high capacity timber joints - proposal of the shear plate dowel · pdf file ·...
TRANSCRIPT

Licentiate DissertationStructural
Mechanics
GUSTAF LARSSON Report TV
SM-3078
GU
STAF LA
RSSON H
IGH
CA
PAC
ITY TIM
BER
JOIN
TS - Prop
osal o
f the Sh
ear plate d
ow
el join
t
HIGH CAPACITY TIMBER JOINTS Proposal of the Shear plate dowel joint


DEPARTMENT OF CONSTRUCTION SCIENCES
DIVISION OF STRUCTURAL MECHANICS
ISRN LUTVDG/TVSM--17/3078--SE (1-114) | ISSN 0281-6679
ISBN 978-91-7753-106-7 (Print) | 978-91-7753-107-4 (Pdf)
LICENTIATE DISSERTATION
Copyright © 2017 Division of Structural Mechanics,Faculty of Engineering LTH, Lund University, Sweden.
Printed by Media-Tryck LU, Lund, Sweden, January 2017 (Pl).
For information, address:Div. of Structural Mechanics,
Faculty of Engineering LTH, Lund University, Box 118, SE-221 00 Lund, Sweden.
Homepage: www.byggmek.lth.se
HIGH CAPACITY TIMBER JOINTSProposal of the Shear plate dowel joint
GUSTAF LARSSON


Acknowledgements
The work presented in this thesis has been carried out as a joint venture between the divisionsof Structural Mechanics and Structural Engineering at the Faculty of Engineering of LundUniversity. The financial support provided by Formas through grant 2012-879 for the projectInnovative connections for timber construction is gratefully acknowledged.
Professor Per-Johan Gustafsson and Professor Roberto Crocetti impressed me during my mas-ter studies by their knowledge and passion for the subject. As my studies were coming toan end, the two of them had together recently started a project regarding innovative timberconnections and were looking for a PhD student. This intriguing combination persuade meto pursue a PhD and for that I am thankful. Many of the ideas being central to the workpresented in this thesis originates from these men, and I am very grateful for their inspiringand skilful guidance.
I would also like to thank my assistant supervisors Assistant Professor Henrik Danielsson andAssistant Professor Johan Jönsson, but also Professor Erik Serrano for valuable comments dur-ing my research. It has been a privilege to be able to work with and visit Associate ProfessorHuifeng Yang at College of Civil Engineering at Nanjing Tech University, as well as having theexternal addition to my reference group of Arne Emilsson from Limträteknik AB and ThomasJohansson from Moelven Töreboda AB. An inspiring work climate has been ensured by thenice staff at Structural Mechanics and Structural Engineering at Lund University.
And finally, to my foremost friend and loving life companion Evelina, thank you for beingyou.
Lund, January 2017


Abstract
An increased use of wood can reduce the environmental footprint of the building sector bybeing a renewable and ecological material. In order to improve the competitiveness of heavytimber structures, this thesis presents a novel type of timber connection with a high degree ofprefabrication, which utilizes a resilient bond line.
It has previously been shown that a large conventional stiff adhesive bond line acting in shearcan be made stronger by using a less stiff bond line, by e.g. introducing an intermediate rubberfoil. The scientific contribution of this thesis starts by comparing such resilient bond lines toconventional non-resilient bond lines. It is numerically shown that the strength of the bondline is increased from 40% to 80% of the local shear strength by introducing a resilient bondline in large lap joints. Unlike other types of connections, a resilient bond line enables designof the stiffness depending on the application by varying the hardness and thickness of theintermediate bond layer.
Using the concept of the resilient bond line in a heavy timber connection design aiming for ahigh degree of prefabrication, the novel Shear Plate Dowel Joint (SPDJ) is proposed. Initiallydesigned for truss nodes, the connection shows promising results in full scale tensile tests withan average shear stress at failure of 3.3 MPa. A bond line model to be used in FE analysis ofthe SPDJ is proposed and used in parameter studies of the connection. It is found that a softerbond line will increase the slip, but also the strength which asymptotically aligns with theoryof perfect plasticity.
The strengths of the SPDJ design are high load carrying capacity and simplicity in design, butduration of load effects and fire resistance are, among other things, in need of further researchprior to structural application.


Contents
I Introduction and overview ix
1 Introduction 11.1 Background . . . . . . . . . . . . . . . . . . . . . . . . . . . . . . . . . 11.2 Aim and research methodology . . . . . . . . . . . . . . . . . . . . . . . 21.3 Original features and limitations . . . . . . . . . . . . . . . . . . . . . . . 31.4 Thesis structure . . . . . . . . . . . . . . . . . . . . . . . . . . . . . . . 4
2 Timber connections 52.1 Functional requirements . . . . . . . . . . . . . . . . . . . . . . . . . . . 52.2 Difficulties in timber connection design . . . . . . . . . . . . . . . . . . . 82.3 Contemporary connections . . . . . . . . . . . . . . . . . . . . . . . . . 9
2.3.1 Punched metal plates . . . . . . . . . . . . . . . . . . . . . . . . 92.3.2 Glulam rivets . . . . . . . . . . . . . . . . . . . . . . . . . . . . 102.3.3 Screws and rods . . . . . . . . . . . . . . . . . . . . . . . . . . . 112.3.4 Slotted-in steel plates . . . . . . . . . . . . . . . . . . . . . . . . 122.3.5 Wood adhesive joints . . . . . . . . . . . . . . . . . . . . . . . . 13
2.4 Room for improvements . . . . . . . . . . . . . . . . . . . . . . . . . . . 14
3 Numerical modelling of timber and bond lines 153.1 Structural levels of timber . . . . . . . . . . . . . . . . . . . . . . . . . . 153.2 Wood elasticity . . . . . . . . . . . . . . . . . . . . . . . . . . . . . . . . 173.3 Wood failure . . . . . . . . . . . . . . . . . . . . . . . . . . . . . . . . . 19
3.3.1 Strength properties . . . . . . . . . . . . . . . . . . . . . . . . . 193.3.2 Failure criteria . . . . . . . . . . . . . . . . . . . . . . . . . . . . 203.3.3 Fracture mechanics . . . . . . . . . . . . . . . . . . . . . . . . . 22
3.4 Bond lines . . . . . . . . . . . . . . . . . . . . . . . . . . . . . . . . . . 263.4.1 Non-resilient bond lines . . . . . . . . . . . . . . . . . . . . . . . 263.4.2 Resilient bond line . . . . . . . . . . . . . . . . . . . . . . . . . 26
4 The resilient bond line 294.1 Background . . . . . . . . . . . . . . . . . . . . . . . . . . . . . . . . . 294.2 Double lap joints . . . . . . . . . . . . . . . . . . . . . . . . . . . . . . 314.3 Characteristics . . . . . . . . . . . . . . . . . . . . . . . . . . . . . . . . 314.4 Applications . . . . . . . . . . . . . . . . . . . . . . . . . . . . . . . . . 34
5 The Shear plate dowel joint 37

5.1 Background . . . . . . . . . . . . . . . . . . . . . . . . . . . . . . . . . 375.2 Design and applications . . . . . . . . . . . . . . . . . . . . . . . . . . . 385.3 Experimental studies . . . . . . . . . . . . . . . . . . . . . . . . . . . . . 415.4 Numerical study . . . . . . . . . . . . . . . . . . . . . . . . . . . . . . . 425.5 The SPDJ and the functional requirements . . . . . . . . . . . . . . . . . 43
6 Summary of appended papers 47
7 Concluding remarks 517.1 Conclusions . . . . . . . . . . . . . . . . . . . . . . . . . . . . . . . . . 517.2 Further research . . . . . . . . . . . . . . . . . . . . . . . . . . . . . . . 52
References 55
II Appended publications 59
Paper AUse of a resilient bond line to increase strength of long adhesive lap jointsGustaf Larsson, Per-Johan Gustafsson, Roberto CrocettiSubmitted in January 2017.
Paper BExperimental study on innovative connections for large span timber truss structuresHuifeng Yang, Roberto Crocetti, Gustaf Larsson, Per Johan GustafssonProceedings of the IASS Working Groups 12 + 18 International Colloquium, 2015.
Paper CBond line models of glued wood-to-steel plate jointsGustaf Larsson, Per-Johan Gustafsson, Erik Serrano, Roberto CrocettiEngineering Structures, 121: 160-169, 2016.
Paper DAnalysis of the Shear plate dowel joint and parameter studiesGustaf Larsson, Per Johan Gustafsson, Erik Serrano, Roberto CrocettiProceedings of the World conference of timber engineering 2016

Part I
Introduction and overview


1Introduction
Gazing at a large forest, it is easy to be impressed by the sheer size of the trees. Thestem is rising high, supporting all the branches which in turn supports the leaves orneedles. For millions of years, trees have ever so slowly adapted their characteristics
in order to survive in a large variety of habitats.
It is seemingly recent people have begun using timber as an engineered wood product. Theonce so optimised structure of branches in the tree and their efficient joint to the stem is nowmerely an imperfection in the engineered board as a knot; just one example of many. How tobest use wood as a construction material has been studied extensively, and will continue to bestudied as production methods develop. This work will look at the structural details, namelyhow timber connections can uphold heavy timber structures while minimizing the effects ofthese engineered imperfections.
1.1 BACKGROUND
Climate change is a fact, and every responsible person should be looking into their possibility tocontribute to a more environmentally friendly society. Although the operation stage dominatesthe life cycle of buildings, the production stage becomes increasingly important in terms ofemissions of greenhouse gases [1]. For the construction sector, a rather simple act is to reducethe use of steel and concrete in favor for timber.
Wood has indeed higher strength to weight ratio than common mild steel, but changing thenaturally intended canopy to yet another engineered building floor introduces a set of chal-

2 1 Introduction
lenges. Not only is wood highly anisotropic, i.e. strength and stiffness vary with the orientationof the grain, but it also needs to be manufactured into timber in order to be used efficiently.The effect of duration of load (DOL), the influence of moisture content and understanding inhow timber degrades during fire are just some characteristics different for timber in comparisonto other building materials.
By aligning and simply gluing the naturally limited cross sections of timber together, crosslaminated timber (CLT) and glued laminated timber (GLT) have significantly increased thepossibilities of high-rise timber buildings, some even believes in timber skyscrapers [2]. Incomparison to the classic timber frame buildings, massive CLT panels in combination withGLT can withstand the large forces that arises in tall buildings. However, the key is combin-ation as no single construction element can be designed to fit all requirements needed in amodern building, and the combination of elements is made possible by timber connections.New production methods and design approaches are needed in order to possibly build timberskyscrapers, including timber connections.
1.2 AIM AND RESEARCH METHODOLOGY
In order to facilitate an increased occurrence and efficiency of timber structures, the aim ofthis research project is to
Develop a good connection design for heavy timber structures suited for industrializedbuilding processes with a high degree of prefabrication.
This applied science project is well suited for an engineering design process rather than thestandard scientific method. Functional requirements are thus identified accordingly and presen-ted in Chapter 2. Contemporary timber connections are presented and discussed based uponthe functional requirements, from which a new design concept is proposed. The proposedconnector design is named the Shear plate dowel joint (SPDJ), and is based upon the use of aresilient bond line. The technique and design are studied to investigate its characteristics andpotential use.
Empirical, analytical and numerical modelling are typical types of modelling in timber en-gineering. Empirical models are based upon observations or experience used to approximatea formula with a predictive power using some chosen input variables. In contrast, analyticalformulas are derived to obtain exact solutions by being based upon fundamental theories ofphysics. Numerical modelling is based upon analytical relations, but typically using approx-imated solutions to differential equations to produce a result with high accuracy. The finiteelement (FE) method is the type of numerical modelling exclusively used in this thesis.
Empirical and numerical modelling are in themselves prone to inductive reasoning, which aresubjected to criticism within philosophy of science. Among the critique and of special concern

1.3 Original features and limitations 3
in engineering is the problem of formulating generalized conclusions based upon a too smallnumber of observations, typically relevant in empirical modelling but also in numerical. Byestablishing a hypothesis in accordance with hypothetico-deductive reasoning, more generalconclusions can be obtained. Although analytical modelling is in general well regarded due tophysical interpretations, it does necessarily not lend itself better to the favoured hypothetico-deductive reasoning.
In order to obtain a credible result, the work presented in this thesis typically includes analyticaland numerical modelling, both compared to empirical data (though no empirical models aresuggested). Although the engineering method is used in general, Paper A investigates therubber foil adhesive joint technique by the following hypothesis:
Decreasing stiffness of the bond line will increase the strength of long lap joints.
The fallibility of the hypothesis lends itself well to the hypothetico-deductive model. Theproblem of demarcation is minimized by the use of the basics of the scientific method incombination with a Socratic approach. The methodology of inference of the best explanationwas used for questions raised during the experimental study, but with limited possibility offurther testing.
1.3 ORIGINAL FEATURES AND LIMITATIONS
The original features presented in this research comprises:
• Comparison of resilient and non-resilient bond lines as presented in Paper A.
• Experimental comparison of different single large diameter dowel joints, including theShear plate dowel joint (SPDJ) design, presented in Paper B and in the introductorychapters.
• Detailed description of the SPDJ, including discussion regarding the functional require-ments, is presented in the introductory chapters.
• Numerical bond line model for the SPDJ is presented in Paper C.
• Various design considerations of the SPDJ are investigated in Paper D.
In this thesis, a resilient bond line is considered a bond line with a lower stiffness than conven-tional adhesive bond lines. A resilient bond line can for example be made up by introducinga rubber foil between the adherends, but also by the use of an adhesive layer with very lowstiffness.
The presented work has the following general limitations:

4 1 Introduction
• Only short term quasi-static loading is considered in all theoretical and experimentalanalyses.
• The influence of moisture is not considered.
• Wood is modelled as a homogeneous orthotropic material with homogeneous materialorientation. If not else specified, a rectilinear model with deterministic parameters areused.
• Glue lines in GLT are not explicitly considered.
1.4 THESIS STRUCTURE
The thesis is divided into two parts, of which the research is presented in a wider perspectivein Part I while Part II compiles the appended research papers. Some results and conclusionsfrom the papers are included in Part I to cover the conducted research as whole, while furtherreading is found in Part II.
Part I
Subsequent the introductory chapter you are now reading, this thesis starts by discussing differ-ent contemporary timber connections in Chapter 2. The connections are discussed regardingfunctional requirements and possible improvements. The thesis is to a great extent based uponnumerical analysis, thus Chapter 3 attends the methodology used to model timber and thebond lines including results from Paper C. Chapter 4 presents the state of the art of resilientbond lines as intended use in civil engineering, including the research conducted in Paper A.The Shear plate dowel joint is finally presented in Chapter 5, which is the novel connectiondesign mainly studied in this thesis. The presentation will include results from Paper B, Cand D but will also be discussed in a broader perspective including comparison to existingsolutions. Concluding remarks are found in Chapter 7.
Part II
Part II of this thesis compiles the appended papers. Paper A compares the length-to-strengthratio for adhesive lap joints using resilient and non-resilient bond lines. A variety of singlelarge diameter dowel connections are tested in Paper B, of which the SPDJ clearly stands outas the strongest, thus merits further investigation. By such, a numerical model for the SPDJis presented in Paper C and parameter studies of the connection are carried out in Paper D. Amore extensive summary of the appended papers is found in Chapter 6.

2Timber connections
Structures commonly consist of a vast number of elements lumped together by con-nections. The fundamental purpose of a connection is to allow forces to be transferredfrom one member to the next. This chapter will further break down the functional re-
quirements and highlight some design difficulties in contemporary timber connections beforepresenting connections commonly used in heavy timber structures.
2.1 FUNCTIONAL REQUIREMENTS
It is not far-fetched to consider strength as the primary functional requirement of a connection.However, strong timber connections can be achieved in numerous ways, and the diverse typesof contemporary connections suggest that different functional requirements not only exist, butalso vary in importance between different projects. Strength and stiffness are usually prioritizedin large span structures, while the appearance can be more important in residential housing.Different functional requirements are listed below without any order of importance, and it isbased upon a list originally presented by Borg Madsen [3].
Strength
A connection should ideally be able to transmit the internal forces from one structural memberto the next, with the same reliability as adopted for the members. For many connection typesused today, this is however not possible and it is common that the strength of the connectionis only 60-70% compared to the strength of the member. This occurs due to local member

6 2 Timber connections
weakening by cutting or drilling, or due to occurrences of stress concentrations. Stress con-centrations in wood are particularly difficult as they always have to be put in relation to itscorresponding orthotropic strength, discussed further in Section 3.3. The low tensile strengthperpendicular to grain is often the limiting factor in timber connections, thus the mode shouldbe minimized in the design phase of any strong connection.
Strength may also be discussed in terms of time. Short term strength is typically higher thanlong term, and duration of load (DOL) studies are thus important. Strength can also bedependent of the time history of the load, regarding cyclic or impact loading.
Stiffness and deformations
The safety level can be increased using statically indeterminate structures. The redundancy ofsuch systems enable different load paths in case of member weakening or failure, and can thusensure structural integrity. However, the structural design will become more complicated byintroducing several possible load paths, as the load then will choose the stiffest path possible.The stiffness of such a path depends greatly on the stiffness of the connections, making it animportant functional requirement. In order to minimize unwanted deformations in the struc-ture, it is important to be able to estimate the stiffness and creep behaviour of the connections.
Ductility
Wood is in general a brittle material and can thus fail without the warning sign of excessivedeformations. This behaviour is undesirable for structures as loads cannot be redistributedin the structure in case of excessive deformations, nor does it leave much time for occupantsto recognise and avoid danger. A ductile failure allows large deformations prior to systemcollapse, and is therefore favourable. The ductility of a timber structure must be achievedin the connections which is made possible by a sound connection design. This is of specialimportance in seismic regions.
Simplicity of design
Simplicity of design have the potential of minimizing the risk of human error in two aspects.Firstly, it is preferable that the design of a connection is done so that a clear understandingof how forces are transferred in the connection is made possible. Similarly but secondly, thedesign method of a connection should be straight forward and easy to understand.

2.1 Functional requirements 7
Production friendly
The production of a timber joint includes the manufacturing and assembly. A high degreeof pre-fabrication and a simple assembly are desirable features, although different connec-tion designs fulfil such requirements to varying degree. Assembly can also be difficult if theconnection designs are sensitive to moisture movements and general construction tolerances.Over-sized holes for bolts could simplify the assembly, but would significantly decrease theconnection stiffness.
Appearance
In comparison to steel and concrete, wood is often considered a beautiful material and thusalso timber structures. To combine aesthetics with functionality is however not an easy task,especially not for connections. An intimate collaboration between architect and structuraldesigner is thus vital.
Durability
The service life of a connection should not fall short of the service life of the remaining structurein the present environment. Possible degradation due to e.g. corrosion of metallic componentsand/or moisture of timber members should always be considered.
Fire
As a timber connection usually consists of a combination of timber and steel components, agood connection design should also use the material characteristics to ensure good perform-ance in the case of fire. Charring will occur on the timber surface, temporarily insulating thematerial within from degradation while steel requires external insulation in order to avert asudden collapse. A sound connection design should thus have a minimum of exposed steel, orenable a simple application of insulation, e.g. intumescent paint.
Costs
As for every project and product, the cost can be critical. About 20-30% of the total cost ofa GLT structure is normally spent on the connections [3], a percentage that possibly can bereduced. However, it should be kept in mind that the size of the structural members can bereduced if the strength of the connection matches the strength of the members, as discussedabove. The total cost of some projects can thus be reduced by increasing the cost of the con-nection.

8 2 Timber connections
Environmental sustainability
Timber engineering has in recent years obtained considerable interest due to a growing envir-onmental awareness. Although considerably better than steel or concrete structures, timberengineering can still improve its ecological footprint by e.g. life cycle assessment. Applied toconnections, the possibility of reutilization or recycling is beneficial.
2.2 DIFFICULTIES IN TIMBER CONNECTION DESIGN
Although numerous different types of timber connections exist, some general difficulties canbe identified. Looking at the material level, which will be further discussed in Chapter 3,the material properties of wood varies greatly with the orientation of the grain. The mostextreme example of this is that the tensile strength of wood perpendicular to grain is onlyapproximately 5% of the parallel to grain tensile strength [4]. This fact is very important toconsider in connection design, as fracture perpendicular to grain will occur at a low load if thedesign triggers such failure mode.
Not only do the material properties differ in different orientations, a great variability is al-ways found for each such property. In terms of strength, the variability is often considered bydifferentiating mean strength from characteristic strength, which is typically the 5th percent-ile. Furthermore, the properties also vary with moisture content and duration of load effects,which also need to be considered.
Wood is in general a brittle material, which together with the variability to some extent limitsall types of timber connections, but tension and bending resistant connections are typicallyidentified by practitioners of timber engineering as cumbersome to design. In terms of brittlefailure in nailed timber connections loaded in tension, Helena Johnsson [5] shows how anincreasing amount of nails can actually decrease the strength of the joint. This counter-intuitiveresults is due to the brittle behaviour of wood, as the increased number of nails weakens thetimber to such an extent that the nails do not have the opportunity to yield as needed to utilizethe full potential of nails according to Johansen’s yield theory [6], taking into considerationthe reduced capacity of dowels placed in a row [7].
The difficulty of assembling many similar fasteners is however seldom solved by introducinganother type of fastener due to different load-slip behaviours. As seen in Figure 2.1, glue isvery stiff and typically fails at a deformation which only would allow a bolt to reclaim 10%of its maximum capacity [8]. Even though glue typically can be used to strengthen differenttype of connections, it then has to be modified in order to match the load-slip behaviour ofthe joint type (see further Chapter 4).
Although the stiffness of connections are essential in the determination of load paths through-out a structure, it is hard to identify a good estimate by analytical means. The difficulty spansseveral types of connections, but being of higher importance in bending resistant connections.

2.3 Contemporary connections 9
Figure 2.1: Typical normalized load-slip behaviours of different types of fasteners in a singlelap joint design. [8]
2.3 CONTEMPORARY CONNECTIONS
In order to be able to present an novel connection for heavy timber structures, a review ofcontemporary connections are of special interest in this thesis. How loads are transferred inthe connections will be presented along with the prominent features influencing design andperformance. The discussion will be based upon the functional requirements presented inSection 2.1.
2.3.1 Punched metal plates
Even though typically designed for light structures such as single family houses, the punchedmetal plate (PMP), or truss plate in America, is used extensively throughout the world andthus worth mentioning. As shown in Figure 2.2, the PMP are an integration of nail plates andnails produced by punching edges in galvanized steel plates and bending the formed teeth intoposition perpendicular to the plate. Due to limitations in the punching process, the steel platethickness usually does not exceed 2 mm and the PMP is thus bound to be considered a surfaceconnection having a relatively low strength capacity.
Trusses are formed by pressing the PMP into the wood members using a hydraulic clamp orpushing the whole truss through a large roller press. By such, it is usually not practical to applyPMP on the building site. Common spans for PMP trusses are 9-15 m, but can reach up to40 m.
The popularity of the PMP is in part due to the simple manufacturing and low production cost.From a design engineer perspective, the connection is however more complex. In the Europeandesign code, Eurocode, 11 strength parameters are needed for full connection characterisation[9]. Poutanen [10] highlighted this complexity in 1989 by comparing seven different design
10 2 Timber connections
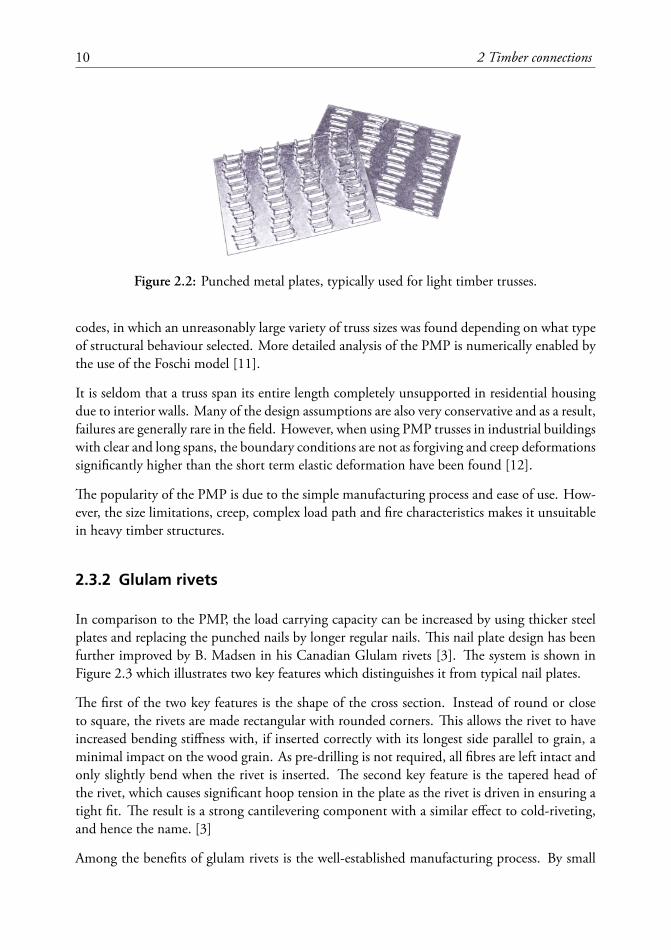
Figure 2.2: Punched metal plates, typically used for light timber trusses.
codes, in which an unreasonably large variety of truss sizes was found depending on what typeof structural behaviour selected. More detailed analysis of the PMP is numerically enabled bythe use of the Foschi model [11].
It is seldom that a truss span its entire length completely unsupported in residential housingdue to interior walls. Many of the design assumptions are also very conservative and as a result,failures are generally rare in the field. However, when using PMP trusses in industrial buildingswith clear and long spans, the boundary conditions are not as forgiving and creep deformationssignificantly higher than the short term elastic deformation have been found [12].
The popularity of the PMP is due to the simple manufacturing process and ease of use. How-ever, the size limitations, creep, complex load path and fire characteristics makes it unsuitablein heavy timber structures.
2.3.2 Glulam rivets
In comparison to the PMP, the load carrying capacity can be increased by using thicker steelplates and replacing the punched nails by longer regular nails. This nail plate design has beenfurther improved by B. Madsen in his Canadian Glulam rivets [3]. The system is shown inFigure 2.3 which illustrates two key features which distinguishes it from typical nail plates.
The first of the two key features is the shape of the cross section. Instead of round or closeto square, the rivets are made rectangular with rounded corners. This allows the rivet to haveincreased bending stiffness with, if inserted correctly with its longest side parallel to grain, aminimal impact on the wood grain. As pre-drilling is not required, all fibres are left intact andonly slightly bend when the rivet is inserted. The second key feature is the tapered head ofthe rivet, which causes significant hoop tension in the plate as the rivet is driven in ensuring atight fit. The result is a strong cantilevering component with a similar effect to cold-riveting,and hence the name. [3]
Among the benefits of glulam rivets is the well-established manufacturing process. By small

2.3 Contemporary connections 11
Figure 2.3: The glulam rivet has a rectangular cross section with rounded corners to maximizebending resistance and minimize grain impact. The tapered head causes hooptension in the nail plate.
design alterations a strong and stiff connection is derived from existing solutions for lighttimber frame buildings. However, the installation of the glulam rivet connection is labour-intensive if used on heavy timber structures as a large quantity of rivets must be inserted. Eventhough the large quantity of rivets may prove useful in earthquake design, it is probably notfavourable in environments prone to moisture content variations.
2.3.3 Screws and rods
Screws are extensively used in timber engineering and building construction in general. Tra-ditionally, fasteners are placed perpendicular to the connection of two adjacent members andtypically carry load by axial or shear forces. However, as screws typically have a considerablewithdrawal strength if inserted at an angle to the grain, this is often a preferable mode of ac-tion. By inclining the screws typically 45°, it is possible to minimize shear action in favour foraxial thus increasing the load carrying capacity and the stiffness of the connection, see Figure2.4.
Figure 2.4: Schematic comparison between traditional and inclined screws in lap joints.
To enable easy on site assemblage, inclined screws can be used in combination with tenonjoints. The load-carrying capacity of inclined screws shows an increase of 50% while the slipmodulus increases by a factor of up to 12 compared to traditional screws [13].

12 2 Timber connections
The inclined screws can be included in the on-site production using well-known techniques.Furthermore, the very limited aesthetic impact of the joint is also a positive feature of thedesign. However, the strength is in general smaller than in e.g. connections made of slotted-insteel plates and dowels, making the inclined screws less ideal for heavy structures. Nevertheless,the strength and stiffness can be increased by using threaded bars in combination with adhesive,resulting in so-called bonded-in rods [14]. Such a system can typically be used as a connectionor as a reinforcement in a similar manner as screws [15]. An advantage for bonded-in rodsover screws is the increased strength when inserted parallel to grain.
2.3.4 Slotted-in steel plates
Dowel type connections are common in timber engineering, and an elegant way of using themin heavy timber structures is in combination with one or more slotted-in steel plates. The steelplates are used to transfer load between members, while the dowels transfer loads to and fromthe steel plates to the timber member, see Figure 2.5. The capacity of a single dowel is increasedby the number of inserted plates, which in turn is limited by the GLT member width.
Figure 2.5: Slotted-in steel plates used in a truss node.
As the steel is embedded in timber, slotted-in steel plates are not only protected from fire, butalso usually considered as an aesthetic connection. Slotted-in steel plates do not eliminate thepossibility of brittle failure, but the risk is reduced by using small diameter dowels as well asadequate plate spacing and end distances.
The dimensions and number of the steel plates and dowels are proportional to the loads,primarily axial forces parallel to grain. Thinner slotted-in plates can be pierced by self-perforatingdowels, which reduces the number of operations needed for installation. This method is also

2.3 Contemporary connections 13
very efficient when considering the connection stiffness as the slip is minimized. However,thicker steel plates or larger dowel diameters requires pre-drilling, which has to be done with ahigh degree of precision in order to prevent connection slip. The large number of dowels alsorequires long assembly times and all cuts made to insert the steel plates weakens the timber.
2.3.5 Wood adhesive joints
The use of timber in structural systems is sometimes in question due to its large variation ofmechanical properties, further discussed in Chapter 3. Similar arguments are often also truefor structural adhesive joints, as they possess a number of favourable characteristics but theirreliability is often in question. To utilize these favourable characteristics, adhesive joints mustbe recognized by skilled design and craftsmanship.
One of the favourable characteristics of adhesive joints is the strength, for which a comparisonis shown in Figure 2.6. Four different types of double lap joints are presented, all with adesign load of approximately 150 kN but obtained at different lap lengths. The comparison ispresented in [16], but the adhesive lap joint is here added with an average shear stress at failureof 1.8 MPa, according to EC5 and well below recorded values in Paper A. Similar comparisonwas also conducted by Adams and Wake in [17]. The adhesive joint is the smallest and thusmost material efficient. In addition to high strength, Adams and Wake also argue that adhesivejoints have better durability than corresponding mechanical fasteners.
200m
m
240m
m
460m
m
920m
m
Figure 2.6: Four different double lap joints with similar design tensile load capacity using(from left): PUR adhesive; 2x6x9 nails d=5; 4x6 screws d=10; and 2x3 splitrings d=120 mm [16]. The illustration is drawn to scale.
There are however disadvantages using adhesive fasteners. The adhesive bond requires a con-trolled environment during gluing and curing, which is difficult to obtain on site. Curingpressure and a curing time is needed at a specific temperature and relative humidity rangeto obtain the desired results. It is furthermore difficult to inspect an adhesive joint since it

14 2 Timber connections
would then be necessary to dismantle the entire connection. The effects of several of thesedisadvantages can be minimized using a resilient lap joint as further discussed in Chapter 4.
2.4 ROOM FOR IMPROVEMENTS
A reasonable design basis for any type of connector is to match the member characteristics.A connection design is too weak if it requires an increase in member dimensions, and it isnot designed properly against fire if it loses load carrying capacity prior to the members, justto mention two examples. This type of reasoning limits the level of optimisation of somefunctional requirements, while others can be improved endlessly such as production cost. Athird category of functional requirements will always be subjected to subjective assessment,which of course is a typically difficult basis for optimisation.
The orthotropical nature of wood in combination with complex structures requires a surpris-ingly large number of different types of connections used in different situations. The aim ofthis thesis regards connections in heavy timber structures with a high degree of prefabrication, adistinction which enables a ranking among the functional requirements and limits the amountof possible design solutions.
One of the most typical connection types used for heavy timber structures today is slotted-insteel plates. The design suggested in this thesis should thus exceed the performance of slotted-insteel plates in one or more aspects, of which cost is the one indirectly highlighted in the projectaim (c.f. Section 1.2). As often is the case in this kind of studies, new design difficulties andpossible weaknesses are introduced with new solutions. Some will be discussed in this thesis,while further analysis will be presented in future research.
Some possible improvements as compared to slotted-in steel plates can be identified as:
• Higher load carrying capacity at long term loads, limited by ductile failure
• A designable stiffness with high prediction accuracy
• Lower the production cost by minimizing material usage and production time (especiallyon site)
• A connection design suitable for tension and bending loads
The novel connection design presented and studied in Chapter 5 has shown to improve someof these aspects.

3Numerical modelling of timber and
bond lines
Wood is the material created by trees which is optimised for the conditions trees areexposed to. Timber, however, is the engineered wood product used for structuralapplications. This distinction is important as “timber is as different from wood as
concrete is different from cement”, as nicely put by Borg Madsen [18]. In this chapter, themodelling choices from wood to timber will be discussed along with material properties ofNorway spruce, the most commonly used wood species in northern Europe. The structure ofwood is only discussed briefly, for more reading see e.g. Bodig and Jayne [19] and Dinwoodie[20]. All modelling in this thesis is conducted using the finite element (FE) method in thegeneral purpose FE software Abaqus.
3.1 STRUCTURAL LEVELS OF TIMBER
Wood is an organic composite built up mainly of cellulose, hemicellulose and lignin whichtogether forms fibres. Most of the fibres are aligned almost parallel to the stem and dependingon what time of year the cells are formed, the characteristic lighter and darker rings in a woodcross section grow in number. The material properties vary greatly with respect to the directionof these annual growth rings, making wood a close to orthotropic material. As the round stemis of limited use in timber construction, the trees are commonly sawn into rectangular crosssections and if heavier cross sections are needed, several timber laminations are glued togetherforming glued laminated timber (GLT).

16 3 Numerical modelling of timber and bond lines
Depending on the type of problem investigated, timber needs to be modelled at different struc-tural levels. Cellulose, hemicellulose and lignin are found at the ultrastructural level whereasfibres are represented at the microstructural level. Clear wood is normally regarded as themacroscopic level [21], which Mother Nature has then spent millions of years devising anarrangement that allows perpendicular branches to grow without impairing the strength ofneither the branch nor stem. However, when timber is produced by sawing through this in-tricate handiwork these knots will become severe weaknesses which can initiate crack growth.Thus, clear wood is rare in timber engineering and consideration must be paid to knots andother defects. How these defects are taken into account differs for different engineering prob-lems. Commonly used, also in this thesis, is that they are treated implicitly on the materialproperties rather on the geometry itself as seen in Figure 3.1. Not only is it common to ignoregeometrical defects (b), but for some problems the effects of the growth ring curvature is alsonegligible, and a rectilinear material model can be used (d). This assumption typically intro-duces larger errors for cuts taken near the pith than if taken in the periphery, while the erroris minimized if the cut is kept small in relation to the distance from the pith.
Figure 3.1: Reduction of a tree stem to an orthotropic model [19].
The macroscopic level is characterised by a distinction between the three orthogonal directionsin relation to the growth rings and fibre direction: longitudinal (L), radial (R) and tangential(T), see Figure 3.1. Due to possible log taper and spiral growth, the longitudinal directionmight not be fully aligned with the longitudinal direction of the tree stem.
Compared to other building materials such as steel or reinforced concrete, wood shows a higherdegree of variation in terms of properties. Not only is it orthotropic, but also hygroscopic withproperties varying with air humidity. While steel and concrete are manufactured according

3.2 Wood elasticity 17
to well-established procedures with controlled variability, timber is simply a sorted existingmaterial. The sawn timber is produced from a very large variety of logs cut from many differenttrees grown in varying conditions. The timber is then sorted using non-destructive tests andstatistical relationships. The variability of timber properties is the cost of wood being a naturalmaterial, which must be considered using sound engineering judgement.
3.2 WOOD ELASTICITY
A convenient way to represent wood at macro scale as a 3D continuum, is to use Hooke’sgeneralized law as given in Equation 3.1 in Voigt matrix form. The constitutional law assumessmall strains and has been adapted to the principal directions of wood. Robert Hooke statedthe law in 1660 as the anagram ut tensio, sic vis — ”As the extension, so the force” [22] whichrelates material stresses σ to the elastic strains ε according to Equation 3.1.
ε = Cσ (3.1)
whereε =
[εLL εRR εTT γLR γLT γRT
]T (3.2)
σ =[σLL σRR σTT τLR τLT τRT
]T (3.3)
The elastic flexibility tensor C in Equation 3.4 is valid for orthotropic materials and organizesthe moduli of elasticity Ei and shear Gi j along with Poisson’s ratio νi j , where i, j = L,R,T[19].
C =
1EL
− νLRER− νT L
ET0 0 0
1ER
− νT RET
0 0 01ET
0 0 01
GLR0 0
sym . 1GLT
01
GRT
(3.4)
The elastic parameters found in Equation 3.4 are material dependent and determined by tests.Comprehensive compilations for various wood species can be found in e.g. [20] and [23].Dahl [4] presents in a recent study a comprehensive test program in order to identify theproperties of Norway Spruce (Picea Abies), a species commonly used as timber in Sweden. Hisfindings are presented in Table 3.1 along with mean stiffness values of some strength classesof timber as defined in EN 338:2016 [24] and GLT in EN 14080:2013 [25]. It can be seenthat the European standards does not distinguish radial from tangential direction, thus takingone further step of simplifying the structure of wood to only parallel and perpendicular tograin, i.e. transverse isotropy. This simplification is implicitly included in LR- and LT -plane

18 3 Numerical modelling of timber and bond lines
Table 3.1: Elastic parameters for softwood from literature. Stiffness [MPa], density [kg/m3]and Poisson’s ratio
Species/Class ref EL ER ET GLR GLT GRT ρ
Norway spruce [4] 9 040 790 340 640 580 30 400
Timber, C24 [24] 11 000 370 370 690 690 420GLT, GL24h [25] 11 500 300 300 650 650 65 420Timber, C30 [24] 12 000 400 400 750 750 460GLT, GL30h [25] 13 600 300 300 650 650 65 480
νLR νRL νLT νT L νRT νT RNorway spruce [4] 0.50 0.11 0.66 0.06 0.84 0.34
stress analysis in 2D. Neither Poisson’s ratio is considered of interest in the standards. Dahlargues that some of the discrepancies between his results and the standard possibly is due tothe fact that the material sample was partly ungraded, but the differences between clear woodand structural timber also affect the results.
Considering the height of a tree and wind action upon it, it is reasonable to expect a highstiffness parallel to grain. The elastic property which stands out is the very low rolling shearstiffness GRT . This difference in stiffness causes some interesting phenomena, e.g. how auniform load causes a non-uniform stress distribution within the cross section as seen in Figure3.2 [26, 27]. The practical influence of the low rolling shear stiffness has previously beenlimited, but to a large extent affects the behaviour of the increasingly popular CLT panelssubjected to bending.
σ0
σ0
σ0
σ0
0.8 σ0
1.0 σ0
1.2 σ0
1.4 σ0
1.6 σ0
1.8 σ0
2.0 σ0
0.8 σ0
1.0 σ0
1.2 σ0
1.4 σ0
1.6 σ0
1.8 σ0
2.0 σ0
σyy σyy
y
z
Figure 3.2: A non-uniform stress distribution σyy is found for a GLT cross section althoughsubjected to uniformly applied stress σ0 due to differences in stiffness [28].
The linear elastic parameters presented above are only valid up to the limit of proportionalityafter which non-linear behaviour is typically found prior to failure as shown in Figure 3.3.However, the non-linearities of wood are often of limited influence in timber engineering, and

3.3 Wood failure 19
thus often disregarded. Elasto-plastic material models can be suitable in compression paralleland perpendicular to grain, but the mechanisms are profoundly different from those in metalwhere many of elasto-plastic models are used.
LL
RR, TT
tension
compression
LR, LT
γ
τ
RTε
σa) b)
Figure 3.3: Schematic illustration of wood behaviour in normal (a) and shear (b) direction.The limits of proportionality are shown as dots.
3.3 WOOD FAILURE
As all structural materials, wood will eventually fail if subjected to increasing stress. Similarlyto the elastic properties, also the strength properties of wood are of orthotropic nature butdistinction must now also be made for compressive and tensile normal stresses. As seen inFigure 3.3, failure typically occurs close to the limit of proportionality making wood a brittlematerial, in which excessive deformations seldom are experienced prior to failure. Strengthproperties are experimentally determined but must be incorporated into a failure criterion inorder to evaluate combined stress state of a material point. Failure can be defined in variousways, but focus will here be put on stress based failure criteria and fracture mechanics.
3.3.1 Strength properties
Handbooks and standards in timber engineering commonly refer strength values as the lower5th percentile of the distribution of graded and tested structural timber. The test specimensize is large enough to include defects in order to represent actual structural elements. Theresulting strengths should therefore be considered defined on element level rather than at asingle material point level [29].
Tests of clear wood specimens are however conducted for research purposes. Comprehensiveexperimental studies have been conducted on clear wood by e.g. Dahl [4] and Eberhardsteiner[30], whose results are compiled in Table 3.2 along with the properties of structural timberand GLT according to EN 338:2016 [24] and EN 14080:2013 [25]. The strengths fi j are

20 3 Numerical modelling of timber and bond lines
Table 3.2: Wood and timber strength properties [MPa] for spruce.
Species/Class ref fLt fLc fRt fRc fT t fT c fLR fLT fRTNorway spruce [4] 63 29 4.9 3.6 2.8 3.8 6.1 4.4 1.6Norway spruce [30] 75 50 4.9 7.0 8.6
Timber, C24 [24] 14.5 21 0.4 2.5 0.4 2.5 4.0 4.0GLT, GL24h [25] 19.2 24 0.5 2.5 0.5 2.5 3.5 3.5 1.2Timber, C30 [24] 19 24 0.4 2.7 0.4 2.7 4.0 4.0GLT, GL30h [25] 24 30 0.5 2.5 0.5 2.5 3.5 3.5 1.2
defined in the principal directions i = L,R,T in compression and tension j = c, t . Shearstrengths are direction independent and all strengths are defined as positive numbers.
Among the parameters influencing the strength of wood, size effects can be somewhat counter-intuitive as larger specimens fail at lower average tension levels than smaller specimens [31]. Itcan however be explained using Weibull weakest link theory [32] due to the presence of defects,as the probability of a large weakness occurring in the most loaded section is higher for a largespecimen than for a small. The theory assumes that the weaknesses are of random size andposition within the element, and that the material is brittle [33]. These effects are typicallyincluded in building codes specifying timber characteristics, such as Eurocode [24,25]. Theseeffects are however disregarded in clear wood specimens, such as tested by Dahl [4] (c.f. Table3.1 and 3.2).
3.3.2 Failure criteria
In practical timber engineering, failure is commonly assessed by linear elastic stress analysiswith a stress based criterion. It is a convenient approach which enables assessment of thestrength of a member also by analytical hand calculations. However, the method is typicallyused on a single point assuming that no stress redistribution occurs. Even though wood isbrittle, the single point evaluation can result in a low strength prediction if large stress gradi-ents occur within the member. This can be improved using several different techniques, suchas using a non-linear material model, stress averaging over a certain area or analysing crackpropagation.
Regardless of what method used, the combined state of stress has to be evaluated by a failurecriterion in each material point in order to asses a reasonable failure. Failure criteria typicallylook different for different materials, and three commonly used for timber are the maximumstress criterion, the Norris criteria [34] and the Tsai-Wu criterion [35].

3.3 Wood failure 21
Maximum stress criterion
The maximum stress criterion is a common and simple failure criterion used for both uniaxialand multiaxial stress states. The criterion assumes that a material can always withstand a certainstress level in one direction regardless of the stress levels in other directions, i.e. does notconsider stress interaction. As a single stress component reaches its strength, failure occursaccording to Equation 3.5 as given for 3D analysis.
max{|σLL |fLi,|σRR |fRi,|σTT |fT i,|τLR |fLR,|τLT |fLT,|τRT |fRT
}− 1 = 0 (3.5)
The strengths with respect to normal stresses may have different values regarding compressionor tension (i = c, t ). If a material point experiences stresses in several directions, the maximumstress criterion is seldom an accurate description of material failure.
Norris criteria
Stress interaction can be achieved by means of the Norris criteria [34]. Instead of looking ata single stress ratio individually, a sum of several is used as shown in Equation 3.6 for the 3Dcase.
max
(σLLfLi
)2+(σRRfRi
)2+(τLRfLR
)2− σLLfLi
σRRfRi(
σLLfLi
)2+(σTTfT i
)2+(τLTfLT
)2− σLLfLi
σTTfT i(
σRRfRi
)2+(σTTfT i
)2+(τRTfRT
)2− σRRfRi
σTTfT i
− 1 = 0 (3.6)
The Norris criteria are commonly used for timber. However, as tensile and compressivestrengths differ, the criteria must be applied in a piece wise manner. Each of the equationsrepresents a closed surface in the respective stress spaces.
Tsai-Wu criterion
The stress interaction of the Norris criteria are often considered sufficient, but the piece wiseapplication of the criteria are sometimes undesirable. The Tsai-Wu criterion [35] uses mat-rix notation to form a more efficient failure criterion according to 3.7, which also allows fordifferent tensile and compressive strengths.
σT q + σT Pσ − 1 = 0 (3.7)

22 3 Numerical modelling of timber and bond lines
where σT is defined in Equation 3.3. The stress interaction is obtained using the Tsai-Wumatrices q and P given by [4]
q =
FLLFRRFTT000
and P =
FLLLL FLLRR FLLTT 0 0 0FRRRR FRRTT 0 0 0
FTTTT 0 0 0FLRLR 0 0
sym . FLT LT 0FRT RT
(3.8)
Uniaxial tensile and compression strengths along with shear strengths are used to define theparameters Fii , Fiiii and Fi j i j according to
Fii = 1/ fi t − 1/ fic i = L,R,TFiiii = 1/
(fi t fic
)i = L,R,T (3.9)
Fi j i j = 1/ f 2i j i, j = L,R,T (i , j)
The remaining strength interaction coefficients Fii j j must be determined by uniaxial off-axisor biaxial tests. The coefficients must satisfy Equation 3.10 in order to produce a closed andconvex failure surface. The inequality is for example satisfied for Fii j j = 0 as Fiiii and F j j j jare defined as positive, which is a simplification often used. However, of special interest in thisthesis is the shear strength of wood, which can be increased if a compressive stress interacts assuggested in Section 4.2.7 of SIA 265 [36]. This is not considered if Fii j j are disregarded.
FiiiiF j j j j − F 2ii j j ≥ 0 i, j = L,R,T (i , j) (3.10)
The Tsai-Wu criterion presents an effective method to evaluate the combined state of stress inan orthotropic material. However, the main difficulty is to determine the strength interactioncoefficients [37].
3.3.3 Fracture mechanics
Fracture mechanics is the branch of solid mechanics which studies structural failure due toseparation of material. The microscopic mechanisms which govern the separation and pre-dictions from a macroscopic point of view are both topics of interest in order to predict theload-carrying capacity of structural members. [38]
The type of relative displacement in the vicinity of a crack is governed by the load acting onthe structural element. However, there are only three basic displacement modes as shown in

3.3 Wood failure 23
Figure 3.4: the opening mode I, the in-plane shear mode II, and the out-of-plane mode III. Asthe stress state in the crack tip often is multiaxial, a mixed mode fracture often occur in whicha combination of mode I and II is most common, also for the problems studied in this thesis.The orthotropic nature of wood further enables six possible orientations of plane cracks in theprinciple planes, resulting in a total of 18 basic fracture situations.
Mode I Mode II Mode III
Figure 3.4: The three fundamental modes of fracture deformation.
Traditional fracture mechanics considers the effect of existing cracks, often under the assump-tion that cracks of limited size are always present in materials due to e.g. manufacturing meth-ods or natural variation. Intense research in the traditional linear elastic fracture mechan-ics (LEFM) was conducted during mid-20th century due to its application on vehicles, shipsand aircrafts. Later developments also includes the creation of cracks as well as material non-linearity outside the crack tip, often referred to as non-linear fracture mechanics (NLFM).
Linear elastic fracture mechanics
LEFM deals with pre-existing cracks in a continuous linear elastic material with infinite strength[39]. Although linear elastic materials can have arbitrary high strains without failure, smallstrain and displacement theory is commonly adopted in stress analysis. The combination of anexisting crack tip and the linear elastic material model implies singular stresses at the crack tip,making the stress based failure criteria as discussed in Section 3.3.2 useless. Instead, energyrelease rate at crack propagation or stress intensity are commonly used quantities.
LEFM can be very useful although no real material possesses ideal elastic properties. The mainrequirement for good applicability is that the size of the fracture process region around thecrack tip is small compared to typical dimensions of the structure, including the crack length.
Non-linear fracture mechanics
NLFM is distinguished from LEFM by the possibility to regard the material non-linearityoutside the crack tip, the limited stress capacity and/or the non-linear stress-deformation per-formance of the material at the crack tip. This can be achieved using various approaches, ofwhich a more direct one is done by characterisation of fracture properties of the material bya stress-deformation relation which includes material softening, commonly denoted a σ-wcurve.

24 3 Numerical modelling of timber and bond lines
The σ-ε curve shows the properties of the material outside the fracture region while the σ-w curve shows the properties within. By finite element analysis including this model, it ispossible to calculate how the fracture process region initiates and moves as the external actionis increased. A schematic σ-w curve of wood is shown in Figure 3.5, plotted alongside a typicalbilinear approximation.
𝜎
𝑤
Figure 3.5: A schematic σ-w curve of wood in tension perpendicular to grain with a typicalbilinear approximation. The curve is obtained by a displacement-controlled tensiletest.
Perpendicular to grain fracture properties
The orthotropic nature of wood complicates the discussion of crack orientations, as six possibleorientations of plane cracks are thus possible as shown in Figure 3.6. The nomenclature issuch that the first index indicates the direction normal to the crack plane, while the secondindicates the straightforward direction of the crack length extension. Combined with thefracture modes in Figure 3.4, this will sum up to 18 different basic fracture situations with,in general, different fracture resistances [39]. The high tensile strength in the longitudinaldirection will, for example, result in high resistance to mode I crack growth for LR and LTorientations.
Fracture resistance can be defined by material stiffness and the fracture energy G f . G f isdefined as the energy required to bring one unit area of the material from unloaded state tocomplete fracture. In the case of pure shear, the mathematical definition is thus found being:
G f =
∫ ∞
0τ dδ (3.11)
It should be noted that the fracture energyG f in general differs from the critical energy releaserate Gc used in LEFM. While G f is looking at a single material point during fracture, Gc

3.3 Wood failure 25
LR
LT
RL
RT
TL
TR
R
L
T
Figure 3.6: Crack plane orientation relative to the LRT directions.
Table 3.3: Fracture properties for spruce and pine found in literature. Density ρ in kg/m3,moisture content u in %, fracture energy G f in J/m2 and material strength f inMPa.
Mode 1 Orientation R Orientation TSpecies ref. ρ u G f ,RR fRt G f ,TT fT t
Scots pine [40] 450 8 450 5.3 550 4.1Scots pine [40] 470 10 445 5.0 500 4.2Scots pine [40] 470 13 535 4.5 460 4.0Scots pine [40] 460 26 515 4.1Norway spruce [41] 463 13 298 3.3
Mode II Orientation R Orientation TSpecies ref. ρ u G f ,RL fLR G f ,T L fLTScots pine [40] 460 13 815 11Norway spruce [41] 463 13 965 8.4Norway spruce [42] 14 1240 9.8
represents the energy dissipated at the distinct tip of a progressing sharp crack. However, inthe case of a material with a small fracture process region in relation to other dimensions, G fand Gc are the same.
Various test setups can be used to determine the fracture energy of wood, also dependent onwhat crack mode is of interest. Commonly used for mode I is the single edge notched beamdesign (SENB), whereas small-scale notched specimen can be used for both mode I and II.A compilation of results found in literature is shown in Table 3.3 for spruce and pine. Ofspecial interest in this thesis is mode II in tangential direction for Norway spruce as it is thedominating orientation in GLT lap joints.

26 3 Numerical modelling of timber and bond lines
3.4 BOND LINES
As will be discussed in more detail in Chapter 4, the strength of lap joints is greatly dependenton the properties of the bond line joining the adherends. In this section, the conventional non-resilient bond line will be distinguished from a resilient bond line, and methods of numericalmodelling of the two are presented, based upon Paper C.
3.4.1 Non-resilient bond lines
Conventional bond lines used in the timber industry are made using stiff structural adhesives.The high stiffness causes stress concentrations in which fracture initiates, and the importanceof the material softening behaviour has been shown in several studies [43, 44] and Paper C.NLFM is thus needed, and a bilinear softening behaviour is typically used in this thesis aspresented in Section 3.3.3 in combination with a linear elastic material response for which astress based failure criterion is to be fulfilled. A continuum-based modelling of the adhesivecan be obtained using cohesive elements in which the adhesive has a finite thickness.
3.4.2 Resilient bond line
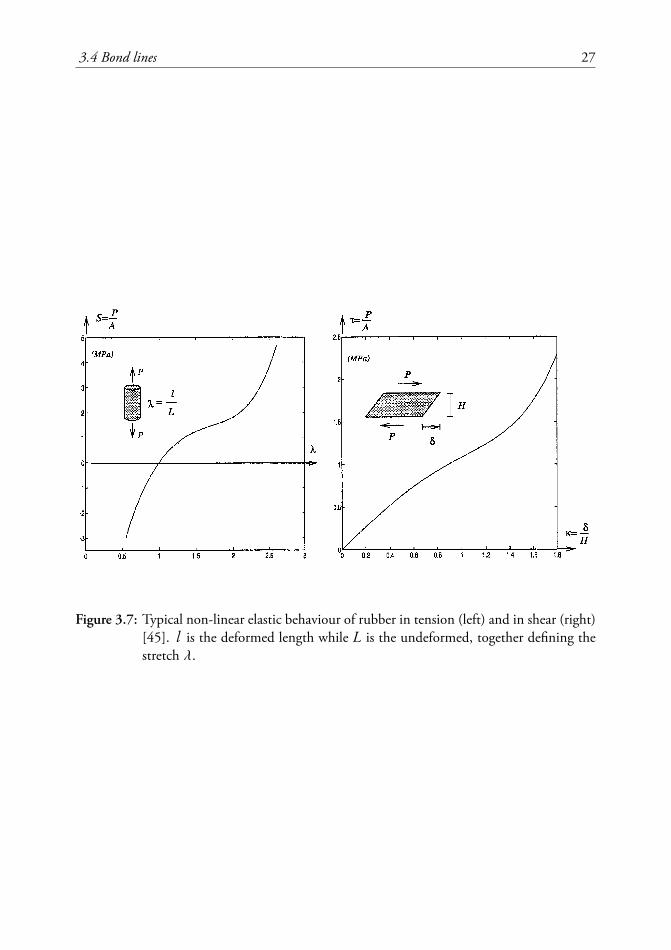
The resilient bond line, as defined in this thesis, is made of elastomeric materials, typicallyrubber. The main specific property of those materials is the ability to sustain large strainingwithout permanent deformation [45]. From a modelling point of view, rubber is a hyperelasticmaterial characterised by low non-linear elastic stiffness and a high Poisson’s ratio, see Figure3.7.
In order to numerically model rubber, hyperelastic models are typically based upon the as-sumption of isotropic behaviour throughout deformation history and thus being able to de-scribe the material model in terms of strain energy potentials [46]. Typical forms of strain en-ergy potentials used for rubber are the polynomials Yeoh and neo-Hookean forms, for whichthe specific coefficients for a resilient bond line is presented by Danielsson and Björnsson [47].Non-linear geometry and special elements must be used in order to obtain reasonable results.More comprehensive reading on the mechanical properties of rubber can be found in e.g. [48].
As seen in Figure 3.7, rubber can be modelled as linear elastic in shear with only a small devi-ation from the real behaviour. This is often desirable in order to minimize the computationalcost of an analysis. Paper C shows that this is indeed possible for the Shear plate dowel jointwith reasonable accuracy, if special consideration is made to the high normal stiffness rubberobtains under plane strain conditions. The simulation procedure presented therein is usedthroughout this thesis.
3.4 Bond lines 27
Figure 3.7: Typical non-linear elastic behaviour of rubber in tension (left) and in shear (right)[45]. l is the deformed length while L is the undeformed, together defining thestretch λ.


4The resilient bond line
The scientific contribution of this thesis is to a large extent presented in the followingtwo chapters. In this chapter, resilient bond lines in lap joints are investigated in com-parison to more conventional non-resilient bond lines. This chapter is based upon
the findings in Paper A, in which numerical, experimental and analytical analyses have beenconducted.
4.1 BACKGROUND
While studying the Volkersen theory [49] regarding shear stress distribution of lap joints, Gust-afsson [50] found that the fracture energy rather than shear strength in terms of maximumstress is decisive for the load carrying capacity of a lap joint. He also found that the relevantmeasure of fracture energy of the bond line included the elastic part of the stress vs. deform-ation response. As common adhesives are very stiff, this elastic part is usually of very limitedsize. However, the elastic part can be made considerably larger by introducing a resilient bondwhich thus increases the load carrying capacity of lap joints. A resilient bond line can be madeup by introducing a rubber layer as shown schematically in Figure 4.1, or by using a resilientadhesive.
The effect of a resilient bond line can also be discussed in terms of shear stress distributionover the lap length. Common adhesives typically have a high stiffness which do not allow thedifferent axial strains of the adherends. This causes shear stress concentrations at the ends ofthe joint as shown in blue in Figure 4.2. The failure strength is reached early and fracture isthus initiated prematurely at low external load. By having a low stiffness, the resilient bond

30 4 The resilient bond line
Wood SteelGlue Rubber
Figure 4.1: The schematics of non-resilient (left) and resilient bond line (right). Note thatresilient bond lines can consist of other components than rubber as discussed inPaper A, and that the bond line can be used for different adherend materials.
line enables different axial strains of the adherends, resulting in a close to uniform shear stressdistribution across the joint area.
Position in joint [mm]0 100 200 300 400 500 600 700
= /
f v
0
0.2
0.4
0.6
0.8
1
ResilientNon-resilient
Figure 4.2: A comparison of the shear stress distribution in a common non-resilient bond lineand in a resilient bond line at failure. Bilinear softening is used in the FE model.Geometry and loading is shown in Figure 4.3, using a lap length of 700 mm.
The concept has been studied in several publications [51–53], typically using a 1 mm thickrubber foil to promote the flexibility. The stiffness of the lap joint with resilient bond line issimilar to a conventional nailed joint, although the resilient bond line shows an elastic beha-viour up to large loads unlike the plastic behaviour of nailed joints due to yielding. In thecomprehensive test series conducted by Gustafsson [51] it is shown that, among other things,the resilient bond line can be used to create interaction between dowel type fasteners and ad-hesive. Preliminary long duration load tests and creep tests have been performed using smalllab-size specimens, see Björnsson and Danielsson [47].

4.2 Double lap joints 31
4.2 DOUBLE LAP JOINTS
Shear stress concentrations are typical for long lap joints, suggesting that a positive influenceof a resilient bond line is higher in such cases. In order to study this possible strength in-crease in a simple geometry with a dominant shear action, an experimental study of doublelap joints was conducted for increasing lap length, see Figure 4.3. The lap width was 225 mm,while the width of the GLT elements were 230 mm and 280 mm for the outer and centremembers respectively. Three different lap lengths of 200, 400 and 700 mm were used in acomparative study between resilient and non-resilient bond lines. Independent numerical andanalytical analyses were conducted using material properties found in literature, with strengthand stiffness as the main characteristics investigated.
200-
700m
m
225mm230mm
280mm
Figure 4.3: Double lap joint design used in the experimentally and numerically comparativestudy between resilient and non-resilient bond lines, c.f. Paper A.
4.3 CHARACTERISTICS
In terms of structural performance, strength and stiffness are of high interest. Strength isthe fundamental property of a connection as to be able to withstand the forces occurringin a structure. However, the forces occurring are typically dependent on the stiffness of theconnections, as the load is transferred by the stiffest load path possible. Thus, in order to havecontrol over the actual load path, the stiffness of the connections must be known. An evengreater control is obtained if the stiffness of the connections can actively be designed. The

32 4 The resilient bond line
results indicate that a resilient bond line can indeed increase the strength of long lap jointsin comparison to non-resilient bond lines, as well as allowing the joint stiffness to be activelydesigned.
The strength of the lap joints are evaluated by means of the analytical Volkersen theory, nu-merical FE simulations as well as full scale tests as shown in Figure 4.5. The Volkersen the-ory [49, 54] presented in Paper A considers a linear elastic shear action without bending. Theeffects of both these limitations are visible in Figure 4.5, as bending decreases the load carry-ing capacity of the short resilient joints while the large influence of the softening behaviourincreases the strength of non-resilient joints in comparison to the numerical analysis accordingto Chapter 3.
In addition to Figure 4.2, a shear stress comparison of the timber adherends is found in Figure4.4. The non-resilient bond line (b) is loaded until failure at 720 kN using a shear strength of4.4 MPa, and the same load is applied to the resilient specimen (a). The more uniform stressdistribution is found for the resilient bond line, with lower maximum values. The propagatingcrack is visible in b) as it moves from the top and downwards.
a) b)
Figure 4.4: A comparison between the resilient (a) and non-resilient bond line (b) in terms ofshear stress distribution in a 700 mm lap length. The non-resilient bond line isloaded to failure at 720 kN and corresponding load is applied to the non-resilientspecimen.

4.3 Characteristics 33
A reasonable resemblance between the numerical, analytical and experimental results are foundfor the resilient bond line. Although considering the softening behaviour with material datapresented in literature, little resemblance is found between the numerical model of the non-resilient bond line and the test results. The experimental study indicates similar load carryingcapacities for resilient and non-resilient bond lines, which is not in agreement with numer-ical findings nor previously presented results [51] and Paper B. It is reasonable to assume thatseveral influencing factors have led to the strength increase, among which the influence ofboundary conditions is deemed most influential. Other factors comprise a possible under-estimation of the fracture energy and influence of the softening behaviour. This is furtherdiscussed in Paper A.
Joint length [mm]200 300 400 500 600 700 800 900
=av
g / f v
0
0.2
0.4
0.6
0.8
1
1.2
ResilientNon-resilient
Figure 4.5: Numerical results of experimental setup compared to experimental data. Woodfailure close to the bond line is marked with x while dots mark premature failures.The solid lines are numerical FE results while the dashed lines are analytical resultsaccording to Volkersen theory, using shear strength fv = 4.4 MPa.
A great variability in rubber properties can be obtained using different fillers during the produc-tion, and also several different types of rubbers are produced. In terms of properties relevant instructural applications, the different products vary in e.g. durability, creep, usable temperatureranges, strength and stiffness. Not only can the elastic properties of the material be varied usingfillers, but the thickness of the bond line can be chosen in a lap joint design. This combinationenables a vast range of possible effective stiffnesses, which possibly enables strength interactionbetween a resilient bond line and e.g. dowel type connections.
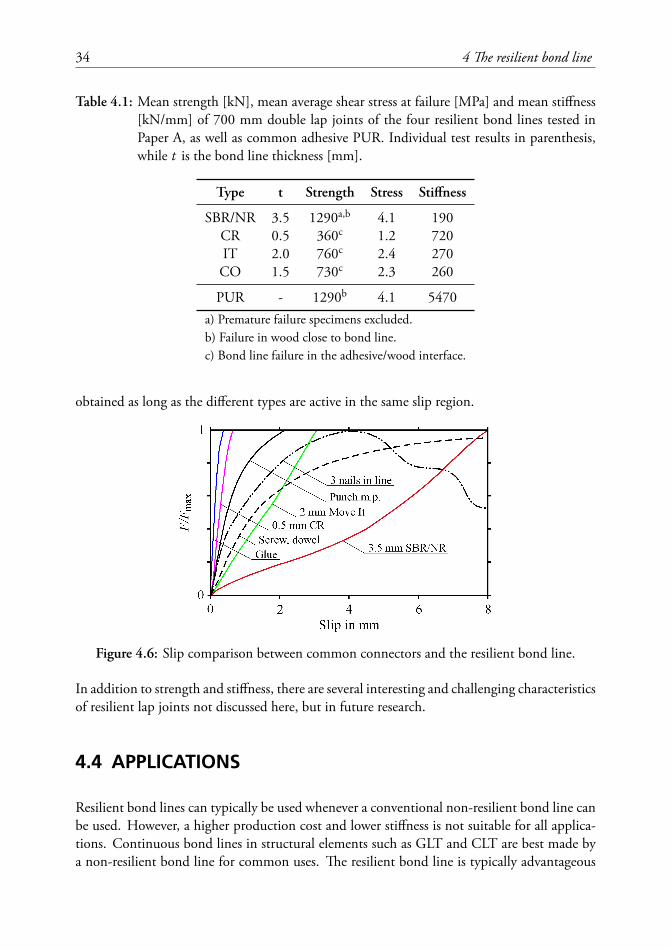
Four types of resilient bond lines are tested in Paper A of which the result is summarized inTable 4.1. Two rubbers were tested: A mixture of natural rubber (NR) and styrene-butadienerubber (SBR) as well as chloroprene rubber (CR). In addition, two elastomeric adhesives werealso tested: SikaTack Move IT (IT) and Collano RESA HLP-H (CO). Although CR was foundunsuitable for the application due to low strength, the bond lines combined well illustrate thepossibilities of strength interaction as shown in Figure 4.6. Slip curves of different types ofconnectors will typically never be identical, but a strength interaction can theoretically be
34 4 The resilient bond line
Table 4.1: Mean strength [kN], mean average shear stress at failure [MPa] and mean stiffness[kN/mm] of 700 mm double lap joints of the four resilient bond lines tested inPaper A, as well as common adhesive PUR. Individual test results in parenthesis,while t is the bond line thickness [mm].
Type t Strength Stress Stiffness
SBR/NR 3.5 1290a,b 4.1 190CR 0.5 360c 1.2 720IT 2.0 760c 2.4 270CO 1.5 730c 2.3 260
PUR - 1290b 4.1 5470a) Premature failure specimens excluded.b) Failure in wood close to bond line.c) Bond line failure in the adhesive/wood interface.
obtained as long as the different types are active in the same slip region.
Figure 4.6: Slip comparison between common connectors and the resilient bond line.
In addition to strength and stiffness, there are several interesting and challenging characteristicsof resilient lap joints not discussed here, but in future research.
4.4 APPLICATIONS
Resilient bond lines can typically be used whenever a conventional non-resilient bond line canbe used. However, a higher production cost and lower stiffness is not suitable for all applica-tions. Continuous bond lines in structural elements such as GLT and CLT are best made bya non-resilient bond line for common uses. The resilient bond line is typically advantageous

4.4 Applications 35
in applications when large forces are to be transferred in relatively small areas, such as in con-nections. The bond line can also be used to increase damping in elements when resistance todynamic loads and/or impact loads is needed.
The double lap joint is not common in modern timber engineering. It has previously been usedto lengthen timber elements, but GLT can today be produced in sufficient lengths directly andthus minimizing material use and improving design aspects. However, the key concept of thisstudy is not the double lap joint itself, but rather the resilient bond line which is further usedin the Shear plate dowel joint presented in Chapter 5.
Paper A also discusses the importance of the correct rubber treatment if used in a flexiblebond line. The study shows a strength increase of the rubber-adhesive interface by 60 timeswhen comparing no treatment to the one used. In terms of load carrying capacity of a joint,correct rubber treatment is vital for the structural integrity. This sensitivity is a clear potentialdrawback of the technique, but can possibly be eliminated by developing a standard treatmentprocedure with simple inspection techniques as partly suggested in Paper A.


5The Shear plate dowel joint
The aim of this project is to develop a novel timber connection design for heavy struc-tures with a high degree of prefabrication. The design should exceed the performanceof existing solutions regarding one or more functional requirements, as discussed in
Chapter 2, in order to be of interest. The Shear Plate Dowel Joint (SPDJ) design is proposedin this chapter, and utilises a resilient bond line for increased strength and a single dowel topromote efficient production.
5.1 BACKGROUND
When considering a production efficient truss node, the simplicity of a single large diameterdowel design is very appealing. As indicated by Figure 5.1, the members can be aligned andjoined together in a single operation. However, this design requires special attention to plugshear failure as shown in Figure 5.2. In order to avoid this failure mode, Eurocode stipulatesthat the dowel to member end distance should be exceed 7d , were d is the dowel diameter.Using a single large diameter dowel, this end distance would result in bulky and unpracticalnodes. To minimize the end distance, different reinforcement techniques have been tested us-ing screws and dowels [55,56]. Although the load carrying capacity was significantly improvedin comparison with no reinforcement at all, the shear plug failure remained and the strengthwas still typically lower than competing solutions using several smaller dowels.
Parallel to the work on single large diameter dowels, Gustafsson developed a new adhesivejoint technique based upon resilient bond lines, and conducted a large test series previouslydiscussed [51]. Included in this experimental study was also a single large dowel design, but

38 5 The Shear plate dowel joint
Figure 5.1: A single large diameter dowel enables fast erection of timber trusses, but is howeverprone to plug shear failure.
Figure 5.2: Typical plug shear failure when using a large dowel without reinforcement.
instead of internal screws as reinforcement he used externally bonded metal plates using aresilient bond line consisting of SBR rubber foil. This would distribute the stress over a largerarea as shown in Chapter 4, thus preventing the formation of a shear plug resulting in increasedstrength. This combination of external plate and a single dowel is the basis for the Shear PlateDowel Joint (SPDJ).
5.2 DESIGN AND APPLICATIONS
The SPDJ can be considered as a centrically loaded lap joint in a steel-wood configuration.Just like the previously discussed wood-wood lap joints, the resilient bond line can also hereconsist of rubber sheeting or a resilient adhesive. However, as rubber can be vulcanized to steelcreating a very strong bond, the rubber is in this configuration preferred. An exploaded viewof the SPDJ is shown in Figure 5.3, where a rubber sheeting is used.

5.2 Design and applications 39
Figure 5.3: SPDJ components: GLT, adhesive, rubber, steel plate and dowel. Externally bon-ded on both sides of the GLT member.
The SPDJ was originally designed for truss nodes, thus being very similar to Figure 5.1. Themain difference is the use of externally bonded metal plates which distribute the forces over alarge area, see Figure 5.4. The resilient bond line technique is used to ensure that the entireplate area is active in load transfer. To ensure shear action rather than bearing stress in thetimber, the hole is made somewhat larger in the GLT than in the steel plates. The dowel isthus not in direct contact with the timber, preventing it from splitting prematurely as a shearplug. The plates are bonded on both sides of each member in order to allow free rotation.
Figure 5.4: The Shear Plate Dowel Joint used in a truss node.
The strength of the SPDJ is strongly related to the steel plate size, which is determined by thedesign load. The dowel size is typically in the order of 15-30% of the member height and it ismainly limited by the bearing strength. The dowel can be made solid or hollow. Even thoughnot yet tested, it should also be possible to create the entire connection using engineered wood

40 5 The Shear plate dowel joint
products at the expense of a decrease in load carrying capacity.
Even though primarily designed for truss nodes, the SPDJ can possibly also be used where ahinge is needed, e.g. in arch springings and beam-column connections as shown in Figure 5.5and 5.6 respectively. A moment resisting connection could possibly be created by combiningseveral dowels.
Figure 5.5: Arch springing with a SPDJ
Figure 5.6: Beam-column connection using the SPDJ

5.3 Experimental studies 41
5.3 EXPERIMENTAL STUDIES
A full scale test series comparing different singe dowel joint designs was carried in collabora-tion with associate professor Huifeng Yang at College of Civil Engineering at Nanjing TechUniversity, China. The study consisted of full sized single dowel joint designs and the findingsare presented in Paper B. The study was designed to enable a simple comparison to a previousstudy conducted by Kobel [56], who also studied large dowel connections. Some of the testedjoints from this combined effort are illustrated in Figure 5.7, were it should be noted that alluses different reinforcement techniques for the same dimensions of GLT and dowel. Thesetests also includes the SPDJ shown as f ).
Figure 5.7: Different reinforcement techniques tested for single large dowel joints in PaperB and [56]. a) Non-reinforced reference, b) single rod, c) prestressed rod, d) 4screws, e) glued steel plate and f ) the SPDJ.
The results are compiled in Table 5.1 using a GLT cross section of 405x140 mm2 and a doweldiameter of 90 mm. The reference case without any reinforcement is found having an averagestrength of 130 kN, at which point a shear plug failure occurred. An increased load carryingcapacity was found using all reinforcement techniques, but often with questionable results incomparison to production time. While the steel plate joint without resilient bond line showeda premature failure at 220 kN in the steel-adhesive interface, the SPDJ outperformed all otherdesigns by a vast margin. With a load carrying capacity of close to 1 000 kN, the design wasworth investigating further.

42 5 The Shear plate dowel joint
Table 5.1: Average experimental strength and stiffness of the single dowel designs shown inFigure 5.7.
Specimen Strength [kN] Stiffness [kN/mm]
a) No reinforcement1 134 308b) Rod 195 -c) Rod, prestressed 298 -d) Screws1 237 336e) Glued steel plate joint 2 220 -f ) SPDJ 990 4841) From [56]2) Premature failure
Table 5.2: Strength comparison between experimental and numerical results. [kN]
Specimen Experimental Numerical Diff.
SPDJ without rubber 2201 5602 90%SPDJ 990 1 050 6%1) Premature failure2) Assuming wood failure
5.4 NUMERICAL STUDY
The experimental results proved the design concept of the SPDJ and numerical models weredeveloped to allow further analysis. The models are presented in Paper C and Section 3.4; oneconsidering the glued steel plate with a non-resilient bond line, and one considering the SPDJusing a resilient bond line.
Of major interest during the development of the numerical models were the influence of peelstresses on the design. As the load is applied to the externally bonded steel plates, bendingstresses develop due to the eccentricity. In order to fully capture this behaviour, a 3D modelwith a combined stress state failure criterion was required.
A premature failure was found in the experimental study for the glued steel plate joint byfailure in the glue to steel interface. The numerical model was thus developed to reveal its fullpotential if the interface could be made sufficiently strong, admitting failure in the wood aslimiting factor. Using a bilinear softening response, the load carrying capacity was found being560 kN. A significant increase, but still not as strong as the SPDJ as shown in Table 5.2.
The SPDJ did however show wood failure close to bond line, thus showing considerably bet-ter agreement between the experimental and numerical analysis. The reasonable agreementbetween experiments and numerical analysis, but also with analytical analysis by the use of

5.5 The SPDJ and the functional requirements 43
Volkersen theory [49], allows the numerical model to be used for further parameter analysis ofthe SPDJ presented in Paper D.
Besides an increased joint slip, it was also found that an increasingly resilient bond line wouldincrease the strength as the shear stress distribution approaches a uniform one. To minimizestress concentrations around the hole, two different types of steel plate designs shown in Figure5.8, were compared to the original square design. Although a strength increase was found forthe strip design, without any bond line along a strip at the height of the hole, the originaldesign was found the most suitable as being most material efficient.
400mm479mm524mm
110m
m11
0mm
Figure 5.8: Alternative plate designs to the SPDJ studied in Paper D: The original squaredesign (top), elliptical cut-outs (middle) and the strip design (bottom). All designshave the same bond area.
5.5 THE SPDJ AND THE FUNCTIONAL REQUIREMENTS
The presented results have yet only concluded that the SPDJ has a high load carrying capacityin terms of short term loading. The design is however expected to be useful also for dynamicloading, but the functional requirements of effective timber connections presented in Section2.1 includes also other factors than strength. That is the topic of this section, and as the SPDJis yet not existing in any real structure, the discussion is based upon available research resultsand sound engineering judgement. A short summary is found in Table 5.3.

44 5 The Shear plate dowel joint
Beside the load carrying capacity, the stiffness of the SPDJ is especially interesting as it canbe designed to meet specific needs. Such a possibility is very uncommon in contemporaryconnections. The basic concept is explained and to some extent studied in Section 4.3 andPaper A, and numerically applied to the SPDJ in Figure 5.9. The stiffness of the joint can bedesigned varying the rubber hardness and thickness, with only a small influence on the loadcarrying capacity.
Slip [mm]0 2 4 6 8 10 12
Loa
d [k
N]
0
200
400
600
800
1000
1200
0.5 mm1.0 mm2.0 mm3.0 mm
= avg [
MPa
]
0
1
2
3
4
Figure 5.9: Linear slip curves using different rubber thicknesses with a shear modulus G= 1.1MPa. Bond line failure marked with x.
The presented work has had the aim of finding the ultimate strength of the SPDJ design,which has resulted in the characteristic brittle wood failure. However, brittle behaviour isnot a favourable characteristic regarding structural safety. A ductile joint performance can beachieved by careful design of the steel parts. Two possibilities exists: (1) the plate is made thinto obtain a deformation zone in the unbonded region of the hole, or (2) the steel dowel can bedesigned to deform in the contact zone, e.g. by choosing a hollow cross section. The latter hasbeen studied in various designs in e.g. [57, 58] and is considered the best alternative. Furtherstudies are necessary to fully implement this design concept for the SPDJ.
The SPDJ is a very simple design with a clear load path. Paper A and C also indicate theapplicability of the Volkersen theory to the resilient bond line, making it possible to determinethe load carrying capacity using a single analytical expression with reasonable agreement. Thejoint is also expected to be production friendly as the steel plates can be mounted onto theGLT member off-site, leaving only alignment and mounting of the single dowel on-site. Apossible weakness in the manufacturing is the treatment sensitivity discussed in Paper A, andthe practicality of the acid rinse.
Appearance is subjective, but the truss node in Figure 5.4 has the potential weakness of havingto stack the members in the out-of-plane direction, creating wide nodes in comparison to e.g.slotted-in steel plates. Possible design alterations, e.g. using internally glued plates or locallyreduced GLT thickness, can potentially improve this.
Of the resilient bond lines tested in Paper A, an SBR rubber foil was found most reliable in

5.5 The SPDJ and the functional requirements 45
Table 5.3: Summarized characteristics of the SPDJ based upon the functional requirements.Weak performance (-), average (∼), good performance (+) and characteristics inneed of further research (?) is indicated.
Strength + Stiffness and deformations + Ductility ?Simplicity of design + Production friendly + Appearance –Durability ? Fire – Costs ∼Sustainability ∼
terms of adhesion properties and strength. The idea of subjecting rubber to high permanentloads are often met with healthy scepticism regarding durability and also fire resistance, whichboth have to be studied further. Unpublished results following the study of Björnsson andDanielsson [47] show that small test specimens can be subjected to permanent load during aperiod of more than 6 years, and the tests were thereafter demounted as the lab facility wasrenovated.
The production cost of the joint is not known at this point. In comparison to slotted-in steelplates, the SPDJ is expected to be more labour intense off-site while less on-site, a combinationoften claimed being cost effective. Approximately the same amount of material is needed forboth types of connections, but the easy dismantling of the SPDJ suggests that it can be reused.Recycling is although difficult due to the bonding of different materials.
Several suggestions for further research on the SPDJ have been presented here, which to someextent is needed prior to structural application. Fire and DOL performance are currentlyconsidered as possible crucial weaknesses.


6Summary of appended papers
Four papers are appended to this thesis, of which the majority of scientific work havebeen conducted by the author in three. Summaries of the papers are presented below,differing from the respective abstracts in order to present a line of argument. For each
paper, the contribution of the author is indicated. Some results and conclusions drawn in theappended papers are included in Part I.
Paper A
Use of a resilient bond line to increase strength of long adhesive lap jointsG. Larsson, P.J. Gustafsson, R. Crocetti
Submitted in January 2017.
Conventional non-resilient bond lines in long lap joints are compared to new resilient bondlines, which can increase the load carrying capacity by minimizing stress concentrations. Acomprehensive comparative study is conducted numerically, analytically and experimentally,indicating differences between the methods used. The numerical and analytical results clearlyshows the benefits of a resilient bond line, while the experimental results to some extent in-dicates the opposite. Difficulties in achieving a strong bond between adhesive and rubber arediscussed as well as the influence of softening behaviour and boundary conditions. Despitethe experimental results, the authors conclude that resilient bond lines typically increase theload carrying capacity of long lap joints.
The author planned and performed the research tasks including the experimental and numer-ical work, as well as writing the article. The co-authors contributed by a general supervision ofthe work, suggested experimental methods and test setup as well as reviewed the work.

48 6 Summary of appended papers
Paper B
Experimental study on innovative connections for large span timber truss structuresH. Yang, R. Crocetti, G. Larsson, P.J. Gustafsson
Proceedings of IASS W.G. 12 + 18, 2015.
On-site assemblage can be made significantly more efficient by the use of a single large dowel.Reinforcements are however needed in order to prevent premature splitting failure, and severaldifferent reinforcing techniques are experimentally compared in this article. 15 full scale quasi-static tensile tests in 5 different designs were conducted on glulam members with identicalconnections at each end. It was found that all reinforcement techniques enhanced the per-formance of the connection, of which the Shear plate dowel joint clearly outperformed theothers by using a resilient bond line in a wood-to-steel design.
The study was planned and conducted by assistant professor Huifeng Yang of the College ofCivil Engineering, Nanjing Tech University, China. The author assisted in the experimentalwork conducted in China as well as in reviewing the paper.
Paper C
Bond line models of glued wood-to-steel plate jointsG. Larsson, P.J. Gustafsson, E. Serrano, R. Crocetti
Engineering Structures, 121: 160-169, 2016
As the experimental results of the Shear plate dowel joint were promising, developement of arepresentative and efficient numerical bond line model was of interest. Paper C presented suchmodel which is in well agreement with the experimental results. The importance of fracturesoftening analysis of the non-resilient bond line is highlighted, and the analysis indicates apremature failure in the Paper B test series of the non-resilient specimens. Thus, the benefitsof a resilient bond line is not as high as the experimental results indicate, but still increases theload carrying capacity by 150%. Comparison is also made to the analytical Volkersen theorydescribing the shear stress distribution of lap joints.
The analytical and numerical work was conducted by the author, as well as writing the majorityof the paper. Remaining authors assisted in reviewing, writing shorter sections of the paperand general supervision of the work.
Paper D
Analysis of the shear plate dowel joint and parameter studiesG. Larsson, P.J. Gustafsson, E. Serrano, R. Crocetti
Proceedings of WCTE 2016.
This conference paper is a direct follow-up of Paper C, in which the previously presented bondline model is used to conduct parameter analysis of the Shear plate dowel joint. Alternative

49
designs are investigated along with a discussion of the applicability of the joint. Alternativejoint designs are presented, for which it is concluded that the original square design is materialefficient but not the strongest.
The author carried out all simulations as well as wrote the paper while the co-authors assistedin reviewing.


7Concluding remarks
Asummary of the research progress made within the Formas project Innovative connectionsfor timber construction is presented in this chapter. Emphasis of the research has beenput on resilient adhesive joints and the new connection design Shear plate dowel joint,
but further research is needed prior to industrial use which is also discussed.
7.1 CONCLUSIONS
Despite to some degree conflicting results in Paper A, the general conclusion of this studyis that a resilient bond line can increase the load carrying capacity of lap joints by reducingstress concentrations1. The technique is typically applicable whenever a conventional adhesivebond line is applicable, and special interest has been taken in the Shear plate dowel joint. Thefollowing conclusions are drawn:
Resilient bond lines
• Increase the load carrying capacity of long lap joints by minimizing stress concentrations.
• Enable the possibility to design joint stiffness.
1There is a saying that Nobody believes the simulation results except the person doing them, whereas everybodybelieves the experimental results except the person doing them. After this reading, would you agree or have I in thiscase convinced you otherwise?

52 7 Concluding remarks
• Analytical predictions regarding shear stress distribution and load carrying capacity can,in a simple manner, be made with reasonable high accuracy using the Volkersen theory.
• The resilient bond line can be made by either an intermediate rubber sheeting or aresilient adhesive.
• Show a high sensitivity to the manufacturing method, thus detailed instructions areneeded.
The shear plate dowel joint
• A new connection for heavy timber structures is proposed.
– High degree of prefabrication is possible
– Fast installation
• Full scale short term tests shows promising results.
• Experimentally verified numerical model is developed.
• The square plate design is found most suitable.
7.2 FURTHER RESEARCH
Although the Shear plate dowel joint shows promising initial results, more research is neededbefore it can be used safely in heavy timber structures. Areas of interest are mainly related tothe functional requirements discussed in Section 5.5, and are presented below.
Resilient bond lines
• Further investigations of the unexpected good performance of non-resilient bond linesin Paper A in order to determine causality.
• Development of production methodology with minimal variance in the achieved bondstrength.
The shear plate dowel joint
• Influence of load direction to fibre orientation. Only load parallel to grain has yet beenstudied, but perpendicular to grain is important for some possible applications, e.g.beam-column connections.

7.2 Further research 53
• Duration of load effects must be investigated as rubber typically is prone to creep.
• Proposal of a design procedure should be developed, possibly based upon the Volkersentheory.
• Response to fire and possible solutions to counteract the temperature influence on rub-ber strength. Possible solutions include insulating materials, choice of rubber fillersand/or designing the curing pressure screws according to fire load.
• Investigate measures to increase joint ductility, possibly by the use of cylindrical dowelsallowing deformations.
• Investigate possible vibration reduction by the use of SPDJ.
It should be noted that the resilient bond line possibly can be used wherever a common bondline is used. In some cases the strength can be increased, in other the stiffness can be lowered.Some of the presented items are planned for further research to the upcoming PhD thesis.


References
[1] Dodoo, A., Gustavsson, L., Sathre, R. (2016), Climate impacts of wood vs. non-woodbuildings, Tech. rep., The Swedish Association of Local Authorities and Regions.
[2] Green, M.C., Karsh, J.E. (2012), Tall Wood, Canadian Wood Council.
[3] Madsen, B. (2000), Behaviour of timber connections, Timber Engineering Ltd.
[4] Dahl, K.B. (2009), Mechanical properties of clear wood from Norway spruce, Ph.D. thesis,NTNU Trondheim.
[5] Johnsson, H. (2004), Plug shear failure in nailed timber connections. Avoiding brittle andpromoting ductile failures, Ph.D. thesis, Luleå University of Technology.
[6] Johansen, K. (1949), Theory of timber connections, in: International Association of Bridgeand Structural Engineering, vol. 9, 249–262.
[7] Jorissen, A.J.M. (1998), Double shear timber connections with dowel type fasteners, Ph.D.thesis, Delft University.
[8] Larsen, H.J. (2003), Introduction: Fasteners, Joints and Composite Structures. Ch.16 in:Timber Engineering ed. by Thelandersson,S., Larsen, H, Chichester West Sussex.
[9] Eurocode 5, SS-EN 1995-1-1.
[10] Poutanen, T.T. (1989), Analysis of trusses with connector plate joints, in: Proceedings ofthe Second Pacific Timber Engineering Conference, University of Auckland, New Zealand,28-31 August 1989 Volume 1, 155–159.
[11] Foschi, R.O. (1977), Analysis of wood diaphragms and trusses. Part II: Truss-plate connec-tions, Canadian Journal of Civil Engineering 4(3), 353–362.
[12] Feldborg, T., Johansen, M. (1981), Wood trussed rafter design: Strength and stiffness testson joints. Long-term deflection of W-trussed rafters, Statens Byggeforskningsinstitut, SBI.
[13] Blass, H.J. (2003), Joints with Dowel-type Fasteners. Ch.17 in: Timber Engineering ed. byThelandersson,S., Larsen, H, Chichester West Sussex.

56 References
[14] Bengtsson, C., Johansson, C.J. (2002), GIROD – Glued-in rods for timber structures,Tech. Rep. 2002:26, SP Technical Research Institute of Sweden.
[15] Tlustochowicz, G., Serrano, E., Steiger, R. (2010), State-of-the-art review on timber con-nections with glued-in steel rods, Materials and Structures 44(5), 997–1020.
[16] Natterer, J., Sandoz, J.L., Rey, M. (2004), Construction en bois: matériau, technologie etdimensionnement, Traité de génie civil de l’Ecole polytechnique fédérale de Lausanne,Presses Polytechniques et Universitaires Romandes.
[17] Adams, R.D., Wake, W.C. (1984), Structural adhesive joints in engineering, Elsevier Ap-plied Science Publishers Ltd.
[18] Madsen, B. (1992), Structural behaviour of timber, Timber Engineering Ltd.
[19] Bodig, J., Jayne, B.A. (1982), Mechanics of wood and wood composites, Van NostrandReinholt Publishing.
[20] Dinwoodie, J. (2000), Timber - Its nature and behaviour, E&FN Spon, 2nd edition edn.
[21] Persson, K. (2000), Micromechanical modelling of wood and fibre properties, Ph.D. thesis,Lund University.
[22] Petroski, H. (1996), Invention by Design: How Engineers Get fromThought to Thing, Har-vard University Press.
[23] Hearmon, R.F.S. (1948), The elasticity of wood and plywood, HM Stationery Office Lon-don.
[24] EN 338:2016, Structural timber - Strength classes.
[25] EN 14080:2013, Timber structures - Glued laminated timber and glued solid timber - Re-quirements.
[26] Astrup, T., Clorius, C.O., Damkilde, L., Hoffmeyer, P. (2007), Size effect of glulam beamsin tension perpendicular to grain, Wood Science and Technology 41(4), 361–372.
[27] Aicher, S., Dill-Langer, G. (2005), Effect of lamination anisotropy and lay-up in glued-laminated timbers, Journal of structural engineering 131(7), 1095–1103.
[28] Danielsson, H. (2013), Perpendicular to grain fracture analysis of wooden structuralelements-Models and applications, Ph.D. thesis, Lund University.
[29] Thelandersson, S. (2003), Introduction: Wood as a construction material. Ch.2 in: TimberEngineering ed. by Thelandersson,S., Larsen, H, Chichester West Sussex.
[30] Eberhardsteiner, J. (2013), Mechanisches Verhalten von Fichtenholz: ExperimentelleBestimmung der biaxialen Festigkeitseigenschaften, Springer-Verlag.

References 57
[31] Aicher, S., Dill-Langer, G., W, K. (2002), Evaluation of different size effect models fortension perpendicular to grain, in: CIB-W18 Timber Structures, meeting 35, 35-6-1.
[32] Weibull, W. (1939), A statistical theory of the strength of materials, 151, Generalstabenslitografiska anstalts förlag.
[33] Johansson, M. (2015), Structural properties of sawn timber and engineered wood products,vol. 1, chap. 2, Swedish Forest Industries Federation, 2 edn.
[34] Norris, C.B. (1962), Strength of orthotropic materials subjected to combined stresses, FPL-1816. Madison, Wis. : U.S. Dept. of Agriculture, Forest Service, Forest Products Labor-atory .
[35] Tsai, S.W., Wu, E.M. (1971), A general theory of strength for anisotropic materials, Journalof composite materials 5(1), 58–80.
[36] Swiss Society of Engineers and Architects (2012), Timber beams notched at the support,SIA 265.
[37] Mascia, N.T., Nicolas, E.A., Todeschini, R. (2011), Comparison between Tsai-Wu failurecriterion and Hankinson’s formula for tension in wood, Wood Research 56(4), 499–510.
[38] Hellan, K. (1985), Introduction to fracture mechanics, McGraw-Hill.
[39] Haller, P., Gustafsson, P.J. (2002), An overview of fracture mechanics concepts, Rep. No.RILEM TC 133.
[40] Boström, L. (1994), The stress-displacement relation of wood perpendicular to the grain,Wood science and technology 28(4), 309–317.
[41] Riberholt, H., Enquist, B., Gustafsson, P., Jensen, R. (1992), Timber beams notched atthe support, Tech. Rep. TVSM-7071, Div. of Struct. Mech., Lund University.
[42] Stefansson, F. (2001), Fracture analysis of orthotropic beams - Linear elastic and non-linearmethods, Licentiate thesis, Lund University.
[43] Serrano, E. (2000), Adhesive joints in timber engineering. Modelling and testing of fractureproperties, Ph.D. thesis, Lund University.
[44] Wernersson, H. (1994), Fracture characterization of wood adhesive joints, Ph.D. thesis,Lund University.
[45] Austrell, P.E. (1997), Modeling of elasticity and damping for filled elastomers, Ph.D. thesis,Lund University.
[46] Dassault Systèmes (2012), Abaqus Analysis User’s manual, Tech. rep.
[47] Björnsson, P., Danielsson, H. (2005), Strength and creep analysis of glued rubber foil timberjoints, Master’s thesis, Lund University.

[48] Freakley, P., Payne, A. (1978), Theory and Practice of Engineering with Rubber, AppliedScience Publishers.
[49] Volkersen, O. (1938), Die Nietkraftverteilung in zugbeanspruchten Nietverbindungen mitkonstanten Laschenquerschnitten, Luftfahrtforschung 15(1/2), 41–47.
[50] Gustafsson, P. (1987), Analysis of generalized Volkersen-joints in terms of non-linear fracturemechanics.
[51] Gustafsson, P. (2007), Tests of full size rubber foil adhesive joints, Tech. Rep. TVSM-7149,Div. of Struct. Mech., Lund University.
[52] Gustafsson, P. (2008), Stress equations for 2D lap joints with a flexible bond layer, Tech.Rep. TVSM-7148, Div. of Struct. Mech., Lund University.
[53] Gustafsson, P. (2006), A structural joint and support finite element, Tech. Rep. TVSM-7143, Div. of Struct. Mech., Lund University.
[54] Gustafsson, P. (2008), Tests of Wooden Cleats Oriented Along Fibre, Tech. Rep. TVSM-7155, Div. of Struct. Mech., Lund University.
[55] Crocetti, R., Axelson, M., Sartori, T. (2010), Strengthening of large diameter single doweljoints, Tech. Rep. 2010:14, SP Technical Research Institute of Sweden.
[56] Kobel, P. (2011), Modelling of strengthened connections for large span truss structures, Mas-ter’s thesis, Lund University.
[57] Pavković, K., Rajčić, V., Haiman, M. (2014), Large diameter fastener in locally reinforcedand non-reinforced timber loaded perpendicular to grain, Engineering structures 74, 256–265.
[58] Leijten, A. (2000), The tube joint. Ch.10 in: Behaviour of timber connections by Madsen,B., Timber Engineering Ltd.

Part II
Appended publications


Paper A


Use of a resilient bond line to increase strength of long
adhesive lap joints
G. Larssona, P.J. Gustafsson, R. Crocetti
aDivision of Structural Mechanics, Lund University, P.O. Box 118, SE-221 00 Lund,Sweden, [email protected]
Abstract
The strength of long adhesive lap joints are often limited by fracture energyrather than failure stress, suggesting that maximum load only is obtainedafter failure initiation due to stress concentrations at lap ends. This paperinvestigates a method to minimize these stress concentrations by introducinga resilient bond line, which increases the load carrying capacity of the lap jointwhile maintaining an elastic behaviour by allowing some shear deformation tooccur. The study comprises analytical, numerical and full-sized experimentalwork on double lap joints comparing non-resilient to resilient bond lines.
The numerical analysis clearly indicates the strength increase made pos-sible using resilient bond lines. A good agreement is also found between thenumerical the analytical Volkersen theory for resilient bond lines, indicatingthat reasonable strength predictions can be obtained by hand calculations ifpeel stress interaction can be minimized.
The experimental results of the resilient bond line verifies the numericalfindings, although production difficulties decreases the statistical significanceof the result. On the contrary, the experimental results of non-resilient bondlines significantly exceed expectations, probably due to the specific boundaryconditions used in the test setup.
Despite some contradictory experimental results, the conclusion of thisstudy is that the efficiency of long lap joints can be increased by the use ofresilient bond lines.
Keywords: timber, resilient bond line, lap joint, rubber foil, tests
Preprint submitted to European Journal of Wood and Wood Products January 9, 2017

1. Introduction
Lap joints have historically been used in engineering as a simple means ofassembling structural members. Lap joints are today still used on a varietyof materials, but the early examples are mainly for wood. Standing for wellover a millennium, high-rise Japanese pagodas as well as the slightly youngerNordic stave churches are good examples of how timber can be assembled fordurability, in which some joints are based upon a lap joint design [1, 2].Today’s efficient production and optimized material usage often rule out theold production methods and lap joints are hence rarely seen in modern timberstructures. However, the resilient adhesive lap joints studied herein mightprove to again increase the competitiveness of lap joints in heavy timberstructures.
Consider an adhesive lap joint in a heavy modern timber structure. Insuch, large forces are typically transferred through the joint which requireslarge lap areas. For a given point along the lap length, the two adherendswill typically experience different axial strains, particularly at the lap ends.This discrepancy causes severe shear stress concentrations in which fractureis initiated, thus limiting the total load bearing capacity of the joint.
While studying the Volkersen theory [3], it was realized that the stressconcentrations of lap joints can be minimized if a bond line with low shearstiffness and high fracture energy, henceforth denoted a resilient bond line, isused. A test series based upon the idea using an intermediate rubber foil wasconducted [4], without any comparisons to non-resilient bond lines. Furtherwork has since been conducted on different types of applicable rubber [5],other full scale tests of innovative timber joints using the technique [6] anda numerical bond line model has been presented [7].
The present paper aims to determine the possible effect of using a resilientbond line in full scale wooden lap joints by a comparative study. The studycomprises:
• Numerical and analytical analyses of an ideal lap joint comparing ge-ometrically similar resilient and non-resilient bond lines. Sensitivityanalysis according to the method of factorial design is also conducted,and
• a full scale experimental test series of double lap joints with lap lengthsup to 700 mm. Non-resilient and resilient bond lines are compared,
2

but also different techniques to achieve a resilient bond line are tested.Additional numerical studies are conducted for the experimental setup.
2. Methods
Double adhesive lap joints were tested experimentally in full scale quasi-static compression tests, accompanied by numerical analyses using bond linemodels presented in [7]. Rational design equations can possibly be derivedfrom analytical expressions based upon Volkersen theory [3]. The study isdesigned to investigate possible benefits of using a resilient bond line for largelap joints, in which a standard adhesive bond line is used as reference.
2.1. Tests
2.1.1. Test series
Double adhesive lap joints with increasing lap lengths according to Figure 1were used, in which the bond line material varied according to Table 2. Theheight of the test specimens was 225 mm, and the width was 230 mm and280 mm for the side members and centre member respectively.
In order to achieve a resilient bond line, a sheeting made from a mixof natural rubber (NR) and styrene-butadiene rubber sheeting (SBR) wasprimarily used. In order to possibly simplify the manufacturing process ofresilient bond lines, three additional types were added to the test series. Theuse of chloroprene rubber sheeting (CR) could possibly decrease preparationwork while rubber can also possibly be replaced entirely using resilient adhe-sives such as SikaTack Move IT (IT) and Collano RESA HLP-H (CO). Thenon-resilient reference PUR-series consisted of a 2-component polyurethane(PUR), the same as used for the rubber specimens.
The SBR/NR used was 3.5 mm thick with a shear modulus of 1.2 MPa anda tensile strength of≥17.5 MPa and an elongation at failure of 400%. The CRwas 0.5 mm thick with a density of 1.30 g/cm3 and a tensile strength of ≥13MPa and an elongation at failure of ≥250% according to ISO standards. Thehardness was the same as for the SBR/NR. The resilient adhesive SikaTackMove IT was slightly stiffer with a shear modulus of 1.4 MPa with a shearstrength of 5 MPa and an elongation at failure of 300%. Collano RESAHLP-H is the softest material tested with a shear modulus of 0.4 MPa andan elongation at failure of approximately 260%.
3

Table 1: Bond line specifications
Specimen L Rubber Adhesive Qty
SBR-200 200 SBR/NR, 3.5 mm SikaForce 7710 + hardener 7020 4SBR-400 400 SBR/NR, 3.5 mm SikaForce 7710 + hardener 7020 4SBR-700 700 SBR/NR, 3.5 mm SikaForce 7710 + hardener 7020 6
PUR-200 200 - SikaForce 7710 + hardener 7020 4PUR-400 400 - SikaForce 7710 + hardener 7020 4PUR-700 700 - SikaForce 7710 + hardener 7020 4
CR-700 700 CR, 0.5 mm SikaForce 7710 + hardener 7020 2
IT-700 700 -SikaTack Move IT, 2 mm
2+ SikaPrimer-3 N
CO-700 700 - Collano RESA HLP-H, 1.5 mm 2
2.1.2. Manufacturing
Glued laminated timber (GLT) of strength class GL30c (Norway spruce) witha cross section depth of 225 mm was paired using SikaBond 545 in order toobtain the required dimensions. The lamella thickness was 45 mm. To reducethe risk of premature splitting, the upper member of the largest specimenswas further reinforced by 2-3 6.5x220 mm screws inserted perpendicular tograin at the low end. The density was 440-460 kg/m3 at an average moisturecontent of 8.7% during testing.
The manufacturing method used for the bond line was dependent on thebond line material, and all methods were verified by tests. The methodused for the SBR/NR is presented in detail in [4], which involves sulphuricacid treatment of the rubber prior to application of the adhesive. The acidtreatment was conducted with 97% sulphuric acid at room temperature. Thesame gluing technique was used for the SBR/NR specimens as the PURspecimens. The GLT was planed within 2 hours prior to bond line gluing.All adhesive was applied to the GLT surfaces, one-sided for each bond, andcured in room temperature with manually applied curing pressure using 4-6sash clamps. Dependent on used adhesive, the pressure was typically appliedfor 24 hours and the specimens stored at minimum one week prior to testing.
The manufacturer of the CR recommended the use of CR-based contactadhesive for application, but pre-testing indicated low strength. In order toobtain the best result, the CR was also treated with sulphuric acid according
4

to [4] and 2-component PUR adhesive was used.The resilient adhesive in the IT specimens was applied using a motorized
mobile caulking gun after application of the primer. A maze of adhesivestrings was applied to the wood surface which were flattened out by applyingcompression between the two adherends. The thickness of the bond linewas ensured by 2.0 mm rubber distances. Due to the manual string-wiseapplication, the bond line was not entirely continuous making the nominalbond line area smaller than intended with typically 90-95% coverage. Thelow viscosity of Collano RESA HLP-H enabled pouring of the adhesive onto the substrate, ensuring 100% coverage if the 1.5 mm rubber distances aredisregarded. The CO specimens was stored for one month prior testing toensure proper hardening.
2.1.3. Setup and loading procedure
The experimental test setup is shown in Figure 1. The test is designed toprimarily fail in shear, in which the horizontal shackle reduces the effect ofleg splitting during the displacement controlled quasi-static loading. Theshackle was made up of UPE 80 beams and 8.8 M16 rods. Steel plates wereused in order to uniformly distribute the bearing stress between the pointsof load application and the end grain.
The loading procedure was conducted according to the European Stan-dard EN 26891 for timber structures. The load is applied up to 40% of theestimated failure load Fest, then reduced to 0.1Fest before loaded to failure atan actuator speed of 1.1 and 1.5 mm/min for non-resilient and resilient bondlines respectively. The relative shear displacement over the bond line wasmeasured centrically on both sides using four LVDTs with 140 mm length ofstroke. The measurement points were located 25 mm from the bond line oneither side. The load was measured using the hydraulic oil pressure, whichwas calibrated up to 500 kN with a maximum error less than approximately2%.
Possible failure modes include bond line failure in the wood/adhesive in-terface, rubber/adhesive interface, rubber failure, wood failure close to bondline by shear/peel stress interaction and wood tensile crack perpendicular tograin along the centreline of the specimen due to leg splitting. Except rubberfailure, all these failure modes were visible in the experimental study. Howe-ver, only wood failure close to bond line by shear/peel stress interaction isstudied in the numerical analyses as further discussed in the following section.
5

200-
700m
m
225mm230mm
280mm
Figure 1: Double lap joint test setup
2.2. Numerical strength analysis
Numerical analyses with linear and non-linear fracture modelling were perfor-med in order to determine a general length to strength behaviour for resilientand non-resilient bond lines respectively. The simulations were performed inplane stress 2D by means of finite element modelling using commercial gene-ral purpose FE software. The model consists of wood and a bond line. Thebond line model is presented in [7], and represented by a cohesive layer witha single element in the thickness direction. The bond line thus representseither (1) the adhesive or (2) the adhesive and the rubber foil; including thematerial interfaces. As fracture softening is important for common adhesiveswhile negligible for resilient bond lines, two separate approaches were used to
6

model the bond line. A bilinear softening model is used for the non-resilientspecimens while the resilient bond line is represented by a linear elastic mate-rial, as shown in Figure 2. The specific bond line model includes a method toconsider the normal stiffness variation of resilient bond lines due to Poisson’sratio ν → 0.5 in a linear fashion. The bond line strength is represented bywood failure while the shear modulus used was 1.2 and 1000 MPa for resilientand non-resilient bond lines respectively.
Shear displacement /s / /
s,max
0 0.2 0.4 0.6 0.8 1
Shea
r st
ress
= /
f v
0
0.2
0.4
0.6
0.8
1
Non-resilientResilient
Figure 2: A linear shear stress-displacement behaviour was used for theresilient bond lines, while a bilinear model was used for the non-resilient.
The wood body is represented by a linear elastic rectilinear orthotropicmaterial model, for which the 2D parameters are given in Table 2. Woodparameters were used in a stochastic fashion, where normal distribution wasfound for all parameters except for the stiffnesses, see Dahl [8]. Fracturesoftening of wood adhesive bonds has been studied by Wernesson [9], fromwhom fracture energies are found.
A load controlled analysis without artificial stabilization was used. Sym-metry was regarded on the geometry built up by first order plane stress solid
7

Table 2: Adopted material parameters for wood [8, 9]. Parameters are givenin MPa and [-] with corresponding coefficient of variation (CV).Fracture energies are given in Nm/m2.
Direction Mean CV
Young’s modulus* EL 9040 0.38ER 790 0.28
Shear modulus GTL 600 0.30Poisson’s ratio νTL 0.06 0.07Shear strength fv 4.4 0.38Tensile strength ft,90 4.9 0.15Fracture energy Gf,I 230 0.14
Gf,II 850 0.10
*) Lognormal distribution
elements with 4 nodes and full integration. Cohesive elements were used forthe bond line with one element in the thickness direction. Failure was evalu-ated using a stressed based Norris failure criterion [10] for the resilient bondline while the maximum strength of the propagating fracture was adoptedfor the non-resilient bond line.
In order to obtain a reasonable strength comparison between resilientand non-resilient bond lines, boundary conditions in the numerical analysiswere mainly set in order to achieve a dominant shear action in the lap joint,as well as using the same bond line thickness of 1 mm regardless of type(despite experimental test setup). The experimental geometry was otherwiseemulated. In comparison to the boundary conditions illustrated in Figure 1,roller supports are in this section replaced by fixed and thus no shackle isneeded. Comparison to test results are made with more realistic boundaryconditions in Section 3.2.2.
A screening process for important factors was conducted using a two-level fractional factorial 29−4
IV design for the resilient and non-resilient modelindividually [11]. The analysis included 9 geometric and material parameterswith a variation of ±10% including failure strengths, fracture energies andaxial stiffness of the members. A full factorial 34 design was then conductedto discover possible non-linear responses and interactions between analysedfactors, which is not possible in a common one-factor-at-the-time sensitivityanalysis. The four most influential material parameters were then inserted
8

as stochastic variables in order to possibly verify a strength increase of theresilient bond line regardless the natural variability of wood.
2.3. Analytical
2.3.1. Shear stress distribution
The analytical expression used for determination of the shear stress distri-bution and bond line strength is based upon the Volkersen theory [3] aspresented in [12]. For the compression-compression load configuration usedin the test, but neglecting bending, the 1D shear stress distribution of thebond line τ3 is found being
τ3(x) = C1 cosh(ωx) + C2 sinh(ωx) (1)
C1 =PG3
t3ω
(1
E1A1 tanh(ωL)+
1
E2A2 sinh(ωL)
)(2)
C2 =PG3
t3ω
(−1
E1A1
)(3)
ωL = L
√G3b3(1 + α)
t3E1A1
(4)
α =E1A1
E2A2
≤ 1.0 (5)
The shear stress distribution of the bond line (index 3) is thus governedby the properties of the two adherends (index 1 and 2) and the bond lineproperties: cross-sectional area A, longitudinal stiffness E, bond line lengthL, width b3, thickness t3 and shear stiffness G3.
The shear stress distribution of the experimental geometry by means ofVolkersen theory is presented in Figure 5. By identifying the maximum shearstress at x = 0 and introducing the material shear strength, the load carryingcapacity Pf can be determined by
Pf = b3Lfv(1 + α) sinh(ωL) tanh(ωL)
ωL (sinh(ωL) + α tanh(ωL))(6)
As tanh(ωL) → 1.0 for large ωL, Eq 6 can be reduced to
9

Pf ≈ b3Lfv(1 + α)
ωL(7)
The approximation deviates less than 0.5% for ωL ≥ 6. The Volkersentheory does not include bending, which however does occur in the test setup.
2.3.2. Brittleness ratio in terms of long lap joints
This study argues for the benefits of a resilient bond line in long lap jointsand the definition of a long lap joints must be put into perspective of theadherends, which properties influence the shear stress distribution. In orderto obtain an estimate of the length needed for positive influence of a resilientbond line, the brittleness ratio of lap joints λ can be used. [13]
The normalized mean shear stress at failure is governed by the brittlenessratio λ of lap joints. In order to achieve a high utilization ratio of the bondedarea, it is important to have a low brittleness ratio. Using the strength limitsof ideal plasticity and linear elastic fracture mechanics (LEFM), it is possibleto identify an approximation of the recommended maximum value of λ whichallows for a high efficient lap joint as
λ =l2f 2
v
t1E1Gf
≤ 2(1 + α) (8)
where α is defined in Equation 5 and t1 is the thickness of element 1. If aresilient bond line is used, then Gf = f 2
v /2G3. The limitations of LEFMshould be noted and the fact that bending is not included in Equation 8. Inorder to meet the recommended brittleness ratio, Equation 8 suggests thata resilient bond line should be used for lap lengths over 420 mm for thegeometry used in the experimental study (α = 0.61).
3. Results and Comparisons
The results of this study comprises numerical and experimental analyses com-paring resilient to non-resilient bond lines, as well as influencing parameters.The numerical analyses will indicate an increasing strength difference in fa-vour of the resilient bond line as the lap length increases, which howeveris in disagreement with the experimental results. It is the authors believethat the discrepancy between the results is due to the influence of boundaryconditions and production difficulties.
10

3.1. Numerical results
The numerical analysis is based upon an ideal lap joint comparing geome-trically similar resilient and non-resilient bond lines. Boundary conditionsare set to promote shear action with minimal interference of tensile stressesin the bond line induced by leg splitting. Material parameters are found inTable 2.
3.1.1. Factorial design
Out of nine material and geometrical parameters analysed, the four mostinfluential were further studied in a full 34 factorial design from which theresults are presented in Figure 3. The analysis was conducted for a basebond line length of 500 mm, and all parameters were independently varied±10% from the reference values discussed in Section 2.2.
The factorial design clearly highlights the fundamental differences bet-ween resilient and non-resilient bond lines. Due to high stress concentrationsin non-resilient bond lines, a shear strength increase does not influence theload carrying capacity, which is more dependent on fracture energy. Althoughto some extent proportional, these material properties have been consideredindividually in this analysis for illustration purposes. Resilient bond lineshave a strength advantage when used in long lap joints, as the average shearstress at failure does not drop at the same rate as for non-resilient bondlines for increased lap length as shown in Figure 3. Low stiffness, by eitherusing a less stiff or thicker bond line, increases the load carrying capacity atthe expense of a decreased joint stiffness. As the stiffness of the bond lineapproaches zero, the strength approaches the theory of perfect plasticity.
The factorial design analysis does not suggest any parameter interactionfor the resilient bond line in the analysed parameter region in terms of averageshear stress over the lap area. It does however suggest a slight interaction incase of non-resilient bond line between lap length and shear strength, as wellas between fracture energy and shear strength.
3.1.2. Numerical comparison of strength to length performance
For the double lap joint geometry shown in Figure 1 using deterministicallyincreasing length, independent stochastic material parameters were insertedin a numerical strength analysis. The stochastic material parameters werethe shear strength fv, shear fracture energy Gf , normal stiffness of wood EL
and tensile strength perpendicular to grain ft,90. The result of 700 stochasticnumerical simulations are shown in Figure 4 using a 2nd order polynomial
11

0.9 1 1.1
Mea
n =
avg [
MPa
]
2.5
3
3.5
4
4.5
fv
0.9 1 1.1
L
0.9 1 1.1
G3
0.9 1 1.1
Gf
Figure 3: Parameters significantly influencing the average shear stress atfailure according to full factorial 34 design using a ±10% variationof reference values: shear strength fv, lap joint length L, stiffnessof the bond line G3 and shear fracture energy Gf . Resilient bondline as solid line while non-resilient in dashed. Reference valuesare found in Section 2.2.
fit with corresponding 95% confidence interval. A decreasing average shearstress at failure is visible for both non-resilient and resilient bond lines forincreasing lap length, although the effect is less pronounced in case of aresilient bond line as also predicted by the factorial design.
To evaluate the applicability of the Volkersen theory on this specific de-sign, a comparison is made to the numerical analysis in Figure 4. A goodagreement is found between analytical and numerical results for a resilientbond line, while very poor agreement for non-resilient bond lines primarilydue to the fact that fracture softening is not taken into account in the Vol-kersen theory.
The increased strength of resilient bond lines is due to the more uniformshear stress distribution as shown in Figure 5, which also illustrates a com-parison to the analytical Volkersen shear stress distribution from Equation1.
The numerical analysis indicates that damage is initiated in the non-resilient design at approximately 70% of maximum load, while no damage ismodelled for the resilient bond lines.
12

Joint length [mm]200 300 400 500 600 700 800 900
=av
g / f v
0
0.2
0.4
0.6
0.8
1
ResilientNon-resilient
Figure 4: Normalized shear stress at failure for increasing joint length.Quadratic polynomial fit to numerical stochastic analysis is in-dicated by solid lines with corresponding 95% confidence dottedadjacent (R2
flex = 0.033, R2n.flex = 0.443). Analytical results ac-
cording to Volkersen theory in dashed lines where a good resem-blance is found for the resilient bond line while very poor for thenon-resilient. The vertical dotted line represents the suggestedlap length limit according to Equation 8.
3.2. Test results
Experimental testing was conducted to relate to the numerical findings with adirect comparison between resilient and non-resilient bond line. A previouslypublished production method for SBR/NR based resilient bond line [4] is alsostudied. Different means of achieving resilient bond lines are compared.
3.2.1. Adhesion between rubber and adhesive
The generally low surface energy of rubber is problematic in terms of adhe-sion as the adhesive used must have an even lower surface energy in orderto achieve a strong bond [14]. However, this is seldom the case and pooradhesion, or no adhesion at all, follows.
It is a relative difference in surface energy that has to be obtained, whichcan be done by either modifying the rubber or the adhesive. In this study,
13

Position in joint [mm]0 100 200 300 400 500 600 700
= /
f v
0
0.2
0.4
0.6
0.8
1
ResilientNon-resilient
Figure 5: Normalized shear stress distribution at failure load of 700 mmdouble lap joints according to numerical analysis. Origo is placedat the low end of the lap joint in comparison to Figure 1. Stressdistribution according to Volkersen theory as dashed line.
the surface energy of the rubber was increased by sanding and etching inconcentrated sulphuric acid. Clean surfaces were obtained by rinsing thespecimens in water and ethanol. In order to investigate the influence of thetreatment, a small study was conducted on simple rubber-adhesive-rubberpeel tests according to Figure 6 using 3.5 mm SBR/NR rubber and 2C PURadhesive with a thickness less than 0.5 mm. Using two nominally equal testspecimens, the effect of each process step was investigated according to Table3 which also presents the corresponding load at failure. The importance ofan adequate rubber treatment prior to bonding cannot be underestimatedas this simple test suggests a strength increase of up to 60 times using acombination of 30 seconds of acid etching after rigorous sanding. In orderto achieve a strong bond of the SBR/NR rubber, the initially shiny surfacemust be sanded until a matt surface is obtained.
3.2.2. Influence of lap length
The strengths of the non-resilient PUR- and the resilient SBR-series werecompared for increasing lap lengths. In comparison to the numerical results
14

Table 3: The effect of rubber processing steps on tensile strength.
CategoryTreatment Avg force
Water Ethanol Sand papera Etchedb at failure [N]
1 - - - - 02 x - - - 53 x x - - 5
4 x x + - 155 x x ++ - 50
6 x x + + 1407 x x + ++ 1308 x x ++ + 3109 x x ++ ++ 90
10 x x - ++ 30
a) + corresponds to 5 seconds by belt sander while ++ is 30
seconds (results in a matt surface)
b) + corresponds to 30 seconds submerged in concentrated
sulphuric acid while ++ is 3 minutes
15

Figure 6: Rubber-adhesive adhesion tensile test. Bonded area was 50x50mm2.
shown in Figure 4, remarkably high strength of non-resilient specimens wasfound in the experimental results presented in Table 4 and Figure 8. Thenumerical analysis indicated a non-resilient failure load of 700 kN for the 700mm specimen, while the experimental study averaged 1290 kN (c.f. Section3.2.3).
All non-resilient specimens showed a brittle failure in wood close to thebond line, see b) in Figure 7. Two types of failure modes were visible in theresilient specimens. Some resilient specimens failed in similar wood bond linefailure as the non-resilient, while other failed prematurely in the adhesive-rubber interface as indicated in Table 4. Visual inspection subsequent tofailure indicates poor rubber treatment, in which some rubber areas were oftype category 6 instead of the intended category 8 (Table 3) which is believedto initiate the premature failure. A reasonable agreement is found betweenexperimental and numerical results of the resilient bond line if the specimenswith premature failure are disregarded.
For a vast majority of the test specimens, a tensile crack perpendicularto grain was formed in the low end of the middle member prior to failure dueto horizontal tensile stresses, see a) in Figure 7. The crack did not influencethe global behaviour of the lap although an irregularity in the displacementplot was observed, i.e. at 700 kN for SBR-700-4 in Figure 9.
A comparison of the deformation of the resilient and non-resilient bondlines are found in Figure 9. By introducing the 3.5 mm thick SBR/NRsheet, the measured stiffness over the bond line was reduced by a factor ofapproximately 30.
Additional numerical simulations were also conducted with boundary con-
16

Table 4: Strength [kN] and average shear stress at failure [MPa] from expe-rimental tests for non-resilient adhesive and the resilient SBR/NRwith increasing lap length [mm]. Individual test results in parent-hesis.
LNon-resilient Resilient
Strength Avg stress Strength Avg stress
200410 4.5 420 4.6
(359, 373, 461, 441) (4.0, 4.2, 5.1, 4.9) (490, 420*, 361*, 400) (5.5, 4.7*, 4.0*, 4.4)
400870 4.8 760 4.2
(941, 940, 716) (5.2, 5.2, 4.0) (687, 769, 759, 814) (3.8, 4.3, 4.2, 4.5)
7001290 4.1 1070 3.4
(1168, 1285, (3.7, 4.1, (911*, 692*, 912*, (2.9*, 2.2*, 2.9*,
1242, 1480) 3.9, 4.7) 1172, 1169, 1537) 3.7, 3.7, 4.9)
*) Premature failure in glue-rubber interface
ditions according to the test setup. Roller supports were used, the shacklerepresented by a linear spring (k=35 kN/mm) and bond line thicknesses of0.1 mm and 3.6 mm were used for non-resilient and resilient bond line re-spectively. It was found that the resilient SBR specimens were somewhatmore sensitive to the shackle stiffness than the non-resilient PUR specimens,while shorter specimens were significantly more sensitive than longer. Incomparison to the results shown in Figure 4, the use of the shackle stiffnesscauses a strength decrease of both types of bond lines as seen in see Figure8. This is especially relevant for shorter lap lengths as these are more proneto bending. A general strength increase using a resilient bond line is foundalso in this analysis.
3.2.3. Influence of boundary conditions
In addition to the test setup described in Section 2.1.3, the influence ofsupport conditions was experimentally investigated to possibly clarify thehigh strength observed for the non-resilient bond lines. The main study wasconducted using steel plates covering the entire end area of the specimensas seen in Figure 1, which is restricting the formation and/or propagation ofshear plugs on the side of the elements. One additional test specimen eachof type SBR-700 and PUR-700 was made in order to experimentally evaluatethis restriction by reducing the end grain area covered by the steel plate. The
17

b) a)
Figure 7: Typical failure initiation points seen during the tests: a) Horizon-tal thrust caused a tensile crack perpendicular to grain but notpropagating to failure, and b) bond line failure in the wood closeto the bond line. Failure typically occurred on one side followedby shear block failure.
steel plate covering the end grain of the top member was reduced in width,allowing 40 mm free end grain on each side. The test results shown in Table 5and Figure 8 indicate a greater sensitivity in the non-resilient specimen thanin the resilient. Using this setup, a better agreement for the non-resilientspecimen with 13% deviation from the numerical findings was found.
3.3. Type of resilient bond line
To investigate the possibility of simplified manufacturing, the SBR/NR wasexperimentally compared to CR, Move IT and CO, in which the latter wassupposedly more easily manufactured than the former.
Initial testing concluded that maximum bonding to the CR was achievedusing the same acid-etching technique as the SBR/NR rubber, and thus itsmerits are diminished. Despite the same treatment, the CR was not as strongas the SBR/NR as shown in Table 6. Also for CR it was found that a mattrubber surface was bonded more strongly than a shiny, yet the very thin
18

Joint length [mm]200 300 400 500 600 700 800 900
=av
g / f v
0
0.2
0.4
0.6
0.8
1
1.2
ResilientNon-resilient
Figure 8: Numerical results of experimental setup compared to experimen-tal data. Wood failure close to bondline is marked with x, dotmarks premature failures and results of the test with smaller steelplates are marked with o.
sheet made production difficult. The resilient adhesives Move IT and RESAHLP-H enabled very simple production, although Move IT having difficultiesin obtaining a uniform bond line. Both the CO and IT specimens also showedpremature failure, now in the adhesive/wood interface.
The stiffness of the resilient bond lines is to a large extent dependent ofthe thickness of the layer, which is varied with the type of rubber. Figure 9compares typical load-deformation curves of the different bond lines tested.
4. Discussion
It is very difficult to achieve a uniform shear stress distribution in a lap jointdue to different axial strains in the adherends at a given point of the bondedarea. The consequences of this difference can however be minimized by in-troducing a resilient bond line, which allows the adherends to deform moreindividually. This conclusion is drawn from the presented numerical analysisas well as previous studies [4, 6]. The experimental results are however not as
19

Table 5: The average shear stress [MPa] at failure using alternative supportconditions of the ends of each test specimen.
BC Non-resilient Resilient
Restricted end 4.1 4.1*Partially free end 2.5 3.6
*) Premature failure specimens excluded
Table 6: Mean strength [kN], mean average shear stress at failure [MPa]and mean stiffness [kN/mm] of 700 mm double lap joints of thefour resilient bond lines as well as common adhesive. Individualtest results in parenthesis and t is the bond line thickness.
Type t Strength Stress Stiffness
SBR/NR 3.5 1290a,b 4.1 190
CR 0.5360c 1.2
720(439, 286) (1.39, 0.91)
IT 2760c 2.4
270(891, 619) (2.83, 1.97)
CO 1.5730c 2.3
260(682, 775) (2.16, 2.46)
PUR - 1290b 4.1 5470
a) Premature failure specimens excluded.
b) Failure in wood close to bond line.
c) Bond line failure in the adhesive/wood interface.
20

Displacement [mm]0 1 2 3 4 5 6 7 8
Loa
d [k
N]
0
500
1000
1500
PUR-700-4SBR-700-6IT-700-1CO-700-2CR-700-1
Figure 9: Load-deformation comparison between the different types of bondlines investigated.
simple to interpret due to different failure modes and unexpected influenceof boundary conditions, but the data do not falsify the numerical results.
In comparison to previous experience and numerical analysis, the highstrength of the non-resilient bond lines is interesting. All GLT specimenswere manufactured and delivered at the same time. The test specimenswere further produced similarly and also stored together, suggesting that thematerial parameters are similar for all. The parameters used in the numericalanalysis are however based upon literature values rather than measured onthe tests themselves. Hence it is possible that the material parameters donot necessarily consider the specific boundary conditions of this test. Theload carrying capacity of non-resilient bond lines is also influenced by thefracture energy. The presented shear fracture energy of 0.85 kNm/m2 wasfound at a shear failure of 3.56 MPa [9], which possibly should be higher if ahigher shear strength is used. The normal distribution of the shear strengthsuggests a 95th percentile strength of up to 7.5 MPa, which would increasethe numerical load carrying capacities. However, numerical analysis indicatesthat this effect alone cannot explain the high strength of the non-resilientbond lines.
A large variance in the experimental results of the resilient SBR/NR wasfound due to premature bond line failure in the rubber/adhesive interface.
21

The results highlight a sensitivity to rubber treatment, in which local diffe-rences are likely to initiate failure. However, this problem can be avoidedby simple but detailed visual inspection and does thus not necessarily implya large variance in the load carrying capacity in an established productionmethod.
A similar double lap joint test setup using resilient bond lines was includedin the large resilient bond line test series presented in [4]. Using close toidentical production method, an average shear stress at failure of 4.6 MPawas recorded for a 600x223 mm2 bond line failure, which is higher thanmeasured in this study although higher bending stresses were induced by thethinner lower members. The higher strength is probably due to the influenceof different boundary conditions.
Comparison between numerical and analytical findings suggests that theVolkersen theory is suitable for hand calculations of lap joints if (1) a resilientbond line is applied and (2) boundary conditions are such that they limitthe influence of peel stress interaction. The numerical findings of the givengeometry also suggest that a strength increase by introducing a resilientbond line can be achieved at shorter lap lengths than the analytical estimatesuggests.
The additional testing of smaller steel plates at end grain suggests thatthe non-resilient bond line is more sensitive to boundary conditions than theresilient. The same shear stress in the bond line occur regardless of end plateboundary conditions at a given load, resulting in insignificant influence onthe numerical model in which a stress based failure criterion is implementedin the bond line. The fundamental difference is found in the wood body,where the wood volume experiencing a shear stress level close to the shearstrength is considerably larger than in the case of smaller end plate. This,in combination with the weakest link theory, is a plausible explanation forthe decrease in average shear stress at failure from 4.1 to 2.5 MPa for non-resilient joints. The same reasoning is also valid for the insensitivity of theresilient bond line as no significant stress concentrations occur. When theshear stress approaches the strength of the material, nearly simultaneouslyfor the whole lap joint, the weakest link theory predicts failure at some pointregardless of end grain support.
Compared to the rubber based resilient bond lines, the manufacturingprocess of the IT and CO series was considerably more effective. If properadhesion can be obtained to wood, a resilient adhesive is recommended inwood-wood lap joints. Similar to rubber based resilient bond lines, a low
22

shear stiffness and high shear strength are important parameters for thestrength of the joint. Furthermore, manufacturing is more effective if the re-silient adhesive also has a high viscosity and only need a low curing pressure.
As modern structural design often promotes redundancy, not only strengthbut also the stiffness of the connection is relevant to consider in a design phasein order to ensure the intended load path. The stiffness and slip are also de-cisive when several types of connectors are used in a single connection, inwhich simultaneous action requires similar behaviour. By using a resilientbond line, the stiffness can be designed specifically to match other connectorsby varying the rubber stiffness and/or thickness, thus enabling the additionof strengths for the different connectors.
5. Conclusion
The presented research concludes the following findings:
• Numerical analysis shows that an increased load carrying capacity oflap joints can be achieved by introducing a resilient bond line due to amore uniform shear stress distribution.
• The experimental study indicates the difficulty of achieving a strongbond between rubber and adhesive, and thus a clear and reliable pro-duction method must be established.
• The experimental study shows that a long non-resilient bond line canbe stronger than resilient bond line in certain conditions.
• The stiffness of lap joints with resilient bond lines can be designed withgreat variety.
• Resilient bond lines can be achieved by means of adhesives with lowstiffness or rubber.
• Volkersen theory is applicable to lap joints with resilient bond lines.
Despite the experimental results, the authors conclude that resilient bondlines typically increase the load carrying capacity of long lap joints.
The use of resilient bond lines are not limited to wood-wood configura-tions nor to timber engineering at large. The study is conducted within aproject regarding the Shear plate dowel joint (SPDJ), which uses the resilientbond line technique in a wood-steel configuration with intended use in heavytimber structures.
23
6. Acknowledgements
The financial support provided by Formas through grant 2012-879 is grate-fully acknowledged. The authors would like to thank Thomas Johansson atMoelven Toreboda AB for delivering the GLT as well as Ante Salomonsson atSika and Steffen Harling at Collano for adhesives and expertise. We wouldalso like to thank Tommy Pettersson at Trelleborg AB for delivering theCR and to Maria Sodergren for her expertise in handling strong chemicals.Special thanks also to Per-Olof Rosenkvist and Per-Erik Austrell, LTH.
7. References
[1] T. Sumiyoshi, G. Matsui, Wood joints in classical japanese architecture,Kajima Institute Publishing, 1991.
[2] Z. Klaus, Wood and wood joints, building traditions of Europe andJapan, Birkhuser, 2000.
[3] O. Volkersen, Die nietkraftverteilung in zugbeanspruchten nietver-bindungen mit konstanten laschenquerschnitten, Luftfahrtforschung15 (1/2) (1938) 41–47.
[4] P. Gustafsson, Tests of full size rubber foil adhesive joints, Tech. Rep.TVSM-7149, Div. of Struct. Mech., Lund University (2007).
[5] P. Bjornsson, H. Danielsson, Strength and creep analysis of glued rubberfoil timber joints, Master’s thesis, Lund University (2005).
[6] H. Yang, R. Crocetti, G. Larsson, P.-J. Gustafsson, Experimental studyon innovative connections for large span timber truss structures, in: Pro-ceedings of the IASS WORKING GROUPS 12+ 18 International Collo-quium 2015, International Association for Shell and Spatial Structures(IASS), 2015.
[7] G. Larsson, P. J. Gustafsson, E. Serrano, R. Crocetti, Bond line modelsof glued wood-to-steel plate joints, Engineering Structures 121 (2016)160–169.
[8] K. B. Dahl, Mechanical properties of clear wood from norway spruce,Ph.D. thesis, NTNU Trondheim (2009).
24

[9] H. Wernersson, Fracture characterization of wood adhesive joints, Ph.D.thesis, Lund University (1994).
[10] C. B. Norris, Strength of orthotropic materials subjected to combinedstresses, FPL-1816. Madison, Wis. : U.S. Dept. of Agriculture, ForestService, Forest Products Laboratory.
[11] G. E. Box, W. G. Hunter, J. S. Hunter, et al., Statistics for experimen-ters.
[12] P. Gustafsson, Tests of wooden cleats oriented along fibre, Tech. Rep.TVSM-7155, Div. of Struct. Mech., Lund University (2008).
[13] P. Gustafsson, Analysis of generalized volkersen-joints in terms of non-linear fracture mechanics (1987).
[14] D. Dillard, A. Pocius, The mechanics of adhesion, 2002.
25


Paper B


Proceedings of the IASS WORKING GROUPS 12 + 18 International Colloquium 2015 “Bio-based and Bio-inspired Environmentally Compatible Structures”
10 to 13 April 2015, Tokyo Denki University, Tokyo, Japan Andreas FALK, Petr VEGH and John CHILTON (eds.)
Copyright © 2015 by the authors. Published by the International Association for Shell and Spatial Structures (IASS) with permission.
Experimental study on innovative connections for large span timber truss structures
Huifeng YANG *, Roberto CROCETTI a, Gustaf LARSSON a&b, Per Johan GUSTAFSSON b
* College of Civil Engineering, Nanjing Tech University P.O. Box 80, NO. 30, South Puzhu Rd. Nanjing, China
a Division of Structural Engineering, Lund University, [email protected] a&b Division of Structural Engineering, and Division of Structural Mechanics, Lund University,
[email protected] b Division of Structural Mechanics, Lund University, [email protected]
Abstract This paper summarizes an experimental investigation on several innovative reinforcing techniques for the “Single Large Diameter Dowel Connection”, SLDDC in timber truss structures. Besides lateral reinforcing or prestressing also steel plates glued on two sides of the glulam specimens were used as reinforcing measure. To study the efficiency of these techniques, 15 full-scale quasi-static tensile tests on glulam members with a SLDDC on either ends of each member were performed. It was found that the reinforcing techniques produced significant increase in the bearing capacity of the SLDDCs. All of the reinforcing techniques showed a quite efficiency, in which the splitting of wood can be prevented. Moreover, the residual strength of most of the specimens remains at a high level.
Keywords: timber structure, truss, singe large-diameter dowel connection, reinforcement, improvement, experimental study
1. Introduction Timber trusses are competitive for relatively large spans, typically larger than 30 m. For such span lengths, however, the magnitude of loads which have to be transferred between truss members becomes significant, often resulting in complex (and expensive) connections.
To find simpler large dowel connections for timber structures, several studies have been carried out. Haller et al. [1] produced and tested some textile reinforcements on the large dowel connections with different textile structures like biaxial weft knitted and stitch bonded. It showed significant increase on the strength, stiffness and also ductility of the connections. The plug shear and splitting failure of the wood are avoided. However, the ultimate fracture is the wood tensile failure because of the stress concentrations and the reduced net cross section. Also, multi inserted reinforcement layer will result in the relative complex and expensive production process.
Kobel [2] conducted an experimental study on the reinforcement of large dowel connections for timber truss structures, in which the dowel has a diameter of 90mm. The study presented several reinforcement methods including reinforcing with self-tapping screws of various configurations and lateral prestressing with threaded rod. It was found that reinforcing screws can effectively impede splitting of the timber and as a result of the remarkable increase of the bearing capacity. By applying lateral prestresses, no splitting occurred and the bearing capacity is even higher.
Pavkovic´ et al. [3] investigate the bearing capacity of reinforced large diameter dowel connections loaded perpendicular to grain of timber with experimental and FEM analytical work. For the glass fiber textile layers reinforcement glued between the timber lamellas, the result demonstrated remarkable enhancement of the strength and ductility of the connections.

Proceedings of the IASS WORKING GROUPS 12 + 18 International Colloquium 2015 “Bio-based and Bio-inspired Environmentally Compatible Structures”
Copyright © 2015 by the authors.
Published by the International Association for Shell and Spatial Structures (IASS) with permission.
In this research, several efficient and relatively inexpensive reinforcement methods of SLDDCs were presented. By means of experimental investigations, the aim of this paper is to study the efficiency of different types of innovative reinforcing techniques for the SLDDC.
2. Material and methods
2.1. Wood materials
Spruce glulam with the strength class of GL30c was used for all of the 15 glulam specimens in the test. The characteristic tensile strength parallel to the grain of ft,0,k = 20 MPa. The average density and the moisture content was 443 kg/m3 and 11.1%, respectively. And they were measured after testing on samples taken from the part of the specimen where failure had occurred (i.e. from the shear plug). These values varied in the range of 324 ~ 551 kg/m3 for density and 8.9 ~ 13.4 % for MC.
2.2. Steel
The steel plates and the large diameter dowel were all made of steel quality Q345B, with a nominal yield stress of 345 MPa. The threaded rods, with a diameter of 24 mm, had a nominal yield stress of higher than 800 MPa. The large diameter dowels had a hollow cross section with the outer diameter of 89 mm and the inner one of 38 mm. The yield strength was 320 MPa for the hexagon head wood screws with 6 mm in diameter and 70 mm in length.
2.3. Rubber
The rubber was mixed of natural rubber and SBR (styrene-butadien), of which the density is 1220 kg/m3, the
hardness is 62°, the shear modulus G≈1.2 MPa, the tensile strength is 22.4 MPa, the shear strength is 9.4MPa and the elongation at break is 595 %. The thickness of the rubber layer vulcanized to steel plates was 1.0-1.2 mm. The outer surface of the vulcanized rubber layer was treated by the sulfuric acid in order to get a satisfy bonding between the timber and rubber layer.
2.4. Glue
The glues used in vulcanized steel – glulam interface were Purbond CR 421 (glue+hardener). While the glues used in smooth steel – glulam interface were epoxy (glue+hardener).
2.5. Layout of the reinforcement
The test series were divided into five groups of three specimens each.
The specimens of the group “Non-Pre” and “Pre” had dowel holes with 92 mm diameter in both end of the glulam specimens, implying they were 3 mm larger than those of dowels. The area between the dowel and the loaded end was reinforced using a threaded rod (See Fig. 1(a) and Fig. 1(b)). Meanwhile for the load transmission from the threaded rods to the glulam, a 30 mm thick steel plate was also used. The prestress in the threaded rods of group “Pre” was about 3.8 MPa while applying at about three month before the test. As to group “Non-Pre”, it had no prestress inside the threaded rods. The threaded rods acted as the reinforcement of the timber perpendicular to the grain.
The specimens of the group “S2” and “S2+R” presented reinforcement by bonding steel plates to the glulam surfaces around the large dowel holes. The hole diameter of glulam and steel plates was 102 mm and 91.5 mm respectively. It means a 6.5 mm gap between the dowels and the glulam specimens aimed to transfer the applied loads from dowel to timber by bond shear stress of the vulcanized steel – glulam interface. The major difference between these two groups was that the bonding surface of group “S2” was smooth steel, while group “S2+R” was vulcanized rubber layer onto the steel plates (See Fig. 1(c) and Fig. 1(d)).
The specimens in the group named “S1+R” were also reinforced by bonding steel plates but with a doubled glulam elements (See Fig. 1(e)). Furthermore, in all of the bonding steel plates reinforced specimens, each steel plate was anchored by 34 wood screws in order to bear the normal stress at the bonding interface as well as give the pressure while gluing.
The lamellae thickness was 45 mm for glulam specimens. The specimens in the group named “S1+R” (See Fig. 1(e)) had a doubled glulam elements with each had a cross section of 61 mm × 405 mm. And the other groups of specimens had a single cross section of 140 mm × 405 mm. All the glulam specimens were 2, 00 m in length.

Proceedings of the IASS WORKING GROUPS 12 + 18 International Colloquium 2015 “Bio-based and Bio-inspired Environmentally Compatible Structures”
Copyright © 2015 by the authors.
Published by the International Association for Shell and Spatial Structures (IASS) with permission.
Threaded rodNon-prestressed
Grain direction
Bearing plate2-30X140X140
Grain direction
Bearing plate2-30X140X300
Threaded rodPrestressed
(a) Group “Non-Pre” (b) Group “Pre”
Steel plate
Grain direction
Steel stiffeners
Steel plate
Grain direction
Steel stiffeners
Vulcanized rubberSBR, t¡ Ö1.1mm
Steel platet=10mmGrain direction
Vulcanized rubberSBR, t¡ Ö1.1mm
(c) Group “S2” (d) Group “S2+R” (e) Group “S1+R”
Figure 1: Configuration of test specimens. Units: [mm]
2.6. Test setup
All tests were conducted at the Jiangsu Key Laboratory of Civil Engineering, Disaster Prevention and Mitigation, Nanjing Tech University. The general setup for all of the specimens is illustrated in Fig. 2. The tests were quasi-static tensile tests under displacement control and the actuator speed was 0.5 mm/min. Each specimen was equipped with an identical design of reinforced SLDDC on both ends. The loads were applied by the loading rods or loading plates between the dowels and the hydraulic device.
The dowel slip as well as the lateral deformation was continuously measured in both end of the specimens for group “Non-Pre” and “Pre”. As to the other three groups, only the steel plate slip was measured.
Dowel
F/2
Loading rodd=32mm
FF/2
Dowel
F/2
Loading rodd=32mm
F/2 F
FF/2
F/2
Loading plate
Dowel
F F
F F
(a) Group “Non-Pre” and “Pre” (b) Group “S2” and “S2+R” (c) Group “S1+R”
Figure 2: General test setup.
3. Results and discussions
3.1. Bearing capacity
Table 1 displays average values of the test results for the specimens. And Fig. 3 gives a comparison on the bearing capacities and the residual strength of different groups. For a comparison, some of the test results of
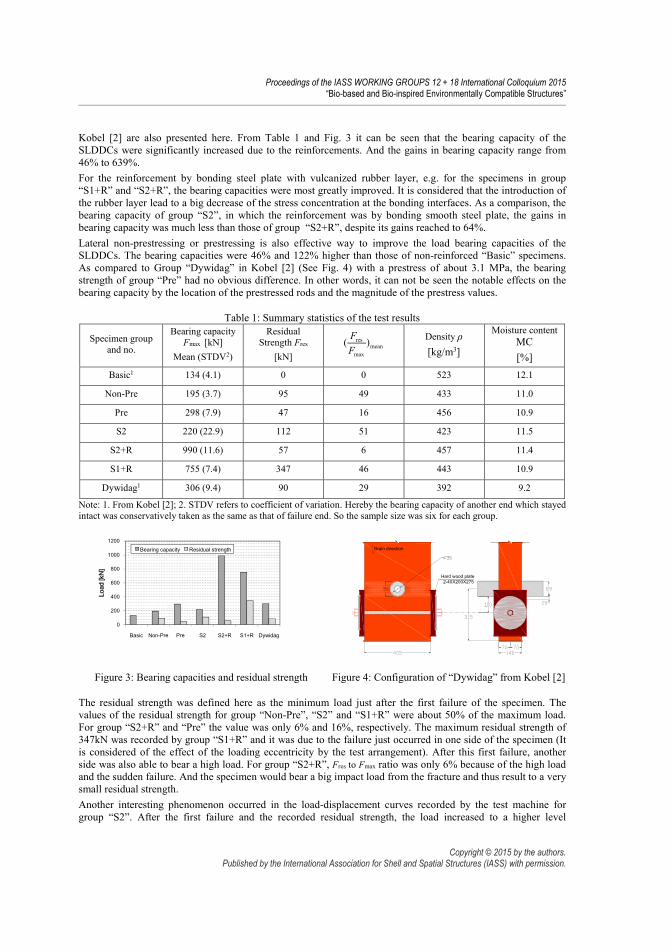
Proceedings of the IASS WORKING GROUPS 12 + 18 International Colloquium 2015 “Bio-based and Bio-inspired Environmentally Compatible Structures”
Copyright © 2015 by the authors.
Published by the International Association for Shell and Spatial Structures (IASS) with permission.
Kobel [2] are also presented here. From Table 1 and Fig. 3 it can be seen that the bearing capacity of the SLDDCs were significantly increased due to the reinforcements. And the gains in bearing capacity range from 46% to 639%.
For the reinforcement by bonding steel plate with vulcanized rubber layer, e.g. for the specimens in group “S1+R” and “S2+R”, the bearing capacities were most greatly improved. It is considered that the introduction of the rubber layer lead to a big decrease of the stress concentration at the bonding interfaces. As a comparison, the bearing capacity of group “S2”, in which the reinforcement was by bonding smooth steel plate, the gains in bearing capacity was much less than those of group “S2+R”, despite its gains reached to 64%.
Lateral non-prestressing or prestressing is also effective way to improve the load bearing capacities of the SLDDCs. The bearing capacities were 46% and 122% higher than those of non-reinforced “Basic” specimens. As compared to Group “Dywidag” in Kobel [2] (See Fig. 4) with a prestress of about 3.1 MPa, the bearing strength of group “Pre” had no obvious difference. In other words, it can not be seen the notable effects on the bearing capacity by the location of the prestressed rods and the magnitude of the prestress values.
Table 1: Summary statistics of the test results
Specimen group and no.
Bearing capacity Fmax [kN]
Mean (STDV2)
Residual Strength Fres
[kN]
resmean
max
( )F
F Density ρ
[kg/m3]
Moisture content MC
[%]
Basic1 134 (4.1) 0 0 523 12.1
Non-Pre 195 (3.7) 95 49 433 11.0
Pre 298 (7.9) 47 16 456 10.9
S2 220 (22.9) 112 51 423 11.5
S2+R 990 (11.6) 57 6 457 11.4
S1+R 755 (7.4) 347 46 443 10.9
Dywidag1 306 (9.4) 90 29 392 9.2
Note: 1. From Kobel [2]; 2. STDV refers to coefficient of variation. Hereby the bearing capacity of another end which stayed intact was conservatively taken as the same as that of failure end. So the sample size was six for each group.
0
200
400
600
800
1000
1200
Basic Non-Pre Pre S2 S2+R S1+R Dywidag
Lo
ad
[kN
]
Bearing capacity Residual strength
Grain direction
Hard wood plate2-40X200X275
Figure 3: Bearing capacities and residual strength Figure 4: Configuration of “Dywidag” from Kobel [2]
The residual strength was defined here as the minimum load just after the first failure of the specimen. The values of the residual strength for group “Non-Pre”, “S2” and “S1+R” were about 50% of the maximum load. For group “S2+R” and “Pre” the value was only 6% and 16%, respectively. The maximum residual strength of 347kN was recorded by group “S1+R” and it was due to the failure just occurred in one side of the specimen (It is considered of the effect of the loading eccentricity by the test arrangement). After this first failure, another side was also able to bear a high load. For group “S2+R”, Fres to Fmax ratio was only 6% because of the high load and the sudden failure. And the specimen would bear a big impact load from the fracture and thus result to a very small residual strength.
Another interesting phenomenon occurred in the load-displacement curves recorded by the test machine for group “S2”. After the first failure and the recorded residual strength, the load increased to a higher level

Proceedings of the IASS WORKING GROUPS 12 + 18 International Colloquium 2015 “Bio-based and Bio-inspired Environmentally Compatible Structures”
Copyright © 2015 by the authors.
Published by the International Association for Shell and Spatial Structures (IASS) with permission.
compared to the Fmax. And then the load dropped and again increased to a high level, so back and forth several times (See Fig. 5). This observation indicates that this kind of specimen failed gradually in the last load stage. This may due to the fracture of the bonding surface near the load end caused by the stress concentration, and then some load was transferred to the wood screws nearby. While the second bonding fracture occurred with the increasing load, growing number of wood screws participated in the work. As a result, the ultimate load was usually higher than that at the first failure.
0
50
100
150
200
250
300
350
400
0 5 10 15 20 25 30
Lo
ad
[k
N]
Displacement [mm]
S2-1 S2-2 S2-3
Figure 5: Load-displacement curves of group “S2”
3.2. Failure mode
For the SLDDCs with lateral reinforcement, the ultimate failure mode was a shear plug fracture (See Fig. 6). For a comparison, giving a prestress in the lateral reinforcement would generally lead to a larger shear plug and so as to reach a higher bearing capacity. It showed that even when there was no prestress in the rods, not any splitting appeared in the glulam specimen.
(a) Group “Non-Pre” (b) Group “Pre”
Figure 6: Failure modes of SLDDCs with lateral reinforcement
For the bonding smooth steel plate reinforced specimens, the failure caused by the first bonding shear fracture between the steel plate and glulam. And then the rest of the bonding layer combined with some of the wood screws worked together to bear the applied load, till to the failure of the whole bonding surfaces (See Fig. 7(a)). While for the group “S2+R”, with a rubber layer, the ultimate failure showed a fully wood shear failure around the bonding area (See Fig. 7(b)). The average value of the shear stress at ultimate load reached to 3.1 MPa. As to group “S1+R”, with a double glulam specimens, the failure mode was combined the wood shear failure and tensile failure (caused by the load eccentricity for the glulam), see Fig. 7(c).
Another observation was that there was also the shear plug failure for the SLDDCs reinforced with bonding steel plates. However, it did not mean that it is a failure mode of this kind of specimens. For the reason of that this shear plug was just caused by the large impact load while the wood shear failure, i.e. the shear plug occurred just after the failure.

Proceedings of the IASS WORKING GROUPS 12 + 18 International Colloquium 2015 “Bio-based and Bio-inspired Environmentally Compatible Structures”
Copyright © 2015 by the authors.
Published by the International Association for Shell and Spatial Structures (IASS) with permission.
(a) Group “S2” (b) Group “S2+R” (c) Group “S1+R”
Figure 7: Failure modes of SLDDCs reinforced with bonding steel plates
3.3. Stiffness
The Load-slip stiffness is steel plate slip for the group “S2”, “S2+R” and “S1+R”. While it is dowel slip for the other groups, groups in Kobel [2] is also included. And it was determined as the rate of dowel or steel plate slip in load direction between 0.4 Fmax and 0.7 Fmax.
Due to the test arrangement error, the dowel slip values were unfortunately not valid. But it can be seen from the test result of Kobel [2] that the lateral reinforcement has no contribution to the stiffness. For group “S2”, there was quite little slip before the first failure, implying quite high slip stiffness. And due to the load eccentricity of the glulam in group “S1+R”, the slip value was also invalid. So only the slip value of group “S2+R” was recorded. According to the sip value of this group, the stiffness (484 kN/mm) was obtained and gave a comparison with group “Basic” (308 kN/mm) and “Dywidag” (311 kN/mm) from Kobel [2]. So the gains of the stiffness was about 57% for group “S2+R” to group “Basic” and “Dywidag”.
The load-slip behaviour of group “S2+R” was given in Fig. 8. There was a quite small variation in the stiffness and the bearing capacity. The relative smaller bearing capacity of S2+R-1 was due to the eccentricity caused by the big load to the test equipment. And then an update was provided to the other two specimens in this group. It could also be observed from Fig. 8 that there was an increasing stiffness during the late loading stage due to the strain hardening of the rubber layer.
0
200
400
600
800
1000
1200
0.00 0.50 1.00 1.50 2.00 2.50 3.00
Lo
ad
[kN
]
Slip [mm]
S2+R-1 S2+R-2 S2+R-3
Figure 8: Load-slip behaviour in group “S2+R”
4. Conclusions and future work From the results of the full-scale test series for SLDDCs the following conclusions can be drawn:
- Lateral reinforcing or prestressing are both able to prevent the splitting, but lateral prestressing will lead to a larger bearing capacity.
- The location of the prestressed rods around the dowel hole in glulam specimen appears to has little effect on the bearing capacity.
Tensile failure

Proceedings of the IASS WORKING GROUPS 12 + 18 International Colloquium 2015 “Bio-based and Bio-inspired Environmentally Compatible Structures”
Copyright © 2015 by the authors.
Published by the International Association for Shell and Spatial Structures (IASS) with permission.
- The prestress may be reduced to some level since it is so close in the bearing strength between the groups “Dywidag” (prestress was about 3.1 MPa) and “Pre” (prestress was about 3.8 MPa).
- The reinforcement with bonding steel plates to the glulam is a quiet efficient way to the SLDDCs, especially while a rubber layer is vulcanized to the steel plates. The gains in bearing capacity reached to 639%. The main reason is the considerably reduced stress concentration and therefore come into a quite uniform shear stress distribution on the bonding surfaces.
- The slip stiffness of the group with a rubber layer on the steel plate can also be increased into a high level compared to the control “Basic” group.
- For a bonding smooth steel plate reinforcing, the gains in bearing capacity was much less than that had a rubber layer. But even so, its gains reached to 64%.
From the test and the observation, further studies should be carried out including:
- The lateral prestressing with a lower level should be taken into consideration.
- In order to further improve the efficiency of the bonding steel plate reinforcement, different kinds of shapes and placement of steel plate need to be studied.
- Since the wood screws can prevent the sudden fracture of the bonding smooth steel plate reinforcement, it is noteworthy that the arrangement of the wood screws should also an important factor on the bearing capacity as well as the slip stiffness.
- For the group with bonding steel plate vulcanized a rubber layer, some measures should be taken so as to endure the sudden impact load on the glulam specimen caused by the fracture at a very high load level.
- Numerical model is a more efficient and economical way to carry out some parametric analysis and also the stress distribution study.
Acknowledgement The cooperation received from Moelven Töreboda AB (http://www.moelven.com) for the supply of glulam and Henkel for the Purbond CR 421 glue. Also we would like to thank master students Wenxiang Zhu and Wei Xu from Nanjing Tech University for the hard and valuable test work.
References [1] Haller P., Birk T., Offermann P. and Cebulla H., Fully fashioned biaxial weft knitted and stitch bonded
textile reinforcements for wood connection. Composites: Part B, 2006; 37; 278-285.
[2] Kobel P., Modelling of strengthened connections for large span truss structures. Master’s Thesis, Department of Structural Engineering, Lund Institute of Technology, Sweden; 2011.
[3] Pavkovic´ K., Rajčić V. and Haiman M., Large diameter fastener in locally reinforced and non-reinforced timber loaded perpendicular to grain. Engineering Structures, 2014; 74; 256–265.


Paper C

Bond line models of glued wood-to-steel plate joints
Gustaf Larsson a,⇑, Per Johan Gustafsson a, Erik Serrano a, Roberto Crocetti b
aDivision of Structural Mechanics, Lund University, P.O. Box 118, SE-221 00 Lund, SwedenbDivision of Structural Engineering, Lund University, P.O. Box 118, SE-221 00 Lund, Sweden
a r t i c l e i n f o
Article history:Received 10 September 2015Revised 22 February 2016Accepted 25 April 2016
Keywords:Timber structureWood-to-steel plate jointsShear plate dowel jointRubber foil connectionNumerical analysisNumerical model
a b s t r a c t
The competitiveness of timber as structural material in large structures is often governed by the cost ofstructural joints. Tests indicate that the new joint concept presented herein using glued wood-to-steelplate joints can possibly reduce the cost by matching joint strength to member strength. The design isinspired by two previously proposed designs using a single large dowel and using a rubber foil interlayerin adhesive joints. Analytical 1D and numerical 3D models of the bond line are proposed in order tofurther develop the concept, both in the case of a traditional adhesive joint and for the innovative rubberfoil adhesive joint.The glued wood-to-steel plate joints studied are lap joints with a load bearing capacity assumed to be
governed by failure within or along the bond line. In the 1D and 3D structural models both linear elasticand non-linear fracture mechanics were applied, with the non-linear fracture mechanics model takinginto account the gradual damage fracture softening in a fracture zone. For the conventional type of bondline it was found that bond line softening needs to be considered for adequate strength analysis while itwas not needed for a bond line with a rubber foil.The computational results are compared to previous full scale test results. The numerical results show
good agreement and the analytical results reasonable agreement. When using a high strength adhesive,the strength of the wood along the bond line is governing joint failure. For this case, the analyses predict a150% load bearing capacity increase by the introduction of a rubber foil as compared to a traditionaldesign. The test results indicated an even higher increase.
� 2016 Elsevier Ltd. All rights reserved.
1. Introduction
1.1. Background
The properties and cost of structural joints often govern thecompetitiveness of timber as main structural material in largestructures. Ideally, a joint should be able to withstand the sameforces as the main members, something which however seldomis the case due to joint detailing (leading to e.g. stress concentra-tions and large stresses perpendicular to the bond line).
Glued wood-to-steel joints can be designed to obtain promisingproperties. The high stiffness of conventional adhesives does
however result in a limited active load transfer area for lap joints.As stress concentrations arise, the material strength of the adher-ents is reached prematurely for a small section and fracture is ini-tiated. In order to significantly reduce the stress concentrationsthus generating a more uniform stress distribution, Gustafsson[1] proposed adding an intermediate rubber layer, see Fig. 1.
1.2. The shear plate dowel connection
The shear plate dowel connection is an applied example of aglued wood-to-steel joint. It is a new design concept developedto increase connection strength while maintaining easy assemblythanks to the use of a single large diameter dowel. Fig. 2 showsthe connection which is based on the concept of the ‘‘Single LargeDiameter Dowel Connection” (SLDDC) design proposed by Crocettiet al. [2]. The use of externally glued steel plates minimizes theimpact on the wood, for which a pure shear action is accomplishedby using a larger hole in the glulam than in the steel plate. The con-nection type has been tested by Yang et al. [3], with and without arubber interlayer.
http://dx.doi.org/10.1016/j.engstruct.2016.04.0530141-0296/� 2016 Elsevier Ltd. All rights reserved.
Abbreviations: SLDDC, Single Large Diameter Dowel Connection; LEFM, linearelastic fracture mechanics; NLFM, non-linear fracture mechanics; EELA, equivalentelastic layer approach.⇑ Corresponding author.
E-mail addresses: [email protected] (G. Larsson), [email protected] (P.J. Gustafsson), [email protected](E. Serrano), [email protected] (R. Crocetti).
Engineering Structures 121 (2016) 160–169
Contents lists available at ScienceDirect
Engineering Structures
journal homepage: www.elsevier .com/locate /engstruct

As the steel plates of the connection reduce the risk of bothsplitting and shear plug failure of the loaded member end, thedowel to element end distance can be reduced from the minimumof 7d suggested by Eurocode 5 [4] thus enabling more compactconnections. The connection was originally intended as a trussjoint but can also be used in other applications, e.g. as hinges atarch springing points or tension ties. By combining several dowelsmoment stiff connections are also made possible. The rubber foilbond line can typically be used whenever a higher static or shockload bearing capacity of a glued joint is needed.
1.3. Previous work
The type of glued wood-to-steel plate joint studied herein is anew design concept and it does seem that it has not been studiedin terms of detailed strength analyses previously. However, Yanget al. [3] and Gustafsson [1] have conducted tests on theconnection type whereas the SLDDC has been tested in full scaletests by Kobel [5] with joints of the same type as those describedby Crocetti et al. [2].
For simple lap joint geometries, such as glued wood-to-steelplate joints, the Volkersen theory [6] may be used to obtain ananalytical solution by assuming pure shear action, c.f. Section 3.Adhesive bonds with more complex geometries are commonlysolved using stress analysis or linear elastic fracture mechanics(LEFM) [7]. Stress or strain discontinuities occur when using con-tinuum mechanics in design situations were adjacent materialshave different stiffnesses, for which edge elements also are meshdependent. Thus it is not trivial how to perform e.g. finite elementanalysis of such model. On the one hand, as the existence of a sin-gular stress field is one of the assumptions in LEFM, such approachshould in principle be appropriate. On the other hand, LEFM is onlyvalid when the fracture process region is small compared to otherdimensions of the structure, which is again seldom the case. Thelimitation of a small fracture process region can however be over-come using non-linear fracture mechanics (NLFM), e.g. softeningplasticity [8], damage mechanics [9] or plasticity-damage models[10].
NLFM is computationally comprehensive, and thus severalso-called extended LEFM models have been developed in order toreduce the number of limitations in LEFM without using step-wise or iterative numerical calculations. In this study, the extended
LEFM model called the equivalent elastic layer approach (EELA) asproposed by Gustafsson [11] is used. It can been used for strengthanalyses of glued joints and for solid materials for which thelocation of the fracture plane is known in advance. The approachhas been used in 2D applications by Gustafsson and Serrano [12],Coureau et al. [13] and extensively by Jensen in e.g. [14,15], butextended to 3D analysis in this paper.
1.4. Failure modes
Glued wood-to-steel plate joints can fail in the wood, in thesteel or in the bond line. Here, the term bond line includes theadhesive, possible rubber foil, a thin wood layer along the glueand the material interfaces. Test results presented in [1,3] indicate,both for joints with and without a rubber foil, typically a dominantmode of shear failure in the bond line; either in the wood/adhesiveinterface or in the wood close to the bond line. If properly manu-factured, wood failure close to bond line should be the governingfailure mode. In the test series of the shear plate dowel connection[3] also shear plug failure occurred in the wood part of the joint.Reportedly the plug failure was a secondary failure occurring afterbond line failure.
1.5. Present study
The present paper relates to one analytical and various numer-ical models for glued wood-to-steel plate joints as limited instrength by fracture in the bond line. Both joints with and withouta rubber foil are studied. Using Volkersen theory [6], an analytical1D shear stress distribution is derived. Furthermore, numericallinear and non-linear 3D analyses are conducted in order toinvestigate the influence of the interaction between shear and peelstresses in the bond line and also to investigate the choice of frac-ture model. The choice of material parameter values correspondsto failure in wood close to the bond line.
The aim of the present paper is to present an efficient andrational computational bond line strength analysis model and toindicate which factors may be of interest to include in a possibledesign model.
1.6. Limitations
The following main limitations apply to the models:
� Quasi-static analysis of short term strength.� Only failure in the wood close to the bond line is considered.� Linear elastic material model of wood (orthotropic) and steel(isotropic).
2. Calculation methods
In the calculation methods studied, steel and wood adherendsare throughout modelled as isotropic and orthotropic linear elasticmaterials, respectively. Failure is assumed to develop in the bondline and not in the adherends. The adherends are in the 1D analysisassumed to act as bars which can be stretched in their longitudinal
SteelRubber foil
AdhesiveWood
SteelAdhesiveWood
Fig. 1. Rubber foil adhesive joint (left) in comparison to conventional adhesive joint (right).
Fig. 2. Glued shear plate dowel connection.
G. Larsson et al. / Engineering Structures 121 (2016) 160–169 161

direction, thus bending is not included. In the 3D analysis theadherends are modelled by 3D solid finite elements.
The bond line, with its different material layers and materialinterfaces as described above, is modelled as a single homogeneouslayer. This layer is in the 1D analysis assumed to act as a shear–slipinterface with a linear relation between the shear stress s and theshear slip d. In this study, two different choices regarding thislinear relation, i.e. the shear stiffness of the interface, are investi-gated: (a) a stiffness representing the actual elastic bond line shearstiffness or (b) a stiffness chosen in order to represent correctly thestrength and fracture energy of the bond line (in the sense that atthe instant when the bond line strength is reached, the elasticenergy stored equals the fracture energy of the bond line) [11].These two alternatives give similar shear stiffness value for a bondline with a rubber foil. However, for a conventionally glued bondline there is commonly a very large difference between the twostiffness values, typically about one or two orders of magnitude.This is because the elastic strain capacity commonly is very smallcompared to the strains during plastic deformation and fracture.If the purpose of the modelling is joint strength analysis, thenthe shear stiffness should be chosen such that bond line strengthand fracture energy are correctly represented, for details seeSections 3 and 4.
In the 3D analyses, the homogeneous layer that models thebond line is assigned a non-zero thickness equal to its physicalthickness. The state of stress in the layer is defined by three stresscomponents. Taking the 1-direction as the bond surface normal,the normal stress r11 and the shear stresses s12 and s13 definethese bond layer stress components. The corresponding straincomponents are denoted e11; c12 and c13. These strains are formallyforced to be constant across the thickness of the layer andaccordingly, the corresponding relative displacements across thebond line thickness are d11 ¼ te11; d12 ¼ tc12 and d13 ¼ tc13, wheret is the bond layer thickness. Influence of in-plane stresses r22,r33 and s23 is not considered and these stresses are in the calcula-tions assumed equal to zero.
In the 3D finite element analyses, the bond layer is modelled bythe use of cohesive elements. The mechanical response of theseelements is defined by traction-separation laws, i.e. relationsbetween stresses ðr11; s12; s13Þ and the relative displacementsðd11; d12; d13Þ. The traction separation laws can be linear or non-linear and coupled or uncoupled. Non-linear relations for the bondlayer are defined in terms of a damage model that enable analysistaking into account gradual fracture softening as described in Sec-tion 4.1. The properties are in the case of a linear relation obtainedfrom the strength and the fracture energy parameters of the bondline under consideration. A special feature for bond lines with arubber layer is that the effective normal stiffness is affected byedge distance. For an inner point of the bond layer, the in-planenormal strain is close to zero entailing high normal stiffness dueto Poisson’s ratio of rubber being close to 0.5, c.f. Section 4.2.
3. 1D analytical method
An analytical expression for the shear stress distribution ofthe centrically loaded shear plate dowel connection based on theVolkersen theory [6] is presented. The failure load is then derivedby identifying the maximum stress and introducing a stress basedfailure criterion. The failure criterion accounts for the fractureenergy according to the equivalent elastic layer approach.
3.1. Shear stress distribution according to Volkersen theory
Glued wood-to-steel plate joints are characterised by shearaction, for which a non-uniform shear stress distribution is
obtained due to the large overlap length. Volkersen [6] presents asecond order homogeneous ordinary linear differential equationfor the shear stress according to Eq. (1).
s003 �xs3 ¼ 0 where x2 ¼ G3b3
t3
1A1E1
þ 1A2E2
� �ð1Þ
Indices 1 and 2 indicate the adherents while index 3 indicates theadhesive layer, c.f. Fig. 3.
The adhesive lap joint under consideration is schematicallyshown in Fig. 3. All elements are assumed to behave linear elasti-cally, the adherents act as centrically loaded bars and the adhesivelayer acts only in shear with constant shear strain across thethickness. Bending is not included.
Eq. (1) is solved individually for the two parts A and B shown inFig. 3b. The mid length normal forces N1ðL=2Þ and N2ðL=2Þ at theload application point are determined using shear stress continuityand force equilibrium according to Eq. (2).
sA3 ðL=2Þ ¼ sB3ðL=2Þ
P ¼ N1ðL=2Þ þ N2ðL=2Þ
(ð2Þ
By the presented boundary conditions in Fig. 3 and Eq. (2), theshear force distribution on a centrically loaded lap joint is found tobe:
s3ðxÞ ¼sA3 for 0 6 x < L=2
sB3 for L=2 6 x 6 L
(
sA3 ¼ PG3
t3xE1A1
1tanhðbÞ þ
a� sechðbÞ2sinhðbÞ
� �coshðxxÞ � sinhðxxÞ
� �
sB3 ¼ PG3
t3xE1A1
coshð2bÞ2sinhðbÞ ðaþ sechðbÞÞ
� �coshðxxÞ
�
�coshðbÞðaþ sechðbÞÞsinhðxxÞ�
ð3Þwhere
xL ¼ L
ffiffiffiffiffiffiffiffiffiffiffiffiffiffiffiffiffiffiffiffiffiffiffiffiffiffiG3b3ð1þ aÞ
t3E1A1
sa ¼ E1A1
E2A2< 1 b ¼ xL
2ð4Þ
Fig. 11 shows the analytical variation of the shear plate dowelconnection with rubber.
3.2. Choice of bond line stiffness
Slender lap joints which fail in an elastic brittle failure can beanalysed using Volkersen theory. However, the non-elastic straincapacity is typically very significant for adhesive joint strengthand should therefore be considered e.g. by the equivalent elasticlayer approach (EELA) [11], see Fig. 4. Depending on what type ofanalysis is conducted, a choice of bond line stiffness thus can bemade.
EELA presents a characteristic linear relation of the bondline obtained by respecting the bond line strength and fractureenergy. By using a fictitious stiffness, the fracture-softeningcapabilities of the bond line can be included in the constitutiverelations. For mode II fracture this is achieved by replacing thebond line shear stiffness with an equivalent stiffness definedaccording to Eq. (5).
G3
t3¼ f 2v
2Gfð5Þ
whereG3: Shear modulus of bond line; f v : Bond line shear strength.t3: Bond line thickness; Gf : Fracture energy of bond line.
162 G. Larsson et al. / Engineering Structures 121 (2016) 160–169

See also Fig. 4. As the shear modulus is replaced by a fictitiousvalue, the initial elastic stiffness of the bond line is in general notrepresented correctly. However, as rubber behaves similar to themodel in hand, the approach can for rubber foil bond lines be con-sidered accurate also regarding deformations. For fracture in modeI, a linear elastic normal stress versus normal slip curve is definedanalogously, thus enabling full 3D modelling capabilities.
Stresses are given by means of linear elastic stress analysis. Dueto the special choice of properties of the elastic layer, eithersmax ¼ f v or G ¼ Gf can be used as a failure criterion. In case ofmixed mode loading some mixed mode failure criterion shouldbe used.
3.3. Failure load
A generalized Volkersen theory is obtained by applying EELAtogether with the Volkersen stress analysis. A failure load is thencalculated by applying a stress based failure criterion: smax ¼ f v .Maximum stress occurs at sðx ¼ 0Þ which yields the failure loadaccording to Eq. (6).
Pf ¼ f vb3ð1þ aÞLxgL
sinhðxgLÞa cosh xgL
2
� �þ coshðxgLÞ
ð6Þ
For Volkersen theory, xg ¼ x as defined in Eq. (4) while for thegeneralized Volkersen theory the normalized joint length xg isdefined in Eq. (7).
xgL ¼ L
ffiffiffiffiffiffiffiffiffiffiffiffiffiffiffiffiffiffiffiffiffiffiffiffiffif 2vb3ð1þ aÞ2Gf E1A1
sð7Þ
The Volkersen theory and the generalized Volkersen theory willyield the same results if rubber is present as discussed in Section 2.Shear fracture in the wood in vicinity of the bond line is theexpected failure mode, thus f v is determined by wood materialstrength.
As bending is not included in the Volkersen model, the presenceof peel stresses due to loading eccentricity is neglected. The modelshould in general thus not be used for prediction of the load carry-ing capacity of the studied connection. However, reinforcementcan be introduced in order to reduce such stresses, e.g. by meansof screws. Provided that the shear stiffness of the reinforcementis either negligible or taken into account, the model should givea realistic estimation of the capacity and Eq. (6) could be used todevelop a simple design criterion.
4. 3D numerical stress and strength analyses methods
Possible interaction between shear and peel stress in the joint isevaluated by means of finite element modelling in a commercialgeneral purpose software. The simulations have been performedin 3D using a model consisting of wood, steel and a bond line.The bond line is represented by a cohesive layer with a single ele-ment in the thickness direction. The bond line thus represents theadhesive or, alternatively, the adhesive and the rubber foil ifapplied. The bond line also represents the material interfaces.The specimens will henceforth be called S-R and S-nR for therubber and non-rubber specimen respectively.
4.1. S-nR – Joint without rubber layer
In order to evaluate the applicability of EELA in 3D, comparisonswere made with non-linear fracture mechanics analyses where lin-ear and bilinear fracture softening behaviours were used, see Fig. 5.The bilinear softening behaviour is a good approximation for sev-eral types of common adhesives [16], but also linear softeningwas studied in order to investigate whether the softening shapewould influence the failure load. As EELA does not account forthe true shape of the softening curve, different results of the linearand bilinear non-linear analyses would imply that EELA is not suit-able for the joint type.
As depicted in Fig. 5, all three fracture models consider both thebond line strengths and its fracture energies, but by differentmeans. When fracture softening is used, a single scalar damage
1
2
2
3
3
1
23
(a)
(b)
(c)
A B
Fig. 3. Nomenclature of the theoretical analysis using Volkersen theory. Young’s modulus Ei and shear stiffness of the bond line as G3. The geometry is divided into part A andB at load application point.
/
/
1
1
adhesive
rubber
Fig. 4. A schematic comparison between normalized fracture-softening behaviourand EELA for common adhesives (two left curves) and rubber (right). Note that EELAcorrectly represents material strength and fracture energy, as indicated by shadedareas.
G. Larsson et al. / Engineering Structures 121 (2016) 160–169 163

variable D is initiated after material failure which represents thematerial stiffness degradation. For linear softening, damage isdefined as
D ¼ d fmðdmax
m � d0mÞdmaxm ðd f
m � d0mÞð8Þ
where d fm ¼ 2GC=T0
eff with T0eff being the effective traction at damage
initiation. The maximum value of the effective displacementattained during the loading history is referred as dmax
m , which can
be determined using the fracture energy GC . During analysis, D isdetermined for the different modes respectively but the minimumis used for all.
For the case of bilinear softening curves for normal and shearmodes, see Fig. 5, damage was back-calculated from experimentaldata [17] and then used as tabular input to the software. Mixedmode is defined in terms of tractions and is expressed by
/1 ¼ 2patan
shtni
/2 ¼ 2patan
ttts
ð9Þ
where s ¼ffiffiffiffiffiffiffiffiffiffiffiffiffiffit2s þ t2t
qis the vector sum of the two shear components.
Using this nomenclature, /1 ¼ 0 corresponds to mode I, /2 ¼ 0 tomode II in the first shear direction and /2 ¼ 1 to mode II in the sec-ond shear direction.
4.2. S-R – Joint with rubber layer
When rubber foil is applied, its flexible behaviour will dominatethe deformations and the bond line is thus represented by rubberproperties. In comparison to adhesives, the bond line has for thiscase close to zero fracture-softening capability.
In dominant shear action rubber can be modelled as beinglinear elastic with fairly good accuracy, c.f. Fig. 4 and [18]. Theincompressible behaviour of rubber will, however, to a large extentaffect the normal stiffness. Given an isotropic linear elasticmaterial in plane strain, one can theoretically identify the normalstiffness kn as a function of Poisson’s ratio m, modulus of elasticityE, and layer thickness t, for an edge point and inner point of therubber layer respectively, see Fig. 7 and Eq. (10).
kn;edge ¼ Etð1� m2Þ kn;inner ¼ Eð1� mÞ
tð1þ mÞð1� 2mÞ ð10Þ
As the rubber properties are to be modelled using cohesive ele-ments, the size of a transition region close to the free edge of therubber was investigated using linear finite element analysis. A
plane strain tensile test of a wide specimen made of a rubberlikelinear elastic material perfectly bonded to stiff plates was analysed,see Figs. 6 and 7.
The equivalent normal stiffness of the rubber shows a variationalong the width due to the pronounced Poisson’s effect, which isobvious from inspection of Fig. 6 showing the normal stress distri-bution for a state of uniform normal strain of the rubber layer. It isfurther clear from Fig. 7 that the inner stiffness is well representedby the theoretical results. However, stress concentrations arise atthe ends due to the sudden change in stiffness. Further investiga-tions reveal a mesh size dependence of the peak stress value atthe ends of the specimen but also that extrapolating the stresscurve from values coincide with the theoretical values of Eq.(10). These findings make it plausible to exclude the concentrationas a numerical artefact, and at the same time the findings provide amean of disregarding this very local phenomenon. A transitionlength is defined as the distance from the edge to the point where99% of the plateau value is reached. Linear simulations of a rubber-like material indicate an influence of Poisson’s ratio and bond linethickness on this transition length. For rubber (low stiffness andPoisson’s ratio close to 0.5) this is approximated by Eq. (11).
ltransition ¼ 9t ð11ÞThe transition length has a positive effect in the applied analy-
ses of the connection as the position of maximum peel stress doesnot coincide with the position where maximum shear stress isfound, the latter typically being located at the bond line edge.
Similar simulations were conducted to verify the shear stressdistribution. As the theory predicts, analyses indicate zero shearstress at the specimen ends and an effective shear stiffness beingequal to the shear modulus, i.e. G ¼ E=2ð1þ mÞ. The transitionlength and variation of equivalent shear stiffness is negligibleand thus considered constant along the bond line.
For the joint design in hand, this linear modelling approach hasbeen verified by comparing the obtained stress distribution to theone obtained from non-linear, third order analyses using both neo-Hookean [19] and Yeoh [20] material models. As seen in Section 5.4,reasonable agreement with conducted tests is also obtained.
The strength of the bond line is found using a stress based fail-ure criterion, for which a Norris criterion [21] is deemed suitablefor the 2D bond line. Compressive normal stress will not cause fail-ure and is thus not included in the criterion, see Eq. (12).
Fig. 5. Normalized stress–displacement plot illustrating the three numericalmodels used for the numerical analysis of the S-nR specimen. Note that materialstrength and fracture energy is the same for all models.
Stiff plate
Rubber
Stiff plate
Fig. 6. Stiffness variation determined by numerical tension simulation of arubberlike material. The specimen width is 30 times the rubber layer thickness.The rubber layer is modelled using an isotropic linear elastic material withE ¼ 3:6 MPa.
164 G. Larsson et al. / Engineering Structures 121 (2016) 160–169

r11
f t90
� �2
þ s12f v
� �2
þ s13f v90
� �2
� 1 ¼ 0 ð12Þ
Index t indicates tension, index v indicates shear and index 90 isused for the perpendicular to grain direction. Stress directions aredefined in Section 2.
5. Calculation results and comparison to tests
5.1. Test series
The calculation results will be compared to tests conducted byYang et al. [3]. The shear plate dowel connections was subjectedto quasi-static displacement controlled tensile test according to
Fig. 8. Each specimen had a length of 2 m with identical connec-tions in each end. Three nominally equal specimens were testedin each series, i.e. 6 tested joints in total. However, the non-failing joint is disregarded in this work. The size of the steel plateswas 400 � 400 mm2 with a thickness of 8 mm. The plates were13 mm thick in the area close to the dowel in order to avoid yield-ing and possible buckling. It should be noted that the plates werenot only glued, but also 34 screws (70 � 6 mm) were inserted tokeep the plates in position during curing. Two similar test serieswere conducted with the only difference being the presence of arubber layer.
The glulam used was of strength class GL30c while the steel wasof grade Q345B with a nominal yield stress of 345 MPa. The rubberwas a mix of natural rubber and SBR (styrene-butadiene) with ahardness of 62� Shore A, which is approximately equivalent to ashear modulus 1.2 MPa [18]. The tensile strength of the rubber is22.4 MPa while its shear strength is 9.4 MPa. The failure elongationin tension is 595% [3] and the rubber layer had a thickness of 1.0–1.2 mm. The rubber was vulcanized to the steel plate whichensures a steel–rubber interface strength similar to the rubberitself. A 2-component polyurethane (Purbond CR421, glue + hard-ener) was used to adhere the rubber to the glulam while epoxy(SHB) was used to adhere the steel directly to the glulam for theconnections without any rubber layer.
The displacement of the steel plate relative the side of the beamwas recorded, see Fig. 8. The failure load Pf and average shearstress at failure sf of the specimens are found in Table 1.
The test results suggest a considerable strength increase in theconnection by introducing a rubber foil. Failure examination of theS-nR specimen does however indicate premature failure at thesteel–adhesive interface rather than in the wood, c.f. [3]. Further-more, a mistake in the test set-up design of the first S-R specimen
Fig. 7. Normal stress distribution plotted over the transition length. By excludingthe stress concentration at the end, data fitting validates the theoretical edgestiffness. The transition length according to Eq. (11) indicated by the vertical dashedline.
Fig. 8. Geometry and test setup used by Yang et al. [3]. Subscript s for steel, w for wood. All dimensions are in mm and the typical arrangement of displacement gauges isshown in the lower part of the middle figure.
G. Larsson et al. / Engineering Structures 121 (2016) 160–169 165

resulted in bending of the glulam which lowered its capacity. Thisbending was prevented in the later S-R tests.
5.2. Numerical analysis parameters
A linear elastic rectilinear orthotropic material model was cho-sen for the wood using the elastic parameters given in Table 2, noidentification experiments were conducted. The steel plate is mod-elled as a linear elastic isotropic material with Young’s modulusE ¼ 210 GPa and a Poisson’s ratio, m ¼ 0:3.
The bond line is modelled according to Section 4, thus depen-dent on the presence of rubber. As the prominent failure mode iswood shear failure close to the bond line, wood properties are usedfor strengths and fracture energies. The values shown in Table 3 arethose given by Berblom Dahl [22] and Serrano [7] respectively forclear wood specimens. The effective normal stiffness for S-R wasapplied to a perimeter zone according to Section 4.2 assuming aPoisson’s ratio of 0.497. This value was found by comparing stresslevels from simulations using a linear elastic rubber layer withthose from simulations using a hyperelastic (Neo-Hookean)material model for the rubber. Bond line stiffness for the adhesivein the S-nR joints is also found in Table 3.
For simplicity, the simulations were run in load control. Bydoing so there was no need to model the dowel itself, nor its inter-action with the steel plate which would call for detailed contactmodelling. Instead a non-uniform pressure load was prescribedon the hole edges to simulate pin pressure. The simulations wererun without introducing artificial stabilization (viscous damping)and using the built-in automatic incrementation features of thesoftware. The minimum step length was expressed as ratio of totalload and was set to 5 � 10�3. Double symmetry was used and theload was applied horizontally to the right, see Figs. 8 and 9.
The element mesh commonly used is shown in Fig. 9. First ordersolid elements with full integration over 8 nodes were used for theglulam and steel while cohesive elements were used for the bondline with one element in the thickness direction. With the pre-sented modelling approach stress concentrations at the edges aresubstantially reduced thus enabling the use of a simple stress fail-ure criterion.
5.3. Results for S-nR – Joint without rubber layer
The predicted failure load of the S-nR specimen varies greatlydepending on the calculation method used, see Table 4. The testresults are also presented for which the premature failure shouldbe kept in mind, c.f. Section 5.1. As the stiffness of the adhesiveis considerably larger than for the screws, the latter are excludedfrom the analysis as they only have a minor influence on the jointstrength. In comparison to the linear 1D analysis according to Eq.(3), the joint geometry causes a more uniform shear stress distri-bution in the linear 3D, and thus yields a higher failure load eventhough the 3D analysis considers stress interaction. Due to the highadhesive stiffness, the linear 3D analysis is sensitive to discretiza-tion in comparison to fracture softening analysis.
EELA shows good resemblance between analytical 1D andnumerical 3D results, but also with the linear fracture softeningmodel. The bilinear model does however imply that the failureloads found by EELA are unreasonably high, which indicates a frac-
Table 1Failure loads and mean shear stress at failure of laboratory test series with (S-R) andwithout rubber (S-nR).
S-nR Pf (kN) sf (MPa) S-R Pf (kN) sf (MPa)
I 281 0.93 I 843 2.78II 209 0.69 II 1076 3.54III 165 0.54 III 1052 3.46AVG 218 0.7 AVG 990 3.3
Table 2Adopted elastic material parameters for wood [7]. Parameters are given in MPaand (–).
Young’s modulus(MPa)
Shear modulus(MPa)
Poisson’s ratio
EL 14,000 GTR 60 tTR 0.3ET 500 GTL 700 tTL 0.02ER 800 GRL 600 tRL 0.02
Table 3Bond line parameters. Units: MPa and J/m2.
rperp s0 s90
S-nR E ¼ 3000Gf ;I ¼ 470f t90 ¼ 4:9
G ¼ 1000Gf ;II ¼ 740f v ¼ 4:4
G ¼ 1000Gf ;II ¼ 300f v90 ¼ 1:6
S-R E ¼ 3:6f t90 ¼ 4:9c.f. Eqs. (10) and (11)
G ¼ 1:2f v ¼ 4:4
G ¼ 1:2f v90 ¼ 1:6
Fig. 9. Typical FE-mesh used in the analyses (double symmetry used). Approximately 80,000 elements in total. Wood elements shown in white, steel plate in grey.
Table 4Failure load comparison of full-sized S-nR test specimens. The variation of the resultsindicates the importance of fracture analysis on adhesive connections. The bilinearmodel is considered realistic, which further indicates the premature failure of the testseries.
Type of analysis Failureload (kN)
Average shearstress (MPa)
1D Analytical, linear 92 0.303D Numerical, linear 128 0.42Test 218 0.723D Numerical, NLFM
Bilinear softening562 1.85
3D Numerical, NLFM Linearsoftening
795 2.62
3D Numerical, EELA 803 2.641D Analytical, EELA 863 2.84
166 G. Larsson et al. / Engineering Structures 121 (2016) 160–169

ture softening behaviour dependency of the failure load. This indi-cation makes the use of EELA not suitable for the connection inhand as it disregards the shape of the softening curve as well asassumes that all fracture energy can be activated during the prop-agating failure. Since no detailed knowledge about the exact shapeof the softening curve is available for the bond line studied, no fur-ther analyses of the joint without rubber foil were performed. As acomparison, the shear stress distribution at failure is illustrated inFig. 10. The bilinear model verifies the premature failure in the testseries discussed in Section 5.1.
5.4. Results for S-R – Joint with rubber layer
In comparison to the S-nR specimen, a self-similar stress distri-bution throughout the load application is obtained for the S-Rspecimen due to the linear analysis. A good resemblance betweenthe analytical 1D expressions and the numerical 3D models isfound for which a close to uniform distribution is obtained, shownin Fig. 11.
The higher load capacity in combination with a slightly largereccentricity due to increased bond line thickness results in highernormal stresses in the S-R specimen in comparison to the S-nR. Thenumerical results are shown in Fig. 12.
The combined state of stress is evaluated using the Norris stresscriterion according to Section 4.2, and applying a single point max-imum stress failure criterion. A comparison of the load bearingcapacity of the connection is presented in Table 5. For the geome-try at hand, the linear numerical analysis shows a reasonableagreement with the test results, especially if the first test resultis disregarded, c.f. Section 5.1. The analysis further indicates thatincluding peel stress reduces the failure load by 20% as compared
Fig. 10. Shear stress distribution comparison between presented models in Section 2 at failure load. The distribution is along a line at 60 mm distance from the plate edge, seelower left corner. Conventional linear stress analysis ‘S-nR Lin’ underestimates the capacity significantly. The load is directed right.
Fig. 11. Shear stress distribution of the S-R specimen; 1D analytical and 3D numerical EELA for a total connection load of 1050 kN directed right. The numerical stress pathsare taken in the middle (hole) and at 60 mm distance from the plate edge (side), see lower left corner.
Fig. 12. Normal stress distribution by numerical EELA analysis of the S-R specimen. Total load is 1050 kN directed right. The peel stress (positive) peak at x � 150 mm governsthe failure region.
Table 5Failure load comparison of the S-R specimen.
Type of analysis Failure load (kN) Average shear stress (MPa)
Test 990 3.263D Numerical 1050 3.461D Analytical 1270 4.18
G. Larsson et al. / Engineering Structures 121 (2016) 160–169 167

to the analytical 1D-solution and also predicts the failure region tobe close to the hole instead of being located at the outer perimeterof the steel plate.
In order to evaluate the linear elastic representation of rubber, aload–slip comparison to test data is of interest, see Fig. 13. Thedeformation measure used for the numerical results in this plotis chosen so as to represent the measurement points used in thetests. It can be concluded that the numerical analysis underesti-mates the joint stiffness, which is possibly due to the large amountof screws used but not modelled.
6. Discussion
A large increase in load bearing capacity of the shear plate con-nection by using a rubber foil between the steel plate and the woodwas recorded in the tests, partly due to premature failure discussedin Section 5.1. If the steel–adhesive interface can be made suffi-ciently strong and failure in the wood close to the bond line ismade the governing factor, the numerical results for the S-nR spec-imen reported herein predicts a failure strength increase of 150%when the rubber foil is applied. In addition, the elastic behaviourof the relatively soft rubber foil also suggests a considerably highercapacity in cyclic loading since the response is reversible up to loadlevels very close to the failure load.
The shear stress distribution is close to uniform for a 1 mm rub-ber foil thickness, hence no significant strength increase is possibleby using a thicker foil. However, a thicker foil would most probablyincrease the joint’s impact resistance and, of course, reduce jointstiffness. Such characteristics can be of interest in shock loadingsituations or when mechanical fasteners are needed to interactwith a glued bond line.
A full analysis of a rubber layer requires a non-linear materialmodel, non-linear geometry (due to high straining) and a consider-able amount of elements in the thickness direction in order toaccurately capture the deformation pattern. By using the suggestedmethod of analysis with cohesive elements, a considerably fasteranalysis run time is attained.
Peel stresses in the bond line can be reduced by fastening theplate also with screws. The same screws can also be used to obtaincuring pressure for the adhesive. The failure load comparison pre-sented in Table 5 suggests a good resemblance between thenumerical 3D analysis and the test results. However, the numericalmodel does not include the screws shown in Fig. 8 which shouldincrease the load carrying capacity of the joint as the rubberenables screw-adhesive interaction [1]. The numerical analysisindicates a failure region just behind the hole, thus it can be ofinterest to insert screws also there. Note that the failure region dif-fers between the presented models, from the outer perimeter ofthe bond line behind the load in the Volkersen analysis to the holeperimeter behind the load in the numerical analysis. This shift isdue to the inclusion of peel stresses in the FE-analyses and the
use of the Norris failure criterion based on the multi-axial stressstate.
Even though strength analyses of the rubber foil adhesive jointsare promising, additional efforts are needed in order to account forlong term effects, dynamic loading and fire safety before structuralapplication.
7. Conclusions
� An analytical expression of the 1D shear stress distribution,based on Volkersen theory, was developed for centrically loadedglued lap joints. The analysis indicates that the generalizedVolkersen theory can be used to determine the load bearingcapacity of the joint with reasonable agreement when an inter-mediate layer with a rubber foil is applied. The predicted load ishigher than can be expected due to the neglected bending.
� Numerical bond line models of glued wood-to-steel plate jointsare presented for which a bilinear fracture softening model issuggested for traditional wood-to-steel plate adhesive jointsand a linear elastic model is suggested if an intermediate rubberfoil layer is used.
� If only failure of wood close to the bond line is considered, thesuggested models indicate a 150% increase of the load bearingcapacity by introducing a rubber foil. The increase is lower thanexperimental experience, indicating difficulties in properlybonding the steel plate to wood. Compared to a traditionaladhesive bond, the numerical results indicate that the failureload is reached without early damage initiation and evolutionin the bond line when a rubber foil is used.
Acknowledgements
The financial support provided by Formas through grant 2012-879 is gratefully acknowledged. The authors would also like tothank associate professor Huifeng Yang and others at Nanjing TechUniversity for a pleasant stay and for providing information on theexperimental work.
Appendix A. Supplementary material
Supplementary data associated with this article can be found, inthe online version, at http://dx.doi.org/10.1016/j.engstruct.2016.04.053.
References
[1] Gustafsson PJ. Tests of full size rubber foil adhesive joints. Lund University;2007.
[2] Crocetti R, Axelson M, Sartori T. Strengthening of large diameter single doweljoints. SP Technical Research Institute of Sweden; 2010.
Fig. 13. Load–slip comparison of the rubber plate connection between tests and numerical analysis.
168 G. Larsson et al. / Engineering Structures 121 (2016) 160–169

[3] Yang H, Crocetti R, Larsson G, Gustafsson P-J. Experimental study on innovativeconnections for large span timber truss structures. In: IASS working groups 12+ 18 International Colloquium 2015, Tokyo, Japan; 2015.
[4] Swedish Standards Institute. SS-EN 1995-1-1:2004: Eurocode 5: design oftimber structures. Stockholm, Sweden: SSI; 2009.
[5] Kobel P. Modelling of strengthened connections for large span truss structures.Master thesis. Lund University; 2011.
[6] Volkersen O. Die Nietkraftverteilung in zugbeanspruchten Nietverbindungenmit. Luftfahrtvorschung 1938;15:41–7.
[7] E. Serrano. Adhesive joints in timber engineering, modelling and testing offracture properties. PhD thesis. Lund; 2000.
[8] Ottosen NS, Olsson K-G. Hardening/softening plastic analysis of adhesive joint.J Eng Mech 1988;114(1):97–116.
[9] Krajcinovic D. Damage mechanics. Mech Mater 1989;8:117–97.[10] Edlund U. Mechanical analysis of adhesive joints: models and computational
methods. PhD thesis. Linköping, Sweden; 1992.[11] PJ Gustafsson. Analysis of generalized Volkersen joints in terms of non-linear
fracture mechanics. In: Proc of European mechanics colloquium 227‘‘Mechanical behavior of adhesive joints”; 1987. p. 323–38.
[12] Gustafsson PJ, Serrano E. Glued truss joints analysed by fracture mechanics. In:5th World conference on timber engineering, Montreux, Switzerland; 1998.
[13] Coureau J-L, Gustafsson PJ, Persson K. Elastic layermodel for application to crackpropagationproblems in timber engineering.WoodSci Technol2006;40:275–90.
[14] Jensen JL. Quasi-non-linear fracture mechanics analysis of the doublecantilever beam specimen. J Wood Sci 2005;51:566–71.
[15] Jensen JL, Gustafsson PJ. Shear strength of beam splice joints with glued-inrods. J Wood Sci 2004;50:123–9.
[16] Wernersson H, Gustafsson PJ. The complete stress–slip curve of wood–adhesives in pure shear. Mech Behav Adhes Joints 1987:139–50.
[17] Wernersson H. Wood adhesive bonds – fracture softening properties in shearand in tension. PhD thesis. Lund: Lund University; 1990.
[18] Austrell P-E. Modelling of elasticity and damping for filled elastomers. PhDthesis. Lund: Lund University; 1997.
[19] Treloar LRG. The physics of rubber elasticity. 3rd ed. Oxford: Clarendon Press;1975.
[20] Yeoh OH. Some forms of the strain energy function for rubber. Rubber ChemTechnol 1993;66:754–71.
[21] Norris CB. Strength of orthotropic materials subjected to combined stresses.Report no. 1816. Madison: U.S. Department of Agriculture; 1962.
[22] Berblom Dahl K. Mechanical properties of clear wood from Norway spruce.PhD thesis. Trondheim, Norway: Norwegian University of Science andTechnology; 2009. ISBN 978-82-471-1911-2.
G. Larsson et al. / Engineering Structures 121 (2016) 160–169 169

Paper D

ANALYSIS OF THE SHEAR PLATE DOWEL JOINT AND PARAMETER STUDIES
Gustaf Larsson1, Per Johan Gustafsson2, Erik Serrano3, Roberto Crocetti4
ABSTRACT: The shear plate dowel joint is a single large dowel joint with rubber-glued steel plates. The design has shown promising results in terms of strength in experimental work. The paper presents results from theoretical models that have been developed to enable further studies of the joint. The failure load obtained through a numerical 3D analysis is in good agreement with test results. Parameter studies and design alterations are presented, which concludes that the joint design is efficient and that the shear slip stiffness can be designed to match commonly used fasteners.
KEYWORDS: Shear plate dowel joint, rubber foil adhesive joint, single dowel, numerical model, timber, connection, joint
1 INTRODUCTION 567
The properties and cost of structural joints often govern the competitiveness of timber as main structural material in large structures. Mechanical fasteners such as dowels, screws and nails are typically used as they provide strength and ductility to the timber joint. However, in order to avoid splitting, proper distances are required to member edges as well as between different fasteners as described in the European design code Eurocode [1]. These distances entail an increase of member dimensions, which subsequently reduces the utilisation factor of the member in span and thus causes excessive material use.
Several types of timber reinforcements have been studied in order to enhance the brittle properties of wood. Early research focused on global element reinforcements [2] [3] of which textiles were proposed suitable also as local reinforcement in e.g. joints [4]. Several studies have since been aimed specifically at minimizing the required distances between mechanical fasteners and end distance by e.g. self-tapping screws [5] and fibre textile [6] [7]. The shear plate dowel joint (SPDJ) distinguishes itself from previous joint proposals by combining high strength with efficient on and off site production, while maintaining a short end distance. The design also enables easy joint-to-member strength matching.
1 Gustaf Larsson, Lund University, Sweden, [email protected], P.O. Box 118, SE-221 00 Lund, Sweden 2 Per Johan Gustafsson, Lund University, Sweden, [email protected] 3 Erik Serrano, Lund University, Sweden, [email protected] 4 Roberto Crocetti, Lund University, Sweden, [email protected]
1.1 THE SHEAR PLATE DOWEL JOINT
The favourable properties of the SPDJ design is achieved by combining the strength of a flexible lap joint with the simplicity of a single dowel design.
A limiting factor in design of lap joints is shear stress concentrations at the joint ends, which grow significantly for large lap lengths. These concentrations reduce the active load transfer region of the joint and thus limit the total load bearing capacity. This premature failure is further deprived due to the high stiffness of commonly used structural adhesives.
In order to minimize the stress concentrations by softening the bond line, Gustafsson [8] suggested adding an intermediate rubber layer as see Figure 1. A close to uniform shear stress distribution over the lap joint length is found even for thin rubber layers, dramatically increasing the elastic load bearing capacity. The stiffness of a rubber foil adhesive joint is typically comparable to, if not stiffer than, bolted joints [8].
Figure 1: Pull-pull adhesive lap joint with intermediate rubber layer
Steel Rubber foil
Adhesive Wood

Figure 2: The shear plate dowel joint used in a truss node
A high degree of prefabrication and easy on site assembly can be achieved by a using a single dowel joint design, see Figure 2. However, a single dowel would be very prone to splitting failure and is thus in need of a large end distance, if no type of reinforcement is used.
Several types of reinforcements have been tested for large diameter dowels, such as self-tapping screws [9] [10] and fibre textile [11], but none of these techniques efficiently reduce the possibility of shear plug failure. However, by combining the concepts of a single large dowel and the rubber foil adhesive joint, the premature shear plug failure is avoided.
The rubber foil adhesive technique is used to externally glue large metal plates with vulcanized rubber to the timber member, see Figure 2. Shear action between timber and rubber is then assured by using a larger hole diameter in the timber than in the steel plates. As the rubber foil enables the use of the bonded area, the member strength can simply be matched by an appropriate choice of plate size. Screws can be used to apply curing pressure, minimize steel plate bending due to eccentricity, and increase joint bearing capacity as the rubber foil can be designed to match the slip of the screws.
The SPDJ was first tested in [8], but later in full scale by Yang et al. [12] along with comparative tests without a rubber foil. For a steel plate size of 400x400 mm2 and dowel diameter of 91 mm, the average failure load was found being 218 kN without rubber foil, compared to 990 kN with rubber foil. The dominant failure mode was shear failure in the bond line, but indications of wood failure also exist [8] [12]. Even though a premature failure in the steel-adhesive interface was found for the specimens without rubber, the benefit of the rubber layer on load bearing capacity is clear. 1.2 PRESENT STUDY
The purpose of this paper is to establish validated and efficient strength analysis procedures of the SPDJ as limited in strength by fracture in the bond line or the timber member. Here, the term bond line includes the adhesive, rubber foil, a thin wood layer along the glue and the material interfaces.
Analytical 1D expressions and a numerical 3D approach are presented to determine the failure load of the joint. The 1D analysis is based upon the Volkersen theory [13], which considers the shear stress distribution, while the numerical 3D approach is needed to also consider peel stress interaction. The analytical expressions can be used to develop design procedures of the joint.
2 1D ANALYTICAL ANALYSIS
The SPDJ is characterised by lap shear action between the steel plate and timber element. A non-uniform shear stress distribution is obtained for large overlap lengths due to the various stiffnesses of the joint materials. Based on studies on large riveted overlap connections in steel, Volkersen [13] presented a differential equation for the shear distribution as Equation (1).
���� − ��� = 0
�� =������
�1
����+
1
�����
(1)
Indices 1 and 2 indicate the adherents while 3 indicates the adhesive layer, see further Figure 3. In the Volkersen theory, the adherends are assumed to act as centrically loaded bars and the adhesive layer can only transfer shear stress, which is constant over the thickness. Bending is thus not included and all materials are modelled as linear elastic. Using stress continuity and force equilibrium over the centric load application point, the analytical shear force distribution for the SPDJ is governed by (2).
��(�)= ���� ��� 0 ≤ � < �
2�
��� ��� �
2� ≤ � ≤ �
��� =
��3
�3��1�1
��1
tanh(�)
+� − sech(�)
2sinh(�)� cosh(��)
− sinh(��)�
��� =
��3
�3��1�1
��cosh(2�)
2sinh(�)��
+ sech(�)�� cosh(��)
− cosh(�)��
+ sech(�)�sinh(��)�
(2)
in which

�� = ������(1 + �)
������
� =��������
< 1
� =��
2
(3)
This analytical shear stress distribution is shown in Figure 7.
For a given a shear strength��, the maximum load bearing capacity, ��, is limited by the shear stress behind the
applied load at � = 0 in Equation (2). Thus, the failure load can be expressed as
�� = ����(1 + �)�
��
sinh(��)
� cosh ���2� + cosh(��)
(4)
Among the simplifications made in the Volkersen theory, disregarding bending is of special concern for the SPDJ design. Due to the eccentricity between the system lines of the steel plate and timber member, bending will occur and thus it is expected than Equation (4) will overestimate the load carrying capacity of the joint.
However, the bond line peel stresses can be reduced if adequate reinforcement is introduced, e.g. by means of screws. The model could then probably be used to obtain a realistic estimation of the capacity, provided also that the shear stiffness of the screws are either negligible or taken into account.
3 3D NUMERICAL ANALYSIS
3.1 GENERAL
Numerical 3D analysis can be used in order to consider the stress interaction between shear and peel stresses in the bond line. For this, the general-purpose finite element software ABAQUS was used. The simulations were performed in 3D using a model consisting of wood, steel and a bond line.
3.2 STEEL AND WOOD MATERIAL MODELS
Wood is modelled using a linear elastic material formulation. Orthotropic parameters are used in both rectilinear and polar manner, see Table 1 and Figure 4. Failure in the wood member is evaluated by a Tsai-Wu failure criterion [14], in which the strength interaction coefficients are set to zero. Strength parameters are found in Table 2.
The steel is modelled as an isotropic linear elastic material using Young’s modulus of 210 GPa and Poisson’s ratio of 0.3.
Table 1: Elastic material properties for wood [15]. Units are given in MPa and [-].
Young’s modulus Shear modulus Poisson’s ratio �� 13700 ��� 60 ��� 0.3 �� 500 ��� 700 ��� 0.02 �� 800 ��� 600 ��� 0.02
Table 2: Wood strength parameters in MPa [16].
Tensile Compression �� 63 29 ��� 4.4 �� 4.9 3.6 ��� 6.1 �� 2.8 3.8 ��� 1.6
Figure 4: Polar and rectilinear material model used in wood stress analysis.
Figure 3. Nomenclature of the theoretical analysis using Volkersen theory. Young’s modulus is denoted �� for wood and steel respectively, and shear stiffness of the bond line is denoted ��. The geometry is divided into part A and B at the load application point.

3.3 BOND LINE MODEL
The bond line represents the rubber and the adjacent interfaces between rubber-wood and rubber-steel. An efficient bond line model is of interest and thus a linear analysis with a minimum amount of elements is favoured even though a non-linear elastic behaviour is characteristic for rubber. However, shear action can be modelled with a linear behaviour with a reasonable accuracy, and as it is the main action of the joint, a reasonable agreement is found with non-linear material models.
Special consideration is needed in order to model the incompressibility of rubber as the Poisson’s ratio approaches 0.5, which highly affects the normal stiffness of the bond line. Based upon a linear elastic material formulation, one can identify a difference in normal stiffness between edge and inner points of the material due to strain boundary conditions. The stiffness is a function of Young’s modulus �, Poisson’s ratio � and the rubber thickness � according to Equation (5).
��,���� =�
�(1 − ��)
��,����� =�(1 − �)
�(1 + �)(1 − 2�)
(5)
A transition region with an increasing normal stiffness from ��,���� to ��,����� is thus expected. The region is
defined as the distance from the edge to a point at which a stiffness of 99% of ��,����� is found, which was investigated using linear finite element analysis. There, a rubberlike linear elastic material was perfectly bonded to stiff plates and subjected to tensile forces in plain strain conditions. The normal stiffness variation is plotted over the specimen width in Figure 5, which indicates that the inner stiffness is well represented by the theoretical results. Parameter studies indicate a linear relation between the transition length and the rubber thickness according to Equation (6) for Poisson’s ratio close to � =0.5.
����������� = 9� (6)
However, stress peaks arise at the ends due to sudden stiffness change. These peaks are mesh dependent, but data extrapolation suggests that the theoretical edge stiffness is accurate. These findings make it plausible to exclude the edge stress concentration as a numerical artefact, and at the same time provide a mean of disregarding this local phenomenon.
Figure 5: Normal stiffness variation on edge. Numerical stiffness ���� compared to theoretical values �� from Equation (5) with the approximated distribution in dashed curve. The transition length, as given in Equation (6), is indicated as a vertical line.
Conducted test series [12] indicated that wood failure close to the bond line was the governing failure mode, and thus wood strength parameters were used in a Norris strength criterion [17]. It was found that good model characteristics were achieved using a single cohesive element in the thickness direction, for which the normal stiffness variation as described above was applied. The material properties of the bond line are found in Table 3, representing the elastic properties of rubber for normal (�����), principal shear (��) and transverse shear direction
(���) [18] while using wood strength characteristics [16]. The stiffness was then determined using Eq (5), in which Poisson’s ratio was set to 0.497.
Table 3: Material properties for the cohesive model of the bond line. Units are given in MPa.
����� �� ���
� 3.6 � 1.2 ��� 1.2 ��,�� 4.9 �� 4.4 ��,�� 1.6
4 MODEL EVALUATION
4.1 EXPERIMENTAL WORK
In order to validate the presented models, comparison is made to conducted test series by Yang et al. [12]. The presented material properties are chosen to represent the used materials, while the test setup and geometry is given in Figure 6.
Two identical SPDJ were prepared in each end of a 2 m long glulam element. The 400x400 mm2 steel plates were thicker around the hole to prevent local buckling. The steel plates were fastened by 34 screws during curing. Three nominally equal specimens were included in the test series, with a resulting average failure load of 990 kN [12].

Figure 6: Test setup and geometry used by Yang et al. [12], with displacement gauges indicated by black solids. Dimensions are given in millimetres. 4.2 BOND LINE STRESS DISTRIBUTION
The bond line shear stress distribution is given by both the analytical 1D and the numerical 3D model. The distributions show good agreement as shown in Figure 7, which also reveals the close to uniform stress distribution needed for good load carrying capacity of the joint.
The normal stresses in the bond line are only evaluated in the numerical 3D analysis, and the results are found in Figure 8. Stress peaks occur on the hole perimeter due to the load application eccentricity, but a bending of the entire steel plate can also be seen. The lower bond line normal stiffness at the edges, discussed in Section 3.3, results in reduced normal stresses at the ends.
Figure 7: Analytical 1D and numerical 3D shear stress distribution at a joint load of 1050 kN directed right. The numerical middle and side path are indicated by left legend.
Figure 8: Normal stress distribution at a total joint load of 1050 kN directed right (c.f. Figure 6). The critical peel stresses are found in Figure 8 as positive normal stresses. By introducing the peel stress component in the failure analysis, the failure region is moved from the edge behind the load (maximum shear stress) to the hole perimeter (maximum peel stress). 4.3 STRENGTH AND STIFFNESS
Table 4 provides a failure load comparison of the presented 1D- and 3D calculation methods, as well as the average failure load from tests [12]. As expected, the analytically determined failure load according to Eq (4) is found to be higher by disregarding peel-shear stress interaction. Deviating 6% from experimental values, the 3D numerical analysis shows reasonable agreement. Yang [12] describes a test setup error, which resulted in a low failure strength of the first specimen (see also Figure 9). If excluded from the average, the 3D analysis deviates 4% from test results, independent of polar or rectilinear wood model was used.
The stress state evaluation of the 3D model was conducted according to a Norris failure criterion, which concludes that bond line failure is reduced by 20% by regarding peel stresses. By such, the bond line failure region is also changed from the outer perimeter of the plate to the vicinity of the hole. Table 4: Bond line failure load and corresponding average shear stress according Eq (4) and FEM.
Type of analysis Failure load Avg shear stress Test [12] 990 kN 3.26 MPa
3D Numerical 1020 kN 3.35 MPa 1D Analytical 1270 kN 4.18 MPa
The numerical model also enables stiffness comparison between model and tests, which is found in Figure 9. The typical S-shaped curve of the non-linear elastic behaviour of rubber is seen in the test results, while it is assumed linear in the bond line model. It can further be seen that the numerical model indicates a softer joint than the test series, which is possibly due to the large amount of screws used but not modelled.

Figure 9: Load-displacement curve comparison between tests and numerical 3D model. Average shear stress is found on the right y-axis. 4.4 WOOD STRESS ANALYSIS
Using the presented bond line model, a good strength agreement was found with tests. However, as indications of timber failure were found in the tests [12] the stress situation in the timber member was also investigated, see Table 5.
The linear stress analysis indicates large tensile stresses parallel to grain in the upper and lower hole perimeter. Evaluating the stress tensor at this point by a Tsai-Wu failure criterion [14] indicates a failure already at a load level of 660 kN, which is 35% lower than the test results indicate. However, this concentration is possibly a crack initiation point, which could explain the combined bond line and shear plug failure seen in the tests. Previously assumed as a secondary failure, these findings make it plausible that the shear plug occurred simultaneously, if not prior, to the bond line failure.
The failure load is further decreased using polar coordinates for the wood representation (Figure 4). The Tsai-Wu criterion indicates failure at 560 kN, with a new failure region at the outer bond line perimeter in front of the applied load.
In comparison to the estimated bond line failure according to Norris, the Tsai-Wu criterion of the wood identifies more localized peak values for both the rectilinear and polar material models. This local behaviour lowers the capacity of the joint by acting as possible fracture initiation points. Even so, by comparing the numerical results to the tests indicates that the bond line failure is the ultimate failure. Table 5: Bond line failure load from numerical 3D analyses.
Type of analysis Failure load Test [12] 990 kN Bond line 1020 kN
Rectilinear wood 660 kN Polar wood 560 kN
5 SPDJ DESIGN EVALUATION
5.1 RUBBER PARAMETER ANALYSIS
A large variety of rubber materials can be found on the market today, typically used as seals or to reduce vibrations. As such, the resistance to chemicals, effective temperature range and the hardness are the relevant design aspects. However, high shear strain capacity, high shear strength and low creep are needed for the implementation of the SPDJ. A thin rubber layer is also favourable, along with a suitable shear stiffness.
The shear stiffness and the rubber thickness are intimately related as they affect the bond line flexibility. The flexibility is needed to allow different elongation of the adherends and thus increase the joint strength. However, normal stresses have a negative impact on the joint, as seen in Section 4.3, which are increased for thicker rubber layers.
In Figure 10, the joint failure strength is shown as a function of rubber hardness for different thicknesses. The hardness is given in shear modulus as well as the industry standard degrees Shore A, which is non-linear in comparison to the shear modulus [18]. It is of little surprise that the load capacity increases for a decreasing hardness, assuming the wood failure is governing. However, as shown in Figure 11 the joint slip also increases for decreased hardness, which is often undesirable. A good balance must thus be found between joint slip and load carrying capacity, which is dependent on the application and possible interaction with other types of fasteners. Note that the strength capacity is, however, predominantly determined by the size of the plate.
Figure 10: Failure strength of the SPDJ reference design for increasing stiffness using different rubber layer thicknesses. Stiffness is given in Pascal (lower x-axis) and Shore A (upper x-axis).
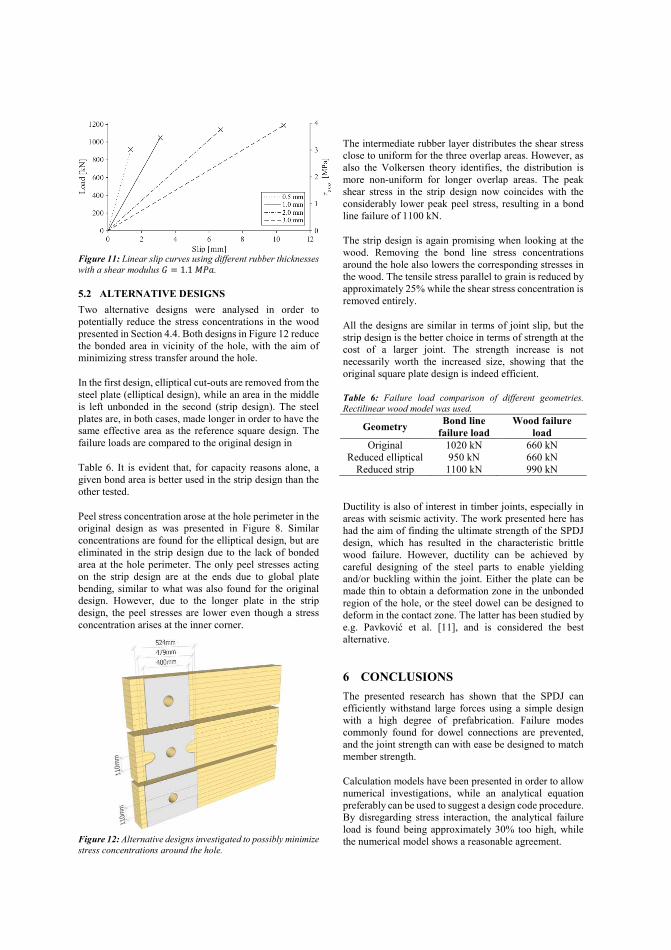
Figure 11: Linear slip curves using different rubber thicknesses with a shear modulus � = 1.1���.
5.2 ALTERNATIVE DESIGNS
Two alternative designs were analysed in order to potentially reduce the stress concentrations in the wood presented in Section 4.4. Both designs in Figure 12 reduce the bonded area in vicinity of the hole, with the aim of minimizing stress transfer around the hole.
In the first design, elliptical cut-outs are removed from the steel plate (elliptical design), while an area in the middle is left unbonded in the second (strip design). The steel plates are, in both cases, made longer in order to have the same effective area as the reference square design. The failure loads are compared to the original design in
Table 6. It is evident that, for capacity reasons alone, a given bond area is better used in the strip design than the other tested.
Peel stress concentration arose at the hole perimeter in the original design as was presented in Figure 8. Similar concentrations are found for the elliptical design, but are eliminated in the strip design due to the lack of bonded area at the hole perimeter. The only peel stresses acting on the strip design are at the ends due to global plate bending, similar to what was also found for the original design. However, due to the longer plate in the strip design, the peel stresses are lower even though a stress concentration arises at the inner corner.
Figure 12: Alternative designs investigated to possibly minimize stress concentrations around the hole.
The intermediate rubber layer distributes the shear stress close to uniform for the three overlap areas. However, as also the Volkersen theory identifies, the distribution is more non-uniform for longer overlap areas. The peak shear stress in the strip design now coincides with the considerably lower peak peel stress, resulting in a bond line failure of 1100 kN.
The strip design is again promising when looking at the wood. Removing the bond line stress concentrations around the hole also lowers the corresponding stresses in the wood. The tensile stress parallel to grain is reduced by approximately 25% while the shear stress concentration is removed entirely.
All the designs are similar in terms of joint slip, but the strip design is the better choice in terms of strength at the cost of a larger joint. The strength increase is not necessarily worth the increased size, showing that the original square plate design is indeed efficient.
Table 6: Failure load comparison of different geometries. Rectilinear wood model was used.
Geometry Bond line
failure load Wood failure
load Original 1020 kN 660 kN
Reduced elliptical 950 kN 660 kN Reduced strip 1100 kN 990 kN
Ductility is also of interest in timber joints, especially in areas with seismic activity. The work presented here has had the aim of finding the ultimate strength of the SPDJ design, which has resulted in the characteristic brittle wood failure. However, ductility can be achieved by careful designing of the steel parts to enable yielding and/or buckling within the joint. Either the plate can be made thin to obtain a deformation zone in the unbonded region of the hole, or the steel dowel can be designed to deform in the contact zone. The latter has been studied by e.g. Pavković et al. [11], and is considered the best alternative.
6 CONCLUSIONS
The presented research has shown that the SPDJ can efficiently withstand large forces using a simple design with a high degree of prefabrication. Failure modes commonly found for dowel connections are prevented, and the joint strength can with ease be designed to match member strength.
Calculation models have been presented in order to allow numerical investigations, while an analytical equation preferably can be used to suggest a design code procedure. By disregarding stress interaction, the analytical failure load is found being approximately 30% too high, while the numerical model shows a reasonable agreement.

Analysis of alternative designs indicate that the original square plate design is not only simple to manufacture, but also an efficient shape. However, the ratio between load bearing capacity and bonded area can be increased if the presented strip design is used.
The rubber foil adhesive joint can typically be used whenever a strong adhesive bond line is required. The SPDJ is one interesting application that the technique enables, but many more are possible. Ongoing studies aim to determine fundamental properties of the rubber foil adhesive joint, such as strength characteristics and long-term behaviour.
ACKNOWLEDGEMENT We gratefully acknowledge the financial support provided by the Swedish research council Formas through grant 2012-879.
REFERENCES
[1] European Committee for Standardization (CEN), EN 1995-1-1:2004: Eurocode 5: Design of Timber structures, Brussels, Belgium, 2004.
[2] B. Bohannon, “Prestressed laminated wood beams,” Forest products lab, Madison, Wisconsin, 1964.
[3] K. B. Borgin, G. F. Loedolff and G. R. Saunders, “Laminated wood beams reinforced with steel strips,” Structural Divison, vol. 94, no. 7, pp. 1681-1706, 1968.
[4] R. E. Rowlands, R. P. Van Deweghe, T. L. Laufenberg and G. P. Kreuger, “Fiber-reinforced wood composites,” Wood abd Fiver Science, vol. 18, no. 1, pp. 39-57, 1986.
[5] H. Min-juan and L. Hui-fen, “Comparison of glulam post-to-beam connections reinforced by two different dowel-type fasteners,” Construction and Building Materials, vol. 99, pp. 99-108, 2015.
[6] D. F. Windorski, L. A. Soltis and R. J. Ross, “Feasibility of fiberglass-reinforced bolted wood connections,” Forest Products Laboratory, Madison, Wisconsin, 1997.
[7] P. Haller, T. Birk, P. Offermann and H. Cebulla, “Fully fashioned biaxial weft knitted and stitch bonded textile reinforcements for wood connections,” Composites: Part B , vol. 37, pp. 278-285, 2006.
[8] P. J. Gustafsson, “Tests of Full Size Rubber Foil Adhesive Joints,” Lund University, 2007.
[9] R. Crocetti, M. Axelson and T. Sartori, “Strengthening of large diameter single dowel joints,” SP Technical Research Institute of Sweden, 2010.
[10] P. Kobel, “Modelling of Strengthened Connections for Large Span Truss Structures,” Master Thesis, Lund University, 2011.
[11] K. Pavkovic, V. Rajcic and M. Haiman, “Large diameter fastener in locally reinforced and non-reinforced timber loaded perpendicular to grain,” Engineering Structures, vol. 74, pp. 256-265, 2014.
[12] H. Yang, R. Crocetti, G. Larsson and P.-J. Gustafsson, “Experimental study on innovative connections for large span timber truss structures,” in IASS working groups 12 + 18 International Colloquium 2015, Tokyo, Japan, 2015.
[13] O. Volkersen, “Die Nietkraftverteilung in zugbeanspruchten Nietverbindungen mit konstanten Laschenquerschnitten,” Luftfahrtvorschung, vol. 15, pp. 41-47, 1938.
[14] S. Tsai and E. Wu, “A general theory of the strength of anisotropic materials,” Journal of Composite Materials, vol. 5, pp. 58-80, 1971.
[15] E. Serrano, Adhesive Joints in Timber Engineering, modelling and testing of fracture properties, Lund, 2000.
[16] K. Berblom Dahl, Mechanical properties of clear wood from Norway spruce, ISBN 978-82-471-1911-2 ed., Trondheim, Norway: Norwegian University of Science and Technology, 2009.
[17] C. B. Norris, Stength of orthotropic materials subjected to combined stresses, Madison: U.S. Department of Agriculture, 1962.
[18] P.-E. Austrell, “Modelling of elasticity and damping for filled elastomers,” Lund University, Lund, 1997.