‘high’ achievers? cannabis access and academic …ftp.iza.org/dp8900.pdf‘high’ achievers?...
TRANSCRIPT

DI
SC
US
SI
ON
P
AP
ER
S
ER
IE
S
Forschungsinstitut zur Zukunft der ArbeitInstitute for the Study of Labor
‘High’ Achievers?Cannabis Access and Academic Performance
IZA DP No. 8900
March 2015
Olivier MarieUlf Zölitz
‘High’ Achievers? Cannabis Access and
Academic Performance
Olivier Marie ROA, Maastricht University,
CEP, IZA and CESifo
Ulf Zölitz IZA and Maastricht University
Discussion Paper No. 8900 March 2015
IZA
P.O. Box 7240 53072 Bonn
Germany
Phone: +49-228-3894-0 Fax: +49-228-3894-180
E-mail: [email protected]
Any opinions expressed here are those of the author(s) and not those of IZA. Research published in this series may include views on policy, but the institute itself takes no institutional policy positions. The IZA research network is committed to the IZA Guiding Principles of Research Integrity. The Institute for the Study of Labor (IZA) in Bonn is a local and virtual international research center and a place of communication between science, politics and business. IZA is an independent nonprofit organization supported by Deutsche Post Foundation. The center is associated with the University of Bonn and offers a stimulating research environment through its international network, workshops and conferences, data service, project support, research visits and doctoral program. IZA engages in (i) original and internationally competitive research in all fields of labor economics, (ii) development of policy concepts, and (iii) dissemination of research results and concepts to the interested public. IZA Discussion Papers often represent preliminary work and are circulated to encourage discussion. Citation of such a paper should account for its provisional character. A revised version may be available directly from the author.

IZA Discussion Paper No. 8900 March 2015
ABSTRACT
‘High’ Achievers? Cannabis Access and Academic Performance* This paper investigates how legal cannabis access affects student performance. Identification comes from an exceptional policy introduced in the city of Maastricht which discriminated legal access based on individuals’ nationality. We apply a difference-in-difference approach using administrative panel data on over 54,000 course grades of local students enrolled at Maastricht University before and during the partial cannabis prohibition. We find that the academic performance of students who are no longer legally permitted to buy cannabis increases substantially. Grade improvements are driven by younger students, and the effects are stronger for women and low performers. In line with how THC consumption affects cognitive functioning, we find that performance gains are larger for courses that require more numerical/mathematical skills. We investigate the underlying channels using students’ course evaluations and present suggestive evidence that performance gains are driven by improved understanding of material rather than changes in students’ study effort. JEL Classification: I18, I20, K42 Keywords: marijuana, legalization, student performance Corresponding author: Ulf Zölitz IZA P.O. Box 7240 53072 Bonn Germany E-mail: [email protected]
* We thank Dan Black, Daniel Hamermesh, Brian Jacob, Daniel Mejia, Rosalie Pacula, Nicolas Salamanca, participants of the 2014 NBER-SI, the 4th AL CAPONE meeting and seminar participants at CPB, The Hague, IZA Bonn, NED Amsterdam, Northwestern University, RAND and the University of Chicago for useful comments and suggestions. We further thank Joël Castermans, Sanne Klasen and Kim Schippers from the SBE Scheduling Department, Sylvie Kersten from the SBE Exams Office, and Paul Jacobs from the Educational Research and Development Department for providing data and valuable background information. Marie is grateful for financial support for this research from the Netherlands Organization for Scientific Research (NWO Veni 451.12.005).
- 1 -
1 Introduction
Public policy and opinion regarding the legalization of cannabis has reached a tipping point.
In the US, 20 states have now passed laws allowing its medical use, and 14 others have taken
steps to decriminalize consumption by some degree. In 2014, Colorado and Washington
legalized sale and possession of cannabis for recreational use after a popular vote. Alaska and
Arizona should follow suit in 2015, and several other states are currently reconsidering their
cannabis laws. Uruguay is planning to become the first nation in the world to fully legalize all
aspects of the cannabis trade including cannabis cultivation, wholesale, retail and
consumption. The Americas are starting to „catch up‟ with the more liberal approach to soft
drug policy in countries such as the Netherlands, where cannabis consumption has been
decriminalized for almost four decades. Despite this development, little is known about many
of the – perhaps unintended – consequences of legalization. This paper contributes to the
ongoing legalization discussion by showing that a change in legal cannabis access strongly
affected student performance through adjustments in their consumption behavior.
Proponents of cannabis legalization have put forward the general failure of the long
running „war on drugs‟ and the huge cost it imposes on the criminal justice system as an
argument in favor of finding alternatives to drug prohibition (Donohue 2013). Also,
legalization would undermine illegal markets and protect low level users from associated
risks, such as contact with dealers that sell other types of drugs. Opponents of cannabis
legalization often argue that making access to cannabis easier and more acceptable via
legalization could push more marginal individuals to become consumers. This could in turn
lead to an increase in the number of individuals suffering from adverse health, educational,
and labor market outcomes associated with regular cannabis use (Cobb-Clark et al. 2015; Hall
2015 and Van Ours and Williams, 2015).
While both sides of the legalization debate make plausible arguments, the actual effect
that policies which change cannabis access have on consumption decisions and on outcomes
- 2 -
affected by consumption remains largely ambiguous. The lack of clear empirical evidence is
the result of identification problems which mostly prevent a causal interpretation of most
existing results. The principal issue is that drug policy changes are unlikely to be implemented
exogenously and are usually the result of a longer process of societal change. When policy
changes take place, they usually affect all individuals at the same time, which makes it
impossible to fully disentangle treatment effects from underlying time trends in consumption
– trends which may have caused the policy change in the first place. These issues cast doubt
on the validity of results obtained from studies using cohort or state level variation, where the
necessary ceteris paribus conditions for identification often do not hold.1
In this paper, we exploit a unique natural experiment to obtain causal estimates of the
effect of a change in legal cannabis access on college student performance. We exploit a
temporary policy change in the city of Maastricht in the Netherlands that locally restricted
legal access to cannabis based on nationality. By looking at changes in university
achievements of students who were potentially affected by the policy against those of their
peers who were unaffected, we isolate the impact of the policy on a measure of individual
productivity which is likely to be strongly affected by cannabis consumption. Importantly,
students were not the intended target of the discriminatory policy, which was originally
introduced to combat drug tourism in the city. This “partial-prohibition” allows us to apply a
difference-in-difference approach across nationality groups of students observed before and
during the discriminatory policy. To eliminate concerns about unobserved heterogeneity, we
exploit the panel nature of our data and apply student fixed effects to identify performance
changes resulting from the „cannabis prohibition‟ using within-individual variation. From a
medical perspective, there is little doubt about the negative short run effects of cannabis
consumption. Studies have repeatedly shown that cognitive functions are strongly impaired by 1 The review of Pacula and Sevigny (2014) discusses a number of recent articles using state level difference-in-
differences approaches to assess how the introduction of medical cannabis laws in the US affect consumption
behaviour and other outcomes. The review report mixed findings and highlights multiple reasons (e.g., changes
in police force behavior) for why results might not have a causal interpretation.
- 3 -
cannabis consumption in the short run.2 We therefore expect changes in cannabis
consumption behavior, brought about by the access restriction scheme studied here, to be
reflected in the academic performance of the students affected. This rationalizes our reduced
form approach, which looks directly at student productivity, rather than (unavailable) changes
in consumption, as an outcome.3
Our main finding is that the temporary restriction of legal cannabis access had a strong
positive effect on course grades of the affected students. These individuals performed, on
average, 9 percent of a standard deviation better and were 5.4 percent more likely to pass
courses when they were banned from entering cannabis-shops („coffeeshops‟). Importantly,
we do not detect a change in dropout probability, which could have created complex
composition effects. Sub-group analysis reveals that these effects are somewhat stronger for
women than men and that they are driven by younger and lower performing students. This can
be explained by baseline differences in consumption rates or differences in marginal
compliance with the prohibition.4 We also find some evidence for a social spillover of the
cannabis restriction: Treated students in sections with a higher fraction of treated peers
become marginally more likely to pass their courses. We however reject that teachers‟ legal
access to cannabis has an impact on their students‟ performance. Finally, both time and
nationality placebo analyses reassure us that the effect on performance is really a reflection of
the policy effect.
2 Bossong et al. (2012, 2013) carry out randomized control trials where subjects have to carry simple cognitive
task and find that “performance was impaired after THC administration, reflected in both an increase in false
alarms and a reduction in detected targets.” 3 This reduced form approach avoids serious measurement problems with usual measures of drug consumption,
since it does not have to rely on self-reported consumption or police seizures which are likely to be correlated
with changes in the legal status of this substance. Another highly relevant short run outcome that might be
affected by changes in soft drug access policy is criminal activity. This is perhaps not as „clean‟ an externality as
productivity since it is the sum of changes in behaviour of all agents concerned: consumers, dealers, and the
police. Adda, McConnell, and Rasul (2014) are the only ones to have attempted to disentangle the various
channels from this complex relationship. 4 It might simply be more costly for women to engage in the illegal commerce that is necessary to obtain access
during the “cannabis-prohibition”.

- 4 -
In order to assess whether the changes in performance we detect really stem from
change in students‟ cannabis consumption, we test whether our results are consistent with
what is known about the impact of THC on human brain functioning and learning. First,
previous research has documented that cannabis consumption most negatively impacts
quantitative thinking and math-based tasks (Block and Ghoneim [1993] and Pacula [2003]).
Therefore, we split all courses depending on whether they are described as requiring
numerical skills or not. We then test if such skills are affected differentially and find that the
policy effect is five times larger for courses requiring numerical/mathematical skills – a result
in line with the existing evidence on the association between cannabis use and cognitive
functioning. Second, to provide some suggestive evidence on the underlying channels, we
make use of evaluations which students are asked to fill in for each course. In these
evaluations, students report their own level of effort, overall understanding, and the perceived
quality of the course and teachers. We find no change in reported study hours, which suggests
that we can eliminate effort adjustments as one channel of our results. We do find an increase
in the reported “overall understanding” of the course content when the policy was in place.
Finally, we put our main finding in perspective with the estimated impact of other
interventions on college student performance. Most relevant is that our change in legal
cannabis access has almost exactly the same effect as students reaching the age when alcohol
consumption is permitted in the US (Carrel, Hoekstra, and West [2011] and Lindo, Swensen
and Waddell [2013]). To better interpret our results, we carried out a survey among current
students at Maastricht University which revealed that over half had consumed cannabis in the
past year. Using this to proxy the size of the potentially treated population and applying
various compliance rates suggests that the prohibition policy had a very large and positive
impact on student performance.
This paper therefore presents, to our knowledge, the first solid causal evidence that a
legal change in access to cannabis had a strong short run impact on productivity. It is however

- 5 -
important to note that we are only looking at a very specific outcome and that our results are
only a small part of the multi-dimensional societal cost-benefit analysis that should drive drug
policy decision making.
The remainder of the paper is structured as follows: Section 2 provides general
information on Dutch cannabis policy and presents the details of the particular change in
cannabis access that occurred in Maastricht. Section 3 discusses the data on student
performance that we collected at Maastricht University. Section 4 describes our empirical
strategy and the various specifications we will consider. Section 5 presents the main
estimation results and carries out sensitivity analysis and placebo tests. Section 6 explores
underlying mechanisms and interprets the findings. Section 7 gives concluding remarks.
2 Background: Cannabis Access in the Netherlands & the Maastricht Case
2.1 The Dutch Drug Policy Approach
For almost four decades now, the sale and consumption of cannabis for recreational use has
been legal in the Netherlands. The 1976 Opium law, which forms the basis of the Dutch
„tolerance‟ policy, was introduced to “minimize harm done to users and their environment”
(McCoun and Reuters, 1997). Practically, possession of up to 30g of cannabis (1.06 ounces)
has not been a prosecutable offence since this law was passed. The government still aims to
decrease demand by means of preventive campaigns and by taking legal measures against any
disturbance to public order caused by cannabis sale or consumption. Although personal
recreational soft-drug use is tolerated, all hard drug use is illegal, and production and illegal
sale of hard and soft drugs are a severe offense and can result in jail sentences. Cannabis is
usually consumed mixed with tobacco and smoked in “joints” or pipes in the Netherlands.

- 6 -
The average concentration of THC in the cannabis sold in cannabis-shops was around 16.5
percent, which is almost twice as much as in cannabis confiscated in the US.5
Through legal channels, cannabis can be bought exclusively via cannabis-shops, which
are strictly regulated and can only function with a license granted by the municipal
authorities. Cannabis-shops are not allowed to sell more than 5 grams per person per day, and
they are not allowed to have more than 500 grams at the shop premise. Furthermore,
cannabis-shops are not allowed to sell any hard drugs, advertise their products or sell their
products to people under the age of 18. Cannabis-shops can be shut down temporarily or
permanently by the license issuing municipality if they fail to meet the regulation
requirements or if they are perceived as being responsible for excessive public disturbance.
2.2 The Maastricht Situation and the Policy Change
Maastricht is the southernmost large city in the Netherlands. Due to its geographical
proximity to Belgium, Germany, Luxembourg and especially France, it has for many years
attracted a great deal of „drug tourists‟, who come solely to buy (and consume) cannabis
legally. As a result, it has a high density of cannabis-shops per population, second only to
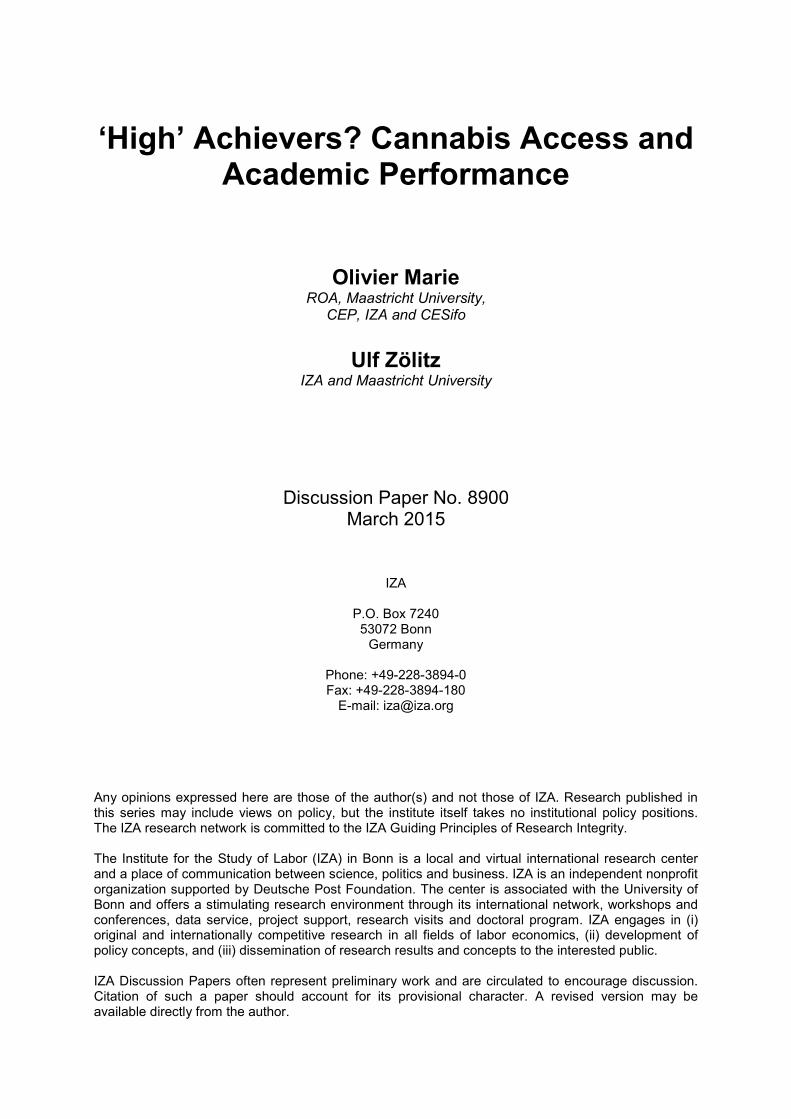
Amsterdam, a city infamous for international cannabis-tourism. Figure 1 presents a map
which depicts the cannabis-shop density of the 443 municipality-districts of the Netherlands.
Maastricht (circled) is located at the very south-east of the map in the region encased between
Belgium and Germany. The city has 13 cannabis-shops for a population of about 122,000
inhabitants. A substantial part of the city‟s population are students: There are in total about
16,000 individuals that study at Maastricht University in any given year, and more than half
of these students are non-Dutch nationals. Figure 1 also shows that not all Dutch cities (only
one-third) have cannabis-shops and that the nearest one outside of Maastricht is more than 25
kilometers away.
5 UNODC (2012) reports an average THC strength of 8.6 percent in confiscated cannabis.

- 7 -
Starting from October 1st, 2011, the Maastricht association of cannabis-shop owners
(VOCM), under pressure from local authorities, introduced a new policy that only allowed
specific nationalities to buy cannabis on their premises. The aim of this policy was to reduce
negative externalities arising from drug tourism, which the city argued constituted a public
nuisance that could lead to the closure of most establishments. The policy targeted „bad
tourists‟, mostly individuals from France and Luxembourg, which the city council „identified‟
as the populations creating the most nuisance and imposing the highest negative externalities
on city residents. In a compromise, the VOCM convinced the municipality to maintain access
to their cannabis-shops not only exclusively to Dutch citizens but also to individuals from the
two neighboring countries, Germany and Belgium, to attempt to solve the drug-tourism
problem. Retaining access rights for these three nationalities was crucial for the Maastricht
establishments as these together represented on average almost 90 percent of their customers.
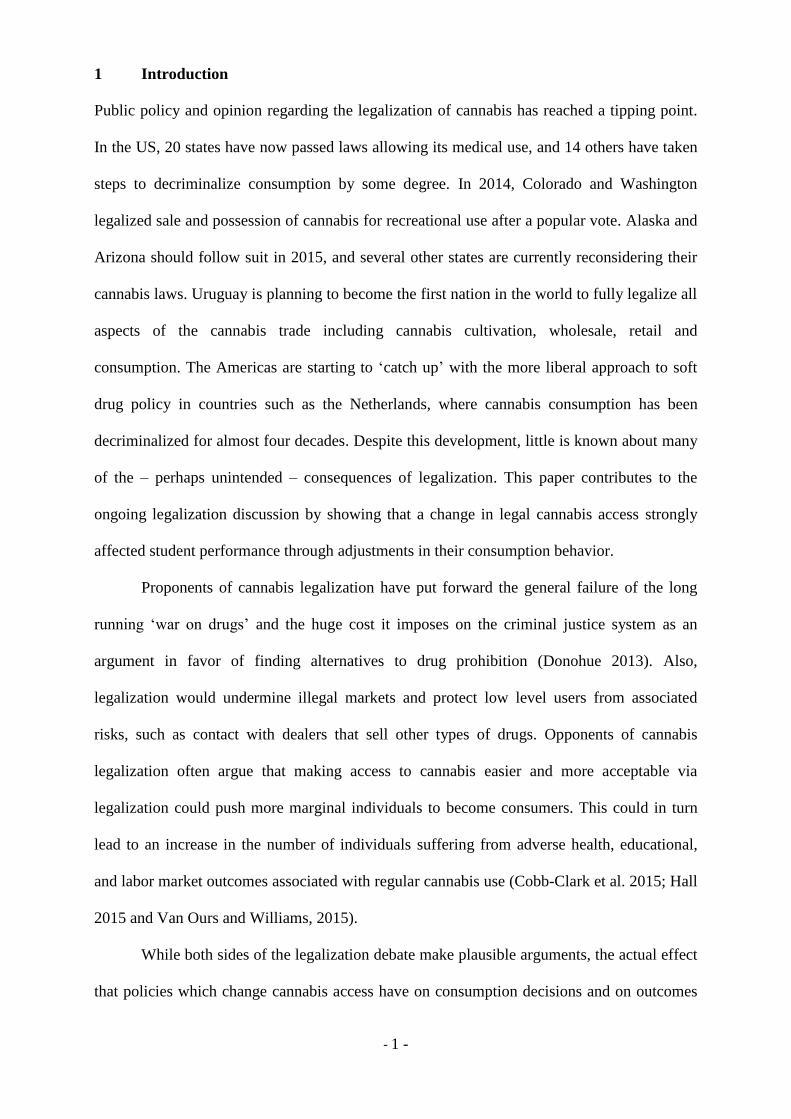
The new policy was locally announced by retailers to inform users about two months before
its official start.6 Figure 2 shows the (very discriminatory) poster that announced the policy
change which cannabis-shops were required to put up on the front widow of their premises.
From October 1st, 2011, anyone who was not able to present a valid Dutch, German or
Belgian form of identification was refused entry to cannabis-shops. In Maastricht, all
establishments have always been required to scan such documents when costumers enter to
insure compliance with the minimum legal age requirement, and this was now this was also
used to enforce the nationality criteria.
The policy that restricted access by nationality was in place for about seven months.
From May 1st until around June 15
th, all cannabis-shops in Maastricht went on strike because
of the planned introduction of a new scheme called the weed-pass (“wietpas”) by the
municipality. The new policy was applied to the southern part of the Netherlands and required 6 The policy was announced and implemented with a relatively short notice. Therefore student application or
enrolment decisions for the academic year 2011/12 could not have been affected by the policy change. Since this
information was not publicly available at the time when these decisions were taken, there is no reason to believe
that the student composition of Maastricht University changed due to the policy change.

- 8 -
everyone who wanted to maintain access to cannabis-shops to register as a cannabis user at
the local municipality. Registering for the weed-pass was available to any person residing in
the Netherlands, independent of nationality. Around mid-June, the cannabis-shop strike
ended, and after this, only residents with a valid weed-pass were allowed access to cannabis-
shops. We consider the strike period as a time when all individuals had limited access in our
analysis but do not study the period after the weed-pass was introduced as it is impossible for
us to identify which individuals are affected. Table 1 summarizes the timing of the policy
changes and puts it in perspective with teaching and exam periods at Maastricht University.
We describe this student performance data in detail in the next section.
3 Data
3.1 Student Performance Data
The School of Business and Economics (SBE) is one of the largest schools of Maastricht
University. There are, on average, about 4,200 students enrolled at the SBE in the Bachelor,
Master and PhD programs at any time. We obtained administrative information on all
undergraduate students enrolled at the SBE during the academic years 2009/2010, 2010/2011
and 2011/2012 from the school‟s exam office. In total, we have 57,903 course results from
4,323 different individuals in our main sample who are, over this period, in any of the three
years it takes to complete a bachelor‟s degree. A little more than a third of students are
female, 52 percent are German, 33 percent Dutch, 6 percent Belgian and the remaining 8
percent have a different nationality (“other nationality”). The academic year at Maastricht
University is divided into four regular teaching periods of two months each and two shorter
skills periods of two weeks each. In total, there are 6 teaching periods per academic year for
which we have course outcome information. Students take, on average, two courses at the
same time in the regular periods and one course in the shorter skills periods. The SBE

- 9 -
examinations office provided data on student grades and on some basic student
characteristics: gender, age and nationality.
The Dutch university grading scale ranges from 1 to 10, with 5.5 usually being the
lowest passing grade. The final course grade is often calculated as the weighted average of
multiple graded components, such as the final exam grade, participation grade, presentation
grade and/or midterm paper grade. The graded components and their respective weights differ
by course, with most courses giving most of the weight to the final exam grade. We do not
observe the individual components of the final grade separately. If the final course grade of a
student after taking the final exam is lower than 5.5 (5 in the first year), the student fails the
course and has the possibility to retake the exam a second time. We observe final grades after
the first and second attempt separately. For our analysis, we only use first attempt grades
since the second attempts take place about two months later than the original examinations
and may not be comparable to the first examinations. From this data, we create three main
performance measure outcomes for our analysis: standardized grades, course passing, and
course dropout.7
3.2 Further Data Sources
3.2.1 Numerical vs. Non-Numerical Courses?
The literature linking cannabis and cognitive performance has shown that numerical tasks are
substantially more affected than non-numerical ones. A challenge to test this was to classify
the 177 different courses available to students at the undergraduate level on whether they
required numerical skills or not. To do so, we looked into the description of every single
course, which is publically available online (http://code.unimaas.nl/), and classified these as
7 Course dropouts are defined as students who registered for a course but either decided to drop the course at
some stage throughout the teaching period, who did not fulfil their attendance requirements, or did not show up
for the final exam. From the data, it is not possible to distinguish between these types of dropouts.

- 10 -
being numerical if the following words appeared in it: math, mathematics, mathematical,
statistics, statistical, theory focused. This exercise resulted in 56 courses being classified as
numerical and 121 as non-numerical. As courses requiring numerical skills are more often
part of the compulsory curriculum of a degree, we end up with about 35 percent of course-
grade observations being categorized as numerical. In section 6, we split our sample along
this numerical and non-numerical course line to test if we are indeed picking up the effect of
cannabis consumption.
3.2.2 Student Course Evaluations
In addition to the scheduling and grade data, we also obtained data on students self-assessed
course evaluations, which we match to the grade data using the individual student ID. We use
these student course evaluations to provide evidence on some of the channels underlying our
results. Two weeks before the exam, students are invited by email to evaluate the courses they
are currently taking in an online questionnaire. Students receive up to three email reminders,
and the questionnaire closes before the day of the exam. Students are ensured that their
individual answers will not be passed on to anyone involved in the respective course.
Teaching staff receive no information about the evaluation before they have submitted the
final course grades to the examination office.8 The exact length and content of the online
questionnaires differ by course, but they typically contain 19-25 closed questions and two
open questions. For our analysis, we use the 16 core questions which are asked in most
courses.9 These standard questions ask students to evaluate different course aspects like
teacher performance, group functioning, course material, and general course organization, and
to state the hours they spent studying outside of the course. We group these questions into 5
8 This “double blind” procedure is implemented to avoid any of the two parties retaliating from negative
feedback with lower grades or evaluations. 9 Table A1 in the appendix shows the evaluation questions which we tried to group into different mechanism
categories and which ones we group together to explore potential channels that explain changes in student
performance.

- 11 -
main categories to explore the underlying mechanism which could explain our results: “hours
worked”; “feel stimulated”; “functions well”; “understand better”; and “quality improved”.
3.3 Student Performance Descriptive Statistics
Table 2 presents the main descriptive statistics for all students in column (1), for Dutch,
German and Belgian (DGB) students in column (2) and for all other students (Non-DGB) in
column (3). Column (4) reports differences between these two sub-groups, and the last two
columns indicate minimum and maximum values for each of the variables. The Non-DGB
students display on average worse performance on all relevant indicators. They are somewhat
younger and are more likely to be female than their DGB peers. The fact that these differences
are always statistically significant underlines the importance of applying a difference-in-
differences approach rather than performing a naïve estimation which would not account for
these baseline disparities.
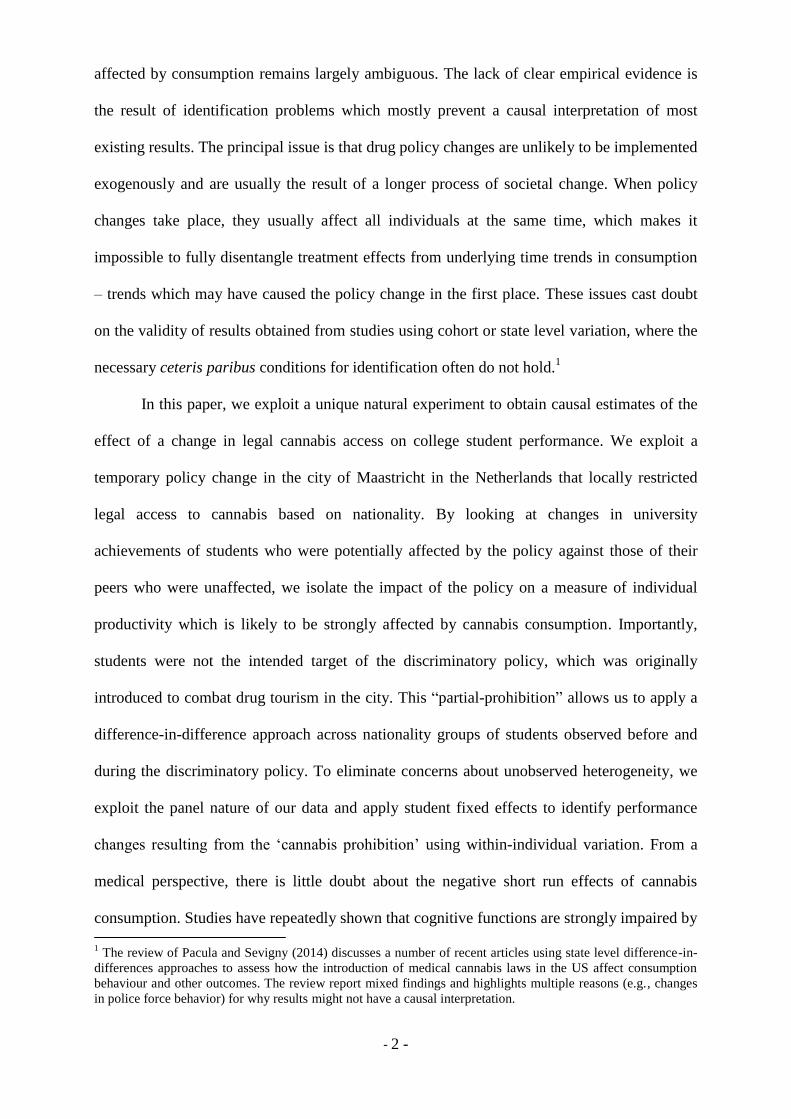
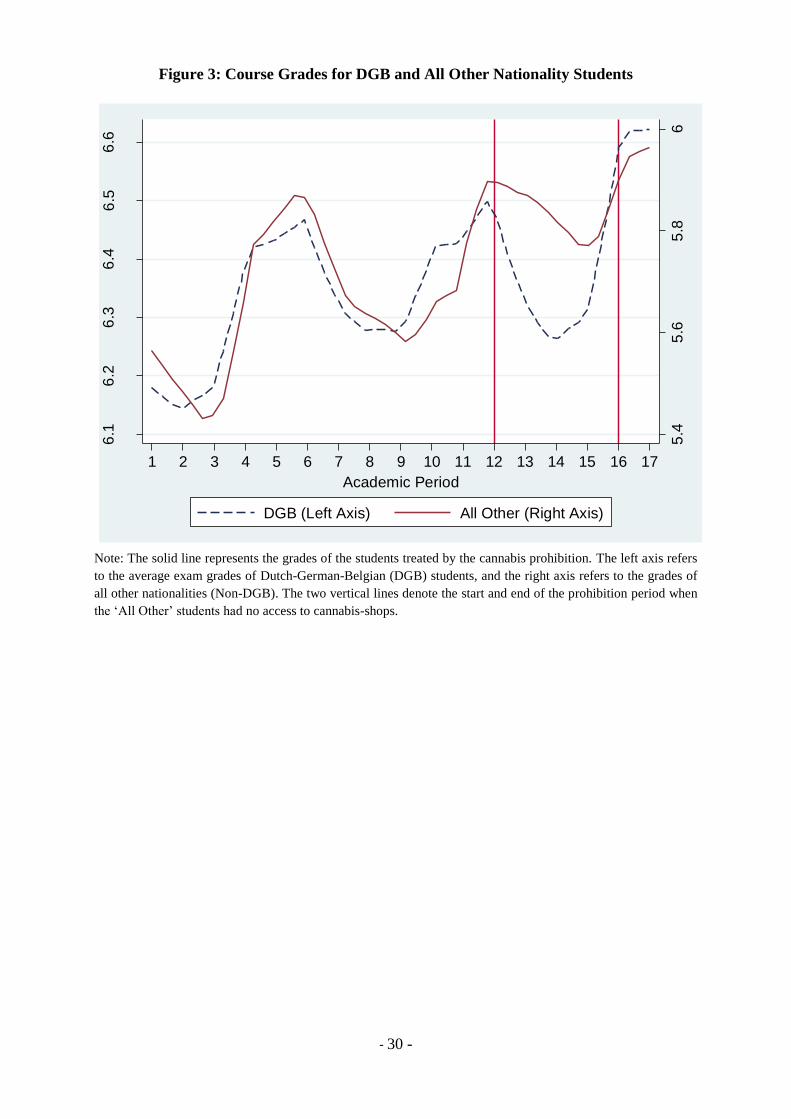
Figure 3 gives us the first glimpse into the existence of an effect of cannabis access
restriction on course results. The figure shows course grades for treated and non-treated
students over the 17 time periods we observe. To capture differences in levels between the
two groups, we use two axes. The two vertical lines mark the start and the end of the
discrimination policy that affected access of the Non-DGB students. We first note that there is
substantial cyclicality in exam results. Importantly, the exam results of both groups of
students clearly trace each other up to the period when the Non-DGB students are no longer
allowed to buy cannabis in cannabis-shops. This is a good illustration of the common pre-
trend assumption which is necessary to validate our difference-in-differences approach. After
the policy introduction, Non-DGB students appear to suddenly do much better than their DGB
peers, which is a first hint that the policy might have had a positive effect on the performance

- 12 -
of those who could no longer buy cannabis legally. We now present the empirical strategy we
will use to formerly identify the strength of this relationship causally.
4 Empirical Strategy
In order to estimate the effect of legal cannabis access on student performance, we exploit a
unique natural experiment that temporarily discriminated legal access to cannabis based on
nationality. We apply a difference-in-differences approach across time and nationality groups.
This means that we will obtain reduced form estimates of how the policy affects changes in
student performance rather than (unavailable) changes in student consumption.10
The main outcome variables of interest to measure the impact of the cannabis access
policy on student performance are standardized course grades and course passing rates. To
test for compositional changes, we also assess whether dropout probabilities are affected.
These outcomes are indicated by the dependent variable Y in equation (1), which describes a
simple difference-in-difference model:
, (1)
where NonDGB is a dummy indicating whether a student is of another nationality than Dutch,
German, or Belgian; Discrim is equal to one for the period when the discriminatory cannabis-
shop access policy was in place (and zero otherwise); and the interaction of these two terms
enables us to get an estimate of , the coefficient of interest. Subscript i and t denote,
respectively, individual and time, α is a constant, and ε an error term. To this basic
10
The effect on performance is perhaps more policy relevant since changes in cannabis consumption itself might
be irrelevant if they do not lead to important negative externalities for society. This reduced form approach also
avoids serious measurement problems with usual measures of drug consumption since we do not have to rely on
self-reported consumption or police seizures, which are likely to be correlated with changes in the legal status of
this substance.

- 13 -
specification we can also add gender and age in months to see whether adding observable
individual characteristics alter results.11
We can further improve on this model by gradually adding a number of fixed effects
layers to the estimation to account for unobserved course and student heterogeneity. First, we
include the total number of courses taken by a student in each period, NCourses, and course
fixed effects for the = 177 different courses available to students at the bachelor level at
the SBE. Second, we exploit the panel nature of our data and replace the common intercept α
with a student specific fixed effect . This model is shown in equation (2):
(2)
This within-individual estimation approach should take care of all remaining time
invariant unobserved individual characteristics which could still not be accounted for in our
previous models and could bias our estimates of .
Figure 3 shows that there was substantial seasonality and a general upward trend in
exam results, thus time effects might still remain as a potential confounder. The graph clearly
indicates that student grades were improving over the 18 periods observed and that, within
academic years, there was much cyclicality across the 6 study periods. Our final model will
also include period dummies and a cubic time trend to account for the cyclicality. This model
is shown in equation (3) below.
(3)
11
Later we also perform subgroup analyses along these dimensions to test whether different responses to the
policy differ along individual characteristics.

- 14 -
This will be our preferred specification to interpret our results on the impact of the
discriminatory cannabis access policy on student performance measures. Using individual
student fixed effects will rule out that the observed treatment effect of the policy is driven by
a change in the student composition. We later use two modified versions of model (3) to
investigate the potential effect of other individuals‟ treatment status on own performance. We
will do this by including an interaction between the main policy effect with, in turn, the
proportion of peers in the same class who are treated and a dummy of the teaching staff being
DGB or not.
We again use model (3) to run placebo tests to check that the estimated effects are
indeed causal and not driven by spurious correlations. Our first placebo analysis will be a
“placebo in time,” which switches the policy “on” one year before it was actually put in place.
We also run a “placebo in nationality,” where we consider Belgian students (which are
statistically the most similar to Non-DGB students) as the ones with restricted access to
cannabis-shops. We also obtain distinct policy effect for the numerical and non-numerical
courses. Finally, we present further results using course evaluation surveys that follow this
within-student difference-in-difference set up.
5 Main Results
5.1 Average Policy Effect
Table 3 reports the estimates of how the policy change affected standardized student grades.
We start with the most basic specification of equation (1) in column (1) of the table and then
successively build up the model with additional controls and fixed effects in columns (2) to
(5). The main coefficients of interest on NonDGB*Restriction are all positive and statistically
significant. They show that the students who could no longer buy cannabis legally obtained
relatively better course grades during the time when the policy was in place. The coefficients
actually become slightly larger as we add more controls, reaching .093 of a standard deviation

- 15 -
for our most complete specification in column (5), which accounts for unobserved individual
heterogeneity and time trends.
Table 4 restates this last result in the first column and then extends our analysis to two
further performance measures: “passing the course” and “course dropout”. Changes in the
probability of passing a class are important since it will indicate whether the grade effect is
concentrated at the top or bottom end of the grade distribution. An effect on passing
probabilities might be economically more important than changes in grades since students that
fail classes have to re-take the exam or course at a later time, which may result in delayed
graduation or lead to failing to obtain a degree. We find a 4 percentage point increase in pass
rates for Non-DGB students when the policy is in place, a 5.4 percent improvement from the
baseline pass rate of 74.6 percent. The coefficient on the probability of dropping out is small
and not statistically significant. This is an important result since it indicates that treated
individuals are as likely to complete courses during the policy period as before. It also
simplifies the interpretation of our results as we can reject compositional effects which could
arise if we would not observe the performance of the same individuals across time.
5.2 Sensitivity by Sub-Groups
One way to get a better sense of where legal access to cannabis really „bites‟ is to consider
differences in the policy impact on the outcomes of different population sub-groups. When
interpreting coefficients for different subgroups, one has to keep in mind that these may not
only differ in their baseline propensity to consume cannabis, but also that they may differ in
their response and compliance to the policy. Table 5 shows estimation results for the sample
split by gender, age, and performance level.
The first intriguing finding is that the course grade effect seems to be much stronger
for female students (.126 compared to .069 of a standard deviation). Although this difference
is smaller when looking at the probability of passing courses, which changes by 4.7 percent

- 16 -
for males and 5.6 percent for females because of differences in baseline pass rates. A reason
for this difference might be found in difference in responses to legal status of substances
across genders (Pacula, 1997) or even in stronger residual effects of cannabis consumption on
test performance (Pope et al, 1997). In our case, it is also probable that the marginal young
woman reacts much more negatively to having to switch to the illegal street market to
purchase drugs.
The age sample split across the median age of 20.6 years (when the individual was last
observed) reveals that all of the impact comes from relatively younger students. As age almost
perfectly maps with year of study in the three year bachelor degree, this indicates that the
performance improvements for no-access nationalities are only present in the first or second
year of enrollment. This is indicative of a maturity effect, with individuals above a certain age
threshold not changing consumption behavior as a result cannabis prohibition. Another
possible factor is that these individuals are in the third year of their degree and have mostly
established networks of DGB student with legal cannabis access who can supply them if
necessary.
Next we test whether low performers, defined as students with a pre-treatment GPA
below the median of 6.62, are affected differently than high performers (above median pre-
treatment GPA). The cannabis ban has a significant effect on the grades of high performers,
but this does not change their probability of passing a course – which is not surprising since
their baseline pass rate is already 94.5 percent. For low performers, however, there is a larger
grade effect, and crucially the policy also very strongly changed their likelihood of passing
courses, with an estimated 7.6 percent success rate increase. This is a substantial policy
relevant improvement since it affects a population who may benefit the most from marginal
changes in improvement in performance.
5.3 Spillovers from Peers and Teachers

- 17 -
In order to test for social multiplier effects of the policy change and affected university
instructors, we also test whether classroom peer composition and teacher nationality affected
student performance.
To assess the effect of treated peers, we create a variable which calculates the fraction
of treated other students (0 to 1) in each teaching group within each course.12
To test if the
classroom composition during the time of restricted cannabis access had an impact on own
performance, we interact the basic policy effect coefficient with the fraction of treated
students in each section. This measure should capture the “extra” effect on performance of
having more or less peers with cannabis access. The interaction and the main policy
coefficient are reported in the first two columns of Table 6 for standardized grades and
probability of passing a course. The estimated impact of peer composition on grades is
insignificant, but we do detect a marginal improvement in passing rates as the fraction of
treated peer in the section increases. The coefficient of .21 means that a 10 percent increase in
classmates that no longer have access to cannabis-shops increases the chance of passing by 2
percentage points. Interestingly, this spillover effect only exists for students who were
themselves affected by the policy change, which might reflect patterns of social interaction on
nationality lines inside and outside the classroom.
We also test whether student results improved because their section instructors are
now performing better after their own cannabis access was restricted. In the administrative
data we obtained, we can observe the teacher‟s nationality when it is a PhD student who is
teaching the class, which is the case for two-thirds of sections. We use this information to
form the same nationality groupings that we applied for students and test whether student
performance in those classes was affected by treatment status of the teacher.13
The last two
columns of Table 6 report the interaction of this dummy with the main policy effect and the 12
Courses at Maastricht University are organized in multiple teaching sections called “tutorials”. One section
usually contains about 10-15 students. Within courses, students are randomly assigned to sections (see Feld &
Zölitz 2014). 13
About one third of the university instructors have a non-DGB nationality.

- 18 -
main difference-in-differences coefficient itself. We find no evidence of a teacher treatment
effect, which is perhaps not surprising considering that results by age group had already
indicated that the performance of relatively older students were not affected by the drug
policy change.
5.4 Time and Nationality Placebos
We report the results from two falsification exercises in Table 7 which test for a potential
non-policy related impact on student performance if we change the time of its introduction or
the nationality of the individuals treated.
For the first falsification test, we generate a placebo policy by estimating equation (3)
with the treatment period artificially placed 1 year earlier than when cannabis access
restriction was actually introduced (dropping the policy period from the sample). The
coefficients on both grades and pass rate for this “placebo in time” are very small and
statistically insignificant. This confirms that we were not picking up some period specific
effect not accounted for in our previous specifications.
Next, we consider Belgian students (instead of non-DGB) as the ones who are
prohibited from entering and buying cannabis at cannabis-shops (dropping the other non-
Dutch nationalities actually treated from the sample). Students from Belgium are the closest
in terms of observable characteristics to the treated Non-DGB. Also in this second
falsification test, the coefficients on both measures of performance of this “placebo in
nationality” are small and non-significant. This further supports our claim that it is the policy
limiting legal cannabis access and not another unobserved event affecting certain types of
students during this period which improved student performance in the short run.
6 Underlying Mechanisms and Interpretation of Results

- 19 -
6.1 Mechanisms Driving the Findings
Our results quite clearly show that students who lost the right to buy cannabis legally
experienced important performance improvements relative to their peers who could still enter
cannabis-shops. Results from the subgroup analysis appear to confirm this and are largely
consistent with those individuals we would expect to be affected by the temporary cannabis
prohibition. In the following, we conduct two additional exercises with the administrative data
we have available to test whether our findings are consistent with the particular manner in
which THC consumption affects cognitive functioning.
6.1.1 Numerical vs. Non-Numerical Courses
We first propose a very simple extension to our analysis of the student performance data
inspired by Block and Ghoneim (1993) and Pacula et al. (2003), who find that numerical
skills are more impaired by cannabis use than non-numerical skills. Consequently, if the
increase in performance detected is more pronounced for courses which require more
knowledge of mathematics or statistics, we can more confidently attribute it to a change in
cannabis consumption. We should not expect see such a disparity in effects if the results were
driven by a change in alcohol consumption caused by the policy change. If students decrease
(or increase) their alcohol consumption because of complementarities (substitution) between
cannabis and alcohol, we would expect numerical and non-numerical courses to be affected in
a similar way. This has recently been confirmed by Carrel, Hoekstra, and West (2011), who
show that access to alcohol and its consumption affect both numerical and non-numerical
skills equally. Apart from cannabis use, it is very difficult to come up with any other plausible
explanation why performance in these two types of courses would be affected in this
systematically differential way.
Table 8 reports results for our main specification split by numerical and non-numerical
categorization of courses after inspection of the content description we discussed in section

- 20 -
3.2.1. The dependent variable in the first two columns is the standardized course grade. The
estimates reveal that the policy effect is more than five times larger for numerical than for
non-numerical courses. Since there might be differences in the average difficulty of courses
that require more or less numerical skills, which may drive the grade differences, it is perhaps
more sensible to focus on the effects on pass rates. These are shown in column (3) and (4) of
Table 8. We can confirm that numerical courses are on average more difficult: only two-thirds
of students pass these compared to the almost 80 percent that pass non-numerical courses.
Despite these baseline differences in passing rates in the different course types, the difference
in the estimated policy effect remains very large, with the probability of passing being three
times larger for math oriented courses than non-mathematical ones. This difference is
statistically significant and a strong indicator that the improvement in performance we
observe is driven by Non-DGB students altering their cannabis consumption as a result of the
change in access policy.
6.1.2 Evidence from Student Evaluations
We now exploit the information contained in students‟ online course evaluation surveys,
which they are asked to fill out at the end of every course. The participation rate for student
course evaluations is relatively low at 37 percent, but since we investigate within-individual
changes using student fixed effects, selectivity issues should play only a minor role. We
match the evaluation data to students‟ nationality and course grades at the individual level.
We have grouped the survey questions into five potential mechanism “categories”: “Hours
worked”, “Feel Stimulated”, “Functions Well”, “Understand Better” and “Quality Improved”.
Table 9 reports the coefficients of the estimated difference-in-differences policy effect
on each of the potential mechanisms. A first observation is that the average number of hours
per week spent studying for a course outside of the classroom does not statistically change
and, if anything, slightly decreases. This is indicative that changes in the time management of

- 21 -
students outside the classroom are not the main driver of our results. This suggests that the
performance increase we observe is not driven by changes in student effort measured as study
hours. Similarly, the domains of “stimulation,” “functioning,” and “quality of the
course/teacher” can each be rejected as the primary reason why course results have improved.
Of all channels, only the “understand” domain seems to be affected by the policy change. This
underlying channel would be consistent with clinical evidence that suggests that the main
effect of cannabis on human functioning is to worsen memory of things learned while „high‟,
or as Ranganathan and D‟Souza (2006) put it in their review of the clinical literature,
“THC…impairs immediate and delayed free recall of information presented after, but not
before, drug administration.” The fact that treated students indicate a better understanding of
course material and lectures appears as further suggestive evidence that the positive
performance effect we have observed here stems indeed from a decrease in cannabis
consumption caused by the policy that restricted cannabis access by nationality.
6.2 Interpretation of Findings
6.2.1 Relative Size of Estimated Effect
The main finding from our most restrictive specification, which uses both student fixed
effects, course fixed effects and time trends, shows that the temporary restriction of legal
cannabis access increased performance by on average .093 standard deviations and raised the
probability of passing a course by 5.4 percent (columns 1 and 2 of Table 4). These point
estimates suggest that restricting legal access to cannabis resulted in a substantial increase in
student performance. To assess the size of such an effect, it is perhaps useful to put it in
perspective with other estimates of interventions aimed at the performance of college
students, and in particular the effect of legal alcohol access.
Our reduced form estimates are roughly the same size as the effect as having a
professor whose quality is one standard deviation above the mean (Carrell and West, 2010) or

- 22 -
of the effect of being taught by a non-tenure track faculty member (Figlio, Shapiro and Soter,
Soter, 2014). It is about twice as large as having a same gender instructor (Hoffmann and
Oreopoulos, 2009) and of similar size as having a roommate with a one standard deviation
higher GPA (Sacerdote, 2001). The effect of the cannabis prohibition we find is a bit smaller
than the effect of starting school one hour later and therefore being less sleep-deprived
(Carell, Maghakian & West, 2011).
A perhaps more relevant benchmark for the comparison of our reduced form estimates
is in relation to recent findings on how legal alcohol access has been found to impair college
achievement. Lindo, Swensen and Waddell (2013) use an identification strategy akin to ours
and show that legal alcohol access reduces course grades by .033 to .097 standard deviations
when including student fixed effects. Exploiting a discontinuity at the legal drinking age for
students at the United States Air Force Academy (USAFA), Carell, Hoekstra and West (2011)
estimate that alcohol access causes course grades to drop by, on average, .092 standard
deviations. This is remarkably close to the impact of legal cannabis access that we estimate
here (.093). The reduced form point estimates of both of these studies suggest that the legal
status of cannabis affects student achievements in a similar way to the legal status of alcohol.
6.2.1 Effect on the Treated and Price Concerns
The final policy relevant exercise we attempt here is to interpret our results in view of the
proportion of individuals who actually responded to the change in legal status of cannabis:
i.e., the treatment effect on the treated. A first step is to have an idea of baseline consumption
rates for the particular group of individuals who were affected by the policy. To obtain rough
estimates of these rates, we carried out an anonymous survey among currently enrolled
students at Maastricht University14
. To make the question about cannabis consumption less
14
Although these are different students to the ones on which we have performance data that we use in the rest of
the analysis, their baseline consumption rates are relevant for two reasons. First, their demographic
- 23 -
salient, we embedded it in a more general questionnaire on risky behavior. In total, 192
students answered the survey, which is over 97 percent of the students present in the lectures
where it was distributed. The survey question we focused on asks students if they “have ever
smoked cannabis or hashish” and if so, when: “ever”, “in the last 12 months”, “in the last 30
days” or “in the last 7 days”.15
Interestingly, the baseline consumption rates we obtain are very similar across the
treated and non-treated populations, with about 58 percent of students reporting having
smoked at any point in the past year. We can consider these individuals as the potentially
treated group, as the others are unlikely to change a behavior they do not participate in before
the prohibition. This means that, if we assume full compliance to the policy, the treatment
effect on the treated would be about .16 standard deviations (= 0.093 / 0.58) in course grades
and a 6.9 percent increase in the pass rate. Assuming a more reasonable 50 percent
compliance rate to cannabis prohibition (as estimated by Jacobi and Sovinsky, 2013), we
roughly estimate a policy impact on the treated of a 0.32 standard deviations improvement in
course grades and a 13.8 percent increase in the passing rate of cannabis consumers. Even if
this treatment effect on the treated is somewhat overestimated due to student under-reporting
baseline consumption or de-facto higher compliance rates, the effects we identify here are
large and economically significant.
One potential concern remaining for the interpretation of our findings is that the drug
access limitation had an effect on cannabis prices. As the partial prohibition reduced demand,
one could expect prices to have gone down during this period. This could have, in turn, lead
to some increase in cannabis consumption for the nationalities who are still allowed to buy the
characteristics (age, gender, and nationality) are extremely similar to the students we previously studied. Second,
since the discriminatory policy was no longer in place at the time we conducted our survey, they enjoy the same
legal access to cannabis as the Dutch, German and Belgian students as only some proof of residence is now
needed to enter coffee-shops. 15 Despite the fact that we guaranteed anonymity, it is likely that the baseline consumption rates obtained from
this survey are likely to underestimate baseline consumption rates since students may not report honestly and
understate their consumption levels while sitting next to their peers and in front of a lecturer.
- 24 -
substance legally. In this case, our results would be an overestimate that captures the
aggregate effect of Non-DGB smoking less because of prohibition and DGB‟s smoking more
due to the drop in the legal price. To rule out this mechanism, we collected prices for 10 types
of cannabis strains sold in 5 of the most popular coffee shops in Maastricht around the time of
the policy introduction. We did this from historical postings in online forums. An average
price per gram calculated from this data was found to be €9.60 before and €9.70 during the
period of restrictive legal access. This suggests that the legal cannabis price was unaffected by
the introduction of the policy and is therefore not a factor biasing our estimates.
7 Conclusion
In this paper, we have investigated how restricting cannabis access affects student
achievements. We find that the performance of students who lose legal access to cannabis
improves substantially. Our analysis of underlying channels suggests that the effects are
specifically driven by an improvement in numerical skills, which existing literature has found
to be particularly impaired by cannabis consumption. This provides perhaps the first clear
causal evidence of an important positive effect on short term productivity of restricting legal
access to cannabis. Our findings also imply that individuals do change their consumption
behavior when the legal status of a drug changes.
We must note here that this paper only assesses the impact on one particular outcome
for a specific group of individuals. The impact on examinations that require skills in math and
statistics might be different from the effects on individuals in environments where
performance requires different skills or is measured differently. Our estimates perhaps
represent an upper bound because of the high THC concentration of Dutch cannabis compared
to cannabis quality in most other countries. It could however also be argued that our estimates
are lower bounds because the policy we study did not restrict access to all students who study
in Maastricht, and it may have been possible to obtain illegal access to the drug through peers

- 25 -
with a different nationalities who were not excluded from cannabis-shops or through other
illegal channels. It is not clear whether restricting cannabis may have other severe negative
consequences on, for example, crime – since it is likely to increase demand through illegal
channels. It should also be noted that it is not clear from our results whether the effects of
legalization and prohibition are symmetric.
We still believe that – after taking these caveats into account – our findings have
potentially important policy implications for countries which are considering the relaxation of
drug laws. Performance (student achievement) is perhaps more policy relevant since changes
in cannabis consumption itself might be irrelevant if they do not lead to important negative
externalities for society. The effects we estimate and the change in consumption behavior they
imply should therefore be taken into account along with other pro and con arguments of drug
legalization. As such, these new findings should therefore become integrated in the complex
and multi-dimensional societal cost-benefit analysis that should drive any drug policy
decision making.
- 26 -
References
Adda, J., McConnell, B., & Rasul, I. (2014). Crime and the Depenalization of Cannabis
Possession: Evidence from a Policing Experiment. Journal of Political Economy,
forthcoming.
Bielman, B., Nijkamp, R., Reimer J., and M. Haaijer (2013) Coffeeshops in Nederland 2012,
WODC Report, Intraval, Groningen-Rotterdam.
Block, R. I., & Ghoneim, M. M. (1993). Effects of chronic cannabis use on human
cognition. Psychopharmacology, 110(1-2), 219-228.
Bossong, M. G., Jansma, J. M., van Hell, H. H., Jager, G., Oudman, E., Saliasi, E., Kahn R. S.
Ramsey, N. F. (2012) Effects of δ9-Tetrahydrocannabinol on Human Working
Memory Function. Biological Psychiatry, 71(8), 693-699.
Bossong, M. G., Jansma, J. M., van Hell, H. H., Jager, G., Oudman, E., Saliasi, E., Kahn R. S.
Ramsey, N. F. (2012) Default Mode Network in the Effects of D9-
Tetrahydrocannabinol (THC) on Human Executive Function, PlosOne, 8(7), e70074.
Carrell, S. E., & West, J. E. (2010). Does professor quality matter? Evidence from random
assignment of students to professors. Journal of Political Economy, 118(3), 409-432.
Carrell, S. E., Maghakian, T., & West, J. E. (2011). A's from Zzzz's? The causal effect of
school start time on the academic achievement of adolescents. American Economic
Journal: Economic Policy, 3(3), 62-81.
Carrell, S.E., Hoekstra, M., West, J.E., (2011) Does drinking impair college performance?
Evidence from a regression discontinuity approach. Journal of Public Economics, 95
(1–2), 54–62.
Cobb-Clark, D. A., Kassenboehmer, S. C., Le, T., McVicar, D., & Zhang, R. (2015). “High”-
School: The Relationship between Early Marijuana Use and Educational Outcomes.
Economic Record forthcoming.
Crean, R. D., Crane, N. A., and B. J. Mason (2011) An Evidence Based Review of Acute and
Long-Term Effects of Cannabis Use on Executive Cognitive Functioning. Journal of
Addiction Medecine, 5(1), 1-8.
Donohue III, J. J, Drug Prohibition and Its Alternatives, in Lessons from the Economics of
Crime: What Reduces Offending?, P. J. Cook, S. Machin, O. Marie and G.
Mastrobuoni, eds., Cambridge, MA: MIT Press, 2013.

- 27 -
Feld J., and U. Zölitz (2014) On the Nature of Peer Effects in Academic Achievement.
University of Gothenburg: Working papers in Economics No 596.
Figlio, D. N., Schapiro, M. O., & Soter, K. B. (2013). Are Tenure Track Professors Better
Teachers? (No. w19406). National Bureau of Economic Research.
Hall W. (2015) What has research over the past two decades revealed about the adverse health
effects of recreational cannabis use?, Addiction, 110(1), 19-35
Jacobi, L. and M. Sovinsky (2013) Cannabis on Main Street? Estimating the Demand in
Markets with Limited Access, R&R American Economic Review , Mimeo, University
of Zurick.
Lindo, J. M., Swensen, I. D., & Waddell, G. R. (2013). Alcohol and student performance:
Estimating the effect of legal access. Journal of health economics, 32(1), 22-32.
MacCoun, R., and P. Reuter (1997). Interpreting Dutch cannabis policy: reasoning by analogy
in the legalization debate. Science, 278(5335), 47-52.
Pacula, R. L. (1997) Women and Substance Use: Are Women Less Susceptible to Addiction?
American Economic Review, 87(2), 454-459
Pacula, R. L., Ross, K. E., & Ringel, J. (2003). Does Cannabis Use Impair Human Capital
Formation? (No. w9963). National Bureau of Economic Research.
Pacula, R. L. and E. L. Sevigny (2014), Cannabis Liberalization Policies: Why We Can't
Learn Much from Policy Still in Motion. Journal of Policy Analysis and Management,
33: 212–221.
Pope Jr, H. G., Jacobs, A., Mialet, J. P., Yurgelun-Todd, D., & Gruber, S. (1997). Evidence
for a sex-specific residual effect of cannabis on visuospatial memory. Psychotherapy
and psychosomatics, 66(4), 179-184.
Pope, H. G., Gruber, A. J., Hudson, J. I., Cohane, G., Huestis, M. A., & Yurgelun-Todd, D.
(2003). Early-onset cannabis use and cognitive deficits: what is the nature of the
association?. Drug and alcohol dependence, 69(3), 303-310.
Ranganathan M. and D. C. D‟Souza (2006). The acute effects of cannabinoids on memory
in humans: a review, Psychopharmacology, 188(4), 425-444.
UNODC: United Nations Office of Drugs and Crimes (2012) World Drug Report, 2012,
available at http://www.unodc.org/unodc/en/data-and-analysis/WDR-2012.html
Van Ours, J. C., and J. Williams (2015). Cannabis Use and Its Effects on Health, Education
and Labor Market Outcomes. Journal of Economic Surveys, forthcoming.

- 28 -
Figure 1: Number of Cannabis-Shops per Population across Dutch Municipalities
Source: Map 2.2 in Bielman et al (2012)
Belgium
Germany
Maastricht

- 29 -
Figure 2: Poster Announcing the Application of the ‘Neighborhood Country Criterion’
in Maastricht Cannabis-Shops on 1st of October 2011
- 30 -
Figure 3: Course Grades for DGB and All Other Nationality Students
Note: The solid line represents the grades of the students treated by the cannabis prohibition. The left axis refers
to the average exam grades of Dutch-German-Belgian (DGB) students, and the right axis refers to the grades of
all other nationalities (Non-DGB). The two vertical lines denote the start and end of the prohibition period when
the „All Other‟ students had no access to cannabis-shops.
5.4
5.6
5.8
6
6.1
6.2
6.3
6.4
6.5
6.6
1 2 3 4 5 6 7 8 9 10 11 12 13 14 15 16 17
Academic Period
DGB (Left Axis) All Other (Right Axis)

- 31 -
Table 1: Timing of Changes to Cannabis Access in Maastricht and Mapping to Academic Year/Period with Student Course Grades
Cannabis Access All Access DGB only All Restricted
Total Academic Period 1 2 3 4 5 6 7 8 9 10 11 12 13 14 15 16 17 18
Teaching Period 1 2 3 4 5 6 1 2 3 4 5 6 1 2 3 4 5 6
Academic Year 2009 / 2010 2010 / 2011 2011 / 2012
Month Sep Oct Nov Dec Jan Feb Mar Apr May Jun Jul Aug Sep Oct Nov Dec Jan Feb Mar Apr May Jun Jul Aug Sep Oct Nov Dec Jan Feb Mar Apr May Jun Jul Aug
Year 2009 2010 2011 2012

- 32 -
Table 2: Descriptive Characteristics of All, DGB, Non-DGB Students
Student Nationality
All
(1)
DGB
(2)
Non-DGB
(3)
Difference
(3) – (2) Min Max
Grade 6.54 6.57 6.10 -.469** 1 10
Passed Course .822 .827 .747 -.080** 0 1
Course Dropout .094 .091 .130 .039** 0 1
Number of Courses 1.99 1.99 2.06 .068** 1 5
Observations 57,903 53,622 4,281
Female .353 .348 .408 .045** 0 1
Age 20.2 20.3 20.2 .100** 16.2 39.7
Final GPA 6.57 6.61 5.98 -.526** 1 9.75
Observations 4,419 4,083 336
Note: ** indicates that the differences in characteristics between Non-DGB and DGB students are significant at
the 1 percent level.

- 33 -
Table 3: Impact of Restricted Cannabis Access on Student Exam Scores
Dependent Variable = Standardized Grades
(1) (2) (3) (4) (5)
Non-DGB*Restriction .059*
(.025)
.058*
(.024)
.082**
(.031)
.104**
(.018)
.093**
(.016)
Non-DGB Student -.266**
(.090)
-.271**
(.088)
-.259*
(.100) - -
Restriction Period .026*
(.013)
.027*
(.013)
.042**
(.016)
-.011
(.007)
.016
(.019)
Gender Dummy No Yes Yes No No
Age in Months No Yes Yes Yes Yes
Course Fixed Effects No No Yes Yes Yes
Number of Courses No No Yes Yes Yes
Individual Fixed Effects No No No Yes Yes
Period Dummies &
Time Trend (Cubic) No No No No Yes
Sample Size 52,424 52,424 52,424 52,424 52,424
Note: Robust standard errors clustered at the nationality level reported in parenthesis. *, and ** indicate
significance at the 5 and 1 percent level, respectively.

- 34 -
Table 4: Impact of Restricted Cannabis Access
on Various Measures of Academic Performance
Education Outcomes
(1)
Standardized
Grade
(2)
Passed
Course
(3)
Dropout
of Course
Non-DGB*Restriction .093**
(.016)
.040**
(.008)
-0.011
(0.010)
Non-DGB Student - - -
Restriction Period 0.016
(0.019)
.013**
(.003)
-0.012**
(0.004)
Mean of Outcome NA 0.746 0.142
Effect size at Mean NA 0.054 -0.077
All Controls and FEs Yes Yes Yes
Observations 52,424 52,424 57,816
Note: All specifications include the same fixed effects and controls as in the last column of
Table 3 (i.e., age in months, number of courses enrolled in, teaching period dummies, a cubic
in time trend, course specific fixed effects, and student specific fixed effects). Robust standard
errors clustered at the nationality level are reported in parentheses. * and ** indicate
significance at the 5 and 1 percent level, respectively.

- 35 -
Table 5: Results by Sub-Groups
Sub-Group
Categories
Standardized
Grades
Passed
Course
Sample Size,
Number of Students,
Percentage Treated
Gender
Male Students
.069**
(.014)
[6.45]
.036**
(.009)
[77.4]
Sample = 33,468
N Students = 2,861
% Treated = 0.069
Female Students
.126**
(.031)
[6.69]
046**
(.012)
[81.7]
Sample = 18,956
N Students = 1,558
% Treated = 0.083
Age
Younger Students
.116**
(.028)
[6.51]
.057**
(.014)
[77.9]
Sample = 26,317
N Students = 2,300
% Treated = 0.081
Older Students
.024
(.031)
[6.56]
.005
(.015)
[79.9]
Sample = 26,107
N Students = 2,520
% Treated = 0.086
Performance
Low Performers
.089**
(.032)
[5.54]
.047**
(.017)
[62.2]
Sample = 27,416
N Students = 1,873
% Treated = 0.081
High Performers
.056**
(.017)
[7.32]
-.010
(.009)
[94.5]
Sample = 31,311
N Students = 1,873
% Treated = 0.088
Note: Table reports coefficients on Non-DGB*Restriction for the same specification as column (4) of Table 3 for
each sub-group. For Age the sample is split between below and above the median age when last observed, 20.69
years. For Performance the sample is split between below and above the median average exam score in the
period before introduction of the policy, 6.62 out of 10. The mean of pre-policy average course (non-
standardized) grade and of the pass rate by subgroup is reported in square brackets. Robust standard errors
clustered at the nationality level reported in parenthesis. *, **, and *** indicate significance at the 10, 5 and 1
percent level, respectively.

- 36 -
Table 6: Effect of Share Treated in Class and of Nationality in Charge of Class
Peer Effects Teacher Effects
(1)
Std. Grade
(2)
Passed
Course
(3)
Std. Grade
(4)
Passed
Course
Non-DGB* Restriction Period *
Share no-access nationality .167
(.133)
.211**
(.080) - -
Non-DGB * Restriction Period *
Nationality of Class Teacher - - -.028
(.028)
-.008
(.014)
Non-DGB * Restriction Period
(i.e. main policy effect)
.077**
(.020)
.021*
(.010)
.067**
(.033)
.038**
(.016)
Restriction Period*Share no-
access nationality
.037
(.125)
-.015
(.030) - -
All Controls & FEs Yes Yes Yes Yes
Observations 52,395 52,395 34,895 34,895
Note: Robust standard errors clustered at the nationality level are reported in parentheses. *, **, and ***
indicate significance at the 10, 5 and 1 percent level, respectively. The placebos report coefficients on Non-
DGB*Restriction for the same specification as column (5) of Table 3 when, respectively, the time period
for treatment is changed to -1 year, and the group treated is changed to Belgians. Coefficients of interest
are: standardized grades in columns 1 and 2; dropout measured by not having a grade in column 3; and the
interaction of a student being NonDGB with the share of NonDGB students in the course in row 4, and with
class tutor being NonDGB in row 5.

- 37 -
Table 7: Placebo in Policy Timing and Treated Group
Placebo Specification
Policy 1 Year Earlier Belgians Treated Group
Std. Grade Passed Std. Grade Passed
Placebo Policy Effect -0.0129
(0.030)
-0.0004
(0.013)
0.0103
(0.048)
0.0284
(0.022)
All Controls and FEs Yes Yes Yes Yes
Observations 34,325 34,325 48,762 48,762
Note: The controls and Fes included in all specifications are as in the last column of Table 3
(i.e., age in months, number of courses enrolled in, teaching period dummies, and a cubic in
time trend, course specific Fes, and student specific Fes). Robust standard errors clustered at
the nationality level are reported in parenthesis. * and ** indicate significance at the 5 and 1
percent level, respectively.

- 38 -
Table 8: Differences between Courses Requiring More and Less Numerical Skills
Standardized Grades Passed Course
Numerical Non-
Numerical Numerical
Non-
Numerical
Non-DGB*Restriction .228**
(.028)
.043**
(.016)
.073**
(.010)
.023**
(.007)
Restriction Period -.183**
(.029)
.033
(.022)
-.055**
(.020)
.002
(.006)
Mean of Outcome NA NA 0,663 0,794
Effect size at Mean NA NA 0,110 0,029
All Controls and FEs Yes Yes Yes Yes
Proportion of Courses
Observations 18,077 34,347 18,077 34,347
Note: Robust standard errors clustered at the nationality level are reported in parenthesis. *, and ** indicate
significance at the 5 and 1 percent level, respectively.

- 39 -
Table 9: Exploration of Potential Channels via Student Evaluation of Courses
Mechanism
Category
Non-DGB
*Restriction
Survey Question(s)
from Course Evaluation
Hours
Worked
[N = 15,987]
-0.244
(0.376)
“How many hours per week on average did
you spend on self-study?”
Feel
Stimulated
[N = 15,937]
0.087
(0.059)
“The learning materials stimulated me to start
and keep on studying‟ & „…stimulated
discussion with my fellow students.”
Functions
Well
[N = 15,997]
0.032
(0.064)
“overall functioning of your tutor…” & “My
tutorial group has functioned well.”
Understand
Better
[N = 13,520]
0.122*
(0.064)
“The lectures contributed to a better
understanding…” & “Working in tutorial
groups helped me to better understand the
subject matters of this course”
Quality
Improved
[N = 15,897]
0.017
(0.061)
“The tutor has sufficiently mastered the
course content of this course” & “give overall
grade for the quality of this course”
Note: All questions were standardized to mean zero and unit variance, then averaged within
each mechanism category and again standardized to mean zero and unit variance. Robust
standard errors clustered at the nationality level are reported in parenthesis. * and ** indicate
significance at the 5 and 1 percent level, respectively. See Table A1 for more details about the
original questions and how we categorize them into the five main channels reported here.

- 40 -
APPENDIX
Table A1: Student Course Evaluation Questions
Nr. Question wording Answering scale Category
1 How many hours per week on the average (excluding contact hours) did you spend on self-study
(presentations, cases, assignments, studying literature, etc.)?
Open question
[0 – 80 HOURS] Hours Worked
2 The learning materials stimulated discussion with my fellow students. 1-5 Feel Stimulated
3 The learning materials stimulated me to start and keep on studying. 1-5 Feel Stimulated
4 Evaluate the overall functioning of your tutor in this course with a grade 1-10 Functions Well
5 My tutorial group has functioned well. 1-5 Functions Well
6 The lectures contributed to a better understanding of the subject matter of this course. 1-5 Understand Better
7 Working in tutorial groups with my fellow-students helped me to better understand the subject
matters of this course. 1-5 Understand Better
8 The tutor sufficiently mastered the course content. 1-5 Quality Improved
9 Please give an overall grade for the quality of this course 1-10 Quality Improved