hi everyone! thanks for joining. this is the u.s. doe tap...
TRANSCRIPT

U.S. DOE TAP Webinar Internal Benchmarking Outreach and Data Collection Techniques
Joel Blaine, Zach Shelin, Rachel Emerson Page 1 of 33
Page 1 of 33
Joel Blaine: Hi everyone! Thanks for joining. This is the U.S. DOE TAP Webcast, Internal Benchmarking Outreach and Data Collection Techniques. So hopefully you’re in the right place. We’ll begin in just a second here. We’re just going to wait for a few more registrants to filter in. And just some quick notes to the audio function on the go to meeting. It just tends to be better sound quality and we’re able to unmute your phones that way. If you’re on the mic and speakers we are unable to help out with the unmuting process.
You should have the dial-in number already, and the access code is
presented in that control panel. And then it gives you an audio PIN when you sign in.
Okay. So my name is Joel Blaine. I’m with the Department of
Energy. I work in the Weatherization and Intergovernmental Program office, also affectionately known as WIP. Today we’re going to cover some tips for benchmarking outreach and data collection for internal portfolios. And we’ve got a great lineup. We’re happy that Zach Shelin, from Cadmus Group, who supports EPA EnergyStar is with us, as well as Rachel Emerson, from the State of Delaware.
Okay, next slide. Just quickly running through the agenda here.
We will continue with the welcome and overview in a minute and run through some additional information about the technical assistance program. From there we’ll jump into strategies for outreach and data collection. After that we’ll highlight resources and tips from EnergyStar. And then we’ll have a chance to get some insight from a state government experience, through Rachel Emerson with the State of Delaware. We will quickly cover some of the opportunities for technical assistance through the Better Buildings Alliance. And then we should have plenty of time at the end for questions and answer session.
Okay, next slide. So this webcast is brought to you by the
Technical Assistance Program here at DOE in support of EERE’s mission of taking clean energy to scale through high impact efforts. TAP has been around for about a decade, and it has handled thousands of inquiries. More recently under the Recovery Act TAP expanded the range of resources to include one-on-one assistance and extensive online resource library with webinars and a blog, and then was able to facilitate peer exchange. Next slide.
Just like state and local governments, TAP has had a post-ARRA
transition to contend with. So rather than reverting back to our

U.S. DOE TAP Webinar Internal Benchmarking Outreach and Data Collection Techniques
Joel Blaine, Zach Shelin, Rachel Emerson Page 2 of 33
Page 2 of 33
pre-ARRA framework, we’ve evolved into sort of a new platform. So our mission will continue to be supporting state, local, and tribes to take clean energy to scale. But now more than ever we want to get the biggest bang for our new limited buck. And we want to help you do this as well. So moving forward we will be focusing on key priority areas to address specific market barriers. We’ll work on resources to disseminate standardized approaches and best practices. And then we’re facilitating communication and learning among peers. And then we’ll have some targeted on-on-one assistance.
So I know one-on-one assistance might perk a few ears here. So just to add some additional clarification to that process, state and locals can still submit applications to be considered for one-on-one assistance. And then these in-depth requests will be evaluated based on a set of criteria, including the broader impact of the effort, the associated time and cost of the request, and then how it addresses gaps in the existing technical assistance market. And so there’s a general shift towards program and policy-based assistance versus these one-off projects. Okay, next slide. So as I mentioned before, there are some priority areas. And one of them is data management EM&V priority area. And so some specifics on that category. So we recently published a guide for designing a benchmarking plan and have posted it on the solution center. So we’re happy to have that up there. And we’re rolling out a comprehensive resource portal on data and EM&V in May, so we’re really excited to be able to release that pretty soon here. We continue to host webinars like this one to discuss a range of topics around data and EM&V, and we’ve just launched a Better Buildings Alliance project team to focus on data management approaches. The first session was actually held last week, on the 20th. But limited space is still available. And I’ll give you some information about how to get connected with that, if you’re interested, towards the end of the presentation. And I’m happy to announce that we have a save the date out for our second annual Better Building Summit for state and local governments. So that’s now going to be held in D.C. And we hope to send out the registration and more information pretty shortly here. Next slide. So here are a few ways to get connected with TAP. We’ll send a copy of the slides around after the presentation so that you don’t
U.S. DOE TAP Webinar Internal Benchmarking Outreach and Data Collection Techniques
Joel Blaine, Zach Shelin, Rachel Emerson Page 3 of 33
Page 3 of 33
have to scramble to write them down now. I just wanted to post them here so you saw that there are a few different ways to get connected with the TAP program. Next slide. Most of us here are familiar with benchmarking. But just for a quick recap, benchmarking is a process of accounting for and comparing a building’s current energy performance with its energy baseline, or comparing a building’s energy performance with the energy performance of similar building types. Benchmarking can be used to compare performance over time, within and between peer groups, or to document top performers. Benchmarking gets at the fundamental principles of energy management, since measuring energy use is at the core of managing that energy use. The famous image here from EnergyStar’s PortfolioManager gives an example of comparing the energy performance of buildings of a similar type against each other. And you can sort of see how you have high or low performers when you’re comparing of a similar type. Okay, next slide. So as I just mentioned, benchmarking gets at the fundamentals of energy management. Benchmarking is a provocative approach to energy management that emphasizes continuous improvement, and it helps organizations manage their energy use rather than react to it. Benchmarking helps with verifying your energy costs or emissions savings, and then being able to communicate those results in a way that others can understand. Likewise, benchmarking helps you assess the effectiveness of your current operation. This can help organizations implement the most cost-effective energy efficiency measures by evaluating the actual performance of these existing practices. And by tracking energy use, benchmarking compliments resource planning and setting goals, targets, and timelines. Finally, if you’re participating in an energy challenge or a benchmarking program, benchmarking helps you get the recognition for the progress that you’ve achieved. Okay, next slide. So we’re all probably familiar with the benefits of benchmarking but honestly, benchmarking can seem like a really daunting task with multiple buildings. And then in other cases multiple meters associated with one building. So it can be lots to sort through, how
U.S. DOE TAP Webinar Internal Benchmarking Outreach and Data Collection Techniques
Joel Blaine, Zach Shelin, Rachel Emerson Page 4 of 33
Page 4 of 33
energy is related to all the various buildings that are under your management. And I think I’ve mentioned before, but sometimes it might feel like staff is spitefully complying with your benchmarking programs. They may just dump a pile of papers and bills on your desk in order to meet your requests, but not in a very helpful way. And then there’s the challenge of competing with multiple priorities for energy reduction or multiple baselines depending on what sort of programs your organization is involved with. And this in on top of what you’re already doing. So it can certainly be a lot to juggle. Next slide. So that’s why there are some real benefits in getting organized around benchmarking and being systematic about your method. Creating a plan allows for a strategic approach to the process, and it helps avoid the pitfalls of a piecemeal process or the need to continually go back to people for more information. Organization helps delegate the work appropriately so that this benchmarking process is actually sustainable and can maintain your sanity. And then this planned approach helps you speak the language of those interested. So if at the end of your benchmarking program your boss asks for something like emission reductions and you only have water savings, it might not be the most fun conversation. And then you may have an immediate need for benchmarking, but if you’re thoughtful in the beginning, creating a plan helps you ensure that the benchmarking program has some room to grow and some staying power as priorities change. Okay, next slide. So getting the right people involved can have a pretty huge impact on the results of your benchmarking program. It’s definitely worth the effort, and it also influences the outputs and the outcomes of the program. Which is kind of nice to know in advance of the effort of your program, like I said. If you end up with the wrong kind of results to share, there’s likely going to be a lot of rehashing of old work. Also, building a benchmarking team is about assembling colleagues and other staff to help make the process more manageable. And it’s about adding the expertise of others in the organization, which can have a big impact when it comes to troubleshooting problems or interpreting some of the results. And another part of engaging the right people is connecting with the data sources to understand how the data is currently managed

U.S. DOE TAP Webinar Internal Benchmarking Outreach and Data Collection Techniques
Joel Blaine, Zach Shelin, Rachel Emerson Page 5 of 33
Page 5 of 33
and to better scope out the scale of the efforts and the avenues for moving forward. Next slide. So securing buy-in from leadership can really influence the success of the benchmarking program. It’s important for top management to approve and communicate the commitment to the benchmarking plan. Management’s endorsement establishes the importance of the benchmarking program and helps foster greater participation. And beyond the initial endorsement, management also should be involved in a part of the regular communication and review of the benchmarking process. Continued support from top management helps build momentum for this benchmarking program. And in order to secure top management buy-in, present the case for benchmarking to demonstrate the value. So it’s helpful to provide a list of benefits that benchmarking offers and to present the significance of the energy costs as a way of demonstrating the need for energy management. And we have a quick blurb there with some talking points that you can include that were pulled from two of the sources shown at the bottom there. Okay, next slide. So we’ve also included a few resources that can be helpful for pitching the idea of benchmarking to top management. These documents obviously have a slant towards EnergyStar’s PortfolioManager, but the concepts are still really relevant about the overall importance of a benchmarking program. So if you do get a chance to present the case for benchmarking with management, solicit their endorsement for a benchmarking program. Connect benchmarking to other energy or environmental goals, or pitch the idea of joining a challenge that requires benchmarking as a way of getting their buy-in and their endorsement. And during your presentation, be sure to get their input on what kind of metrics are important for measuring success. This, again, goes back to in the end, you want to be able to communicate on the same language that management is looking for. Next slide. So capacity. I’d venture to guess that no one on the line has benchmarking as their only duty. So building a team can help spread the load around. You’ll likely want to establish a benchmarking coordinator or a project manager. Depending on your organization, it may work better for this role to be shared than more than one person. The benchmarking coordinator doesn’t have to be an expert on energy, but strong communication and

U.S. DOE TAP Webinar Internal Benchmarking Outreach and Data Collection Techniques
Joel Blaine, Zach Shelin, Rachel Emerson Page 6 of 33
Page 6 of 33
leadership skills are really helpful. It’s great if this person is a good project manager to begin with. And then take the time to clearly define the roles and responsibilities of this coordinator position. The person is going to need cooperation and assistance from a lot of different people and a lot of different parts of the organization. So it’s important that their role is clearly understood across the organization. And it’s also helpful to identify key personnel in the organization to implement the benchmarking plan. The benchmarking process will involve many players. The benchmarking process will involve many players. Team will need to collect and aggregate data from a variety of sources. Depending on the organizational structure, the benchmarking program will impact energy management at several levels or several positions. So involve personnel with familiarity to the data and whose work will be affected by the benchmarking program. Good candidates include maintenance and operations, purchasing, human resources – which can be helpful for identifying operating characteristics, like number of employees or operating hours – environmental health and safety, and then IT. IT can be helpful for information about data center, energy use, or other operating characteristics, like number of PCs or significant plug load. Next slide. Tips for building a benchmarking team. So we already know that the benchmarking data can be a substantial effort. And building capacity can take many forms. So some ideas could be to look for “pro bono help” with analysis or data entry from local stakeholders. Use benchmarking as a part of projects or professional development for local government analysts or junior engineers. You may have to go to outside sources for help, including hiring consultants such as an ESCO or a third-party service provider. And then incorporating benchmarking into energy efficiency projects and contracts. Some ESCOs will offer free benchmarking as a way of developing business opportunities, so that’s always something to consider. And then sort of just giving credit that a lot of these tips are similar to tips provided in the Community Energy Strategic Planning Guide, which we can provide a link to later. Next slide. So to collect data you have to first recognize where it is. Understanding the existing energy data management process by engaging the relevant departments and staff. To learn about how bills are managed, it’s pretty important. This could be department
U.S. DOE TAP Webinar Internal Benchmarking Outreach and Data Collection Techniques
Joel Blaine, Zach Shelin, Rachel Emerson Page 7 of 33
Page 7 of 33
head, accounting, HR, facility management, general services. Sort of a similar list to who we were looking for help in our benchmarking team. And then part of understanding existing energy data management means inventorying buildings and meters and mapping out how that metering configuration looks. You’re likely going to have to interact with data sources for some time in the future, so you should really maintain these relationships. Part of that means creating a clear picture of how the data is being used. Demonstrate the value of benchmarking to the existing practices and show that it’s more than just a reporting exercise. And then it’s always important to provide open avenues for feedback from these data sources. If they feel like it’s a two-way street, you’re much more likely to find cooperation in that area. Next slide. So empower participants on the front end of the program to reduce the need to revise or revisit the benchmarking process. Training and takeoff meetings early on can reduce the headaches down the road. Help the team get on the same page about the intended out comes, the timelines, and the responsibilities of the team members. Providing training on the benchmarking tool, that’s key. We all know that the benchmarking process can seem pretty mystifying. So go ahead and get ahead of the curve and give a demo or a basic training before there’s time for the staff to worry about how unmanageable benchmarking could potentially be, because we all know it’s not. And then we’ll get into this more later, but provide consistent definitions for the data so that you can help ensure that you’re comparing apples to apples later on in the process. Next slide. So here I’ve pulled these data requirements from the PortfolioManager collection template. We’ve got that rough-looking link there at the bottom, which links to the benchmarking starter kit. That includes this benchmarking collection template. This slide gives an example of the type of information needed to benchmark; weather normalized, adjusted, and EnergyStar eligible EUI values. That’s a lot to consider there. So people often ask what the minimum requirement is for benchmarking a building. And if you just want PortfolioManager to accept the building information, you’ll need to enter the bold blue values and the space site, such as that it’s an office. The other fields are what’s used to normalize based on changes in operating characteristics. And that can be a really valuable thing to some organizations.
U.S. DOE TAP Webinar Internal Benchmarking Outreach and Data Collection Techniques
Joel Blaine, Zach Shelin, Rachel Emerson Page 8 of 33
Page 8 of 33
And note that I said that this information will get you weather normalized EUI values, but there’s no meteorological data included. And that’s where the emphasis on the zip code comes in. That’s one of the ways that PortfolioManager is able to connect with meteorological data based on your region. So these are the kinds of fields worth identifying at the beginning of the benchmarking process. Hopefully by having your requirements up front, collecting the data will be a little bit less painless. And I’ll note again that this collection template is found in the benchmarking starter kit at the link below. And it includes the required information for multiple space sites beyond just a general office as shown here. And it provides more information on what those space types are if you click on the name. So it’s definitely worth checking out if you’re planning to use PortfolioManager of another tool that uses a similar taxonomy. And so presenting the team with something like this, like this straightforward list of the inputs, helps put the effort in perspective and hopefully makes it appear more manageable. Next slide. Since we’re talking about data collection, it’s important to select a method that addresses how the data is currently managed. Planning for a data collection method gets at creating a benchmarking process that’s manageable for everyone involved. Effective data sharing helps spread the load more evenly. Depending on the tool you select and your organizational structure, data can be collected and aggregated in a handful of ways. But the most digital way to talk about data collection is dividing into a centralized or decentralized approach. You don’t have to feel the need to conform completely to one or the other, but do have a plan about how this collection will take place. Some use a centralized approach, where a central account is created to house all of the data. Building information is shared with the coordinator for input, and then reports are distributed back from that central account. Honestly, it sounds like it’s going to be a little bit more time intensive for the benchmarking coordinator, but it does reduce the asks for the staff. And ten in the decentralized approach, multiple accounts are created to share data with one central database. Multiple users manage data for their own department or their facilities, and then the data is shared with a central account as a way of aggregating all the information. And this targets a more delegated approach to data management. Next slide.
U.S. DOE TAP Webinar Internal Benchmarking Outreach and Data Collection Techniques
Joel Blaine, Zach Shelin, Rachel Emerson Page 9 of 33
Page 9 of 33
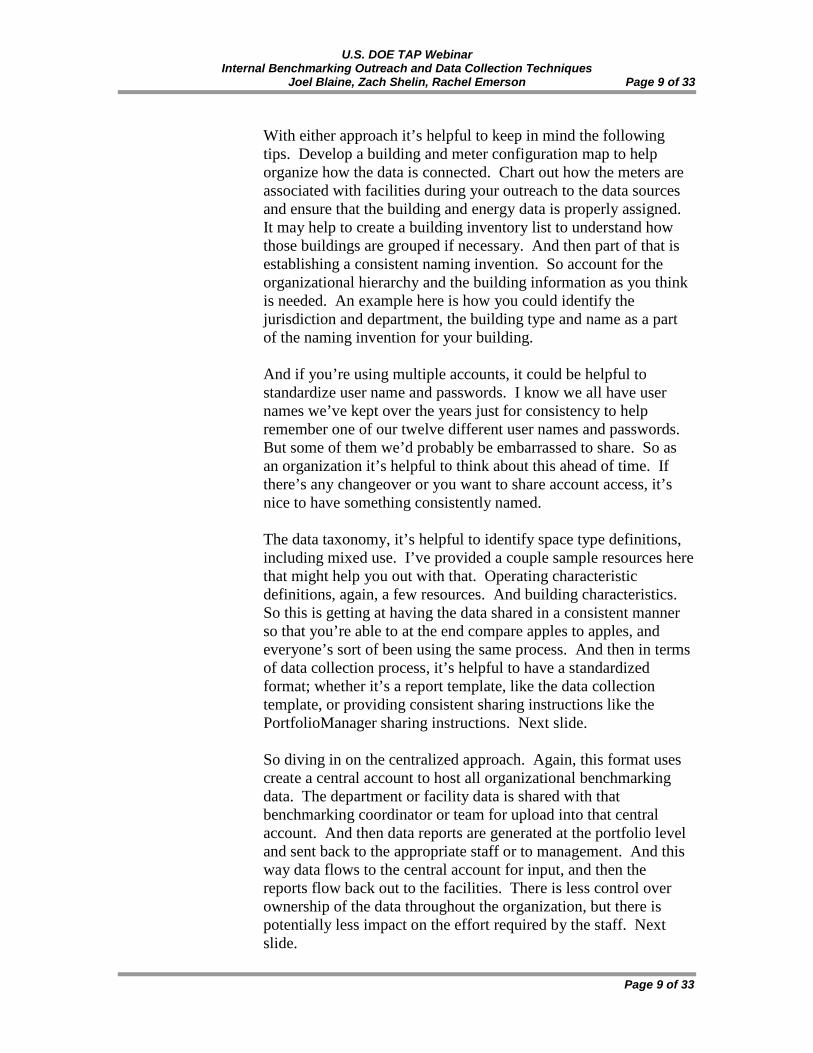
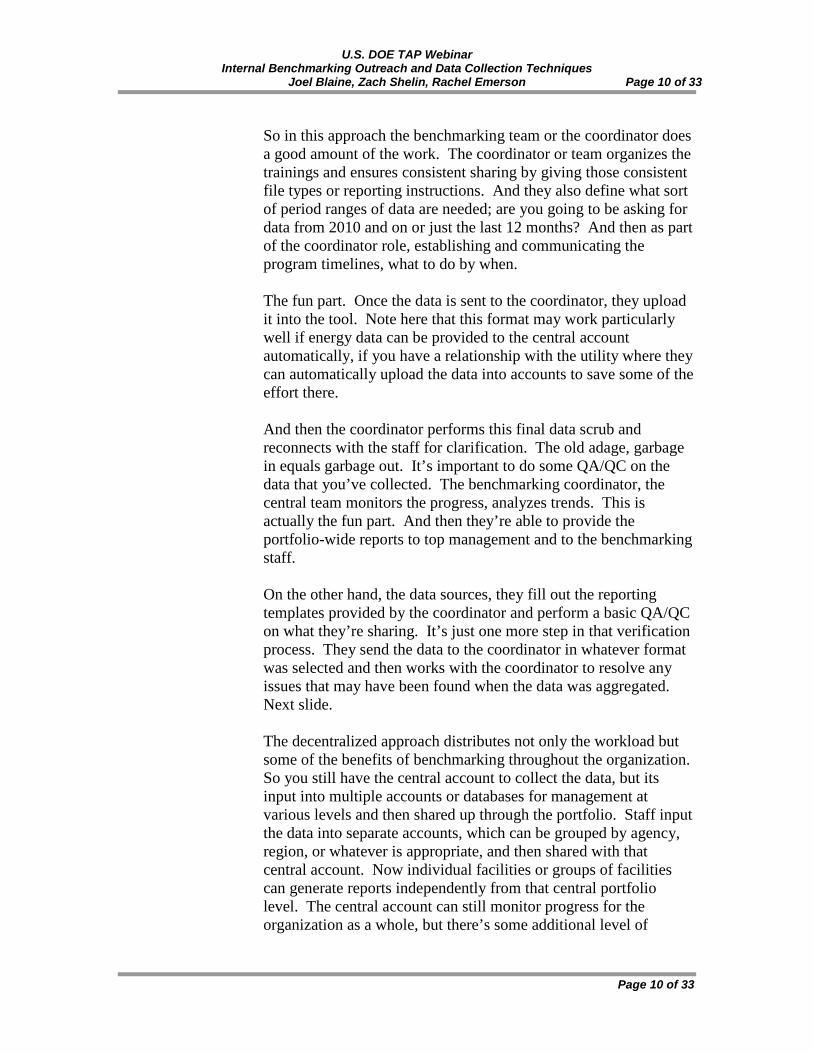
With either approach it’s helpful to keep in mind the following tips. Develop a building and meter configuration map to help organize how the data is connected. Chart out how the meters are associated with facilities during your outreach to the data sources and ensure that the building and energy data is properly assigned. It may help to create a building inventory list to understand how those buildings are grouped if necessary. And then part of that is establishing a consistent naming invention. So account for the organizational hierarchy and the building information as you think is needed. An example here is how you could identify the jurisdiction and department, the building type and name as a part of the naming invention for your building. And if you’re using multiple accounts, it could be helpful to standardize user name and passwords. I know we all have user names we’ve kept over the years just for consistency to help remember one of our twelve different user names and passwords. But some of them we’d probably be embarrassed to share. So as an organization it’s helpful to think about this ahead of time. If there’s any changeover or you want to share account access, it’s nice to have something consistently named. The data taxonomy, it’s helpful to identify space type definitions, including mixed use. I’ve provided a couple sample resources here that might help you out with that. Operating characteristic definitions, again, a few resources. And building characteristics. So this is getting at having the data shared in a consistent manner so that you’re able to at the end compare apples to apples, and everyone’s sort of been using the same process. And then in terms of data collection process, it’s helpful to have a standardized format; whether it’s a report template, like the data collection template, or providing consistent sharing instructions like the PortfolioManager sharing instructions. Next slide. So diving in on the centralized approach. Again, this format uses create a central account to host all organizational benchmarking data. The department or facility data is shared with that benchmarking coordinator or team for upload into that central account. And then data reports are generated at the portfolio level and sent back to the appropriate staff or to management. And this way data flows to the central account for input, and then the reports flow back out to the facilities. There is less control over ownership of the data throughout the organization, but there is potentially less impact on the effort required by the staff. Next slide.
U.S. DOE TAP Webinar Internal Benchmarking Outreach and Data Collection Techniques
Joel Blaine, Zach Shelin, Rachel Emerson Page 10 of 33
Page 10 of 33
So in this approach the benchmarking team or the coordinator does a good amount of the work. The coordinator or team organizes the trainings and ensures consistent sharing by giving those consistent file types or reporting instructions. And they also define what sort of period ranges of data are needed; are you going to be asking for data from 2010 and on or just the last 12 months? And then as part of the coordinator role, establishing and communicating the program timelines, what to do by when. The fun part. Once the data is sent to the coordinator, they upload it into the tool. Note here that this format may work particularly well if energy data can be provided to the central account automatically, if you have a relationship with the utility where they can automatically upload the data into accounts to save some of the effort there. And then the coordinator performs this final data scrub and reconnects with the staff for clarification. The old adage, garbage in equals garbage out. It’s important to do some QA/QC on the data that you’ve collected. The benchmarking coordinator, the central team monitors the progress, analyzes trends. This is actually the fun part. And then they’re able to provide the portfolio-wide reports to top management and to the benchmarking staff. On the other hand, the data sources, they fill out the reporting templates provided by the coordinator and perform a basic QA/QC on what they’re sharing. It’s just one more step in that verification process. They send the data to the coordinator in whatever format was selected and then works with the coordinator to resolve any issues that may have been found when the data was aggregated. Next slide. The decentralized approach distributes not only the workload but some of the benefits of benchmarking throughout the organization. So you still have the central account to collect the data, but its input into multiple accounts or databases for management at various levels and then shared up through the portfolio. Staff input the data into separate accounts, which can be grouped by agency, region, or whatever is appropriate, and then shared with that central account. Now individual facilities or groups of facilities can generate reports independently from that central portfolio level. The central account can still monitor progress for the organization as a whole, but there’s some additional level of

U.S. DOE TAP Webinar Internal Benchmarking Outreach and Data Collection Techniques
Joel Blaine, Zach Shelin, Rachel Emerson Page 11 of 33
Page 11 of 33
management and monitoring that’s available to the department or facility level. Next slide. So in this scenario, smaller groups of buildings are benchmarked in clusters for aggregation up the chain. The coordinator fills a similar role as with the centralized account or a centralized approach except that the data upload is now distributed throughout the organization. It provides more flexibility throughout the process because individuals or groups can monitor and manage the data as needed, but the coordinator still has access to the same level of data as was provided in the centralized approach. So ideally you may take one or the other format, but it’s likely that it could be a combination of the two. And it’s just important to match the collection process to how data in the hierarchy is structured in your organization. So enough from me. Let’s hear a bit from EnergyStar about some of the specific tips and tools available for outreach and how data collection works for the Cadmus Group supporting EPA’s EnergyStar program. He focuses primarily on public sector benchmarking, EnergyStar recognition programs, and energy efficient commercial building design. Thanks, Zach.
Zach Shelin: Thanks, Joel. I’m going to go ahead and dive into
PortfolioManager and try to get into some of the specifics with the time that I have here. And I do also want to mention that I’ll be directing everybody to a lot of the great resources that we have at EnergyStar. Since I don’t have time to go into detail about everything, I think it would be very helpful to take advantage of some of the links that I’ve included in this presentation to get trained on more of the specifics, like importing the data, keeping it up to date, and so forth.
So let’s start with an overview of PortfolioManager. So
PortfolioManager is a management tool that’s used to help businesses and organizations assess their whole building energy and water consumption. And it’s used to track changes relative to the baseline in energy and water consumption, and then also greenhouse gas emissions and energy costs. It will also help you track any green power purchases and on-site renewable energy generation that you have, and then share and report all of that data with others, either via custom reports or any other metrics that you want to highlight. And lastly, it also helps to apply for recognition if your building achieves superior energy performance and is

U.S. DOE TAP Webinar Internal Benchmarking Outreach and Data Collection Techniques
Joel Blaine, Zach Shelin, Rachel Emerson Page 12 of 33
Page 12 of 33
eligible to get an EnergyStar score, which we’ll touch on in just a second.
PortfolioManager is also a metrics calculator. It provides over 400
metrics that you can use to advance your energy management plans. And so just a few examples of those are source and site energy use intensity – and we also have weather normalized energy use intensity available – the EnergyStar 1 to 100 score, which much of you are probably familiar with, and then also greenhouse gas emissions tracking and water consumption. And it’s very easy to access PortfolioManager. All of that is available at no cost at the URL energystar.gov/benchmark.
So if we move into the next slide, I’m going to talk briefly about
getting that commitment to benchmark that Joel mentioned earlier. So I’ve included a link there to some of our tips. But one of the ways that you can secure buy-in from management and make sure that folks are on board with the benchmarking effort is by learning to speak their language. And what I mean by that is talking in dollars rather than in BTUs and not getting caught up too much in the technical jargon. So any proposals that are made to senior management should establish some clear and feasible cost savings goals. And in an effort to speak their language, we would encourage you to use some of those key financial metrics, like net present value, internal rate of return, and so forth. So if the case is made with metrics, you’re much more likely to go further with benchmarking.
And life cycle costs versus first cost is also a very important thing
to emphasize. A lot of energy efficiency improvements may have a higher first cost, but end up saving money in the long run. And you can back that up with some real-world proof. I know there’s a lot of case studies available with EnergyStar. And it also helps to compare to competitors. EnergyStar allows you to compare your building’s energy performance to other buildings, both within your portfolio and nationwide. So it can show you how you’re doing relative to your competing organizations and owners of similar-type buildings throughout the country. So that’s also a way to help move forward.
So moving on to the next slide, we’re going to talk about planning
a reporting strategy in PortfolioManager. So first determine a baseline period based on what your goals are. Are you going to reduce energy relative to a baseline of 2009 or 2005? So make sure that that’s decided up front. And then also make sure that you’re capturing the best reporting metrics in PortfolioManager.

U.S. DOE TAP Webinar Internal Benchmarking Outreach and Data Collection Techniques
Joel Blaine, Zach Shelin, Rachel Emerson Page 13 of 33
Page 13 of 33
There’s a couple of those in the table over to the right. And I would encourage you to check out the custom reporting section of PortfolioManager to find the others that are available.
Also set a timeline to share your results with management and with
other folks in the company, and make sure that benchmarking is integrated into energy efficiency project development so you can track the success of those energy efficiency projects. And also set up a schedule for public reporting so you can get the word out and get recognized by the public for your benchmarking and your improvements on energy performance.
And the next slide will talk a bit about what Joel mentioned earlier
as far as dividing the data between PortfolioManager accounts. So when you start out your benchmarking plan, make sure to determine how many PortfolioManager accounts you need, and then also assign folks to take over each PortfolioManager account.
So here’s an example. And how you divide this data and the buildings is entirely up to you and depends on the circumstances unique to your organization. Here’s just an example. So say there’s an overall organization split up into regions. And then each of those regions has what we call an EnergyStar captain managing their PortfolioManager data. So you’ll see at the bottom that there’s the buildings themselves, each managed by the EnergyStar captain. They’ll share that information up to the region captain. And then those region captains will in turn share it up to the main organization account, just so that everybody is able to see the data. But the ones who are working on the benchmarking day-to-day are the facility personnel that are most familiar with the data, who know where to find it and are able to make any corrections. And the next slide. First, when you set up benchmarking, make sure to designate points of contact and figure out who is going to have what roles and responsibilities with benchmarking. And again, that’s going to entirely depend on your organization. We have seen some organizations that choose to have their maintenance department take charge of benchmarking. Others find it easier to have accounting take over, since they are most familiar with putting numbers in the system, organizing all of the data, and knowing where everything is. And we’ve even seen some that use interns to have that responsibility. So whatever works the best for your organization. Just make sure that it’s consistent and that everybody knows who is in charge of the accounts.
U.S. DOE TAP Webinar Internal Benchmarking Outreach and Data Collection Techniques
Joel Blaine, Zach Shelin, Rachel Emerson Page 14 of 33
Page 14 of 33
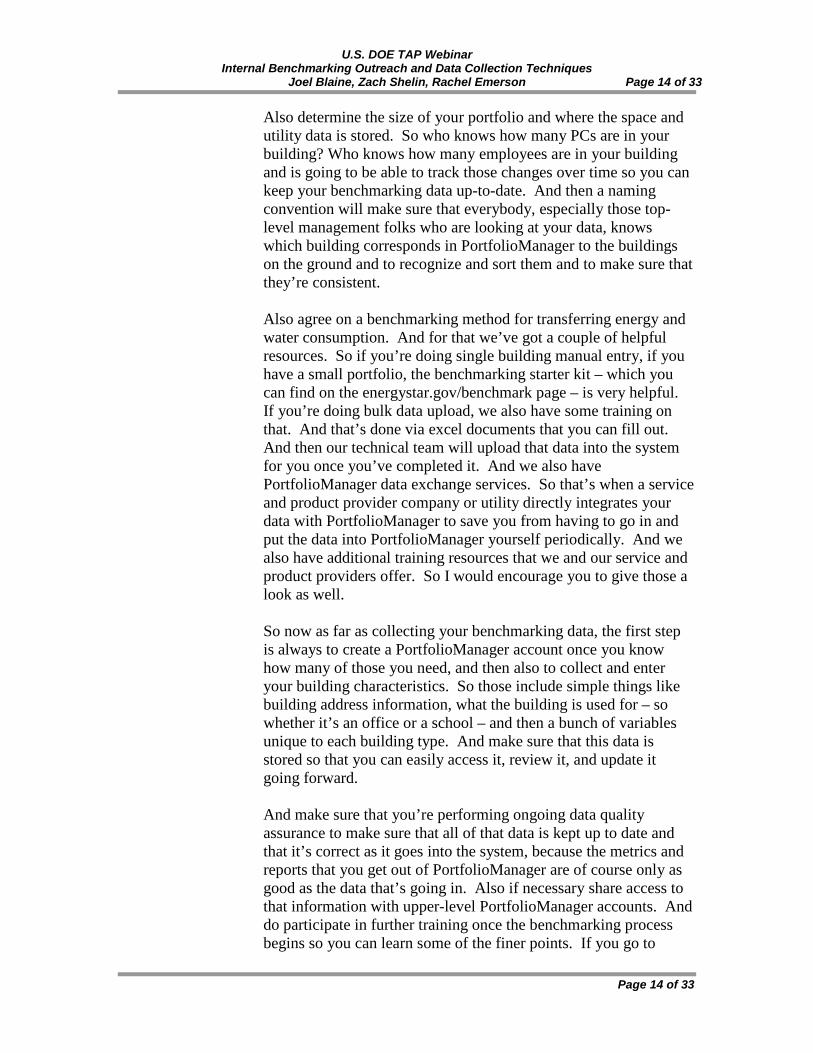
Also determine the size of your portfolio and where the space and utility data is stored. So who knows how many PCs are in your building? Who knows how many employees are in your building and is going to be able to track those changes over time so you can keep your benchmarking data up-to-date. And then a naming convention will make sure that everybody, especially those top-level management folks who are looking at your data, knows which building corresponds in PortfolioManager to the buildings on the ground and to recognize and sort them and to make sure that they’re consistent. Also agree on a benchmarking method for transferring energy and water consumption. And for that we’ve got a couple of helpful resources. So if you’re doing single building manual entry, if you have a small portfolio, the benchmarking starter kit – which you can find on the energystar.gov/benchmark page – is very helpful. If you’re doing bulk data upload, we also have some training on that. And that’s done via excel documents that you can fill out. And then our technical team will upload that data into the system for you once you’ve completed it. And we also have PortfolioManager data exchange services. So that’s when a service and product provider company or utility directly integrates your data with PortfolioManager to save you from having to go in and put the data into PortfolioManager yourself periodically. And we also have additional training resources that we and our service and product providers offer. So I would encourage you to give those a look as well. So now as far as collecting your benchmarking data, the first step is always to create a PortfolioManager account once you know how many of those you need, and then also to collect and enter your building characteristics. So those include simple things like building address information, what the building is used for – so whether it’s an office or a school – and then a bunch of variables unique to each building type. And make sure that this data is stored so that you can easily access it, review it, and update it going forward. And make sure that you’re performing ongoing data quality assurance to make sure that all of that data is kept up to date and that it’s correct as it goes into the system, because the metrics and reports that you get out of PortfolioManager are of course only as good as the data that’s going in. Also if necessary share access to that information with upper-level PortfolioManager accounts. And do participate in further training once the benchmarking process begins so you can learn some of the finer points. If you go to
U.S. DOE TAP Webinar Internal Benchmarking Outreach and Data Collection Techniques
Joel Blaine, Zach Shelin, Rachel Emerson Page 15 of 33
Page 15 of 33
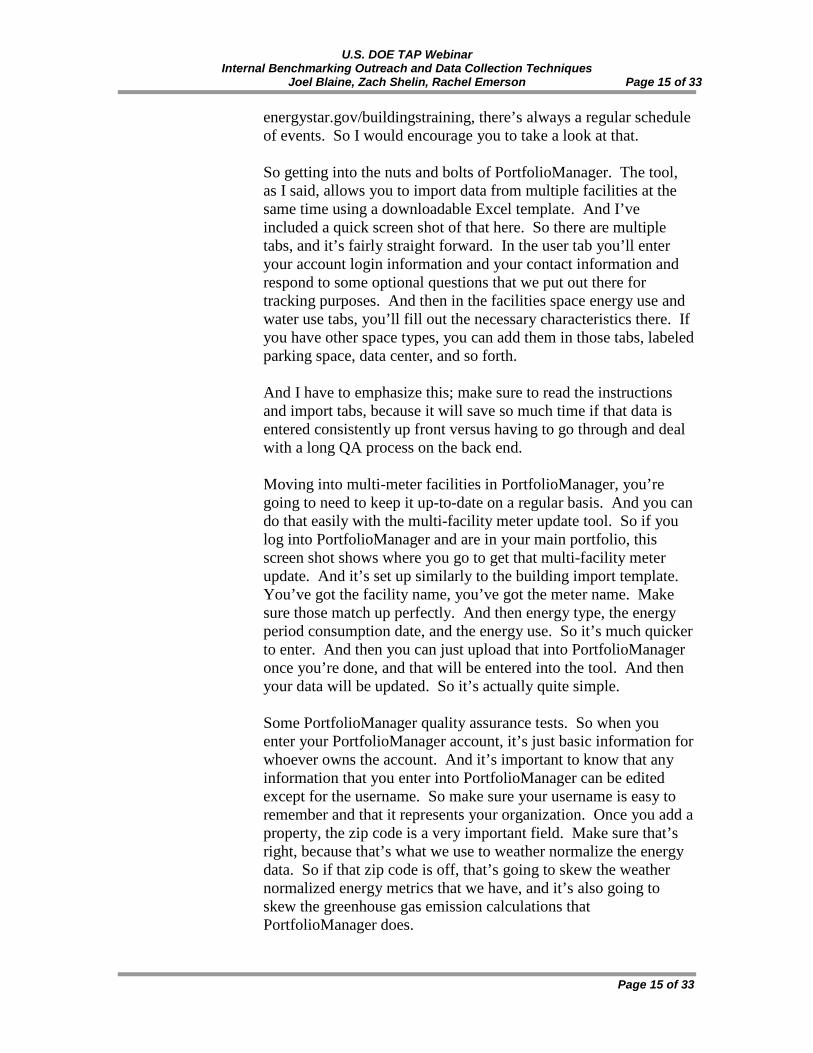
energystar.gov/buildingstraining, there’s always a regular schedule of events. So I would encourage you to take a look at that. So getting into the nuts and bolts of PortfolioManager. The tool, as I said, allows you to import data from multiple facilities at the same time using a downloadable Excel template. And I’ve included a quick screen shot of that here. So there are multiple tabs, and it’s fairly straight forward. In the user tab you’ll enter your account login information and your contact information and respond to some optional questions that we put out there for tracking purposes. And then in the facilities space energy use and water use tabs, you’ll fill out the necessary characteristics there. If you have other space types, you can add them in those tabs, labeled parking space, data center, and so forth. And I have to emphasize this; make sure to read the instructions and import tabs, because it will save so much time if that data is entered consistently up front versus having to go through and deal with a long QA process on the back end. Moving into multi-meter facilities in PortfolioManager, you’re going to need to keep it up-to-date on a regular basis. And you can do that easily with the multi-facility meter update tool. So if you log into PortfolioManager and are in your main portfolio, this screen shot shows where you go to get that multi-facility meter update. And it’s set up similarly to the building import template. You’ve got the facility name, you’ve got the meter name. Make sure those match up perfectly. And then energy type, the energy period consumption date, and the energy use. So it’s much quicker to enter. And then you can just upload that into PortfolioManager once you’re done, and that will be entered into the tool. And then your data will be updated. So it’s actually quite simple. Some PortfolioManager quality assurance tests. So when you enter your PortfolioManager account, it’s just basic information for whoever owns the account. And it’s important to know that any information that you enter into PortfolioManager can be edited except for the username. So make sure your username is easy to remember and that it represents your organization. Once you add a property, the zip code is a very important field. Make sure that’s right, because that’s what we use to weather normalize the energy data. So if that zip code is off, that’s going to skew the weather normalized energy metrics that we have, and it’s also going to skew the greenhouse gas emission calculations that PortfolioManager does.
U.S. DOE TAP Webinar Internal Benchmarking Outreach and Data Collection Techniques
Joel Blaine, Zach Shelin, Rachel Emerson Page 16 of 33
Page 16 of 33
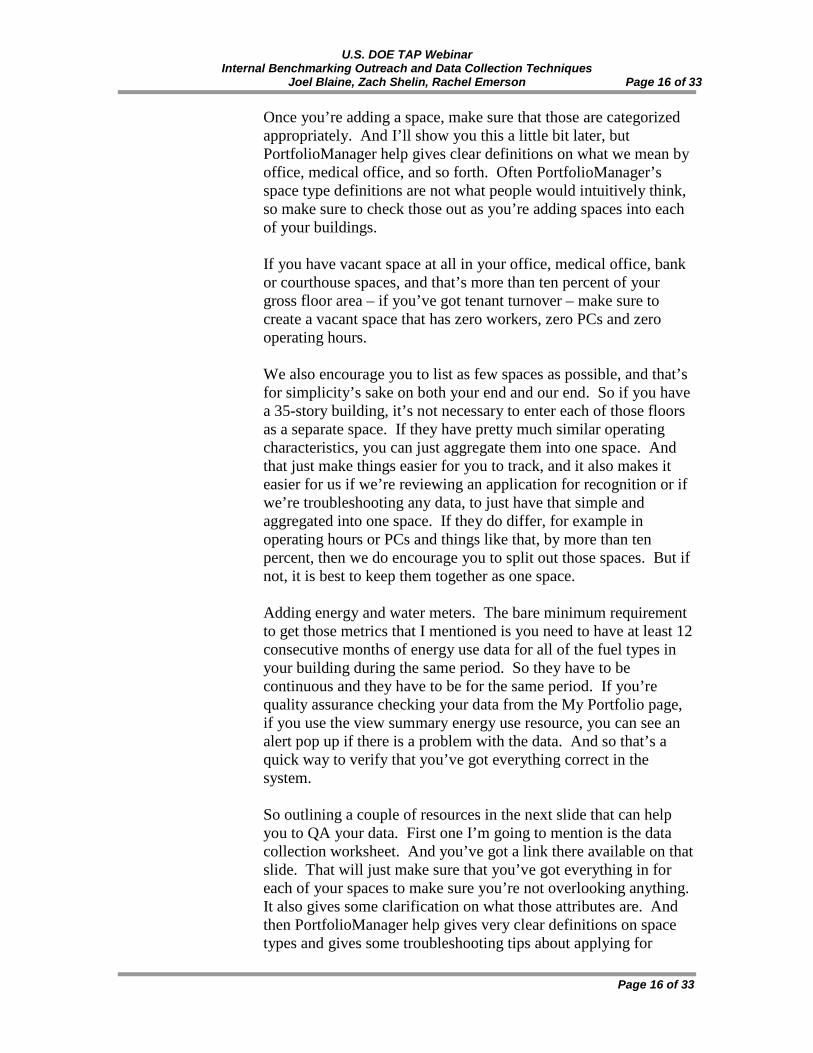
Once you’re adding a space, make sure that those are categorized appropriately. And I’ll show you this a little bit later, but PortfolioManager help gives clear definitions on what we mean by office, medical office, and so forth. Often PortfolioManager’s space type definitions are not what people would intuitively think, so make sure to check those out as you’re adding spaces into each of your buildings. If you have vacant space at all in your office, medical office, bank or courthouse spaces, and that’s more than ten percent of your gross floor area – if you’ve got tenant turnover – make sure to create a vacant space that has zero workers, zero PCs and zero operating hours. We also encourage you to list as few spaces as possible, and that’s for simplicity’s sake on both your end and our end. So if you have a 35-story building, it’s not necessary to enter each of those floors as a separate space. If they have pretty much similar operating characteristics, you can just aggregate them into one space. And that just make things easier for you to track, and it also makes it easier for us if we’re reviewing an application for recognition or if we’re troubleshooting any data, to just have that simple and aggregated into one space. If they do differ, for example in operating hours or PCs and things like that, by more than ten percent, then we do encourage you to split out those spaces. But if not, it is best to keep them together as one space. Adding energy and water meters. The bare minimum requirement to get those metrics that I mentioned is you need to have at least 12 consecutive months of energy use data for all of the fuel types in your building during the same period. So they have to be continuous and they have to be for the same period. If you’re quality assurance checking your data from the My Portfolio page, if you use the view summary energy use resource, you can see an alert pop up if there is a problem with the data. And so that’s a quick way to verify that you’ve got everything correct in the system. So outlining a couple of resources in the next slide that can help you to QA your data. First one I’m going to mention is the data collection worksheet. And you’ve got a link there available on that slide. That will just make sure that you’ve got everything in for each of your spaces to make sure you’re not overlooking anything. It also gives some clarification on what those attributes are. And then PortfolioManager help gives very clear definitions on space types and gives some troubleshooting tips about applying for

U.S. DOE TAP Webinar Internal Benchmarking Outreach and Data Collection Techniques
Joel Blaine, Zach Shelin, Rachel Emerson Page 17 of 33
Page 17 of 33
recognition and other things like that. So it’s a great resource. It’s available right in the PortfolioManager tool. So if you ever have a question about benchmarking or are wondering if you’ve captured that space type correctly, first resource to go to is PortfolioManager help for assistance with those. In the next slide we’ll cover some common pitfalls with PortfolioManager data. And one of those is incomplete meter data. So all meters need to have complete usage data through the entire reporting period. And so what that means is that there can’t be any gaps and there also can’t be any overlaps in the data. For example, if you’ve got data running through March and through April, if the March data ends March 30th, the April data doesn’t start until April 1st, the tool will get an error because there is a gap in data. The same thing with overlap. If the first period doesn’t end until April 2nd but the second period that you’ve entered starts April 1st, there will also be an error because of that overlap. Also, no individual electric meter entry can be for a period longer than 65 days. And that’s because that throws off the weather normalized metrics that we have. So we need to be able to have that data on a monthly basis if at all possible. If you notice that your building’s energy use intensity or water use intensity is having some extreme fluctuations, that’s often just a simple data entry error that can be outlined fairly quickly. A couple of common ones that we’ve seen include mismatched units. So if you’re entering gas, typically it’s in CCF, not MCF. And same for electricity; kilowatt hours, not megawatt hours. Also if there are missing digits. If you meant to put in 150,000 kilowatt hours but instead put in 15,000, that can also be an issue. Extra digits or transposed digits is basically the same issue. And then sometimes we also run into swapped cost and consumption information. So people will enter the cost on their utility bill for one month instead of the actual consumption. The final one that I’ll add in in addition to those is demand. Sometimes people are adding in their kilowatt demand on average for a given month instead of the actual billed kilowatt hours they used in that month. So make sure to avoid stepping into those common pitfalls. So once you’ve got that down, you can move forward with benchmarking in QA by training your team. And we’ve got a lot of no-cost training resources available at energystar.gov/buildingstraining. We’ve got some basics of benchmarking sessions and broad overviews of PortfolioManager.
U.S. DOE TAP Webinar Internal Benchmarking Outreach and Data Collection Techniques
Joel Blaine, Zach Shelin, Rachel Emerson Page 18 of 33
Page 18 of 33
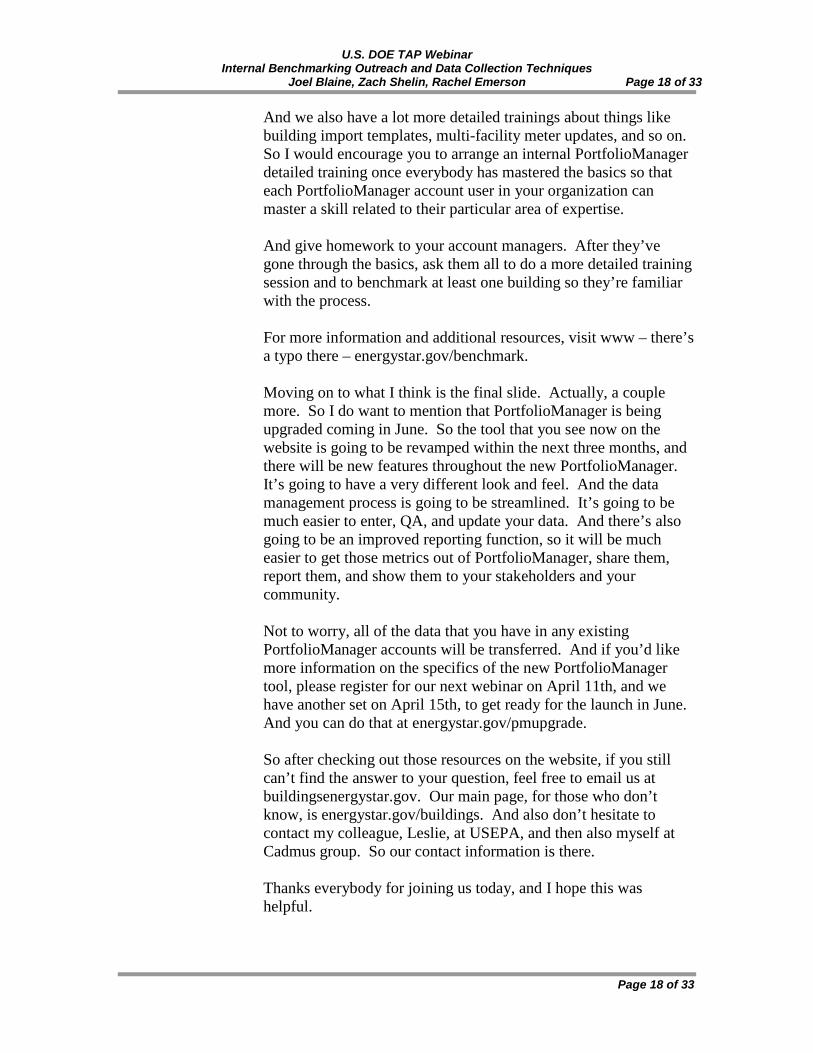
And we also have a lot more detailed trainings about things like building import templates, multi-facility meter updates, and so on. So I would encourage you to arrange an internal PortfolioManager detailed training once everybody has mastered the basics so that each PortfolioManager account user in your organization can master a skill related to their particular area of expertise. And give homework to your account managers. After they’ve gone through the basics, ask them all to do a more detailed training session and to benchmark at least one building so they’re familiar with the process. For more information and additional resources, visit www – there’s a typo there – energystar.gov/benchmark. Moving on to what I think is the final slide. Actually, a couple more. So I do want to mention that PortfolioManager is being upgraded coming in June. So the tool that you see now on the website is going to be revamped within the next three months, and there will be new features throughout the new PortfolioManager. It’s going to have a very different look and feel. And the data management process is going to be streamlined. It’s going to be much easier to enter, QA, and update your data. And there’s also going to be an improved reporting function, so it will be much easier to get those metrics out of PortfolioManager, share them, report them, and show them to your stakeholders and your community. Not to worry, all of the data that you have in any existing PortfolioManager accounts will be transferred. And if you’d like more information on the specifics of the new PortfolioManager tool, please register for our next webinar on April 11th, and we have another set on April 15th, to get ready for the launch in June. And you can do that at energystar.gov/pmupgrade. So after checking out those resources on the website, if you still can’t find the answer to your question, feel free to email us at buildingsenergystar.gov. Our main page, for those who don’t know, is energystar.gov/buildings. And also don’t hesitate to contact my colleague, Leslie, at USEPA, and then also myself at Cadmus group. So our contact information is there. Thanks everybody for joining us today, and I hope this was helpful.

U.S. DOE TAP Webinar Internal Benchmarking Outreach and Data Collection Techniques
Joel Blaine, Zach Shelin, Rachel Emerson Page 19 of 33
Page 19 of 33
Joel Blaine: Thanks, Zach. I think that was really good information. Next we have Rachel Emerson from the State of Delaware. Rachel is a LEED AP L+M and serves as the energy resource manager in the Office of Management and Budget. We are very happy to have Rachel here today. So I’ll just go ahead and turn it over to her.
Rachel Emerson: Thank you. First I want to thank the folks at the U.S. Department
of Energy for including the State of Delaware in today’s webinar. It’s a special opportunity for us to be a part of the national dialogue on benchmarking, and we hope that our experiences will resonate with those of you in the audience today. We hope that our successes provide some useful examples, and I think you’ll see that we’ve been through a lot of those challenges in a lot of ways.
So when we talk about energy benchmarking at the State of
Delaware, the discussion really goes back to Executive Order 18. Following an extensive period of input and discussion among many state agencies, there was a leading by example executive order that was issued by Governor Markell in February of 2010. It required executive branch agencies to work toward a clean energy economy and a sustainable natural environment over a period of five years through six task areas.
One of the task areas was energy conservation and efficiency,
which included a sub-task of benchmarking. So in the language of the EO, which I’ve hyperlinked later in the presentation, you can see how important the state felt benchmarking would become and the work that we would have to do to achieve the specific energy conservation and efficiency goals. We were directed not only to reduce our energy consumption according to incremental targets, but to also do so in ways that would reduce operating expenses and greenhouse gas emissions.
As a result, the EO specified that executive agencies had to
benchmark, monitor, and track this threefold scope. So our data goes back to 2007 and we will continue to report through 2015.
I do want to talk a little bit about the last four bullets on this slide,
as they get into the kind of cultural changes that took place as a result of benchmarking being included in the executive order. Facility managers are given reports quarterly highlighting the energy use trends in the buildings within their care. The spreadsheets are fairly simple. They are sorted by facility and show the electricity, natural gas, et cetera, and the percent change from the 2008 baseline. And typically these spreadsheets are

U.S. DOE TAP Webinar Internal Benchmarking Outreach and Data Collection Techniques
Joel Blaine, Zach Shelin, Rachel Emerson Page 20 of 33
Page 20 of 33
distributed to the maintenance superintendents who then share the kudos or opportunities for improvement with their technicians.
We also share these reports with mechanical engineers, as the data
helps them identify HVAC issues or building automation overrides according to changes in consumption. The reports also help engineers prioritize efficiency replacements like lighting, fans, drives, et cetera.
Similar reports feed into projects like the ARRA energy efficiency
upgrades or performance contracting. They are used to forecast the ROI and to support M&V after the projects are complete. And we’re actually just getting into the M&V now, and our scope is a little over 40 buildings.
The greenhouse gas reports feed into statewide programs for
reducing Delaware’s impact on climate change. The reports show what impact state government is having, although this is only one piece of the pie. Our Department of Natural Resources is looking at this much more holistically with data from other sectors, like industries and businesses.
Finally, the energy consumption reports feed into renewable
energy studies. Based on the volume and the cost of electricity coming off the grid, we are able to determine the ROI of various renewable energy options. Some are better than others depending on the site. We’re also able to evaluate the load characteristics of the buildings and use that information to help determine the most appropriate energy option. Next slide, please.
As you see here, EO18 was written as a top-down initiative. The
Governor had specific performance metrics and timelines for achievement, and he required cabinet-level support and oversight throughout the life of the EO. The cabinet was required to designate sustainability managers from each executive branch to head up an EO18 work group. They had two weeks to do it. The resulting work group included agency directors, bureau chiefs, and other managers closely involved with each department facility operation.
The work group then had the responsibility of carrying out the
requirements of the EO through communications with executive agencies as well as with utilities. And the utilities, being the external factor here, were handled a little bit differently by each agency. Typically we started with each agency’s financial office, providing expenditure reports for invoices coded to energy. From
U.S. DOE TAP Webinar Internal Benchmarking Outreach and Data Collection Techniques
Joel Blaine, Zach Shelin, Rachel Emerson Page 21 of 33
Page 21 of 33
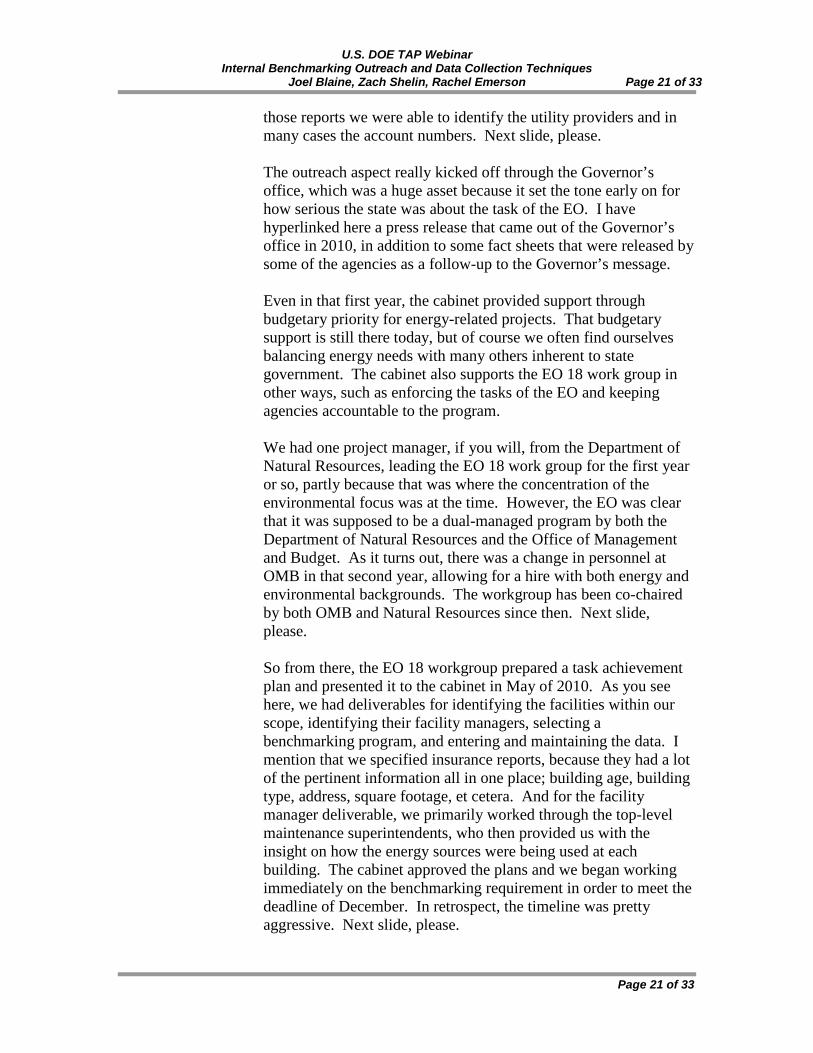
those reports we were able to identify the utility providers and in many cases the account numbers. Next slide, please.
The outreach aspect really kicked off through the Governor’s
office, which was a huge asset because it set the tone early on for how serious the state was about the task of the EO. I have hyperlinked here a press release that came out of the Governor’s office in 2010, in addition to some fact sheets that were released by some of the agencies as a follow-up to the Governor’s message.
Even in that first year, the cabinet provided support through
budgetary priority for energy-related projects. That budgetary support is still there today, but of course we often find ourselves balancing energy needs with many others inherent to state government. The cabinet also supports the EO 18 work group in other ways, such as enforcing the tasks of the EO and keeping agencies accountable to the program.
We had one project manager, if you will, from the Department of
Natural Resources, leading the EO 18 work group for the first year or so, partly because that was where the concentration of the environmental focus was at the time. However, the EO was clear that it was supposed to be a dual-managed program by both the Department of Natural Resources and the Office of Management and Budget. As it turns out, there was a change in personnel at OMB in that second year, allowing for a hire with both energy and environmental backgrounds. The workgroup has been co-chaired by both OMB and Natural Resources since then. Next slide, please.
So from there, the EO 18 workgroup prepared a task achievement
plan and presented it to the cabinet in May of 2010. As you see here, we had deliverables for identifying the facilities within our scope, identifying their facility managers, selecting a benchmarking program, and entering and maintaining the data. I mention that we specified insurance reports, because they had a lot of the pertinent information all in one place; building age, building type, address, square footage, et cetera. And for the facility manager deliverable, we primarily worked through the top-level maintenance superintendents, who then provided us with the insight on how the energy sources were being used at each building. The cabinet approved the plans and we began working immediately on the benchmarking requirement in order to meet the deadline of December. In retrospect, the timeline was pretty aggressive. Next slide, please.

U.S. DOE TAP Webinar Internal Benchmarking Outreach and Data Collection Techniques
Joel Blaine, Zach Shelin, Rachel Emerson Page 22 of 33
Page 22 of 33
During this process, the Executive Order 18 work group met monthly and reported to the cabinet quarterly on progress toward a task. These monthly meetings and quarterly reports are something that continue today and will be ongoing through 2015. In fact, we just had a meeting yesterday. In our monthly meetings, we review the status of our collective efforts toward the tasks of the EO, and we often share some of our individual best practices since our agencies and experiences are so widely varied. And for many of us, the past years together have been a huge learning curve because we’ve been working closely with agencies that we otherwise would not have had the opportunity to engage in our own operations.
In the quarterly reports, we provide both compliance figures and
milestones of achievement by the group as a whole and by individual agencies. We’ve always included successes and challenges in these reports in addition to the raw data so that the cabinet could have a fuller, more meaningful understanding of the work being done on the EO. While the report includes data on benchmarking, such as the number of buildings being tracked and the current energy reduction percentage, it also includes data on the other tasks of the EO. These things cover things like waste diversion, clean transportation, environmentally sensitive procurement, and green building operation. Next slide, please.
Since we have been successful is the accountability structure that
was built into it. Since the sustainability managers on the EO work group were largely directors, bureau chiefs, and other managers, there is a direct line to the agency staff throughout the executive branch. As you see here, we use that direct line in a number of decentralized approaches; promoting the value of benchmarking, energy conservation, and the other tasks of the EO. I’ve hyperlinked a couple of examples here so you can see some of the communications that went out and are still out there today for anyone who may be curious about greening efforts in Delaware.
For the most part each of the sustainability managers on the work
group use some combination of email blasts, green committees, posters, and signs. I actually got my agency’s posters from the U.S. Department of Energy. It’s the one about turning words into action, and it has an image of an arm reaching to turn off a light switch, with all the reasons for not taking action filled into the arm. And, of course, all those reasons are gone after the switch is turned off, because we do start to recognize and give more weight to the benefits.

U.S. DOE TAP Webinar Internal Benchmarking Outreach and Data Collection Techniques
Joel Blaine, Zach Shelin, Rachel Emerson Page 23 of 33
Page 23 of 33
I also designed some signs in-house to show where we have made upgrades to visible things, like lighting and plumbing fixtures. They had two or three-line blurbs about energy or water statistics, and then the benefits of conservation. The idea was to show people that conservation didn’t have to just be about sacrifice; it could also be about improvement, which they could readily see in the improved lighting and the nicer-looking faucets.
In retrospect, there were a few lessons learned. First, emails don’t
really work so well unless you have some degree of face time with the recipients. Otherwise, they are very likely to delete your email and move on. By far green committees work the best because they aggregate a broad spectrum of ideas and experiences, and because many of the participants are volunteering their time and support by virtue of self-selection, they are very passionate about the desired outcomes and they are very driven to see them through. Next slide, please.
This gets into the collection aspect. Because we have ten very
different state departments working toward the benchmarking requirement of EO 18, we really had to go with a decentralized approach to data collection. First, we identified our scope through state property lists with the directors, bureau chiefs, and other managers on the work group. We had already been using the property lists for other reasons, such as lease management. In that context, we had been receiving updated reports pretty much annually, so we knew that the information was current and reliable. Taking the information into benchmarking was a fairly intuitive step for our group.
While the property lists did help us tie many meters to the
respective facilities by service address, we found that some meters were shared among buildings in campus-type settings. So that was something we had to investigate further through site visits and talking with the facility managers.
From there, the work group sustainability managers contacted the
fiscal offices for their agencies in order to get the payment information which I mentioned earlier; which utilities own the meters at each site and the corresponding account numbers where available. In these communications there was a lot of weight in the driver being an executive order. Ultimately, no one wanted to be cast in a negative light to the cabinet or to the governor. So cooperation and compliance was something that was just understood.

U.S. DOE TAP Webinar Internal Benchmarking Outreach and Data Collection Techniques
Joel Blaine, Zach Shelin, Rachel Emerson Page 24 of 33
Page 24 of 33
Once we had the service addresses, meter numbers, and or the account numbers, the work group approached the utilities to get usage reports. In some cases, sustainability managers were able to come to an agreement with their agency’s accounting staff so that those folks contact the utilities and handled the reporting since they were already seeing the invoices. The work group also met with utility staff to explain not only the initial data retrieval requirements, but also that long-term commitment to reporting monthly energy use for each of the facilities.
Some of the utilities did ask us to demonstrate authority to receive
invoice data. It really depended on the utility and the extent of the reporting. For example, I had to show authorization from other agencies to retrieve their data from one of the smaller electricity providers. The understood the request, they just wanted to cover themselves for sharing the information. Next slide, please.
Of course with a decentralized approach, our group has a lot of
different techniques for getting the data. Some of the state departments have relatively small portfolios, with 10 to 15 buildings in their scope. For them, there has been some success with manually pulling the data. Each agency contacts either the fiscal office or the utility to get the invoice copies. And they typically do this every two to three months.
Some of the state departments, like mine for example, have
upwards of 40, 50, or 60 buildings in their scope. And it’s made more sense for us to get streamlined, periodic reports. In most cases the utilities provide monthly spreadsheets of energy usage for each of the facilities. So, for example, my natural gas report may have 30 facilities, my municipal electric may have 20, and so on. Where we have only one or two facilities on a given utility, our fiscal offices send us the invoice copies monthly. We do have one utility provider that has online reporting, and this has been a huge help with managing large groups of facilities. I think my online access right now includes somewhere around 50 or 60 facilities. Next slide, please.
We worked on learning how to enter it into the benchmarking
program that we selected. The work group learned EnergyStar’s PortfolioManager and trained agency staff in preparation of energy reporting. As you see here, much of the training was about the what and the how; the building data, the types of energy sources, account numbers, how to read and report energy use metrics – that was a big one – and how to report energy costs. Some of it was just a matter of sitting down with the accounting folks and showing

U.S. DOE TAP Webinar Internal Benchmarking Outreach and Data Collection Techniques
Joel Blaine, Zach Shelin, Rachel Emerson Page 25 of 33
Page 25 of 33
them how to use PortfolioManager, as they were already familiar with the building inventory for their agency and the utility invoices. Some of it, though, was a bit more in-depth. We did have some facility managers handling the entry duties, but they were not used to be computer oriented. So we had to really walk through the quirks of PortfolioManager, and there are a few, like gaps between meter entries, overlapping meter dates, an space definitions, to name a few. We really had to teach the language of PortfolioManager in those cases. Next slide, please.
For example, within our department of state, Historical and
Cultural Affairs handles reporting for its buildings, and Veteran Affairs handles its own reporting. The same is true for a few of the other departments on the EO. Through PortfolioManager, each of the agencies provides sharing access to the Office of Management and Budget, which is the central sharing point of aggregation and analysis of the statewide portfolio. OMB reviews the portfolio monthly and reaches out to sustainability managers when data appears inaccurate or incomplete, or when reporting indicates a possible increase in energy consumption, because that’s really why we’re using this. OMB also contacts sustainability managers when agencies are behind in reporting by greater than three months and when there are unique circumstances driving a smaller grace period.
I am actually the OMB central sharing point for our state portfolio.
Each agency has given me at least reading permissions to its portfolio. Some have given me more editing-type access just based on the relationship that we’ve built over time. I review each agency’s data about once a month and send quarterly reports back out to the work group and to the cabinet showing our overall volume, the makeup of that volume by facility and by state department, and our energy use reduction percentage, again, by facility, by state department, and the overall for the group.
These reports often feed into capital budget planning and ongoing
maintenance for the buildings. Within my agency, we’ve turned it into a good-spirited competition among the maintenance superintendents to see who can have the most efficiently running buildings. I also contact the work group sustainability managers by email when their portfolios show some QA/QC red flags, like outdate reporting, big changes in energy use, or overlapping meter entries. The most common issue that I’ve seen is the data not being current. It’s easy to drop off for three, four months at a time without realizing it.

U.S. DOE TAP Webinar Internal Benchmarking Outreach and Data Collection Techniques
Joel Blaine, Zach Shelin, Rachel Emerson Page 26 of 33
Page 26 of 33
And I admit that the QA/QC process from my side is not foolproof, especially when dealing with this many facilities and meters. Being a part of the Better Buildings Challenge has helped us a lot, because we’ve gotten a fresh set of eyes to review the data with us. To keep the information easy to use on my side, I do sort the portfolios in PortfolioManager by state departments. For example, the buildings that correlate to the Department of Corrections, the Department of Health and Social Services, et cetera. The last thing that I would like to mention about this slide is that I do post my agency’s energy use report on our state government website. I have hyperlinked it here, if you’d like to take a look. I update it quarterly, and I find that the public does take a look at it from time to time especially since we are undertaking so many performance contracts. There is a curiosity to see if and when we will start to see results of those investments. So naturally there have been some lessons learned with these varying techniques for data collection. Manual requests can be very time-consuming, especially when reporting is significantly behind or when the scope is over 10 or 15 buildings. Outside of automated reporting directly into PortfolioManager, which we do not have at this time, streamlined period reports are the best solution for larger groups of accounts. But communication with utilities or fiscal offices is critical to making this work. We have found that while the utilities were very accommodating of our requests in the beginning, some really did not understand how we were using the information or why it was important. We had to walk them through what we needed, how often we needed it, and even what we did not need, so that the reporting was efficient for all of us. They have it nailed down to a science now, and I thank my contacts all the time for being such an important part of our benchmarking efforts, as this is very much a long-term relationship. We have been in it for three years now, and we have at least two more to go. Next slide, please. So that is benchmarking at the State of Delaware. Here is my contact information if you would like to discuss this with me again sometime. Again, I want to thank the U.S. Department of Energy for having Delaware on this webinar today. It is a true pleasure to be here with all of you. Thank you.
Joel Blaine: Great. Thanks so much, Rachel. And I know we have about 18 minutes. I’m going to sort of fast track through the Better
U.S. DOE TAP Webinar Internal Benchmarking Outreach and Data Collection Techniques
Joel Blaine, Zach Shelin, Rachel Emerson Page 27 of 33
Page 27 of 33
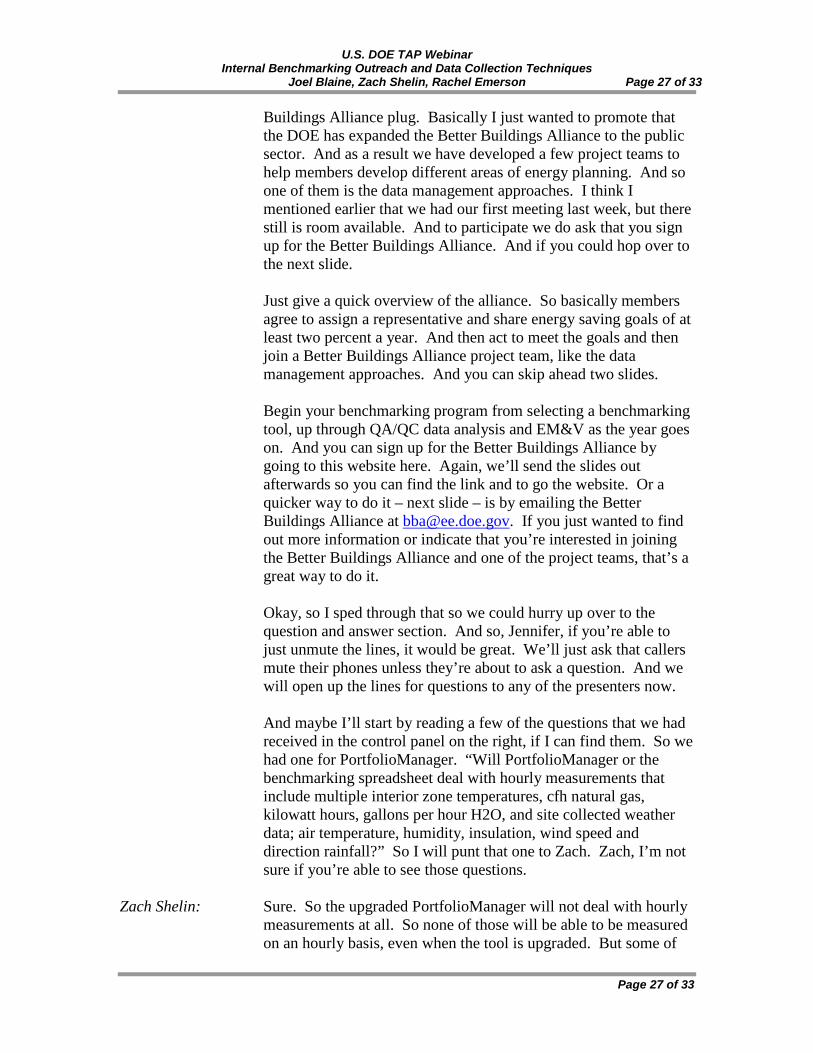
Buildings Alliance plug. Basically I just wanted to promote that the DOE has expanded the Better Buildings Alliance to the public sector. And as a result we have developed a few project teams to help members develop different areas of energy planning. And so one of them is the data management approaches. I think I mentioned earlier that we had our first meeting last week, but there still is room available. And to participate we do ask that you sign up for the Better Buildings Alliance. And if you could hop over to the next slide.
Just give a quick overview of the alliance. So basically members
agree to assign a representative and share energy saving goals of at least two percent a year. And then act to meet the goals and then join a Better Buildings Alliance project team, like the data management approaches. And you can skip ahead two slides.
Begin your benchmarking program from selecting a benchmarking
tool, up through QA/QC data analysis and EM&V as the year goes on. And you can sign up for the Better Buildings Alliance by going to this website here. Again, we’ll send the slides out afterwards so you can find the link and to go the website. Or a quicker way to do it – next slide – is by emailing the Better Buildings Alliance at [email protected]. If you just wanted to find out more information or indicate that you’re interested in joining the Better Buildings Alliance and one of the project teams, that’s a great way to do it.
Okay, so I sped through that so we could hurry up over to the
question and answer section. And so, Jennifer, if you’re able to just unmute the lines, it would be great. We’ll just ask that callers mute their phones unless they’re about to ask a question. And we will open up the lines for questions to any of the presenters now.
And maybe I’ll start by reading a few of the questions that we had
received in the control panel on the right, if I can find them. So we had one for PortfolioManager. “Will PortfolioManager or the benchmarking spreadsheet deal with hourly measurements that include multiple interior zone temperatures, cfh natural gas, kilowatt hours, gallons per hour H2O, and site collected weather data; air temperature, humidity, insulation, wind speed and direction rainfall?” So I will punt that one to Zach. Zach, I’m not sure if you’re able to see those questions.
Zach Shelin: Sure. So the upgraded PortfolioManager will not deal with hourly
measurements at all. So none of those will be able to be measured on an hourly basis, even when the tool is upgraded. But some of

U.S. DOE TAP Webinar Internal Benchmarking Outreach and Data Collection Techniques
Joel Blaine, Zach Shelin, Rachel Emerson Page 28 of 33
Page 28 of 33
those things that were mentioned in that question, specifically air temperature and then things like humidity and thermal comfort are included as part of an EnergyStar application. So a licensed professional verifying the application needs to verify that those things fall within accepted boundaries. But that’s the only interaction that PortfolioManager would have with things like that.
Joel Blaine: Great. Thanks, Zach. And maybe while I’m addressing you,
another question was, “Can you explain the difference between site and source use intensity?”
Zach Shelin: Yeah, absolutely. So site energy intensity takes the total energy
consumption that you see on your utility bills – and we measure it typically on a monthly or yearly basis. So, for example, 2012, you would add up the total amount of electricity and natural gas, if those were your two fuels, convert them into KBTU, because that’s an easy converting unit, and then divide them by the gross floor area of your building. So it’s a measure of the amount of energy that your building used divided by its number of square feet.
Source energy is that, and also takes into account all of the energy
that was originally used at the generation site, but was lost in getting to your building, through things like conversion and transmission. A quick example. For electricity the source energy to site energy ratio is about 3.34. So for every unit of energy you use at your building, there were 3.34 on average units of energy used to get that energy to your building. So that makes them different.
Joel Blaine: Thanks, Zach. So I just want to remind folks that you could either
unmute your phone when you’re ready to ask a question, or there’s also a questions box in the control panel on your right. If you want to type in questions there, that works. Or you can just ask over the phone. I’ll just open up the air for questions.
I’m just getting an indication that – if you do want to talk, if you
could go ahead and raise your hand virtually. That way we can see it and will be able to unmute you individually.
And maybe in the meantime I’ll just direct a question at Rachel.
Rachel, could you tell us a little bit about what the size of your portfolio was that you were working with and maybe number of buildings or square foot that incorporated?
Rachel Emerson: Sure. Our portfolio right now is about 230 facilities and multi-
facility complexes. And it’s a little over 8 million square feet.

U.S. DOE TAP Webinar Internal Benchmarking Outreach and Data Collection Techniques
Joel Blaine, Zach Shelin, Rachel Emerson Page 29 of 33
Page 29 of 33
Joel Blaine: Okay, great. Did you start out using the PortfolioManager tool, or
was there another process that you had before that? Rachel Emerson: In 2010, yes, we did start out with PortfolioManager. And that’s
the one that stuck. There were some that we had looked at in prior administrations, but it just really didn’t work out.
Joel Blaine: Okay, great. And we have a few more questions here. “Does the
State of Delaware provide incentives to state agencies for meeting their energy savings? If so, what type of incentives do they provide?”
Rachel Emerson: We do not right now, other than just kind of a kudos in the report
that goes to the cabinet. It is something that we’ve talked about, but we do not do any sort of incentive at this time.
Joel Blaine: Okay, great. “Is there any metrics on savings occurred by
benchmarking or does one need to implement some energy savings project to see the savings, either on average or specifically for the state of Delaware? Thanks.”
So maybe I’ll direct it first to you, Rachel. Rachel Emerson: Let me see if maybe I understand the question a little bit better. Joel Blaine: Sure. It sounds maybe it’s a question of if you’ve seen any savings
from benchmarking alone, or if you needed to implement energy savings projects to see savings.
Rachel Emerson: There is a little bit that comes from benchmarking, just because
you become more conscious of the energy use. I hate to say it this way, but unless you’re looking at the numbers, it’s really easy to kind of go on auto pilot. And when you start seeing the numbers and you start seeing how much you’re paying each month, there’s a light bulb moment of “wow”. And you start doing things like setting the building back and turning the lights down when you’re not using them. So there is something that comes from benchmarking. It wasn’t enough for us to meet our target, so that’s why we have been doing the bigger projects and the performance contracts, and things like that.
Joel Blaine: Great. Thanks. And Zach, do you have any insight on that
process?
U.S. DOE TAP Webinar Internal Benchmarking Outreach and Data Collection Techniques
Joel Blaine, Zach Shelin, Rachel Emerson Page 30 of 33
Page 30 of 33
Zach Shelin: On the EnergyStar site we actually did put together metrics like that. If you go to energystar.gov/benchmark and scroll down a little ways, right above the PortfolioManager login you’ll see a box that says EnergyStar data trends. And if you click on that, the first link in that report, if you scroll down towards the middle of the page, it’s called energy use benchmarking. And so that shows you some of the trends and energy reductions that we’ve seen just from benchmarking.
Joel Blaine: Great. Thanks. And that report tells a little bit – it doesn’t
necessarily make the link that benchmarking will absolutely save you energy, but it was more of on average buildings that did benchmark tended to perform better than those that didn’t – or something like that. Is that right?
Zach Shelin: Yeah. I think it’s the concept that just by tracking your energy use
and paying attention to it, you’ll automatically, subconsciously start doing things that will save your building energy.
Joel Blaine: Okay, great. “Is there a daily energy use report, or is it only a
monthly summary?” And maybe, Rachel, I’ll pass that to you first. Rachel Emerson: So you’re looking for if there’s a daily report versus a more spread
out kind of period of time? Joel Blaine: Yeah. It looks like the question is there a daily, or is it a monthly
summary. Rachel Emerson: I review it monthly, but the summaries that go out to our work
group members, to the cabinet, and to our maintenance superintendents, those are all quarterly. I’ve just found that if you send it out more frequently than that, it becomes information overload. They need a little bit of time in between to work on that, and then you come back to them with what the numbers are now, and they can see what the difference was.
Joel Blaine: Right. Great. And Zach, maybe you can discuss quickly the
PortfolioManager approach? Zach Shelin: Specifically with daily reports? Joel Blaine: Right. Zach Shelin: So there’s no daily EUI report in PortfolioManager, just because
most people don’t have daily energy data. I mean, utilities will often have it in give or take monthly intervals. But if you have a

U.S. DOE TAP Webinar Internal Benchmarking Outreach and Data Collection Techniques
Joel Blaine, Zach Shelin, Rachel Emerson Page 31 of 33
Page 31 of 33
plug load monitor or a meter that can provide daily energy entries, you’re certainly welcome to upload that information into PortfolioManager and then try and use that to create a daily energy use intensity metric. But that’s not one that’s currently available in PortfolioManager at the moment.
Joel Blaine: Great. “Is there a way on the new PortfolioManager to show
dollars saved? You mentioned this earlier for upper management reporting.”
Zach Shelin: Yeah. So in PortfolioManager you can record your energy costs
month by month, and then you can also use the metrics and the reporting to show your total energy costs on a monthly, yearly basis, and so forth. So once you’ve got the cost in there, you can use that to show your costs relative to your baseline, and that will show you on average how much you’re saving once you started benchmarking, or once you’ve done a specific energy efficiency project.
Joel Blaine: Thanks. And, Rachel, was there any component of cost associated
with the reports that you’re generating? Rachel Emerson: There wasn’t at first, because how we were using it at first was to
target buildings for the energy performance contracts, and how to deploy those ARRA funds. So at first, no. But now that we’ve really progressed with those projects and we’re wrapping them up and we’re starting to get into the M&V, there’s most definitely a cost aspect. You want to be able to look back and say this was the benefit of having undertaken a project of this size.
Joel Blaine: Gotcha. And are you recording the energy costs in another
location, just sort of the investment costs to track against the savings?
Rachel Emerson: Yeah. Joel Blaine: How is that managed? Rachel Emerson: That’s something that I do externally off PortfolioManager. I do
use PortfolioManager for the actual energy costs, but then I have files separately from that that I keep documents of how much each performance contract costs, and I compare the savings to the investment.
Joel Blaine: Great. I’m just going to take a look at the control panel to see if
anyone has a hand raised. I don’t see any now. Again, just a
U.S. DOE TAP Webinar Internal Benchmarking Outreach and Data Collection Techniques
Joel Blaine, Zach Shelin, Rachel Emerson Page 32 of 33
Page 32 of 33
reminder, you can raise your hand in the control panel and we can unmute your phone. It looks like we have one more question here. “With such a broad picture of energy use, how do you identify problems or measure the effective value of the solutions and upgrades?” And Zach, would you mind fielding this question first?
Zach Shelin: Yeah. So typically in PortfolioManager a building is going to have
monthly energy data. So given that, how do you identify problems? So one way is by comparing internally. If, for example, you have five office buildings in the same city and you’re entering the PortfolioManager data, and you’ve got one that’s got a score of 70, three that have a score of 60, and one that has a score of 40. Well then obviously you know that the one that has the score of 40 has got something going on that needs attention to improve its performance.
And then as far as measuring the effective value of solutions and upgrades, I’ll use the same example. So if you’ve got a building that’s got a score of 40 and then you start doing some retro commissioning and you upgrade the insulation and install new appliances, and then six months to a year after those upgrades have taken place, you find that the score has gone up to 80, then you know that those have had a positive and measurable effect.
Joel Blaine: Great. Thanks. And Rachel, how about with your experience at Delaware? How did you use your benchmarking to target facilities for those performance contracts?
Rachel Emerson: As far as targeting them, initially it was based on their
consumption volume and the size of the building, and also to some extent the condition of the building. So there were some that we knew really needed a lot of attention. And it wasn’t the sort of thing that we were going to be able to address through a capital budget and with the resources that we had in our staff. Like he was saying earlier that you can look at where you started, you can look at that EnergyStar rating, you can look at the energy use per square foot, and compare that to six months, 12 months, 18 months after the project and see that improvement over time. And we’ve had some pretty drastic improvements. It’s been really encouraging to see, actually.
Joel Blaine: Great. That’s great to hear. Okay, well, I think that about covers
our time here. I just want to thank, again, Rachel and Zach for presenting with us today and for all that were able to join in and

U.S. DOE TAP Webinar Internal Benchmarking Outreach and Data Collection Techniques
Joel Blaine, Zach Shelin, Rachel Emerson Page 33 of 33
Page 33 of 33
participate in the webinar. I look forward to seeing you guys all again online shortly. Thanks again, bye.
[End of Audio]