hhs public access michael h norris , and tung t. hoang ... prokaryotic cell isolation and total...
TRANSCRIPT

Single prokaryotic cell isolation and total transcript amplification protocol for transcriptomic analysis
Yun Kang1, Ian McMillan2, Michael H Norris2, and Tung T. Hoang1,2
1Department of Microbiology, University of Hawaii at Manoa, Honolulu, Hawaii 96822, USA
2Department of Molecular Biosciences and Bioengineering, University of Hawaii at Manoa, Honolulu, Hawaii 96822, USA
Abstract
Until recently, transcriptome analyses of single cells have been confined to eukaryotes. The
information obtained from single cell transcripts can provide detailed insight into spatiotemporal
gene-expression, and could be even more valuable if expanded to prokaryotic cells. Transcriptome
analysis of single prokaryotic cells is a recently developed and powerful tool. Here, we describe a
procedure that allows amplification of the total transcript of a single prokaryotic cell for in-depth
analysis. This is performed by utilizing a laser capture microdissection instrument for single cell
isolation, followed by reverse transcription via Moloney Murine Leukemia virus, degradation of
chromosomal DNA with McrBC and DpnI restriction enzymes, ss-cDNA ligation using T4
polynucleotide kinase and CircLigase, and polymerization of ss-cDNA to ds-cDNA by ϕ 29
polymerase. This procedure takes ~5 days, and sufficient amounts of ds-cDNA can be obtained
from single cell RNA template for further microarray analysis.
Keywords
Single prokaryotic cell; total transcript amplification; single cell isolation; laser microdissection; microarray
INTRODUCTION
The ability to isolate a single prokaryotic cell and analyze its transcriptome is a powerful
new tool that can bring a better understanding to unique behaviors in bacteria not observable
in multicellular bacterial populations. Single cell research was pioneered for eukaryotes
using multiple rounds of exponential amplification1 to analyze a single cell transcriptome.
This revolutionary development showed reproducible results with much higher efficiency
than conventional methods. Soon after, another method was developed that used multiple
Reprints and permissions information is available online at http://npg.nature.com/reprintsandpermissions
Correspondence should be addressed to T.T.H. ([email protected]).
COMPETING FINANCIAL INTERESTS The authors declare no competing financial interests.
AUTHOR CONTRIBUTIONST.T.H., Y. K., and M.H.N. designed the experiments. Y.K., I. M., and M.H.N. performed the experiments. Y.K., I.M., M.H.N., and T.T.H. wrote this manuscript.
HHS Public AccessAuthor manuscriptNat Protoc. Author manuscript; available in PMC 2016 January 01.
Published in final edited form as:Nat Protoc. 2015 July ; 10(7): 974–984. doi:10.1038/nprot.2015.058.
Author M
anuscriptA
uthor Manuscript
Author M
anuscriptA
uthor Manuscript

rounds of linear amplification of cDNA2 instead of exponential amplification. Both methods
rely on the isolation of a single cell via laser capture microdissection3,4 and amplification of
small quantities of mRNA into cDNA for analysis5–7. When we attempted these developed
methods for prokaryotic cells, they proved to be inefficient and impractical. To extend the
usefulness of single cell transcriptome into prokaryotes, a unique method of total transcript
amplification was developed using ϕ 29 polymerase for multiple displacement amplification
(MDA) of circularized cDNA8. To date, this is the only available protocol for analyzing
single prokaryotic transcriptome. This method was shown to overcome three problems with
total transcript amplification of prokaryotes; low levels of RNA in prokaryotes (0.1–2 pg
versus 10–50 pg in eukaryotes), a lack of poly(A)-tails, and the presence of polycistronic
mRNA. As proof of concept, this method was used in B. thailendensis for the identification
of genes up- or down-regulated in the presence and absence of a sub-inhibitory
concentration of glyphosate as the two comparable conditions8. It was proven to be very
efficient with approximately 94–96% of the total transcript successfully amplified in B.
thailendensis E264 via microarray analysis8. It is worth noting that, to cancel out the bias
from amplifying single-cell levels of transcript globally for downstream analysis, single cell
amplification and transcriptomic analysis should be identically performed for both
conditions being compared, such as wildtype and mutant strain, or in the presence and
absence of a compound treatment (e.g. glyphosate). Although not employed here, the
amplified cDNA could be analyzed by Next-Generation-Sequencing (NGS)9, with an
optional step to eliminate rRNAs and tRNAs for enrichment of mRNA8. Since the amount
of material required for NGS is much lower than microarray (nano-gram versus micro-gram
range), we expect that NGS may improve the detection of low abundant transcripts and/or
reduce amplification bias accumulated from multiple rounds of amplification. On the other
hand, when working with clinical samples or host-bacterium interaction models instead of a
pure bacterial culture, contamination of host or other bacterial RNA could be the potential
drawback in using NGS. Required sequencing depth for bacteria of interest could be
achieved by sequencing “deeper”, however, the cost could increase significantly, making the
NGS approach less appealing. Since the previous publication, our laboratory has
successfully utilized this protocol and microarrays for studying Pseudomonas aeruginosa
spatial gene expression in biofilm (Y.K. et al., unpublished observations), and Burkholderia
pseudomallei single cell transcriptome during macrophage infection (Y.K. et al.,
unpublished observations), suggesting that this protocol could be widely applicable in
bacteria. Additionally, our unpublished eukaryotic single cell data suggested that this
procedure could also be used for total transcript analysis of eukaryotic single cells by
replacing the random hexamers in this procedure with poly(T) oligos (Y.K. unpublished
observation).
This single prokaryotic cell total transcript amplification protocol allows for effective
isolation and efficient amplification of total RNA (or mRNA) for transcriptomic analysis.
The step-by-step protocol is summarized in Figure 1. To make it as widely applicable as
possible, we present here three different options for isolation of single cells from various
types of samples, including liquid samples, tissue samples, and host-cell monolayer
infection models. This protocol was validated independently by two researchers in our
laboratory, one with moderate experience in single eukaryotic cell transcript amplification
Kang et al. Page 2
Nat Protoc. Author manuscript; available in PMC 2016 January 01.
Author M
anuscriptA
uthor Manuscript
Author M
anuscriptA
uthor Manuscript
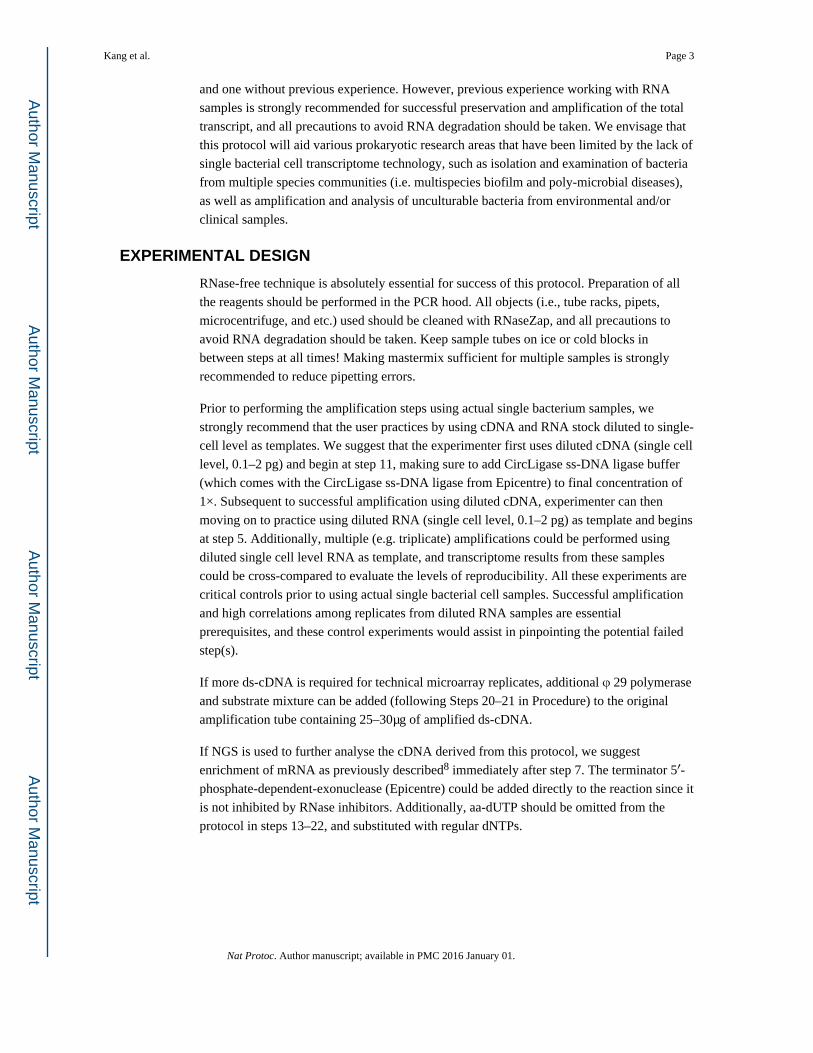
and one without previous experience. However, previous experience working with RNA
samples is strongly recommended for successful preservation and amplification of the total
transcript, and all precautions to avoid RNA degradation should be taken. We envisage that
this protocol will aid various prokaryotic research areas that have been limited by the lack of
single bacterial cell transcriptome technology, such as isolation and examination of bacteria
from multiple species communities (i.e. multispecies biofilm and poly-microbial diseases),
as well as amplification and analysis of unculturable bacteria from environmental and/or
clinical samples.
EXPERIMENTAL DESIGN
RNase-free technique is absolutely essential for success of this protocol. Preparation of all
the reagents should be performed in the PCR hood. All objects (i.e., tube racks, pipets,
microcentrifuge, and etc.) used should be cleaned with RNaseZap, and all precautions to
avoid RNA degradation should be taken. Keep sample tubes on ice or cold blocks in
between steps at all times! Making mastermix sufficient for multiple samples is strongly
recommended to reduce pipetting errors.
Prior to performing the amplification steps using actual single bacterium samples, we
strongly recommend that the user practices by using cDNA and RNA stock diluted to single-
cell level as templates. We suggest that the experimenter first uses diluted cDNA (single cell
level, 0.1–2 pg) and begin at step 11, making sure to add CircLigase ss-DNA ligase buffer
(which comes with the CircLigase ss-DNA ligase from Epicentre) to final concentration of
1×. Subsequent to successful amplification using diluted cDNA, experimenter can then
moving on to practice using diluted RNA (single cell level, 0.1–2 pg) as template and begins
at step 5. Additionally, multiple (e.g. triplicate) amplifications could be performed using
diluted single cell level RNA as template, and transcriptome results from these samples
could be cross-compared to evaluate the levels of reproducibility. All these experiments are
critical controls prior to using actual single bacterial cell samples. Successful amplification
and high correlations among replicates from diluted RNA samples are essential
prerequisites, and these control experiments would assist in pinpointing the potential failed
step(s).
If more ds-cDNA is required for technical microarray replicates, additional ϕ 29 polymerase
and substrate mixture can be added (following Steps 20–21 in Procedure) to the original
amplification tube containing 25–30μg of amplified ds-cDNA.
If NGS is used to further analyse the cDNA derived from this protocol, we suggest
enrichment of mRNA as previously described8 immediately after step 7. The terminator 5′-
phosphate-dependent-exonuclease (Epicentre) could be added directly to the reaction since it
is not inhibited by RNase inhibitors. Additionally, aa-dUTP should be omitted from the
protocol in steps 13–22, and substituted with regular dNTPs.
Kang et al. Page 3
Nat Protoc. Author manuscript; available in PMC 2016 January 01.
Author M
anuscriptA
uthor Manuscript
Author M
anuscriptA
uthor Manuscript

MATERIALS
REAGENTS
• RNaseZap® RNase Decontamination Solution (Invitrogen, cat. no. AM9780)
• Paraformaldehyde (Sigma-Aldrich, cat. no. P6148-500G)
! CAUTION: Formaldehyde is toxic. Please read the MSDS before working with
this chemical.
Gloves and safety glasses should be worn and solutions made inside a fume hood.
• RNAprotect Bacterial Reagent (Qiagen, cat. no. 76506)
• RNAlater RNA Stabilization Reagent (Qiagen, cat. no. 76104)
• LIVE/DEAD BacLight Viability Kit (Invitrogen, cat. no. L-7007)
• Tissue-Tek O.C.T. compound (Sakura Finetek U.S.A., Inc., cat. no. 4583)
• Tris-Cl (1 M, pH 8.0, RNase-free; Invitrogen, cat. no. 15568-025)
• KCl (2 M, RNase-free; Invitrogen, cat. no. AM9640G)
• EDTA (0.5 M, pH 8.0, RNase-free; Invitrogen, cat. no. AM9261)
• Triton X-100 (Sigma-Aldrich, cat. no. T8787)
• DTT (100 mM, RNase-free; Epicentre, cat. no. RH040210)
• Ready-Lyse lysozyme (29 kU μl−1, RNase-free; Epicentre, cat. no. R1802M)
• RNaseOut Recombinant Ribonuclease Inhibitor (40 U μl−1, Invitrogen, cat. no.
10777-019)
• RNase-free DNA random hexamers (3 μg μl−1; Invtirogen, cat. no. 48190-011)
• MgCl2 (1 M, RNase-free; Invitrogen, cat. no. AM9530G)
• Moloney Murine Leukemia Virus Reverse Transcriptase (M-MLV RT) (New
England BioLabs, cat. no. M0253S)
• dNTPs (10 mM; New England Biolabs, cat. no. N0447L)
• GTP (100 mM; New England BioLabs, cat. no. M0272S)
• McrBC (10 U μl−1; New England BioLabs, cat. no. M0272S)
• DpnI (20 U μl−1; New England BioLabs, cat. no. R0176S)
• ATP (1 mM; Epicentre, cat. no. CL4111K)
• MnCl2 (50 mM; Epicentre, cat. no. CL4111K)
• T4 polynucleotide kinase (10 U μl−1; New England BioLabs, cat. no. M0201S)
• CircLigase ssDNA Ligase Kit (Epicentre, cat. no. CL4111K),
• Aminoallyl-dUTP (aa-dUTP) (1 mg; Sigma-Aldrich, cat. no. A0410)
Kang et al. Page 4
Nat Protoc. Author manuscript; available in PMC 2016 January 01.
Author M
anuscriptA
uthor Manuscript
Author M
anuscriptA
uthor Manuscript
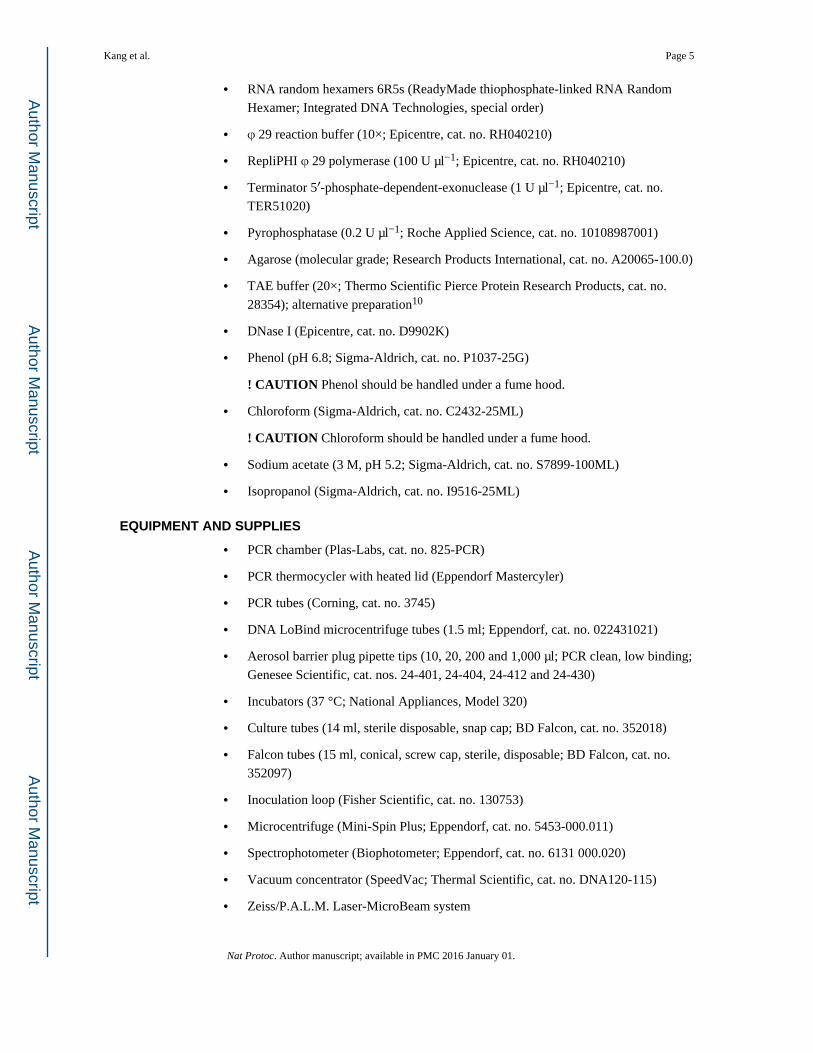
• RNA random hexamers 6R5s (ReadyMade thiophosphate-linked RNA Random
Hexamer; Integrated DNA Technologies, special order)
• ϕ 29 reaction buffer (10×; Epicentre, cat. no. RH040210)
• RepliPHI ϕ 29 polymerase (100 U μl−1; Epicentre, cat. no. RH040210)
• Terminator 5′-phosphate-dependent-exonuclease (1 U μl−1; Epicentre, cat. no.
TER51020)
• Pyrophosphatase (0.2 U μl−1; Roche Applied Science, cat. no. 10108987001)
• Agarose (molecular grade; Research Products International, cat. no. A20065-100.0)
• TAE buffer (20×; Thermo Scientific Pierce Protein Research Products, cat. no.
28354); alternative preparation10
• DNase I (Epicentre, cat. no. D9902K)
• Phenol (pH 6.8; Sigma-Aldrich, cat. no. P1037-25G)
! CAUTION Phenol should be handled under a fume hood.
• Chloroform (Sigma-Aldrich, cat. no. C2432-25ML)
! CAUTION Chloroform should be handled under a fume hood.
• Sodium acetate (3 M, pH 5.2; Sigma-Aldrich, cat. no. S7899-100ML)
• Isopropanol (Sigma-Aldrich, cat. no. I9516-25ML)
EQUIPMENT AND SUPPLIES
• PCR chamber (Plas-Labs, cat. no. 825-PCR)
• PCR thermocycler with heated lid (Eppendorf Mastercyler)
• PCR tubes (Corning, cat. no. 3745)
• DNA LoBind microcentrifuge tubes (1.5 ml; Eppendorf, cat. no. 022431021)
• Aerosol barrier plug pipette tips (10, 20, 200 and 1,000 μl; PCR clean, low binding;
Genesee Scientific, cat. nos. 24-401, 24-404, 24-412 and 24-430)
• Incubators (37 °C; National Appliances, Model 320)
• Culture tubes (14 ml, sterile disposable, snap cap; BD Falcon, cat. no. 352018)
• Falcon tubes (15 ml, conical, screw cap, sterile, disposable; BD Falcon, cat. no.
352097)
• Inoculation loop (Fisher Scientific, cat. no. 130753)
• Microcentrifuge (Mini-Spin Plus; Eppendorf, cat. no. 5453-000.011)
• Spectrophotometer (Biophotometer; Eppendorf, cat. no. 6131 000.020)
• Vacuum concentrator (SpeedVac; Thermal Scientific, cat. no. DNA120-115)
• Zeiss/P.A.L.M. Laser-MicroBeam system
Kang et al. Page 5
Nat Protoc. Author manuscript; available in PMC 2016 January 01.
Author M
anuscriptA
uthor Manuscript
Author M
anuscriptA
uthor Manuscript

• P.A.L.M. MembraneSlides (0.17 PET, P.A.L.M. Microlaser Technologies, cat. no.
1440-1150)
• Cryostat (CryoStar™ NX50, Thermo Scientific)
REAGENT SETUP
Agarose gels—Prepare agarose gels (1%) by adding 1 g of agarose to every 100 ml of 1×
TAE buffer. Heat the mixture until all agarose is dissolved, pour into a gel mold with comb
and allow to cool. Prepare the agarose gels freshly before use.
Paraformaldehyde—In a 50 ml Falcon tube, weigh 2 g of paraformaldehyde powder.
Add approximately 5 ml of 1× PBS and place in a 70–80°C water bath (be sure not to boil).
Swirl the tube gently while slowly adding a few drops of 1 M NaOH until the solution
becomes clear. Remove from the water bath and add 1× PBS to 50 ml. Check the pH and
adjust it to 7.2–7.4 using HCl or NaOH. This 4% (w/v) paraformaldehyde should be made
freshly for each use, or stored at room temperature (20–25°C) for up to two weeks.
! CAUTION: Formaldehyde is toxic. Please read the MSDS before working with this
chemical. Gloves and safety glasses should be worn and solutions made inside a fume hood.
PROCEDURE
Preparation of PALM membrane-coated slides ● TIMING ~ 1 h
1| Remove PALM MembraneSlides from container and expose to UV for 30 min
to make membrane surface more hydrophilic. Treated slides can be stored at
room temperature in the cleaned PCR hood or an RNase free area.
Preparation of cell lysis buffer ● TIMING ~ 0.5 h
2| Typically, prepare the 2× lysis buffer in large volume (at least 10 ml) to reduce
inaccuracy in pipetting. Aliquots of 0.5–1 ml should be stored at −20 °C for a
few months, or −80°C for extended storage.
Components Amount (μl) Final Concentrations
Nuclease-free H2O 7616 –
Tris-Cl @ pH 8 (1 M) 1000 100 mM
KCl (2 M) 1000 200 mM
EDTA (0.5 M) 4 0.2 mM
Triton X-100 (10%) 100 0.1%
DTT (100 mM) 200 2 mM
RNaseOut (40 U μl−1) 10 0.04 U μl−1
Ready-Lyse lysozyme (29 KU μl−1) 70 of 1:109 dilution 2×10⁻⁷ U μl−1
Total volume 10000
△ CRITICAL STEP Buffer should be made in PCR hood, which is thoroughly
cleaned with RNaseZap reagent.
Kang et al. Page 6
Nat Protoc. Author manuscript; available in PMC 2016 January 01.
Author M
anuscriptA
uthor Manuscript
Author M
anuscriptA
uthor Manuscript

Preparation of samples for single cell isolation ● TIMING ~ 1–3 d
3| To prepare cells for isolation, different procedures should be followed for
bacterial culture grown in liquid medium or liquid clinical samples (A), tissue
samples (B), or in a monolayer host cell infection model (C).
(A) Prepare liquid culture or clinical samples for single cell isolation
i. Transfer appropriate amount of bacterial culture or liquid clinical samples (e.g. 500
μl) to a microcentrifuge tube.
△ CRITICAL STEP The bacterial cell density should be less than 5×10⁸ for
efficient staining and fixation. Ideal cell density should range from 106–108
CFU/ml for ease of observation and isolation. Cell densities could be estimated by
plating serial dilutions on appropriate growth agar plates and enumerating. Liquid
cultures that have cell densities higher than 5×10⁸/ml should be diluted with buffers
(e.g. 1× PBS) down to the 106–108 CFU/ml range. Liquid cultures that have cell
densities lower than 106/ml could be concentrated by centrifugation and
resuspending the cell pellets in smaller volumes, to achieve the 106–108 CFU/ml
cell density if desired.
ii. Stain with LIVE/DEAD BacLight Viability dyes according to manufacturer’s
instruction (Fig. 2, panel b).
iii. Add 4% (w/v) paraformaldehyde to reach final concentration of 1%. Incubate at
room temperature for 5 min.
△ CRITICAL STEP Paraformaldehyde should be made fresh. Time of
crosslinking is critical. Proceed to the next step immediately to avoid over-
crosslinking of RNA.
Alternative strategy: If not isolating fluorescence-tagged bacterium, RNAprotect®
reagent could be used for treating the cells instead of paraformaldehyde. Briefly,
mix two volumes of RNAprotect® reagent with one volume of bacterial cell culture
and incubate at room temperature for 5 min.
iv. Centrifuge at 20,000g for 30 s at room temperature and remove supernatant.
v. Wash the cell pellet twice with 1 ml of RNase-free H2O, and resuspend in 1 ml of
RNase-free H2O.
■ PAUSE POINT At this time, the cell pellets can be kept in a −80°C freezer for
long-term storage. We have successfully amplified cDNA from single cell samples
that have been frozen at −80°C for two years.
vi. Transfer a drop of sample from Step 3Av onto a glass slide for microscope, cover
with coverslip and check for bacteria under microscope.
? TROUBLESHOOTING
vii. Given bacteria are observed under microscope and cell densities are acceptable,
thinly spread a loopful of the fixed sample from Step 3Av onto a PALM
Kang et al. Page 7
Nat Protoc. Author manuscript; available in PMC 2016 January 01.
Author M
anuscriptA
uthor Manuscript
Author M
anuscriptA
uthor Manuscript

MembraneSlide from Step 1 with a disposable inoculation loop. Dry membrane
thoroughly in the PCR hood.
■ PAUSE POINT At this time, the membrane slides can be stored in a 4°C
refrigerator for up to two weeks.
(B) Prepare clinical tissue samples for single cell isolation
i. Submerge the samples in RNAlater® reagent and incubate at room temperature for
5 min. Remove the samples and rinse twice with RNase-free H2O.
Alternative strategy: If not available, RNAlater® reagent could be substituted with
paraformaldehyde. Submerge the samples in 1% paraformaldehyde and incubate at
room temperature for 5 min. Remove the samples and rinse with RNase-free H2O.
△ CRITICAL STEP Paraformaldehyde should be made fresh. Time of
crosslinking is critical. Proceed to the next step immediately to avoid over-
crosslinking of RNA.
ii. Stain with LIVE/DEAD BacLight Viability dyes according to manufacturer’s
instruction.
iii. Embed the samples in Tissue-Tek O.C.T. compound. Freeze in −80°C freezer or on
dry ice.
■ PAUSE POINT At this time, the samples can be kept in a −80°C freezer for
long-term storage.
iv. Cut the embedded samples into 1 cm blocks in length, obtain thin sections of the
samples (5 μm) using a cryostat system and place onto a glass slide for microscope,
check for bacteria under microscope.
? TROUBLESHOOTING
v. If sections are positive for bacteria, cut more sections of the samples (5 μm) and
place onto a PALM MembraneSlide from Step 1.
■ PAUSE POINT At this time, the membrane slides can be stored in a 4°C
refrigerator for up to two weeks.
(C) Create a host-cell monolayer model and prepare for isolation of a single bacterium
i. Seed host cells (e.g., murine macrophage cell line RAW264.7) in growth medium
(e.g., DMEM with 10% FBS) on to a PALM MembraneSlide from Step 1 at
appropriate cell density to achieve 50–70% confluency. Incubate cells at 37°C in
humidified 5% CO2 incubator 4 h to overnight to allow attachment.
ii. Remove growth medium and unattached host cells, wash host cell monolayer twice
with 1× PBS solution.
Kang et al. Page 8
Nat Protoc. Author manuscript; available in PMC 2016 January 01.
Author M
anuscriptA
uthor Manuscript
Author M
anuscriptA
uthor Manuscript

iii. Add bacteria diluted in DMEM to host cell monolayer at desired ratio ( e.g., 1:1 or
10:1) for sufficient amount of time (e.g., 30 min) at 37°C in humidified 5% CO2
incubator to allow attachment and/or invasion.
iv. To remove extracellular or unattached bacterial cells, wash host cell monolayer
twice with 1× PBS solution.
v. Add growth medium and incubate at 37°C in humidified 5% CO2 incubator for
desired amount of time (e.g. 2–24 h).
vi. Wash slides twice with 1× PBS solution.
vii. Fix the monolayer with 1% (w/v) paraformaldehyde. Incubate at room temperature
for 5 min.
△ CRITICAL STEP Paraformaldehyde should be made fresh. Time of
crosslinking is critical. Proceed to the next step immediately to avoid over-
crosslinking of RNA.
viii. Wash slides twice with 1× PBS. Dry membrane thoroughly.
■ PAUSE POINT At this time, the membrane slides can be stored in a 4°C
refrigerator for up to two weeks.
Single bacterial cell isolation ● TIMING ~ 1 h
4| Observe slides under 1000× oil immersion objective lens on the Zeiss Laser
Capture Microdissection (P.A.L.M.) system (Fig. 2a). Choose an isolated
bacterium and cut the membrane around it using the focused laser, then catapult
with the unfocused low-intensity laser beam into 2 μl 2× lysis buffer (from Step
2) in a 0.2 ml PCR tube lid (Fig. 2b and 2c). Close the lid and give the PCR tube
a quick spin (3 sec at ~6,000× g) in a mini centrifuge so the buffer containing
the single bacterial cell is collected at the bottom of the tube.
△ CRITICAL STEP Old membrane slides (>6 months) have lots of artifacts
that resemble bacteria under bright-field microscopy, when bacteria are not
labeled (e.g., with a fluorescent tag) or stained with fluorescent dye. We
recommend using fresh membrane slides if bacteria are to be isolated under
bright-field, rather than fluorescent mode.
■ PAUSE POINT At this time, the single cells can be stored at −80°C for up to
6 months.
? TROUBLESHOOTING
Random reverse transcription ●TIMING ~ 2.5 h
5| Dilute the DNA random hexamers to appropriate concentration, adjust
accordingly if using more than one cell (e.g. 0.4 pg μl−1 for single cell, and 40
pg μl−1 for 100 cells). Preheat the DNA random hexamers at 70°C for 5 min,
snap freeze on ice.
Kang et al. Page 9
Nat Protoc. Author manuscript; available in PMC 2016 January 01.
Author M
anuscriptA
uthor Manuscript
Author M
anuscriptA
uthor Manuscript
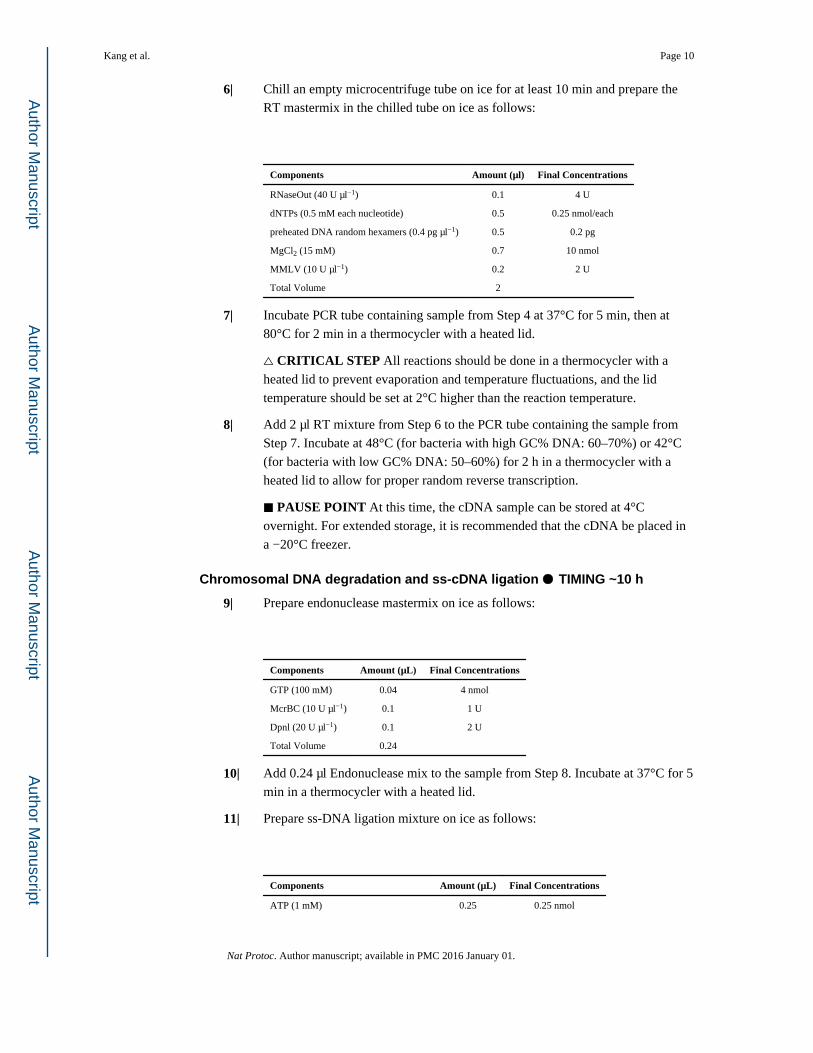
6| Chill an empty microcentrifuge tube on ice for at least 10 min and prepare the
RT mastermix in the chilled tube on ice as follows:
Components Amount (μl) Final Concentrations
RNaseOut (40 U μl−1) 0.1 4 U
dNTPs (0.5 mM each nucleotide) 0.5 0.25 nmol/each
preheated DNA random hexamers (0.4 pg μl−1) 0.5 0.2 pg
MgCl2 (15 mM) 0.7 10 nmol
MMLV (10 U μl−1) 0.2 2 U
Total Volume 2
7| Incubate PCR tube containing sample from Step 4 at 37°C for 5 min, then at
80°C for 2 min in a thermocycler with a heated lid.
△ CRITICAL STEP All reactions should be done in a thermocycler with a
heated lid to prevent evaporation and temperature fluctuations, and the lid
temperature should be set at 2°C higher than the reaction temperature.
8| Add 2 μl RT mixture from Step 6 to the PCR tube containing the sample from
Step 7. Incubate at 48°C (for bacteria with high GC% DNA: 60–70%) or 42°C
(for bacteria with low GC% DNA: 50–60%) for 2 h in a thermocycler with a
heated lid to allow for proper random reverse transcription.
■ PAUSE POINT At this time, the cDNA sample can be stored at 4°C
overnight. For extended storage, it is recommended that the cDNA be placed in
a −20°C freezer.
Chromosomal DNA degradation and ss-cDNA ligation ● TIMING ~10 h
9| Prepare endonuclease mastermix on ice as follows:
Components Amount (μL) Final Concentrations
GTP (100 mM) 0.04 4 nmol
McrBC (10 U μl−1) 0.1 1 U
Dpnl (20 U μl−1) 0.1 2 U
Total Volume 0.24
10| Add 0.24 μl Endonuclease mix to the sample from Step 8. Incubate at 37°C for 5
min in a thermocycler with a heated lid.
11| Prepare ss-DNA ligation mixture on ice as follows:
Components Amount (μL) Final Concentrations
ATP (1 mM) 0.25 0.25 nmol
Kang et al. Page 10
Nat Protoc. Author manuscript; available in PMC 2016 January 01.
Author M
anuscriptA
uthor Manuscript
Author M
anuscriptA
uthor Manuscript
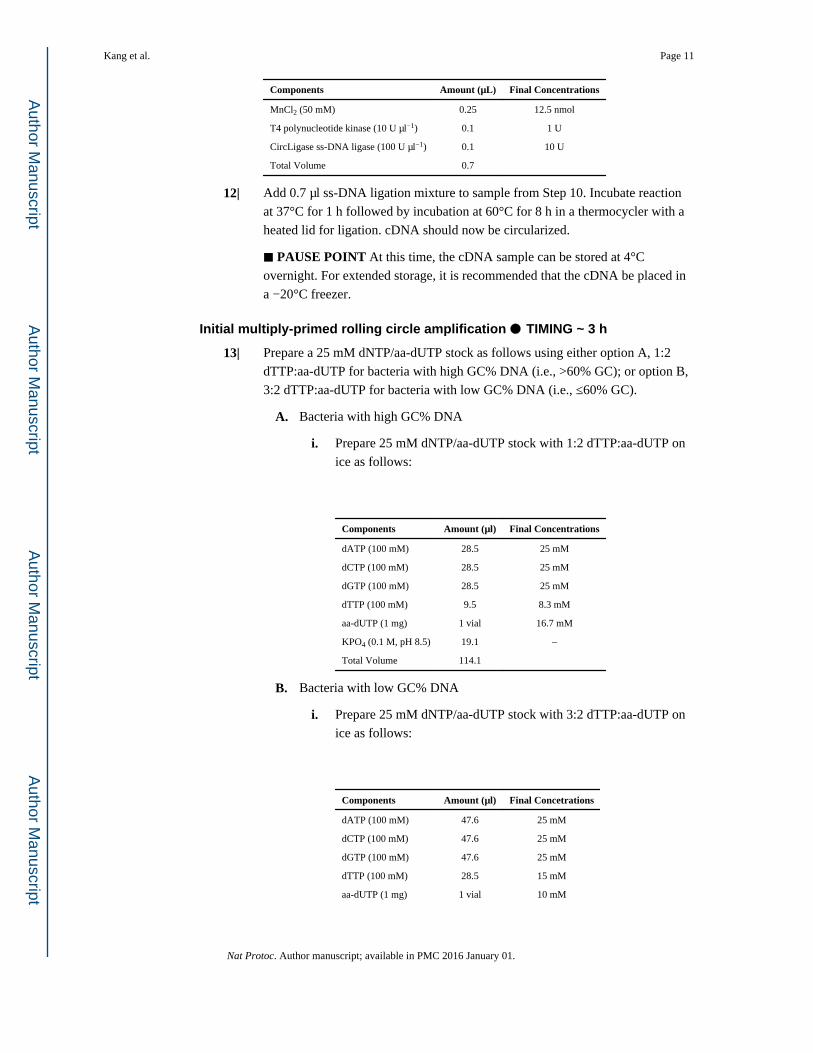
Components Amount (μL) Final Concentrations
MnCl2 (50 mM) 0.25 12.5 nmol
T4 polynucleotide kinase (10 U μl−1) 0.1 1 U
CircLigase ss-DNA ligase (100 U μl−1) 0.1 10 U
Total Volume 0.7
12| Add 0.7 μl ss-DNA ligation mixture to sample from Step 10. Incubate reaction
at 37°C for 1 h followed by incubation at 60°C for 8 h in a thermocycler with a
heated lid for ligation. cDNA should now be circularized.
■ PAUSE POINT At this time, the cDNA sample can be stored at 4°C
overnight. For extended storage, it is recommended that the cDNA be placed in
a −20°C freezer.
Initial multiply-primed rolling circle amplification ● TIMING ~ 3 h
13| Prepare a 25 mM dNTP/aa-dUTP stock as follows using either option A, 1:2
dTTP:aa-dUTP for bacteria with high GC% DNA (i.e., >60% GC); or option B,
3:2 dTTP:aa-dUTP for bacteria with low GC% DNA (i.e., ≤60% GC).
A. Bacteria with high GC% DNA
i. Prepare 25 mM dNTP/aa-dUTP stock with 1:2 dTTP:aa-dUTP on
ice as follows:
Components Amount (μl) Final Concentrations
dATP (100 mM) 28.5 25 mM
dCTP (100 mM) 28.5 25 mM
dGTP (100 mM) 28.5 25 mM
dTTP (100 mM) 9.5 8.3 mM
aa-dUTP (1 mg) 1 vial 16.7 mM
KPO4 (0.1 M, pH 8.5) 19.1 –
Total Volume 114.1
B. Bacteria with low GC% DNA
i. Prepare 25 mM dNTP/aa-dUTP stock with 3:2 dTTP:aa-dUTP on
ice as follows:
Components Amount (μl) Final Concetrations
dATP (100 mM) 47.6 25 mM
dCTP (100 mM) 47.6 25 mM
dGTP (100 mM) 47.6 25 mM
dTTP (100 mM) 28.5 15 mM
aa-dUTP (1 mg) 1 vial 10 mM
Kang et al. Page 11
Nat Protoc. Author manuscript; available in PMC 2016 January 01.
Author M
anuscriptA
uthor Manuscript
Author M
anuscriptA
uthor Manuscript
Components Amount (μl) Final Concetrations
KPO4 (0.1 M, pH 8.5) 19.1 –
Total Volume 190.4
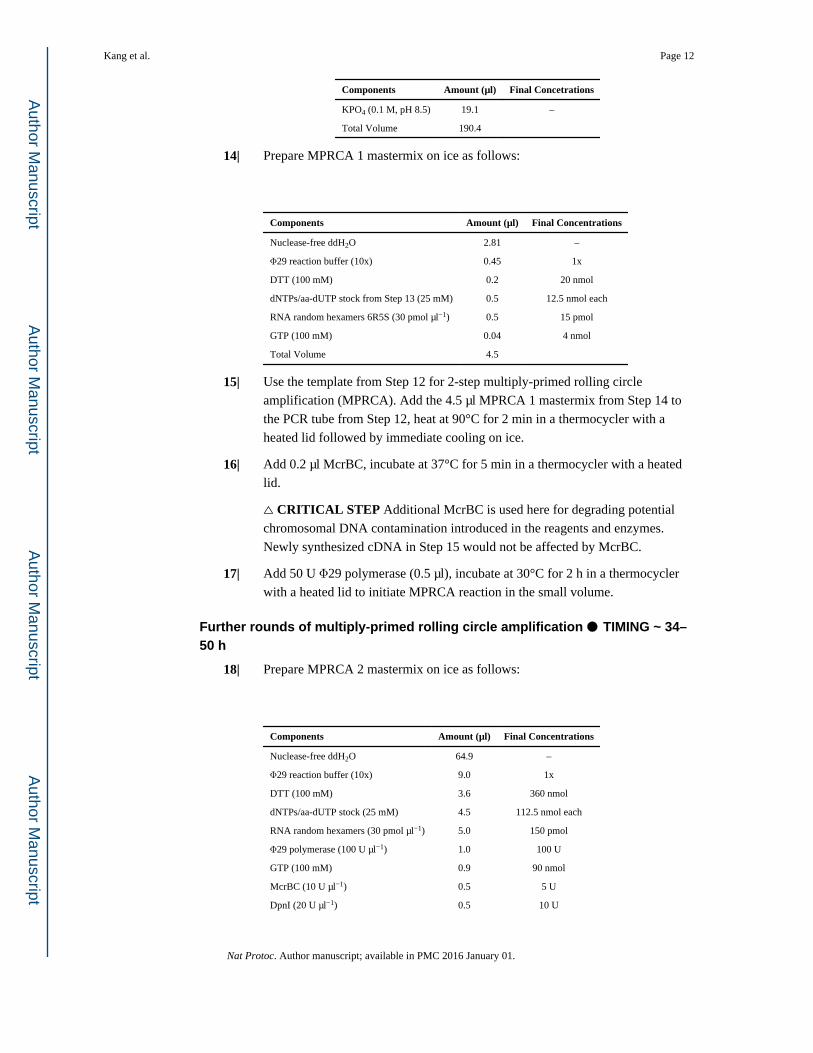
14| Prepare MPRCA 1 mastermix on ice as follows:
Components Amount (μl) Final Concentrations
Nuclease-free ddH2O 2.81 –
Φ29 reaction buffer (10x) 0.45 1x
DTT (100 mM) 0.2 20 nmol
dNTPs/aa-dUTP stock from Step 13 (25 mM) 0.5 12.5 nmol each
RNA random hexamers 6R5S (30 pmol μl−1) 0.5 15 pmol
GTP (100 mM) 0.04 4 nmol
Total Volume 4.5
15| Use the template from Step 12 for 2-step multiply-primed rolling circle
amplification (MPRCA). Add the 4.5 μl MPRCA 1 mastermix from Step 14 to
the PCR tube from Step 12, heat at 90°C for 2 min in a thermocycler with a
heated lid followed by immediate cooling on ice.
16| Add 0.2 μl McrBC, incubate at 37°C for 5 min in a thermocycler with a heated
lid.
△ CRITICAL STEP Additional McrBC is used here for degrading potential
chromosomal DNA contamination introduced in the reagents and enzymes.
Newly synthesized cDNA in Step 15 would not be affected by McrBC.
17| Add 50 U Φ29 polymerase (0.5 μl), incubate at 30°C for 2 h in a thermocycler
with a heated lid to initiate MPRCA reaction in the small volume.
Further rounds of multiply-primed rolling circle amplification ● TIMING ~ 34–50 h
18| Prepare MPRCA 2 mastermix on ice as follows:
Components Amount (μl) Final Concentrations
Nuclease-free ddH2O 64.9 –
Φ29 reaction buffer (10x) 9.0 1x
DTT (100 mM) 3.6 360 nmol
dNTPs/aa-dUTP stock (25 mM) 4.5 112.5 nmol each
RNA random hexamers (30 pmol μl−1) 5.0 150 pmol
Φ29 polymerase (100 U μl−1) 1.0 100 U
GTP (100 mM) 0.9 90 nmol
McrBC (10 U μl−1) 0.5 5 U
DpnI (20 U μl−1) 0.5 10 U
Kang et al. Page 12
Nat Protoc. Author manuscript; available in PMC 2016 January 01.
Author M
anuscriptA
uthor Manuscript
Author M
anuscriptA
uthor Manuscript

Components Amount (μl) Final Concentrations
Pyrophosphatase (0.2 U μl−1) 0.1 0.02 U
Total Volume 90
19| Add 90 μl MPRCA 2 mixture from Step 18 to the initially amplified cDNA
mixture from Step 17, and incubate at 30°C for 32 h in a thermocycler with a
heated lid. Run 2–5 μl of sample on a 1% agarose gel to estimate the amount of
amplified cDNA. Highly polymerized DNA smears (significantly larger than 10
kb) indicate sufficient amplification. If desired, an aliquot of the sample (e.g.
10–20 μl) could be purified by following the steps 23–26, and amount of
amplified DNA could be quantitated.
■ PAUSE POINT At this time, the cDNA sample can be stored at 4°C
overnight. For extended storage, it is recommended that the cDNA be placed in
a −20°C freezer.
? TROUBLESHOOTING
20| If 75–90 μg ds-cDNA is needed for microarray technical triplicate, prepare
MPRCA 3 mastermix on ice as follows:
Components Amount (μl) Final Concentrations
Nuclease-free ddH2O 145.8 –
Φ29 reaction buffer (10x) 20.0 1x
DTT (100 mM) 8 800 nmol
dNTPs/aa-dUTP stock (25 mM) 10 250 nmol each
RNA random hexamers (30 pmol μl−1) 10 300 pmol
Φ29 polymerase (100 U μl−1) 2.0 200 U
GTP (100 mM) 2.0 200 nmol
McrBC (10 U μl−1) 1.0 10 U
DpnI (20 U μl−1) 1.0 20 U
Pyrophosphatase (0.2 U μl−1) 0.2 0.2 U
Total Volume 200
21| Mix the 200 μl MPRCA 3 mixture with the 100 μl amplified cDNA from Step
19, aliquot the resulting 300 μl mixture into three PCR tubes, and incubate at
30°C for 16 h in a thermocycler with a heated lid.
■ PAUSE POINT At this time, the cDNA sample can be stored at 4°C
overnight. For extended storage, it is recommended that the cDNA be placed in
a −20°C freezer.
22| At the end of 16 h incubation, combine all three aliquots and run 2–5 μl of
sample on a 1% agarose gel to estimate the amount of amplified cDNA. Highly
polymerized DNA smears indicate sufficient amplification (significantly larger
than 10 kb). Transfer the solution to a 1.5 ml microcentrifuge tube.
? TROUBLESHOOTING
Kang et al. Page 13
Nat Protoc. Author manuscript; available in PMC 2016 January 01.
Author M
anuscriptA
uthor Manuscript
Author M
anuscriptA
uthor Manuscript
Purification of amplified ds-cDNA ● TIMING ~ 2 h
23| To the combined solution from Step 22, add 500 μl phenol and 500 μl
chloroform and vortex for 20 seconds to mix well. Then centrifuge at 20,000g
for 5 min at room temperature. Transfer the top aqueous phase, which contains
the cDNA, to a new 1.5 ml microcentrifuge tube. Extract again with another 500
μl of chloroform. Centrifuge at 20,000g for 5 min at room temperature and
transfer the upper aqueous layer into a new 1.5 ml microcentrifuge tube.
24| Add 30 μl (one tenth of the volume) of 3 M sodium acetate (pH 5.2) to the
extracted cDNA followed by 600 μl isopropanol. Freeze at −80°C for at least 1 h
to precipitate the cDNA.
25| Centrifuge at 20,000g for 10 min at room temperature to pellet the precipitated
cDNA and gently remove supernatant. Wash pellet by adding 1 ml of 70%
ethanol and centrifuge at 20,000g for 10 min at room temperature. Gently,
remove the 70% ethanol and discard.
26| Vacuum dry using appropriate vacuum drier.
■ PAUSE POINT At this time, the dried cDNA sample can be stored
temporarily at 4°C for a few hours. For extended storage, it is recommended that
the cDNA be placed in a −20°C freezer.
Random fragmentation of amplified ds-cDNA ● TIMING ~ 3 h
27| Dissolve the cDNA pellet from Step 26 in 100 μl of nuclease-free ddH2O and
determine the DNA concentration by measuring the A260 in a
spectrophotometer. To firstly test the efficiency of random fragmentation, use a
small aliquot (e.g. 5–10 μl) and add 10x DNase I buffer to reach final
concentration of 1x and 0.01 U DNase I per μg of cDNA and incubate at 37°C
for 5 min. Heat to 98°C for 10 min to inactivate the DNase I. Run 2–5 μl of
sample on a DNA gel to determine the approximate length range of the
fragmented cDNA. If the length of cDNA is not in the desired range (1–4 kb for
microarray; Fig. 3), repeat the fragmentation step. Once appropriate amount of
DNase is determined, repeat the fragmentation for the rest of the cDNA samples
using identical conditions (unit of DNase per μg of cDNA and time of
incubation).
△ CRITICAL STEP The size range is critical for optimal hybridization.
Random fragmentation with DNase I can be finicky, as over-fragmentation
occurs easily, and fragmentation efficiency can vary differently between each lot
of DNase I. Based on our experience, DNase I from different companies or even
different lots from the same company vary in activity. The amount of DNase I
given here should be used as a starting point for optimization. Use serial
dilutions of DNase I until a desired smear from 1–4 kb is visible.
Alternative strategy: If available, other methods of random fragmentation could
be used instead of DNase I, such as sonication or nebulization. These methods
require optimization as well.
Kang et al. Page 14
Nat Protoc. Author manuscript; available in PMC 2016 January 01.
Author M
anuscriptA
uthor Manuscript
Author M
anuscriptA
uthor Manuscript

? TROUBLESHOOTING
28| Repeat Steps 23–26.
■ PAUSE POINT At this time, the dried cDNA sample can be stored at 4°C for
a short period of time. For extended storage, it is recommended that the cDNA
be placed in a −20°C freezer.
Further cDNA analysis ● TIMING 1–3 d
29| Analyse the cDNA via microarray following the established protocols (http://
pfgrc.jcvi.org/index.php/microarray/protocols.html) as previously described 8, or
following the instructions from the microarray manufactures.
? TROUBLESHOOTING
Troubleshooting advice can be found in Table 1.
● TIMING
Step 1, Preparation of PALM membrane-coated slides: 1 h
Step 2, Preparation of cell lysis buffer: 0.5 h
Step 3, Preparation of samples for single cell isolation: 1–3 d
Step 4, Single bacterial cell isolation: 1 h
Steps 5–8, Random reverse transcription: 2.5 h
Steps 9–12, Chromosomal DNA degradation and ss-cDNA ligation: 10 h
Steps 13–17, Initial multiply-primed rolling circle amplification: 3 h
Steps 18–22, Further rounds of multiply-primed rolling circle amplification: 34–50 h
Steps 23–26, Purification of amplified ds-cDNA: 2 h
Steps 27 and 28, Random fragmentation of amplified ds-cDNA: 3 h
Step 29, Further cDNA analysis: 1–3 d
ANTICIPATED RESULTS
Using the protocol provided will typically produce 25–100 μg of amplified ds-cDNA,
depending on the incubation time of MPCRA. Based on our experience using 70-mer probe
glass microarray slides, 25–30 μg cDNA is sufficient for microarray analysis. When
technical or biological replicates are performed, transcriptome results could be cross-
compared to evaluate the levels of reproducibility. Scatter plots, Venn diagrams, correlation
coefficient determination are all powerful tools to assess reproducibility as presented in
Figure 4. Dot plots (Fig. 4d) allow analysis of the expression map on the whole genomic
scale and easy visualization of differentially expressed genes/operons/genomic regions.
Kang et al. Page 15
Nat Protoc. Author manuscript; available in PMC 2016 January 01.
Author M
anuscriptA
uthor Manuscript
Author M
anuscriptA
uthor Manuscript

Acknowledgments
This project was supported by the US National Institutes of Health (NIH)/National Institute of General Medical Sciences (NIGMS) grant number R01GM103580 and by the Center of Biomedical Research Excellence grant P20GM103516 from the National Center for Research Resources of the National Institutes of Health, and it was partially supported by Award U54 AI065359 from the National Institute of Allergy and Infectious Diseases. We acknowledge R. Hendrickson for his help with editing part of this protocol.
References
1. Kurimoto K, et al. An improved single-cell cDNA amplification method for efficient high-density oligonucleotide microarray analysis. Nuc Acids Res. 2006; 34:e42.10.1093/nar/gkl1050
2. Scanlon, MJ.; Ohtsu, K.; Timmermans, MC.; Schnable, PS. RNA. John Wiley & Sons, Inc; 2009. Laser microdissection-mediated isolation and in vitro transcriptional amplification of plant.
3. Emmert-Buck MR, et al. Laser capture microdissection. Science. 1996; 274:998–1001. [PubMed: 8875945]
4. Tietjen I, et al. Single-cell transcriptional analysis of neuronal progenitors. Neuron. 2003; 38:161–175. S0896627303002290 [pii]. [PubMed: 12718852]
5. Iscove NN, et al. Representation is faithfully preserved in global cDNA amplified exponentially from sub-picogram quantities of mRNA. Nat Biotechnol. 2002; 20:940–943. [pii]. 10.1038/nbt729nbt729 [PubMed: 12172558]
6. Tougan T, Okuzaki D, Nojima H. Chum-RNA allows preparation of high-quality cDNA library from sing-cell quantity of mRNA without PCR amplification. Nuc Acids Res. 2008; 36:e92.10.1093/nar/gkn1420
7. Kurimoto K, Yabuta Y, Ohinata Y, Saitou M. Global single-cell cDNA amplification to provide a template for representative high-density oligonucleotide microarray analysis. Nature Protocols. 2007; 2:739–752.
8. Kang Y, et al. Transcript amplification from single bacterium for transcriptome analysis. Genome Res. 2011; 21:925–935. gr.116103.110 [pii]. 10.1101/gr.116103.110 [PubMed: 21536723]
9. Passalacqua KD, et al. Structure and complexity of a bacterial transcriptome. J Bacteriol. 2009; 191:3203–3211.10.1128/JB.00122-09 [PubMed: 19304856]
10. Sambrook, J.; Russell, DW. Molecular Cloning: A Laboratory Manual. 2. Cold Spring Harbor Laboratory Press; 2001.
11. Son MS, Matthews WJJ, Kang Y, Nguyen DT, Hoang TT. In vivo evidence of Pseudomonas aeruginosa nutrient acquisition and pathogenesis in the lungs of cystic fibrosis patients. Infect Immun. 2007; 75:5313–5324. [PubMed: 17724070]
Kang et al. Page 16
Nat Protoc. Author manuscript; available in PMC 2016 January 01.
Author M
anuscriptA
uthor Manuscript
Author M
anuscriptA
uthor Manuscript

Summary
This protocol enables amplification of the total transcript of a single prokaryotic cell for
in-depth analysis. Laser capture microdissection is used to isolate single cells and
amplified cDNA can be further analysed by microarray.
Kang et al. Page 17
Nat Protoc. Author manuscript; available in PMC 2016 January 01.
Author M
anuscriptA
uthor Manuscript
Author M
anuscriptA
uthor Manuscript
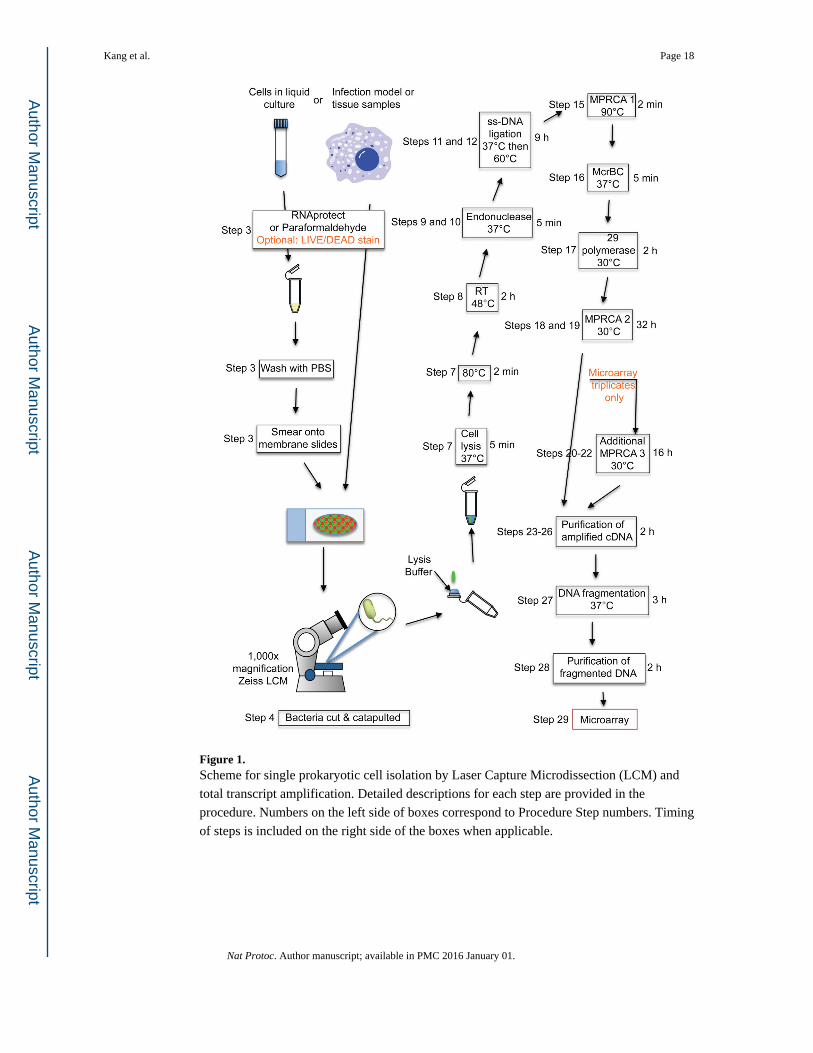
Figure 1. Scheme for single prokaryotic cell isolation by Laser Capture Microdissection (LCM) and
total transcript amplification. Detailed descriptions for each step are provided in the
procedure. Numbers on the left side of boxes correspond to Procedure Step numbers. Timing
of steps is included on the right side of the boxes when applicable.
Kang et al. Page 18
Nat Protoc. Author manuscript; available in PMC 2016 January 01.
Author M
anuscriptA
uthor Manuscript
Author M
anuscriptA
uthor Manuscript
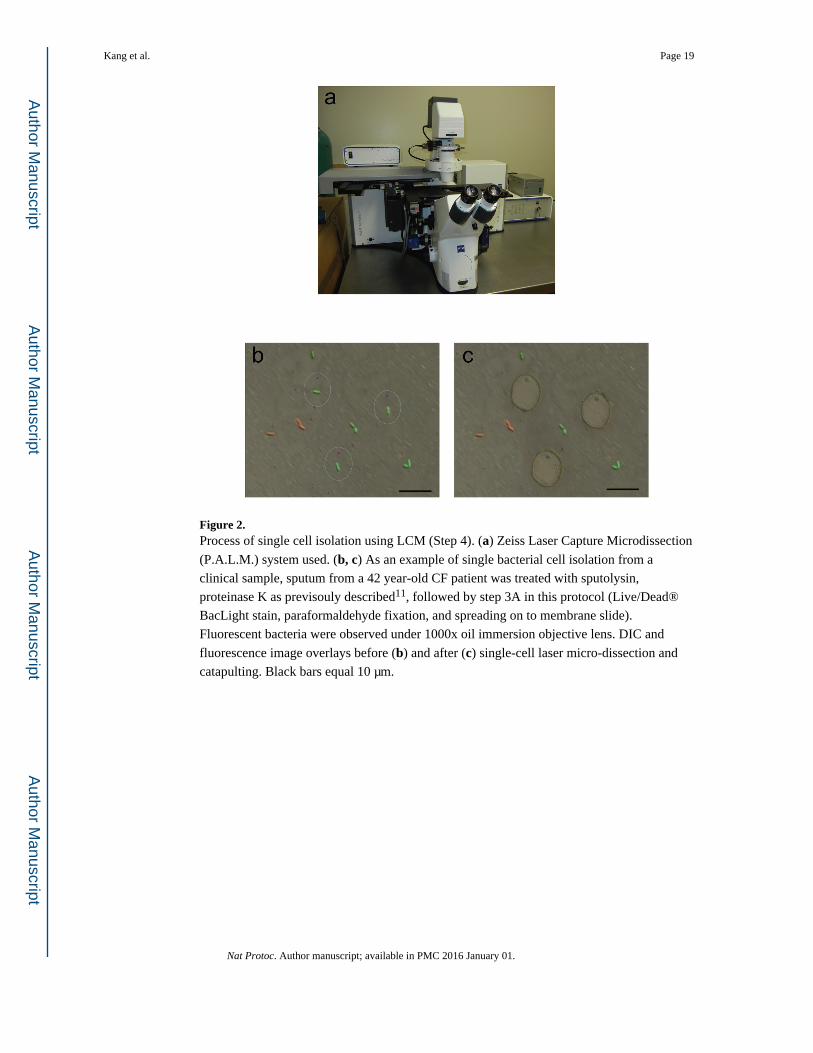
Figure 2. Process of single cell isolation using LCM (Step 4). (a) Zeiss Laser Capture Microdissection
(P.A.L.M.) system used. (b, c) As an example of single bacterial cell isolation from a
clinical sample, sputum from a 42 year-old CF patient was treated with sputolysin,
proteinase K as previsouly described11, followed by step 3A in this protocol (Live/Dead®
BacLight stain, paraformaldehyde fixation, and spreading on to membrane slide).
Fluorescent bacteria were observed under 1000x oil immersion objective lens. DIC and
fluorescence image overlays before (b) and after (c) single-cell laser micro-dissection and
catapulting. Black bars equal 10 μm.
Kang et al. Page 19
Nat Protoc. Author manuscript; available in PMC 2016 January 01.
Author M
anuscriptA
uthor Manuscript
Author M
anuscriptA
uthor Manuscript

Figure 3. Anticipated results from Step 27 showing the DNase I random fragmentation of amplified
ds-cDNA on an agarose gel. Serial dilutions of DNase I (Epicentre) were used for
fragmentation at 37°C for 5 min, and different levels of fragmentation were observed as
shifted DNA smears. Lane M, 1 kb DNA ladder from New England Biolabs. Lane 1, 1 U of
DNase per μg of DNA; lane 2, 0.1 U of DNase per μg of DNA; lane 3, 0.01 U of DNase per
μg of DNA; lane 4, 0.001 U of DNase per μg of DNA; lane 5, 0.0001 U of DNase per μg of
DNA; lane 6, no DNase control.
Kang et al. Page 20
Nat Protoc. Author manuscript; available in PMC 2016 January 01.
Author M
anuscriptA
uthor Manuscript
Author M
anuscriptA
uthor Manuscript
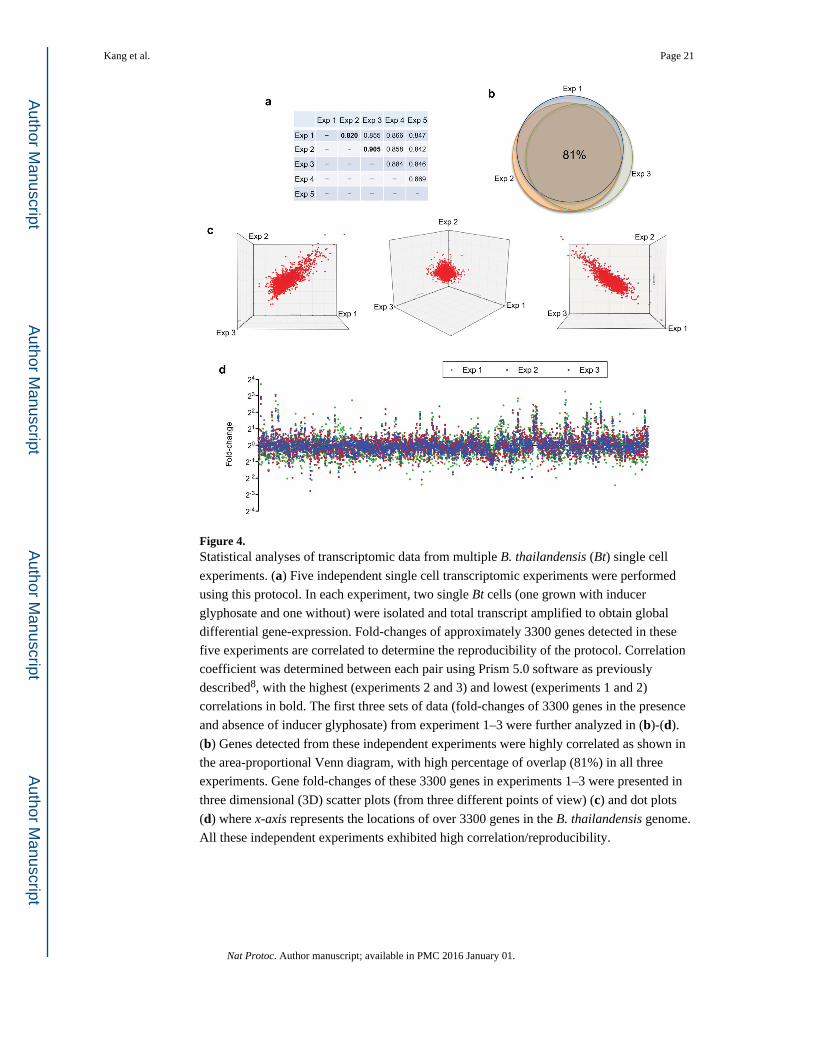
Figure 4. Statistical analyses of transcriptomic data from multiple B. thailandensis (Bt) single cell
experiments. (a) Five independent single cell transcriptomic experiments were performed
using this protocol. In each experiment, two single Bt cells (one grown with inducer
glyphosate and one without) were isolated and total transcript amplified to obtain global
differential gene-expression. Fold-changes of approximately 3300 genes detected in these
five experiments are correlated to determine the reproducibility of the protocol. Correlation
coefficient was determined between each pair using Prism 5.0 software as previously
described8, with the highest (experiments 2 and 3) and lowest (experiments 1 and 2)
correlations in bold. The first three sets of data (fold-changes of 3300 genes in the presence
and absence of inducer glyphosate) from experiment 1–3 were further analyzed in (b)-(d).
(b) Genes detected from these independent experiments were highly correlated as shown in
the area-proportional Venn diagram, with high percentage of overlap (81%) in all three
experiments. Gene fold-changes of these 3300 genes in experiments 1–3 were presented in
three dimensional (3D) scatter plots (from three different points of view) (c) and dot plots
(d) where x-axis represents the locations of over 3300 genes in the B. thailandensis genome.
All these independent experiments exhibited high correlation/reproducibility.
Kang et al. Page 21
Nat Protoc. Author manuscript; available in PMC 2016 January 01.
Author M
anuscriptA
uthor Manuscript
Author M
anuscriptA
uthor Manuscript

Author M
anuscriptA
uthor Manuscript
Author M
anuscriptA
uthor Manuscript
Kang et al. Page 22
TABLE 1
Troubleshooting table.
Step Problem Possible reasons Possible solutions
3Avi, 3Biv, 3 No bacteria was observed
Low bacterial density Use larger volumes of samples and/or concentrate samples
Insufficient fluorescent staining Increase concentration of LIVE/DEAD bacteria stain, or incubate for longer time
Complex clinical samples with high background
Use alternative staining methods for detection, e.g., fluorescence-dye-conjugated antibody targeting bacterial surface protein.
4 Unable to cut or catapult with laser
Membrane slides are not sufficiently dried, as water would absorb the energy from laser and prevent cutting and surface tension would prevent catapulting
Air dry membrane thoroughly in PCR hood.
19 and 22 No DNA smear or only short polymers (smaller than 10 kb) were obtained
RNase and/or DNase contamination Always keep the PCR hood clean, as well as pipettes, tube racks, tubes, gloves, etc., wipe everything thoroughly with RNaseZap reagent and let air-dry. Never touch the inside of the lids or tubes. Keep sample tubes on ice or cold blocks in between steps at all times.
27 DNA smear disappears after DNase fragmentation
Over-fragmentation Use serial dilutions of DNase I and test on small aliquots of amplified samples.Other methods of random fragmentation could be used instead of DNase I, such as sonication or nebulization. Optimization is still recommended using small aliquots of samples
Nat Protoc. Author manuscript; available in PMC 2016 January 01.