hhs public access lauren n. bell, phd*,† reiesha d
TRANSCRIPT

Effect of Different Obesogenic Diets on Pancreatic Histology in Ossabaw Miniature Swine
Allison M. Fullenkamp, BSc*, Lauren N. Bell, PhD*,†, Reiesha D. Robbins, BSc‡, Lydia Lee, BSc*, Romil Saxena, MD†,§, Mouhamad Alloosh, MD||, James E. Klaunig, PhD¶, Raghavendra G. Mirmira, MD, PhD||,#, Michael Sturek, PhD||, and Naga Chalasani, MD*,†
*Division of Gastroenterology/Hepatology, Indiana University School of Medicine, Indianapolis, IN
†Division of Clinical Pharmacology, Indiana University School of Medicine, Indianapolis, IN
‡Department of Pharmacology, University of Virginia, Charlottesville, VA
§Department of Pathology and Laboratory Medicine, Indiana University School of Medicine, Indianapolis, IN
||Department of Cellular & Integrative Physiology, Indiana University School of Medicine, Indianapolis, IN
¶Department of Toxicology, Indiana University School of Medicine, Indianapolis, IN
#Department of Pediatrics, Indiana University School of Medicine, Indianapolis, IN
Abstract
Objective—Obesity is a factor in the outcome and severity of pancreatic conditions. We
examined the effect of hypercaloric diets on the pancreata of Ossabaw swine, a large animal model
of metabolic syndrome and obesity.
Methods—Swine were fed with 1 of 4 diets: high-fructose (n = 9), atherogenic (n = 10),
modified atherogenic (n = 6), or eucaloric standard diet (n = 12) for 24 weeks. Serum chemistries
were measured, and pancreata were examined for histological abnormalities including steatosis,
inflammation or fibrosis, insulin content, and oxidative stress.
Results—The fructose, atherogenic, and modified atherogenic diet groups exhibited obesity,
metabolic syndrome, islet enlargement, and significantly increased pancreatic steatosis (22.9% ±
7.5%, 19.7% ± 7.7%, and 38.7% ± 15.3% fat in total tissue area, respectively) compared with
controls (9.3% ± 1.9%; P < 0.05). The modified atherogenic diet group showed significantly
increased oxidative stress levels as evidenced by elevated serum malondialdehyde (3.0 ± 3.3 vs
1.5 ± 0.3 μmol/L in controls; P = 0.006) and pancreatic malondialdehyde (0.1 ± 0.12 vs 0.04 ±
0.01 nmol/mg protein in controls; P = 0.01). None of the swine exhibited pancreatitis or cellular
injury.
Reprints: Naga Chalasani, MD, Division of Gastroenterology/Hepatology, Indiana University School of Medicine, 1050 Wishard Blvd, RG4100, Indianapolis, IN 46202, [email protected].
HHS Public AccessAuthor manuscriptPancreas. Author manuscript; available in PMC 2015 October 12.
Published in final edited form as:Pancreas. 2011 April ; 40(3): 438–443. doi:10.1097/MPA.0b013e3182061583.
Author M
anuscriptA
uthor Manuscript
Author M
anuscriptA
uthor Manuscript

Conclusions—Ossabaw swine fed with a modified atherogenic diet developed significant
pancreatic steatosis and increased oxidative stress, but no other histological abnormalities were
observed.
Keywords
animal model; fatty pancreas; metabolic syndrome; fatty liver
Obesity paired with hypertension, insulin resistance, and dyslipidemia—the metabolic
syndrome—is a growing epidemic and is linked closely with other chronic diseases. In
humans, obesity is a risk factor for fat accumulation in the pancreas and is a predictor of the
severity of acute pancreatitis,1,2 and small animal models have confirmed these findings. For
example, leptin-deficient obese mice were found to have significantly more total pancreatic
fat, a condition termed nonalcoholic fatty pancreas disease (NAFPD).3 In another study, the
severity of chemical-induced acute pancreatitis was greater in obese mice as compared to
lean control mice.4
Ossabaw miniature swine are an excellent large animal model for investigating metabolic
syndrome and associated conditions.5 These swine exhibit a thrifty genotype that allows for
the storage of large amounts of fat for survival during famine.6 When fed with high-calorie
and high-fat atherogenic diets, swine develop several characteristics of metabolic syndrome,
including dyslipidemia, obesity, hypertension, and insulin resistance.7 Recently, we reported
that feeding swine with a modified atherogenic/nonalcoholic steatohepatitis (NASH) diet
consisting of cholesterol and fat calories from hydrogenated soybean oil, coconut oil, and
lard induced abnormalities in liver histology that closely resemble those observed in human
NASH.8
Because of the tendency of Ossabaw swine to develop obesity and metabolic syndrome, in
this study, we evaluated whether swine also exhibited NAFPD and/or nonalcoholic
steatopancreatitis (NASP) when fed with high-fructose, atherogenic, or modified
atherogenic (NASH) diets.
MATERIALS AND METHODS
Thirty-seven miniature swine aged 5 to 10 months at the start of the study were allocated to
1 of 4 different diet groups for 24 weeks. The control group consumed a eucaloric diet (2500
kcal/day) and maintained normal body weight, whereas the other 3 groups consumed a
hypercaloric diet (6000 kcal/day) that induced obesity. These 37 swine were included in an
earlier publication that described a large animal model of diet-induced steatohepatitis and
metabolic syndrome.8 The 4 groups of diets were the following:
Standard Chow (Control Group, n = 12): These swine received standard chow
consisting of 18.5% calories from protein, 71% calories from carbohydrates, 10.5% of
calories from fat, and normal concentrations of methionine and choline (3500 and 1500
ppm, respectively).
Fullenkamp et al. Page 2
Pancreas. Author manuscript; available in PMC 2015 October 12.
Author M
anuscriptA
uthor Manuscript
Author M
anuscriptA
uthor Manuscript

Fructose Diet Group (n = 9): This high-fructose, normal-fat diet consisted of 20%
calories from fructose and 10.5% calories from fat, with methionine and choline
concentrations at 2800 and 1200 ppm, respectively.
Atherogenic Diet Group (n = 10): The high fructose–containing atherogenic diet
consisted of 20% calories from fructose, 43% calories from fat derived from
hydrogenated soybean oil, and methionine and choline at concentrations of 2100 and
900 ppm, respectively.
Modified Atherogenic Diet group (NASH diet, n = 6): The fructose-based atherogenic
diet (5B4L; custom formulated by Purina TestDiet, Inc, Richmond, Ind) provided 18%
calories from fructose, 17% calories from protein (added casein), 43% calories from fat
(admixture of hydrogenated soybean oil, coconut oil, and lard), and methionine and
choline at concentrations of 3500 and 700 ppm, respectively. For the remainder of the
manuscript, this diet will be referred to as NASH diet.
Animals were given free access to feed for 6 hours a day and unlimited access to water.
Animals were humanely killed by excision of the heart under general anesthesia as described
elsewhere.9 All protocols involving animals were approved by an Institutional Animal Care
and Use committee and complied with the recommendations outlined by the National
Research Council and the American Veterinary Medical Association Panel on
Euthanasia.10,11
Phenotypic and Laboratory Measurements
Body weights were obtained at the beginning of the study and at weekly intervals thereafter.
An intravenous glucose tolerance test was conducted on the swine 1 week before the
animals were killed, and insulin resistance was assessed by the homeostatic model
assessment method.8 Total cholesterol, triglycerides, low-density lipoprotein cholesterol,
and high-density lipoprotein cholesterol were measured in plasma samples using standard
methods.7 Serum chemistries were measured by a local clinical laboratory (Antech
Diagnostics, Fishers, Ind). Fasting serum levels of leptin were measured by a commercial
laboratory (Millipore Corp, St Charles, Mo), and serum adiponectin was measured by mass
spectrometry and expressed as relative protein intensity (Monarch LifeSciences,
Indianapolis, Ind).
Tissue Preparation and Histological Analyses
At the time the swine were killed, a portion of the head of the pancreas was fixed in
formalin, processed, and embedded in paraffin for subsequent hematoxylin and eosin (H&E)
staining. Immunohistochemistry was also performed on sections cut from paraffin-
embedded tissue. Briefly, the sections were deparaffinized, endogenous peroxidase activity
was quenched using hydrogen peroxide, and heat-induced antigen retrieval was performed.
Sections were incubated with anti-insulin antibody (Santa Cruz Biotechnology, Inc, Santa
Cruz, Calif). After incubation with a peroxidase conjugated secondary antibody (Vector
Laboratory, Inc, Burlingame, Calif), the reaction was developed using the Vector NovaRed
peroxidase substrate kit (Vector Laboratories, Inc, Burlingame, Calif).
Fullenkamp et al. Page 3
Pancreas. Author manuscript; available in PMC 2015 October 12.
Author M
anuscriptA
uthor Manuscript
Author M
anuscriptA
uthor Manuscript

Both stains were blindly examined via light microscopy and scored by an expert pathologist
(R.S.). The presence of cellular injury, such as inflammation or fibrosis, was evaluated. In
addition, islet size and the percentage and placement of β cells within islets were recorded.
Islet size was scored based on the insulin-positive area of islets on a scale ranging from zero
(normal, no enlargement) to +++ (very enlarged).
The amount of fat in the pancreatic tissue was examined using H&E-stained slides and
digitally quantified using SPSS Sigma Scan Pro 5.0 software (SPSS Inc, Chicago, Ill) as
described previously.12 Pancreatic fat was expressed as a percent of total tissue area.
Oxidative Stress Analyses
Two measures of oxidative stress, malondialdehyde (MDA) and trolox equivalent
antioxidant capacity (TEAC) were quantitated in pancreatic tissue and serum that had been
flash frozen in liquid nitrogen at the time of sacrifice and stored at −80°C until analysis.
Malondialdehyde levels in serum and pancreatic tissue homogenates were measured using
high-performance level chromatography with UV detection as described previously with
some modifications.13,14 The total antioxidant capacity in pancreatic tissue homogenates
was measured using the TEAC assay described previously with some modifications.15
Statistical Analysis
Statistical Package for the Social Sciences (SPSS) Version 16.0 for Windows (SPSS,
Chicago, Ill) was used to perform statistical analyses. Student t tests were used to detect
differences between groups, and P < 0.05 was considered significant.
RESULTS
Pig Phenotypes
Selected characteristics of the 37 swine in the different diet groups examined in this study
are shown in Table 1. Compared to the lean control group, swine in all 3 hypercaloric diet
groups had gained a significant amount of weight by the time the animals were killed. Swine
fed with atherogenic or NASH diet had significantly elevated serum levels of total
cholesterol and low-density lipoprotein cholesterol compared with the control and fructose
diet groups, and the NASH diet group had a significantly increased triglycerides compared
with all 3 other diets. The NASH diet group also had significantly greater aspartate
aminotransferase (AST), alanine aminotransferase (ALT), and alkaline phosphatase levels
compared with the control group as described by Lee et al.8 There were no significant
differences in amylase, lipase, glucose, or insulin values among any of the diet groups. The
NASH diet groups had a significantly increased homeostatic model assessment method
value when compared with the control (4.1 ± 1.0 vs 2.1 ± 0.4, P < 0.05). There was a trend
for reduction of serum adiponectin in the NASH diet group compared to the controls, but
this did not reach statistical significance [13,296 ± 663 vs 16,351 ± 1322 qauc (expressed as
protein intensity), P = 0.08], and serum leptin levels in the NASH diet group were
significantly greater than in the control, fructose, and atherogenic diet groups (Table 1).
Fullenkamp et al. Page 4
Pancreas. Author manuscript; available in PMC 2015 October 12.
Author M
anuscriptA
uthor Manuscript
Author M
anuscriptA
uthor Manuscript

Histological and Morphological Analyses
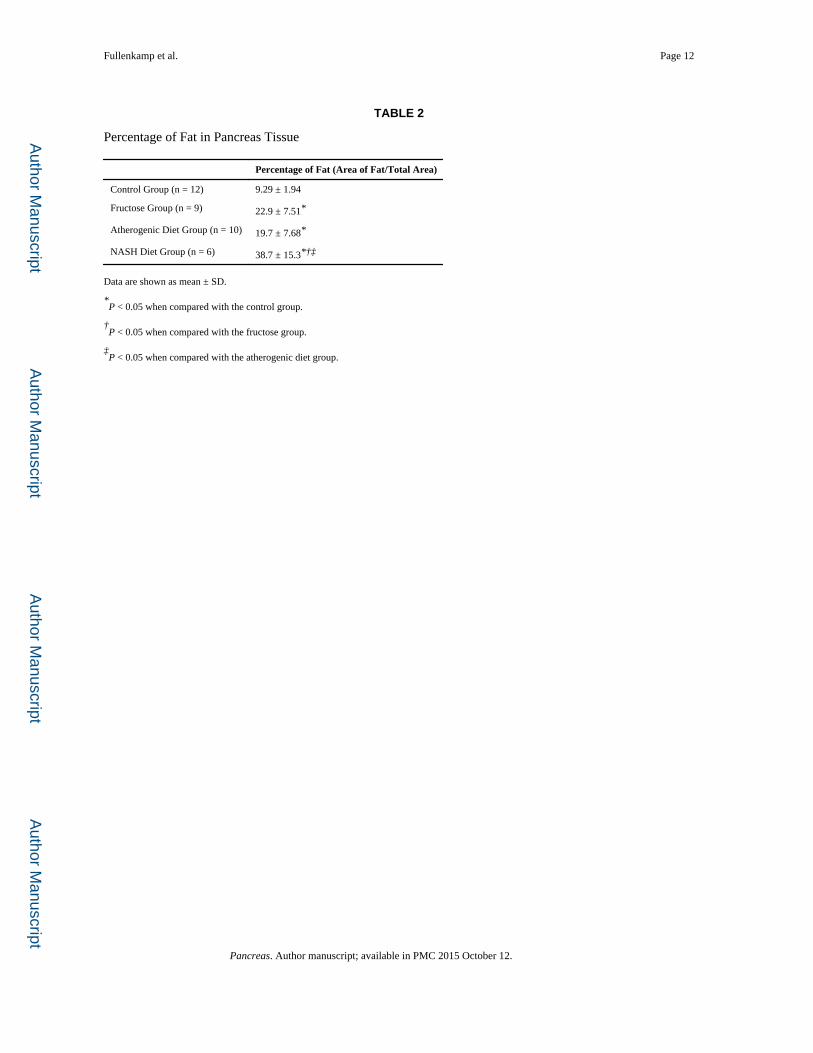
As shown in Table 2, the amount of fat in pancreatic tissue (measured as a percentage of
total tissue area) in the NASH diet group (38.7% ± 15.3%) was significantly greater than in
the control, fructose and atherogenic diet groups (9.29% ± 1.94%, 22.9% ± 7.51%, and
19.7% ± 7.68%, respectively; P < 0.001, P = 0.009, and P = 0.011, respectively). The
fructose and atherogenic diet groups also had significant increases in pancreatic fat when
compared to the control group (P = 0.001 and P = 0.004, respectively). Beyond this increase
in lipid accumulation, no differences in tissue morphology were observed among the diet
groups. Specifically, no inflammation, fibrosis, or cellular injury was observed in any of the
test diet groups or controls. Figure 1 shows representative H&E-stained images from all diet
groups.
Insulin-positive cells constituted greater than 90% of all islets, and these cells were
distributed diffusely throughout the islets. Representative images of insulin staining are
shown in Figure 2. Single or small clusters of insulin-immunoreactive cells outside of the
islets were also seen scattered throughout tissue samples from all 4 diet groups. In addition,
tissue samples from all diet groups contained “microcyst”-like growths within many of the
islets (Fig. 2D).
The number of swine scored for each category of islet size and corresponding percentages
are shown in Table 3. Five of the 11 control samples scored zero or no enlargement (45%),
two scored + (18%), and only one scored +++ (9%; very enlarged). In contrast, 8 of the 9
fructose diet samples showed islet enlargement (89%), and 6 of the 9 atherogenic diet
samples were enlarged (67%). Furthermore, all 5 NASH diet samples showed enlargement,
and 4 of the samples were scored as +++ (80%).
Oxidative Stress
Oxidative stress, which may play a role in cellular injury, was measured by examining MDA
and TEAC levels in serum and pancreatic tissue homogenate (Table 4). The NASH diet
group exhibited a significant increase in both the serum and pancreatic tissue levels of MDA
(3.0 ± 3.3 μmol/L and 0.1 ± 0.12 nmol/mg protein, respectively) compared to the control
group (1.46 ± 0.32 μmol/L and 0.04 ± 0.01 nmol/mg protein, respectively; P = 0.006 and P
= 0.01, respectively). The ratio of MDA to TEAC was also significantly greater in the
NASH diet group (1.3 ± 1.83) when compared to controls (0.41 ± 0.16, P = 0.006). No
differences in the serum and pancreatic MDA and the pancreatic TEAC were observed
among the fructose, atherogenic, and control diet groups. In addition, the TEAC levels in
swine fed with NASH diet (0.09 ± 0.01 μmol/mg protein) were not different when compared
to the control, fructose, or atherogenic diet groups (0.1 ± 0.01, 0.092 ± 0.004, and 0.12 ±
0.05 μmol/mg protein, respectively).
DISCUSSION
In this study, the effect of feeding 3 different obesogenic diets (high-fructose, atherogenic,
or NASH diet) on the pancreata of Ossabaw swine was examined. Overall, the fructose diet,
which induced metabolic syndrome in the absence of changes in liver histology,8 resulted in
Fullenkamp et al. Page 5
Pancreas. Author manuscript; available in PMC 2015 October 12.
Author M
anuscriptA
uthor Manuscript
Author M
anuscriptA
uthor Manuscript

enlargement of some islets with lipid accumulation, but no other significant changes within
the pancreas, such as cellular injury, inflammation, or lesions, were observed. The
atherogenic diet, which induced metabolic syndrome and simple steatosis in the liver,8 also
induced some islet enlargement and lipid accumulation in the pancreas. The NASH diet,
however, induced severe metabolic syndrome and abnormal liver histology consistent with
human NASH,8 along with islet enlargement and significant fat accumulation in the
pancreatic tissue. Interestingly, there was no association between the amount of pancreatic
fat and the severity of histological features of NASH, including hepatic fat accumulation,
potentially because of our small sample size. The NASH diet group also exhibited
significantly increased serum and pancreatic oxidative stress levels in the absence of cellular
injury or inflammation in the pancreas.
It has been previously shown that obesity can lead to an increase in pancreatic fat in both
animal models and humans,3,16–19 and similar observations were made in the current study.
However, increased pancreatic fat was not accompanied by cellular injury or inflammation,
indicating that simple steatosis alone was not be sufficient to induce pancreatitis/NASP in
our animal model. In fact, multiple factors are likely influential in the progression of
NAFPD to NASP.3,16 For example, oxidative stress has been cited as a factor in the
pathogenesis and progression of fatty pancreas to pancreatitis.16 The NASH diet group did
exhibit increased oxidative stress; however, progression to pancreatitis had not yet occurred.
The serum hormones adiponectin and leptin have also been identified as factors that may
contribute to the pathology of pancreatitis4 and as markers for pancreatitis,16 and we
observed a significant increase in serum leptin and a borderline significant decrease in
adiponectin in swine fed with NASH diet.
The NASH diet group showed the greatest islet enlargement. This trend may depict the
pancreas’ attempt to compensate for higher glucose levels. Similarly, obese Gottingen
miniature swine with metabolic syndrome have also shown β-cell expansion.20,21 Whereas
female Gottingen miniature swine fed ad libitum for 2 years did not develop type 2
diabetes,21 Ossabaw swine have been shown to progress to type 2 diabetes.22 It is therefore
possible that dietary intervention for more than 24 weeks, as was done in this study, in
Ossabaw swine would stress the pancreas to a sufficient degree to induce pancreatitis.
The pancreata of Ossabaw swine fed with the control diet did contain a small amount of fat
and exhibited some islet enlargement, which differs slightly from previous characterizations
of porcine pancreatic histology.20,23 This could be due to the greater predisposition of
Ossabaw swine to develop obesity and metabolic syndrome. Prior studies have identified
single or small clusters of β cells outside the islets in porcine pancreases, but it is unknown if
they continue to develop into larger or new islets.23,24 It is also possible that the small
clusters could represent islet degradation or abnormalities, as decreased insulin
immunoreactivity in islets was seen in mice fed with a high-fat diet as a sign of islet
dysfunction.25 In addition, the origin, cause, and effect of the termed microcystlike growths
are uncertain. Cystlike structures have been reported before in porcine islets as a site of new
β-cell formation; however, these were larger structures and these observations were made in
an in vitro environment.26
Fullenkamp et al. Page 6
Pancreas. Author manuscript; available in PMC 2015 October 12.
Author M
anuscriptA
uthor Manuscript
Author M
anuscriptA
uthor Manuscript

In this study, we were able to gain a better understanding of the effects of dietary
intervention on the pancreas in our large animal model of obesity, metabolic syndrome, and
NASH. In summary, we found that, although the NASH diet did not induce
steatopancreatitis, significant fat accumulation and elevated oxidative stress in the pancreas
were observed. These important observations suggest that the Ossabaw swine model may
better translate to human clinical medicine, as compared to rodent models, because it is only
in extreme cases of obesity that lipid accumulates in the pancreas of rodents.5 Findings from
our study reiterate that the Ossabaw miniature swine is emerging as an important large
animal model of obesity, metabolic syndrome,5 and NASH,8 and extend the characterization
of this model to NAFPD, although longer study periods may be required to induce NASP.
Acknowledgments
This study was supported by the Public Health Service Grants RR-013223 and HL-062552 and Purina TestDiet, Inc to MS, R01CA100908 to JK, and the Purdue-Indiana University Comparative Medicine Program.
References
1. Martinez J, Johnson CD, Sanchez-Paya J, et al. Obesity is a definitive risk factor of severity and mortality in acute pancreatitis: an updated meta-analysis. Pancreatology. 2006; 6:206–209. [PubMed: 16549939]
2. Papachristou GI, Papachristou DJ, Avula H, et al. Obesity increases the severity of acute pancreatitis: performance of APACHE-O score and correlation with the inflammatory response. Pancreatology. 2006; 6:279–285. [PubMed: 16636600]
3. Mathur A, Marine M, Lu D, et al. Nonalcoholic fatty pancreas disease. HPB (Oxford). 2007; 9:312–318. [PubMed: 18345311]
4. Zyromski NJ, Mathur A, Pitt HA, et al. A murine model of obesity implicates the adipokine milieu in the pathogenesis of severe acute pancreatitis. Am J Physiol Gastrointest Liver Physiol. 2008; 295:G552–G558. [PubMed: 18583460]
5. Varga O, Harangi M, Olsson IA, et al. Contribution of animal models to the understanding of the metabolic syndrome: a systematic overview. Obes Rev. 2009; 11:792–807. [PubMed: 19845867]
6. Sturek, M.; Alloosh, M.; Wenzel, J., et al. Ossabaw island miniature swine: cardiometabolic syndrome assessment. In: Swindle, MM., editor. Swine in the Laboratory: Surgrey, Anesthesia, Imaging, and Experimental Techniques. Boca Raton, FL: CRC Press; 2007. p. 397-402.
7. Dyson MC, Alloosh M, Vuchetich JP, et al. Components of metabolic syndrome and coronary artery disease in female Ossabaw swine fed excess atherogenic diet. Comp Med. 2006; 56:35–45. [PubMed: 16521858]
8. Lee L, Alloosh M, Saxena R, et al. Nutritional model of steatohepatitis and metabolic syndrome in the Ossabaw miniature swine. Hepatology. 2009; 50:56–67. [PubMed: 19434740]
9. Swindle, MM. Swine in the Laboratory: Surgery, Anesthesia, Imaging, and Experimental Techniques. Boca Raton, FL: CRC Press; 2006.
10. National Research Council. Guide for the Care and Use of Laboratory Animals. Washington, DC: National Academy Press; 1996.
11. American Veterinary Medical Association Panel on Euthanasia. Report of AVMA panel on euthanasia. J Am Vet Assoc. 2001; 218:669–696.
12. Bell LN, Temm CJ, Saxena R, et al. Bariatric surgery–induced weight loss reduces hepatic lipid peroxidation levels and affects hepatic cytochrome P-450 protein content. Annals of Surgery. 2010; 251(6):1041–1048. [PubMed: 20485142]
13. de Peyster A, Rodriguez Y, Shuto R, et al. Effect of oral methyl-t-butyl ether (MTBE) on the male mouse reproductive tract and oxidative stress in liver. Reprod Toxicol. 2008; 26:246–253. [PubMed: 18824092]
Fullenkamp et al. Page 7
Pancreas. Author manuscript; available in PMC 2015 October 12.
Author M
anuscriptA
uthor Manuscript
Author M
anuscriptA
uthor Manuscript

14. Mateos R, Goya L, Bravo L. Determination of malondialdehyde by liquid chromatography as the 2,4-dinitrophenylhydrazone derivative: a marker for oxidative stress in cell cultures of human hepatoma HepG2. J Chromatogr B Analyt Technol Biomed Life Sci. 2004; 805:33–39.
15. Re R, Pellegrini N, Proteggente A, et al. Antioxidant activity applying an improved ABTS radical cation decolorization assay. Free Radic Biol Med. 1999; 26:1231–1237. [PubMed: 10381194]
16. Yan MX, Li YQ, Meng M, et al. Long-term high-fat diet induces pancreatic injuries via pancreatic microcirculatory disturbances and oxidative stress in rats with hyperlipidemia. Biochem Biophys Res Commun. 2006; 347:192–199. [PubMed: 16814251]
17. Matsumoto S, Mori H, Miyake H, et al. Uneven fatty replacement of the pancreas: evaluation with CT. Radiology. 1995; 194:453–458. [PubMed: 7824726]
18. Katz DS, Hines J, Math KR, et al. Using CT to reveal fat-containing abnormalities of the pancreas. AJR Am J Roentgenol. 1999; 172:393–396. [PubMed: 9930790]
19. Kovanlikaya A, Mittelman SD, Ward A, et al. Obesity and fat quantification in lean tissues using three-point Dixon MR imaging. Pediatr Radiol. 2005; 35:601–607. [PubMed: 15785930]
20. Larsen MO, Juhl CB, Porksen N, et al. Beta-cell function and islet morphology in normal, obese, and obese beta-cell mass-reduced Gottingen minipigs. Am J Physiol Endocrinol Metab. 2005; 288:E412–E421. [PubMed: 15479954]
21. Larsen MO, Rolin B, Raun K, et al. Evaluation of beta-cell mass and function in the Gottingen minipig. Diabetes Obes Metab. 2007; 9(suppl 2):170–179. [PubMed: 17919191]
22. Neeb ZP, Edwards JM, Bratz IN, et al. Increased cholesterol is vital to the development of coronary artery disease and type 2 diabetes in Ossabaw swine. FASEB J. 2008; 22:1152.18.
23. Wieczorek G, Pospischil A, Perentes E. A comparative immunohistochemical study of pancreatic islets in laboratory animals (rats, dogs, minipigs, nonhuman primates). Exp Toxicol Pathol. 1998; 50:151–172. [PubMed: 9681646]
24. Jay TR, Heald KA, Carless NJ, et al. The distribution of porcine pancreatic beta-cells at ages 5, 12 and 24 weeks. Xenotransplantation. 1999; 6:131–140. [PubMed: 10431790]
25. Walz HA, Harndahl L, Wierup N, et al. Early and rapid development of insulin resistance, islet dysfunction and glucose intolerance after high-fat feeding in mice overexpressing phosphodiesterase 3B. J Endocrinol. 2006; 189:629–641. [PubMed: 16731793]
26. Oberg-Welsh C. Long-term culture in matrigel enhances the insulin secretion of fetal porcine islet-like cell clusters in vitro. Pancreas. 2001; 22:157–163. [PubMed: 11249070]
Fullenkamp et al. Page 8
Pancreas. Author manuscript; available in PMC 2015 October 12.
Author M
anuscriptA
uthor Manuscript
Author M
anuscriptA
uthor Manuscript

FIGURE 1. Pancreatic histology. Representative images are shown from the control (A), fructose (B),
atherogenic (C), and NASH (D) diet groups. The NASH diet group exhibited significantly
greater fat accumulation compared to the control, fructose, and atherogenic diet groups (P <
0.001, P = 0.009, and P = 0.011, respectively). The fructose and atherogenic diet groups had
significantly increased pancreatic steatosis compared to the control group (P = 0.001 and P
= 0.004, respectively).
Fullenkamp et al. Page 9
Pancreas. Author manuscript; available in PMC 2015 October 12.
Author M
anuscriptA
uthor Manuscript
Author M
anuscriptA
uthor Manuscript
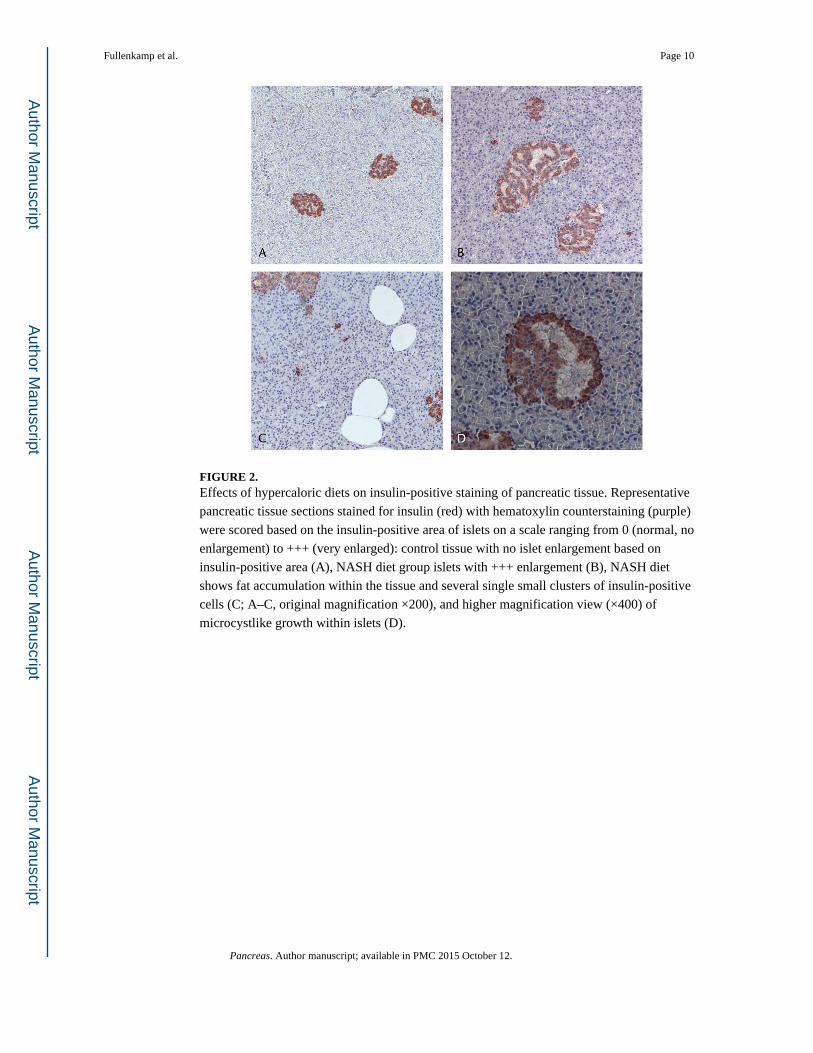
FIGURE 2. Effects of hypercaloric diets on insulin-positive staining of pancreatic tissue. Representative
pancreatic tissue sections stained for insulin (red) with hematoxylin counterstaining (purple)
were scored based on the insulin-positive area of islets on a scale ranging from 0 (normal, no
enlargement) to +++ (very enlarged): control tissue with no islet enlargement based on
insulin-positive area (A), NASH diet group islets with +++ enlargement (B), NASH diet
shows fat accumulation within the tissue and several single small clusters of insulin-positive
cells (C; A–C, original magnification ×200), and higher magnification view (×400) of
microcystlike growth within islets (D).
Fullenkamp et al. Page 10
Pancreas. Author manuscript; available in PMC 2015 October 12.
Author M
anuscriptA
uthor Manuscript
Author M
anuscriptA
uthor Manuscript

Author M
anuscriptA
uthor Manuscript
Author M
anuscriptA
uthor Manuscript
Fullenkamp et al. Page 11
TABLE 1
Selected Phenotypic Characteristics of Swine at Sacrifice
Control Group (n = 12)
Fructose Group (n = 9)
Atherogenic Diet Group (n = 10) NASH Diet Group (n = 6)
Sex (M/F) 4/8 9/0 4/6 0/6
Weight When Killed, kg 56.9 ± 3 97.7 ± 8.6* 81.1 ± 3.9† 85.6 ± 13.6*†
Mean Weight Gain, kg 14.2 ± 1.4 52.8 ± 7.3* 35.0 ± 4.3* 37.9 ± 13*‡
Serum Glycemic Measures
Glucose, fasting, mg/dL 77.4 ± 2.7 83.5 ± 2.6 86.4 ± 4.6 87.6 ± 6.4
Insulin, fasting, mg/dL 12 ± 2 15 ± 2 14 ± 1 18 ± 3
HOMA 2.1 ± 0.4 2.8 ± 0.5 3.2 ± 0.3 4.1 ± 1.0*
Peak insulin (by IVGTT), mg/dL 105 ± 9 143 ± 27 113 ± 15 142 ± 25
Plasma Lipids
Cholesterol, mg/dL 71 ± 4.5 63.0 ± 4.6 401.5 ± 30.9*† 628.7 ± 71.9*†
Triglycerides, mg/dL 24.1 ± 2.5 29.0 ± 2.7 44.7 ± 3*† 130.3 ± 16.8*†‡
LDL, mg/dL 27.1 ± 3.2 25.3 ± 2.8 280.9 ± 22.9*† 519.8 ± 68.3*†
HDL, mg/dL 39.2 ± 3.3 31.9 ± 3.0 80.9 ± 5.9 82.8 ± 5.3
Serum Chemistry Profile
AST, IU/L 35 ± 5 30 ± 6 34 ± 6 100 ± 21*†‡
ALT, IU/L 42 ± 6 18 ± 1 30 ± 2 41 ± 12†‡
Alkaline phosphatase, IU/L 74 ± 8 60 ± 9 119 ± 9 273 ± 110*†‡
Amylase, IU/L 1178 ± 86 1097 ± 137 1070 ± 90 780 ± 110
Lipase, IU/L 25 ± 0.4 25 ± 0 25 ± 0 25 ± 0
Serum Hormones
Adiponectin (qauc)§ 16,351 ± 1322 Not done 13,705 ± 894 13,296 ± 663
Leptin, ng/dL 2 ± 0.2 4 ± 1 3 ± 1 17 ± 5*†‡
Data are shown as mean ± SD.
*P < 0.05 when compared with the control group.
†P < 0.05 when compared with the fructose group.
‡P < 0.05 when compared with the atherogenic diet group.
§Expressed as protein intensity.
IVGTT indicates intravenous glucose tolerance test; LDL, low-density lipoprotein cholesterol; HDL, high-density lipoprotein cholesterol; AST, aspartate aminotransferase; ALT, alanine aminotransferase.
Pancreas. Author manuscript; available in PMC 2015 October 12.
Author M
anuscriptA
uthor Manuscript
Author M
anuscriptA
uthor Manuscript
Fullenkamp et al. Page 12
TABLE 2
Percentage of Fat in Pancreas Tissue
Percentage of Fat (Area of Fat/Total Area)
Control Group (n = 12) 9.29 ± 1.94
Fructose Group (n = 9) 22.9 ± 7.51*
Atherogenic Diet Group (n = 10) 19.7 ± 7.68*
NASH Diet Group (n = 6) 38.7 ± 15.3*†‡
Data are shown as mean ± SD.
*P < 0.05 when compared with the control group.
†P < 0.05 when compared with the fructose group.
‡P < 0.05 when compared with the atherogenic diet group.
Pancreas. Author manuscript; available in PMC 2015 October 12.

Author M
anuscriptA
uthor Manuscript
Author M
anuscriptA
uthor Manuscript
Fullenkamp et al. Page 13
TABLE 3
Number of Swine With Islet Cell Size Scores (0 to +++) Based on Insulin-Positive Staining Area
No Enlargement: 0 Slightly Enlarge: + Enlarge: ++ Very Enlarged: +++
Control Group (n = 11) 5 (45%) 2 (18%) 3 (27%) 1 (9%)
Fructose Group (n = 9) 1 (11%) 2 (22%) 3 (33%) 3 (33%)
Atherogenic Diet Group (n = 9) 3 (33%) 1 (11%) 2 (22%) 3 (33%)
NASH Diet Group (n = 5) 0 1 (20%) 0 4 (80%)
Data are shown as number of swine (%).
Pancreas. Author manuscript; available in PMC 2015 October 12.

Author M
anuscriptA
uthor Manuscript
Author M
anuscriptA
uthor Manuscript
Fullenkamp et al. Page 14
TABLE 4
Malondialdehyde and TEAC Levels in Serum and Pancreatic Tissue Homogenate
Control Group (n = 12)
Fructose Group (n = 9) Atherogenic Diet Group (n = 10)
NASH Diet Group (n = 6)
Serum MDA, μmol/L 1.46 ± 0.32 1.75 ± 0.54 2.11 ± 0.48 3.00 ± 3.3*
Pancreatic MDA, nmol/mg protein 0.04 ± 0.01 0.048 ± 0.0125 0.05 ± 0.01 0.1 ± 0.12*
Pancreatic TEAC, μmol/mg protein 0.1 ± 0.01 0.092 ± 0.004 0.12 ± 0.05 0.09 ± 0.01
Pancreatic MDA/TEAC 0.41 ± 0.16 0.53 ± 0.15 0.45 ± 0.13 1.30 ± 1.83*
Data are shown as mean ± SD.
*P < 0.05 when compared with the control group.
Pancreas. Author manuscript; available in PMC 2015 October 12.