hgcapital trust plc interim/media/files/h/hgcapital-trust/... · trust plc new deals £63m invested...
TRANSCRIPT

HgCapital Trust plc
Interim Results 30 June 2010

2© Copyright 2010 HgCapital
Summary
Performance
Balance Sheet Analysis
Investment Activity
Portfolio Review
Manager Update
Events since 30 June 2010
Conclusion
Appendices
ContentsHgCapital Trust plc
3© Copyright 2010 HgCapital
SummaryHgCapital Trust plc
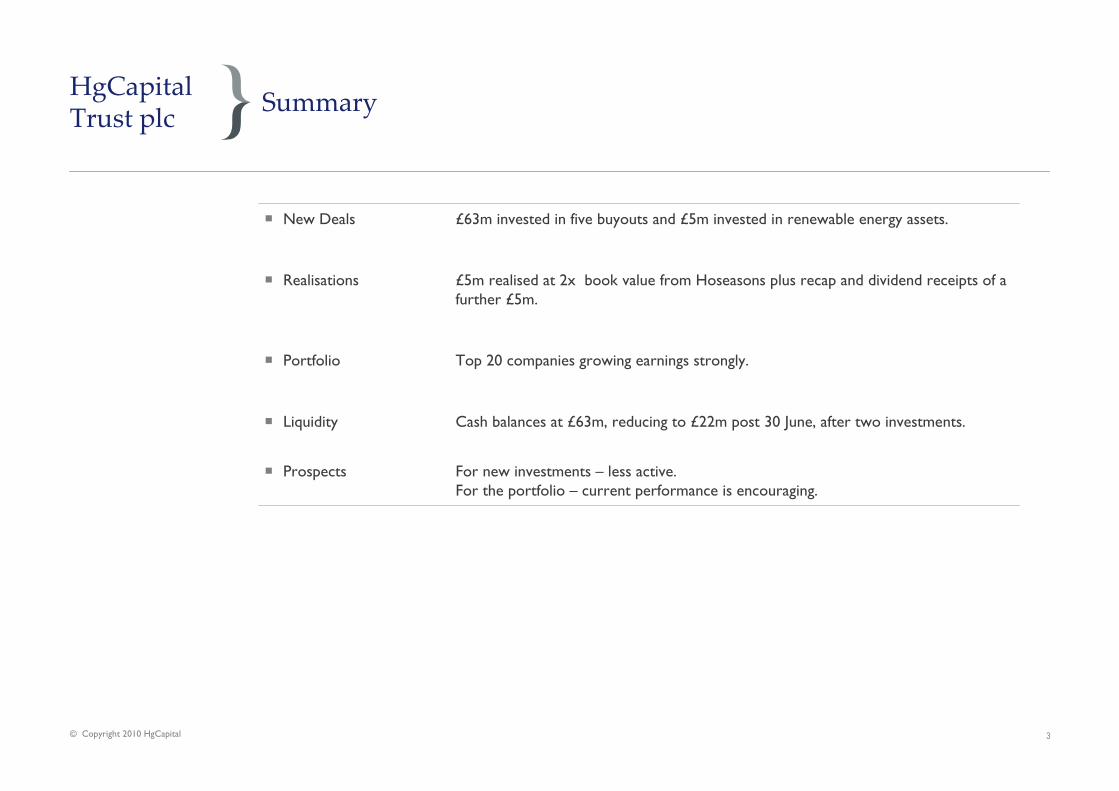
� New Deals £63m invested in five buyouts and £5m invested in renewable energy assets.
� Realisations £5m realised at 2x book value from Hoseasons plus recap and dividend receipts of a further £5m.
� Portfolio Top 20 companies growing earnings strongly.
� Liquidity Cash balances at £63m, reducing to £22m post 30 June, after two investments.
� Prospects For new investments – less active.For the portfolio – current performance is encouraging.

4© Copyright 2010 HgCapital
Summary
Performance
Balance Sheet Analysis
Portfolio Review
Investment Activity
Manager Update
Events since 30 June 2010
Conclusion
Appendices
ContentsHgCapital Trust plc

5© Copyright 2010 HgCapital
Financial Highlights
ASSETS AT 30 JUNE 2010* AT 31 DEC 2009% CHANGE OVER
6 MONTHS
Net assets (£’000) 291,941 236,044 23.7%
Net assets per share 938.6p 937.2p 0.1%
Liquid resources per share 203.7p 348.0p (41.5%)
Share price (ordinary shares at mid-market)
798.5p 844.0p (5.4%)**
Discount (%) over last reported NAV
10.3% 9.9% n/a
Share price (subscription shares) 42.0p n/a n/a
Performance
*Since 31 December 2009, an issue of £50 million of new ordinary shares completed at an issue price of 845p
** Performance of -1.4% after adding back 25.0p dividend and 8.4p implied value of subscription shares received (on a five-to-one basis)

6© Copyright 2010 HgCapital
Total Return
6 MTHS TO 30 JUNE 2010
1 YEAR TO 30 JUNE 2010
3 YEARS TO 30 JUNE 2010
5 YEARS TO 30 JUNE 2010
7 YEARS TO 30 JUNE 2010
10 YEARS TO 30 JUNE 2010
Net asset value 2.9% 9.8% 6.5% 13.2% 18.0% 11.3%
Share price (2.6%) 4.6% 1.5% 11.0% 21.5% 13.2%
FTSE All-Share Index
(6.1%) 21.1% (5.7%) 3.5% 7.4% 1.6%
*Figures are annualised
Performance

7© Copyright 2010 HgCapital
Analysis of net asset value (NAV) movements for the six months ending 30 June 2010
Performance

8© Copyright 2010 HgCapital
Analysis of unrealised movements in investment portfolio (including accrued interest movement of £1.0 million) for the six months ending 30 June 2010
Performance
© Copyright 2010 HgCapital

9© Copyright 2010 HgCapital
Realised and unrealised movements in investment portfolio(including accrued interest) during the six months ending 30 June 2010
Performance

Significant unrealised portfolio movementsduring the six months ending 30 June 2010
Company
Valuations as at31 December 2009
£m
Acquisitions less realisations at value to 30
June 2010
£m
Valuations as at 30 June 2010
£m
Valuation changes to 30 June 2010
£m Earnings Gearing Ratings Fx
Significant increases
Visma 27.7 1.7 40.6 11.2 ↑ ↑ ↓
Achilles 5.2 - 7.9 2.7 ↑
SLV 6.9 0.1 9.1 2.1 ↑ ↑ ↓
Epyx 5.9 0.5 8.4 2.0 ↑ ↑ ↓
Significant decreases
Pulse 24.6 (0.9) 22.6 (1.1) ↓
HgRPP1 11.6 3.6 13.8 (1.4) ↓
Sporting Index 8.0 - 6.1 (1.9) ↓ ↓
Performance
Drivers of valuation changes
© Copyright 2010 HgCapital 10

11© Copyright 2010 HgCapital
ContentsHgCapital Trust plc
Summary
Performance
Balance Sheet Analysis
Investment Activity
Portfolio Review
Manager Update
Events since 30 June 2010
Conclusion
Appendices

NAV AnalysisPerformance
AT 30 JUNE 2010 AT 31 DEC 2009
£m % £m %
Investments 228.6 78.3% 147.8 62.6%
Liquid Resources* 63.4 21.7% 87.7 37.2%
Other net (liabilities)/assets (0.1) - 0.5 0.2
Net assets 291.9 100.0% 236.0 100.0%
*Since the period end we have completed the acquisition of Teufel and Mr Ted, an add-on to Stepstone, reducing liquid resources by £12.6 million and announced the acquisition of TeamSystem which will reduce liquid resources by £28.5m. This transaction is expected to complete in September 2010. After this investment, liquid resources are estimated to be about £22 m (8% of current NAV).
© Copyright 2010 HgCapital 12

Liquid Resources and Outstanding Commitments Balance Sheet Analysis
AT 30 JUNE 10ESTIMATED POSITION POST TRANSACTIONS*
£m % of NAV £m % of NAV
Total liquid resources** 63.4 21.7 22.3 7.6
Outstanding Commitments 231.0 79.1 189.9 65.0
Hg5 Vintage 19.6 19.6
Hg6 Vintage 200.0 158.9
HgRPP1 1.8 1.8
HgRPP2 9.6 9.6
Net oustanding commitments less liquid resources
167.6 57.4 167.6 57.4
*Post investments related to the new investment in Teufel (£9.1m), TeamSystem (£28.5m) which is expected to complete in September and a further investment in Stepstone (£3.5m) to fund a bolt-on acquisition that closed in August.
**HgCapital plc has the benefit of an investment opt-out provision in its commitment to invest alongside HgCapital 6, so that it can opt-out of a new investment without penalty should it not have the cash available to invest.
© Copyright 2010 HgCapital 13

14© Copyright 2010 HgCapital
ContentsHgCapital Trust plc
Summary
Performance
Balance Sheet Analysis
Investment Activity
Portfolio Review
Manager Update
Events since 30 June 2010
Conclusion
Appendices

15© Copyright 2010 HgCapital
Investments in the six months to 30 June 2010Investment Activity
COMPANY SECTOR ACTIVITYCOST £’000
New Investments
Stepstone TMT Global provider of strategic HR software 15,805
JLA Services Provision of on-premise laundry services and commercial machine sales 13,398
Frosunda Healthcare Swedish provider of specialist disability care 13,076
Manx TMT Telecommunications and internet provider 11,033
SimonsVoss Industrials Provider of digital radio-based locking and access control systems 10,065
RPP2 Fund Renewable energy Renewable energy fund 1,428
Total New Investments 64,805
Further Investments
Voyage Healthcare Care home operator 4,357
RPP Fund Renewable energy Renewable energy fund 3,600
Visma TMT Business application software 1,712
Goldshield Healthcare Markets pharmaceuticals and nutraceuticals (2,730)
Other Investments 549
Total Further Investments 7,488
Total Investment by the Company 72,29315

16© Copyright 2010 HgCapital
COMPANY SECTOR EXIT ROUTECost £’000
PROCEEDS* £’000
CURRENT YEAR GAIN/(LOSS)**
£’000
Full Realisations
Hoseasons Consumer & Leisure Trade sale 2,197 5,065 2,592
FTSA*** Industrials Liquidation 6,813 - -
Total Full Realisations 9,010 5,065 2,592
Partial Realisations
Elite TMT Refinancing 2,209 4,126 -
Pulse Healthcare Dividend - 909 -
Other 2,395 554 165
Total Partial Realisations 4,604 5,589 165
Total Realisations 13,614 10,654 2,757
Investment Activity
Realisations in the six months to 30 June 2010
* Includes gross revenue received during the year
** Realised proceeds including gross revenue received, in excess of 31 December 2009 book value and accrued interest
*** Fully written-off pre 31 December 2009

17© Copyright 2010 HgCapital
Investment Environment and Prospects
� Our investment stance has changed little since we released results for 2009 in March.
� We retain a concern that there will be a second leg to the recession- accordingly we have little interest in cyclical stories; and - we are very focused on buying growth companies at valuations below long run averages.
� We can see buy out activity levels rising (56% by number and 290% by value ytd cf 2009) and debt markets opening up again … to our surprise.
� Return of a two way market in M&A.
� Risks centre on- relapse in growth, triggered by slowdown in China/USA- another banking crisis, triggered by Euro area splitting.
Investment Activity

18© Copyright 2010 HgCapital
ContentsHgCapital Trust plc
Summary
Performance
Balance Sheet Analysis
Investment Activity
Portfolio Review
Manager Update
Events since 30 June 2010
Conclusion
Appendices

19© Copyright 2010 HgCapital
Portfolio as at 30 June 2010The top 10 buy-out investments represent two thirds of the portfolio value
Portfolio Review
InvestmentYear ofInvestment Sector Location
Residual Cost £’000
Total valuation* £’000
Portfolio value %
Cumulative Value %
Visma
Pulse
Stepstone
JLA
Frosunda
Manx
Mondo
SimonsVoss
SLV
Goldshield
2006
1999
2010
2010
2010
2010
2007
2010
2007
2009
TMT
Healthcare
TMT
Services
Healthcare
TMT
Industrials
Industrials
Industrials
Healthcare
Nordic Region
UK
UK
UK
Nordic Region
UK
Nordic Region
Germany
Germany
UK
16,321
6,131
15,805
13,398
13,076
11,033
6,987
10,065
5,999
8,545
40,633
22,624
14,883
13,398
12,837
11,033
10,272
9,898
9,098
8,545
17.8%
9.8%
6.5%
5.9%
5.6%
4.8%
4.5%
4.3%
4.0%
3.7%
17.8%
27.6%
34.1%
40.0%
45.6%
50.4%
54.9%
59.2%
63.2%
66.9%
Top 10 Investments 107,360 153,221 66.9%

20© Copyright 2010 HgCapital
Portfolio as at 30 June 2010The top 20 buy-out investments represent over 90% of the portfolio value
Portfolio Review
InvestmentYear ofInvestment
Sector LocationResidual Cost
£’000Total valuation*
£’000Portfolio value %
Cumulative Value %
Voyage
Epyx
Achilles
Schleich
Americana
Sporting Index
Elite
Casa Reha
SHL
Software (Cayman) LP re IRIS
2006
2009
2008
2006
2007
2005
2005
2008
2006
2006
Healthcare
TMT
TMT
Consumer & Leisure
Consumer & Leisure
Consumer & Leisure
TMT
Healthcare
Services
TMT
UK
UK
UK
Germany
UK
UK
Benelux
Germany
UK
UK
13,112
6,388
5,226
4,634
4,625
7,272
3,540
8,151
7,984
530
8,375
8,358
7,918
7,567
7,013
6,106
3,534
2,766
2,728
1,897
3.7%
3.7%
3.5%
3.3%
3.1%
2.7%
1.5%
1.2%
1.2%
0.8%
70.6%
74.3%
77.8%
81.1%
84.2%
86.9%
88.4%
89.6%
90.8%
91.6%
Top 20 Investments 168,822 209,483 91.6%

21© Copyright 2010 HgCapital
Portfolio as at 30 June 2010Renewable Energy Fund Investments
Portfolio Review
� The Trust holds an investment via a limited partnership interestin the Manager’s two Renewable Energy Funds, RPP1 and RPP2.
� The Fund’s give investors an exposure to renewable power assets to deliver returns through yield during operation and capital gain at exit.
� The fund typically takes control positions in high quality European renewable energy infrastructure projects with minimal GDP and technology risk.
Investment VintageValuation
£000
Portfolio Value
%
RPP1 2006 13,771 6.0%
RPP2 2010 1,364 0.6%
15,135 6.6%
66%
31%
3%
Wind Solar Biogas
34%
3%
3%
31%
28%
1%
UK / Ireland Germany France
Spain Sweden Italy
Platform analysis Geographical analysis

22© Copyright 2010 HgCapital 22© Copyright 2010 HgCapital
TradingPortfolio Review
� The aggregate sales and EBITDA for the Top 20 buyout investments over the last 12 months was £2.0bn and £0.5bn respectively.
� The Top 20 investments have delivered year on year sales and EBITDA growth of 6% and 17% respectively.
� The Top 10 investments, which include five new investments have continued to trade robustly through the downturn, with year on year sales and EBITDA growth of 7% and 14% respectively.
� A number of investments within the next 10 investments were harder hit by the downturn and have shown some good recovery, growing sales and EBITDA over the last 12 months by 5% and 20% respectively.
Trading for the Top 20 Buyout Investments

Gearing
Debt/EBITDA
Band Number
EBITDA
£m
Debt
£m
Portfolio Value
£m
0-2 6 75 65 67.9
2-4 8 139 451 76.1
4-6 5 187 915 57.1
>6 1 35 240 8.4
20 436 1,671 209.5
� Average value weighted Debt/EBITDA of the Top 20 investments was 2.9x at 30th June 2010.
Gearing Analysis for the top 20 investments
Portfolio Review
© Copyright 2010 HgCapital 23

Valuations
� Average Value weighted EV/EBITDA multiple used at 30th June was 9x for the Top 20 investments.
� Average proceeds over book value on exit has been 1.9x on 30 exits since mid 2005.
Portfolio Review
Band Number
Portfolio Value
£m
<7x 8 69.1
7-9x 5 44.0
9-11x 3 50.4
>11x 4 46.0
20 209.5
Valuation Multiple bands for the Top 20 Investments
© Copyright 2010 HgCapital 24

25© Copyright 2010 HgCapital
ContentsHgCapital Trust plc
Summary
Performance
Balance Sheet Analysis
Portfolio Review
Investment Activity
Manager Update
Events since 30 June 2010
Conclusion
Appendices

Manager Update
� Hg6 had a final closing in May 2010, with aggregate commitments of £1.9bn, of which HgCapital Trust plc has committed £285 million.
� We are in the process of raising our second renewable energy fund with targeted commitments of €500m. The Trust has agreed to commit €40m to this fund once aggregate commitments reach €200m. The Trust has initially committed €13m alongside a number of LPs to fund the first investment in RPP2, an on-shore Swedish wind farm development.
� During the year we have taken the opportunity to strengthen our team, including the hiring of an experienced Director in Healthcare from Apax and a Senior Partner from Deloitte to lead our Services team.
© Copyright 2010 HgCapital 26

27© Copyright 2010 HgCapital
ContentsHgCapital Trust plc
Summary
Performance
Balance Sheet Analysis
Portfolio Review
Investment Activity
Manager Update
Events since 30 June 2010
Conclusion
Appendices

28© Copyright 2010 HgCapital
Events since 30 June 2010HgCapital Trust plc
� Net asset value per share at 31 July 2010 was 941.7p.
� In July we completed the acquisition of Teufel, a leading designer and online retailer of loud speaker systems in Germany. HgCapital Trust plc invested £9.1m in this transaction.
� In August we announced the acquisition of TeamSystem, the leading provider of regulatory driven SME business software in Italy. The acquisition is expected to be completed by the end of September. HgCapital Trust plc will invest £28.5m in this transaction. Furthermore, we completed the acquisition of Mr Ted, an add-on for Stepstone, in which HgCapital Trust’s investment was £3.5 million.
� Following these acquisitions the liquid resources of the Trust are estimated to be £22 million and outstanding commitments are £190 million.
� The Manager and the Board are currently in preliminary discussions with banks to put in place a revolving credit facility.

29© Copyright 2010 HgCapital
Contents
Summary
Performance
Portfolio Review
Investment Activity
Manager Update
Events since 30 June 2010
Conclusion
Appendices
HgCapital Trust plc

30© Copyright 2010 HgCapital 30© Copyright 2010 HgCapital
ConclusionHgCapital Trust plc
� Seven new investments selected that fit our tight criteria during the buyer’s market phase of the M&A cycle.
� Moving into a two way market in M&A, owning 20 companies delivering 17% growth in ebitda will attract the attention of buyers.
� Best cadre of portfolio CEOs allow us to look forward with confidence about the prospects for the Trust.

31© Copyright 2010 HgCapital
Contents
Summary
Performance
Portfolio Review
Investment Activity
Manager Update
Events since 30 June 2010
Conclusion
Appendices
HgCapital Trust plc

32© Copyright 2010 HgCapital 32
HgCapital Trust has rewarded the patient investor –outperforming the FTSE All-Share Index by 3x and listed PE peers by 2.4-8x over the last 10 years
+10.2% p.a. share price appreciation for HgCT vs. -3.3% p.a. for LPE Peers, -1.7% p.a. for the FTSE All-Share Index10 year total return of 13.2% p.a. for HgCT vs. 1.6% p.a. for the FTSE All-Share Index
Note: Chart shows share price return. Data as per 12 January 2010; (1) Equally weighted index of 3i Group, Candover, Electra, Graphite, and SVG Capital.
Appendices
© Copyright 2010 HgCapital
0%
50%
100%
150%
200%
250%
300%
2000 2001 2002 2003 2004 2005 2006 2007 2008 2009 2010
HgCapital Trust LPE Peer Index (1) FTSE All-Share
264%
72%
84%

33© Copyright 2010 HgCapital 33
HgCapital Trust – Outperforming its listed PE peersAppendices
HgCapital Trust outperformed key competitors by an average of 3.7x over the last 10 yearsBest performing peer Electra was outperformed by 2.4x and worst performing 3i by >8x
Note: Chart shows share price return. Data as per 12 January 2010© Copyright 2010 HgCapital
0%
50%
100%
150%
200%
250%
300%
2000 2001 2002 2003 2004 2005 2006 2007 2008 2009 2010
HgCapital Trust Candover Electra
SVG Graphite 3i Group
264%
88%
112%
97%
32%
31%

34© Copyright 2010 HgCapital
Analysis of Movement in NAV
£’000
Opening net asset value as at 1 January 2010
Net proceeds from share issue
236,044
48,855
Realised loss to book value at 31 December 2009 (excludes gross revenue including gilts results)
(619)
Net unrealised appreciation of investments (excluding accrued interest) 12,177
Gross revenue 6,510
Priority profit share to General Partners (3,542)
Other Expenditure (1,187)
Dividend paid (6,297)
Closing net asset value as at 30 June 2010 291,941
Appendices

35© Copyright 2010 HgCapital
Pre 2005
15%
Year 2005
10%
Year 2006
28%
Year 2007
23%
Year 2008
12%
Year 2009
12%
Pre 2005
15%
Year 2005
10%
Year 2006
28%
Year 2007
23%
Year 2008
12%
Year 2009
12%
Pre 2005
15%
Year 2005
10%
Year 2006
28%
Year 2007
23%
Year 2008
12%
Year 2009
12%
VINTAGEVALUATION BASIS
Valuation Basis and VintagePortfolio Review
As at 30 June 2010 by value
2010
28%
2009
7%
2008
5%2007
12%
2006
33%
pre 2006
15%
Earnings
48%
Cost
38%
Written down
7%
Net assets
7%

36© Copyright 2010 HgCapital
BY NUMBERBY VALUE
Sector coverage of investmentsPortfolio Review
As at 30 June 2010 by value
TMT
40%
Healthcare
24%
Industrials
13%
Consumer & Leisure
9%
Services
7%
Renewable Energy
6%
Fund
1%
TMT
27%
Healthcare
20%
Industrials
17%
Consumer & Leisure
11%
Fund
11%
Services
11%
Renewable Energy
3%

37© Copyright 2010 HgCapital
BY STAGEBY GEOGRAPHY
Geography and StagePortfolio Review
As at 30 June 2010 by value
UK
50%
Nordic Region
28%
Germany
13%
Rest of Europe
7%
Benelux
1%
North America
1%
Buyout
93%
Renewable Energy
6%
Fund
1%

38© Copyright 2010 HgCapital
Portfolio by Sector: 30 June 2010Appendices
*Including accrued interest
Investment Year of investment Valuation basis Residual costTotal
valuation* Portfolio value
£'000 £'000 %
TMT investments
Visma 2006 Earnings 16,321 40,633 17.8%
Stepstone 2010 Cost 15,805 14,883 6.5%
Manx Telecom 2010 Cost 11,033 11,033 4.8%
Epyx 2009 Cost 6,388 8,358 3.7%
Achilles 2008 Cost 5,226 7,918 3.5%
Elite 2005 Written down 3,540 3,534 1.5%
Software (Cayman), LP - re Blue Minerva 2006 Earnings 530 1,897 0.8%
Software (Cayman), LP - re Guildford 2007 Earnings 253 879 0.4%
Tiger Capital 2008 Other 632 277 0.1%
Total TMT investments 59,728 89,412 39.10%
Healthcare investments
Pulse Staffing 1999 Earnings 6,131 22,624 9.8%
Frosunda 2010 Cost 13,076 12,837 5.6%
Goldshield 2009 Cost 8,545 8,545 3.7%
Voyage 2006 Written down 13,112 8,375 3.7%
Casa Reha 2008 Written down 8,151 2,766 1.2%
Doc M 2004 Other - 137 0.1%
PBR 2002 Other - - -
Total Healthcare investments 49,015 55,284 24.10%

39© Copyright 2010 HgCapital
Portfolio by Sector: 30 June 2010 (continued)Appendices
*Including accrued interest
Investment Year of investment Valuation basis Residual costTotal
valuation* Portfolio value
£'000 £'000 %
Industrials investments
Mondo 2007 Earnings 6,987 10,272 4.5%
SimonsVoss 2010 Cost 10,065 9,898 4.3%
SLV 2007 Earnings 5,999 9,098 4.0%
Hirschmann 2004 Other - 188 0.1%
KVT (King) 2008 Written down 5,827 - -
W.E.T 2003 Written down 7,774 - -
Total Industrials investments 36,652 29,456 12.90%
Consumer & Leisure investments
Schleich 2006 Earnings 4,634 7,567 3.3%
Americana 2007 Earnings 4,625 7,013 3.1%
Sporting Index 2005 Earnings 7,272 6,106 2.7%
Cornish Bakehouse 2007 Written down 4,200 - -
Total Consumer & Leisure investments 20,731 20,686 9.10%
Services investments
JLA 2010 Cost 13,398 13,398 5.9%
SHL 2006 Written down 7,984 2,728 1.2%
Atlas Energy 2007 Written down 8,153 - -
Fabory 2007 Written down 7,474 - -
Total Services investments 37,009 16,126 7.10%
40© Copyright 2010 HgCapital
Portfolio by Sector: 30 June 2010 (continued)Appendices
*Including accrued interest
Investment Year of investment Valuation basis Residual costTotal
valuation* Portfolio value
£'000 £'000 %
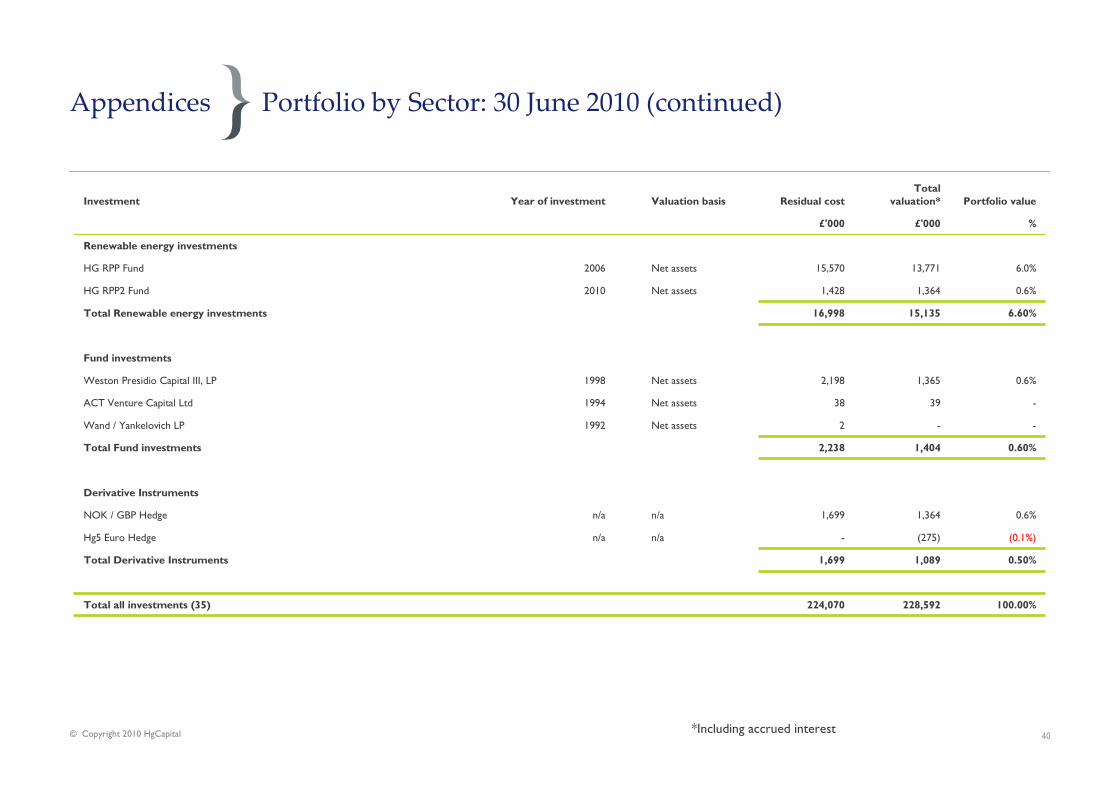
Renewable energy investments
HG RPP Fund 2006 Net assets 15,570 13,771 6.0%
HG RPP2 Fund 2010 Net assets 1,428 1,364 0.6%
Total Renewable energy investments 16,998 15,135 6.60%
Fund investments
Weston Presidio Capital III, LP 1998 Net assets 2,198 1,365 0.6%
ACT Venture Capital Ltd 1994 Net assets 38 39 -
Wand / Yankelovich LP 1992 Net assets 2 - -
Total Fund investments 2,238 1,404 0.60%
Derivative Instruments
NOK / GBP Hedge n/a n/a 1,699 1,364 0.6%
Hg5 Euro Hedge n/a n/a - (275) (0.1%)
Total Derivative Instruments 1,699 1,089 0.50%
Total all investments (35) 224,070 228,592 100.00%

41© Copyright 2010 HgCapital
HgCapital – Strategic relevance
STRATEGY Mid-Market
� £50 million - £500 million EV buyouts/buy-ins:
− Consistently strong deal-flow.
− Multiple exit options.
− Not overly dependent on capital markets (for returns, financing or exit).
− Defensible market positions / proven records.
− Ability to attract high quality management teams.
− Return attribution potential to effect material operational improvements.
� Sole / lead / control investors.
� Seek multiple value levers.
� Conservative capital structures.
Pan-Regional
� Primary coverage of northern Europe.
� Cultural affinity with management teams and business environments.
� Secondary coverage of other European markets via sector focus.
© Copyright 2010 HgCapital
Appendices
41

42© Copyright 2010 HgCapital
HgCapital – Tactical advantage
TACTICS Sector-focused
� 5 dedicated sector teams (developed over 12 years) covering c.70% of the market.
� Annual business planning process drives agenda for each team.
� Strategy superseding geography in investment targeting.
Intensive post-transaction planning and management
� Company and portfolio level activity (developed over 10 years).
� Dedicated resource and expertise (team of 8 professionals, plus support from other
senior partners).
� Helps drive growth and optimise exits.
Highly resourced
� Favourable ratio of staff to deals - team of 75 with 19 active portfolio companies.
� Just under £3.1 billion AUM.
� Partners average 16 years of private equity experience / worked together for 12
years.
© Copyright 2010 HgCapital
Appendices
42

43© Copyright 2010 HgCapital
HgCapital 6 Portfolio
Relationship between HgCapital (“the Manager”), HgCapital Trust and the HgCapital 6 fund
The Manager
Appendices
© Copyright 2010 HgCapital
Sources, arranges and manages investment portfolio
Manages investment portfolio
Investment
HgCapital Trust£285m
Other investors in HgCapital 6
£1,615m
Investment
Same terms (management fee, etc.)
43
£1.9bn
Note: HgCapital Trust plc has a unique investment opt-out (without penalty)

44© Copyright 2010 HgCapital 44
HgCapital’s strategy and tactics have been effective and are well suited to the next stage in the life of Private Equity
HgCapital
MID-MARKET AND PAN REGIONAL (UK, Germany, Northern Europe)
� Multiple value levers.
� Conservative capital structures.
� Multiple exit options not overly dependent on capital markets.
DEEP SECTOR KNOWLEDGE THROUGH SPECIALIST TEAMS
� Research-driven investment selection in TMT, Services, Healthcare & Industrials.
� Higher deal conversion.
� Optimizes exits.
DEDICATED SPECIALIST PORTFOLIO MANAGEMENT � Drive incremental growth and profit.
� Strengthen teams and franchises.
BROAD BENCH OF PROFESSIONALS LED BY A COHERENT PARTNER GROUP
� 40+ investment executives with an average experience of 8+ years in private equity related workfields.
� Partners have worked 12 years together and enjoy an average experience of 16 years in private equity.
� Total team of 75 employees.
LAUNCHING NEW PRODUCTS THAT EXPLOIT CORE COMPETENCIES
� Hg6: £1.9 billion flagship buy-out fund- similar focus, strategy and tactics to earlier funds.
� RPP1&2 : Expansion of successful Renewable Power Generation business.
� More research-led ideas that leverage core competences.
© Copyright 2010 HgCapital

45
Disclaimer
This document constitutes an advertisement and is not a prospectus. It does not constitute an offer to sell or a solicitation of an offer to buy any securities described herein in the United States or in any other jurisdiction, nor shall it, by the fact of its distribution, form the basis if, or be relied upon, in connection with any contract therefor. No offer, invitation or inducement to acquire shares or other securities in HgCapital Trust plc (“Shares”) is being made by or in connection with this document. Any offer, invitation or inducement to acquire Shares will be made solely by means of a prospectus published in connection with any offering (the "Prospectus") and any decision to buy Shares should be made solely on the basis of the information contained in the Prospectus.
The information presented herein is not an offer for sale within the United States of any equity shares or other securities of HgCapital Trust plc. HgCapital Trust plc has not been and will not be registered under the US Investment Company Act of 1940, as amended (the Investment Company Act"). In addition, the Shares have not been and will not be registered under the US Securities Act of 1933, as amended (the "Securities Act") or any other applicable law of the United States. Consequently, the Shares may not be offered or sold or otherwise transferred within the United States, or to, or for the account or benefit of, US Persons, except pursuant to an exemption from the registration requirements of the Securities Act and under circumstances which will not require HgCapital Trust plc to register under the Investment Company Act. No public offering of the Shares is being made in the United States. The Shares may only be resold or transferred in accordance with the restrictions set forth in the Prospectus to be published in connection with any proposed offering and related subscription documents. This communication should not be distributed, forwarded, transferred, reproduced, or otherwise transmitted, directly or indirectly, to any persons within the United States or to any US Persons unless it is lawful to do so.
This document is being issued by HgCapital and is for private circulation only. The information and opinions contained in this document are for background purposes only, do not purport to be full or complete and do not constitute investment advice. Subject to HgCapital's regulatory requirements and responsibilities, no reliance may be placed for any purpose on the information and opinionscontained in this document or their accuracy or completeness and no representation, warranty or undertaking, express or implied, is given as to the accuracy or completeness of the information or opinions contained in this document by HgCapital or any of its members or employees and no liability is accepted by such persons for the accuracy or completeness of any such information or opinions.
HgCapital’s communications are only directed at eligible counterparties and professional clients. HgCapital acts for its investors and for no one else in relation to its business. It will not advise, provide services to or be responsible for providing customer protections to any other person.
This information is not intended to provide, and should not be relied upon, for accounting, legal, tax advice or investment recommendations. You should consult your tax, legal, accounting or other professional advisors about the issues discussed herein. The descriptions contained herein are summaries and are not intended to be complete and neither HgCapital nor any of its affiliates undertakes any obligation to update or correct any errors or inaccuracies in any of the information presented herein. The information in these materials and any other information discussed at the presentation is subject to change. This document does not constitute or form part of any offer to issue or sell, or any solicitation of any offer to subscribe or purchase any investment nor shall it or the fact of its distribution form the basis of, or be relied on in connection with, any contract therefor.
The distribution of these materials in certain jurisdictions may be restricted by law and persons into whose possession these materials come should inform themselves about and observe any relevant restrictions. In particular, these materials are not for publication or distribution, directly or indirectly, in, into or from the United States of America, Canada, Australia, Japan, New Zealand or the Republic of South Africa. Any failure to comply with the above restrictions may constitute a violation of such securities laws. This document is and may be communicated only to (and is directed only at) persons to whom such communication may lawfully be made.
These materials include statements that are, or may be deemed to be, "forward-looking statements" which are based on current expectations and projections about future events. In some cases, these forward-looking statements may be identified by the use of forward-looking terminology, including the terms "targets", "believes", "estimates", "anticipates", "expects", "intends", "may", "will" or "should" or, in each case, their negative or other variations or comparable terminology. They appear in a number of places throughout these materials and include statements regarding the intentions, beliefs or current expectations of HgCapital and/or its members or employees concerning, among other things, the trading performance, results of operations, financial condition, liquidity, prospects and investment policy of HgCapital Trust plc. By their nature, these forward-looking statements as well as those included in any other material discussed at any presentation involve risks and uncertainties because they relate to events and depend on circumstances that may or may not occur in the future.
© Copyright 2010 HgCapital
HgCapital

46
Disclaimer
Forward-looking statements are not guarantees of future performance. A number of important factors could cause actual results or outcomes to differ materially from those expressed, projected or implied in any forward-looking statements. No one undertakes publicly to update or revise any such forward-looking statement. In light of these risks, uncertainties and assumptions, the events or circumstances referred to in the forward-looking statements may not occur. None of the future projections, expectations, estimates or prospects in this document should be taken as forecasts or promises nor should they be taken as implying any indication, assurance or guarantee that the assumptions on which such future projections, expectations, estimates or prospects have been prepared are correct or exhaustive or, in the case of the assumptions, fully stated in the document. No one undertakes to publicly update or revise any such forward-looking statement, whether as a result of new information, future events or otherwise. As a result of these risks, uncertainties and assumptions, you should not place undue reliance on these forward-looking statements as a prediction of actual results or otherwise.
Return targets are targets only and are based over the long-term on the performance projections of the investment strategy and market conditions at the time of modelling and are therefore subject to change. There is no guarantee that any target return can be achieved. Investors should not place any reliance on such target return in deciding whether to invest in HgCapital Trust plc or any fund established by HgCapital.
To the extent available, the industry, market and competitive position data contained in these materials come from official or third party sources. Third party industry publications, studies and surveys generally state that the data contained therein have been obtained from sources believed to be reliable, but that there is no guarantee of the accuracy or completeness of such data. The contents of this document have not been independently verified, are not comprehensive, does not contain all the information that a prospective purchaser of securities may desire or require in deciding whether or not to offer to purchase such securities and do not constitute a due diligence review and should not be construed as such. Subject to HgCapital's regulatory requirements and responsibilities, no undertaking, representation, warranty or other assurance, express or implied, is made or given by or on behalf of HgCapital or any of its members, employees, agents or advisers or any other person as to the accuracy, completeness or fairness of the information, forward-looking statements or opinions contained in this document and no responsibility or liability is accepted by any of them for any such information, forward-looking statements or opinions or in respect of any omission, and this document is distributed expressly on the basis that it shall not give rise to any liability or obligation if, for whatever reason, any of its contents are or become inaccurate, incomplete or misleading and neither HgCapital nor any such persons undertakes any obligation to provide the recipient with access to additional information or to correct any inaccuracies herein which may become apparent.
HgCapital is the trading name of HgCapital LLP and Hg Pooled Management Limited.
Registered office: 2 More London Riverside, London SE1 2AP.
Authorised and regulated by the Financial Services Authority.
© Copyright 2010 HgCapital
HgCapital