hfcs well placed expect strong 17 june 2015 - alpha...
TRANSCRIPT

See Appendix A-1 for analyst certification, important disclosures and the status of non-US analysts.
Global Markets Research
AN
CH
OR
RE
PO
RT
India financials: Mortgage finance – The structural story continues
HFCs well placed – expect strong returns with low asset quality risks
Mortgage finance in India will continue to remain a structural growth opportunity and housing finance corporations (HFCs) are well placed, especially with the wholesale funding environment remaining favourable. Competition will likely remain intense, but we do not see irrational pricing as the profitability of PSUs is much weaker than in the previous cycle (FY09-10). We are positive on HFCs and upgrade LICHF to Buy as it is the biggest beneficiary of lower wholesale rates. We also initiate coverage with Buy on Indiabulls Housing and Dewan Housing as rating upgrades are driving a structural improvement in their funding profile which should make these HFCs more competent in the prime mortgage market.
Key themes and analysis in this Anchor Report include:
Why HFCs have gained market share and why we believe that pricing in mortgages will not be as irrational as in the last cycle.
A detailed update on the LAP (loan against property) market.
Detailed initiation on Indiabulls Housing and Dewan Housing, and updates on LIC Housing and HDFC Limited.
17 June 2015
Research analysts
India Financials
Adarsh Parasrampuria - NFASL [email protected] +91 22 4037 4034
Amit Nanavati - NFASL [email protected] +91 22 4037 4361

Anchor themes
Mortgages remain a structural story from a growth perspective. Cyclically the domestic rate environment remains favourable for HFCs and banks' ability to compete on pricing is lower than in the previous cycle (FY09-10).
Nomura vs consensus
Our FY16/17F PAT estimates are largely in line with consensus.
Research analysts
India Financials
Adarsh Parasrampuria - NFASL [email protected] +91 22 4037 4034
Amit Nanavati - NFASL [email protected] +91 22 4037 4361
India financials
EQUITY: FINANCIALS
Mortgage finance: Structural story continues
HFCs well placed – expect strong returns with low asset quality risks
Action: LICHF up to Buy; initiate on Indiabulls, Dewan Housing at Buy
Structural drivers remain in place for mortgage growth in India with penetration
still more than 50% lower than peers and cyclically we expect the funding
environment to remain favourable. We upgrade LIC Housing to Buy (TP:
INR500) as we believe it is the sector’s biggest beneficiary of lower wholesale
cost of funds. We initiate on Indiabulls (IHFL) and Dewan with Buy ratings as
their consistent performance have led to continuous credit rating upgrades and
the funding profile improvement should drive up their competitiveness in prime
mortgages. Among larger HFCs, our top pick is LICHF and among mid-sized
HFCs, we are more convinced on IHFL.
Structural story continues: HFCs appear well placed
With just ~8% mortgage to GDP penetration and rising income levels, we
expect 18% CAGR mortgage growth over the next five years. While
competition has remained intense, large HFCs have gained share due to their
competitive cost of funds and lower opex structure vs banks and smaller HFCs
have built niches in funding low cost housing (ticket size of less than
INR1.5mn). HDFC/LICHF should continue to remain as the dominant players
and we see smaller HFCs like IHFL graduate to become prominent in prime
mortgages as their cost of funds become more competitive.
Cyclically funding environment favourable
We expect wholesale funding environment to remain favourable. While banks,
especially PSUs, are re-orienting their focus to retail/mortgages, their ability to
cut mortgage/base rates is lower than FY08-10 given their weak profitability
(ROAs 0.6-0.7% lower than FY09).For smaller HFCs like IHFL/Dewan, credit
ratings upgrades should result in significant improvement in their funding
profile and acceptance of their bonds. This should help offset any yield
pressure on LAP and drive up their competitiveness in prime mortgages.
Valuations and preference among HFCs
1) Among large HFCs, LICHF’s valuations seem reasonable at 1.9x FY17F
book (BVPS: INR212) as improving margins should drive up ROEs to 18-19%
in FY17F. 2) HDFC's valuation at 3.6x FY17F book (BVPS: INR195) is above
mean and hence we maintain Neutral. 3) IHFL’s re-rating is likely to continue
as ROEs at ~27-28% are best in class, improving rating profile should offset
any yield pressure and recent management steps to address weak perception
of corporate governance is all positive. 4) Dewan's focus on low-cost housing
is to its advantage and lower profitability vs peers is reflected in its valuation
(1x book). Dewan’s use of cashflows have been inefficient in the past and
improvement there should drive a re-rating. Fig. 1: Stocks for action
Source: Bloomberg, Nomura estimates. Note: * initiating coverage; ↑ upgrading; share prices are as of 15 June 2015 close.
Mcap Avg To Target Current Upside/
Company Code Rating USDbn USDmn price price downside
Indiabulls Housing IHFL IN Buy * 3.1 11.4 800 556 43.9%
Dew an Housing DEWH IN Buy * 0.9 5.5 525 389 35.0%
LIC Housing LICHF IN Buy ↑ 3.1 17.3 500 395 26.6%
HDFC HDFC IN Neutral 29.9 60.6 1,325 1,215 9.1%
Global Markets Research
17 June 2015
See Appendix A-1 for analyst certification, important disclosures and the status of non-US analysts.
Nomura | India financials 17 June 2015
2
Contents
Investment thesis: HFCs well placed ............................................................... 3
Investment thesis in charts .............................................................................. 5
Mortgage opportunity remains large; HFCs continue to gain share ................ 6
Segmenting the housing market: Low-cost housing financing and low
financing cost the key differentiators ............................................................... 9
Cyclically funding environment remains favourable ...................................... 13
Weaker profitability of banks to restrict ability for a sharp cut in base and
mortgage rates similar to the past cycle ........................................................ 14
LAP: substantial growth opportunity but yields likely to come off further ...... 15
Positive on HFCs; upgrade LICHF to Buy; initiate on Indiabulls and Dewan
at Buy ............................................................................................................. 19
Risks to our calls ............................................................................................ 21
Indiabulls Housing Finance................................................................... 23
Dewan Housing Finance ...................................................................... 41
LIC Housing Finance ............................................................................ 61
HDFC ................................................................................................... 66
Appendix A-1 ........................................................................................71
Nomura | India financials 17 June 2015
3
Investment thesis: HFCs well placed
HFCs (housing finance companies) should continue to remain strong value creators:
HFCs have been strong value creators in the past decade with 20-24% CAGR return
driven by secular growth opportunities in the mortgage space. Given India’s low
mortgage penetration levels (9% vs 15-20% for other markets); we believe the secular
trend will continue. Mortgage funding is largely pricing sensitive thus only HFCs with the
lowest cost of funds (eg, HDFC and LICHF) have consistently gained market share,
despite competition from banks, as their low operating cost structure mitigates their cost
of funds disadvantage.
Mid-sized HFCs now moving towards the next level driven by their improved
funding mix: Apart from HDFC and LICHF, a few HFCs have been operating in niche
segments and have built successful business models around those niches. We believe
the biggest opportunity for these mid-sized HFCs is to move into prime mortgages as this
is still the largest part of India’s mortgage market. They have been able to move into this
segment because their consistent financial performance has led to rating upgrades over
the past two years. IHLF and DHFL fall into this category with IHFL's credit rating (AA+
from CRISIL) now being just one notch below HDFC’s and LICHF’s.
Rate cycle remains favourable; Ability of banks to cut rates low: Cyclically we
believe the funding environment will remain favourable for HFCs as system credit growth
remains weak. Although banks are shifting their focus to mortgages and hence
competition should intensify, we do not expect this to lead to irrational pricing given PSU
banks’ current weak profitability. LAP, which contributes more than 20% of loan book for
IHFL and DHFL is seeing yield compression which could significantly impact their
profitability. However, as explained above, their rating upgrades should bring down their
cost of funds and help offset yield pressure in the LAP book.
Valuations reasonable for HFCs: Given reasonable valuations, we upgrade LICHF to
Buy from Neutral and maintain HDFC as Neutral. Among mid-sized HFCs, we initiate
coverage on IHFL and DHFL with Buy ratings. IHFL has best-in-class ROEs (27-28%)
and has tried to address investors’ concerns over its corporate governance and this
should drive further re-rating. DHFL operates in a good niche (low-cost housing) but may
need to demonstrate better use of cash flows to see a meaningful re-rating.
Valuations and preference among HFCs: 1) Among large HFCs, valuation for LICHF
seem reasonable at 1.8x FY17F book, as we forecast improving margins to drive up
ROEs to 19% in FY17F. 2) HDFC's valuation at 3.6x FY17F book is above the mean and
hence we maintain our Neutral rating. 3) We believe IHFL’s re-rating is likely to continue
ROEs at ~27-28% as best in class and its improving ratings should lead it to being more
competitive in prime mortgages. Recent management steps to address weak perception
of corporate governance is positive, in our view. 4) DHFL’s focus on low-cost housing is
to its advantage and lower profitability vs peers is reflected in its valuations (0.9x 2017F
book).
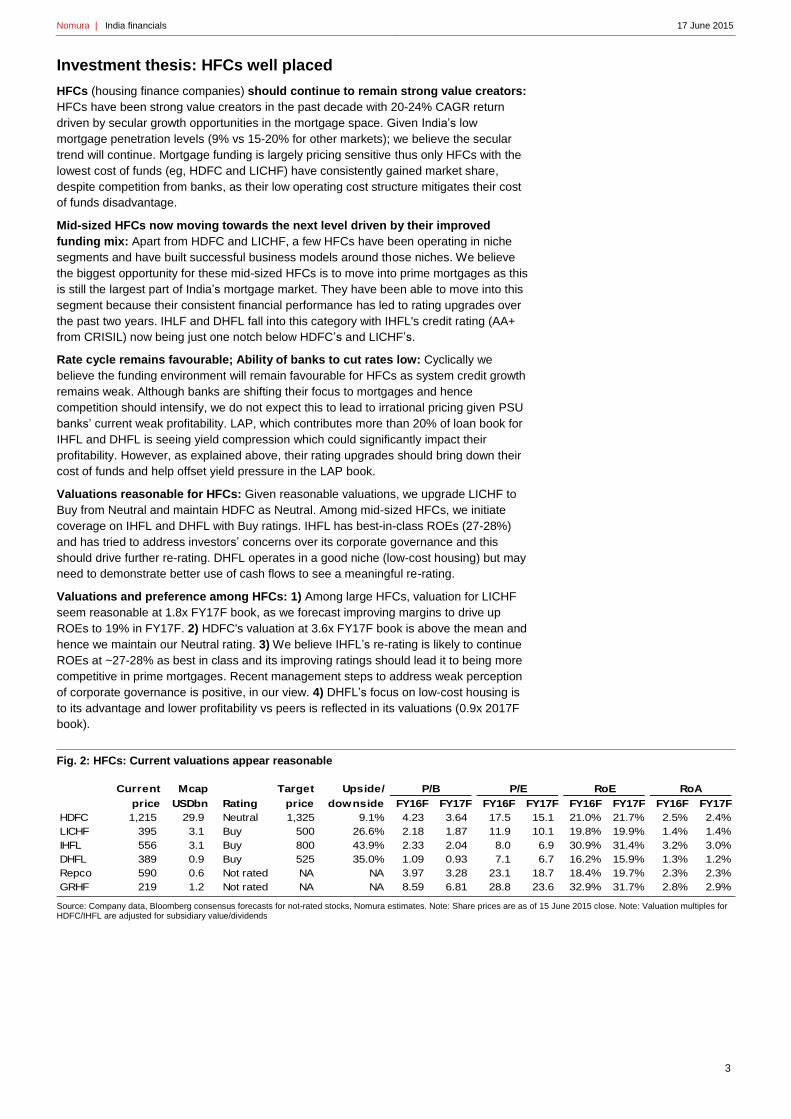
Fig. 2: HFCs: Current valuations appear reasonable
Source: Company data, Bloomberg consensus forecasts for not-rated stocks, Nomura estimates. Note: Share prices are as of 15 June 2015 close. Note: Valuation multiples for HDFC/IHFL are adjusted for subsidiary value/dividends
Current Mcap Target Upside/
price USDbn Rating price downside FY16F FY17F FY16F FY17F FY16F FY17F FY16F FY17F
HDFC 1,215 29.9 Neutral 1,325 9.1% 4.23 3.64 17.5 15.1 21.0% 21.7% 2.5% 2.4%
LICHF 395 3.1 Buy 500 26.6% 2.18 1.87 11.9 10.1 19.8% 19.9% 1.4% 1.4%
IHFL 556 3.1 Buy 800 43.9% 2.33 2.04 8.0 6.9 30.9% 31.4% 3.2% 3.0%
DHFL 389 0.9 Buy 525 35.0% 1.09 0.93 7.1 6.7 16.2% 15.9% 1.3% 1.2%
Repco 590 0.6 Not rated NA NA 3.97 3.28 23.1 18.7 18.4% 19.7% 2.3% 2.3%
GRHF 219 1.2 Not rated NA NA 8.59 6.81 28.8 23.6 32.9% 31.7% 2.8% 2.9%
P/B P/E RoE RoA
Nomura | India financials 17 June 2015
4
Stock-wise view and recommendation:
• HDFC Limited (Neutral; TP: INR1,325): Over the past decade, HDFC’s market share
has gradually increased to 14% from 12%. We think the stock offers good structural
exposure to increasing mortgage penetration. While wholesale funding should also
benefit HDFC, its margins have remained in a tight band through the cycle. Thus we
NIMs seem unlikely to improve despite the cost of funds benefit. Valuation at 3.6x
FY17F book is above mean levels. Hence, we maintain our Neutral and TP of
INR1,325.
• LIC Housing Finance (Upgrade to Buy; TP: INR500): LICHF has also increased its
market share to ~9.6% currently from 7% in FY10. LICHF’s NIMs are very sensitive to
the interest rate cycle and it remains a key beneficiary of lower wholesale funding rates.
Thus, LICHF’s spreads should improve by ~15bps over the next two years, which could
be higher if it is able to increase the proportion of its LAP/builder book. While
historically, LICHF’s management of ALMs and margins through cycles has been
disappointing, we see lower risk in this cycle as a large part of its asset book is fixed
rate in a falling rate environment,. Recent correction to <INR400/share has brought its
valuation to a reasonable level at 1.8x FY17F book, in our view. We thus upgrade to
Buy but maintain our TP of INR500.
• Indiabulls Housing Finance: (Initiate at Buy with TP of INR800): IHFL has been the
fastest-growing HFC over the past five years with a strong presence in LAP (more than
10% market share) and builder financing; and it is now gaining share in mortgages
(~3% share). ROEs of 30% are best among peers due to its higher share of
LAP/corporate book. We expect this to sustain despite increasing traditional mortgage
share; due to a significant improvement in funding profile/mix and increasing leverage.
Two key re-rating catalysts: 1) Continuous improvement in funding profile as a result
of credit ratings upgrades should make IHFL more competitive in mortgages and 2)
various steps taken by management to improve perception relating to corporate
governance. Current valuation at 2x FY17F book is cheap, in our view, for sector-best
ROEs of ~28% and 23-25% growth. Our TP of INR800 implies ~3x FY17F book.
• Dewing housing: (Initiate at Buy rating with TP of INR525): DHFL has been one of
the fastest-growing HFC over the past decade. It has focused on the lower/middle
income (LMI) segment where penetration/competition remains fairly low. While ROEs
remain comparatively low at 16% due to the inefficient use of cash, higher
leverage/opex, we think valuations more than discount this and recent rating upgrades
(AAA by CARE), improving bond mix and management’s commitment to improve
efficiencies going forward should support valuations. DHFL remains the cheapest
Indian mortgage provider currently trading at 0.9x FY17F book vs peers trading at 2-3x
FY17F book. Better delivery in terms of cash utilisation and operating efficiency should
help the stock re-rate going forward. Our TP of INR525 implies 1.25x FY17F book.

Nomura | India financials 17 June 2015
5
Investment thesis in charts
Fig. 3: Mortgage penetration still low: should continue to improve
Source: HDFC, Nomura research
Fig. 4: HFCs have gradually gained share: trends should stabilise
Source: Company data, NHB, RBI, Nomura estimates
Fig. 5: Funding mix improving for HFCs: Reliance on bank funding coming down
Source: Company data, Nomura estimates
Fig. 6: Ratings upgrades a key catalyst for Indiabulls and Dewan Housing
Source: Company data, Bloomberg, Nomura research
Fig. 7: Cyclically we expect liquidity to remain comfortable and hence bond funding should remain cheaper vs bank funding
Source: Bloomberg, Nomura research
Fig. 8: Valuations reasonable relative to ROAs
Source: Company data, Nomura estimates
9%
18% 20%
32%36%
40%45%
56%62%
81%
94%
0%
10%
20%
30%
40%
50%
60%
70%
80%
90%
100%
India
Chin
a
Thaila
nd
Mala
ysia
Ko
rea
Taiw
an
HK
Sin
ag
apore
US
A
UK
Denm
ark
Mortgages as a % of GDP
29.9%
30.8%
33.3%
33.7%
35.6% 38.6%
39.1%
39.1%
39.1%
39.1%
39.4%
39.6%
39.9%
25%
27%
29%
31%
33%
35%
37%
39%
41%
43%
45%
FY
08
FY
09
FY
10
FY
11
FY
12
FY
13
FY
14
FY
15
FY
16F
FY
17F
FY
18F
FY
19F
FY
20F
HFC market share
0%
10%
20%
30%
40%
50%
60%
70%
80%
90%
HD
FC
HD
FC
LIC
HF
LIC
HF
IHF
L
IHF
L
DH
FL
DH
FL
GR
HF
GR
HF
Bond Bank Bond Bank Bond Bank Bond Bank Bond Bank
FY12 FY15 FY18F FY11 FY12 FY13 FY14 FY15
Crisil AAA AAA AAA AAA AAA
CARE AAA AAA AAA AAA AAA
ICRA AAA AAA AAA AAA AAA
Crisil AAA AAA AAA AAA AAA
CARE AAA AAA AAA AAA AAA
Crisil AA AA AA AA AA+
CARE AA+ AA+ AA+ AA+ AAA
ICRA AA AA AA AA AA+
Dewan CARE AA+ AA+ AA+ AA+ AAA
Long term ratings
HDFC
LICHF
Indiabulls
8.0
8.2
8.4
8.6
8.8
9.0
9.2
9.4
9.6
9.8
10.0
Ma
r-11
Jun
-11
Se
p-1
1
Dec-1
1
Ma
r-12
Jun
-12
Se
p-1
2
Dec-1
2
Ma
r-13
Jun
-13
Se
p-1
3
Dec-1
3
Ma
r-14
Jun
-14
Se
p-1
4
Dec-1
4
Ma
r-15
AAA 5 yr corp bond rate %
HDFC
LICHF
IHFL
DHFL
Repco
1.0%
1.5%
2.0%
2.5%
3.0%
3.5%
0.0x 1.0x 2.0x 3.0x 4.0x
RO
A
P/B
Nomura | India financials 17 June 2015
6
Mortgage opportunity remains large; HFCs continue to gain share
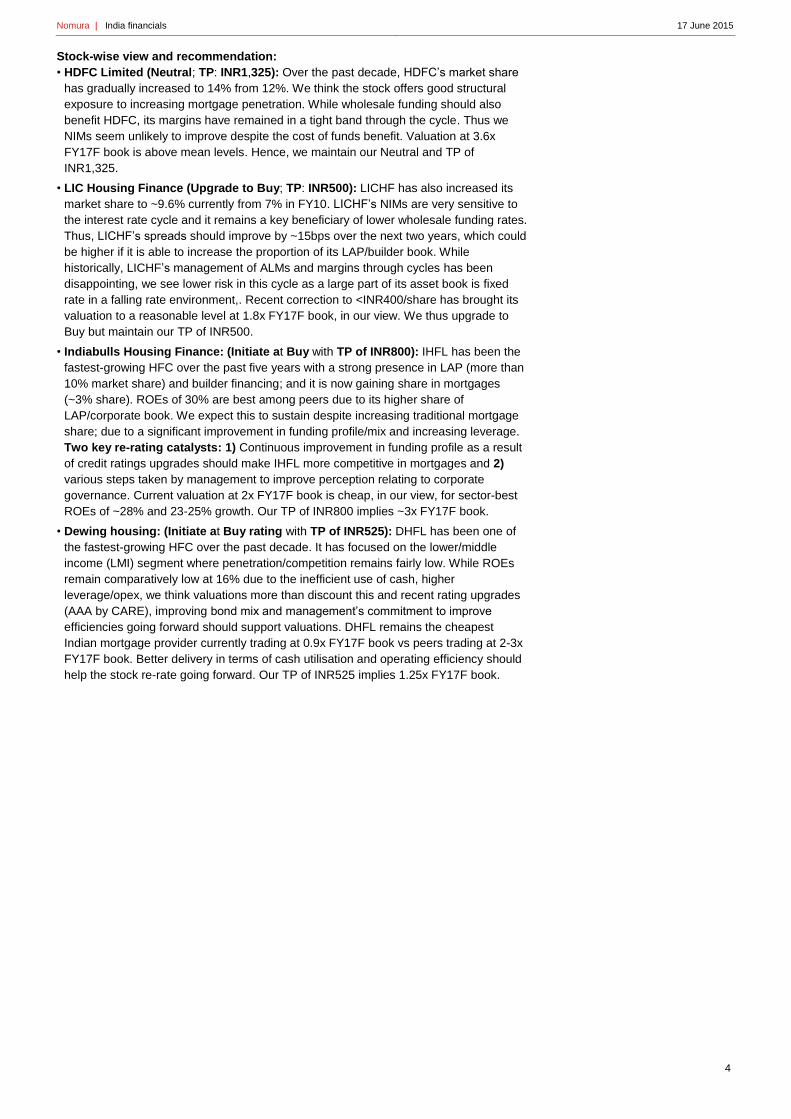
Domestic mortgage market to more than double in the next five years:
India’s mortgage penetration at 8% of GDP remains lower than most developing markets
at 15-20% penetration despite ~20% CAGR growth in the past decade. Penetration
levels have inched up ~25bps annually in the past 10 years leading to penetration
improving from 5-6% in FY04-05 to 8-9% currently. With improving income levels and the
penetration rate still less 50% of other developing markets, we see mortgage penetration
continuing to increase at a similar pace as in the past decade implying ~17-18% CAGR
over the next five years with the total mortgage market growing from INR10trn currently
to INR23trn by FY20F.
Fig. 9: Mortgage penetration levels still low in India
Source: HDFC, Nomura research
Fig. 10: Penetration continues to inch up at a steady pace barring the spike and normalisation around GFC
Source: RBI, Nomura estimates
Fig. 11: We expect ~17-18% CAGR opportunity: mortgage market to increase from +INR10trn to ~INR23trn by FY20F
Source: RBI, Nomura estimates
9%
18% 20%
32%36%
40%45%
56%62%
81%
94%
0%
10%
20%
30%
40%
50%
60%
70%
80%
90%
100%
India
Chin
a
Thaila
nd
Mala
ysia
Ko
rea
Taiw
an
HK
Sin
ag
apore
US
A
UK
Denm
ark
Mortgages as a % of GDP
5.2%
6.3%
7.3%7.5%
7.3%7.3%
7.1%7.1%6.9%
7.4%7.8%
8.0%
8.2%8.5%
8.9%9.2%
9.5%
5.0%
5.5%
6.0%
6.5%
7.0%
7.5%
8.0%
8.5%
9.0%
9.5%
10.0%
FY
04
FY
05
FY
06
FY
07
FY
08
FY
09
FY
10
FY
11
FY
12
FY
13
FY
14
FY
15
FY
16F
FY
17F
FY
18F
FY
19F
FY
20F
Mortgages as a % of GDP
INRbn
Bank
Mortgage
book
HFC
mortgage
book
Total
mortgage
book
HFC
market
share
Mortgage
growth y/y
Real
GDP
growth
CPI
Inflation
Nominal
GDP
Mortgage
penetration
FY04 894 591 1,485 39.8% 8.0% 3.9% 28,379 5.23%
FY05 1,347 705 2,052 34.4% 38.2% 7.1% 3.1% 32,422 6.33%
FY06 1,852 862 2,714 31.7% 32.2% 9.5% 4.1% 36,934 7.35%
FY07 2,310 902 3,212 28.1% 18.4% 9.6% 7.3% 42,947 7.48%
FY08 2,557 1,092 3,649 29.9% 13.6% 9.3% 6.9% 49,871 7.32%
FY09 2,848 1,268 4,116 30.8% 12.8% 6.7% 9.7% 56,301 7.31%
FY10 3,063 1,532 4,595 33.3% 11.6% 8.6% 13.2% 64,778 7.09%
FY11 3,674 1,864 5,538 33.7% 20.5% 8.9% 10.2% 77,841 7.11%
FY12 4,027 2,222 6,249 35.6% 12.8% 6.7% 8.3% 90,097 6.94%
FY13 4,622 2,904 7,526 38.6% 20.4% 4.5% 10.2% 101,133 7.44%
FY14 5,408 3,479 8,888 39.1% 18.1% 4.7% 9.5% 113,551 7.83%
FY15 6,267 4,032 10,300 39.1% 15.9% 6.0% 7.0% 128,312 8.03%
FY16F 7,291 4,690 11,981 39.1% 16.3% 7.5% 6.0% 145,634 8.23%
FY17F 8,577 5,518 14,095 39.1% 17.6% 8.0% 5.5% 165,295 8.53%
FY18F 10,093 6,561 16,654 39.4% 18.2% 8.0% 5.5% 187,610 8.88%
FY19F 11,793 7,748 19,541 39.6% 17.3% 8.0% 5.5% 212,937 9.18%
FY20F 13,766 9,138 22,904 39.9% 17.2% 8.0% 5.5% 241,684 9.48%
Growth FY04-14 19.7% 19.4% 19.6%
Growth FY14-20F 16.8% 17.5% 17.1%

Nomura | India financials 17 June 2015
7
HFCs gained share over the past five years – Should maintain share going forward
Mortgages have remained competitive over the past five to ten years, with ICICI being
the most aggressive pre-2008, SBI/LICHF being aggressive between 2009-12 and now
all banks/HFCs competing aggressively for the past two years with corporate growth
slowing. Despite their relative funding cost disadvantage to banks, HFCs have
maintained their market share relative to banks over the past 10 years and gained
market share in the past five years due to: 1) increasing reliance on lower cost market
borrowing vs bank funding; 2) lower opex structure (opex to assets of 0.4-0.5% of loans
vs 1.5-2.0% for banks) and 3) smaller HFCs concentrating and gaining share in the low-
cost mortgage market (<INR2mn loans).
Fig. 12: Banks’ market share declining over the past five years even excluding ICICI
Source: Company data, RBI, Nomura estimates
Fig. 13: HFCs’ share has inched up marginally in past decade
Source: Company data, NHB, Nomura research
Fig. 14: Market shares of most HFCs have been increasing in past 5 years; Axis Bank has gained the most among banks
Source: Company data, NHB, RBI, Nomura research
60.2%
65.6%68.3%
71.9%
70.1%
69.2%66.7%
66.3%
64.4%
61.4%
60.9%
60.9%
48.9%
51.8%
51.5%
52.2%
51.9%
55.3%
56.5%
58.1%
56.7%
55.1%
54.3%
53.8%
45%
50%
55%
60%
65%
70%
75%
FY
04
FY
05
FY
06
FY
07
FY
08
FY
09
FY
10
FY
11
FY
12
FY
13
FY
14
FY
15
Bank share Bank share ex ICICI
34.4%
31.7%
28.1%
29.9%
30.8%
33.3%
33.7%
35.6%38.6%
39.1%
39.1%
25%
27%
29%
31%
33%
35%
37%
39%
41%
FY
05
FY
06
FY
07
FY
08
FY
09
FY
10
FY
11
FY
12
FY
13
FY
14
FY
15
Market share FY08 FY12 FY13 FY14 FY15
Incremental
market share -
FY08-12
Incremental
market share -
FY12-15
CAGR -
FY09-12
CAGR -
FY12-15
Private Banks 70.1% 64.4% 61.4% 60.9% 60.9% 56.5% 55.4% 12% 16%
ICICI Bank 18.2% 7.7% 6.3% 6.5% 7.0% -6.9% 6.0% -8% 15%
Axis Bank 2.1% 4.2% 4.7% 5.0% 5.2% 7.1% 6.7% 36% 27%
HDFC Bank 2.3% 2.2% 2.2% 2.3% 5.5% 2.4% 19%
Kotak Bank 0.7% 1.3% 1.4% 1.4% 1.4% 2.2% 1.5% 34% 21%
PSUs
SBI 12.4% 16.4% 15.9% 15.8% 15.4% 22.2% 13.7% 23% 16%
PNB 2.2% 2.2% 1.9% 1.9% 2.1% 2.2% 1.9% 14% 16%
BOB 2.0% 2.3% 2.1% 2.2% 2.2% 2.6% 2.0% 18% 17%
BOI 1.7% 1.3% 1.4% 1.5% 1.6% 0.8% 2.0% 7% 26%
Private banks ex- ICICI 51.9% 54.4% 52.9% 52.2% 51.5% 63.5% 49.4% 17% 16%
HFCs 29.9% 35.6% 38.6% 39.1% 39.1% 43.5% 44.6% 19% 22%
HDFC Ltd 13.3% 13.5% 13.9% 13.9% 13.8% 13.9% 14.2% 15% 19%
LIC Housing 5.7% 9.3% 9.6% 9.6% 9.7% 14.4% 10.3% 29% 20%
Dewan housing 1.0% 2.7% 4.0% 3.9% 4.1% 5.1% 6.3% 46% 36%
Indiabulls Financials 2.0% 2.1% 2.2% 2.5% 4.9% 3.3% 27%
Gruh Finance 0.5% 0.6% 0.7% 0.8% 0.9% 0.8% 1.2% 20% 32%
GIC Housing 0.7% 0.6% 0.6% 0.7% 0.6% 0.6% 0.7% 13% 19%
Can Fin Houses 0.5% 0.4% 0.5% 0.7% 0.8% 0.3% 1.4% 9% 45%
PNB Housing 0.6% 0.9% 1.2% 1.6% 1.5% 3.1% 62%
Repco 0.4% 0.4% 0.4% 0.5% 0.9% 0.6% 27%
Total Mortgage Market 14% 18%

Nomura | India financials 17 June 2015
8
Economics of mortgages: HFC vs bank: Our comparison of profitability of mortgages
provided by a bank or HFC indicates that whilst an HFC has higher costs of funds (200-
250bps higher than for banks) this is mitigated by lower opex costs for HFCs (~125-
150bps lower opex to assets) and no regulatory requirement of SLR/CRR (75bps cost of
SLR/CRR for banks). So on a total ROA/ROE basis, a mortgage as a product is equally
or more profitable for an HFC than for a bank if: 1) the HFC is able to deliver on most
efficient/cheap cost of funds especially when competing in the prime mortgage category
and 2) find niches on the asset side where banks do not dominate the market.
Fig. 15: ROEs of a plain vanilla mortgage similar or better for HFC than bank
Source: Nomura estimates
Small ticket mortgages
Bank HFC HFC-2
Equity 9.0 9.0 9.0
Borrowings/Deposits 91.0 91.0 91.0
Loans 77.3 95.0 95.0
Investments 22.8 5.0 5.0
Effective Loan yields 10.80% 10.80% 12.50%
Cost of Funds 6.75% 9.00% 10.00%
Yield on investments 7.50% 7.50% 7.50%
NIMs 3.61% 2.45% 3.15%
Fees 0.25% 0.25% 0.25%
Revenues 3.86% 2.70% 3.40%
Opex 1.75% 0.35% 0.75%
PPOP 2.11% 2.35% 2.65%
Credit costs 0.20% 0.20% 0.30%
Pre tax ROA 1.91% 2.15% 2.35%
Tax rate 0.57% 0.64% 0.71%
ROA 1.33% 1.50% 1.65%
Leverage 11.1 11.1 11.1
ROE (%) 14.8% 16.7% 18.3%
Plain vanilla mortgages
Banks have an advantage of
lower funding cost, making them more competitive on the cost side; however, this is mitigated
by the lower opex cost of HFCs vs banks which more than offsets the funding cost benefit.

Nomura | India financials 17 June 2015
9
Segmenting the housing market: Low-cost housing financing and low financing cost the key differentiators
India’s mortgage market can be split by the ticket size of the mortgage loan. There are
broadly three categories: 1) >INR2.5mn: generally the metro/urban markets; 2) INR1.0-
2.5mn: generally the catchment areas of urban/metro cities and semi urban towns and 3)
<INR1.0mn ticket size.
• Of these three segments, the >INR2.5mn market (prime mortgage market) is most
competitive as the majority of this market is templated lending largely to salaried
individuals in urban/metro cities and underwriting challenges in this category are fairly
low. We have seen mortgage yield differences with bank base rate down to almost “nil”
in this category and as low funding cost is the key differentiator, most large
banks/HFCs dominate this market. Among our coverage universe of NBFCs/HFCs,
HDFC Limited, LICHF are very active in this market and Indiabulls is now more focused
on this segment given its improvement in cost of funds.
• The INR1-2.5mn loan category is more a product for semi-urban towns and satellite
towns around large cities. Pricing competition is limited to only the upper end of this
segment where larger HFCs like HDFC, LICHF and IHFL operate. HFCs like DHFL are
present more in the lower end of this category where pricing competition is lower and
yields are ~75-100bps higher than the >INR2.5mn category.
• The <INR1.0mn segment: This is the low income housing segment which is the least
serviced and reach/assessment skill requirement is very different vs the template
lending in the >INR2.5mn category. Some niche NBFCs like Gruh Finance (GRHF IN,
NR), Repco Finance (REPCO IN, NR) and to some extent DHFL operate in this
segment.
• So overall for ticket sizes of >INR2.5mn, cost of funding is the key differentiator
and for ticket size of <INR2.5mn, ability to assess credit within certain operating
cost is the key differentiator.
Fig. 16: >60% of o/s mortgages are in the >INR1mn category (FY13)
Source: NHB, Nomura research
Fig. 17: Share of <INR1.0mn mortgages has been coming down in overall mortgage book for banks
Source: NHB, Nomura research
Upto INR1mn,
36.0%
INR1-2.5mn, 38.3%
Above INR2.5mn,
25.8%
27.4%13.7%
6.8% 2.5%
32.6%
28.5%
19.9%14.1%
16.8%
22.9%
20.8%
23.6%
9.4%17.4%
25.6% 37.1%
13.9% 17.5%26.9% 22.7%
0%
20%
40%
60%
80%
100%
120%
FY03 FY05 FY09 FY13
Less than INR0.2mn INR0.2-0.5mn
INR0.5-1mn INR1-2.5mn
Above INR2.5mn

Nomura | India financials 17 June 2015
10
Fig. 18: Segmenting the mortgage market: % of disbursements in low ticket segment has fallen in the past few years
Source: Company data, NHB, Nomura research
Fig. 19: Average ticket sizes of mortgage providers clearly shows the differentiation in product segment targeted (FY14 ticket size)
Source: Company data, Nomura research
Improvement in funding mix and cost of funds: key investment catalyst for IHFL
and DHFL
• The >INR1.5mn category continues to be the largest segment of India’s mortgage
market contributing 64% of loans and 75% of disbursements but it is the most price
competitive as well with mortgages now being written mostly at base rates (vs 75-
125bps higher than base rate about four to five years ago). Thus apart from
distribution, branding and underwriting, cost of funds is the key differentiator.
• Among banks, larger banks with higher CASA ratio have done better in garnering
market share and banks with weaker CASA franchise generally have refrained from
building a large mortgage book given their cost of funds disadvantage. Among HFCs as
well, larger wholesale funded HFCs like HDFC limited and LIC housing who are AAA
rated and have the lowest cost of funds have continued to increase their market share.
• Both IHFL and DHFL have had a funding disadvantage vs HDFC and LICHF in their
cost of funds due both to the mix of funding (IHFL and DHFL are more bank-funded)
and also due to higher costs (as IHFL and DHFL’s credit ratings are lower). As IHFL
>INR2.5mn INR1-2.5mn <INR1.0mn
FY10 % of Loans - 26.9% 25.6% 47.5%
FY13 % of Loans - 22.7% 37.1% 40.2%
FY10 % of disbursements - 35.6% 26.4% 37.9%
FY13 % of disbursements - 33.0% 41.6% 25.4%
Markets/Customers Concentrated in
Urban/Metro cities. Mostly
salaried customers and
HNIs
Semi-urban towns and
sattelite towns around
large cities
Semi-urban and rural
towns
Average yields 10-10.25% 10.75-11.5% 11-14%
Pricing Competition Very competitive market
with rates as low as base
rate
Relatively lower
competition as compared
to prime mortgage market
Very limited competition
as it has been an ignored
segment
Key players All large banks, HFCs -
HDFC and LICHF
PSU Banks, HFCs -
LICHF, HDFC, IHFL and
Dewan
Cooperative Banks,
regional Banks, HFCs -
Gruh, Repco and DHFL to
some extent
Competitive advantage Low cost of funds and
operating effeciency
Better underwritting ability,
competitive cost of funds
Better underwriting ability,
higher operating
effeciency and NHB
funding support
2.32.4
1.9
1.2 1.2
0.8
0.5
0.7
0.9
1.1
1.3
1.5
1.7
1.9
2.1
2.3
2.5
HDFC IHFL LICHF DHFL Repco GRUH
(INRmn)

Nomura | India financials 17 June 2015
11
and DHFL are increasing in size and have built a credible history, rating agencies have
upgraded their ratings, which has led to improved cost of funds. With further credit
ratings upgrades expected and an increase in the share of the wholesale funding mix,
we expect, the cost of funds gap to narrow substantially for IHFL vs HDFC and LICHF
and increase its ability to compete.
• Lower incremental cost of funds is our key investment thesis for both IHFL and
DHFL. While both are large loan providers in the LAP market (as discussed in a later
section), where yields are certainly on the decline, we expect their cost of funding to
improve and that should restrict any material NIM contraction.
Fig. 20: Mortgage rate differentials vs base rate almost negligible, making cost of funds most important differentiator
Source: Company data, Bloomberg, Nomura research
Fig. 21: Larger HFCs have the best cost of funds
Source: Company data, Nomura research
Fig. 22: Larger HFCs have higher reliance of their funding for wholesale market which is cheaper; NHB re-finance is available for rural/low-income urban housing but the pool is very limited
Source: Company data, Nomura research
6
7
8
9
10
11
12
Ju
n-0
9
Dec-0
9
Ju
n-1
0
Dec-1
0
Ju
n-1
1
Dec-1
1
Ju
n-1
2
Dec-1
2
Ju
n-1
3
Dec-1
3
Ju
n-1
4
Dec-1
4
HDFC - Home loan rate
SBI - Base rate
9.2%9.3%
9.5%
10.0%
9.9%
8.0%
8.5%
9.0%
9.5%
10.0%
10.5%
HDFC LICHF IHFL DHFL Repco
Cost of funds - FY15
INRmn Ba nks Bonds De posits NHB
Cost of
funds 9.9%- 11% 8.5%- 9.5% 9%- 10% 7- 8%
HDFC 12.6% 54.8% 31.7% 0.9% 9.15%
LICHF 17.6% 75.7% 2.5% 3.6% 9.31%
Indiabulls 59.8% 40.2% 9.50%
Dewan 58.0% 28.0% 8.0% 3.0% 10.04%
Gruh 33.0% 17.0% 16.0% 34.0% 9.32%
Repco 80.3% 19.7% 9.85%
Curre nt
c ost of
funds Comme nts
Curre nt Funding mix
Bond funding share is the highest and hence HDFC enjoys the lowest
cost of funds. While deposits are currently more expensive than
bonds, stability of rates is higher in deposits given their retail nature.
LICHF has ramped up its bond mix significantly and now is similar to
HDFC. Falling rates and +50% fixed rate asset book makes LICHf a
big beenficary of the rate cycle.
We expect cost of funds to structurally improve for Indiabulls driven by
ratings upgrades and higher market acceptability of their bonds. Its
CRISIL rating is just one notch below HDFC and LICHF.
Cost of funds for Dewan should see a sharp improvement as it builds
up bond book reaping rating upgrade benefits. Leverage too high
and further upgrades contingent upon leverage falling.
Cost of funds has been lower for GRUH due to its higher share of NHB
re- financing which comes at a cheaper rate and also parent level
comfort (HDFC Limited subsidiary) for rating agencies and debt
investors.
Repco has higher reliance on NHB re- financing and that helps it
keep its cost of funds low.

Nomura | India financials 17 June 2015
12
Fig. 23: Rating agencies have upgraded their ratings on Indiabulls and Dewan
Source: Company data, Bloomberg, Nomura research
Fig. 24: Leading to significant reduction in cost of funds and premium paid over HDFC/LICHF’s cost of funds
Source: Bloomberg, Nomura research
Fig. 25: Improvement in funding mix over next two to three years to drive down cost of funds for Indiabulls/Dewan
Source: Company data, Nomura estimates
FY08 FY09 FY10 FY11 FY12 FY13 FY14 FY15
Crisil AAA AAA AAA AAA AAA AAA AAA AAA
CARE AAA AAA AAA AAA AAA AAA AAA AAA
ICRA AAA AAA AAA AAA AAA AAA AAA
Crisil AAA AAA AAA AAA AAA AAA AAA AAA
CARE AAA AAA AAA AAA AAA AAA AAA AAA
Crisil AA- AA- AA AA AA AA AA+
CARE AA+ AA+ AA+ AA+ AAA
ICRA AA AA AA AA AA+
Dewan CARE AA+ AA+ AA+ AA+ AA+ AA+ AA+ AAA
Crisil AA AA+ AA+ AA+ AA+ AA+ AA+ AA+
ICRA AA+ AA+ AA+ AA+ AA+ AA+ AA+
CARE AA- AA-
ICRA A A A+ A+ A+ AA- AA-
Long term ratings
HDFC
LICHF
Indiabulls
Gruh
Repco
1.14
1.04
0.79 0.72
0.00
0.20
0.40
0.60
0.80
1.00
1.20
1.40
DHFL Indiabulls gap
Funding cost gap - FY13 Funding cost gap - 2HFY15
FY13 FY15 FY18F FY13 FY15 FY18F
Bonds 24.0% 31.0% 46.0% 30.1% 37.6% 55.0%
Bank 71.0% 58.0% 43.0% 62.3% 59.8% 40.0%
Deposits 6.0% 8.0% 8.0%
Others 0.0% 3.0% 3.0% 7.7% 2.6% 5.0%
IHFLFunding
mix%
DHFL

Nomura | India financials 17 June 2015
13
Cyclically funding environment remains favourable
HFCs are wholesale-funded especially the larger HFCs and system liquidity and funding
environment are important determinants of profitability over the near- to medium-term.
System liquidity has remained comfortable since March 2014 and with only a gradual
pick up in corporate credit growth expected (11% in FY16 and 13% in FY17F); we expect
system liquidity to remain relatively benign over next 12 months. This should lead to
lower wholesale rates and cost of funds for HFCs. Apart from the structural growth
opportunity, expectations of benign liquidity is also a driver for our positive view
on HFCs in general.
Fig. 26: System liquidity has been comfortable over the past 12 months (chart shows net RBI borrowing of banks)
Source: Bloomberg, Nomura research
Fig. 27: Leading to lower wholesale rates
Source: Bloomberg, Nomura research
Fig. 28: We expect a gradual recovery in corporate credit growth and hence liquidity should remain comfortable
Source: RBI, Nomura estimates
Fig. 29: Incremental share of cheaper bond funding has been on the rise and should continue
Source: Company data, Nomura estimates
-2,400
-1,900
-1,400
-900
-400
100
Nov-1
2
Jan
-13
Mar-
13
May-1
3
Ju
l-1
3
Se
p-1
3
Nov-1
3
Jan
-14
Mar-
14
May-1
4
Jul-1
4
Se
p-1
4
Nov-1
4
Jan
-15
(INRbn) Liquidity deficit
8.0
8.2
8.4
8.6
8.8
9.0
9.2
9.4
9.6
9.8
10.0
Mar-
11
Jun
-11
Se
p-1
1
Dec-1
1
Mar-
12
Jun
-12
Se
p-1
2
Dec-1
2
Mar-
13
Jun
-13
Se
p-1
3
Dec-1
3
Mar-
14
Jun
-14
Se
p-1
4
Dec-1
4
Mar-
15
AAA 5 yr corp bond rate %
18.4% 19.1%
9.5% 9.3%
11.0%
13.4%
0%
5%
10%
15%
20%
25%
FY12 FY13 FY14 FY15 FY16F FY17F
Corporate credit growth (incl. Bonds/NCDs/ECBs)
0%
10%
20%
30%
40%
50%
60%
70%
80%
90%
HD
FC
HD
FC
LIC
HF
LIC
HF
IHF
L
IHF
L
DH
FL
DH
FL
GR
HF
GR
HF
Bond Bank Bond Bank Bond Bank Bond Bank Bond Bank
FY12 FY15 FY18F

Nomura | India financials 17 June 2015
14
Weaker profitability of banks to restrict their ability to cut base/mortgage rates unlike the previous cycle
With slower corporate credit growth most banks have indicated retail/MSME to be their
focus growth area. While this would mean that pricing competition should remain high for
HFCs from banks, we believe the ability of banks to cut the base rate in this cycle is
much lower than in the past cycle (after GFC), given their weak profitability. Banks cut
the base rate by 150-200bps between September 2008 to December 2009 leading to a
significant cut in mortgage rates and 30-40bps impact to their margins over 2QFY09 to
1QFY10. NIMs is already lower by 40-50bps vs FY12 and more importantly, current
ROAs/ROEs is 0.5-0.7%/10-12% lower than FY09/10 with significant pressure on asset
quality. This should likely restrict banks from cutting their base rate and hence mortgage
rates aggressively.
Fig. 30: Most banks concentrating on retail/MSME growth as corporate credit growth has been weak (FY15 growth)
Source: Company data, Nomura research
Fig. 31: After GFC, banks cut base rate and mortgage rates significantly
Source: Company data, Nomura research
Fig. 32: Leading to 70-100bps impact on margins in FY10
Source: Company data, Nomura research
Fig. 33: Current profitability too weak for banks to afford such aggressive cut in rates
Source: Company data, Nomura research
23.7%
17.9%
24.1%
8.7%9.8% 9.3%
2.7%
6.0%
0%
5%
10%
15%
20%
25%
30%
ICICI PNB Union SBI
Retail/SME loan growth Corporate loan growth
6
7
8
9
10
11
12
Jun
-07
Nov-0
7
Ap
r-08
Se
p-0
8
Fe
b-0
9
Jul-0
9
Dec-0
9
Ma
y-1
0
Oct-
10
Ma
r-11
Au
g-1
1
Jan
-12
Jun
-12
Nov-1
2
Ap
r-13
Se
p-1
3
Fe
b-1
4
Jul-1
4
Dec-1
4
Ma
y-1
5
SBI - Base rate
1.8
2.3
2.8
3.3
3.8
4.3
1Q
09
2Q
09
3Q
09
4Q
09
1Q
10
2Q
10
3Q
10
4Q
10
1Q
11
2Q
11
3Q
11
4Q
11
1Q
12
2Q
12
3Q
12
4Q
12
NIM% ROA tree - PSUs FY09 FY15 Change
NIMs/Assets 2.74% 2.72% -0.02%
Fees/Assets 1.12% 0.84% -0.28%
Investment profits/Assets 0.29% 0.14% -0.15%
Net revenues/Assets 4.15% 3.69% -0.45%
Opex/Assets 1.84% 1.86% 0.02%
PPOP/Assets 2.31% 1.84% -0.47%
Provisioning/Assets 0.43% 0.94% 0.52%
Pre Tax ROA/Assets 1.88% 0.89% -0.99%
ROAs 1.15% 0.62% -0.53%
ROEs 20.1% 10.4% -9.7%

Nomura | India financials 17 June 2015
15
LAP: substantial growth opportunity but yields likely to come off further
The loan against property (LAP) market has expanded at ~40% CAGR over the past four
to five years and is now more than USD20bn market. While growth rates are moderating
from over 40%, we believe the opportunity remains fairly large as micro & small
manufacturing enterprise (MSME) segment is highly underpenetrated and LAP works as
a win-win for the financiers and also borrowers. While growth rates should continue to
remain high we are clearly seeing yield pressure in LAP as almost all banks/NBFCs are
growing this book aggressively. While LAP still contributes <5% of loans for the larger
HFCs like HDFC and LICHF and contraction in yields cannot materially alter profitability
for larger HFCs but for mid-sized HFCs including IHFL and Dewan, LAP contributes 20-
25% of their current loan book and lower LAP yields could have a meaningful impact on
profitability of these HFCs. For detailed discussion on LAP see our December 2014
report “LAP 101 – Competitive now, yet still attractive”.
LAP offering and market size:
LAP is the mortgaging of an existing property to secure business or personal loans and
is a substitute for unsecured SME or personal loans. It is similar to a mortgage in terms
of collateral but servicing of the loan is based on business cashflows. The self-employed
account for ~85-90% of total loans and this is largely sourced through DSAs (direct
selling agents ~80%). While ticket sizes and yields are higher than traditional mortgages,
average tenures are lower. LAP has witnessed robust growth over the past four years
with both banks/NBFCs becoming more aggressive in this segment, which has resulted
in 40% CAGR over the past four to five years taking the market size to USD20bn.
Fig. 34: LAP vs. home loans
Source: Company data, Nomura estimates
Fig. 35: LAP market now large enough: size is ~12% of traditional mortgage market
Source: Company data, Nomura research
Market size comparison more appropriate to SME financing – Large opportunity
still remains: As discussed above, the nature of LAP funding is closer to SME financing
rather than traditional mortgages and hence market size and opportunity comparison is
more appropriate vs SME financing. SME financing is under-penetrated in India and IFC
estimates an INR16trn viable debt financing opportunity for SMEs which is growing every
year. Banks SME loan book including medium-size enterprises is INR5trn and as per our
estimates LAP book for banks/NBFCs is INR1.2trn. So formal funding available through
banks and NBFCs is INR6.2rn which is just 40% of latent demand and the financing
opportunity remains large. Currently 80-90% the LAP market is from top 8-10 cities while
the SME dispersion should likely be more into both urban and rural markets and so there
should be opportunity in LAP financing over time to extend the product beyond the top 8-
10 cities. While LAP growth will slow down from +40% CAGR growth seen in last four
Home Loans LAP
Key focus segment Salaried Self employeed
Average ticket size INR2.5-3mn INR5-7mn
Average tenure 6-7 years 3-4 years
LTVs 75-80% (on agreement value) 55-65% (on market value)
Avg. Loan yields 10-10.5% 11.25-12.5%
Risk weights 55-60% 100%
Sourcing mix ~60% sourced from DSA ~80% sourced from DSA
FY10 FY11 FY12 FY13 FY14 FY15 CAGR (FY10-15)
LAP book 245 392 533 736 978 1,228 38.0%
Mortgages Total 4,595 5,538 6,249 7,526 8,888 10,368 17.7%
LAP (% of mortgage book) 5.3% 7.1% 8.5% 9.8% 11.0% 11.8%
LAP (% of incremental mortgage growth) 15.6% 19.8% 15.9% 17.8% 16.8%
Nomura | India financials 17 June 2015
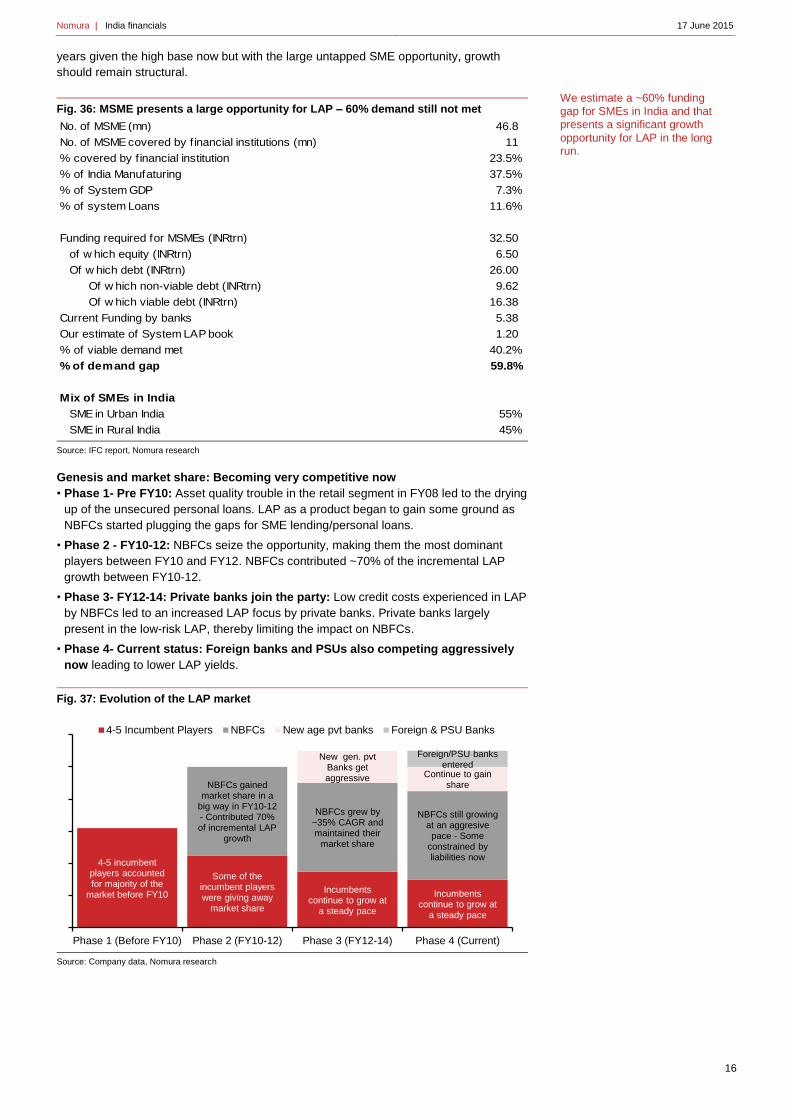
16
years given the high base now but with the large untapped SME opportunity, growth
should remain structural.
Fig. 36: MSME presents a large opportunity for LAP – 60% demand still not met
Source: IFC report, Nomura research
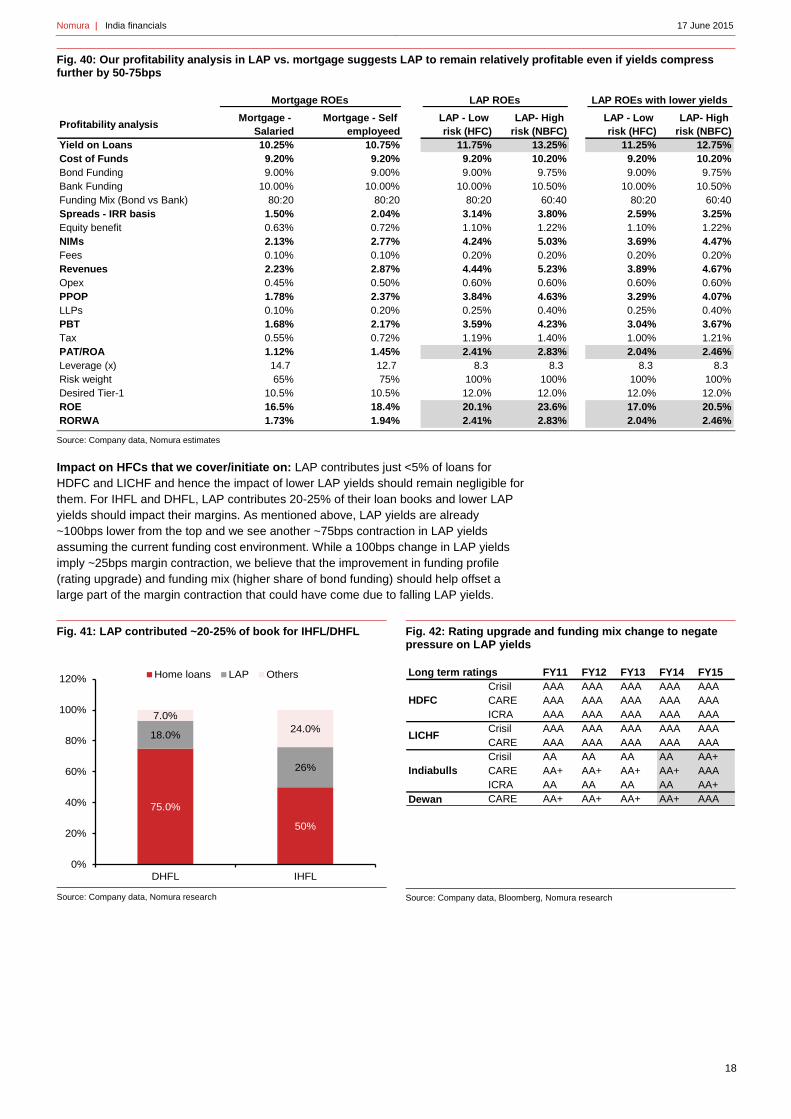
Genesis and market share: Becoming very competitive now
• Phase 1- Pre FY10: Asset quality trouble in the retail segment in FY08 led to the drying
up of the unsecured personal loans. LAP as a product began to gain some ground as
NBFCs started plugging the gaps for SME lending/personal loans.
• Phase 2 - FY10-12: NBFCs seize the opportunity, making them the most dominant
players between FY10 and FY12. NBFCs contributed ~70% of the incremental LAP
growth between FY10-12.
• Phase 3- FY12-14: Private banks join the party: Low credit costs experienced in LAP
by NBFCs led to an increased LAP focus by private banks. Private banks largely
present in the low-risk LAP, thereby limiting the impact on NBFCs.
• Phase 4- Current status: Foreign banks and PSUs also competing aggressively
now leading to lower LAP yields.
Fig. 37: Evolution of the LAP market
Source: Company data, Nomura research
No. of MSME (mn) 46.8
No. of MSME covered by f inancial institutions (mn) 11
% covered by f inancial institution 23.5%
% of India Manufaturing 37.5%
% of System GDP 7.3%
% of system Loans 11.6%
Funding required for MSMEs (INRtrn) 32.50
of w hich equity (INRtrn) 6.50
Of w hich debt (INRtrn) 26.00
Of w hich non-viable debt (INRtrn) 9.62
Of w hich viable debt (INRtrn) 16.38
Current Funding by banks 5.38
Our estimate of System LAP book 1.20
% of viable demand met 40.2%
% of demand gap 59.8%
Mix of SMEs in India
SME in Urban India 55%
SME in Rural India 45%
4-5 incumbent players accounted for majority of the
market before FY10
Some of the incumbent players were giving away
market share
Incumbents continue to grow at
a steady pace
Incumbents continue to grow at
a steady pace
NBFCs gained market share in a
big way in FY10-12 - Contributed 70% of incremental LAP
growth
NBFCs grew by ~35% CAGR and maintained their
market share
NBFCs still growing at an aggresive
pace - Some constrained by liabilities now
New gen. pvt Banks get aggressive Continue to gain
share
Foreign/PSU banks entered
Phase 1 (Before FY10) Phase 2 (FY10-12) Phase 3 (FY12-14) Phase 4 (Current)
4-5 Incumbent Players NBFCs New age pvt banks Foreign & PSU Banks
We estimate a ~60% funding gap for SMEs in India and that presents a significant growth
opportunity for LAP in the long run.

Nomura | India financials 17 June 2015
17
Fig. 38: LAP: Market share dynamics – HFCs/NBFCs gained share pre FY12 and are now maintaining share as most banks have become aggressive in their LAP offering
Source: Company data, Nomura estimates
LAP yields fell in the past 12-18 months; more contraction likely
• LAP commanded better rates in FY10-12 with NBFCs being the only serious LAP
provider but with slow-down in corporate demand, banks have entered this segment
resulting in a yield compression of ~75bps over the past 1-1.5 years.
• Our feedback from most providers in this category indicates 75-100bps compression in
yields due to increased competition and our checks with DSAs (direct selling agents)
indicate that foreign banks are now offering the best rates.
• On a longer-term basis, we think a spread of ~100-225bps over mortgages would be
more sustainable, which would mean another 50-75bps compression in yields over
mortgage rates.
Fig. 39: LAP yields coming off: All banks/NBFCs competing aggressively in LAP
Source: Company data, Nomura estimates
Market share FY10 FY11 FY12 FY13 FY14 FY15
Incremental
market share -
FY10-12
Incremental
market share -
FY12-15
Private Banks 56.5% 48.9% 41.8% 42.4% 42.1% 42.3% 30.2% 42.6%
ICICI 25.0% 23.4% 15.5% 13.7% 12.9% 12.8% 7.9% 10.8%
Axis 3.1% 2.8% 4.1% 4.4% 6.4% 6.2% 4.8% 7.8%
HDFCB 17.6% 12.6% 11.5% 11.6% 8.9% 7.5% 6.7% 4.5%
Kotak 6.0% 5.4% 5.5% 5.6% 5.5% 5.3% 5.0% 5.1%
IIB 0.0% 0.0% 0.8% 1.9% 2.5% 3.7% 1.4% 5.9%
ING Vysya 2.2% 1.7% 1.7% 2.0% 2.4% 2.4% 1.3% 2.9%
Federal 1.7% 1.4% 1.4% 1.4% 1.7% 1.9% 1.2% 2.3%
DCB 0.9% 1.4% 1.4% 1.9% 1.9% 2.5% 1.9% 3.3%
Private banks ex- ICICI/HDFCB 13.9% 12.9% 14.9% 17.2% 20.4% 22.0% 15.6% 27.3%
NBFCs 43.5% 51.1% 58.2% 57.6% 57.9% 57.7% 69.8% 57.4%
Indiabulls 11.6% 13.1% 12.9% 11.7% 10.6% 10.8% 13.9% 9.3%
HDFC 9.3% 8.5% 7.9% 9.5% 10.0% 10.1% 6.8% 11.7%
Religare 5.0% 9.4% 11.0% 7.9% 7.3% 8.2% 15.7% 6.1%
Dewan Housing 1.1% 1.1% 4.7% 5.4% 7.3% 8.2% 7.6% 10.7%
Bajaj Finance 4.5% 5.9% 8.0% 8.0% 7.0% 6.2% 10.7% 4.9%
IIFL 2.6% 4.6% 4.2% 4.0% 4.7% 4.1% 5.5% 4.0%
Reliance 4.2% 4.0% 4.7% 5.5% 4.6% 3.2% 5.0% 2.1%
LICHF 4.3% 3.7% 3.6% 3.6% 3.6% 4.2% 3.0% 4.7%
L&T 0.0% 0.0% 0.0% 0.1% 0.8% 1.1% 0.0% 1.9%
Repco 1.0% 0.8% 0.7% 0.7% 0.9% 0.8% 0.6% 0.9%
Edelweiss 0.0% 0.0% 0.6% 1.2% 1.2% 0.9% 1.0% 1.2%
11-5-12%
11.75-12.5%
12-14% 12.5-13.5%
10.0%
10.5%
11.0%
11.5%
12.0%
12.5%
13.0%
Foreign Banks Pvt Banks NBFCs Banks - SME yields
Interest rates offered by DSAs on LAP loans
Nomura | India financials 17 June 2015
18
Fig. 40: Our profitability analysis in LAP vs. mortgage suggests LAP to remain relatively profitable even if yields compress further by 50-75bps
Source: Company data, Nomura estimates
Impact on HFCs that we cover/initiate on: LAP contributes just <5% of loans for
HDFC and LICHF and hence the impact of lower LAP yields should remain negligible for
them. For IHFL and DHFL, LAP contributes 20-25% of their loan books and lower LAP
yields should impact their margins. As mentioned above, LAP yields are already
~100bps lower from the top and we see another ~75bps contraction in LAP yields
assuming the current funding cost environment. While a 100bps change in LAP yields
imply ~25bps margin contraction, we believe that the improvement in funding profile
(rating upgrade) and funding mix (higher share of bond funding) should help offset a
large part of the margin contraction that could have come due to falling LAP yields.
Fig. 41: LAP contributed ~20-25% of book for IHFL/DHFL
Source: Company data, Nomura research
Fig. 42: Rating upgrade and funding mix change to negate pressure on LAP yields
Source: Company data, Bloomberg, Nomura research
Profitability analysisMortgage -
Salaried
Mortgage - Self
employeed
LAP - Low
risk (HFC)
LAP- High
risk (NBFC)
LAP - Low
risk (HFC)
LAP- High
risk (NBFC)
Yield on Loans 10.25% 10.75% 11.75% 13.25% 11.25% 12.75%
Cost of Funds 9.20% 9.20% 9.20% 10.20% 9.20% 10.20%
Bond Funding 9.00% 9.00% 9.00% 9.75% 9.00% 9.75%
Bank Funding 10.00% 10.00% 10.00% 10.50% 10.00% 10.50%
Funding Mix (Bond vs Bank) 80:20 80:20 80:20 60:40 80:20 60:40
Spreads - IRR basis 1.50% 2.04% 3.14% 3.80% 2.59% 3.25%
Equity benefit 0.63% 0.72% 1.10% 1.22% 1.10% 1.22%
NIMs 2.13% 2.77% 4.24% 5.03% 3.69% 4.47%
Fees 0.10% 0.10% 0.20% 0.20% 0.20% 0.20%
Revenues 2.23% 2.87% 4.44% 5.23% 3.89% 4.67%
Opex 0.45% 0.50% 0.60% 0.60% 0.60% 0.60%
PPOP 1.78% 2.37% 3.84% 4.63% 3.29% 4.07%
LLPs 0.10% 0.20% 0.25% 0.40% 0.25% 0.40%
PBT 1.68% 2.17% 3.59% 4.23% 3.04% 3.67%
Tax 0.55% 0.72% 1.19% 1.40% 1.00% 1.21%
PAT/ROA 1.12% 1.45% 2.41% 2.83% 2.04% 2.46%
Leverage (x) 14.7 12.7 8.3 8.3 8.3 8.3
Risk weight 65% 75% 100% 100% 100% 100%
Desired Tier-1 10.5% 10.5% 12.0% 12.0% 12.0% 12.0%
ROE 16.5% 18.4% 20.1% 23.6% 17.0% 20.5%
RORWA 1.73% 1.94% 2.41% 2.83% 2.04% 2.46%
Mortgage ROEs LAP ROEs LAP ROEs with lower yields
75.0%
50%
18.0%
26%
7.0%
24.0%
0%
20%
40%
60%
80%
100%
120%
DHFL IHFL
Home loans LAP Others FY11 FY12 FY13 FY14 FY15
Crisil AAA AAA AAA AAA AAA
CARE AAA AAA AAA AAA AAA
ICRA AAA AAA AAA AAA AAA
Crisil AAA AAA AAA AAA AAA
CARE AAA AAA AAA AAA AAA
Crisil AA AA AA AA AA+
CARE AA+ AA+ AA+ AA+ AAA
ICRA AA AA AA AA AA+
Dewan CARE AA+ AA+ AA+ AA+ AAA
Long term ratings
HDFC
LICHF
Indiabulls

Nomura | India financials 17 June 2015
19
Positive on HFCs; upgrade LICHF to Buy; initiate on Indiabulls and Dewan at Buy
We are positive on HFCs:
• HFCs with ~40% market share remain well placed to take advantage of the structural
growth opportunity in the mortgage space (18% CAGR in mortgages for the next five
years)
• We expect HFCs to continue to maintain their market share in spite of increasing
competition from banks given their opex advantage.
• Cyclically we expect wholesale funding rate environment to remain favorable and HFCs
benefit most from lower wholesale rates.
• While banks especially PSUs are refocussing on retail loans including mortgages it is
leading to increased competition, we believe the ability of banks to cut their base
rate and hence mortgage rates in this cycle is low given their weak profitability.
Fig. 43: HFC and NBFCs valuations – Valuations appear reasonable for HFCs after the recent consolidation
Source: Company data, Bloomberg consensus forecasts for not-rated stocks, Nomura estimates. Note: Pricing as of 15 June 2015 close.
Stock wise view and recommendation:
• HDFC Limited (Neutral with TP of INR1,325): Over the past decade, HDFC’s market
share has gradually increased to 14% from 12%. We think the stock offers investors
good structural exposure to the increasing mortgage penetration. While wholesale
funding should also benefit HDFC, its margins have remained in a tight band through
the cycle. Hence, NIMs are unlikely to improve despite the cost of funds benefit.
Valuation at 3.6x FY17F book is above mean levels. Thus we maintain our Neutral
rating and TP of INR1,325.
• LIC Housing Finance (Upgrade to Buy; TP maintained at INR500): LICHF has also
increased its market share to ~9.6% currently from 7% in FY10. LICHF’s NIMs are very
sensitive to the interest rate cycle and it remains a key beneficiary of lower wholesale
funding rates. Thus, LICHF’s spreads should improve by ~20bps over the next two
years, which could be higher if LICHF is able to increase the proportion of its
LAP/builder book. While historically, LICHF management of ALMs and margins through
cycles has been disappointing, we believe that with a large part of its asset book being
fixed in a falling rate environment, there is lower risk this cycle. Recent correction from
INR480/share to INR420 has its brought valuation to a reasonable level at 1.75x FY17F
book, in our view. Upgrade to Buy.
• Indiabulls Housing Finance: (Initiate at Buy with TP of INR800): IHFL has been the
fastest-growing HFC over the past five years with a strong presence in LAP (more than
10% market share) and builder financing; and it is now gaining share in mortgages
(~3% share). ROEs of 30% are best among peers due to higher share of
LAP/corporate book. We expect this to sustain despite the increasing traditional
mortgage share; due to a significant improvement in funding profile/mix and increasing
leverage. Two key re-rating catalysts: 1) continuing improvement in funding profile as a
result of ratings upgrades should make IHFL more competitive in mortgages and 2)
various steps taken by management to improve perception relating to corporate
governance. Current valuation at 2x 2017F book is cheap, in our view, for sector-best
ROEs of ~28% and 23-25% growth. Our TP of INR800 implies ~3x FY17F book.
Current Mcap Target Upside/
price USDbn Rating price downside FY16F FY17F FY16F FY17F FY16F FY17F FY16F FY17F
HDFC 1,215 29.9 Neutral 1,325 9.1% 4.23 3.64 17.5 15.1 21.0% 21.7% 2.5% 2.4%
LICHF 395 3.1 Buy 500 26.6% 2.18 1.87 11.9 10.1 19.8% 19.9% 1.4% 1.4%
IHFL 556 3.1 Buy 800 43.9% 2.33 2.04 8.0 6.9 30.9% 31.4% 3.2% 3.0%
DHFL 389 0.9 Buy 525 35.0% 1.09 0.93 7.1 6.7 16.2% 15.9% 1.3% 1.2%
Repco 590 0.6 Not rated NA NA 3.97 3.28 23.1 18.7 18.4% 19.7% 2.3% 2.3%
GRHF 219 1.2 Not rated NA NA 8.59 6.81 28.8 23.6 32.9% 31.7% 2.8% 2.9%
Shriram 821 3.0 BUY 1,100 33.8% 1.76 1.51 11.7 9.2 16.1% 17.6% 2.5% 2.8%
MMFS 236 2.1 Neutral 305 25.7% 2.07 1.80 12.7 10.5 17.3% 18.4% 2.7% 2.8%
P/B P/E RoE RoA

Nomura | India financials 17 June 2015
20
• Dewan Housing Finance: Initiate at Buy with TP of INR525):
DHFL has been one of the fastest-growing HFC over the past decade. It has focused
on the LMI segment where penetration/competition remains fairly low. While ROEs
remain comparatively low at 16% due to the inefficient use of cash, higher
leverage/opex, we think valuations more than discount this and recent rating upgrades
(AAA by CARE), improving bond mix and management’s commitment to improve
efficiencies going forward should support valuations. DHFL remains the cheapest
Indian mortgage provider currently trading at 0.9x FY17F book vs peers trading at 2-3x
FY17F book. Better delivery in terms of cash utilisation and operating efficiency should
help the stock re-rate going forward. Our TP of INR525 implies 1.25x FY17F book.
Fig. 44: HFCs: TPs and implied upsides
Source: : Company data, Nomura estimates. Note: Share prices are as of 15 June 2015 close.
Fig. 45: Current valuations vs ROAs for HFCs/NBFCs
Source: Company data, Bloomberg, Nomura estimates
Fig. 46: Our FY17F ROE expectations for HFCs
Source: Company data, Nomura estimates
Current Mcap Target Upside/
price USDbn Rating price downside FY16F FY17F FY16F FY17F FY16F FY17F FY16F FY17F
HDFC 1,215 29.9 Neutral 1,325 9.1% 4.23 3.64 17.5 15.1 21.0% 21.7% 2.5% 2.4%
LICHF 395 3.1 Buy 500 26.6% 2.18 1.87 11.9 10.1 19.8% 19.9% 1.4% 1.4%
IHFL 556 3.1 Buy 800 43.9% 2.33 2.04 8.0 6.9 30.9% 31.4% 3.2% 3.0%
DHFL 389 0.9 Buy 525 35.0% 1.09 0.93 7.1 6.7 16.2% 15.9% 1.3% 1.2%
P/B P/E RoE RoA
HDFC
LICHF
IHFL
DHFL
Repco
1.0%
1.5%
2.0%
2.5%
3.0%
3.5%
0.0x 1.0x 2.0x 3.0x 4.0x
RO
A
P/B
ROA table - FY17F HDFC LICHF DHFL IHFL
NII 3.3% 2.37% 2.52% 4.69%
Fee 0.6% 0.24% 0.31% 0.64%
Investment 0.0% 0.00% 0.13% 5.33%
Net revenues 3.9% 2.61% 2.95% 0.87%
Opex 0.3% 0.36% 0.85% 4.46%
Provisions 0.1% 0.06% 0.25% 0.34%
Tax 1.1% 0.74% 0.62% 4.11%
Total cost 1.4% 1.16% 1.72% 1.11%
ROA 2.5% 1.44% 1.23% 3.00%
Equity/Assets 12.1% 8.15% 8.91% 8.31%
ROE 21.7% 19.0% 15.8% 31.4%

Nomura | India financials 17 June 2015
21
Risks to our calls
• Unfavourable wholesale funding environment: Apart from the structural growth
opportunity, our positive stance on HFCs is based on a favourable wholesale rate
environment. We believe that corporate loan growth pick-up would be gradual and
hence system liquidity and wholesale funding environment remains comfortable. Spike
in wholesale rates should be a risk to our view on overall HFCs and also for Indiabulls
housing finance.
• Higher-than-expected contraction in LAP yields: LAP yields have fallen by ~100bps
and we expect a further 100bps contraction in LAP yields over FY15-18F. LAP is an
attractive product from a risk adjusted return perspective and competition should likely
increase and given Indiabulls’ high reliance on LAP on its lending book, lower LAP
yields remain a risk. Every 50bps cut in LAP yields would lead to ~1% cut to IHFL’s
ROEs.
• Increased competition from banks: Prime mortgage remains the most competitive
market and any further increase in competition from banks may lead to a rate war
which may impact NIMs in the traditional mortgage segment.
• Lumpy asset quality risk in builder portfolio: IHFL has not had any defaults in its
builder book till now but as the builder book is ~20% of IHFL’s loans, lumpy asset
quality risks remain. SPV lending would imply that ultimate loss given default should be
lower and also IHFL is building a floating provision buffer (INR2bn), but this still does
not rule out chances of lumpy NPAs in builder book.

Nomura | India financials 17 June 2015
22
Fig. 47: HFCs: Comparison on fundamental metrics
Source: Company data, Nomura research
2011 2015 2011 2015 2011 2015 2011 2015
Asset Mix:
Mortgages 57.9% 63.2% 87.5% 92.5% 46.0% 50.0% 92.0% 75.0%
LAP 5.0% 5.0% 4.0% 5.0% 25.0% 26.0% 3.0% 18.0%
Builder + Corporates 37.1% 31.8% 8.5% 2.5% 21.0% 22.0% 3.0% 6.0%
Investments (% of B/S) 8.9% 6.0% 2.6% 2.3% 20.7% 16.9% 9.4% 3.1%
Average Ticket Size (INRmn)
Market Share
Total AUM (INR bn) 1,293 2,533 511 1,084 198 522 141 569
Mortgages 12.7% 13.8% 8.2% 9.7% 1.6% 2.5% 2.3% 4.1%
LAP 8.5% 10.3% 3.7% 4.3% 13.1% 11.1% 1.1% 8.3%
Borrowing Mix:
Banks 32.9% 12.6% 31.1% 17.6% 69.9% 59.8% 75.0% 58.0%
Bonds 44.7% 54.8% 55.0% 72.7% 19.7% 37.6% 13.0% 28.0%
NHB 1.1% 0.9% 3.4% 3.6% 9.0% 3.0%
Deposits 21.3% 31.7% 4.0% 8.0%
Others 10.4% 6.1% 10.3% 2.6% 0.0% 3.0%
Yields/ Spreads
Yield on Loans 10.3% 11.5% 10.1% 10.6% 13.6% 14.0% 12.7% 12.5%
Yield on investment 7.3% 7.4% 3.8% 9.5% 12.1% 12.2%
Asset yields 10.2% 11.3% 9.6% 10.2% 11.6% 13.4% 6.6% 4.6%
Cost of funds 7.1% 9.3% 7.8% 9.3% 7.2% 9.9% 9.3% 10.1%
NIMs 3.2% 3.2% 3.2% 2.3% 7.0% 5.9% 4.0% 2.5%
ROE tree
Net Interest Income/Assets 3.76% 3.39% 3.17% 2.25% 6.90% 5.31% 3.13% 2.48%
Fees/Assets 0.72% 0.64% 0.80% 0.24% 1.47% 0.71% 1.03% 0.36%
Investment profits/Assets 0.00% 0.00% 0.00% 0.00% 8.37% 6.02% 0.68% 0.15%
Net revenues/Assets 4.48% 4.03% 3.97% 2.49% 1.92% 1.00% 4.83% 2.99%
Operating Expense/Assets 0.32% 0.30% 0.48% 0.38% 6.45% 5.02% 1.76% 0.93%
Provisions/Assets 0.06% 0.07% 0.59% 0.01% 1.30% 0.54% 0.15% 0.21%
Taxes/Assets 1.12% 1.12% 0.72% 0.72% 5.15% 4.48% 0.78% 0.63%
Total Costs/Assets 1.50% 1.49% 1.79% 1.10% 1.25% 1.03% 2.68% 1.77%
ROA 2.98% 2.54% 2.19% 1.39% 3.90% 3.44% 2.15% 1.22%
Equity/Assets 7.3 8.0 11.8 13.0 4.3 9.0 11.9 12.4
ROE 21.7% 20.3% 25.8% 18.1% 17.0% 30.8% 25.6% 15.1%
HDFC LICHF Indiabulls Dewan
2.3 1.9 2.4 1.1

Rating Starts at Buy
Target price Starts at INR 800
Closing price 15 June 2015 INR 556
Potential upside +43.8%
Anchor themes
Mortgages remain a structural story from a growth perspective. Cyclically rate environment remains favorable for HFCs and ability of banks to compete on pricing is lower than last cycle (FY09-10).
Nomura vs consensus
Our FY16/17F PAT estimates are ~5% lower than consensus as we factor in higher tax rate and higher compression in LAP yields than the Street.
Research analysts
India Financials
Adarsh Parasrampuria - NFASL [email protected] +91 22 4037 4034
Amit Nanavati - NFASL [email protected] +91 22 4037 4361
Indiabulls Housing Finance
INBF.NS IHFL IN
EQUITY: FINANCIALS
Graduating to the next level
Strong LAP player gaining prominence in prime mortgage business, Buy with 44% implied upside
Action: Initiate at Buy with TP of INR800
Indiabulls Housing Finance (IHFL) has been India’s fastest-growing housing
finance company (HFC) over the past five years, with a strong presence in
loan against property (LAP) (+10% share) and builder financing and is now
gaining prominence in mortgages (~3% share). IHFL’s ROEs of 30% are best-
in-class due to its higher share of LAP/corporate book relative to peers. We
expect this to sustain despite its increasing mortgage share; due to the
significant improvement in its funding profile and increasing leverage.
Continuous funding profile improvement and various steps taken by
management to improve perception relating to corporate governance should
drive further re-rating.
Funding profile improvement: With consistent performance and board
level improvements, rating agencies have upgraded IHFL over the past 1-2
years to AA+ (one notch below HDFC/LICHF). Funding cost has become
very competitive (just 60-70bps higher HDFC/LICHF) and coupled with an
increasing share of bond funding this should make IHFL more completive in
the domestic prime mortgage business and net off yield pressure in the LAP
business.
Addressing perception challenges: IHFL has faced perception
challenges given promoter linkages to a real estate company. Management
has addressed these issues by: 1) recently simplifying promoter ownership;
2) increasing share of independent board members and 3) improving board
quality. Strong management pedigree and high dividend (65% payout) have
historically provided confidence to investors.
Valuation at 2x book looks cheap for 28-30% ROEs, initiate at Buy
We value IHFL at 3.1x FY17F book (BVPS of INR237); adding dividends we
arrive at our TP of INR800. Adjusted ROEs of 28-29% are the sector’s highest
and with growth outpacing the system, we find current valuations attractive at
2x book. Relatively, IHFL is one of the cheaper HFCs at ~8x FY17F P/E (EPS
of INR70).
Year-end 31 Mar FY15
FY16F
FY17F
FY18F
Currency (INR) Actual Old New Old New Old New
PPOP (mn) 27,715 N/A 31,698 N/A 37,463 N/A 44,807
Reported net profit (mn) 18,936 N/A 21,767 N/A 25,156 N/A 29,164
Normalised net profit (mn) 18,936 N/A 21,767 N/A 25,156 N/A 29,164
FD normalised EPS 56.69 N/A 61.22 N/A 69.46 N/A 80.53
FD norm. EPS growth (%) 21.1 N/A 8.0 N/A 13.5 N/A 15.9
FD normalised P/E (x) 9.8 N/A 9.1 N/A 8.0 N/A 6.9
Price/adj. book (x) 3.0 N/A 2.7 N/A 2.3 N/A 2.1
Price/book (x) 3.0 N/A 2.7 N/A 2.3 N/A 2.1
Dividend yield (%) 6.3 N/A 6.2 N/A 6.2 N/A 7.3
ROE (%) 30.7 N/A 30.8 N/A 31.3 N/A 31.8
ROA (%) 3.7 N/A 3.5 N/A 3.3 N/A 3.1
Source: Company data, Nomura estimates
Global Markets Research
17 June 2015
See Appendix A-1 for analyst certification, important disclosures and the status of non-US analysts.

Nomura | Indiabulls Housing Finance 17 June 2015
24
Key data on Indiabulls Housing Finance Relative performance chart
Source: Thomson Reuters, Nomura research
Notes:
Performance (%) 1M 3M 12M
Absolute (INR) -0.3 -1.6 50.6 M cap (USDmn) 3,087.4
Absolute (USD) -1.1 -3.2 40.3 Free float (%) 53.4
Rel to MSCI India 3.8 8.3 47.0 3-mth ADT (USDmn) 11.4
Profit and loss (INRmn) Year-end 31 Mar FY14 FY15 FY16F FY17F FY18F
Interest income 51,865 61,210 77,010 94,277 114,778
Interest expense -32,824 -39,442 -47,630 -56,956 -69,926
Net interest income 19,041 21,768 29,381 37,320 44,852
Net fees and commissions 3,045 3,945 4,605 5,376 6,277
Trading related profits 4,703 7,549 4,054 2,059 2,065
Other operating revenue 0 0 0 0 0
Non-interest income 7,748 11,494 8,659 7,436 8,342
Operating income 26,789 33,262 38,040 44,756 53,194
Depreciation -79 -188 -220 -252 -290
Amortisation 0 0 0 0 0
Operating expenses -1,391 -2,110 -2,321 -2,669 -3,070
Employee share expense -2,637 -3,249 -3,801 -4,371 -5,027
Pre-provision op profit 22,682 27,715 31,698 37,463 44,807
Provisions for bad debt -2,864 -2,990 -2,574 -2,899 -3,623
Other provision charges 0 0 0 0 0
Operating profit 19,818 24,725 29,124 34,564 41,184
Other non-op income 0 0 0 0 0
Associates & JCEs 0 0 0 0 0
Pre-tax profit 19,818 24,725 29,124 34,564 41,184
Income tax -4,133 -5,713 -7,281 -9,332 -11,943
Net profit after tax 15,685 19,012 21,843 25,232 29,240
Minority interests -44 -76 -76 -76 -76
Other items 0 0 0 0 0
Preferred dividends 0 0 0 0 0
Normalised NPAT 15,642 18,936 21,767 25,156 29,164
Extraordinary items
Reported NPAT 15,642 18,936 21,767 25,156 29,164
Dividends
Transfer to reserves 15,642 18,936 21,767 25,156 29,164
Growth (%)
Net interest income 14.4 14.3 35.0 27.0 20.2
Non-interest income 50.6 48.3 -24.7 -14.1 12.2
Non-interest expenses 2.5 51.7 10.0 15.0 15.0
Pre-provision earnings 27.5 22.2 14.4 18.2 19.6
Net profit 23.5 21.1 14.9 15.6 15.9
Normalised EPS 15.9 21.1 8.0 13.5 15.9
Normalised FDEPS 15.9 21.1 8.0 13.5 15.9
Loan growth 15.2 30.6 22.6 25.0 25.0
Interest earning assets 16.1 30.6 22.6 25.0 25.0
Interest bearing liabilities 13.6 33.6 21.6 24.8 24.8
Asset growth 13.5 28.8 20.0 22.9 23.1
Deposit growth na na na na
Source: Company data, Nomura estimates
Balance sheet (INRmn) As at 31 Mar FY14 FY15 FY16F FY17F FY18F
Cash and equivalents 44,190 34,903 40,138 46,159 53,083
Inter-bank lending 0 0 0 0 0
Deposits with central bank 0 0 0 0 0
Total securities 0 0 0 0 0
Other int earning assets 0 0 0 0 0
Gross loans 359,217 468,679 575,118 718,898 898,622
Less provisions -3,417 -3,950 -5,130 -6,412 -8,015
Net loans 355,800 464,729 569,988 712,485 890,607
Long-term investments 29,470 61,638 64,720 72,486 81,184
Fixed assets 469 541 541 541 541
Goodwill 700 686 686 686 686
Other intangible assets 0 0 0 0 0
Other non IEAs 13,554 9,773 10,745 11,815 12,991
Total assets 444,184 572,270 686,818 844,172 1,039,092
Customer deposits 0 0 0 0 0
Bank deposits, CDs,
debentures
355,395 474,870 577,544 720,809 899,836
Other int bearing liabilities 0 0 0 0 0
Total int bearing liabilities 355,395 474,870 577,544 720,809 899,836
Non-int bearing liabilities 31,730 31,062 34,168 37,585 41,344
Total liabilities 387,125 505,932 611,713 758,394 941,179
Minority interest 19 21 21 21 21
Common stock 668 711 724 724 724
Preferred stock 0 0 0 0 0
Retained earnings 56,372 65,606 74,361 85,033 97,168
Reserves for credit losses 0 0 0 0 0
Proposed dividends 0 0 0 0 0
Other equity 0 0 0 0 0
Shareholders' equity 57,040 66,317 75,085 85,757 97,892
Total liabilities and equity 444,184 572,270 686,818 844,172 1,039,092
Non-perf assets 3,417 3,950 5,130 6,412 8,015
Balance sheet ratios (%)
Loans to deposits na na na na na
Equity to assets 12.8 11.6 10.9 10.2 9.4
Asset quality & capital
NPAs/gross loans (%) 1.0 0.8 0.9 0.9 0.9
Bad debt charge/gross
loans (%)
0.80 0.64 0.45 0.40 0.40
Loss reserves/assets (%) 0.77 0.69 0.75 0.76 0.77
Loss reserves/NPAs (%) 100.0 100.0 100.0 100.0 100.0
Tier 1 capital ratio (%) 15.1 15.3 14.3 13.1 11.9
Total capital ratio (%) 19.1 18.4 17.4 16.2 15.1
Per share
Reported EPS (INR) 46.83 56.69 61.22 69.46 80.53
Norm EPS (INR) 46.83 56.69 61.22 69.46 80.53
FD norm EPS (INR) 46.83 56.69 61.22 69.46 80.53
DPS (INR) 28.91 35.00 34.36 34.36 40.37
PPOP PS (INR) 67.90 82.97 89.15 103.45 123.72
BVPS (INR) 170.76 186.52 207.33 236.80 270.31
ABVPS (INR) 170.76 186.52 207.33 236.80 270.31
NTAPS (INR) 168.66 184.59 205.44 234.91 268.42
Valuations and ratios
Reported P/E (x) 11.9 9.8 9.1 8.0 6.9
Normalised P/E (x) 11.9 9.8 9.1 8.0 6.9
FD normalised P/E (x) 11.9 9.8 9.1 8.0 6.9
Dividend yield (%) 5.2 6.3 6.2 6.2 7.3
Price/book (x) 3.3 3.0 2.7 2.3 2.1
Price/adjusted book (x) 3.3 3.0 2.7 2.3 2.1
Net interest margin (%) na 5.31 5.68 5.82 5.60
Yield on assets (%) na 14.92 14.89 14.70 14.32
Cost of int bearing liab (%) na 9.50 9.05 8.77 8.63
Net interest spread (%) na 5.42 5.83 5.93 5.69
Non-interest income (%) 28.9 34.6 22.8 16.6 15.7
Cost to income (%) 15.3 16.7 16.7 16.3 15.8
Effective tax rate (%) 20.9 23.1 25.0 27.0 29.0
Dividend payout (%) 0.0 0.0 0.0 0.0 0.0
ROE (%) na 30.7 30.8 31.3 31.8
ROA (%) na 3.73 3.46 3.29 3.10
Operating ROE (%) na 40.1 41.2 43.0 44.9
Operating ROA (%) na 4.87 4.63 4.52 4.37
Source: Company data, Nomura estimates

Nomura | Indiabulls Housing Finance 17 June 2015
25
Investment thesis: graduating to the next level
• Company background: IHFL is the third-largest HFC and part of the Indiabulls group.
From a largely LAP/corporate book focused NBFC in FY09, IHFL has graduated to
becoming a sizable player in India’s prime mortgage space. IHFL continues to maintain
its share in the LAP business (>10% share in the past five years) and has increased its
market share in traditional mortgages from <1% in FY09 to ~3% in FY15. From a loan
mix perspective, 50% is from traditional mortgages, 26% LAP and the rest is builder
financing.
• Fastest-growing HFC; should continue to gain share: IHFL has been one of the
fastest-growing HFCs with AUM growth of 38% CAGR in the past five years. In FY09-
12, growth was more focused on higher-yielding LAP and corporate book given higher
cost of funds, but as IHFL’s ratings were upgraded due to its consistent performance
and improved cost of funds, it has increased focus on mortgages leading to a gain in
market share. With ratings upgrade in FY15 and its ratings now just one notch below
HDFC/LICHF, we believe IHFL is well poised to deliver faster-than-system growth of
24% CAGR as it has relatively lower funding cost which should help compete in the
INR2.5-5.0mn category. We expect IHFL’s share of traditional mortgages to be up from
50% in FY15 to 56% by FY18F.
• Funding mix change to largely net off pressure in LAP yields: LAP forms 26% of
IHFL's AUMs (FY15) and is seeing significant yield pressure given increasing
competition. While overall yields for IHFL should be impacted due to contraction in LAP
yields, we believe its higher share of bond funding (38% of total funding currently to
55% by FY18F), coupled with cost advantage from better ratings, should net off yield
pressure from the LAP book. While we expect margins to come off by 80-90bps in the
next three years, only 30bps of that is driven by lower loan spreads and the majority of
that is due to higher leverage.
• Adjusted ROEs of 28% best in class; higher leverage to sustain these ROEs:
IHFL’s adjusted ROEs of 28-29% are best-in-class and have been driven by a higher
share of high-yielding LAP/corporate book. While LAP yields are under pressure, we
expect funding cost advantage to partially net off yield pressure on LAP and with
improving leverage we forecast ROEs to sustain at 28-29% going forward.
• Valuations at 2x FY17F book (BVPS of INR237) remains cheap given sector-best
ROEs and higher-than-system growth: Consensus has had perception challenges
with regards to IHFL's corporate governance, given real estate linkages of the promoter
and hence valuations multiples for IHFL have lagged its fundamental performance. But
with consistent performance, rating upgrade, high dividend payout and more important
board level improvements done by the management, we expect re-rating to continue.
We value IHFL at 3x FY17F book and adding dividends we arrive at our TP of INR800.
Adjusted ROEs of 27-28% are the highest in the sector and with growth outpacing the
system; we find current valuations attractive at 2x book. Relatively, IHFL is one of the
cheaper HFCs at <8x FY17F P/E (EPS of INR70).
Fig. 48: HFCs and NBFCs comparative valuations – IHFL valuation still reasonable given higher ROEs and growth potential
Source: Company data, Nomura estimates
Current Mcap Target Upside/
price USDbn Rating price downside FY16F FY17F FY16F FY17F FY16F FY17F FY16F FY17F
HDFC 1,215 29.9 Neutral 1,325 9.1% 4.23 3.64 17.5 15.1 21.0% 21.7% 2.5% 2.4%
LICHF 395 3.1 Buy 500 26.6% 2.18 1.87 11.9 10.1 19.8% 19.9% 1.4% 1.4%
IHFL 556 3.1 Buy 800 43.9% 2.33 2.04 8.0 6.9 30.9% 31.4% 3.2% 3.0%
DEWH 389 0.9 Buy 525 35.0% 1.09 0.93 7.1 6.8 16.1% 15.8% 1.2% 1.2%
Repco 590 0.6 Not rated NA NA 3.97 3.28 23.1 18.7 18.4% 19.7% 2.3% 2.3%
GRHF 219 1.2 Not rated NA NA 8.59 6.81 28.8 23.6 32.9% 31.7% 2.8% 2.9%
Shriram 821 3.0 BUY 1,100 33.8% 1.76 1.51 11.7 9.2 16.1% 17.6% 2.5% 2.8%
MMFS 236 2.1 Neutral 305 25.7% 2.07 1.80 12.7 10.5 17.3% 18.4% 2.7% 2.8%
P/B P/E RoE RoA

Nomura | Indiabulls Housing Finance 17 June 2015
26
Our thesis in charts:
Fig. 49: Fastest-growing HFC
Source: Company data, Nomura research
Fig. 50: Increasing prominence in the prime mortgage space
Source: Company data, RBI, NHB, Nomura research
Fig. 51: Ratings upgrades led to significant improvement in funding profile
Source: Bloomberg, Nomura research
Fig. 52: Funding mix to also improve given increasing acceptance of IHFL’s bonds and both combined to net off
yield pressure in LAP business
Source: Company data, Nomura estimates
Fig. 53: Best in class ROEs: likely to sustain at 27-28% ROEs
Source: Company data, Nomura estimates
Fig. 54: Valuations seem reasonable given sector-best ROAs and higher growth expected
Source: Company data, Bloomberg, Nomura estimates
43 91
127 162
200 261
28
50
69
86
105
136
23
42
58
72
86
115
-
100
200
300
400
500
600
FY10 FY11 FY12 FY13 FY14 FY15
Home loans LAP
Corporate Loans Others
Commercial Vehicles
0.23%0.41%
0.94%
1.65%
2.03%2.15%
2.25%
2.64%
0.0%
0.5%
1.0%
1.5%
2.0%
2.5%
3.0%
FY
08
FY
09
FY
10
FY
11
FY
12
FY
13
FY
14
FY
15
Home loan market share
FY11 FY12 FY13 FY14 FY15
Crisil AAA AAA AAA AAA AAA
CARE AAA AAA AAA AAA AAA
ICRA AAA AAA AAA AAA AAA
Crisil AAA AAA AAA AAA AAA
CARE AAA AAA AAA AAA AAA
Crisil AA AA AA AA AA+
CARE AA+ AA+ AA+ AA+ AAA
ICRA AA AA AA AA AA+
Dewan CARE AA+ AA+ AA+ AA+ AAA
Long term ratings
HDFC
LICHF
Indiabulls
20%
24%
30% 30%
38%
45%
50%
55%
15%
20%
25%
30%
35%
40%
45%
50%
55%
60%
FY
11
FY
12
FY
13
FY
14
FY
15
FY
16F
FY
17F
FY
18F
Bond mix
17.0%
21.3%
25.4%
29.1%
30.8% 30.9% 31.4% 31.8%
15%
17%
19%
21%
23%
25%
27%
29%
31%
33%
FY
11
FY
12
FY
13
FY
14
FY
15
FY
16F
FY
17F
FY
18F
ROE
HDFC
LICHF
IHFL
DHFL
Repco
1.0%
1.5%
2.0%
2.5%
3.0%
3.5%
0.0x 1.0x 2.0x 3.0x 4.0x
RO
A
P/B
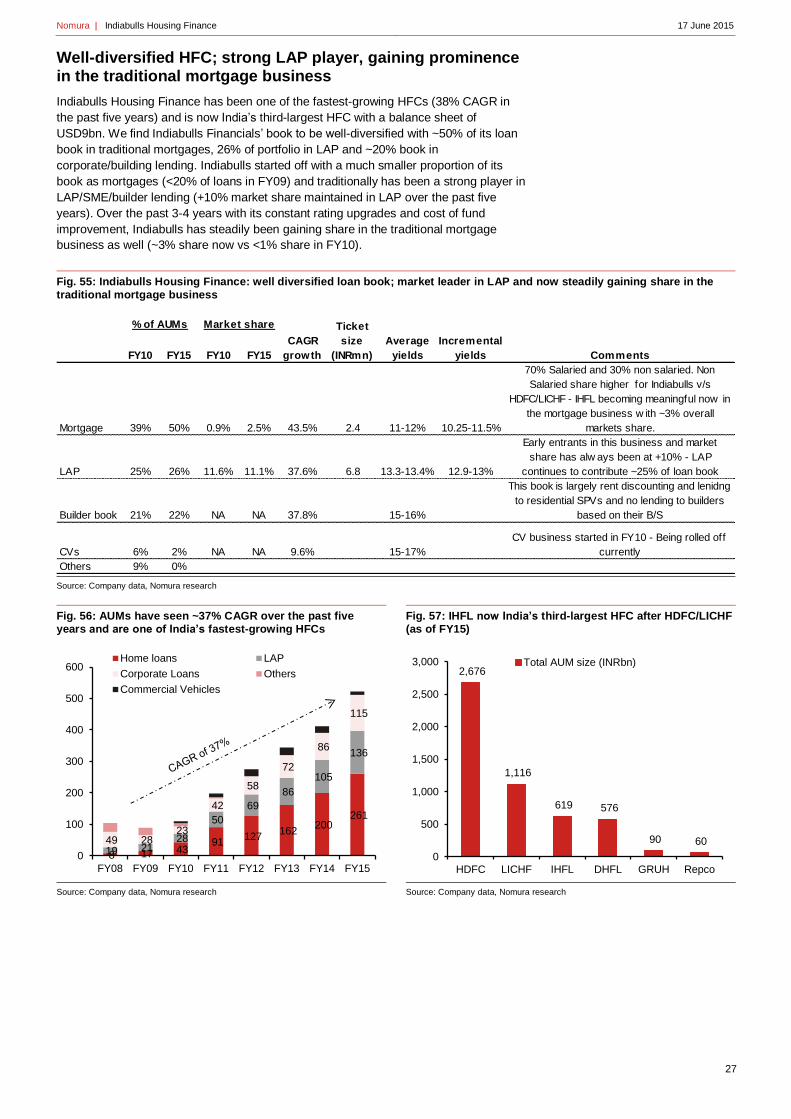
Nomura | Indiabulls Housing Finance 17 June 2015
27
Well-diversified HFC; strong LAP player, gaining prominence in the traditional mortgage business
Indiabulls Housing Finance has been one of the fastest-growing HFCs (38% CAGR in
the past five years) and is now India’s third-largest HFC with a balance sheet of
USD9bn. We find Indiabulls Financials’ book to be well-diversified with ~50% of its loan
book in traditional mortgages, 26% of portfolio in LAP and ~20% book in
corporate/building lending. Indiabulls started off with a much smaller proportion of its
book as mortgages (<20% of loans in FY09) and traditionally has been a strong player in
LAP/SME/builder lending (+10% market share maintained in LAP over the past five
years). Over the past 3-4 years with its constant rating upgrades and cost of fund
improvement, Indiabulls has steadily been gaining share in the traditional mortgage
business as well (~3% share now vs <1% share in FY10).
Fig. 55: Indiabulls Housing Finance: well diversified loan book; market leader in LAP and now steadily gaining share in the
traditional mortgage business
Source: Company data, Nomura research
Fig. 56: AUMs have seen ~37% CAGR over the past five years and are one of India’s fastest-growing HFCs
Source: Company data, Nomura research
Fig. 57: IHFL now India’s third-largest HFC after HDFC/LICHF (as of FY15)
Source: Company data, Nomura research
FY10 FY15 FY10 FY15
Mortgage 39% 50% 0.9% 2.5% 43.5% 2.4 11-12% 10.25-11.5%
70% Salaried and 30% non salaried. Non
Salaried share higher for Indiabulls v/s
HDFC/LICHF - IHFL becoming meaningful now in
the mortgage business w ith ~3% overall
markets share.
LAP 25% 26% 11.6% 11.1% 37.6% 6.8 13.3-13.4% 12.9-13%
Early entrants in this business and market
share has alw ays been at +10% - LAP
continues to contribute ~25% of loan book
Builder book 21% 22% NA NA 37.8% 15-16%
This book is largely rent discounting and lenidng
to residential SPVs and no lending to builders
based on their B/S
CVs 6% 2% NA NA 9.6% 15-17%
CV business started in FY10 - Being rolled off
currently
Others 9% 0%
Comments
% of AUMs Market share
CAGR
growth
Ticket
size
(INRmn)
Average
yields
Incremental
yields
8 17 43 91
127 162
200 261
19 21 28
50
69
86
105
136
49 28 23
42
58
72
86
115
0
100
200
300
400
500
600
FY08 FY09 FY10 FY11 FY12 FY13 FY14 FY15
Home loans LAP
Corporate Loans Others
Commercial Vehicles
2,676
1,116
619 576
90 60
0
500
1,000
1,500
2,000
2,500
3,000
HDFC LICHF IHFL DHFL GRUH Repco
Total AUM size (INRbn)

Nomura | Indiabulls Housing Finance 17 June 2015
28
Traditional mortgages: significant scope to gain share
Traditional mortgages contribute ~50% of IHFL’s loan book; this has increased from
<40% in FY10 and <10% in FY08 as IHFL has become more competitive in its cost of
funds. Mortgage portfolio for IHFL is similar to HDFC Limited with an average ticket size
of INR2.4mn and LTV of ~70%. The small difference is possibly in higher share of self-
employed for IHFL in its traditional mortgage book (~30% are self-employed for IHFL vs
15% of HDFC Limited).
Fig. 58: Traditional mortgages increasing as a % of overall
loan portfolio
Source: Company data, Nomura estimates
Fig. 59: As funding cost difference between IHFL vs
HDFC/LICHF has come off
Source: Bloomberg, Nomura research
Fig. 60: Ticket size is similar to HDFC limit at INR2.4mn
Source: Company data, Nomura research
Fig. 61: Share of self-employed higher vs larger HFC peers
Source: Company data, Nomura research
Mortgage market share still low: scope to gain share and thus outpace system
mortgage growth
IHFL’s mortgage market share rose from <1% in FY09 to ~3% by FY15 and Indiabulls
excluding LAP/mortgages is just the fourth-largest HFC and a distant eighth in the overall
domestic mortgage market. As mentioned previously, low funding cost remains the key
differentiator in the traditional mortgage business and with the gap on cost of funds
closing vs peers we expect India bulls to continue to gain share (with market share
currently <3%). We expect traditional mortgage book for IHFL to increase at ~26-27%
CAGR over FY15-18F vs 18% CAGR expected for the industry. While LAP and
corporate book have been significant contributors, mortgages growth has been higher
than LAP/corporate book growth for IHFL for the past 2-3 years and this trend should
continue.
8%
19%
39%
46% 46% 47% 49% 50%53% 54% 56%
0%
10%
20%
30%
40%
50%
60%
FY
08
FY
09
FY
10
FY
11
FY
12
FY
13
FY
14
FY
15
FY
16F
FY
17F
FY
18F
Home loan mix in AUM
1.14
1.04
0.790.72
0.0
0.2
0.4
0.6
0.8
1.0
1.2
1.4
DHFL Indiabulls gap
Funding cost gap - FY13 Funding cost gap - 2HFY15
2.32.4
1.9
1.2 1.2
0.8
0.5
0.7
0.9
1.1
1.3
1.5
1.7
1.9
2.1
2.3
2.5
HDFC IHFL LICHF DHFL Repco GRUH
Avg. ticket size (INRmn)
15.0%30.0%
12.0%
40.0%
56.0%
39.0%
85.0%70.0%
88.0%
60.0%
44.0%
61.0%
0%
20%
40%
60%
80%
100%
120%
HDFC IHFL LICHF DHFL Repco GRUH
Self employeed Salaried

Nomura | Indiabulls Housing Finance 17 June 2015
29
Fig. 62: Traditional mortgage market share has inched up significantly in the past five years
Source: Company data, NHB, RBI, Nomura research
Fig. 63: But market share is still low and thus there is significant scope for market share gains
Source: Company data, NHB, RBI, Nomura research
Fig. 64: Mortgages have been growing faster than
LAP/corporate book
Source: Company data, Nomura estimates
Fig. 65: Higher-than-system growth to continue for IHFL
Source: Company data, RBI, NHB, Nomura estimates
LAP: traditionally very strong; growth opportunity still large but yield contraction
a reality
Loan against property (LAP) now contributes ~26% of IHFL’s loan book. While the LAP
market has evolved and grown in the past 4-5 years, IHFL has been among the first
entrants. Our estimates indicate that IHFL’s market share in the LAP business has
always been +10% (currently ~12%). Like most NBFCs, IHFL’s average ticket size is
INR7mn with incremental LTV of ~60% in this book.
0.23%0.41%
0.94%
1.65%
2.03%2.15%
2.25%
2.52%
0.0%
0.5%
1.0%
1.5%
2.0%
2.5%
3.0%F
Y08
FY
09
FY
10
FY
11
FY
12
FY
13
FY
14
FY
15
Home loan market share
15.4%
13.8%
9.7%
7.0%
5.2%4.1%
2.5%
0%
2%
4%
6%
8%
10%
12%
14%
16%
18%
SBI HDFC LICHF ICICI Axis DHFL IHFL
Home loan market share
15%
20%
25%
30%
35%
40%
FY12 FY13 FY14 FY15 FY16F FY17F FY18F
Mortgage growth - IHFL
LAP growth - IHFL
10%
15%
20%
25%
30%
35%
40%
FY12 FY13 FY14 FY15 FY16F FY17F FY18F
Mortgage growth - IHFL
Mortgage growth - system

Nomura | Indiabulls Housing Finance 17 June 2015
30
Fig. 66: IHFL’s LAP book has had a 38% CAGR over the past five years
Source: Company data, Nomura research
Fig. 67: IHFL LAP market share has always remained +10%
Source: Company data, RBI, NHB, Nomura research
As noted in the industry section, we believe the LAP opportunity remains large in India
with 60% of SMEs still not having access to formal bank funding; we think LAP funding is
a good alternative for these SMEs. Hence LAP book growth looks secular to us.
However, as previously noted in our industry section, competition has increased in LAP
book and yields have come off by 100-125bps in the past 12-15 months. We expect
further yield compression as competition continues to inch up. Yields coming off the LAP
business are negative for IHFL (25% of loan book), but a large part of the margin hit
should be netted off by cost of fund improvement driven by rating improvement.
Fig. 68: LAP growth opportunity appears to remain large
Source: IFC report, RBI, Nomura estimates
Fig. 69: But yields are coming off and likely to come off
further
Source: Company data, Nomura estimates
19 21 28
50 69
86 105
136
0
20
40
60
80
100
120
140
160
FY08 FY09 FY10 FY11 FY12 FY13 FY14 FY15
LAP book (INRbn)
11.6%
13.1%12.9%
11.7%
10.6%
11.1%
8%
9%
10%
11%
12%
13%
14%
FY10 FY11 FY12 FY13 FY14 FY15
LAP market share - IHFL
No. of MSME 46.8
No. of MSME covered by f inancial institutions 11
% covered by f inancial institution 23.5%
Employment generated 106.2
% of India Manufaturing 37.5%
% of System GDP 7.3%
% of system Loans 11.6%
Funding required for MSMEs (INRtrn) 32.50
of w hich equity 6.50
Of w hich debt 26.00
Of w hich non-viable debt 9.62
Of w hich viable debt 16.38
Current Funding by banks 5.38
Our estimate of System LAP book 1.20
% of viable demand met 40.2%
% of demand gap 59.8%
Mix of SMEs in India
SME in Urban India 55%
SME in Rural India 45%
13-15%
11.75-13.75%
8%
9%
10%
11%
12%
13%
14%
15%
FY13 FY15
LAP yields

Nomura | Indiabulls Housing Finance 17 June 2015
31
Corporate book: yield maximiser like HDFC Limited
Corporate book contributes ~20-21% of total loans for IHFL and is largely either rent
discounting (60% of the builder book) or special purpose vehicles (SPVs) lending to
residential projects (40% of builder book) with no balance sheet financing of builders as
per management. Share of corporate book has been stable at 21-22% for IHFL and like
HDFC limited; builder book lending is a yield maximisation strategy with current yields of
+15% in this portfolio for IHFL. While there has been minimal defaults yet in IHFL’s
builder/corporate book, but like HDFC limited, probability of default remains high in this
portfolio though loss given default should be lower. While management is confident of its
underwriting, it is building on floating provisions (INR2bn currently) for any contingencies.
Two recent examples highlight lumpy risk in the builder book
• IHFL had a corporate exposure of INR1bn to Deccan Chronicle - Of the INR1bn it has
received INR250mn and management is confident the company will recover INR750mn
as well, given collateral of three owners’ houses the company has. While most PSU
banks had to write off their exposure to Deccan Chronicle, IHFL given the collateral
backed lending, should possibly recover a large part of its exposure to Deccan. This is
similar to HDFC’s exposure to the UNSP Group, where the collateral structuring
provided some confidence on HFDC’s large exposure to the UNSP group.
• IHFL has large exposure to INR6bn to central Mumbai currently under construction, a
building called Palais Royale. The exposure is very large relative to IHFL’s size but it is
the sole lender to the project and has the entire project as collateral. The building is
under litigation due to the amount of space constructed vs what was originally
approved by regulators. The worst-case scenario could be that the builder will have to
knock down a few floors. Even taking sales of only the lower space, IHFL is 2.5-3.0x
covered on its exposure and does not see any risk of ultimate loss given default. As the
company is servicing debt, IHFL has not classified this exposure as NPA but on a
prudent basis it is not accruing interest on this INR6bn exposure to Palais Royale.
Fig. 70: Builder book break-up for IHFL vs HDFC Limited
(FY15)
Source: Company data, Nomura research
Fig. 71: Asset quality has remained stable for IHFL without
any default in builder portfolio
Source: Company data, Nomura research
21%
60%
41%
40%38%
0%
20%
40%
60%
80%
100%
120%
HDFC IHFL
LRD Project loans Corporates
0.7%
1.6%
1.9%
1.0%
0.8% 0.8% 0.8% 0.9%
0.0%
0.5%
1.0%
1.5%
2.0%
2.5%
FY08 FY09 FY10 FY11 FY12 FY13 FY14 FY15
GNPA%

Nomura | Indiabulls Housing Finance 17 June 2015
32
Funding cost now becoming competitive; mix change key catalysts
IHFL’s funding cost has been ~100-125bps higher than HDFC’s and LICHF’s about 2-3
years back and given that mortgages spreads are ~150-175bps only, this restricts IHFL’s
ability to compete in the mortgage market. But Indiabulls has established a consistent
track record over the past six to seven years in terms of financial performance leading to
continuous ratings upgrade. Currently IHFL’s long-term rating at +AA is just one notch
lower than that of HDFC/LICHF and hence borrowing cost differentials are coming off
significantly.
Fig. 72: Continuous rating upgrade: long-term ratings now just one notch lower to HDFC/LICHF
Source: Company data, Bloomberg, Nomura research
Fig. 73: Continuous rating upgrade: long-term ratings now just one notch lower to HDFC/LICHF
Source: Company data, Bloomberg, Nomura research
While consistent financial performance should only close the cost of funds gap further,
we believe the key benefit of all the rating improvements is only flowing now and with
increasing share of bond mix in it is over borrowing mix, we expect significant
improvement in cost of funds for IHFL. Currently banks contribute ~60% of IHFL’s
funding vs 11-17% for HDFC/LICHF and with increasing acceptance of IHFL’s bond
paper and increasing institutional participation, we estimate bank funding share to
decline to ~40% by FY18F. This should aid cost of funds as bond funding currently is
>100bps cheaper than bank funding (longer-term differentials have been 50-75bps)
FY08 FY09 FY10 FY11 FY12 FY13 FY14 FY15
Crisil AAA AAA AAA AAA AAA AAA AAA AAA
CARE AAA AAA AAA AAA AAA AAA AAA AAA
ICRA AAA AAA AAA AAA AAA AAA AAA
Crisil AAA AAA AAA AAA AAA AAA AAA AAA
CARE AAA AAA AAA AAA AAA AAA AAA AAA
Crisil AA- AA- AA AA AA AA AA+
CARE AA+ AA+ AA+ AA+ AAA
ICRA AA AA AA AA AA+
Dewan CARE AA+ AA+ AA+ AA+ AA+ AA+ AA+ AAA
Crisil AA AA+ AA+ AA+ AA+ AA+ AA+ AA+
ICRA AA+ AA+ AA+ AA+ AA+ AA+ AA+
CARE AA- AA-
ICRA A A A+ A+ A+ AA- AA-
Long term ratings
HDFC
LICHF
Indiabulls
Gruh
Repco
1.14
1.04
0.790.72
0.0
0.2
0.4
0.6
0.8
1.0
1.2
1.4
DHFL Indiabulls gap
Funding cost gap - FY13 Funding cost gap - 2HFY15

Nomura | Indiabulls Housing Finance 17 June 2015
33
Fig. 74: Growing acceptance of IHFL’s paper in the market
Source: Company data, Nomura research
Fig. 75: IHFL’s share of bonds still much lower than HDFC/LICHF
Source: Company data, Nomura research
Fig. 76: Reliance on bank funding to significantly come off
Source: Company data, Nomura research
Improving cost of funds partially negate lower LAP yields
Competition in mortgages is likely to remain intense and with yields on LAP coming off
sharply, overall yields and margins for IHFL is already facing downward pressure.
Incremental yields are already at ~13% vs 13.3-13.4% in FY15. We believe the favorable
rate environment, coupled with funding mix change, should help negate the majority of
the yield pressure in mortgages and LAP. Thus we expect loan spreads to come off by
just ~25-30bps over the next two years vs 100bps contraction we expect in lending
yields. Our expectation of margin contraction is largely due to normalisation in
investment yields and higher leverage impact.
Fig. 77: Yield pressure high but cost of funds benefit to also be significant
Source: Company data, Nomura estimates
Fig. 78: Loan spread contraction to be limited
Source: Company data, Nomura estimates
21 23 27 26
1115
15 16
22
29
5266
0
20
40
60
80
100
120
FY11 FY12 FY13 FY14
Non banks
Private/Foreign banks
PSU banks
37.6%
55.8%
76.3%
0%
10%
20%
30%
40%
50%
60%
70%
80%
90%
IHFL HDFC LICHF
Bond mix70%
66%
62% 62%
60%
55%
57%
59%
61%
63%
65%
67%
69%
71%
FY
11
FY
12
FY
13
FY
14
FY
15
Bank mix
13.6% 13.9% 14.4% 14.5% 14.0% 13.4% 13.1% 12.8%
3.8% 4.4%5.0%
9.5% 9.5%9.0%
8.5% 8.0%
5%
6%
7%
8%
9%
10%
11%
5%
7%
9%
11%
13%
15%
17%
19%
21%
23%
25%
FY
11
FY
12
FY
13
FY
14
FY
15
FY
16
F
FY
17
F
FY
18
F
Yield on investments (LHS)Yield on loans (LHS)Cost of funds (RHS)
7.09%
5.47%5.30%
4.63%4.49% 4.39% 4.28% 4.19%
3.0%
3.5%
4.0%
4.5%
5.0%
5.5%
6.0%
6.5%
7.0%
7.5%
FY
11
FY
12
FY
13
FY
14
FY
15
FY
16F
FY
17F
FY
18F
Spreads
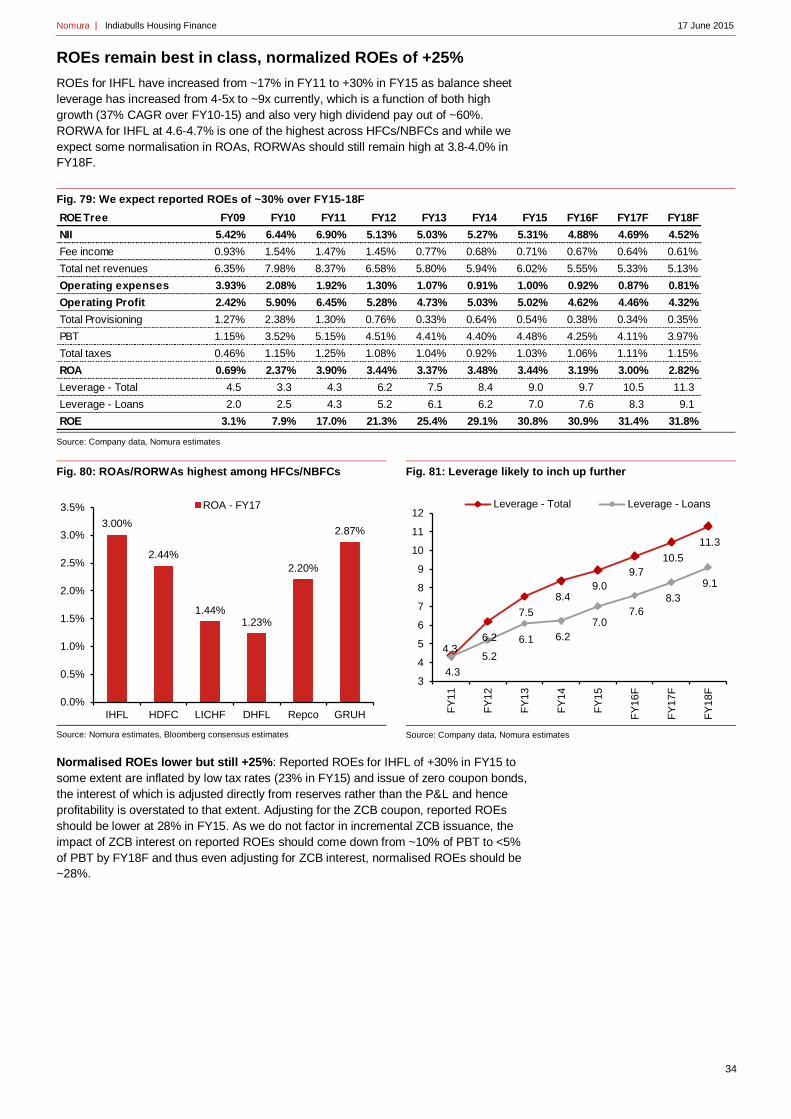
Nomura | Indiabulls Housing Finance 17 June 2015
34
ROEs remain best in class, normalized ROEs of +25%
ROEs for IHFL have increased from ~17% in FY11 to +30% in FY15 as balance sheet
leverage has increased from 4-5x to ~9x currently, which is a function of both high
growth (37% CAGR over FY10-15) and also very high dividend pay out of ~60%.
RORWA for IHFL at 4.6-4.7% is one of the highest across HFCs/NBFCs and while we
expect some normalisation in ROAs, RORWAs should still remain high at 3.8-4.0% in
FY18F.
Fig. 79: We expect reported ROEs of ~30% over FY15-18F
Source: Company data, Nomura estimates
Fig. 80: ROAs/RORWAs highest among HFCs/NBFCs
Source: Nomura estimates, Bloomberg consensus estimates
Fig. 81: Leverage likely to inch up further
Source: Company data, Nomura estimates
Normalised ROEs lower but still +25%: Reported ROEs for IHFL of +30% in FY15 to
some extent are inflated by low tax rates (23% in FY15) and issue of zero coupon bonds,
the interest of which is adjusted directly from reserves rather than the P&L and hence
profitability is overstated to that extent. Adjusting for the ZCB coupon, reported ROEs
should be lower at 28% in FY15. As we do not factor in incremental ZCB issuance, the
impact of ZCB interest on reported ROEs should come down from ~10% of PBT to <5%
of PBT by FY18F and thus even adjusting for ZCB interest, normalised ROEs should be
~28%.
ROE Tree FY09 FY10 FY11 FY12 FY13 FY14 FY15 FY16F FY17F FY18F
NII 5.42% 6.44% 6.90% 5.13% 5.03% 5.27% 5.31% 4.88% 4.69% 4.52%
Fee income 0.93% 1.54% 1.47% 1.45% 0.77% 0.68% 0.71% 0.67% 0.64% 0.61%
Total net revenues 6.35% 7.98% 8.37% 6.58% 5.80% 5.94% 6.02% 5.55% 5.33% 5.13%
Operating expenses 3.93% 2.08% 1.92% 1.30% 1.07% 0.91% 1.00% 0.92% 0.87% 0.81%
Operating Profit 2.42% 5.90% 6.45% 5.28% 4.73% 5.03% 5.02% 4.62% 4.46% 4.32%
Total Provisioning 1.27% 2.38% 1.30% 0.76% 0.33% 0.64% 0.54% 0.38% 0.34% 0.35%
PBT 1.15% 3.52% 5.15% 4.51% 4.41% 4.40% 4.48% 4.25% 4.11% 3.97%
Total taxes 0.46% 1.15% 1.25% 1.08% 1.04% 0.92% 1.03% 1.06% 1.11% 1.15%
ROA 0.69% 2.37% 3.90% 3.44% 3.37% 3.48% 3.44% 3.19% 3.00% 2.82%
Leverage - Total 4.5 3.3 4.3 6.2 7.5 8.4 9.0 9.7 10.5 11.3
Leverage - Loans 2.0 2.5 4.3 5.2 6.1 6.2 7.0 7.6 8.3 9.1
ROE 3.1% 7.9% 17.0% 21.3% 25.4% 29.1% 30.8% 30.9% 31.4% 31.8%
3.00%
2.44%
1.44%1.23%
2.20%
2.87%
0.0%
0.5%
1.0%
1.5%
2.0%
2.5%
3.0%
3.5%
IHFL HDFC LICHF DHFL Repco GRUH
ROA - FY17
4.3
6.2
7.5
8.4 9.0
9.7
10.5
11.3
4.3 5.2
6.1 6.2
7.0 7.6
8.3
9.1
3
4
5
6
7
8
9
10
11
12
FY
11
FY
12
FY
13
FY
14
FY
15
FY
16
F
FY
17
F
FY
18
F
Leverage - Total Leverage - Loans
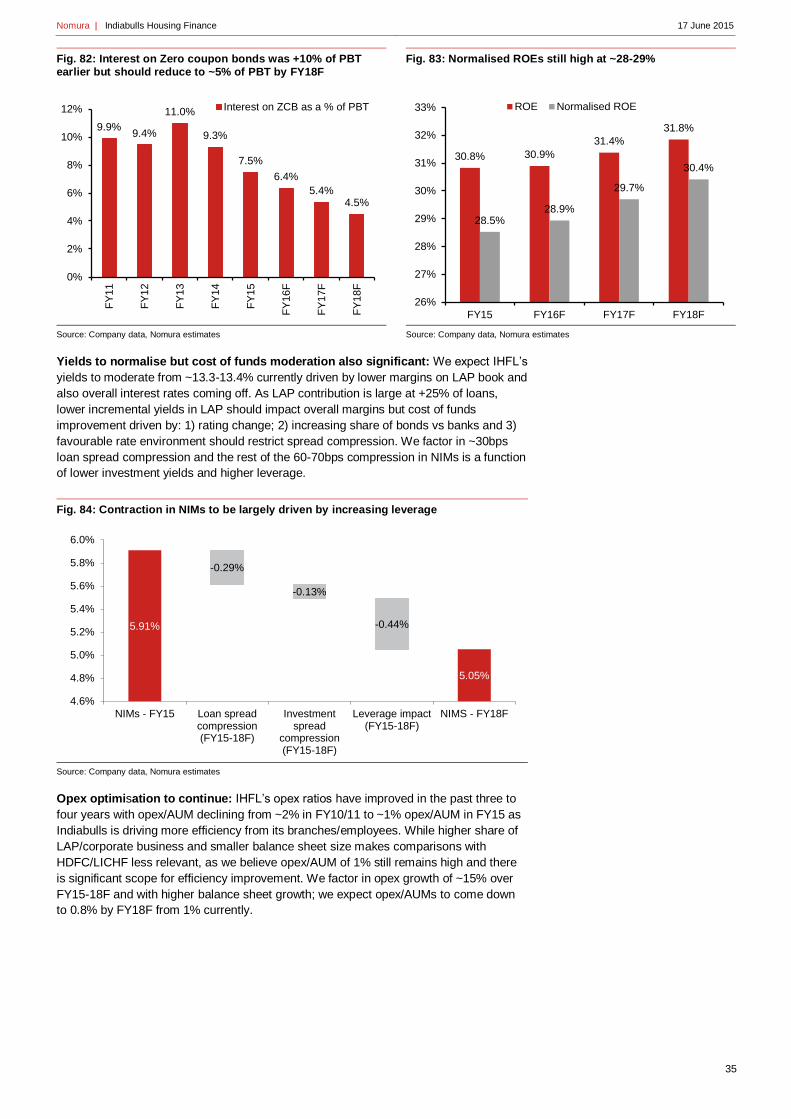
Nomura | Indiabulls Housing Finance 17 June 2015
35
Fig. 82: Interest on Zero coupon bonds was +10% of PBT earlier but should reduce to ~5% of PBT by FY18F
Source: Company data, Nomura estimates
Fig. 83: Normalised ROEs still high at ~28-29%
Source: Company data, Nomura estimates
Yields to normalise but cost of funds moderation also significant: We expect IHFL’s
yields to moderate from ~13.3-13.4% currently driven by lower margins on LAP book and
also overall interest rates coming off. As LAP contribution is large at +25% of loans,
lower incremental yields in LAP should impact overall margins but cost of funds
improvement driven by: 1) rating change; 2) increasing share of bonds vs banks and 3)
favourable rate environment should restrict spread compression. We factor in ~30bps
loan spread compression and the rest of the 60-70bps compression in NIMs is a function
of lower investment yields and higher leverage.
Fig. 84: Contraction in NIMs to be largely driven by increasing leverage
Source: Company data, Nomura estimates
Opex optimisation to continue: IHFL’s opex ratios have improved in the past three to
four years with opex/AUM declining from ~2% in FY10/11 to ~1% opex/AUM in FY15 as
Indiabulls is driving more efficiency from its branches/employees. While higher share of
LAP/corporate business and smaller balance sheet size makes comparisons with
HDFC/LICHF less relevant, as we believe opex/AUM of 1% still remains high and there
is significant scope for efficiency improvement. We factor in opex growth of ~15% over
FY15-18F and with higher balance sheet growth; we expect opex/AUMs to come down
to 0.8% by FY18F from 1% currently.
9.9%9.4%
11.0%
9.3%
7.5%
6.4%
5.4%4.5%
0%
2%
4%
6%
8%
10%
12%F
Y11
FY
12
FY
13
FY
14
FY
15
FY
16
F
FY
17
F
FY
18
F
Interest on ZCB as a % of PBT
30.8% 30.9%
31.4%
31.8%
28.5%28.9%
29.7%
30.4%
26%
27%
28%
29%
30%
31%
32%
33%
FY15 FY16F FY17F FY18F
ROE Normalised ROE
5.91%
5.05%
-0.29%
-0.13%
-0.44%
4.6%
4.8%
5.0%
5.2%
5.4%
5.6%
5.8%
6.0%
NIMs - FY15 Loan spreadcompression(FY15-18F)
Investmentspread
compression(FY15-18F)
Leverage impact(FY15-18F)
NIMS - FY18F
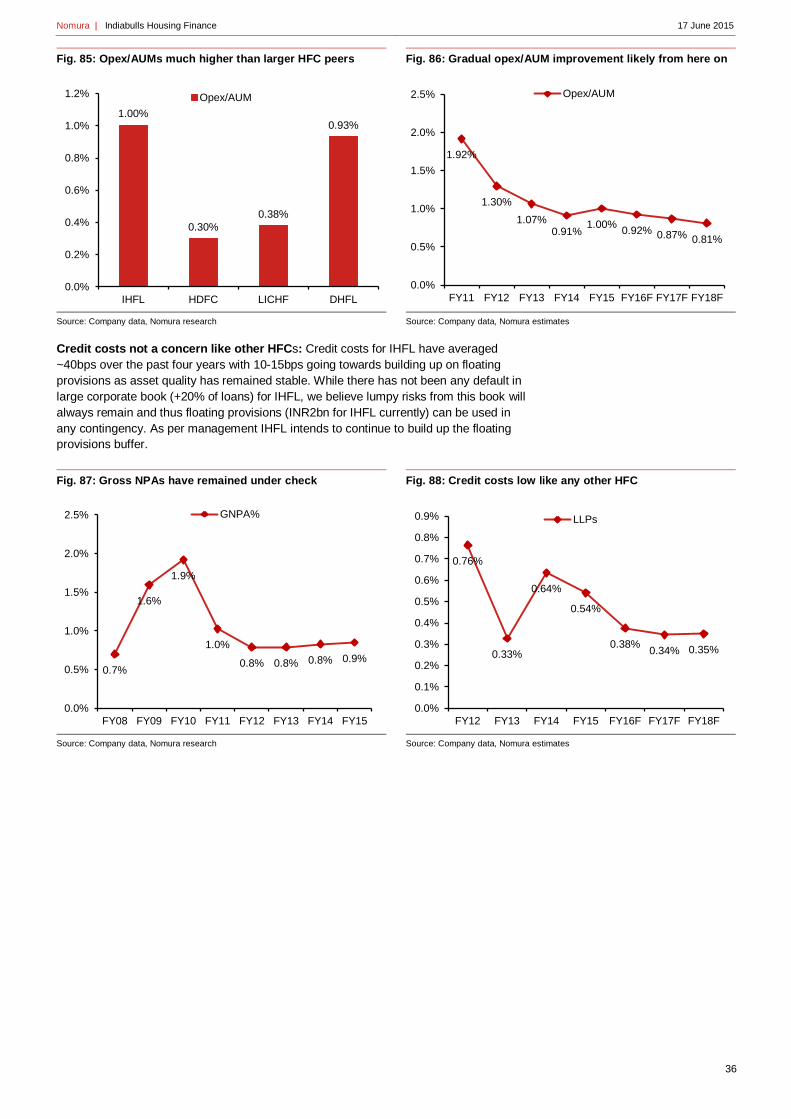
Nomura | Indiabulls Housing Finance 17 June 2015
36
Fig. 85: Opex/AUMs much higher than larger HFC peers
Source: Company data, Nomura research
Fig. 86: Gradual opex/AUM improvement likely from here on
Source: Company data, Nomura estimates
Credit costs not a concern like other HFCs: Credit costs for IHFL have averaged
~40bps over the past four years with 10-15bps going towards building up on floating
provisions as asset quality has remained stable. While there has not been any default in
large corporate book (+20% of loans) for IHFL, we believe lumpy risks from this book will
always remain and thus floating provisions (INR2bn for IHFL currently) can be used in
any contingency. As per management IHFL intends to continue to build up the floating
provisions buffer.
Fig. 87: Gross NPAs have remained under check
Source: Company data, Nomura research
Fig. 88: Credit costs low like any other HFC
Source: Company data, Nomura estimates
1.00%
0.30%
0.38%
0.93%
0.0%
0.2%
0.4%
0.6%
0.8%
1.0%
1.2%
IHFL HDFC LICHF DHFL
Opex/AUM
1.92%
1.30%
1.07%0.91%
1.00%0.92% 0.87% 0.81%
0.0%
0.5%
1.0%
1.5%
2.0%
2.5%
FY11 FY12 FY13 FY14 FY15 FY16F FY17F FY18F
Opex/AUM
0.7%
1.6%
1.9%
1.0%
0.8% 0.8% 0.8% 0.9%
0.0%
0.5%
1.0%
1.5%
2.0%
2.5%
FY08 FY09 FY10 FY11 FY12 FY13 FY14 FY15
GNPA%
0.76%
0.33%
0.64%
0.54%
0.38%0.34% 0.35%
0.0%
0.1%
0.2%
0.3%
0.4%
0.5%
0.6%
0.7%
0.8%
0.9%
FY12 FY13 FY14 FY15 FY16F FY17F FY18F
LLPs
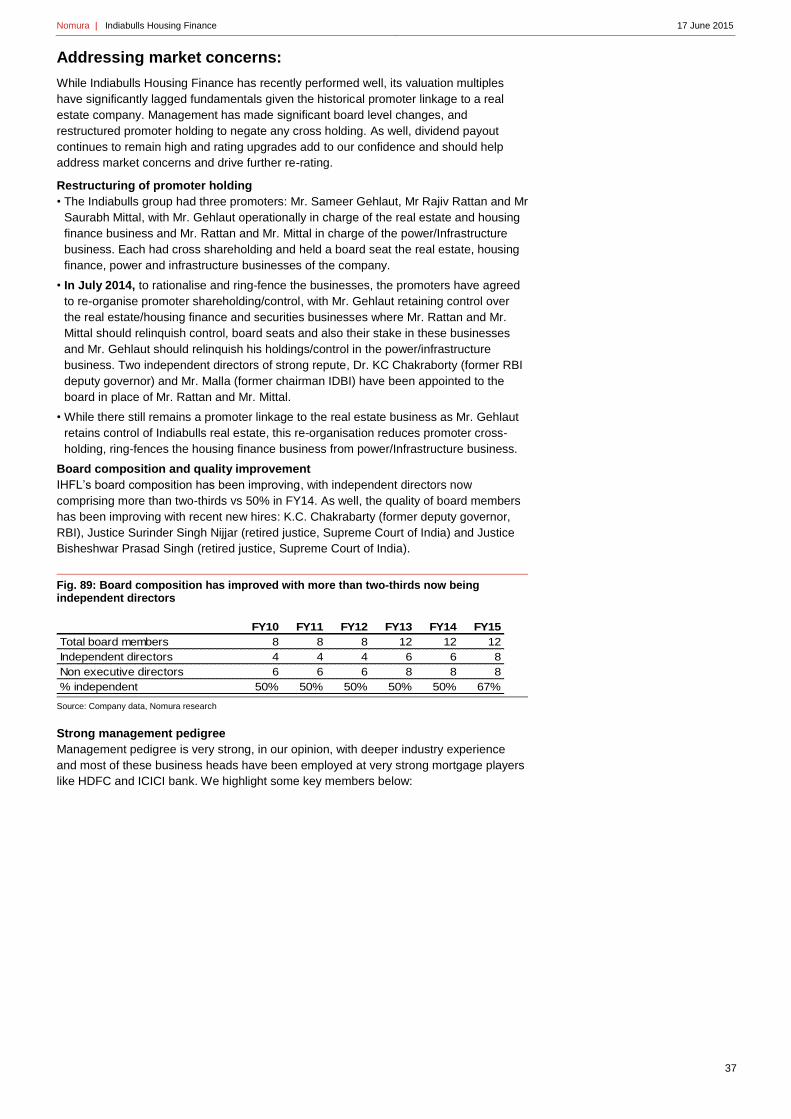
Nomura | Indiabulls Housing Finance 17 June 2015
37
Addressing market concerns:
While Indiabulls Housing Finance has recently performed well, its valuation multiples
have significantly lagged fundamentals given the historical promoter linkage to a real
estate company. Management has made significant board level changes, and
restructured promoter holding to negate any cross holding. As well, dividend payout
continues to remain high and rating upgrades add to our confidence and should help
address market concerns and drive further re-rating.
Restructuring of promoter holding
• The Indiabulls group had three promoters: Mr. Sameer Gehlaut, Mr Rajiv Rattan and Mr
Saurabh Mittal, with Mr. Gehlaut operationally in charge of the real estate and housing
finance business and Mr. Rattan and Mr. Mittal in charge of the power/Infrastructure
business. Each had cross shareholding and held a board seat the real estate, housing
finance, power and infrastructure businesses of the company.
• In July 2014, to rationalise and ring-fence the businesses, the promoters have agreed
to re-organise promoter shareholding/control, with Mr. Gehlaut retaining control over
the real estate/housing finance and securities businesses where Mr. Rattan and Mr.
Mittal should relinquish control, board seats and also their stake in these businesses
and Mr. Gehlaut should relinquish his holdings/control in the power/infrastructure
business. Two independent directors of strong repute, Dr. KC Chakraborty (former RBI
deputy governor) and Mr. Malla (former chairman IDBI) have been appointed to the
board in place of Mr. Rattan and Mr. Mittal.
• While there still remains a promoter linkage to the real estate business as Mr. Gehlaut
retains control of Indiabulls real estate, this re-organisation reduces promoter cross-
holding, ring-fences the housing finance business from power/Infrastructure business.
Board composition and quality improvement
IHFL’s board composition has been improving, with independent directors now
comprising more than two-thirds vs 50% in FY14. As well, the quality of board members
has been improving with recent new hires: K.C. Chakrabarty (former deputy governor,
RBI), Justice Surinder Singh Nijjar (retired justice, Supreme Court of India) and Justice
Bisheshwar Prasad Singh (retired justice, Supreme Court of India).
Fig. 89: Board composition has improved with more than two-thirds now being independent directors
Source: Company data, Nomura research
Strong management pedigree
Management pedigree is very strong, in our opinion, with deeper industry experience
and most of these business heads have been employed at very strong mortgage players
like HDFC and ICICI bank. We highlight some key members below:
FY10 FY11 FY12 FY13 FY14 FY15
Total board members 8 8 8 12 12 12
Independent directors 4 4 4 6 6 8
Non executive directors 6 6 6 8 8 8
% independent 50% 50% 50% 50% 50% 67%
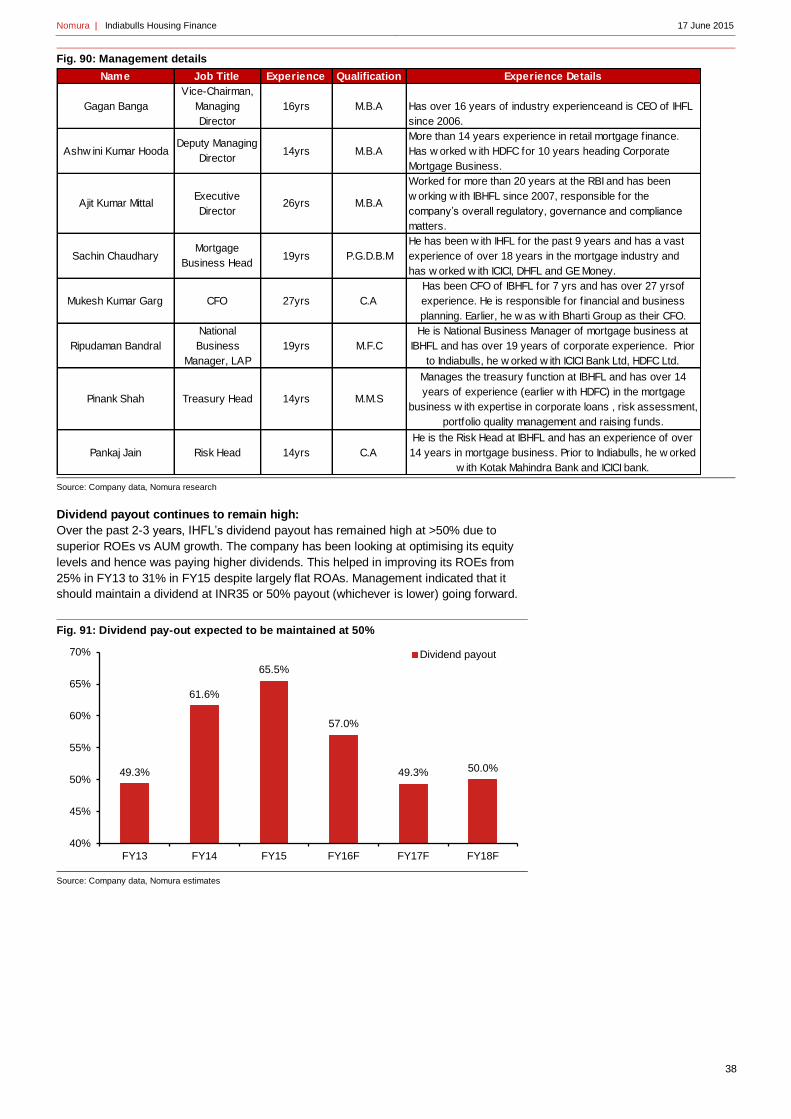
Nomura | Indiabulls Housing Finance 17 June 2015
38
Fig. 90: Management details
Source: Company data, Nomura research
Dividend payout continues to remain high:
Over the past 2-3 years, IHFL’s dividend payout has remained high at >50% due to
superior ROEs vs AUM growth. The company has been looking at optimising its equity
levels and hence was paying higher dividends. This helped in improving its ROEs from
25% in FY13 to 31% in FY15 despite largely flat ROAs. Management indicated that it
should maintain a dividend at INR35 or 50% payout (whichever is lower) going forward.
Fig. 91: Dividend pay-out expected to be maintained at 50%
Source: Company data, Nomura estimates
Name Job Title Experience Qualification Experience Details
Gagan Banga
Vice-Chairman,
Managing
Director
16yrs M.B.A Has over 16 years of industry experienceand is CEO of IHFL
since 2006.
Ashw ini Kumar HoodaDeputy Managing
Director14yrs M.B.A
More than 14 years experience in retail mortgage finance.
Has w orked w ith HDFC for 10 years heading Corporate
Mortgage Business.
Ajit Kumar MittalExecutive
Director26yrs M.B.A
Worked for more than 20 years at the RBI and has been
w orking w ith IBHFL since 2007, responsible for the
company’s overall regulatory, governance and compliance
matters.
Sachin ChaudharyMortgage
Business Head19yrs P.G.D.B.M
He has been w ith IHFL for the past 9 years and has a vast
experience of over 18 years in the mortgage industry and
has w orked w ith ICICI, DHFL and GE Money.
Mukesh Kumar Garg CFO 27yrs C.A
Has been CFO of IBHFL for 7 yrs and has over 27 yrsof
experience. He is responsible for f inancial and business
planning. Earlier, he w as w ith Bharti Group as their CFO.
Ripudaman Bandral
National
Business
Manager, LAP
19yrs M.F.C
He is National Business Manager of mortgage business at
IBHFL and has over 19 years of corporate experience. Prior
to Indiabulls, he w orked w ith ICICI Bank Ltd, HDFC Ltd.
Pinank Shah Treasury Head 14yrs M.M.S
Manages the treasury function at IBHFL and has over 14
years of experience (earlier w ith HDFC) in the mortgage
business w ith expertise in corporate loans , risk assessment,
portfolio quality management and raising funds.
Pankaj Jain Risk Head 14yrs C.A
He is the Risk Head at IBHFL and has an experience of over
14 years in mortgage business. Prior to Indiabulls, he w orked
w ith Kotak Mahindra Bank and ICICI bank.
49.3%
61.6%
65.5%
57.0%
49.3% 50.0%
40%
45%
50%
55%
60%
65%
70%
FY13 FY14 FY15 FY16F FY17F FY18F
Dividend payout

Nomura | Indiabulls Housing Finance 17 June 2015
39
Further re-rating likely; building credibility over time
We value Indiabulls Financials at 3x FY17F book and initiate coverage with a TP of
INR800, with implied 44% upside (including INR76/share dividends for FY16/17F).
Indiabulls currently trades at ~2x F17F book and with +24% CAGR growth and sector-
leading return ratios, we expect IHFL to get re-rated further. In the past 12 months IHFL
has re-rated from ~1x book to ~2x book as: (1) Management addressed market concerns
on group level holdings; 2) consistent performance has led to ROEs moving up and 3)
management has maintained higher dividend pay-outs. We expect the re-rating to
continue with funding mix change and consistent performance likely to be key drivers.
Fig. 92: Initiate with a TP of INR800
Source: Nomura estimates
Fig. 93: Re-rating has started in the past 12 months is likely to continue
Source: Bloomberg, Nomura estimates
Relatively, IHFL is one of the cheapest HFCs, trading at <8x FY17F P/E despite its
strong stock performance. Its ROEs are the sector’s best, in line with return ratios for
HDFC’s standalone mortgage business and at least ~8-10% higher than other HFCs. We
think that justifies our premium valuation multiple.
Fig. 94: Relative valuations – Indiabulls still the cheapest relative to peers despite its strong stock performance
Source: Company data, Nomura estimates
Valuation assumptions
Cost of Equity 13.5%
Terminal grow th 5.0%
Normalised ROE 24.5%
Stage 2 grow th 17.0%
Mar-16 PT 800
Implied Mar-17 P/B 3.07
Implied Mar-17 P/E 10.40.5
1.0
1.5
2.0
2.5
3.0
3.5
Au
g-1
3
Dec-1
3
Ap
r-14
Au
g-1
4
Dec-1
4
Ap
r-15
IHFL
Current Mcap Target Upside/
price USDbn Rating price downside FY16F FY17F FY16F FY17F FY16F FY17F FY16F FY17F
HDFC 1,215 29.9 Neutral 1,325 9.1% 4.23 3.64 17.5 15.1 21.0% 21.7% 2.5% 2.4%
LICHF 395 3.1 Buy 500 26.6% 2.18 1.87 11.9 10.1 19.8% 19.9% 1.4% 1.4%
IHFL 556 3.1 Buy 800 43.9% 2.33 2.04 8.0 6.9 30.9% 31.4% 3.2% 3.0%
DEWH 389 0.9 Buy 525 35.0% 1.09 0.93 7.1 6.8 16.1% 15.8% 1.2% 1.2%
Repco 590 0.6 Not rated NA NA 3.97 3.28 23.1 18.7 18.4% 19.7% 2.3% 2.3%
GRHF 219 1.2 Not rated NA NA 8.59 6.81 28.8 23.6 32.9% 31.7% 2.8% 2.9%
Shriram 821 3.0 BUY 1,100 33.8% 1.76 1.51 11.7 9.2 16.1% 17.6% 2.5% 2.8%
MMFS 236 2.1 Neutral 305 25.7% 2.07 1.80 12.7 10.5 17.3% 18.4% 2.7% 2.8%
P/B P/E RoE RoA

Nomura | Indiabulls Housing Finance 17 June 2015
40
Risks to our Buy rating
• Unfavorable wholesale funding environment: Apart from the structural growth
opportunity, our positive stance on HFCs is based on a favourable wholesale rate
environment. We think corporate loan growth pick-up will be gradual; hence system
liquidity and the wholesale funding environment remain comfortable. A spike in
wholesale rates could be a risk to our view on overall HFCs and also for Indiabulls
Housing Finance.
• Higher-than-expected contraction in LAP yields: LAP yields have come off by
~100bps and we expect further 100bps contraction in LAP yields over FY15-18F. LAP
is an attractive product from a risk-adjusted return perspective and competition is likely
to increase. Given Indiabulls’ s high reliance on LAP on lending book, lower LAP yields
remain a risk; every 50bps cut in LAP yields could lead to ~1% cut to IHFL’s ROEs.
• Lumpy asset quality risk in builder portfolio: IHFL has not had any default in its
builder book until now, but as the builder book is ~20% of IHFL’s loans, lumpy asset
quality risks remain. SPV lending would imply that ultimate loss given default should be
lower and also IHFL is building a floating provision buffer (INR2bn), but this still does
not rule out likelihood of lumpy NPAs in builder book.
Rating Starts at Buy
Target price Starts at INR 525
Closing price 15 June 2015 INR 389
Potential upside +35%
Anchor themes
Mortgages remain a structural story from a growth perspective. Cyclically the rate environment remains favorable for HFCs and the banks' ability to compete on pricing is lower than in the last cycle (FY09-10).
Nomura vs consensus
Our FY16/17F PAT estimates are largely in line with consensus.
Research analysts
India Financials
Amit Nanavati - NFASL [email protected] +91 22 4037 4361
Adarsh Parasrampuria - NFASL [email protected] +91 22 4037 4034
Dewan Housing Finance
DWNH.NS DEWH IN
EQUITY: FINANCIALS
Initiate at Buy with 35% upside potential
Niche player with large opportunity; valuations more than adequately factors in our concerns
Action: Initiate at Buy with 35% potential upside
Dewan Housing Finance (DHFL) has been one of India’s fastest-growing
HFCs over the past decade with its niche focus in the lower- and middle-
income (LMI) segment (Tier 2/3 cities) where penetration/competition remains
fairly low. Lower competition and a significant untapped market have helped
DHFL to ramp up market share to 4.1% in mortgages and 8% in loan against
property (LAP) as on FY15. ROE remains inferior at 16% vs a peer avg of 20-
30% due to inefficient use of cash and higher leverage/opex, but recent rating
upgrades and management’s commitment to improve efficiencies should help
the stock re-rate. We initiate at Buy with a TP of INR525 (35% implied upside).
Opportunities large, funding profile improving: Opportunities remain
large, in our view, with a 34mn-unit shortfall expected in urban housing by
2022, where any development in the GoI’s affordable housing push would
benefit DHFL. CARE’s recent rating upgrade to AAA should drive funding
costs lower in FY16/17F (70-80bps higher than HDFC/LICHF vs 100-
120bps in FY13) with improving bond mix to 42% by FY18F vs 28% now.
Inferior ROE remains a concern: Over the past three-four years, DHFL
has disappointed investors with its inefficient use of cash (~45% of FY15
NW invested in acquisitions/non-core investments) which has led to
leverage inching up to 12-13x in FY15 from 10-11x in FY09/10, pushing
ROE down to 16% now vs ~20% in FY09/10. However, DHFL is now
committed to focusing on the core business and possibly monetise
unrelated investments, which will help address investors’ concerns.
Valuation at 0.9x book looks inexpensive despite inferior ROE
DHFL remains the cheapest mortgage play in the sector, trading at 0.9x
FY17F book (BVPS of INR419) vs peers at 2-3x. We concede that DHFL’s
ROE remains inferior but its large potential growth opportunity and improving
cash utilisation from here on should drive a re-rating. Our TP of INR525
implies 1.25x FY17F book.
Year-end 31 Mar FY15
FY16F
FY17F
FY18F
Currency (INR) Actual Old New Old New Old New
PPOP (mn) 10,480 N/A 13,573 N/A 16,545 N/A 21,132
Reported net profit (mn) 6,213 N/A 7,968 N/A 9,694 N/A 12,440
Normalised net profit (mn) 6,213 N/A 7,968 N/A 9,694 N/A 12,440
FD normalised EPS 42.65 N/A 54.69 N/A 57.86 N/A 74.25
FD norm. EPS growth (%) 3.5 N/A 28.2 N/A 5.8 N/A 28.3
FD normalised P/E (x) 9.1 N/A 7.1 N/A 6.7 N/A 5.2
Price/adj. book (x) 1.2 N/A 1.1 N/A 0.9 N/A 0.8
Price/book (x) 1.2 N/A 1.1 N/A 0.9 N/A 0.8
Dividend yield (%) 2.3 N/A 2.8 N/A 3.0 N/A 3.8
ROE (%) 15.1 N/A 16.2 N/A 15.9 N/A 16.6
ROA (%) 1.3 N/A 1.3 N/A 1.3 N/A 1.4
Source: Company data, Nomura estimates
Global Markets Research
17 June 2015
See Appendix A-1 for analyst certification, important disclosures and the status of non-US analysts.
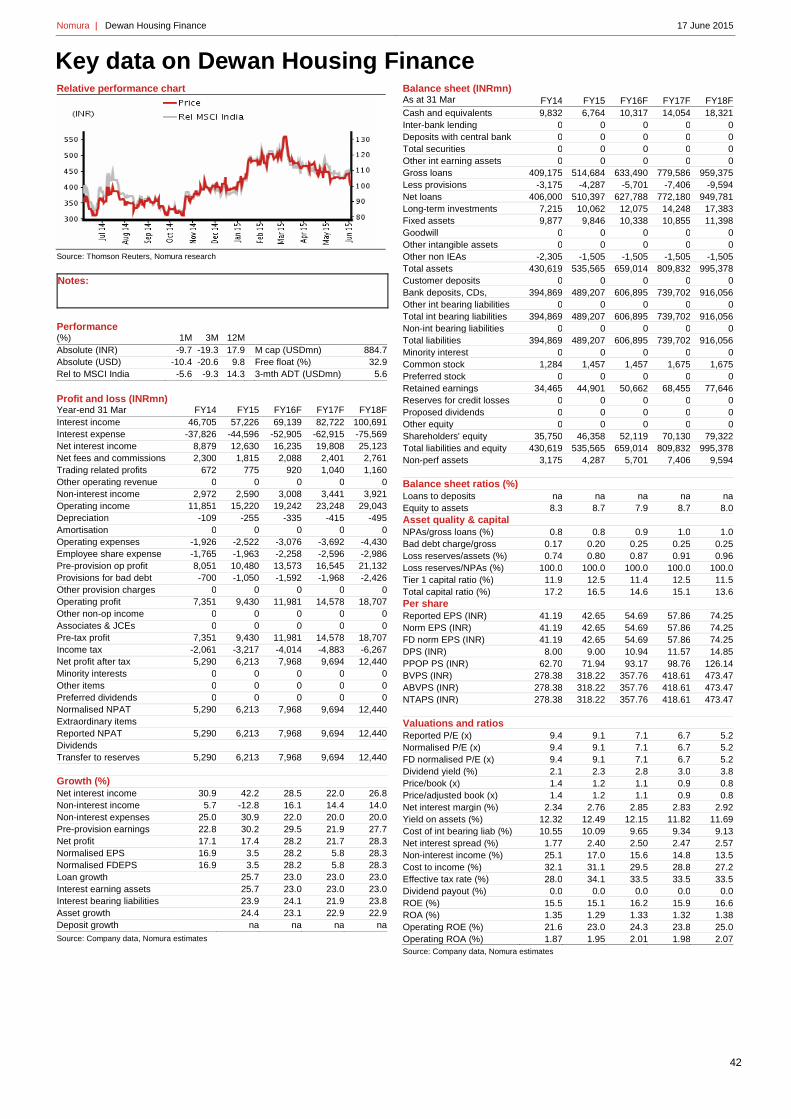
Nomura | Dewan Housing Finance 17 June 2015
42
Key data on Dewan Housing Finance Relative performance chart
Source: Thomson Reuters, Nomura research
Notes:
Performance (%) 1M 3M 12M
Absolute (INR) -9.7 -19.3 17.9 M cap (USDmn) 884.7
Absolute (USD) -10.4 -20.6 9.8 Free float (%) 32.9
Rel to MSCI India -5.6 -9.3 14.3 3-mth ADT (USDmn) 5.6
Profit and loss (INRmn) Year-end 31 Mar FY14 FY15 FY16F FY17F FY18F
Interest income 46,705 57,226 69,139 82,722 100,691
Interest expense -37,826 -44,596 -52,905 -62,915 -75,569
Net interest income 8,879 12,630 16,235 19,808 25,123
Net fees and commissions 2,300 1,815 2,088 2,401 2,761
Trading related profits 672 775 920 1,040 1,160
Other operating revenue 0 0 0 0 0
Non-interest income 2,972 2,590 3,008 3,441 3,921
Operating income 11,851 15,220 19,242 23,248 29,043
Depreciation -109 -255 -335 -415 -495
Amortisation 0 0 0 0 0
Operating expenses -1,926 -2,522 -3,076 -3,692 -4,430
Employee share expense -1,765 -1,963 -2,258 -2,596 -2,986
Pre-provision op profit 8,051 10,480 13,573 16,545 21,132
Provisions for bad debt -700 -1,050 -1,592 -1,968 -2,426
Other provision charges 0 0 0 0 0
Operating profit 7,351 9,430 11,981 14,578 18,707
Other non-op income 0 0 0 0 0
Associates & JCEs 0 0 0 0 0
Pre-tax profit 7,351 9,430 11,981 14,578 18,707
Income tax -2,061 -3,217 -4,014 -4,883 -6,267
Net profit after tax 5,290 6,213 7,968 9,694 12,440
Minority interests 0 0 0 0 0
Other items 0 0 0 0 0
Preferred dividends 0 0 0 0 0
Normalised NPAT 5,290 6,213 7,968 9,694 12,440
Extraordinary items
Reported NPAT 5,290 6,213 7,968 9,694 12,440
Dividends
Transfer to reserves 5,290 6,213 7,968 9,694 12,440
Growth (%)
Net interest income 30.9 42.2 28.5 22.0 26.8
Non-interest income 5.7 -12.8 16.1 14.4 14.0
Non-interest expenses 25.0 30.9 22.0 20.0 20.0
Pre-provision earnings 22.8 30.2 29.5 21.9 27.7
Net profit 17.1 17.4 28.2 21.7 28.3
Normalised EPS 16.9 3.5 28.2 5.8 28.3
Normalised FDEPS 16.9 3.5 28.2 5.8 28.3
Loan growth 25.7 23.0 23.0 23.0
Interest earning assets 25.7 23.0 23.0 23.0
Interest bearing liabilities 23.9 24.1 21.9 23.8
Asset growth 24.4 23.1 22.9 22.9
Deposit growth na na na na
Source: Company data, Nomura estimates
Balance sheet (INRmn) As at 31 Mar FY14 FY15 FY16F FY17F FY18F
Cash and equivalents 9,832 6,764 10,317 14,054 18,321
Inter-bank lending 0 0 0 0 0
Deposits with central bank 0 0 0 0 0
Total securities 0 0 0 0 0
Other int earning assets 0 0 0 0 0
Gross loans 409,175 514,684 633,490 779,586 959,375
Less provisions -3,175 -4,287 -5,701 -7,406 -9,594
Net loans 406,000 510,397 627,788 772,180 949,781
Long-term investments 7,215 10,062 12,075 14,248 17,383
Fixed assets 9,877 9,846 10,338 10,855 11,398
Goodwill 0 0 0 0 0
Other intangible assets 0 0 0 0 0
Other non IEAs -2,305 -1,505 -1,505 -1,505 -1,505
Total assets 430,619 535,565 659,014 809,832 995,378
Customer deposits 0 0 0 0 0
Bank deposits, CDs,
debentures
394,869 489,207 606,895 739,702 916,056
Other int bearing liabilities 0 0 0 0 0
Total int bearing liabilities 394,869 489,207 606,895 739,702 916,056
Non-int bearing liabilities 0 0 0 0 0
Total liabilities 394,869 489,207 606,895 739,702 916,056
Minority interest 0 0 0 0 0
Common stock 1,284 1,457 1,457 1,675 1,675
Preferred stock 0 0 0 0 0
Retained earnings 34,465 44,901 50,662 68,455 77,646
Reserves for credit losses 0 0 0 0 0
Proposed dividends 0 0 0 0 0
Other equity 0 0 0 0 0
Shareholders' equity 35,750 46,358 52,119 70,130 79,322
Total liabilities and equity 430,619 535,565 659,014 809,832 995,378
Non-perf assets 3,175 4,287 5,701 7,406 9,594
Balance sheet ratios (%)
Loans to deposits na na na na na
Equity to assets 8.3 8.7 7.9 8.7 8.0
Asset quality & capital
NPAs/gross loans (%) 0.8 0.8 0.9 1.0 1.0
Bad debt charge/gross
loans (%)
0.17 0.20 0.25 0.25 0.25
Loss reserves/assets (%) 0.74 0.80 0.87 0.91 0.96
Loss reserves/NPAs (%) 100.0 100.0 100.0 100.0 100.0
Tier 1 capital ratio (%) 11.9 12.5 11.4 12.5 11.5
Total capital ratio (%) 17.2 16.5 14.6 15.1 13.6
Per share
Reported EPS (INR) 41.19 42.65 54.69 57.86 74.25
Norm EPS (INR) 41.19 42.65 54.69 57.86 74.25
FD norm EPS (INR) 41.19 42.65 54.69 57.86 74.25
DPS (INR) 8.00 9.00 10.94 11.57 14.85
PPOP PS (INR) 62.70 71.94 93.17 98.76 126.14
BVPS (INR) 278.38 318.22 357.76 418.61 473.47
ABVPS (INR) 278.38 318.22 357.76 418.61 473.47
NTAPS (INR) 278.38 318.22 357.76 418.61 473.47
Valuations and ratios
Reported P/E (x) 9.4 9.1 7.1 6.7 5.2
Normalised P/E (x) 9.4 9.1 7.1 6.7 5.2
FD normalised P/E (x) 9.4 9.1 7.1 6.7 5.2
Dividend yield (%) 2.1 2.3 2.8 3.0 3.8
Price/book (x) 1.4 1.2 1.1 0.9 0.8
Price/adjusted book (x) 1.4 1.2 1.1 0.9 0.8
Net interest margin (%) 2.34 2.76 2.85 2.83 2.92
Yield on assets (%) 12.32 12.49 12.15 11.82 11.69
Cost of int bearing liab (%) 10.55 10.09 9.65 9.34 9.13
Net interest spread (%) 1.77 2.40 2.50 2.47 2.57
Non-interest income (%) 25.1 17.0 15.6 14.8 13.5
Cost to income (%) 32.1 31.1 29.5 28.8 27.2
Effective tax rate (%) 28.0 34.1 33.5 33.5 33.5
Dividend payout (%) 0.0 0.0 0.0 0.0 0.0
ROE (%) 15.5 15.1 16.2 15.9 16.6
ROA (%) 1.35 1.29 1.33 1.32 1.38
Operating ROE (%) 21.6 23.0 24.3 23.8 25.0
Operating ROA (%) 1.87 1.95 2.01 1.98 2.07
Source: Company data, Nomura estimates
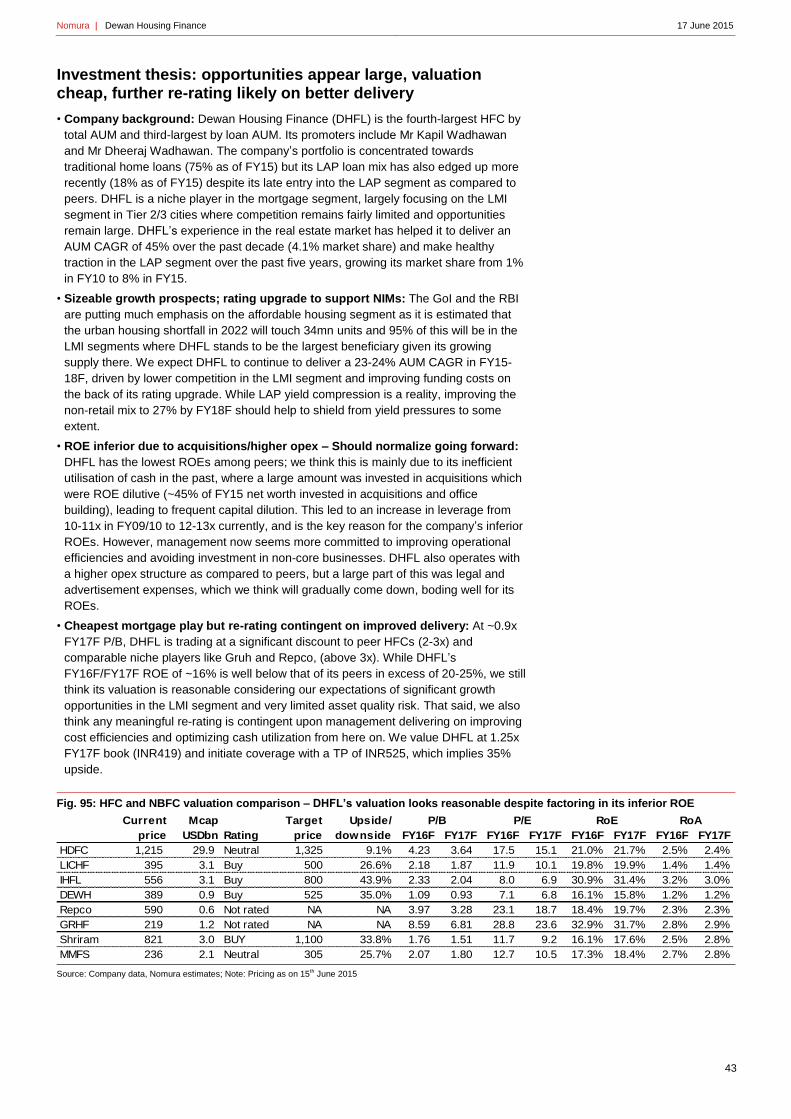
Nomura | Dewan Housing Finance 17 June 2015
43
Investment thesis: opportunities appear large, valuation cheap, further re-rating likely on better delivery
• Company background: Dewan Housing Finance (DHFL) is the fourth-largest HFC by
total AUM and third-largest by loan AUM. Its promoters include Mr Kapil Wadhawan
and Mr Dheeraj Wadhawan. The company’s portfolio is concentrated towards
traditional home loans (75% as of FY15) but its LAP loan mix has also edged up more
recently (18% as of FY15) despite its late entry into the LAP segment as compared to
peers. DHFL is a niche player in the mortgage segment, largely focusing on the LMI
segment in Tier 2/3 cities where competition remains fairly limited and opportunities
remain large. DHFL’s experience in the real estate market has helped it to deliver an
AUM CAGR of 45% over the past decade (4.1% market share) and make healthy
traction in the LAP segment over the past five years, growing its market share from 1%
in FY10 to 8% in FY15.
• Sizeable growth prospects; rating upgrade to support NIMs: The GoI and the RBI
are putting much emphasis on the affordable housing segment as it is estimated that
the urban housing shortfall in 2022 will touch 34mn units and 95% of this will be in the
LMI segments where DHFL stands to be the largest beneficiary given its growing
supply there. We expect DHFL to continue to deliver a 23-24% AUM CAGR in FY15-
18F, driven by lower competition in the LMI segment and improving funding costs on
the back of its rating upgrade. While LAP yield compression is a reality, improving the
non-retail mix to 27% by FY18F should help to shield from yield pressures to some
extent.
• ROE inferior due to acquisitions/higher opex – Should normalize going forward:
DHFL has the lowest ROEs among peers; we think this is mainly due to its inefficient
utilisation of cash in the past, where a large amount was invested in acquisitions which
were ROE dilutive (~45% of FY15 net worth invested in acquisitions and office
building), leading to frequent capital dilution. This led to an increase in leverage from
10-11x in FY09/10 to 12-13x currently, and is the key reason for the company’s inferior
ROEs. However, management now seems more committed to improving operational
efficiencies and avoiding investment in non-core businesses. DHFL also operates with
a higher opex structure as compared to peers, but a large part of this was legal and
advertisement expenses, which we think will gradually come down, boding well for its
ROEs.
• Cheapest mortgage play but re-rating contingent on improved delivery: At ~0.9x
FY17F P/B, DHFL is trading at a significant discount to peer HFCs (2-3x) and
comparable niche players like Gruh and Repco, (above 3x). While DHFL’s
FY16F/FY17F ROE of ~16% is well below that of its peers in excess of 20-25%, we still
think its valuation is reasonable considering our expectations of significant growth
opportunities in the LMI segment and very limited asset quality risk. That said, we also
think any meaningful re-rating is contingent upon management delivering on improving
cost efficiencies and optimizing cash utilization from here on. We value DHFL at 1.25x
FY17F book (INR419) and initiate coverage with a TP of INR525, which implies 35%
upside.
Fig. 95: HFC and NBFC valuation comparison – DHFL’s valuation looks reasonable despite factoring in its inferior ROE
Source: Company data, Nomura estimates; Note: Pricing as on 15th June 2015
Current Mcap Target Upside/
price USDbn Rating price downside FY16F FY17F FY16F FY17F FY16F FY17F FY16F FY17F
HDFC 1,215 29.9 Neutral 1,325 9.1% 4.23 3.64 17.5 15.1 21.0% 21.7% 2.5% 2.4%
LICHF 395 3.1 Buy 500 26.6% 2.18 1.87 11.9 10.1 19.8% 19.9% 1.4% 1.4%
IHFL 556 3.1 Buy 800 43.9% 2.33 2.04 8.0 6.9 30.9% 31.4% 3.2% 3.0%
DEWH 389 0.9 Buy 525 35.0% 1.09 0.93 7.1 6.8 16.1% 15.8% 1.2% 1.2%
Repco 590 0.6 Not rated NA NA 3.97 3.28 23.1 18.7 18.4% 19.7% 2.3% 2.3%
GRHF 219 1.2 Not rated NA NA 8.59 6.81 28.8 23.6 32.9% 31.7% 2.8% 2.9%
Shriram 821 3.0 BUY 1,100 33.8% 1.76 1.51 11.7 9.2 16.1% 17.6% 2.5% 2.8%
MMFS 236 2.1 Neutral 305 25.7% 2.07 1.80 12.7 10.5 17.3% 18.4% 2.7% 2.8%
P/B P/E RoE RoA

Nomura | Dewan Housing Finance 17 June 2015
44
Our thesis in charts
Fig. 96: Fastest growing HFC – AUM CAGR of 45% aid consistent market share gains
Source: Company data, NHB, RBI, Nomura research
Fig. 97: Opportunities remain large especially with ~95% of the urban housing shortfall expected in LMI/EWS segment
Source: Ministry of Housing and Urban Poverty, Nomura research
Fig. 98: Recent rating upgrade should help cost of funds
Source: Company data, Nomura research estimates
Fig. 99: Funding cost to benefit from improving bond mix
Source: Company data, Nomura estimates
Fig. 100: While ROE remains inferior on higher leverage…
Source: Company data, Nomura estimates
Fig. 101: Current valuation looks reasonable
Source: Company data, Nomura estimates
15 23 33 42 5888
141
210
361
448
569
0.0%
0.5%
1.0%
1.5%
2.0%
2.5%
3.0%
3.5%
4.0%
4.5%
0
100
200
300
400
500
600
FY
05
FY
06
FY
07
FY
08
FY
09
FY
10
FY
11
FY
12
FY
13
FY
14
FY
15
AUM (INRbn)
Home loan market share - DHFL (RHS)
Economically weaker section56%
Lower / Middle income group,40%
Middle income group,
4%
Urban housing shortfall
Economically weaker section,
56%
FY11 FY12 FY13 FY14 FY15
Crisil AAA AAA AAA AAA AAA
CARE AAA AAA AAA AAA AAA
ICRA AAA AAA AAA AAA AAA
Crisil AAA AAA AAA AAA AAA
CARE AAA AAA AAA AAA AAA
Crisil AA AA AA AA AA+
CARE AA+ AA+ AA+ AA+ AAA
ICRA AA AA AA AA AA+
Dewan CARE AA+ AA+ AA+ AA+ AAA
Long term ratings
HDFC
LICHF
Indiabulls
13% 18% 17% 20% 28% 35% 40% 42%
9.3%
10.4%
11.0%
10.5%
10.1%
9.7%
9.3%9.1%
8.0%
8.5%
9.0%
9.5%
10.0%
10.5%
11.0%
11.5%
0%
5%
10%
15%
20%
25%
30%
35%
40%
45%
FY
11
FY
12
FY
13
FY
14
FY
15
FY
16F
FY
17F
FY
18F
Bond mix (LHS) Cost of funds (RHS)
20.3%
18.9%
22.1%
25.6%
19.6%
16.5%15.5%15.1%
16.1%15.8%15.6%
10%
12%
14%
16%
18%
20%
22%
24%
26%
28%
FY
08
FY
09
FY
10
FY
11
FY
12
FY
13
FY
14
FY
15
FY
16F
FY
17F
FY
18F
HDFC
LICHF
IHFL
DHFL
Repco
1.0%
1.5%
2.0%
2.5%
3.0%
3.5%
0.0x 1.0x 2.0x 3.0x 4.0x
RO
A
P/B

Nomura | Dewan Housing Finance 17 June 2015
45
Serving the underserved: one of the fastest-growing HFCs with a niche focus
DHFL is India’s fourth-largest player on total AUM (INR580bn) and third-largest player in
the home loan market after HDFC and LICHF with AUM of INR530bn in mortgage loans.
Its portfolio is concentrated towards traditional home loans (75%) and includes LAP
(18%) and developer loans (6%). DHFL is a niche player in the mortgage segment,
largely focusing on the LMI segment in tier-2/3 cities where the competition from private
banks and HFCs like HDFC/LICHF remains fairly limited.
Its borrowers are largely in the salaried segment and in the low/middle-income (LMI)
group where ticket sizes are in the range of INR0.4-1.5mn and the average income of
borrowers is in the range of INR10,000-35,000/month. Its experience in the real estate
market and superior underwriting ability has helped DHFL to deliver an AUM CAGR of
45% (42% CAGR excluding First Blue acquisition) over the past decade. It has
consistently gained market share over the past 4-5 years from 1% in FY08 to 4.1% now.
Fig. 102: DHFL: India’s third-largest (on mortgage book) HFC after HDFC/LICHF (FY15)
Source: Company data, Nomura research
Fig. 103: AUMs have had at a ~45% CAGR over the past decade, making DHFL one of the fastest-growing HFCs
Source: Company data, Nomura research
Fig. 104: Home loan market share trends – DHFL consistently gaining market share
Source: Company data, NHB, RBI Nomura research
1,808
1,056
529 397
89 60
0
200
400
600
800
1,000
1,200
1,400
1,600
1,800
2,000
HDFC LICHF DHFL IHFL GRUH Repco
(INRbn) AUM size
15 23 33 42 5888
141
210
361
448
569
0
100
200
300
400
500
600
FY
05
FY
06
FY
07
FY
08
FY
09
FY
10
FY
11
FY
12
FY
13
FY
14
FY
15
(INRmn)
Market share FY08 FY12 FY13 FY14 FY15
Incremental
market share -
FY08-12
Incremental
market share -
FY12-15
CAGR -
FY09-12
CAGR -
FY12-15
Private Banks 70.1% 64.4% 61.4% 60.9% 60.9% 56.5% 55.4% 12% 16%
ICICI Bank 18.2% 7.7% 6.3% 6.5% 7.0% -6.9% 6.0% -8% 15%
Axis Bank 2.1% 4.2% 4.7% 5.0% 5.2% 7.1% 6.7% 36% 27%
HDFC Bank 2.3% 2.2% 2.2% 2.3% 5.5% 2.4% 19%
Kotak Bank 0.7% 1.3% 1.4% 1.4% 1.4% 2.2% 1.5% 34% 21%
SBI 12.4% 16.4% 15.9% 15.8% 15.4% 22.2% 13.7% 23% 16%
Private banks ex- ICICI 51.9% 54.4% 52.9% 52.2% 51.5% 63.5% 49.4% 17% 16%
HFCs 29.9% 35.6% 38.6% 39.1% 39.1% 43.5% 44.6% 19% 22%
HDFC Ltd 13.3% 13.5% 13.9% 13.9% 13.8% 13.9% 14.2% 15% 19%
LIC Housing 5.7% 9.3% 9.6% 9.6% 9.7% 14.4% 10.3% 29% 20%
Dew an housing 1.0% 2.7% 4.0% 3.9% 4.1% 5.1% 6.3% 46% 36%
Indiabulls Financials 2.0% 2.1% 2.2% 2.5% 4.9% 3.3% 27%
Gruh Finance 0.5% 0.6% 0.7% 0.8% 0.9% 0.8% 1.2% 20% 32%
PNB Housing 0.6% 0.9% 1.2% 1.6% 1.5% 3.1% 62%
Repco 0.4% 0.4% 0.4% 0.5% 0.9% 0.6% 27%
Total M ortgage M arket 14% 18%
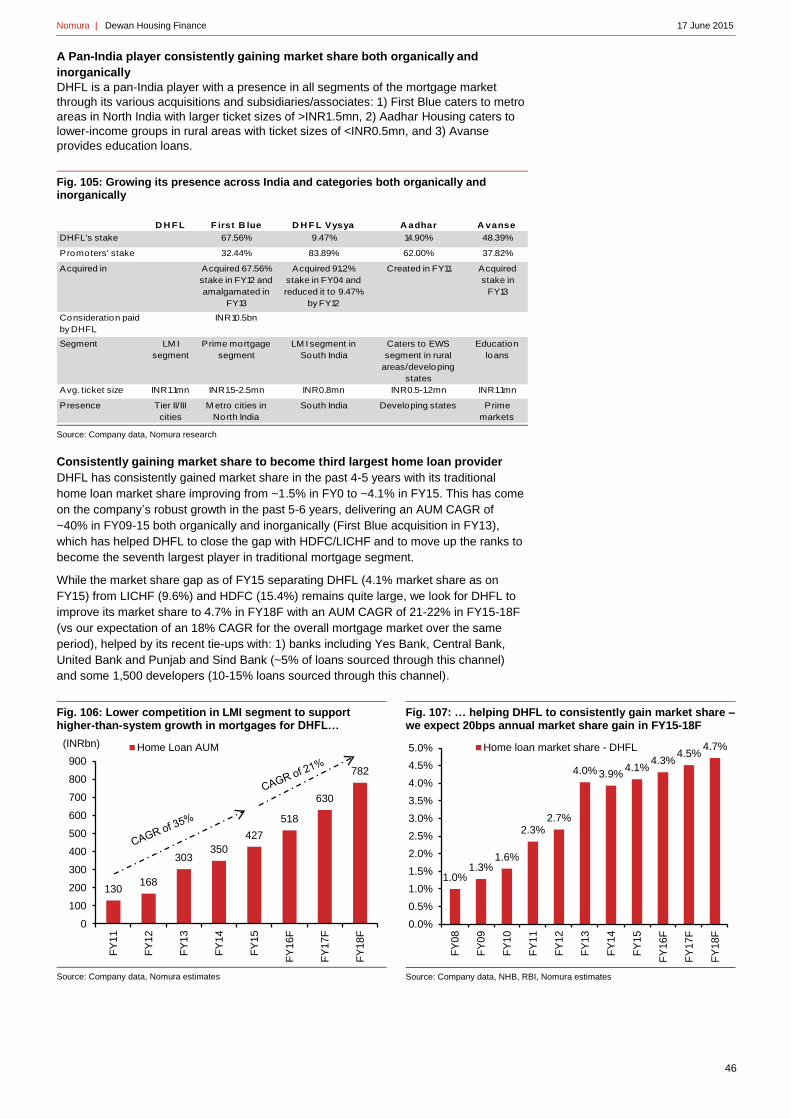
Nomura | Dewan Housing Finance 17 June 2015
46
A Pan-India player consistently gaining market share both organically and
inorganically
DHFL is a pan-India player with a presence in all segments of the mortgage market
through its various acquisitions and subsidiaries/associates: 1) First Blue caters to metro
areas in North India with larger ticket sizes of >INR1.5mn, 2) Aadhar Housing caters to
lower-income groups in rural areas with ticket sizes of <INR0.5mn, and 3) Avanse
provides education loans.
Fig. 105: Growing its presence across India and categories both organically and inorganically
Source: Company data, Nomura research
Consistently gaining market share to become third largest home loan provider
DHFL has consistently gained market share in the past 4-5 years with its traditional
home loan market share improving from ~1.5% in FY0 to ~4.1% in FY15. This has come
on the company’s robust growth in the past 5-6 years, delivering an AUM CAGR of
~40% in FY09-15 both organically and inorganically (First Blue acquisition in FY13),
which has helped DHFL to close the gap with HDFC/LICHF and to move up the ranks to
become the seventh largest player in traditional mortgage segment.
While the market share gap as of FY15 separating DHFL (4.1% market share as on
FY15) from LICHF (9.6%) and HDFC (15.4%) remains quite large, we look for DHFL to
improve its market share to 4.7% in FY18F with an AUM CAGR of 21-22% in FY15-18F
(vs our expectation of an 18% CAGR for the overall mortgage market over the same
period), helped by its recent tie-ups with: 1) banks including Yes Bank, Central Bank,
United Bank and Punjab and Sind Bank (~5% of loans sourced through this channel)
and some 1,500 developers (10-15% loans sourced through this channel).
Fig. 106: Lower competition in LMI segment to support higher-than-system growth in mortgages for DHFL…
Source: Company data, Nomura estimates
Fig. 107: … helping DHFL to consistently gain market share – we expect 20bps annual market share gain in FY15-18F
Source: Company data, NHB, RBI, Nomura estimates
D H F L F irst B lue D H F L Vysya A adhar A vanse
DHFL's stake 67.56% 9.47% 14.90% 48.39%
Promoters' stake 32.44% 83.89% 62.00% 37.82%
Acquired in Acquired 67.56%
stake in FY12 and
amalgamated in
FY13
Acquired 91.2%
stake in FY04 and
reduced it to 9.47%
by FY12
Created in FY11 Acquired
stake in
FY13
Consideration paid
by DHFL
INR10.5bn
Segment LM I
segment
Prime mortgage
segment
LM I segment in
South India
Caters to EWS
segment in rural
areas/developing
states
Education
loans
Avg. ticket size INR1.1mn INR1.5-2.5mn INR0.8mn INR0.5-1.2mn INR1.1mn
Presence Tier II/III
cities
M etro cities in
North India
South India Developing states Prime
markets
130168
303350
427
518
630
782
0
100
200
300
400
500
600
700
800
900
FY
11
FY
12
FY
13
FY
14
FY
15
FY
16F
FY
17F
FY
18F
(INRbn) Home Loan AUM
1.0%1.3%
1.6%
2.3%2.7%
4.0% 3.9%4.1%
4.3%4.5%
4.7%
0.0%
0.5%
1.0%
1.5%
2.0%
2.5%
3.0%
3.5%
4.0%
4.5%
5.0%
FY
08
FY
09
FY
10
FY
11
FY
12
FY
13
FY
14
FY
15
FY
16F
FY
17F
FY
18F
Home loan market share - DHFL
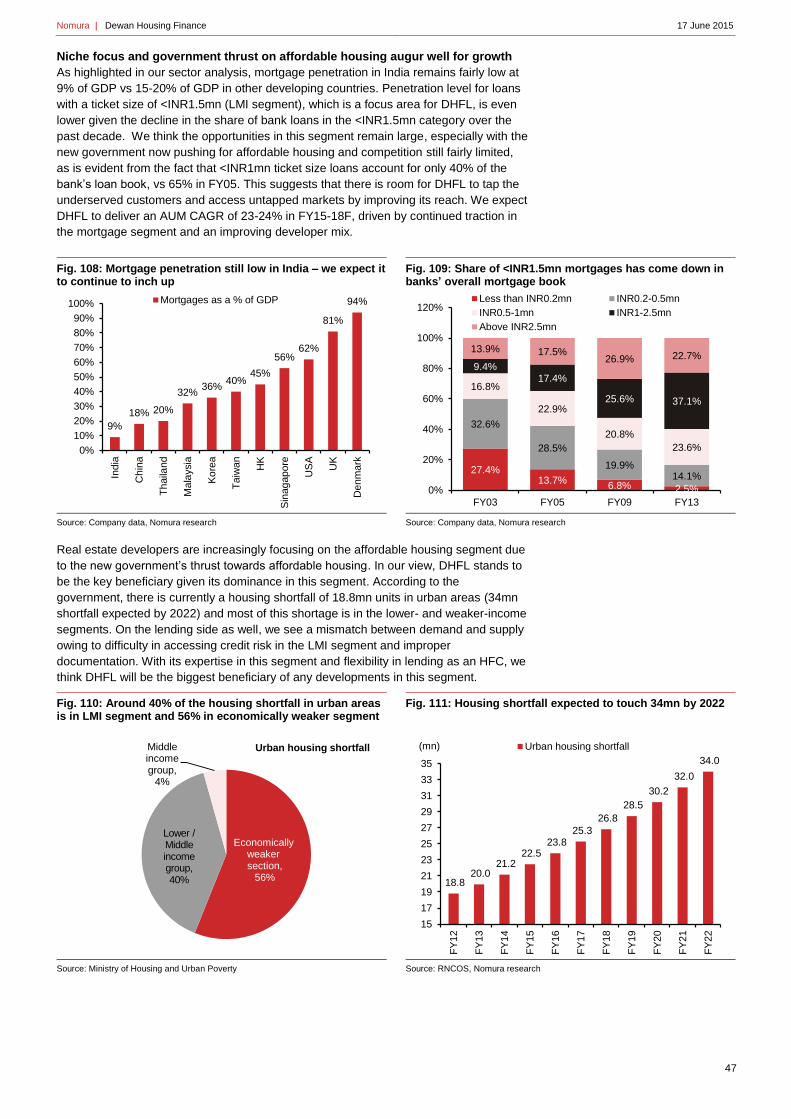
Nomura | Dewan Housing Finance 17 June 2015
47
Niche focus and government thrust on affordable housing augur well for growth As highlighted in our sector analysis, mortgage penetration in India remains fairly low at
9% of GDP vs 15-20% of GDP in other developing countries. Penetration level for loans
with a ticket size of <INR1.5mn (LMI segment), which is a focus area for DHFL, is even
lower given the decline in the share of bank loans in the <INR1.5mn category over the
past decade. We think the opportunities in this segment remain large, especially with the
new government now pushing for affordable housing and competition still fairly limited,
as is evident from the fact that <INR1mn ticket size loans account for only 40% of the
bank’s loan book, vs 65% in FY05. This suggests that there is room for DHFL to tap the
underserved customers and access untapped markets by improving its reach. We expect
DHFL to deliver an AUM CAGR of 23-24% in FY15-18F, driven by continued traction in
the mortgage segment and an improving developer mix.
Fig. 108: Mortgage penetration still low in India – we expect it to continue to inch up
Source: Company data, Nomura research
Fig. 109: Share of <INR1.5mn mortgages has come down in banks’ overall mortgage book
Source: Company data, Nomura research
Real estate developers are increasingly focusing on the affordable housing segment due
to the new government’s thrust towards affordable housing. In our view, DHFL stands to
be the key beneficiary given its dominance in this segment. According to the
government, there is currently a housing shortfall of 18.8mn units in urban areas (34mn
shortfall expected by 2022) and most of this shortage is in the lower- and weaker-income
segments. On the lending side as well, we see a mismatch between demand and supply
owing to difficulty in accessing credit risk in the LMI segment and improper
documentation. With its expertise in this segment and flexibility in lending as an HFC, we
think DHFL will be the biggest beneficiary of any developments in this segment.
Fig. 110: Around 40% of the housing shortfall in urban areas is in LMI segment and 56% in economically weaker segment
Source: Ministry of Housing and Urban Poverty
Fig. 111: Housing shortfall expected to touch 34mn by 2022
Source: RNCOS, Nomura research
9%
18% 20%
32%36%
40%45%
56%62%
81%
94%
0%
10%
20%
30%
40%
50%
60%
70%
80%
90%
100%
India
Chin
a
Thaila
nd
Mala
ysia
Ko
rea
Taiw
an
HK
Sin
ag
apore
US
A
UK
Denm
ark
Mortgages as a % of GDP
27.4%13.7%
6.8% 2.5%
32.6%
28.5%
19.9%14.1%
16.8%
22.9%
20.8%
23.6%
9.4%17.4%
25.6% 37.1%
13.9% 17.5%26.9% 22.7%
0%
20%
40%
60%
80%
100%
120%
FY03 FY05 FY09 FY13
Less than INR0.2mn INR0.2-0.5mn
INR0.5-1mn INR1-2.5mn
Above INR2.5mn
Economically weaker section56%
Lower / Middle income group,40%
Middle income group,
4%
Urban housing shortfall
Economically weaker section,
56%18.8
20.0 21.2
22.5 23.8
25.3
26.8
28.5
30.2
32.0
34.0
15
17
19
21
23
25
27
29
31
33
35
FY
12
FY
13
FY
14
FY
15
FY
16
FY
17
FY
18
FY
19
FY
20
FY
21
FY
22
(mn) Urban housing shortfall
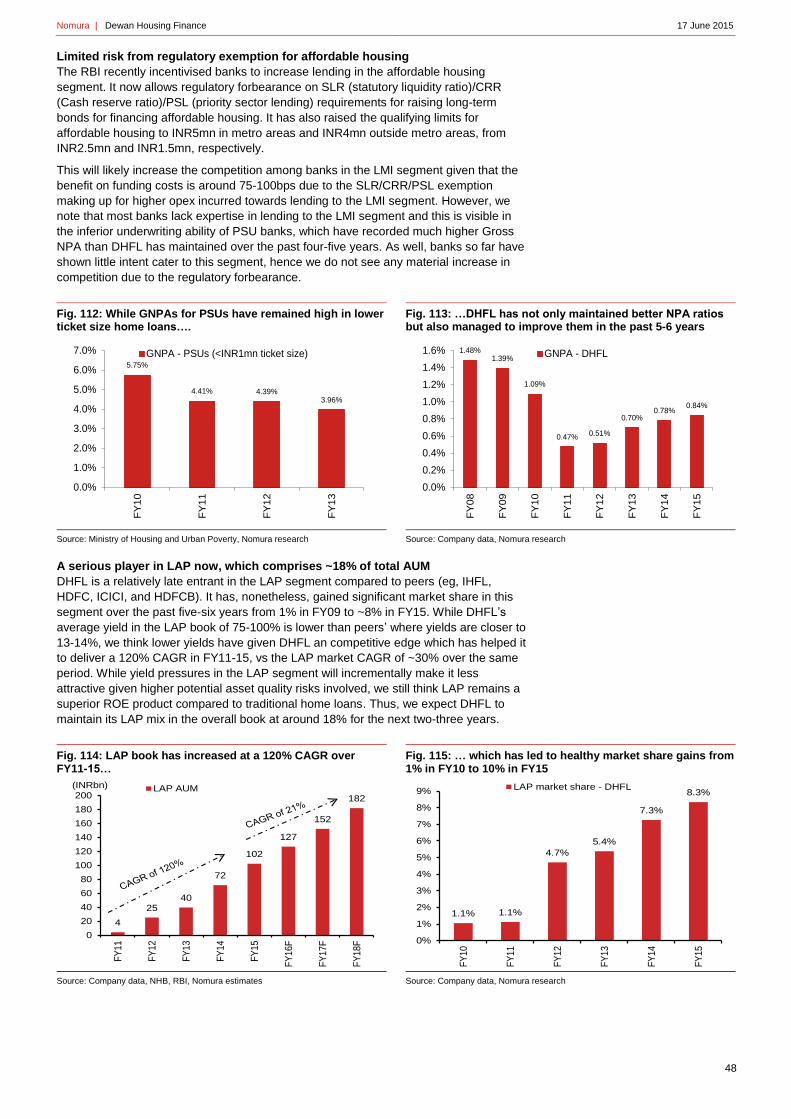
Nomura | Dewan Housing Finance 17 June 2015
48
Limited risk from regulatory exemption for affordable housing
The RBI recently incentivised banks to increase lending in the affordable housing
segment. It now allows regulatory forbearance on SLR (statutory liquidity ratio)/CRR
(Cash reserve ratio)/PSL (priority sector lending) requirements for raising long-term
bonds for financing affordable housing. It has also raised the qualifying limits for
affordable housing to INR5mn in metro areas and INR4mn outside metro areas, from
INR2.5mn and INR1.5mn, respectively.
This will likely increase the competition among banks in the LMI segment given that the
benefit on funding costs is around 75-100bps due to the SLR/CRR/PSL exemption
making up for higher opex incurred towards lending to the LMI segment. However, we
note that most banks lack expertise in lending to the LMI segment and this is visible in
the inferior underwriting ability of PSU banks, which have recorded much higher Gross
NPA than DHFL has maintained over the past four-five years. As well, banks so far have
shown little intent cater to this segment, hence we do not see any material increase in
competition due to the regulatory forbearance.
Fig. 112: While GNPAs for PSUs have remained high in lower ticket size home loans….
Source: Ministry of Housing and Urban Poverty, Nomura research
Fig. 113: …DHFL has not only maintained better NPA ratios but also managed to improve them in the past 5-6 years
Source: Company data, Nomura research
A serious player in LAP now, which comprises ~18% of total AUM
DHFL is a relatively late entrant in the LAP segment compared to peers (eg, IHFL,
HDFC, ICICI, and HDFCB). It has, nonetheless, gained significant market share in this
segment over the past five-six years from 1% in FY09 to ~8% in FY15. While DHFL’s
average yield in the LAP book of 75-100% is lower than peers’ where yields are closer to
13-14%, we think lower yields have given DHFL an competitive edge which has helped it
to deliver a 120% CAGR in FY11-15, vs the LAP market CAGR of ~30% over the same
period. While yield pressures in the LAP segment will incrementally make it less
attractive given higher potential asset quality risks involved, we still think LAP remains a
superior ROE product compared to traditional home loans. Thus, we expect DHFL to
maintain its LAP mix in the overall book at around 18% for the next two-three years.
Fig. 114: LAP book has increased at a 120% CAGR over FY11-15…
Source: Company data, NHB, RBI, Nomura estimates
Fig. 115: … which has led to healthy market share gains from 1% in FY10 to 10% in FY15
Source: Company data, Nomura research
5.75%
4.41% 4.39%3.96%
0.0%
1.0%
2.0%
3.0%
4.0%
5.0%
6.0%
7.0%
FY
10
FY
11
FY
12
FY
13
GNPA - PSUs (<INR1mn ticket size) 1.48%1.39%
1.09%
0.47%0.51%
0.70%0.78%
0.84%
0.0%
0.2%
0.4%
0.6%
0.8%
1.0%
1.2%
1.4%
1.6%
FY
08
FY
09
FY
10
FY
11
FY
12
FY
13
FY
14
FY
15
GNPA - DHFL
4
2540
72
102
127
152
182
0
20
40
60
80
100
120
140
160
180
200
FY
11
FY
12
FY
13
FY
14
FY
15
FY
16F
FY
17F
FY
18F
(INRbn) LAP AUM
1.1% 1.1%
4.7%
5.4%
7.3%
8.3%
0%
1%
2%
3%
4%
5%
6%
7%
8%
9%
FY
10
FY
11
FY
12
FY
13
FY
14
FY
15
LAP market share - DHFL

Nomura | Dewan Housing Finance 17 June 2015
49
Developer book small vs peers’; developer mix to improve but remain small
As compared to IHFL, which has a reasonable mix of high-yield LAP and developer
loans in its book, DHLF seems to be slowly getting there with its focus on garnering
higher yields. The developer mix for DHFL has increased from 3% in FY11 to 6%
currently. Despite its real estate background, DHFL has been slower in ramping up this
book. The reason for the lower share is that it focuses only on the developers in tier-2/3
cities where the competition and ticket sizes are fairly low, allowing it to demand better
rates at around 18-20%. To mitigate the higher risks, it only lends to builders where
projects are 30-40% completed and where the builder has put in enough equity to give
more comfort on execution risks. The average tenure due to this is lower at around 18-24
months as either the project gets completed sooner or the builder gets the loan
refinanced at cheaper rates from other lenders, thus increasing the run-downs in this
book. This in our view has also led to inferior builder book mix vs peers.
With recent tie-ups with developers and with the company now gaining enough expertise
in this segment and having started lending to new projects at early stages, we think
developer book will see healthy traction from here on. Also to mitigate falling yields in the
LAP book, we think the company will focus on this segment to support overall yields. We
expect builder book to increase from 6% currently of total loans to 9% by FY18F, but we
do not see this book becoming materially large at around ~20-25% of total loans like that
of HDFC/IHFL as run-downs will likely remain fairly high in this segment. Increase in
developer loans will also likely support growth in home loans as loan sourcing from
builder references will also improve going forward.
Fig. 116: Builder book mix for DHFL is very low compared to peer HFCs’
Source: Company data, Nomura research
Fig. 117: We expect some inch up in builder book mix which should help offset yield pressures in LAP
Source: Company data, Nomura estimates
8.5%
5.0%3.4% 3.0% 2.6%3.0%
6.0% 5.0% 6.0% 6.0%
21.0% 21.0% 21.0% 21.0% 22.0%
36.0% 35.6%33.5%
31.3% 30.3%
0%
5%
10%
15%
20%
25%
30%
35%
40%
FY11 FY12 FY13 FY14 FY15
LICHF DEWH IHFL HDFC
3.0%
6.0%
5.0%
6.0%
6.0%
6.5%8.0%
9.0%
2%
3%
4%
5%
6%
7%
8%
9%
10%
FY11 FY12 FY13 FY14 FY15 FY16F FY17F FY18F
Builder/corporate book mix

Nomura | Dewan Housing Finance 17 June 2015
50
Dewan’s cost of funds becoming competitive
Faced transition risk like any other mid-sized HFC: For any HFC, we think cost
competence comes when it is either a small company dependent on cheaper NHB
funding or when it graduates to a big HFC where higher proportion of its funding is from
is bonds. Mid-sized HFCs like Dewan face some transition risk when share of cheaper
NHB funding mix declines (NHB funding has declined from 9% in FY11 to 3% currently
for Dewan) and its share and cost of bond funding is not enough to compensate for the
cost increase due to lower NHB funding.
Fig. 118: NHB funding has been higher for smaller players (FY15)
Source: Company data, Nomura research
Fig. 119: NHB funding has been coming off as it grows in size
Source: Company data, Nomura research
But ratings upgrade coming in at the right time: Dewan was traditionally a weaker
liability franchise and that was visible in FY13 where it had to raise bonds at 13-15%
(300-400bps higher than HDFC/LICHF vs an avg spread of 100-150bps). Dewan
housing has now established a long enough track record of stable financial performance
leading to ratings upgrade and better acceptance of its bonds. Recent rating upgrades
(AA+ to AAA by CARE) have led to improvement in cost of funds where DHFL is now
raising NCDs at 70-80bps higher than HFDC/LICHF vs 100-120bps higher in FY13. In
our view, this will help DHFL to be more competitive in higher-ticket segments and also
help offset yield pressure in the LAP book. While bond mix at 28% of total funding is
lower as compared to peers, we expect this to improve to 42% by FY18.
Fig. 120: DHFL’s rating upgrade leading to significant improvement in funding profile
Source: Company data, Bloomberg, Nomura research
Fig. 121: Improving bond mix on rating upgrade to help reduce funding cost
Source: Company data, Nomura estimates
0.9%
3.6% 3.0%
19.7%
34.0%
0%
5%
10%
15%
20%
25%
30%
35%
40%
HDFC LICHF DHFL Repco GRUH
NHB funding mix9.0%
8.0%
7.0%
5.0%
3.0%
0%
1%
2%
3%
4%
5%
6%
7%
8%
9%
10%
FY
11
FY
12
FY
13
FY
14
FY
15
NHB funding mix
FY11 FY12 FY13 FY14 FY15
Crisil AAA AAA AAA AAA AAA
CARE AAA AAA AAA AAA AAA
ICRA AAA AAA AAA AAA AAA
Crisil AAA AAA AAA AAA AAA
CARE AAA AAA AAA AAA AAA
Crisil AA AA AA AA AA+
CARE AA+ AA+ AA+ AA+ AAA
ICRA AA AA AA AA AA+
Dewan CARE AA+ AA+ AA+ AA+ AAA
Long term ratings
HDFC
LICHF
Indiabulls
13% 18% 17% 20% 28% 35% 40% 42%
9.3%
10.4%
11.0%
10.5%
10.1%
9.7%
9.3%9.1%
8.0%
8.5%
9.0%
9.5%
10.0%
10.5%
11.0%
11.5%
0%
5%
10%
15%
20%
25%
30%
35%
40%
45%
FY
11
FY
12
FY
13
FY
14
FY
15
FY
16F
FY
17F
FY
18F
Bond mix (LHS) Cost of funds (RHS)

Nomura | Dewan Housing Finance 17 June 2015
51
Improving liability and asset mix to partly shield pressure in LAP yields LAP yields under pressure: LAP yields have been ~200-250bps higher than for
traditional mortgage loans in the past 4-5 years, has driven the improvement in yields for
Dewan. However, the yield gap of LAP vs mortgages has come off from 200-250bps in
the past 4-5 years to the current 100-150bps, and we think it can further converge to 75-
100bps going forward. While DHFL’s yield in the LAP segment is lower than that of peers
and it faces less competition in the <INR1.5mn loan category, overall spreads are likely
to remain under pressure given that LAP constitutes 18% of Dewan’s loan book.
But asset and liability mix improvement to offset yield pressure:
1) Improving asset mix: We think LAP remains a superior ROE product with a similar
asset quality experience as mortgages, and we expect Dewan to maintain its LAP share
in total AUM at around 17-18% from here on. We expect developer loan mix to gradually
improve from 6% to 9% by FY18F. Yields on this segment are significantly higher and
that should offset some pressure on margins from falling LAP yields. Overall, we expect
the non-retail portfolio to increase from 24% currently to 27% by FY18F, which should
help DHFL mitigate yield compression challenges to some extent.
Fig. 122: We expect LAP yields to compress further
Source: Company data, Nomura estimates
Fig. 123: But the non-retail book mix should improve, offsetting the yield pressure in LAP
Source: Company data, Nomura estimates
2) Liability mix to improve on recent rating upgrade: Recent rating upgrades (AA+ to
AAA by CARE) have led to improvement in cost of funds where DHFL is now raising
NCDs at 70-80bps higher than HFDC/LICHF vs 100-120bps higher in FY13. We expect
DHFL’s liability franchise to improve on the back of this with bond mix expected to
improve to 42% by FY18F from 28% currently which will further aid cost of funds.
Fig. 124: Improving liability mix to aid funding cost
Source: Company data, Nomura estimates
13-15%
11.75-13.75%
8%
9%
10%
11%
12%
13%
14%
15%
FY13 FY15
LAP yields
5% 6% 6% 7% 8% 9%
11%
16%18% 18%
18%18%
0%
5%
10%
15%
20%
25%
30%
FY13 FY14 FY15 FY16F FY17F FY18F
Builder book mix % LAP mix %
13% 18% 17% 20% 28% 35% 40% 42%
9.3%
10.4%
11.0%
10.5%
10.1%
9.7%
9.3%9.1%
8.0%
8.5%
9.0%
9.5%
10.0%
10.5%
11.0%
11.5%
0%
5%
10%
15%
20%
25%
30%
35%
40%
45%
FY
11
FY
12
FY
13
FY
14
FY
15
FY
16F
FY
17F
FY
18F
Bond mix (LHS) Cost of funds (RHS)

Nomura | Dewan Housing Finance 17 June 2015
52
Further ratings upgrade contingent on leverage coming down
While CARE recently upgraded Dewan’s rating from AA+ to AAA, DHFL’s leverage
remains high and in our view that is one key reason for it not being rated by CRISIL for
the long-term bonds. Its leverage is 11-12x, vs an average of 7-10x for peer HFCs.
Additionally it remains an inferior ROE company with higher growth prospects, which will
keep the leverage higher in our view. This remains a key concern for Dewan and we
think further rating upgrades will be difficult to come by unless it increases it equity base.
We are building in capital dilution of 15% in FY17F despite which the leverage will likely
remain high at 12-13x.
Fig. 125: DHFL’s leverage is higher than peers
Source: Company data, Nomura research
Fig. 126: Its low ROEs to keep the leverage high
Source: Company data, Nomura estimates
8.0
12.4 12.4
7.0 7.40
0
2
4
6
8
10
12
14
HDFC LICHF DHFL IHFL Repco
Leverage
19.8%
22.4%
26.4%
21.1%
17.1%15.5%
15.1%
16.2%
15.9%
16.6%
10%
12%
14%
16%
18%
20%
22%
24%
26%
28%
FY
09
FY
10
FY
11
FY
12
FY
13
FY
14
FY
15
FY
16F
FY
17F
FY
18F
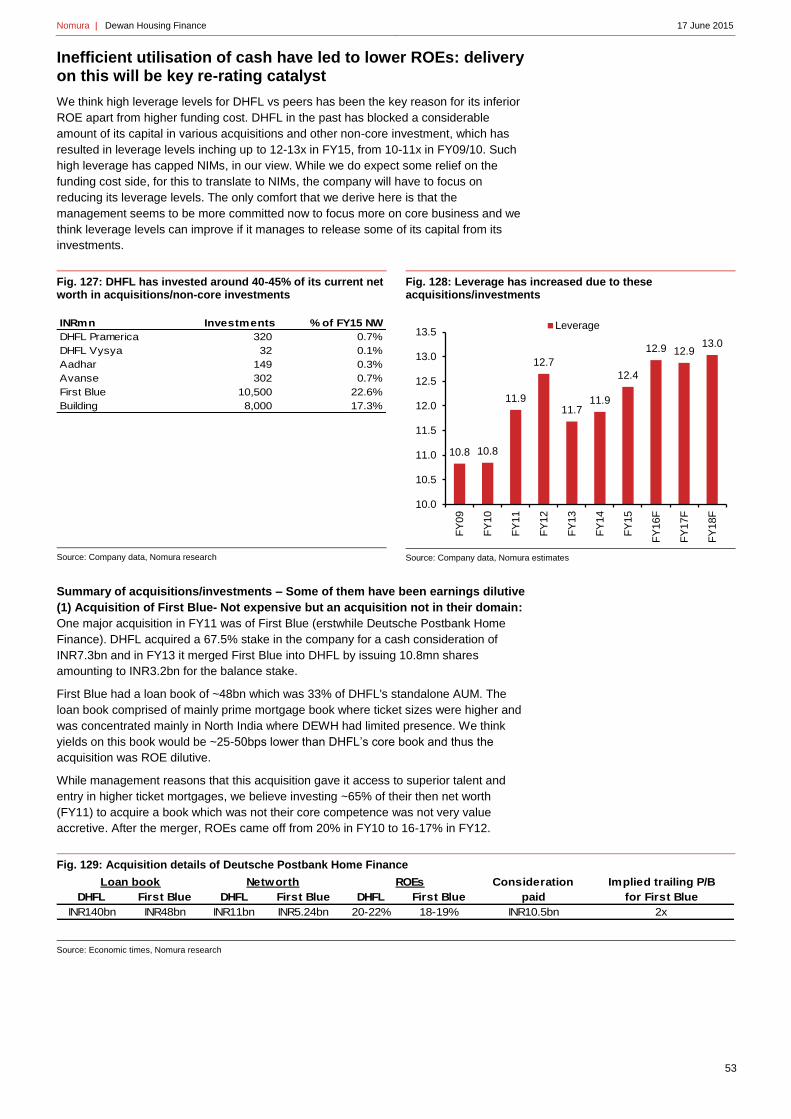
Nomura | Dewan Housing Finance 17 June 2015
53
Inefficient utilisation of cash have led to lower ROEs: delivery on this will be key re-rating catalyst
We think high leverage levels for DHFL vs peers has been the key reason for its inferior
ROE apart from higher funding cost. DHFL in the past has blocked a considerable
amount of its capital in various acquisitions and other non-core investment, which has
resulted in leverage levels inching up to 12-13x in FY15, from 10-11x in FY09/10. Such
high leverage has capped NIMs, in our view. While we do expect some relief on the
funding cost side, for this to translate to NIMs, the company will have to focus on
reducing its leverage levels. The only comfort that we derive here is that the
management seems to be more committed now to focus more on core business and we
think leverage levels can improve if it manages to release some of its capital from its
investments.
Fig. 127: DHFL has invested around 40-45% of its current net worth in acquisitions/non-core investments
Source: Company data, Nomura research
Fig. 128: Leverage has increased due to these acquisitions/investments
Source: Company data, Nomura estimates
Summary of acquisitions/investments – Some of them have been earnings dilutive
(1) Acquisition of First Blue- Not expensive but an acquisition not in their domain:
One major acquisition in FY11 was of First Blue (erstwhile Deutsche Postbank Home
Finance). DHFL acquired a 67.5% stake in the company for a cash consideration of
INR7.3bn and in FY13 it merged First Blue into DHFL by issuing 10.8mn shares
amounting to INR3.2bn for the balance stake.
First Blue had a loan book of ~48bn which was 33% of DHFL's standalone AUM. The
loan book comprised of mainly prime mortgage book where ticket sizes were higher and
was concentrated mainly in North India where DEWH had limited presence. We think
yields on this book would be ~25-50bps lower than DHFL’s core book and thus the
acquisition was ROE dilutive.
While management reasons that this acquisition gave it access to superior talent and
entry in higher ticket mortgages, we believe investing ~65% of their then net worth
(FY11) to acquire a book which was not their core competence was not very value
accretive. After the merger, ROEs came off from 20% in FY10 to 16-17% in FY12.
Fig. 129: Acquisition details of Deutsche Postbank Home Finance
Source: Economic times, Nomura research
INRmn Investments % of FY15 NW
DHFL Pramerica 320 0.7%
DHFL Vysya 32 0.1%
Aadhar 149 0.3%
Avanse 302 0.7%
First Blue 10,500 22.6%
Building 8,000 17.3%
10.8 10.8
11.9
12.7
11.711.9
12.4
12.9 12.913.0
10.0
10.5
11.0
11.5
12.0
12.5
13.0
13.5
FY
09
FY
10
FY
11
FY
12
FY
13
FY
14
FY
15
FY
16F
FY
17F
FY
18F
Leverage
Consideration Implied trailing P/B
DHFL First Blue DHFL First Blue DHFL First Blue paid for First Blue
INR140bn INR48bn INR11bn INR5.24bn 20-22% 18-19% INR10.5bn 2x
Loan book Networth ROEs

Nomura | Dewan Housing Finance 17 June 2015
54
Fig. 130: ROEs in FY11-13 saw significant impact from acquisition of First Blue
Source: Company data, Nomura estimates
(2) Invested INR8bn (17-18% of FY15 NW) in construction of office building over
FY12-15 –Unjustifiable in our view
DHFL invested 17-18% of its equity into the construction of an office building for its own
use, while we think it could have easily leased a building and not blocked so much of its
capital. It has already spent INR8bn on construction in the past three years and we think
the cost already incurred is c.INR23,000/sq ft. Management indicated that the building
will be completed in the next two-three years and the company will not incur any material
cost on it going forward. The only comforting factor here is that management is already
considering selling and leasing back the building which will release much needed capital.
(3) Better deal on insurance acquisition
The company acquired a 50% stake in DLF Pramerica Life Insurance in FY12 for only
INR1 and DHFL’s promoters acquired another 24% stake for INR326mn. Thereafter,
DHFL infused INR320mn. The company is already making profits of INR400mn (FY15)
and may also start paying dividends by FY16. We think this was a good acquisition
especially considering that it paid almost nothing for it.
With the FDI limits now increased to 49%, DHFL can look to sell part of its stake to a
foreign partner which may also release some capital and lead to some windfall gains.
The company is still considering options to monetise it, which should be a positive as we
are not adding any value of the insurance business to our TP.
Our back of envelope calculation, suggest a valuation of INR15bn for the insurance
company applying same NBP multiple/margins as the larger insurers. A 50% stake of
DHFL implies a value of ~INR45/share which we have not included in our TP and will
offer further upside in case management is able to offload their stake or build this
business profitably.
Fig. 131: Back of the envelope valuation for Insurance business
Source: Nomura estimates
20.3%
18.9%
22.1%
25.6%
19.6%
16.5%15.5% 15.1%
16.1% 15.8% 15.6%
10%
12%
14%
16%
18%
20%
22%
24%
26%
28%
FY
08
FY
09
FY
10
FY
11
FY
12
FY
13
FY
14
FY
15
FY
16F
FY
17F
FY
18F
DHFL Pramerica - Back of the envelope valuation
Appraisal Value (INRmn) 14,977
EV (INRmn) 8,673
Value of future business (INRmn) 6,305
P/NBAP (ex-EV)- FY18 15.6
P/EV 1.73
EV (% of AV) 57.9%
DHFL's stake in insurance business 50%
Contribution to DHFL (INR/share) 45

Nomura | Dewan Housing Finance 17 June 2015
55
Inefficient use of cash has led to frequent dilutions
On account of such frequent acquisitions and investing in non-core assets like the office
building, the company has faced frequent capital dilution. The company raised INR2.3bn
in FY10 (25% dilution), INR3.8bn in FY11 (20% dilution) and INR8.1bn in FY15 (13%
dilution). Apart from the fact that such use of capital reduced profitability of the company,
it has also seen its ROE moderate to 15% now, from ~20% pre FY11, despite leverage
inching up to 12-13x currently, from 10-11x in FY10. This has turned the company into
the highest levered HFC with leverage of 10-11x vs 7-10x for peers, despite its recent
capital infusion in 4QFY15 of INR8bn.
Fig. 132: Frequent dilutions have capped ROE at under 17% in the past 3-4 years
Source: Company data, Nomura research
2.26 3.75 8.10
25.2%
19.8%
13.2%
0%
5%
10%
15%
20%
25%
30%
0.0
1.0
2.0
3.0
4.0
5.0
6.0
7.0
8.0
9.0
FY10 FY11 FY12 FY13 FY14 FY15
(INRbn) Capital raised (LHS) % equity dilution (RHS)
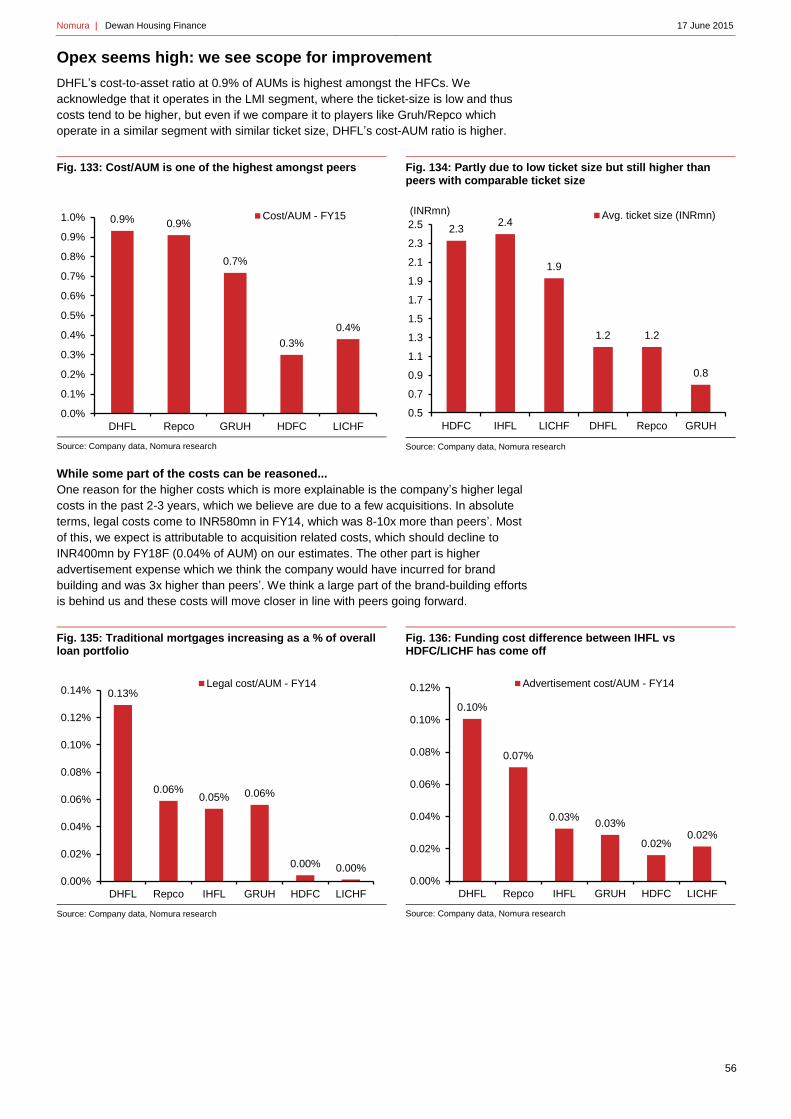
Nomura | Dewan Housing Finance 17 June 2015
56
Opex seems high: we see scope for improvement
DHFL’s cost-to-asset ratio at 0.9% of AUMs is highest amongst the HFCs. We
acknowledge that it operates in the LMI segment, where the ticket-size is low and thus
costs tend to be higher, but even if we compare it to players like Gruh/Repco which
operate in a similar segment with similar ticket size, DHFL’s cost-AUM ratio is higher.
Fig. 133: Cost/AUM is one of the highest amongst peers
Source: Company data, Nomura research
Fig. 134: Partly due to low ticket size but still higher than peers with comparable ticket size
Source: Company data, Nomura research
While some part of the costs can be reasoned...
One reason for the higher costs which is more explainable is the company’s higher legal
costs in the past 2-3 years, which we believe are due to a few acquisitions. In absolute
terms, legal costs come to INR580mn in FY14, which was 8-10x more than peers’. Most
of this, we expect is attributable to acquisition related costs, which should decline to
INR400mn by FY18F (0.04% of AUM) on our estimates. The other part is higher
advertisement expense which we think the company would have incurred for brand
building and was 3x higher than peers’. We think a large part of the brand-building efforts
is behind us and these costs will move closer in line with peers going forward.
Fig. 135: Traditional mortgages increasing as a % of overall loan portfolio
Source: Company data, Nomura research
Fig. 136: Funding cost difference between IHFL vs HDFC/LICHF has come off
Source: Company data, Nomura research
0.9% 0.9%
0.7%
0.3%
0.4%
0.0%
0.1%
0.2%
0.3%
0.4%
0.5%
0.6%
0.7%
0.8%
0.9%
1.0%
DHFL Repco GRUH HDFC LICHF
Cost/AUM - FY15
2.32.4
1.9
1.2 1.2
0.8
0.5
0.7
0.9
1.1
1.3
1.5
1.7
1.9
2.1
2.3
2.5
HDFC IHFL LICHF DHFL Repco GRUH
(INRmn) Avg. ticket size (INRmn)
0.13%
0.06%0.05% 0.06%
0.00% 0.00%
0.00%
0.02%
0.04%
0.06%
0.08%
0.10%
0.12%
0.14%
DHFL Repco IHFL GRUH HDFC LICHF
Legal cost/AUM - FY14
0.10%
0.07%
0.03%0.03%
0.02%0.02%
0.00%
0.02%
0.04%
0.06%
0.08%
0.10%
0.12%
DHFL Repco IHFL GRUH HDFC LICHF
Advertisement cost/AUM - FY14

Nomura | Dewan Housing Finance 17 June 2015
57
… we still think there is scope for further improvement
Excluding legal and advertisement costs, we still think the costs remain high compared
with peers which operate in similar segments given that at such an AUM size, operating
leverage should have started flowing through. We factor in ~10bps improvement in cost
to assets for Dewan largely from lower legal/advertising expenses and any further
reduction in cost will be positive surprise vs our estimates.
Fig. 137: Opex remains high even after excluding legal and advertisement expense
Source: Company data, Nomura research
Fig. 138: We are building in only a 10bp improvement in opex/AUM by FY18F
Source: Company data, Nomura estimates
0.71%
0.54%0.52%
0.35%
0.29%
0.0%
0.1%
0.2%
0.3%
0.4%
0.5%
0.6%
0.7%
0.8%
DHFL GRUH Repco LICHF HDFC
Opex/AUM (excl. legal and ad spends) - FY14
1.42%
1.57%
1.76%
1.48%
0.99%0.94%
0.93%0.89%0.85%
0.82%
0.0%
0.2%
0.4%
0.6%
0.8%
1.0%
1.2%
1.4%
1.6%
1.8%
2.0%
FY
09
FY
10
FY
11
FY
12
FY
13
FY
14
FY
15
FY
16F
FY
17F
FY
18F
Opex/AUM
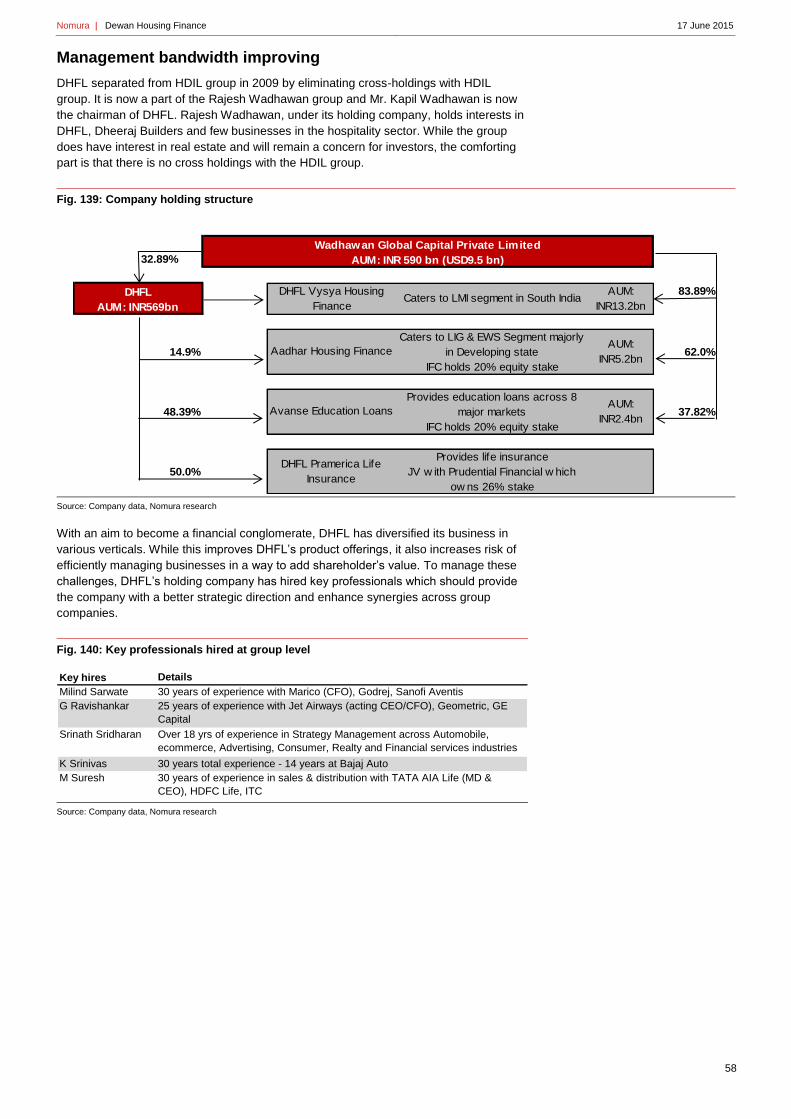
Nomura | Dewan Housing Finance 17 June 2015
58
Management bandwidth improving
DHFL separated from HDIL group in 2009 by eliminating cross-holdings with HDIL
group. It is now a part of the Rajesh Wadhawan group and Mr. Kapil Wadhawan is now
the chairman of DHFL. Rajesh Wadhawan, under its holding company, holds interests in
DHFL, Dheeraj Builders and few businesses in the hospitality sector. While the group
does have interest in real estate and will remain a concern for investors, the comforting
part is that there is no cross holdings with the HDIL group.
Fig. 139: Company holding structure
Source: Company data, Nomura research
With an aim to become a financial conglomerate, DHFL has diversified its business in
various verticals. While this improves DHFL’s product offerings, it also increases risk of
efficiently managing businesses in a way to add shareholder’s value. To manage these
challenges, DHFL’s holding company has hired key professionals which should provide
the company with a better strategic direction and enhance synergies across group
companies.
Fig. 140: Key professionals hired at group level
Source: Company data, Nomura research
32.89%
83.89%
14.9% 62.0%
48.39% 37.82%
50.0%
Caters to LIG & EWS Segment majorly
in Developing state
IFC holds 20% equity stake
AUM:
INR5.2bn
Wadhawan Global Capital Private Limited
AUM: INR 590 bn (USD9.5 bn)
DHFL
AUM: INR569bn
DHFL Vysya Housing
FinanceCaters to LMI segment in South India
AUM:
INR13.2bn
Aadhar Housing Finance
Avanse Education Loans
Provides education loans across 8
major markets
IFC holds 20% equity stake
AUM:
INR2.4bn
DHFL Pramerica Life
Insurance
Provides life insurance
JV w ith Prudential Financial w hich
ow ns 26% stake
Key hires Details
Milind Sarwate 30 years of experience with Marico (CFO), Godrej, Sanofi Aventis
G Ravishankar 25 years of experience with Jet Airways (acting CEO/CFO), Geometric, GE
Capital
Srinath Sridharan Over 18 yrs of experience in Strategy Management across Automobile,
ecommerce, Advertising, Consumer, Realty and Financial services industries
K Srinivas 30 years total experience - 14 years at Bajaj Auto
M Suresh 30 years of experience in sales & distribution with TATA AIA Life (MD &
CEO), HDFC Life, ITC

Nomura | Dewan Housing Finance 17 June 2015
59
Cheapest mortgage play: further re-rating likely but contingent on efficient utilisation of cashflows
At ~0.9x FY17F P/B, DHFL is trading at a significant discount to peer HFCs trading at 2-
3x and comparable niche players like Gruh and Repco trading above 3x. Admittedly,
DHFL’s FY16/17F ROE of ~16% is far weaker than peer ROEs of 20-25%, but we still
think the valuation is inexpensive considering our expectations of significant growth
opportunities in the LMI segment and very limited asset quality risks.
Moreover, falling funding costs on the recent rating upgrade and improving bond mix will
likely net off the yield pressures in the LAP book and may lead to some improvement in
NIMs, albeit the benefit will likely be capped by increasing leverage. As well,
management now seems more committed to improve operational efficiencies and a large
part of the cost differential (legal and advertisement cost) is now in the past and should
improve going forward.
We value Dewan Housing at 1.25x FY17F book (INR419) and initiate coverage with a TP
of INR525, with implied upside of 35%. DHFL remains one of the cheapest HFCs at
~0.9x FY17F book. We expect DHFL to re-rate given its +23% CAGR and benign
liquidity conditions. While in the past 12 months, DHFL has re-rated from ~0.7x to ~0.9x
book, the re-rating should continue with improving funding mix/cost and efficient
utilisation of cash.
Fig. 141: ROEs to remain subdued on the back of capital dilution assumed in FY17F
Source: Company data, Nomura estimates
Fig. 142: Initiate with a TP of INR525
Source: Nomura estimates
Fig. 143: Our TP implies 1.25x FY17F book for an ROE of 16%
Source: Company data, Bloomberg, Nomura estimates
ROE Decomposition (on AUM) FY09 FY10 FY11 FY12 FY13 FY14 FY15 FY16F FY17F FY18F
Net Interest Income/Assets 2.98% 2.81% 3.13% 2.26% 2.20% 2.19% 2.48% 2.55% 2.52% 2.59%
Fees/Assets 0.33% 1.03% 1.03% 1.06% 0.65% 0.57% 0.36% 0.33% 0.31% 0.28%
Investment profits/Assets 0.71% 0.64% 0.74% 0.60% 0.27% 0.17% 0.15% 0.14% 0.13% 0.12%
Net revenues/Assets 4.03% 4.47% 4.90% 3.92% 3.12% 2.93% 2.99% 3.02% 2.95% 2.99%
Operating Expense/Assets 1.42% 1.57% 1.76% 1.48% 0.99% 0.94% 0.93% 0.89% 0.85% 0.82%
Provisions/Assets 0.12% 0.12% 0.15% 0.20% 0.15% 0.17% 0.21% 0.25% 0.25% 0.25%
Taxes/Assets 0.66% 0.72% 0.78% 0.57% 0.52% 0.51% 0.63% 0.63% 0.62% 0.65%
Total Costs/Assets 2.20% 2.40% 2.68% 2.25% 1.65% 1.62% 1.77% 1.77% 1.72% 1.71%
ROA 1.83% 2.07% 2.21% 1.67% 1.47% 1.31% 1.22% 1.25% 1.23% 1.28%
Equity/AUM 9.90% 11.58% 10.69% 8.95% 10.52% 8.84% 9.12% 8.19% 8.91% 8.18%
ROE 19.8% 22.4% 26.4% 21.1% 17.1% 15.5% 15.1% 16.2% 15.9% 16.6%
Cost of Equity 14.5%
Terminal grow th 5.0%
Normalised ROE 17.3%
Stage 2 grow th 15.0%
Mar-16 PT 525
Implied Mar-17 P/B 1.25
Implied Mar-17 P/E 9.1
Valuation assumption
0.4
0.6
0.8
1.0
1.2
1.4
1.6
1.8
2.0
2.2
Ap
r-08
Au
g-0
8
Dec-0
8
Ap
r-09
Au
g-0
9
Dec-0
9
Ap
r-10
Au
g-1
0
Dec-1
0
Ap
r-11
Au
g-1
1
Dec-1
1
Ap
r-12
Au
g-1
2
Dec-1
2
Ap
r-13
Au
g-1
3
Dec-1
3
Ap
r-14
Au
g-1
4
Dec-1
4
Ap
r-15
DEWH

Nomura | Dewan Housing Finance 17 June 2015
60
Risks
• Disappointment on utilization of cash: As highlighted earlier, this has been the
biggest disappointment for investors and we think any material re-rating is contingent
on the company not utilising cash in acquisitions/non-core investments going forward.
• Unfavourable wholesale funding environment: Apart from the structural growth
opportunity, our positive view on HFCs is based on a favourable wholesale rate
environment. We believe that corporate loan growth will pick up gradually, hence the
system liquidity and wholesale funding environment should remain comfortable. A spike
in wholesale rates would be a risk to our view on overall HFCs and for DHFL.
• Higher-than-expected contraction in LAP yields: LAP yields have come off by
~100bps and we expect further 100bps contraction in LAP yields over FY15-18F. LAP
is an attractive product from a risk-adjusted return perspective and competition will
likely increase and given DHFL’s higher share of LAP, lower LAP yields remain a risk.
• Lumpy asset quality risk in builder portfolio: DHFL’s builder book is still very small
but as it builds up there will be lumpy risks that can be added to the book and since
DHFL is relatively new in this segment, it may lack the necessary underwriting skills to
the extent that it has demonstrated in the mortgage book.
• Small bank license: DHFL has applied for a small bank license with an aspiration to
become a full-fledged financial institution, from a mortgage lender. If DHFL gets the
license, the business model will completely change for DHFL and we are not sure if it
has the management bandwidth or competence to successfully run a small bank where
profitability remains a key concern at the moment due to its high cost structure.

Rating Up from Neutral Buy
Target price Remains INR 500
Closing price 15 June 2015 INR 395
Potential upside +26.6%
Anchor themes
Mortgages remain a structural story from a growth perspective. Cyclically the domestic rate environment remains favourable for HFCs and banks' ability to compete on pricing is lower than in the previous cycle (FY09-10).
Nomura vs consensus
Our FY16/17F PAT estimates are broadly in line with consensus.
Research analysts
India Financials
Adarsh Parasrampuria - NFASL [email protected] +91 22 4037 4034
Amit Nanavati - NFASL [email protected] +91 22 4037 4361
LIC Housing Finance LICH.NS LICHF IN
EQUITY: FINANCIALS
Valuations now undemanding; upgrade to Buy
A beneficiary of lower wholesale costs; mortgage pricing unlikely to become irrational
Action: Upgrade to Buy; TP maintained at INR500
LICHF remains one of the best beneficiaries of a falling rate environment; we
think the recent 16-18% correction has made its valuations reasonable. Thus,
we upgrade to Buy (from Neutral). While competition should remain intense,
we believe the ability of PSU banks to cut base/ mortgage rates is low vs. the
2009 cycle, given the current weak profitability of PSU banks. We look for
spreads to rise by ~15bps over the next two years and help ROEs sustain at
20%. Any significant improvement in the builder and LAP book proportion
would provide further upside.
Mortgage pricing less irrational this time: While the falling wholesale
cost of funding is good for HFCs, lower interest costs may also lead to a
2009-like intense competition in mortgages. While banks, especially PSUs,
are re-orienting their focus to mortgages, their weak profitability will likely
restrict their ability to cut base and mortgage rates, as in 2009. Thus, we
expect mortgage pricing to remain rational. LICHF should record 15bps
improvement in loan spreads over FY15-18F driven by the lower cost of
funds and some upward re-pricing in legacy fixed loans.
Well-positioned: Internal catalysts mostly positive: In 2010, LICHF
wrote a lot of fixed rate mortgages, and with wholesale funding costs
moving higher, margins in 2012 were negatively impacted. Currently LICHF
is uniquely placed with 60% of its assets being fixed in nature in a falling
rate environment and part of the fixed loans is likely to be repriced upward.
In addition, LICHF's builder-book proportion is currently at a historical low
(2.5% of loans) and there could only be a positive catalyst from these levels.
Valuations look reasonable at 1.9x book (BVPS: INR212); up to Buy
We expect ROEs to inch up to 20% by FY17F, driven by ~15bps rise in loan
spreads, and valuations at 1.9x book look reasonable after the recent
correction; hence, we upgrade LICHF to Buy. We do not see any risk of
irrational pricing in mortgages and change in loan mix (LAP + builder book
share) can only aid margins from here on.
Year-end 31 Mar FY15
FY16F
FY17F
FY18F
Currency (INR) Actual Old New Old New Old New
PPOP (mn) 21,092 27,014 26,032 32,034 30,622
35,742
Reported net profit (mn) 13,862 17,755 16,793 21,049 19,743
23,025
Normalised net profit (mn) 13,862 17,755 16,793 21,049 19,743
23,025
FD normalised EPS 27.45 35.16 33.26 41.68 39.10
45.60
FD norm. EPS growth (%) 5.2 24.3 21.1 18.5 17.6
16.6
FD normalised P/E (x) 14.4 N/A 11.9 N/A 10.1 N/A 8.7
Price/adj. book (x) 2.6 N/A 2.2 N/A 1.9 N/A 1.6
Price/book (x) 2.6 N/A 2.2 N/A 1.9 N/A 1.6
Dividend yield (%) 1.3 N/A 1.5 N/A 1.8 N/A 2.1
ROE (%) 18.1 19.0 19.8 19.4 19.9
19.9
ROA (%) 1.3 1.4 1.4 1.4 1.3
1.3
Source: Company data, Nomura estimates
Global Markets Research
17 June 2015
See Appendix A-1 for analyst certification, important disclosures and the status of non-US analysts.

Nomura | LIC Housing Finance 17 June 2015
62
Key data on LIC Housing Finance Relative performance chart
Source: Thomson Reuters, Nomura research
Notes:
Performance (%) 1M 3M 12M
Absolute (INR) -5.9 -11.6 28.4 M cap (USDmn) 3,110.3
Absolute (USD) -6.6 -13.0 19.6 Free float (%) 90.3
Rel to MSCI India -1.7 -1.6 24.8 3-mth ADT (USDmn) 17.1
Profit and loss (INRmn) Year-end 31 Mar FY14 FY15 FY16F FY17F FY18F
Interest income 90,903 105,587 123,385 145,879 175,032
Interest expense -71,744 -83,102 -95,957 -113,512 -137,268
Net interest income 19,158 22,485 27,428 32,367 37,764
Net fees and commissions 2,444 2,399 3,003 3,379 3,952
Trading related profits 0 0 0 0 0
Other operating revenue 0 0 0 0 0
Non-interest income 2,444 2,399 3,003 3,379 3,952
Operating income 21,602 24,884 30,431 35,745 41,716
Depreciation -76 -94 -103 -113 -125
Amortisation
Operating expenses -2,018 -2,405 -2,809 -3,300 -3,882
Employee share expense -1,038 -1,293 -1,487 -1,710 -1,967
Pre-provision op profit 18,470 21,092 26,032 30,622 35,742
Provisions for bad debt -215 -73 -714 -857 -1,028
Other provision charges 0 0 0 0 0
Operating profit 18,255 21,019 25,318 29,765 34,713
Other non-op income
Associates & JCEs
Pre-tax profit 18,255 21,019 25,318 29,765 34,713
Income tax -5,083 -7,158 -8,524 -10,022 -11,688
Net profit after tax 13,172 13,862 16,793 19,743 23,025
Minority interests
Other items
Preferred dividends
Normalised NPAT 13,172 13,862 16,793 19,743 23,025
Extraordinary items 0 0 0 0 0
Reported NPAT 13,172 13,862 16,793 19,743 23,025
Dividends -2,656 -2,954 -3,579 -4,207 -4,907
Transfer to reserves 10,516 10,908 13,214 15,535 18,118
Growth (%)
Net interest income 24.6 17.4 22.0 18.0 16.7
Non-interest income 32.1 -1.8 25.2 12.5 17.0
Non-interest expenses 9.7 19.2 16.8 17.5 17.6
Pre-provision earnings 28.2 14.2 23.4 17.6 16.7
Net profit 30.2 5.2 21.1 17.6 16.6
Normalised EPS 30.2 5.2 21.1 17.6 16.6
Normalised FDEPS 30.2 5.2 21.1 17.6 16.6
Loan growth 17.4 18.6 19.8 20.1 19.9
Interest earning assets 17.4 18.6 19.8 20.1 19.9
Interest bearing liabilities 19.3 17.7 20.9 21.1 20.8
Asset growth 18.9 16.8 19.9 20.1 19.9
Deposit growth na na na na na
Source: Company data, Nomura estimates
Balance sheet (INRmn) As at 31 Mar FY14 FY15 FY16F FY17F FY18F
Cash and equivalents 6,793 6,758 8,168 9,890 11,948
Inter-bank lending
Deposits with central bank
Total securities
Other int earning assets
Gross loans 915,963 1,086,210 1,301,350 1,563,394 1,875,567
Less provisions -2,554 -2,603 -3,572 -4,285 -6,856
Net loans 913,409 1,083,607 1,297,778 1,559,109 1,868,712
Long-term investments 25,442 25,640 31,506 36,736 44,377
Fixed assets 756 797 792 868 950
Goodwill
Other intangible assets
Other non IEAs 11,370 1,959 2,935 4,539 6,483
Total assets 957,770 1,118,761 1,341,179 1,611,142 1,932,469
Customer deposits 0 0 0 0 0
Bank deposits, CDs,
debentures
820,356 965,470 1,166,897 1,412,924 1,706,807
Other int bearing liabilities 0 0 0 0 0
Total int bearing liabilities 820,356 965,470 1,166,897 1,412,924 1,706,807
Non-int bearing liabilities 62,085 75,106 82,884 91,284 100,610
Total liabilities 882,441 1,040,576 1,249,781 1,504,208 1,807,417
Minority interest
Common stock 1,010 1,010 1,010 1,010 1,010
Preferred stock
Retained earnings 74,319 77,174 90,389 105,924 124,043
Reserves for credit losses
Proposed dividends
Other equity
Shareholders' equity 75,329 78,184 91,399 106,934 125,053
Total liabilities and equity 957,770 1,118,761 1,341,179 1,611,142 1,932,469
Non-perf assets 6,090 4,947 7,144 9,999 13,711
Balance sheet ratios (%)
Loans to deposits na na na na na
Equity to assets 7.9 7.0 6.8 6.6 6.5
Asset quality & capital
NPAs/gross loans (%) 0.7 0.5 0.5 0.6 0.7
Bad debt charge/gross
loans (%)
0.02 0.01 0.05 0.05 0.05
Loss reserves/assets (%) 0.27 0.23 0.27 0.27 0.35
Loss reserves/NPAs (%) 41.9 52.6 50.0 42.9 50.0
Tier 1 capital ratio (%) 12.2 10.7 10.4 10.2 9.9
Total capital ratio (%) 16.4 14.3 13.4 12.6 12.0
Per share
Reported EPS (INR) 26.08 27.45 33.26 39.10 45.60
Norm EPS (INR) 26.08 27.45 33.26 39.10 45.60
FD norm EPS (INR) 26.08 27.45 33.26 39.10 45.60
DPS (INR) 4.50 5.00 6.06 7.12 8.31
PPOP PS (INR) 36.58 41.77 51.55 60.64 70.78
BVPS (INR) 149.17 154.83 180.99 211.76 247.64
ABVPS (INR) 149.17 154.83 180.99 211.76 247.64
NTAPS (INR) 149.17 154.83 180.99 211.76 247.64
Valuations and ratios
Reported P/E (x) 15.1 14.4 11.9 10.1 8.7
Normalised P/E (x) 15.1 14.4 11.9 10.1 8.7
FD normalised P/E (x) 15.1 14.4 11.9 10.1 8.7
Dividend yield (%) 1.1 1.3 1.5 1.8 2.1
Price/book (x) 2.6 2.6 2.2 1.9 1.6
Price/adjusted book (x) 2.6 2.6 2.2 1.9 1.6
Net interest margin (%) 2.27 2.25 2.30 2.27 2.20
Yield on assets (%) 10.75 10.57 10.36 10.21 10.21
Cost of int bearing liab (%) 9.52 9.31 9.00 8.80 8.80
Net interest spread (%) 1.23 1.27 1.36 1.41 1.41
Non-interest income (%) 11.3 9.6 9.9 9.5 9.5
Cost to income (%) 14.5 15.2 14.5 14.3 14.3
Effective tax rate (%) 27.8 34.1 33.7 33.7 33.7
Dividend payout (%) 20.2 21.3 21.3 21.3 21.3
ROE (%) 18.8 18.1 19.8 19.9 19.9
ROA (%) 1.49 1.34 1.37 1.34 1.30
Operating ROE (%) 26.1 27.4 29.9 30.0 29.9
Operating ROA (%) 2.07 2.02 2.06 2.02 1.96
Source: Company data, Nomura estimates
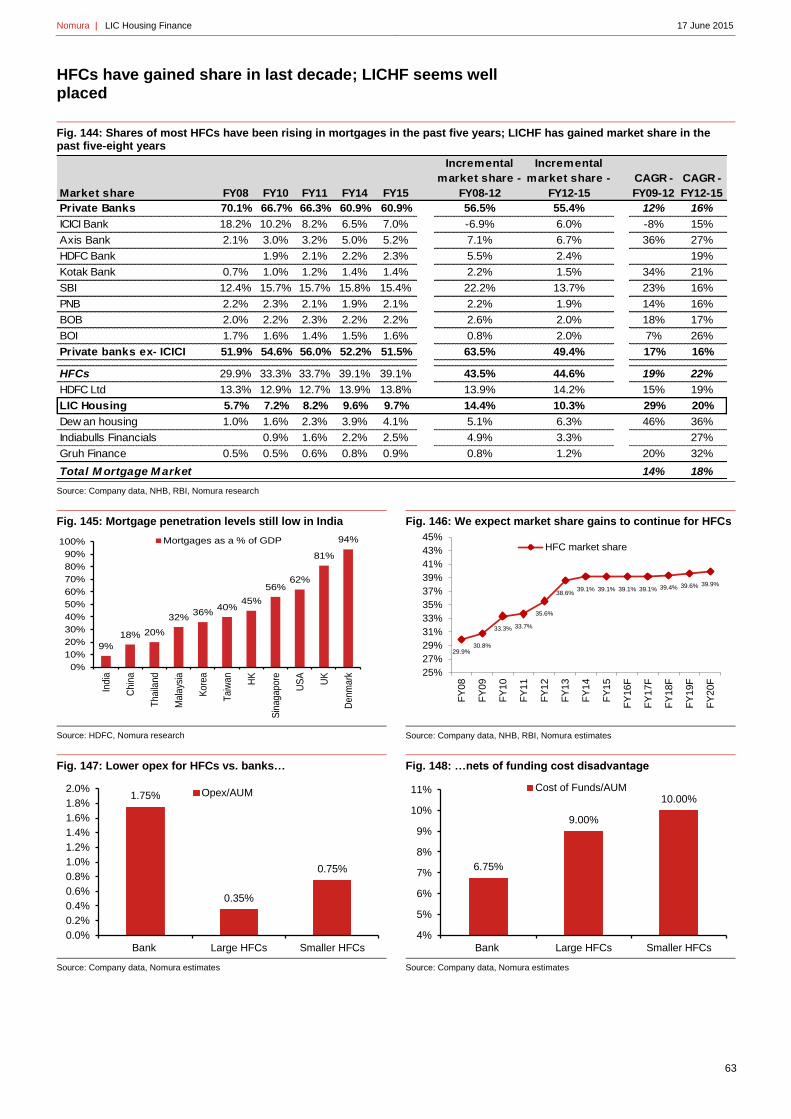
Nomura | LIC Housing Finance 17 June 2015
63
HFCs have gained share in last decade; LICHF seems well placed
Fig. 144: Shares of most HFCs have been rising in mortgages in the past five years; LICHF has gained market share in the past five-eight years
Source: Company data, NHB, RBI, Nomura research
Fig. 145: Mortgage penetration levels still low in India
Source: HDFC, Nomura research
Fig. 146: We expect market share gains to continue for HFCs
Source: Company data, NHB, RBI, Nomura estimates
Fig. 147: Lower opex for HFCs vs. banks…
Source: Company data, Nomura estimates
Fig. 148: …nets of funding cost disadvantage
Source: Company data, Nomura estimates
Market share FY08 FY10 FY11 FY14 FY15
Incremental
market share -
FY08-12
Incremental
market share -
FY12-15
CAGR -
FY09-12
CAGR -
FY12-15
Private Banks 70.1% 66.7% 66.3% 60.9% 60.9% 56.5% 55.4% 12% 16%
ICICI Bank 18.2% 10.2% 8.2% 6.5% 7.0% -6.9% 6.0% -8% 15%
Axis Bank 2.1% 3.0% 3.2% 5.0% 5.2% 7.1% 6.7% 36% 27%
HDFC Bank 1.9% 2.1% 2.2% 2.3% 5.5% 2.4% 19%
Kotak Bank 0.7% 1.0% 1.2% 1.4% 1.4% 2.2% 1.5% 34% 21%
SBI 12.4% 15.7% 15.7% 15.8% 15.4% 22.2% 13.7% 23% 16%
PNB 2.2% 2.3% 2.1% 1.9% 2.1% 2.2% 1.9% 14% 16%
BOB 2.0% 2.2% 2.3% 2.2% 2.2% 2.6% 2.0% 18% 17%
BOI 1.7% 1.6% 1.4% 1.5% 1.6% 0.8% 2.0% 7% 26%
Private banks ex- ICICI 51.9% 54.6% 56.0% 52.2% 51.5% 63.5% 49.4% 17% 16%
HFCs 29.9% 33.3% 33.7% 39.1% 39.1% 43.5% 44.6% 19% 22%
HDFC Ltd 13.3% 12.9% 12.7% 13.9% 13.8% 13.9% 14.2% 15% 19%
LIC Housing 5.7% 7.2% 8.2% 9.6% 9.7% 14.4% 10.3% 29% 20%
Dew an housing 1.0% 1.6% 2.3% 3.9% 4.1% 5.1% 6.3% 46% 36%
Indiabulls Financials 0.9% 1.6% 2.2% 2.5% 4.9% 3.3% 27%
Gruh Finance 0.5% 0.5% 0.6% 0.8% 0.9% 0.8% 1.2% 20% 32%
Total M ortgage M arket 14% 18%
9%
18% 20%
32%36%
40%45%
56%62%
81%
94%
0%
10%
20%
30%
40%
50%
60%
70%
80%
90%
100%
India
Chin
a
Th
aila
nd
Ma
lays
ia
Ko
rea
Ta
iwan
HK
Sin
ag
apore
US
A
UK
Denm
ark
Mortgages as a % of GDP
29.9%30.8%
33.3% 33.7%
35.6%
38.6%39.1% 39.1% 39.1% 39.1% 39.4% 39.6% 39.9%
25%
27%
29%
31%
33%
35%
37%
39%
41%
43%
45%
FY
08
FY
09
FY
10
FY
11
FY
12
FY
13
FY
14
FY
15
FY
16
F
FY
17
F
FY
18
F
FY
19F
FY
20
F
HFC market share
1.75%
0.35%
0.75%
0.0%
0.2%
0.4%
0.6%
0.8%
1.0%
1.2%
1.4%
1.6%
1.8%
2.0%
Bank Large HFCs Smaller HFCs
Opex/AUM
6.75%
9.00%
10.00%
4%
5%
6%
7%
8%
9%
10%
11%
Bank Large HFCs Smaller HFCs
Cost of Funds/AUM

Nomura | LIC Housing Finance 17 June 2015
64
Funding environment remains comfortable; we do not expect irrational pricing from PSU banks this time
Fig. 149: Wholesale rates have moderated
Source: Bloomberg, Nomura research
Fig. 150: Liquidity remains comfortable
Source: Bloomberg, Nomura research
Fig. 151: Banks unlikely to be irrational in mortgage pricing as in FY10…
Source: Company data, Bloomberg, Nomura research
Fig. 152: …as profitability remains lower which should restrict them from getting aggressive
Source: Company data, Nomura research
Fig. 153: We expect spreads to improve gradually
Source: Company data, Nomura estimates
7.5%
8.5%
9.5%
Jun
-10
Nov-1
0
Ap
r-11
Se
p-1
1
Feb-1
2
Ju
l-1
2
Dec-1
2
Ma
y-1
3
Oct-
13
Ma
r-14
Au
g-1
4
Jan
-15
5yr AAA corp bond-2,400
-1,900
-1,400
-900
-400
100
Nov-1
2
Jan
-13
Ma
r-1
3
Ma
y-1
3
Jul-1
3
Se
p-1
3
Nov-1
3
Jan
-14
Ma
r-1
4
Ma
y-1
4
Jul-1
4
Se
p-1
4
Nov-1
4
Jan
-15
Liquidity deficit (INRbn)
6.0
7.0
8.0
9.0
10.0
11.0
12.0
Jun
-07
Nov-0
7
Ap
r-08
Se
p-0
8
Feb-0
9
Jul-0
9
Dec-0
9
May-1
0
Oct-
10
Mar-
11
Au
g-1
1
Jan
-12
Jun
-12
Nov-1
2
Ap
r-13
Se
p-1
3
Feb-1
4
Jul-1
4
SBI - Base rateROA tree - PSUs FY09 FY15 Change
NIMs/Assets 2.74% 2.72% -0.02%
Fees/Assets 1.12% 0.84% -0.28%
Investment profits/Assets 0.29% 0.14% -0.15%
Net revenues/Assets 4.15% 3.69% -0.45%
Opex/Assets 1.84% 1.86% 0.02%
PPOP/Assets 2.31% 1.84% -0.47%
Provisioning/Assets 0.43% 0.94% 0.52%
Pre Tax ROA/Assets 1.88% 0.89% -0.99%
ROAs 1.15% 0.62% -0.53%
ROEs 20.1% 10.4% -9.7%
2.30%
2.03%
2.27%
1.51%
1.20%1.30% 1.33% 1.36%
1.41% 1.41%
1.0%
1.2%
1.4%
1.6%
1.8%
2.0%
2.2%
2.4%
FY09 FY10 FY11 FY12 FY13 FY14 FY15 FY16F FY17F FY18F
Spreads

Nomura | LIC Housing Finance 17 June 2015
65
Valuations reasonable at 1.9x book; upgrade to Buy
We look for ROEs for LICHF to inch up to 20% by FY17F, driven by ~15bps
improvement in loan spreads and find valuations at 1.9x Mar-17F book (BVPS: INR212)
reasonable after the recent correction and hence upgrade LICHF to Buy. We do not see
any risk of irrational pricing in mortgages, and changing the loan mix from here onwards
can only aid margins. We maintain our target price of INR500, which is based on 2.35x
Mar-17F book.
Risks: Excessive pricing competition in the mortgage market, unfavorable funding
environment and higher delinquencies in the builder book.
Fig. 154: ROEs remain respectable despite lower margins/ROAs
Source: Company data, Nomura estimates
Fig. 155: TP of INR500
Source: Nomura estimates
Fig. 156: Currently trades at 1.9x Mar-17F book
Source: Company data, Bloomberg, Nomura estimates
ROE Decomposition (on AUM ) FY10 FY11 FY12 FY13 FY14 FY15 FY16F FY17F FY18F
Net Interest Income/Assets 2.72% 3.17% 2.44% 2.18% 2.27% 2.25% 2.30% 2.27% 2.20%
Fees/Assets 0.55% 0.80% 0.39% 0.26% 0.29% 0.24% 0.25% 0.24% 0.23%
Investment profits/Assets 0.00% 0.00% 0.00% 0.00% 0.00% 0.00% 0.00% 0.00% 0.00%
Net revenues/Assets 3.27% 3.97% 2.83% 2.45% 2.55% 2.49% 2.56% 2.50% 2.43%
Operating Expense/Assets 0.58% 0.48% 0.42% 0.40% 0.37% 0.38% 0.37% 0.36% 0.35%
Provisions/Assets -0.09% 0.59% 0.27% 0.11% 0.03% 0.01% 0.06% 0.06% 0.06%
Taxes/Assets 0.76% 0.72% 0.55% 0.50% 0.60% 0.72% 0.72% 0.70% 0.68%
Total Costs/Assets 1.25% 1.79% 1.24% 1.01% 1.00% 1.10% 1.15% 1.12% 1.09%
ROA 2.01% 2.19% 1.59% 1.44% 1.56% 1.39% 1.41% 1.38% 1.34%
Equity/AUM 10.30% 9.35% 9.95% 9.20% 8.91% 7.83% 7.68% 7.49% 7.30%
ROE 23.6% 25.8% 18.4% 16.6% 18.8% 18.1% 19.8% 19.9% 19.9%
Valuation assumptions
Cost of Equity 13.8%
Terminal grow th 5.0%
Normalised ROE 17.8%
Stage 2 grow th 18.0%
Mar-16 PT 500
Implied Mar-17 P/B 2.36
Implied Mar-17 P/E 12.80.5
1.0
1.5
2.0
2.5
3.0
3.5
Ap
r-05
Au
g-0
5D
ec-0
5A
pr-
06
Au
g-0
6D
ec-0
6A
pr-
07
Au
g-0
7D
ec-0
7A
pr-
08
Au
g-0
8D
ec-0
8A
pr-
09
Au
g-0
9D
ec-0
9A
pr-
10
Au
g-1
0D
ec-1
0A
pr-
11
Au
g-1
1D
ec-1
1A
pr-
12
Au
g-1
2D
ec-1
2A
pr-
13
Au
g-1
3D
ec-1
3A
pr-
14
Au
g-1
4D
ec-1
4A
pr-
15
LIC Housing

Rating Remains Neutral
Target price Remains INR 1325
Closing price 15 June 2015 INR 1215
Potential upside +9.1%
Anchor themes
Mortgages remain a structural story from a growth perspective. Cyclically the domestic rate environment remains favourable for HFCs and banks' ability to compete on pricing is lower than in the previous cycle (FY09-10).
Nomura vs consensus
Our FY16F PAT estimate is largely in line with consensus.
Research analysts
India Banks
Adarsh Parasrampuria - NFASL [email protected] +91 22 4037 4034
Amit Nanavati - NFASL [email protected] +91 22 4037 4361
HDFC HDFC.NS HDFC IN
EQUITY: FINANCIALS
Great business, but already in the price
Stability is good, but ability to surprise low
Action: Limited ability to surprise; maintain Neutral and INR1,325 TP
HDFC Limited has improved its market share to 13.8% from 12.7% over the
past five years driven by a strong funding mix and distribution and it should
maintain its dominant market share position. While volatility of NIMs, growth
and earnings are low across credit and rate cycles, HDFC is less leveraged to
the easing rate cycle than peers like LICHF, and its current valuation at 3.6x
FY17F book (BVPS: INR195) has now become reasonable.
Asset mix and funding mix already optimum: 1) HDFC’s share of higher
yielding loans at +30% (LAP + builder book) is the highest among India’s
banks and while corporate loan growth could inch up from current levels,
structurally we think proportion of higher yielding loans is capped. 2) On the
funding side, 56% of HDFC’s funding is currently bonds and incrementally
90% of funding was bonds in FY15; hence, levers from a funding mix
change are also lower. Deposit funding at 32% of borrowing is more
expensive than bonds, however, we do not see HDFC cutting the deposit
share in its funding mix as it adds to the stability in funding mix.
Stability in NIMs/growth good, but levers to surprise are limited: As
mortgage growth is structural, HDFC recording steady growth is not a
surprise, but the ability to maintain NIMs in a thin band irrespective of
interest rate cycles has been surprising. Although the market seems to pay
for earnings predictability, this makes HDFC less leveraged to the rate cycle
and the ability to surprise will be lower, in our view.
Valuation now becoming reasonable again; remain Neutral
While we have nothing much to complain about with regard to HDFC’s
business, except for the lumpiness in its builder book which also is well
collateralised, we believe current valuations are just reasonable at 3.6x FY17F
book. Thus, we maintain our Neutral. Among large-cap retail plays, we prefer
HDFCB (Buy), and among large HFCs, LICHF (Buy) offers better risk-reward.
Year-end 31 Mar FY15
FY16F
FY17F
FY18F
Currency (INR) Actual Old New Old New Old New
PPOP (mn) 87,891 101,032 101,032 116,961 116,961
136,073
Reported net profit (mn) 59,901 68,914 68,914 79,852 79,852
92,988
Normalised net profit (mn) 59,901 68,914 68,914 79,852 79,852
92,988
FD normalised EPS 38.04 43.76 43.76 50.71 50.71
59.05
FD norm. EPS growth (%) 9.1 15.0 15.0 15.9 15.9
16.5
FD normalised P/E (x) 31.9 N/A 27.8 N/A 24.0 N/A 20.6
Price/adj. book (x) 6.2 N/A 5.5 N/A 4.9 N/A 4.3
Price/book (x) 6.2 N/A 5.5 N/A 4.9 N/A 4.3
Dividend yield (%) 1.2 N/A 1.4 N/A 1.6 N/A 1.9
ROE (%) 20.3 21.0 21.0 21.7 21.7
22.4
ROA (%) 2.5 2.5 2.5 2.5 2.5
2.4
Source: Company data, Nomura estimates
Global Markets Research
17 June 2015
See Appendix A-1 for analyst certification, important disclosures and the status of non-US analysts.
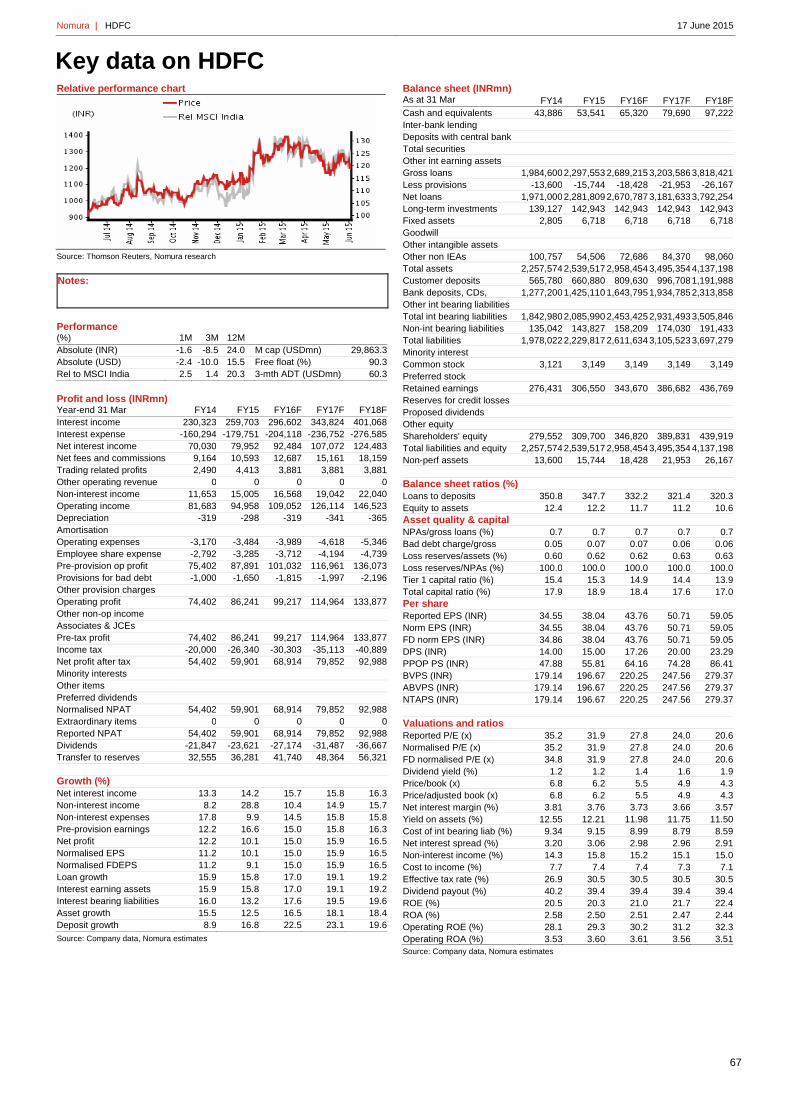
Nomura | HDFC 17 June 2015
67
Key data on HDFC Relative performance chart
Source: Thomson Reuters, Nomura research
Notes:
Performance (%) 1M 3M 12M
Absolute (INR) -1.6 -8.5 24.0 M cap (USDmn) 29,863.3
Absolute (USD) -2.4 -10.0 15.5 Free float (%) 90.3
Rel to MSCI India 2.5 1.4 20.3 3-mth ADT (USDmn) 60.3
Profit and loss (INRmn) Year-end 31 Mar FY14 FY15 FY16F FY17F FY18F
Interest income 230,323 259,703 296,602 343,824 401,068
Interest expense -160,294 -179,751 -204,118 -236,752 -276,585
Net interest income 70,030 79,952 92,484 107,072 124,483
Net fees and commissions 9,164 10,593 12,687 15,161 18,159
Trading related profits 2,490 4,413 3,881 3,881 3,881
Other operating revenue 0 0 0 0 0
Non-interest income 11,653 15,005 16,568 19,042 22,040
Operating income 81,683 94,958 109,052 126,114 146,523
Depreciation -319 -298 -319 -341 -365
Amortisation
Operating expenses -3,170 -3,484 -3,989 -4,618 -5,346
Employee share expense -2,792 -3,285 -3,712 -4,194 -4,739
Pre-provision op profit 75,402 87,891 101,032 116,961 136,073
Provisions for bad debt -1,000 -1,650 -1,815 -1,997 -2,196
Other provision charges
Operating profit 74,402 86,241 99,217 114,964 133,877
Other non-op income
Associates & JCEs
Pre-tax profit 74,402 86,241 99,217 114,964 133,877
Income tax -20,000 -26,340 -30,303 -35,113 -40,889
Net profit after tax 54,402 59,901 68,914 79,852 92,988
Minority interests
Other items
Preferred dividends
Normalised NPAT 54,402 59,901 68,914 79,852 92,988
Extraordinary items 0 0 0 0 0
Reported NPAT 54,402 59,901 68,914 79,852 92,988
Dividends -21,847 -23,621 -27,174 -31,487 -36,667
Transfer to reserves 32,555 36,281 41,740 48,364 56,321
Growth (%)
Net interest income 13.3 14.2 15.7 15.8 16.3
Non-interest income 8.2 28.8 10.4 14.9 15.7
Non-interest expenses 17.8 9.9 14.5 15.8 15.8
Pre-provision earnings 12.2 16.6 15.0 15.8 16.3
Net profit 12.2 10.1 15.0 15.9 16.5
Normalised EPS 11.2 10.1 15.0 15.9 16.5
Normalised FDEPS 11.2 9.1 15.0 15.9 16.5
Loan growth 15.9 15.8 17.0 19.1 19.2
Interest earning assets 15.9 15.8 17.0 19.1 19.2
Interest bearing liabilities 16.0 13.2 17.6 19.5 19.6
Asset growth 15.5 12.5 16.5 18.1 18.4
Deposit growth 8.9 16.8 22.5 23.1 19.6
Source: Company data, Nomura estimates
Balance sheet (INRmn) As at 31 Mar FY14 FY15 FY16F FY17F FY18F
Cash and equivalents 43,886 53,541 65,320 79,690 97,222
Inter-bank lending
Deposits with central bank
Total securities
Other int earning assets
Gross loans 1,984,600 2,297,553 2,689,215 3,203,586 3,818,421
Less provisions -13,600 -15,744 -18,428 -21,953 -26,167
Net loans 1,971,000 2,281,809 2,670,787 3,181,633 3,792,254
Long-term investments 139,127 142,943 142,943 142,943 142,943
Fixed assets 2,805 6,718 6,718 6,718 6,718
Goodwill
Other intangible assets
Other non IEAs 100,757 54,506 72,686 84,370 98,060
Total assets 2,257,574 2,539,517 2,958,454 3,495,354 4,137,198
Customer deposits 565,780 660,880 809,630 996,708 1,191,988
Bank deposits, CDs,
debentures
1,277,200 1,425,110 1,643,795 1,934,785 2,313,858
Other int bearing liabilities
Total int bearing liabilities 1,842,980 2,085,990 2,453,425 2,931,493 3,505,846
Non-int bearing liabilities 135,042 143,827 158,209 174,030 191,433
Total liabilities 1,978,022 2,229,817 2,611,634 3,105,523 3,697,279
Minority interest
Common stock 3,121 3,149 3,149 3,149 3,149
Preferred stock
Retained earnings 276,431 306,550 343,670 386,682 436,769
Reserves for credit losses
Proposed dividends
Other equity
Shareholders' equity 279,552 309,700 346,820 389,831 439,919
Total liabilities and equity 2,257,574 2,539,517 2,958,454 3,495,354 4,137,198
Non-perf assets 13,600 15,744 18,428 21,953 26,167
Balance sheet ratios (%)
Loans to deposits 350.8 347.7 332.2 321.4 320.3
Equity to assets 12.4 12.2 11.7 11.2 10.6
Asset quality & capital
NPAs/gross loans (%) 0.7 0.7 0.7 0.7 0.7
Bad debt charge/gross
loans (%)
0.05 0.07 0.07 0.06 0.06
Loss reserves/assets (%) 0.60 0.62 0.62 0.63 0.63
Loss reserves/NPAs (%) 100.0 100.0 100.0 100.0 100.0
Tier 1 capital ratio (%) 15.4 15.3 14.9 14.4 13.9
Total capital ratio (%) 17.9 18.9 18.4 17.6 17.0
Per share
Reported EPS (INR) 34.55 38.04 43.76 50.71 59.05
Norm EPS (INR) 34.55 38.04 43.76 50.71 59.05
FD norm EPS (INR) 34.86 38.04 43.76 50.71 59.05
DPS (INR) 14.00 15.00 17.26 20.00 23.29
PPOP PS (INR) 47.88 55.81 64.16 74.28 86.41
BVPS (INR) 179.14 196.67 220.25 247.56 279.37
ABVPS (INR) 179.14 196.67 220.25 247.56 279.37
NTAPS (INR) 179.14 196.67 220.25 247.56 279.37
Valuations and ratios
Reported P/E (x) 35.2 31.9 27.8 24.0 20.6
Normalised P/E (x) 35.2 31.9 27.8 24.0 20.6
FD normalised P/E (x) 34.8 31.9 27.8 24.0 20.6
Dividend yield (%) 1.2 1.2 1.4 1.6 1.9
Price/book (x) 6.8 6.2 5.5 4.9 4.3
Price/adjusted book (x) 6.8 6.2 5.5 4.9 4.3
Net interest margin (%) 3.81 3.76 3.73 3.66 3.57
Yield on assets (%) 12.55 12.21 11.98 11.75 11.50
Cost of int bearing liab (%) 9.34 9.15 8.99 8.79 8.59
Net interest spread (%) 3.20 3.06 2.98 2.96 2.91
Non-interest income (%) 14.3 15.8 15.2 15.1 15.0
Cost to income (%) 7.7 7.4 7.4 7.3 7.1
Effective tax rate (%) 26.9 30.5 30.5 30.5 30.5
Dividend payout (%) 40.2 39.4 39.4 39.4 39.4
ROE (%) 20.5 20.3 21.0 21.7 22.4
ROA (%) 2.58 2.50 2.51 2.47 2.44
Operating ROE (%) 28.1 29.3 30.2 31.2 32.3
Operating ROA (%) 3.53 3.60 3.61 3.56 3.51
Source: Company data, Nomura estimates

Nomura | HDFC 17 June 2015
68
Fig. 157: Funding mix already optimum (FY15)
Source: Company data, Nomura research
Fig. 158: Share of high yielding loans high for HDFC
Source: Company data, Nomura research
Fig. 159: ROEs to remain in a stable band
Source: Company data, Nomura estimates
Banks12%
Bonds56%
Deposits32%
50%
66%75%
93%
48%
34%24%
7%
0%
20%
40%
60%
80%
100%
120%
IHFL HDFC DEWH LICHF
Mortgage Builder/corporates + LAP
INRmn FY11 FY12 FY13 FY14 FY15 FY16F FY17F
Reported PAT 35,350 41,226 48,483 54,402 59,901 68,914 79,852
Dividends 2,252 3,097 4,807 5,556 6,883 8,259 9,911
Adjustment for Zero Coupon 5,321 4,851 4,380 3,572 4,151 4,151 4,151
Adjusted PAT 29,532 34,880 40,742 46,453 50,238 57,874 67,160
% growth 19.8% 18.1% 16.8% 14.0% 8.1% 15.2% 16.0%
Subsidiary Stake
HDFC Life 72.4% 72.4% 72.4% 72.4% 72.4% 71.4% 71.4%
HDFC Bank 23.4% 23.1% 22.8% 22.8% 22.8% 22.8% 22.8%
Gruh Finance 60.7% 60.4% 59.7% 59.7% 59.7% 59.7% 59.7%
HDFC General insurance 74.0% 74.0% 73.9% 73.9% 73.9% 73.9% 73.9%
HDFC AMC 60.0% 59.9% 59.8% 59.8% 59.8% 59.8% 59.8%
Others 100.0% 100.0% 100.0% 100.0% 100.0% 100.0% 100.0%
Subsidiary performance
HDFC Life -990 2710 4515 7253 7860 8646 9511
HDFC Bank 39264 51671 64749 84784 102159 126677 157080
Gruh Finance 915 1203 1460 1770 2038 2649 3444
HDFC General insurance -364 -397 1545 1954 1040 1196 1375
HDFC AMC 2422 2691 3190 3578 4160 4576 5034
Others 1860 280 -1000 200 500 700 700
Proportionate income 12070 16223 20952 29422 33956 40958 49388
Calculated consolidated PAT 46923 55954 66075 79447 88344 102982 120698
Reported Consolidated PAT 45280 54630 66400 79478 87626 102264 119980
Reported Standalone Equity 173165 190176 250000 279552 309700 346820 389831
Reported Consolidated Equity 211901 244240 320600 401300 461290 531760 614900
Adjusted ROEs - Consol 23.8% 24.5% 23.4% 22.0% 20.5% 20.7% 21.1%
Reported ROEs - Consol 23.0% 24.0% 23.5% 22.0% 20.3% 20.6% 20.9%
Standalone Equity 173165 190176 250000 279552 309700 346820 389831
Subsidiary investment 79351 79351 79351 79351 79351 79351 79351
Adjusted Standalone Equity 93814 110825 170649 200201 230349 267469 310480
Adjusted Standalone PAT 29532 34880 40742 46453 50238 57874 67160
Adjusted Standalone ROE 34.9% 34.1% 28.9% 25.1% 23.3% 23.3% 23.2%
Adjusted Subsidiary PAT 15748 19750 25658 33025 38106 45108 53538
Adjusted Susidiary Capital 118,087 133,415 149,951 201,099 230,942 264,292 304,420
Adjusted Subsidiary ROE 14.0% 15.7% 18.1% 18.8% 17.6% 18.2% 18.8%

Nomura | HDFC 17 June 2015
69
Valuations now becoming reasonable again; maintain Neutral
Except for the lumpiness in its builder book (which is also well collateralized), we are
satisfied with HDFC’s business. We think current valuations are reasonable at 3.6x
FY17F book (BVPS: INR195). Thus, we maintain our Neutral rating. Among large-cap
retail plays we prefer HDFCB (Buy), and among large HFCs, we think LICHF (Buy) offers
better risk-reward.
Fig. 160: Valuations still above mean levels
Source: Company data, Nomura research
Fig. 161: Our SOTP factors in upsides for subsidiaries as well
Source: Nomura estimates
Risk: 1) A very benign funding environment could lead to an increase in
margins/spreads and that will be an upside risk. 2) Slower growth in the corporate book
will restrict any spread expansion and impact overall fees, which will remain a key
downside risk.
2.0
2.5
3.0
3.5
4.0
4.5
5.0
5.5
6.0
Ma
r-06
Jan
-07
Nov-0
7
Se
p-0
8
Jul-0
9
Ma
y-1
0
Ma
r-11
Jan
-12
Nov-1
2
Se
p-1
3
Jul-1
4
Ma
y-1
5
HDFC ltd standalone P/B Key subsidiary valuations Value per share
HDFC Bank 355
HDFC Standard Life 90
HDFC Asset Management 30
Gruh Finance 32
Fair value of key subsidiaries 508
HDFC Ltd (standalone) 817
Mar-16 PT 1,325
Implied Mar-17 P/E 17.5
Implied Mar-17 P/B 4.2

Nomura | India financials 17 June 2015
70
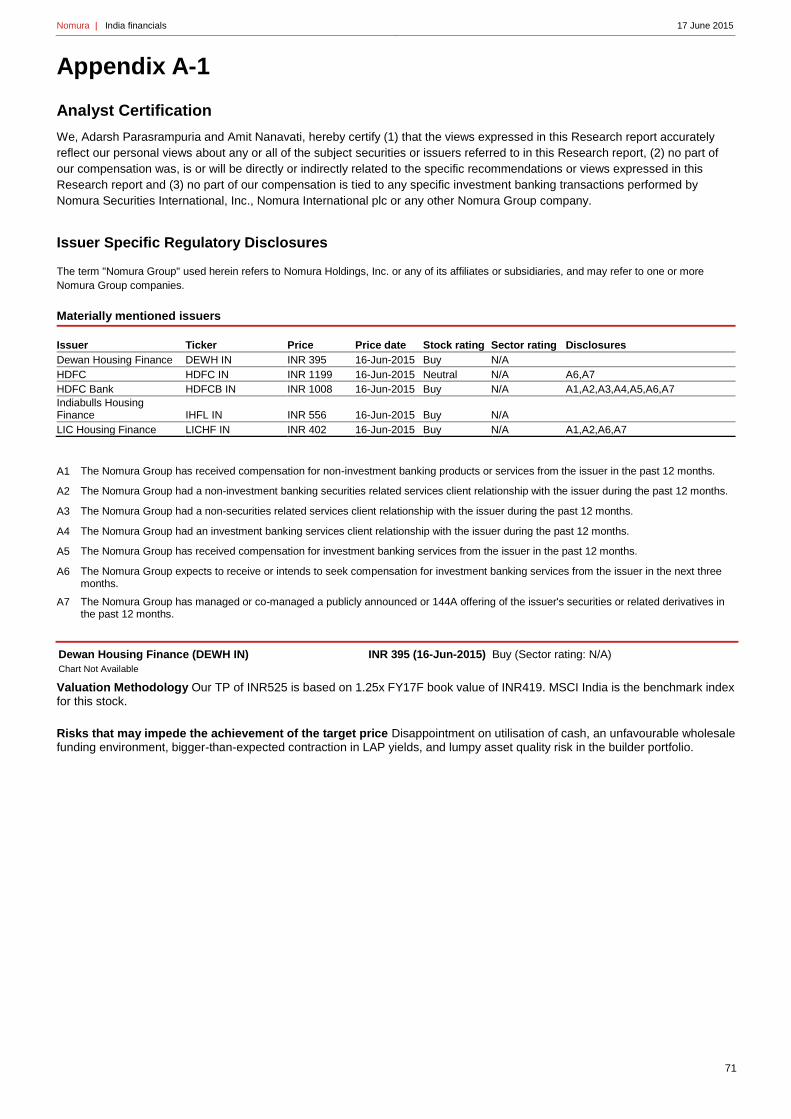
Nomura | India financials 17 June 2015
71
Appendix A-1
Analyst Certification
We, Adarsh Parasrampuria and Amit Nanavati, hereby certify (1) that the views expressed in this Research report accurately
reflect our personal views about any or all of the subject securities or issuers referred to in this Research report, (2) no part of
our compensation was, is or will be directly or indirectly related to the specific recommendations or views expressed in this
Research report and (3) no part of our compensation is tied to any specific investment banking transactions performed by
Nomura Securities International, Inc., Nomura International plc or any other Nomura Group company.
Issuer Specific Regulatory Disclosures
The term "Nomura Group" used herein refers to Nomura Holdings, Inc. or any of its affiliates or subsidiaries, and may refer to one or more
Nomura Group companies.
Materially mentioned issuers
Issuer Ticker Price Price date Stock rating Sector rating Disclosures
Dewan Housing Finance DEWH IN INR 395 16-Jun-2015 Buy N/A
HDFC HDFC IN INR 1199 16-Jun-2015 Neutral N/A A6,A7
HDFC Bank HDFCB IN INR 1008 16-Jun-2015 Buy N/A A1,A2,A3,A4,A5,A6,A7
Indiabulls Housing Finance IHFL IN INR 556 16-Jun-2015 Buy N/A
LIC Housing Finance LICHF IN INR 402 16-Jun-2015 Buy N/A A1,A2,A6,A7
A1 The Nomura Group has received compensation for non-investment banking products or services from the issuer in the past 12 months.
A2 The Nomura Group had a non-investment banking securities related services client relationship with the issuer during the past 12 months.
A3 The Nomura Group had a non-securities related services client relationship with the issuer during the past 12 months.
A4 The Nomura Group had an investment banking services client relationship with the issuer during the past 12 months.
A5 The Nomura Group has received compensation for investment banking services from the issuer in the past 12 months.
A6 The Nomura Group expects to receive or intends to seek compensation for investment banking services from the issuer in the next three months.
A7 The Nomura Group has managed or co-managed a publicly announced or 144A offering of the issuer's securities or related derivatives in the past 12 months.
Dewan Housing Finance (DEWH IN) INR 395 (16-Jun-2015)
Buy (Sector rating: N/A)
Chart Not Available
Valuation Methodology Our TP of INR525 is based on 1.25x FY17F book value of INR419. MSCI India is the benchmark index for this stock.
Risks that may impede the achievement of the target price Disappointment on utilisation of cash, an unfavourable wholesale funding environment, bigger-than-expected contraction in LAP yields, and lumpy asset quality risk in the builder portfolio.

Nomura | India financials 17 June 2015
72
HDFC (HDFC IN) INR 1199 (16-Jun-2015)
Rating and target price chart (three year history)
Neutral (Sector rating: N/A)
Date Rating Target price Closing price
29-Jan-15
1,325.00 1,315.55
08-Jul-14 Neutral
1,022.20
08-Jul-14
1,050.00 1,022.20
28-Jun-14 Suspended
976.10
19-Jul-13
860.00 803.20
For explanation of ratings refer to the stock rating keys located after chart(s)
Valuation Methodology Our TP of INR1,325 implies 4.3x Mar-17F book of INR194 for the mortgage business after deducting for INR508 for its subsidiaries. The benchmark index for this stock is MSCI India.
Risks that may impede the achievement of the target price (1) A very benign funding environment could lead to an increase
in margins/spreads and that will be an upside risk. (2) Slower growth in the corporate book will restrict any spread expansion and impact overall fees, which will remain a key downside risk.
Indiabulls Housing Finance (IHFL IN) INR 556 (16-Jun-2015)
Buy (Sector rating: N/A)
Chart Not Available
Valuation Methodology We value IHFL at 3x FY17F book and adding dividends we arrive at our TP of INR800. Adjusted ROEs
of 28-29% is highest in the sector and with growth outpacing system, we find current valuations attractive at 2x book. Relatively, IHFL is one of the cheaper HFCs at ~8x FY17F P/E. The benchmark index for this stock is MSCI India.
Risks that may impede the achievement of the target price Key risks to our call are unfavourable wholesale funding environment,higher than expected contraction in LAP yields and lumpy asset quality risk in builder portfolio.
LIC Housing Finance (LICHF IN) INR 402 (16-Jun-2015)
Rating and target price chart (three year history)
Buy (Sector rating: N/A)
Date Rating Target price Closing price
15-Jan-15
500.00 466.15
20-Oct-14
350.00 323.55
31-Jul-14 Neutral
289.205
31-Jul-14
310.00 289.205
08-Jul-14 Buy
320.102
08-Jul-14
370.00 320.102
28-Jun-14 Suspended
316.658
16-Aug-13
255.00 169.609
For explanation of ratings refer to the stock rating keys located after chart(s)

Nomura | India financials 17 June 2015
73
Valuation Methodology We expect ROEs for LICHF to inch up to 20% by FY17F, driven by ~15bps improvement in loan
spreads and find current valuations reasonable. We do not see any risk of irrational pricing in mortgages, and changing the loan mix from here onwards can only aid margins. We maintain our target price of INR500, which is based on 2.35x Mar-17F book (BVPS: INR212). MSCI India is the benchmark index for this stock.
Risks that may impede the achievement of the target price Excessive pricing competition in the mortgage market, unfavourable funding environment and higher delinquencies in the builder book.
HDFC Bank (HDFCB IN) INR 1008 (16-Jun-2015)
Rating and target price chart (three year history)
Buy (Sector rating: N/A)
Date Rating Target price Closing price
16-Feb-15
1,200.00 1,067.55
16-Sep-14
1,025.00 851.00
08-Jul-14 Buy
829.25
08-Jul-14
950.00 829.25
28-Jun-14 Suspended
816.20
22-Apr-14
820.00 727.55
16-Oct-13
750.00 652.45
20-Jun-13 Buy
636.60
20-Jun-13
780.00 636.60
12-Oct-12
650.00 631.15
For explanation of ratings refer to the stock rating keys located after chart(s)
Valuation Methodology Our TP of INR1,200 is based on 3.6x Mar-17F book of INR332. The benchmark index for this stock is MSCI India.
Risks that may impede the achievement of the target price 1) A slower-than-expected pick-up in retail credit growth; and 2) any significant change in underwriting standards of retail loans.
Rating and target price changes
Issuer Ticker Old stock rating New stock rating Old target price New target price
Dewan Housing Finance DEWH IN Not rated Buy N/A INR 525
Indiabulls Housing Finance IHFL IN Not rated Buy N/A INR 800
LIC Housing Finance LICHF IN Neutral Buy INR 500 INR 500
Important Disclosures Online availability of research and conflict-of-interest disclosures Nomura research is available on www.nomuranow.com/research, Bloomberg, Capital IQ, Factset, MarkitHub, Reuters and ThomsonOne. Important disclosures may be read at http://go.nomuranow.com/research/globalresearchportal/pages/disclosures/disclosures.aspx or requested from Nomura Securities International, Inc., on 1-877-865-5752. If you have any difficulties with the website, please email [email protected] for help. The analysts responsible for preparing this report have received compensation based upon various factors including the firm's total revenues, a portion of which is generated by Investment Banking activities. Unless otherwise noted, the non-US analysts listed at the front of this report are not registered/qualified as research analysts under FINRA/NYSE rules, may not be associated persons of NSI, and may not be subject to FINRA Rule 2711 and NYSE Rule 472 restrictions on communications with covered companies, public appearances, and trading securities held by a research analyst account.
Nomura Global Financial Products Inc. (“NGFP”) Nomura Derivative Products Inc. (“NDPI”) and Nomura International plc. (“NIplc”) are registered with the Commodities Futures Trading Commission and the National Futures Association (NFA) as swap dealers. NGFP, NDPI, and NIplc are generally engaged in the trading of swaps and other derivative products, any of which may be the subject of this report. Any authors named in this report are research analysts unless otherwise indicated. Industry Specialists identified in some Nomura International plc research reports are employees within the Firm who are responsible for the sales and trading effort in the sector for which they have coverage. Industry Specialists do not contribute in any manner to the content of research reports in which their names appear.
Nomura | India financials 17 June 2015
74
Distribution of ratings (Global) The distribution of all ratings published by Nomura Global Equity Research is as follows: 48% have been assigned a Buy rating which, for purposes of mandatory disclosures, are classified as a Buy rating; 43% of companies with this rating are investment banking clients of the Nomura Group*. 44% have been assigned a Neutral rating which, for purposes of mandatory disclosures, is classified as a Hold rating; 53% of companies with this rating are investment banking clients of the Nomura Group*. 8% have been assigned a Reduce rating which, for purposes of mandatory disclosures, are classified as a Sell rating; 25% of companies with this rating are investment banking clients of the Nomura Group*. As at 31 March 2015. *The Nomura Group as defined in the Disclaimer section at the end of this report. Explanation of Nomura's equity research rating system in Europe, Middle East and Africa, US and Latin America, and Japan and Asia ex-Japan from 21 October 2013 The rating system is a relative system, indicating expected performance against a specific benchmark identified for each individual stock, subject to limited management discretion. An analyst’s target price is an assessment of the current intrinsic fair value of the stock based on an appropriate valuation methodology determined by the analyst. Valuation methodologies include, but are not limited to, discounted cash flow analysis, expected return on equity and multiple analysis. Analysts may also indicate expected absolute upside/downside relative to the stated target price, defined as (target price - current price)/current price.
STOCKS A rating of 'Buy', indicates that the analyst expects the stock to outperform the Benchmark over the next 12 months. A rating of 'Neutral', indicates that the analyst expects the stock to perform in line with the Benchmark over the next 12 months. A rating of 'Reduce', indicates that the analyst expects the stock to underperform the Benchmark over the next 12 months. A rating of 'Suspended', indicates that the rating, target price and estimates have been suspended temporarily to comply with applicable regulations and/or firm policies. Securities and/or companies that are labelled as 'Not rated' or shown as 'No rating' are not in regular research coverage. Investors should not expect continuing or additional information from Nomura relating to such securities and/or companies. Benchmarks are as follows: United States/Europe/Asia ex-Japan: please see valuation methodologies for explanations of relevant benchmarks for stocks, which can be accessed at: http://go.nomuranow.com/research/globalresearchportal/pages/disclosures/disclosures.aspx; Global Emerging Markets (ex-Asia): MSCI Emerging Markets ex-Asia, unless otherwise stated in the valuation methodology; Japan: Russell/Nomura Large Cap.
SECTORS A 'Bullish' stance, indicates that the analyst expects the sector to outperform the Benchmark during the next 12 months. A 'Neutral' stance, indicates that the analyst expects the sector to perform in line with the Benchmark during the next 12 months. A 'Bearish' stance, indicates that the analyst expects the sector to underperform the Benchmark during the next 12 months. Sectors that are labelled as 'Not rated' or shown as 'N/A' are not assigned ratings. Benchmarks are as follows: United States: S&P 500; Europe: Dow Jones STOXX 600; Global Emerging Markets (ex-Asia): MSCI Emerging Markets ex-Asia. Japan/Asia ex-Japan: Sector ratings are not assigned.
Explanation of Nomura's equity research rating system in Japan and Asia ex-Japan prior to 21 October 2013 STOCKS Stock recommendations are based on absolute valuation upside (downside), which is defined as (Target Price - Current Price) / Current Price, subject to limited management discretion. In most cases, the Target Price will equal the analyst's 12-month intrinsic valuation of the stock, based on an appropriate valuation methodology such as discounted cash flow, multiple analysis, etc. A 'Buy' recommendation indicates that potential upside is 15% or more. A 'Neutral' recommendation indicates that potential upside is less than 15% or downside is less than 5%. A 'Reduce' recommendation indicates that potential downside is 5% or more. A rating of 'Suspended' indicates that the rating and target price have been suspended temporarily to comply with applicable regulations and/or firm policies in certain circumstances including when Nomura is acting in an advisory capacity in a merger or strategic transaction involving the subject company. Securities and/or companies that are labelled as 'Not rated' or shown as 'No rating' are not in regular research coverage of the Nomura entity identified in the top banner. Investors should not expect continuing or additional information from Nomura relating to such securities and/or companies.
SECTORS A 'Bullish' rating means most stocks in the sector have (or the weighted average recommendation of the stocks under coverage is) a positive absolute recommendation. A 'Neutral' rating means most stocks in the sector have (or the weighted average recommendation of the stocks under coverage is) a neutral absolute recommendation. A 'Bearish' rating means most stocks in the sector have (or the weighted average recommendation of the stocks under coverage is) a negative absolute recommendation. Target Price A Target Price, if discussed, reflects in part the analyst's estimates for the company's earnings. The achievement of any target price may be impeded by general market and macroeconomic trends, and by other risks related to the company or the market, and may not occur if the company's earnings differ from estimates.

Nomura | India financials 17 June 2015
75
Disclaimers This document contains material that has been prepared by the Nomura entity identified on page 1 and/or with the sole or joint contributions of one or more Nomura entities whose employees and their respective affiliations are also specified on page 1 or identified elsewhere in the document. The term "Nomura Group" used herein refers to Nomura Holdings, Inc. or any of its affiliates or subsidiaries and may refer to one or more Nomura Group companies including: Nomura Securities Co., Ltd. ('NSC') Tokyo, Japan; Nomura International plc ('NIplc'), UK; Nomura Securities International, Inc. ('NSI'), New York, US; Nomura International (Hong Kong) Ltd. (‘NIHK’), Hong Kong; Nomura Financial Investment (Korea) Co., Ltd. (‘NFIK’), Korea (Information on Nomura analysts registered with the Korea Financial Investment Association ('KOFIA') can be found on the KOFIA Intranet at http://dis.kofia.or.kr); Nomura Singapore Ltd. (‘NSL’), Singapore (Registration number 197201440E, regulated by the Monetary Authority of Singapore); Nomura Australia Ltd. (‘NAL’), Australia (ABN 48 003 032 513), regulated by the Australian Securities and Investment Commission ('ASIC') and holder of an Australian financial services licence number 246412; P.T. Nomura Indonesia (‘PTNI’), Indonesia; Nomura Securities Malaysia Sdn. Bhd. (‘NSM’), Malaysia; NIHK, Taipei Branch (‘NITB’), Taiwan; Nomura Financial Advisory and Securities (India) Private Limited (‘NFASL’), Mumbai, India (Registered Address: Ceejay House, Level 11, Plot F, Shivsagar Estate, Dr. Annie Besant Road, Worli, Mumbai- 400 018, India; Tel: +91 22 4037 4037, Fax: +91 22 4037 4111; CIN No : U74140MH2007PTC169116, SEBI Registration No: BSE INB011299030, NSE INB231299034, INF231299034, INE 231299034, MCX: INE261299034) and NIplc, Madrid Branch (‘NIplc, Madrid’). ‘CNS Thailand’ next to an analyst’s name on the front page of a research report indicates that the analyst is employed by Capital Nomura Securities Public Company Limited (‘CNS’) to provide research assistance services to NSL under a Research Assistance Agreement. ‘NSFSPL’ next to an employee’s name on the front page of a research report indicates that the individual is employed by Nomura Structured Finance Services Private Limited to provide assistance to certain Nomura entities under inter-company agreements. THIS MATERIAL IS: (I) FOR YOUR PRIVATE INFORMATION, AND WE ARE NOT SOLICITING ANY ACTION BASED UPON IT; (II) NOT TO BE CONSTRUED AS AN OFFER TO SELL OR A SOLICITATION OF AN OFFER TO BUY ANY SECURITY IN ANY JURISDICTION WHERE SUCH OFFER OR SOLICITATION WOULD BE ILLEGAL; AND (III) BASED UPON INFORMATION FROM SOURCES THAT WE CONSIDER RELIABLE, BUT HAS NOT BEEN INDEPENDENTLY VERIFIED BY NOMURA GROUP. Nomura Group does not warrant or represent that the document is accurate, complete, reliable, fit for any particular purpose or merchantable and does not accept liability for any act (or decision not to act) resulting from use of this document and related data. To the maximum extent permissible all warranties and other assurances by Nomura group are hereby excluded and Nomura Group shall have no liability for the use, misuse, or distribution of this information. Opinions or estimates expressed are current opinions as of the original publication date appearing on this material and the information, including the opinions and estimates contained herein, are subject to change without notice. Nomura Group is under no duty to update this document. Any comments or statements made herein are those of the author(s) and may differ from views held by other parties within Nomura Group. Clients should consider whether any advice or recommendation in this report is suitable for their particular circumstances and, if appropriate, seek professional advice, including tax advice. Nomura Group does not provide tax advice. Nomura Group, and/or its officers, directors and employees, may, to the extent permitted by applicable law and/or regulation, deal as principal, agent, or otherwise, or have long or short positions in, or buy or sell, the securities, commodities or instruments, or options or other derivative instruments based thereon, of issuers or securities mentioned herein. Nomura Group companies may also act as market maker or liquidity provider (within the meaning of applicable regulations in the UK) in the financial instruments of the issuer. Where the activity of market maker is carried out in accordance with the definition given to it by specific laws and regulations of the US or other jurisdictions, this will be separately disclosed within the specific issuer disclosures. This document may contain information obtained from third parties, including ratings from credit ratings agencies such as Standard & Poor’s. Reproduction and distribution of third-party content in any form is prohibited except with the prior written permission of the related third-party. Third-party content providers do not guarantee the accuracy, completeness, timeliness or availability of any information, including ratings, and are not responsible for any errors or omissions (negligent or otherwise), regardless of the cause, or for the results obtained from the use of such content. Third-party content providers give no express or implied warranties, including, but not limited to, any warranties of merchantability or fitness for a particular purpose or use. Third-party content providers shall not be liable for any direct, indirect, incidental, exemplary, compensatory, punitive, special or consequential damages, costs, expenses, legal fees, or losses (including lost income or profits and opportunity costs) in connection with any use of their content, including ratings. Credit ratings are statements of opinions and are not statements of fact or recommendations to purchase hold or sell securities. They do not address the suitability of securities or the suitability of securities for investment purposes, and should not be relied on as investment advice. Any MSCI sourced information in this document is the exclusive property of MSCI Inc. (‘MSCI’). Without prior written permission of MSCI, this information and any other MSCI intellectual property may not be reproduced, re-disseminated or used to create any financial products, including any indices. This information is provided on an "as is" basis. The user assumes the entire risk of any use made of this information. MSCI, its affiliates and any third party involved in, or related to, computing or compiling the information hereby expressly disclaim all warranties of originality, accuracy, completeness, merchantability or fitness for a particular purpose with respect to any of this information. Without limiting any of the foregoing, in no event shall MSCI, any of its affiliates or any third party involved in, or related to, computing or compiling the information have any liability for any damages of any kind. MSCI and the MSCI indexes are services marks of MSCI and its affiliates. Russell/Nomura Japan Equity Indexes are protected by certain intellectual property rights of Nomura Securities Co., Ltd. and Russell Investments. Nomura Securities Co., Ltd. and Russell Investments do not guarantee the accuracy, completeness, reliability, or usefulness thereof and do not account for business activities and services that any index user and its affiliates undertake with the use of the Indexes. Investors should consider this document as only a single factor in making their investment decision and, as such, the report should not be viewed as identifying or suggesting all risks, direct or indirect, that may be associated with any investment decision. Nomura Group produces a number of different types of research product including, among others, fundamental analysis and quantitative analysis; recommendations contained in one type of research product may differ from recommendations contained in other types of research product, whether as a result of differing time horizons, methodologies or otherwise. Nomura Group publishes research product in a number of different ways including the posting of product on Nomura Group portals and/or distribution directly to clients. Different groups of clients may receive different products and services from the research department depending on their individual requirements. Figures presented herein may refer to past performance or simulations based on past performance which are not reliable indicators of future performance. Where the information contains an indication of future performance, such forecasts may not be a reliable indicator of future performance. Moreover, simulations are based on models and simplifying assumptions which may oversimplify and not reflect the future distribution of returns. Certain securities are subject to fluctuations in exchange rates that could have an adverse effect on the value or price of, or income derived from, the investment. The securities described herein may not have been registered under the US Securities Act of 1933 (the ‘1933 Act’), and, in such case, may not be offered or sold in the US or to US persons unless they have been registered under the 1933 Act, or except in compliance with an exemption from the registration requirements of the 1933 Act. Unless governing law permits otherwise, any transaction should be executed via a Nomura entity in your home jurisdiction.

Nomura | India financials 17 June 2015
76
This document has been approved for distribution in the UK and European Economic Area as investment research by NIplc. NIplc is authorised by the Prudential Regulation Authority and regulated by the Financial Conduct Authority and the Prudential Regulation Authority. NIplc is a member of the London Stock Exchange. This document does not constitute a personal recommendation within the meaning of applicable regulations in the UK, or take into account the particular investment objectives, financial situations, or needs of individual investors. This document is intended only for investors who are 'eligible counterparties' or 'professional clients' for the purposes of applicable regulations in the UK, and may not, therefore, be redistributed to persons who are 'retail clients' for such purposes. This document has been approved by NIHK, which is regulated by the Hong Kong Securities and Futures Commission, for distribution in Hong Kong by NIHK. This document has been approved for distribution in Australia by NAL, which is authorized and regulated in Australia by the ASIC. This document has also been approved for distribution in Malaysia by NSM. In Singapore, this document has been distributed by NSL. NSL accepts legal responsibility for the content of this document, where it concerns securities, futures and foreign exchange, issued by their foreign affiliates in respect of recipients who are not accredited, expert or institutional investors as defined by the Securities and Futures Act (Chapter 289). Recipients of this document in Singapore should contact NSL in respect of matters arising from, or in connection with, this document. Unless prohibited by the provisions of Regulation S of the 1933 Act, this material is distributed in the US, by NSI, a US-registered broker-dealer, which accepts responsibility for its contents in accordance with the provisions of Rule 15a-6, under the US Securities Exchange Act of 1934. The entity that prepared this document permits its separately operated affiliates within the Nomura Group to make copies of such documents available to their clients. This document has not been approved for distribution to persons other than ‘Authorised Persons’, ‘Exempt Persons’ or ‘Institutions’ (as defined by the Capital Markets Authority) in the Kingdom of Saudi Arabia (‘Saudi Arabia’) or 'professional clients' (as defined by the Dubai Financial Services Authority) in the United Arab Emirates (‘UAE’) or a ‘Market Counterparty’ or ‘Business Customers’ (as defined by the Qatar Financial Centre Regulatory Authority) in the State of Qatar (‘Qatar’) by Nomura Saudi Arabia, NIplc or any other member of Nomura Group, as the case may be. Neither this document nor any copy thereof may be taken or transmitted or distributed, directly or indirectly, by any person other than those authorised to do so into Saudi Arabia or in the UAE or in Qatar or to any person other than ‘Authorised Persons’, ‘Exempt Persons’ or ‘Institutions’ located in Saudi Arabia or 'professional clients' in the UAE or a ‘Market Counterparty’ or ‘Business Customers’ in Qatar . By accepting to receive this document, you represent that you are not located in Saudi Arabia or that you are an ‘Authorised Person’, an ‘Exempt Person’ or an ‘Institution’ in Saudi Arabia or that you are a 'professional client' in the UAE or a ‘Market Counterparty’ or ‘Business Customers’ in Qatar and agree to comply with these restrictions. Any failure to comply with these restrictions may constitute a violation of the laws of the UAE or Saudi Arabia or Qatar. NO PART OF THIS MATERIAL MAY BE (I) COPIED, PHOTOCOPIED, OR DUPLICATED IN ANY FORM, BY ANY MEANS; OR (II) REDISTRIBUTED WITHOUT THE PRIOR WRITTEN CONSENT OF A MEMBER OF NOMURA GROUP. If this document has been distributed by electronic transmission, such as e-mail, then such transmission cannot be guaranteed to be secure or error-free as information could be intercepted, corrupted, lost, destroyed, arrive late or incomplete, or contain viruses. The sender therefore does not accept liability for any errors or omissions in the contents of this document, which may arise as a result of electronic transmission. If verification is required, please request a hard-copy version. Nomura Group manages conflicts with respect to the production of research through its compliance policies and procedures (including, but not limited to, Conflicts of Interest, Chinese Wall and Confidentiality policies) as well as through the maintenance of Chinese walls and employee training. Additional information is available upon request and disclosure information is available at the Nomura Disclosure web page: http://go.nomuranow.com/research/globalresearchportal/pages/disclosures/disclosures.aspx Copyright © 2015 Nomura International (Hong Kong) Ltd. All rights reserved.

Nomura Asian Equity Research Group
Hong Kong Nomura International (Hong Kong) Limited 30/F Two International Finance Centre, 8 Finance Street, Central, Hong Kong Tel: +852 2536 1111 Fax: +852 2536 1820
Singapore
Nomura Singapore Limited 10 Marina Boulevard Marina Bay Financial Centre Tower 2, #36-01, Singapore 018983, Singapore Tel: +65 6433 6288 Fax: +65 6433 6169
Taipei Nomura International (Hong Kong) Limited, Taipei Branch 17th Floor, Walsin Lihwa Xinyi Building, No.1, Songzhi Road, Taipei 11047, Taiwan, R.O.C. Tel: +886 2 2176 9999 Fax: +886 2 2176 9900
Seoul Nomura Financial Investment (Korea) Co., Ltd. 17th floor, Seoul Finance Center, 84 Taepyeongno 1-ga, Jung-gu, Seoul 100-768, Korea Tel: +82 2 3783 2000 Fax: +82 2 3783 2500
Kuala Lumpur Nomura Securities Malaysia Sdn. Bhd. Suite No 16.5, Level 16, Menara IMC, 8 Jalan Sultan Ismail, 50250 Kuala Lumpur, Malaysia Tel: +60 3 2027 6811 Fax: +60 3 2027 6888
India Nomura Financial Advisory and Securities (India) Private Limited Ceejay House, Level 11, Plot F, Shivsagar Estate, Dr. Annie Besant Road, Worli, Mumbai- 400 018, India Tel: +91 22 4037 4037 Fax: +91 22 4037 4111
Indonesia PT Nomura Indonesia Suite 209A, 9th Floor, Sentral Senayan II Building Jl. Asia Afrika No. 8, Gelora Bung Karno, Jakarta 10270, Indonesia Tel: +62 21 2991 3300 Fax: +62 21 2991 3333
Sydney Nomura Australia Ltd. Level 25, Governor Phillip Tower, 1 Farrer Place, Sydney NSW 2000 Tel: +61 2 8062 8000 Fax: +61 2 8062 8362
Tokyo Equity Research Department Financial & Economic Research Center Nomura Securities Co., Ltd. 17/F Urbannet Building, 2-2, Otemachi 2-chome Chiyoda-ku, Tokyo 100-8130, Japan Tel: +81 3 5255 1658 Fax: +81 3 5255 1747, 3272 0869
Caring for the environment: to receive only the electronic versions of our research, please contact your sales representative.