hfc inventory ghana...hfc inventory ghana 2011-2014 prepared by dr. kwame owusu-achaw reviewed by...
TRANSCRIPT
HFC Inventory
GHANA 2011-2014
Prepared by Dr. Kwame Owusu-Achaw Reviewed by Richard Abrokwa-Ampadu
Implemented by the United Nations Development Programme (UNDP) For the Climate and Clean Air Coalition to Reduce Short-Lived Climate Pollutants
2015

2
EXECUTIVE SUMMARY In February 2012, the Governments of Bangladesh, Canada, Ghana, Mexico, Sweden and the United States, and the United Nations Environment Programme (UNEP), formed the Climate and Clean Air Coalition to Reduce Short Lived Climate Pollutants (CCAC); a unique initiative to support fast action to reduce short-lived climate pollutants (SLCPs) such as black carbon (soot), methane and some hydrofluorocarbons (HFCs). Ghana ratified the United Nations Framework Convention for Climate Change (UNFCCC) and the Kyoto Protocol and initiated actions to implement a national policy for Climate Change, i.e. the development of a country adaptation system and the formulation of a Ghanaian strategy for a sustainable low-in-carbon development with sectorial mitigation plans. The country has also ratified the Vienna Convention and the Montreal Protocol with all its amendments to control the consumption of the substances that deplete the Ozone layer and currently is engaged in the implementation of the first stage of the HCFC Phase-out Management Plan (HPMP). This document is a report on survey and analysis carried out on HFC installations and the bank of HFC refrigerants in Ghana as well as HFC consumption in the period 2011-2014. The activity was undertaken within the context of CCAC’s HFC focal area initiative to conduct initial surveys of HFCs in selected developing countries, including Bangladesh, Chile, Colombia, Ghana, Indonesia and Nigeria.
In Tables ES.1 and ES.2 is the consumption of HFCs and HFC blends in the period 2011-2014. Almost all consumption is for the servicing of the Refrigeration and Air Conditioning (RAC) sector and there is no manufacturing in Ghana.
Table ES.1: Consumption of HFC and HFC blends in 2011-2014 (MT)
Year HFC-134a R-404A R-410A R-407C R-507A Total HFC and HFC blends
R-600a
2011 49.3 13.5 2.9 16.0 1.4 83.1 11.9
2012 108.4 41.4 13.1 14.5 5.7 183.1 36.8
2013 118.7 25.8 18.5 14.6 4.5 182.1 11.1
2014 65.3 11.7 29.3 4.4 0.1 110.8 21.8
Percentage of import by substance (2014)
Per Cent
58.9 10.6 26.4 4.0 0.1 100 33.4*
* Consumption of R-600a as a percentage of HFC-134a consumption in 2014 – for information.
Table ES.2: Consumption of HFC and HFC blends in 2011-2014 (T CO2 eq)
Year HFC-134a R-404A R-410A R-407C R-507A Total HFC and HFC blends
R-600a
2011 70,499 51,300 5,510 25,600 5,320 158,229 36-60
2012 155,012 157,320 24,890 23,200 21,660 382,082 110-184
2013 169,741 98,040 35,150 23,360 17,100 343,391 33-56
2014 93,379 44,460 55,670 7,040 380 200,929 65-109
Percentage of import by substance (2014)

3
Per Cent 46.5 22.1 27.7 3.5 0.2 100 < 0.1%
In Figure 1 below, projected future HFC consumption is represented for the period of 2015-2020:
Figure 1.: Projected future HFC consumption, 2015-2020 in MT
Refrigeration and Air Conditioning (RAC) industry is the main consumer of HFC gases in Ghana. For this study, the industry is divided into five sectors and the installed refrigerant base of HFCs by substance in the various sectors is shown in Table ES.3 below:
Table ES.3: Installed base of HFCs - Refrigeration and Air Conditioning Sectors (MT)
Sector HFC-134a
R-404A R-407C R-410A R-507 Total (MT)
Per Cent
R-600a
Domestic and Commercial Refrigeration (including Small Scale Cold Stores and Cold Stores using domestic refrigeration appliances, Display Cases etc.)
276.4 0.0 0.0 0.0 0.0 276.4 26.5 70.2
Industrial Refrigeration (including Medium and Large Cold Storage plants, Processing plants)
11.0 277.4 3.5 0.0 55.4 347.4 33.3 0.0
Stationary Air Conditioning (Residential and Commercial)
0.0 0.0 42.0 75.6 0.0 117.6 11.3 0.0
Mobile Air Conditioning (MAC)
302.7 0.0 0.0 0.0 0.0 302.7 29.0 0.0
Total (MT) 590.1 277.4 45.5 75.6 55.5 1044.1 100.1 70.2
142
172
216
261
282
310
337
83
109
141
177187
199210
25 32
4252
6376
88
0
50
100
150
200
250
300
350
400
2014 2015 2016 2017 2018 2019 2020
Fig. ES.1: Projected future HFC consumption, 2014 - 2020
Total R134a R410
4
Per Cent 53.0 24.9 4.1 6.8 5.0 100.0
Table ES.4: Source of imported HFCs and HFC blends
Source of Import
2011 2012 2013 2014
Quantity (T) % Quantity (T) % Quantity (T) % Quantity (T) %
China 83.7 88.1 178.3 96.9 178.8 92.6 122.7 92.6
UK 5. 5.3 5.6 3.1 5.4 2.8 0 0.0
UAE 6.2 6.6 0 0.0 1.2 0.6 2.7 2.0
Belgium 0 0.0 0 0.0 3.4 1.7 0 0.0
South Africa 0 0.0 0 0.0 1.80 0.9 0 0.0
India 0 0.0 0 0.0 2.6 1.3 7.1 5.4
Total 95.0 100.0 183.9 100.0 193.1 100.0 132.6 100.0
The following low GWP replacement options are proposed for the various sectors in the country based on the report published by the Refrigeration Technical Options Committee (RTOC) of the Montreal Protocol:
Table ES.5: Low GWP Options for Relevant RAC Sectors
Sector Sub-sector Current substance Low GWP option
Refrigeration Domestic HFC 134a HC-600a, HFC-1234yf, Propane
Commercial (stand-alone equipment)
HFC 134a, R-404A
HC-600a and HC-290 for small units with charges under 1.5kg, HFC-1234yf and CO2, Iso-butane, Propane
Display Cabinets R-404A, R-507A, HFC-134a
HC-290 and HC-1270, Iso-butane, Propane, R441A
Refrigerated trucks R-404A, HFC 134a HFC-1234yf as replacement of HFC-134a, Ethane
Reefers R-404A, HFC 134a CO2, Ethane
Air Conditioning
Split and Window type R407A, R-410A HC-290, HFC-32
Mobile HFC-134a HFC-1234yf, CO2
Proposed Projects The following projects have been proposed as potential follow-up activities to the HFC survey.
Table ES.6: Proposed Projects
Sector Project Outputs
1. Institutional Strengthening
i. Integration of HFCs inventory results in Ghana’s low carbon based development strategy
Green house emissions due to HFCs in Ghana calculated.
Abatement curves developed and disseminated.
Mitigation actions defined and prioritized.
ii. Integration of ODS consumption data collection with data collection of consumption of high GWP chemicals
Availability of up-to-date data on green house gases and other climate-impacting chemicals enhanced.

5
and their emissions from application processes.
Better coordination of ozone protection and climate change mitigation information.
iii. Public awareness on HFC substances, energy efficiency and climate issues (in collaboration with relevant agencies)
Stakeholders in RAC sector and general public made aware of nature of HFCs and blends and the socio-economic and environmental impact of their use.
iv. Programme monitoring and evaluation
Periodic and regular reports on progress of implementation of activities are made available. Assessment of various aspects of programme organized as required or facilitated.
2. Refrigeration Sub-Sector Activities
(a) Domestic and Small Scale Commercial Refrigeration Units
i. Recovery and recycling of HFC and HFC blend refrigerants in the servicing of domestic and commercial refrigeration equipment.
R and R programme of HPMP extended to domestic and commercial refrigeration equipment not covered under HPMP. Conservation of high GWP refrigerants improved. Import of virgin high GWP refrigerants (R-404A, R-507C, R-410A, HFC-134a) reduced.
ii. Conversion of stand-alone commercial units using HFC/HFC blend refrigerants to climate-friendly systems
Selected enterprises using stand-alone commercial units converted from high GWP refrigerant technology to low GWP hydrocarbon technology (HFC-134a replacement with R-600a; R-404A replacement with R290)
(b) Large Scale Commercial/Industrial Refrigeration Units
iii. Study of socio-economic and environmental impact of refrigeration and comfort cooling systems in supermarket operations.
Enhanced information on baseline data and on cost efficiencies and environmental impact of the use of HFC-based refrigeration systems and identification of potential mitigation activities.
iv. Demonstration projects in the supermarket subsector aiming at HFC replacement improvement and improvement of energy efficiency
a. Implementation of a demonstration project with a cascade system using R-717/R744 (CO2).
b. Implementation of a demonstration project with a cascade system using R-290 (propane)/R-744(CO2).
c. Implementation of a demonstration project with a trans-critical CO2 system
3. Air Conditioning Sub-Sector Activities
i. Recovery and recycling of HFC and HFC blend refrigerants in the servicing of residential and commercial air conditioning units.
R and R programme of HPMP extended to residential and commercial air conditioning equipment not covered under HPMP. Conservation of high GWP refrigerants improved. Reliance on virgin high GWP refrigerants (R-404A, R-507C, R-410A, HFC-134a) reduced
ii. Study of socio-economic and environmental impact of comfort cooling systems in hotels and large commercial/office blocks without centralized cooling system.
Enhanced information on baseline data and on cost efficiencies and environmental impact of the use of HFC-based cooling systems and identification of potential mitigation activities.
iii. Demonstration project for the use of a low GWP options for central air conditioning system in commercial/office buildings
a. Implementation of a demonstration project with a hydrocarbon air conditioning system in hotels;
b. Implementation of a demonstration project with a low GWP air conditioning system in commercial/office buildings;

6
Contents EXECUTIVE SUMMARY ............................................................................................................................. 2
1. Introduction ..................................................................................................................................... 7
2. Methodology of data collection and analysis .................................................................................. 7
3. Overview of country’s refrigerant installation ................................................................................ 9
3.1 Installed refrigerant capacity .................................................................................................... 9
3.2 HFCs and HFC Blends ............................................................................................................... 11
3.3 Installed RAC Equipment ......................................................................................................... 13
3.4 HFC substances and application areas .................................................................................... 13
3.5 Market sectors ........................................................................................................................ 14
4. HFC Imports and Exports ............................................................................................................... 14
4.1. Importers ................................................................................................................................. 15
4.2. Origin of Imports ..................................................................................................................... 17
4.3 Packaging and prices ............................................................................................................... 18
5. HFC consumption ........................................................................................................................... 19
5.1. Climate impact of HFC consumption....................................................................................... 20
5.1. HFC consumption at end-user level ........................................................................................ 22
5.1.1. Comparison with HFC refrigerant import data ................................................................ 22
5.2 Projected trend of future consumption of HFCs and their potential alternatives ................. 23
5.3 HFC and HFC blend refrigerants .............................................................................................. 25
5.4. Non-fluorinated alternatives ................................................................................................... 26
6. Conclusions .................................................................................................................................... 28
7. HFC replacement options and projects ......................................................................................... 29
7.1 Low GWP options .................................................................................................................... 29
7.2 Projects .................................................................................................................................... 29
APPENDIX 1: ........................................................................................................................................... 32
REFERENCES ........................................................................................................................................... 34

7
1. Introduction Hydrofluorocarbon (HFC) and Hydrochlorofluorocarbon (HCFC) refrigerants were developed as alternative refrigerants to replace CFC refrigerants. Since HCFCs are ozone depleting substances (ODS) just like CFCs, although with lower ozone depleting potential (ODP), they are currently being phased out under the Montreal Protocol and replaced by alternatives, including HFCs. However, in view of the high global warming potential of most HFCs there is international pressure to control the production and consumption of HFCs as alternatives to HCFCs, including its consumption as refrigerants. To strategically position Ghana to contain any potential adverse impact of possible global phase out/down of HFC consumption and appropriately manage the national dependence on HFCs in the various user sectors, the National Ozone Unit of EPA, Ghana in collaboration with one of its international partners, UNDP, has carried out a survey of installed refrigeration and air-conditioning (RAC) units in the country to determine the installed base of RAC systems as well as HFC-based refrigerant bank (installed capacity in the RAC sector) in the country and by default also ascertain installed capacity of HCFC-based RAC systems.
The activity also included the collection and analysis of data to establish annual HFC consumption and potential growth in the HFC refrigerant bank in the country. Almost all HFC consumption is for the servicing of the Refrigeration and Air Conditioning (RAC) sector and there is no manufacturing in Ghana.
2. Methodology of data collection and analysis
Data Collection to Establish Installed RAC Refrigerant Capacity (Refrigerant Bank) The survey was conducted beginning May 2014 in all the ten (10) regions of the country. It was carried out by three (3) teams, each comprising two (2) technicians and an engineer as the lead investigator. One team surveyed the northern sector of the country, the second surveyed the middle and central parts whilst the third covered the southern sector. Each team was provided with an introductory letter by the Environmental Protection Agency (EPA) to facilitate the survey. The teams were tasked to visit various organizations, institutions and major refrigerant user facilities to collect data on the kind of cooling systems in use, the type of refrigerant and related volumes. In addition, they were to gather data on incremental trends of installed equipment vis-a-vis refrigerant consumption in the period 2011-2013. Data collected from the survey covered (fixed equipment) residential air conditioners and air conditioners in commercial facilities, refrigerators, supermarket display cases, provision cold rooms in hotels and catering services, cold store and ice manufacturing plants, morgues, etc. and was not limited to HFC substances only. Data was collected also for HCFCs and blends (R-406A) and other alternative chemicals to HCFCs such as isobutane (R-600a) and ammonia (R-717).
8
To provide a complete overview of the HFC situation in the country, a supplementary survey was conducted in December 2014 to collect data on Mobile Air Conditioners (MACs) that was not covered in the earlier survey. This involved field survey as well as review of records of all automobile vehicles registered in the country through data supplied by the Driver, Vehicle and Licensing Authority of Ghana (DVLA). Please see Appendix 1. Data Collection to determine HFC (refrigerant) consumption Data on import of HFCs was collected through the use of the licensing system, which regulates the import of ozone depleting substances as well as their alternatives. The regulation requires all importers that wish to import chemicals within the relevant schedule of the regulations under the Environmental Protection Agency (EPA) Act to register with and request import license from the EPA for the chemical being imported prior to importing that chemical. The Customs authorities check the chemicals arriving at the ports against the licenses issued by the EPA for their import before they are released to the importer. Thus the Customs' import records for the years concerned were checked against licenses issued by the EPA for the same period in order to establish and validate the quantities of chemicals imported, the identity of the importers, the time of their import, and the origin of import. The data obtained was used to determine the levels of annual consumption of HCFCs, HFCs and other alternative chemicals, including R-600a. Data analysis The Terms of Reference (TOR) for analyzing data collected from the survey are as follows:
Establish market penetration of currently available commercial HCFC alternatives, specifically HFCs (HFC-134a, R400 and R500 series) by substance (and to the extent feasible, by sector i.e. domestic (residential) air conditioning, mobile air conditioning, commercial & industrial air conditioning, cold stores etc.).
Identify emerging HFCs used as alternatives to HCFCs in Ghana, in terms of their expected market introduction and availability, performance and projected costs.
The data collected have been analysed accordingly and the results described in the following sections of the report.
9
3. Overview of country’s refrigerant installation
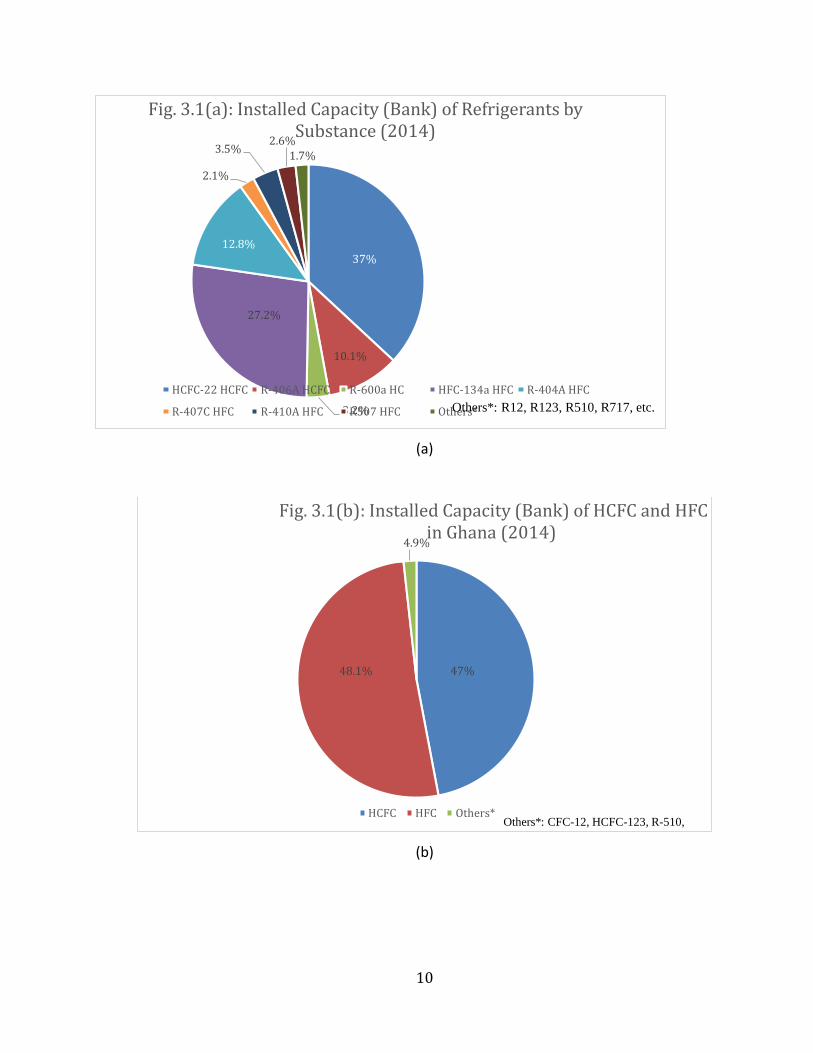
3.1 Installed refrigerant capacity General Shown in Table 3.1 is an overview of installed refrigerants nationwide for 2014. HCFC and HFC substances combined represent 95% of the total refrigerant volume in the country. Of the remaining refrigerants (“others”, 1.7%), ammonia (R-717) and CFC-12 are the most significant. Ammonia application is found in areas of large refrigeration load such as cold stores, breweries and process industries. CFC-12 can still be found in old refrigerators but this has been reduced to insignificant volume following the ban of the gas. Distribution of installed refrigerants is also displayed on the pie chart in Figures 3.1(a) and 3.1(b). The result shows that as in 2014 the amount of HFC and HFC blend refrigerant in installed RAC equipment (bank of refrigerants) (48.1%) had a slight margin over HCFC (47%). HCFC continues to enjoy popular application in the domestic and commercial air conditioning service. By substance, HCFC 22 had the biggest installed share with over 37% followed by HFC-134a with 27.2% share.
Table 3.1: Refrigerants in Installed RAC Equipment (Refrigerant Bank) in Ghana
Refrigerant Type HCFC HCFC Blend
HFC HFC Blend Non-HFC Alternatives
Substance HCFC-22
R-406A
HFC-134A
R-404A R-407C R-410A R-507 R-600a Others* Total
Total (MT) 802.7 218.5 590.1 277.4 45.5 75.6 55.5 70.2 36.2 2171.7
Percentage of Total (Individual Refrigerants)
37 10.1 27.2 12.8 2.1 3.5 2.6 3.2 1.7 100
Refrigerant Group HCFC and Blend HFC and Blends Non-HFC Alternatives
Total (MT) 1,021.20 1044.1 106.4 2,171.7
Percentage of Total (Refrigerant Groups)
47.0 48.1 4.9 100
Others*: CFC-12, HCFC-123, R-510, R-717, etc.
10
(a)
(b)
37%
10.1%
3.2%
27.2%
12.8%
2.1%
3.5%2.6%
1.7%
Fig. 3.1(a): Installed Capacity (Bank) of Refrigerants by Substance (2014)
HCFC-22 HCFC R-406A HCFC R-600a HC HFC-134a HFC R-404A HFC
R-407C HFC R-410A HFC R507 HFC Others*Others*: R12, R123, R510, R717, etc.
47%48.1%
4.9%
Fig. 3.1(b): Installed Capacity (Bank) of HCFC and HFC in Ghana (2014)
HCFC HFC Others*Others*: CFC-12, HCFC-123, R-510,

11
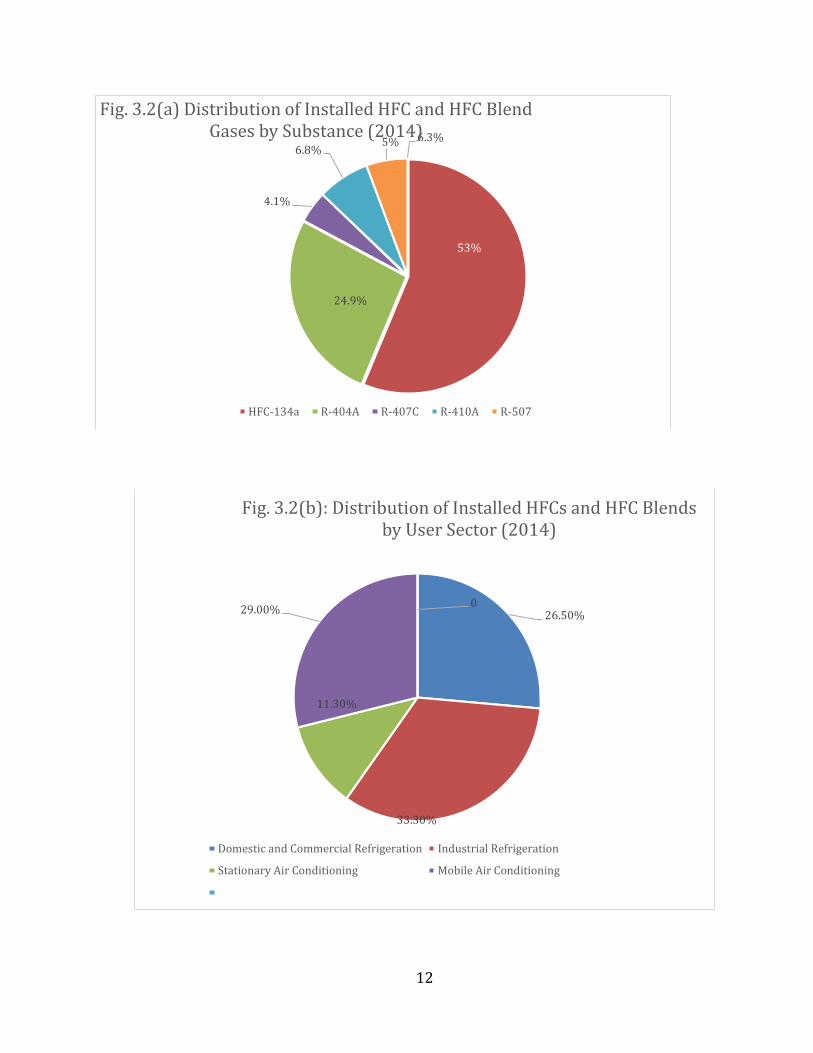
3.2 HFCs and HFC Blends Table 3.2 gives an overview of the distribution of the country’s installed HFC gases and blends of HFC gases by substance and by sector in 2014. By substance, HFC-134a carries the bigger share at 56.5% followed by R-404A blend with 26.6% share. By Sector, the Medium and Large Cold Storage Plants/Processing Plants (Industrial) have the bigger share of 33.3% of installed refrigerant capacity followed closely by MACs (29%). The distribution is further illustrated by the pie-charts in Figure 3.2.
Table 3.2 - Installed HFC Refrigerants (Refrigerant Bank) in 2014 (MT)
Sector HFC-134a R-404A R-407C R-410A R-507
Total (MT)
Per Cent R-600a
Domestic and Commercial Refrigeration (including Small Scale Cold Stores and Cold Stores using domestic refrigeration appliances, Display Cases etc.) 276.4 0.0 0.0 0.0 0.0 276.4 26.5 70.2
Industrial Refrigeration (including Medium and Large Cold Storage plants, Processing plants) 11.0 277.4 3.5 0.0 55.4 347.4 33.3 0.0
Stationary Air Conditioning (Residential and Commercial) 0.0 0.0 42.0 75.6 0.0 117.6 11.3 0.0
Mobile Air Conditioning (MAC) 302.7 0.0 0.0 0.0 0.0 302.7 29.0 0.0
Total (MT) 590.1 277.4 45.5 75.6 55.5 1044.1 100 70.2
Per Cent 53.0 24.9 4.1 6.8 5.0 100.0
12
6.3%
53%
24.9%
4.1%
6.8%5%
Fig. 3.2(a) Distribution of Installed HFC and HFC Blend Gases by Substance (2014)
HFC-134a R-404A R-407C R-410A R-507
26.50%
33.30%
11.30%
29.00%0
Fig. 3.2(b): Distribution of Installed HFCs and HFC Blends by User Sector (2014)
Domestic and Commercial Refrigeration Industrial Refrigeration
Stationary Air Conditioning Mobile Air Conditioning
13
3.3 Installed RAC Equipment RAC equipment surveyed comprises the following:
a) Domestic Refrigeration: Domestic refrigerators and freezers.1
b) Commercial Refrigeration: Small scale cold stores, display cabinets, walk-in freezers, wine/bottle coolers, mortuary facilities etc.
c) Industrial Refrigeration: Medium and large cold storage plants, processing plants, breweries.
d) Transportation Refrigeration: Refrigerated trucks, reefers
e) Stationary Air Conditioners: Window unit, Single and Multi split units, VRF systems, Ducted (central) systems.
f) Mobile Air Conditioners (MACs). Refrigerant banks in the various equipment are captured in the survey data report of which a grand summary is given in Table 3.1 above
3.4 HFC substances and application areas Table 3.3 shows the HFC and HCFC refrigerant gases and blends currently available on the Ghana market and their common areas of application. Together, the two refrigerant classes represent 98.3% of refrigerants used in the country with the remainder being CFC-12 in old refrigerators, R-600a in domestic and small commercial refrigerators and R-717 in cold stores and industrial plants (see Section 2.3 below). It is noted that HFC-134a is the only pure HFC that is used in the country; the rest are all HFC blends.
Table 3.3: HFC and HCFC Gases in Ghana and their Common Application
Refrigerant Type ODS replaced Area of Application
R-22 HCFC - Stationary air conditioners, display cases, refrigeration
plants
R-406a HCFC R-12 Domestic Refrigerators & Freezers
R-134a HFC R-12 Refrigerators, Transportation Refrigeration
1 It is estimated that this category may still be underestimated, due to the difficulty to survey the household use of domestic refrigerators and freezers and the corresponding refrigerant bank by substance.

14
R-404A HFC R-502 Commercial/Industrial refrigeration, Refrigerated
trucks, Display cases
R-407C HFC R-22 Stationary AC and industrial refrigeration plants
R-410A HFC R-22 Stationary AC and industrial refrigeration plants
R-507 HFC R-502 Refrigerated trucks, supermarket display cases
3.5 Market sectors Refrigeration and Air Conditioning (RAC) industry is the single main user of HFC and HCFC gases in the country. For the purpose of the analysis of the survey data, this market is divided into the following four market sectors: a. Domestic and Commercial Refrigeration: including Small Scale Cold Stores and Cold Stores using
domestic refrigeration appliances, Display Cases; b. Industrial Refrigeration: including Medium and Large Cold Storage plants, Processing plants; c. Transportation refrigeration; d. Stationary Air Conditioning: including Residential and Commercial; e. Mobile Air Conditioning (MAC) HFC substances are also consumed in fire protection equipment but consumption in this area is insignificant. Additionally, a small amount of HFCs (which was not possible to estimate) is imported within Metered-Dose Inhalers (MDI) - those MDIs are not manufactured in Ghana. This quantity being included in products, it would not be considered as consumption (as per the definition of consumption in the Montreal Protocol, for example).
4. HFC Imports and Exports Table 4.1 below shows the quantities of HFC and natural refrigerants that were imported from 2011-2014 based on data from the Customs department verified through the licensing system operated by the NOU. The cumulative trend in the import of refrigerants is illustrated in Figure 4.1. There were no exports during that period.
Table 4.1: Main Refrigerants Imported in Ghana (2011-2014) (and their Average Carbon Intensity)
Year
HFC and HFC Blends (MT)
Natural Refrigerants
(MT)
HFC-134a R-404A R-410A R-407C R-507A Total R-600a
2011 49.26 13.51 2.85 16.02 1.45 83.09 11.93

15
2012 108.44 41.43 13.12 14.49 5.65 183.13 36.77
2013 118.70 25.76 18.50 14.58 4.52 182.06 11.09
2014 65.32 11.68 29.25 4.44 0.06 110.75 21.80
Total 341.72 92.38 63.72 49.54 11.68 559.02 81.58
Per Cent 61.1 16.5 11.4 8.9 2.1 100.0
ODP 0.0 0.0 0.0 0.0 0.0 0.0
GWP 1,430 3,800 1,900 1,600 3,800 3-5
Average CO2 Equivalent (MT/year) 122,165 87,761 30,267 19,816 11,096 61-102
(*) Baseline GWP GWP: CO2 = 1; NH3 = 0; R-290 = 3-5; HFO-1234yf = 4;
4.1. Importers Twenty one companies are registered importers of HFCs and HFC blends. The list of the importers and the volumes of the different HFC and HFC blends as well as of R-600a gases they imported into the country in 2014 is shown in Table 4.2 below. The distribution of the import volumes among the importers is also illustrated in the pie chart in Figure 4.1. None of the Importers is a registered local agent of the major refrigerant producers.
95
220
193
133
0
50
100
150
200
250
2011 2012 2013 2014
Fig. 4.1: Trends in Total HFC imports for 2011 - 2014 in MT
Total Imports

16
The first six companies (Importer 1 – Importer 6) with combined share of over 65% of total HFC imports in 2014 imported for each year in the period 2011-2014, which suggests that importation of HFC substances is their steady business. One of the six companies is also the largest of importers of R-600a among seven companies that imported the refrigerant in that year. The remaining importers in the period are predominantly one time or two times importers that appear not to be in the steady business of importing HFC substances but may have become involved for one of several reasons. Some may have tried the business only to abandon on first or second attempt if they find it unprofitable. In some cases the import may be first refrigerant charge accompanying imported RAC equipment. Occasionally too, RAC companies executing a major project that requires a large volume of charge may decide to reduce their costs by ordering the gas themselves instead of buying from the local market.
Table 4.2: List of Importers of HFC and HFC Blends and R-600a in 2014 (kg)
Importers Refrigerants (kg)
HFC-134a R-404A R-410A R-407C R-507A
Total R-600a
Importer 1 18,000 2,260 20,260 7,735
Importer 2 2,720 5,450 2,260 2,260 12,690
Importer 3 8,157 1,281 1,187 1,130 11,755
Importer 4 2,720 8,160 10,880 650
Importer 5 5,100 4,632 9,732
Importer 6 6,392 273 283 170 58 7,174 2,015
Importer 7 7,800 7,800
Importer 8 408 408 7,280
Importer 9 6,800 339 7,139
Importer 10 5,085 5,085
Importer 11 2,720 2,720 1,950
Importer 12 2,992 466 599 4,056
Importer 13 1,188 1,188 1,690
Importer 14 2,700 2,700
Importer 15 1,360 1,130 2,490
Importer 16 2,480 2,480
Importer 17 1,050 1,050
Importer 18 340 283 283 905
Importer 19 162 162 483
Importer 20 44 44
Importer 21 33 33
Total 65,322 11,679 29,251 4,441 58 110,751 21,803

17
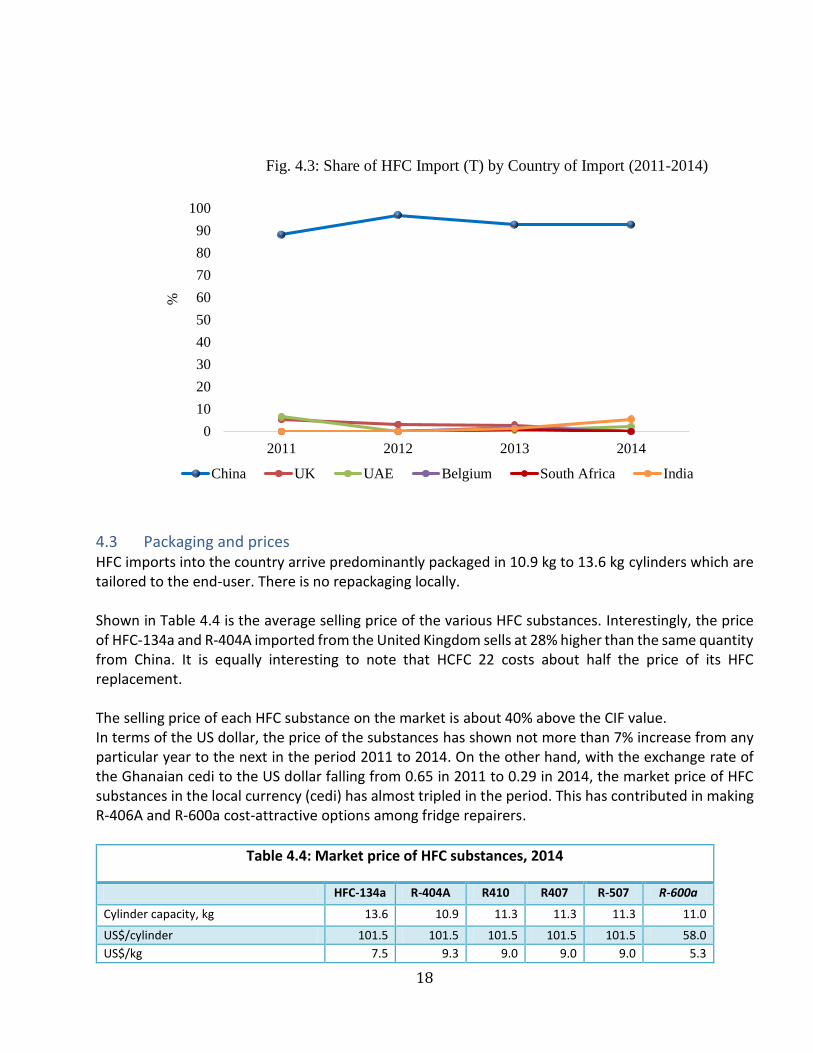
4.2. Origin of Imports HFC and HFC blends were imported from six countries. However, as shown in Table 4.3, China has been the traditional source of HFC import into the country with percentage share of total imports rising from over 88% to over 92% in the period 2011-2014. In 2012 China accounted for 97%, almost the entire import for the year, with the remainder coming from the United Kingdom (UK). As source of import, China is followed weakly by the United Kingdom (UK) with a dwindling share falling from 5.3% in 2011 to zero in 2014. However, of late imports from India, though not very significant, have seen some growth from zero in 2011 to over 5% in 2014. In 2014 only three countries (China: 97%, India: 5% and UAE: 2%) were the sources of import of HFCs and blends. Distribution of imports by countries of origin is shown in Figure 4.2.
Table 4.3: Source of imported HFCs and HFC blends
Source of Import
2011 2012 2013 2014
Quantity (kg) % Quantity (kg) % Quantity (kg) % Quantity (kg)
%
China 83,738 88.1 178,281 96.9 178,780 92.6 122,715 92.6
UK 5,035 5.3 5,620 3.1 5,400 2.8 0 0.0
UAE 6,240 6.6 0 0.0 1,243 0.6 2,700 2.0
Belgium 0 0.0 0 0.0 3,357 1.7 0 0.0
South Africa 0 0.0 0 0.0 1,760 0.9 0 0.0
India 0 0.0 0 0.0 2,600 1.3 7,139 5.4
Total 95,013 100.0 183,901 100.0 193,140 100.0 132,554 100.0
21.1%
9.6%
8.9%
8.7%7.3%
6.9%5.9%
5.8%
5.4%
3.8%
3.5%
3.1%10%
Fig. 4.2: Percentage of HFC imports by Importer, 2014
Importer 1 Importer 2 Importer 3 Importer 4 Importer 5
Importer 6 Importer 7 Importer 8 Importer 9 Importer 10
Importer 11 Importer 12 Others
18
4.3 Packaging and prices HFC imports into the country arrive predominantly packaged in 10.9 kg to 13.6 kg cylinders which are tailored to the end-user. There is no repackaging locally. Shown in Table 4.4 is the average selling price of the various HFC substances. Interestingly, the price of HFC-134a and R-404A imported from the United Kingdom sells at 28% higher than the same quantity from China. It is equally interesting to note that HCFC 22 costs about half the price of its HFC replacement. The selling price of each HFC substance on the market is about 40% above the CIF value. In terms of the US dollar, the price of the substances has shown not more than 7% increase from any particular year to the next in the period 2011 to 2014. On the other hand, with the exchange rate of the Ghanaian cedi to the US dollar falling from 0.65 in 2011 to 0.29 in 2014, the market price of HFC substances in the local currency (cedi) has almost tripled in the period. This has contributed in making R-406A and R-600a cost-attractive options among fridge repairers.
Table 4.4: Market price of HFC substances, 2014
HFC-134a R-404A R410 R407 R-507 R-600a
Cylinder capacity, kg 13.6 10.9 11.3 11.3 11.3 11.0
US$/cylinder 101.5 101.5 101.5 101.5 101.5 58.0
US$/kg 7.5 9.3 9.0 9.0 9.0 5.3
0
10
20
30
40
50
60
70
80
90
100
2011 2012 2013 2014
%Fig. 4.3: Share of HFC Import (T) by Country of Import (2011-2014)
China UK UAE Belgium South Africa India
19
5. HFC consumption Consumption of HFCs in Ghana for the period 2011-2014 was calculated as production plus import minus export. Since Ghana neither produces nor exported HFCs the consumption is the same as import as shown in Table 5.1 below, which is a reflection of Table 4.1. Table 5.1 also shows the consumption of R-600a, a potential low GWP replacement refrigerant for HFC-134a (R-134a), particularly in domestic refrigeration servicing application. HFC-134a has been the refrigerant with the highest consumption annually. However, as shown in the pie chart in Fig. 5.2 R-410A has shown significant growth from 2.9 tonnes in 2011 to 29.3 tonnes in 2014, which appears to follow the global trend. Figure 5.1 also illustrates the trends in total HFC consumption as well as the predominant HFCs and HFC blends, namely HFC-134a and R-404A, R-410A and R-407C, as well as R-600a for the period 2011 – 2014. As shown in Table 5.1 and illustrated in Figures 5.1 and 4.2 consumption of HFCs and the blends grew substantially from 2012, increasing in volume between 2011 and 2012 by over 100 per cent, except for R-407C, while at the same time the consumption of R-600a held study and even showed some growth. R-600a was introduced through the Refrigerant Management Plan (RMP) and the Terminal Phase-out Management Plan (TPMP) for the phase-out of CFC-12 under the Multilateral Fund as a substitute refrigerant for CFC-12 in domestic refrigerators and freezers through refrigerator retrofit programmes. In subsequent years 2012-2014 while R-410A showed steady growth at an average rate of about 50% the other HFC blends and HFC-134a showed some decline in consumption. Overall, after the phenomenal increase in consumption of HFC and HFC blends between 2011 and 2012 there appears to have been gradual decline thereafter by the average rate of about 20 per cent between 2012 and 2014. With regard to consumption of HFC-134a and R-600a the data shows that while consumption of HFC-134a showed a 45 per cent decline between 2013 and 2014 that of R-600a increased by nearly 100 per cent. In 2014 the amount of R-600a imported was over 30 per cent of that of HFC-134a. This could be attributed to growing confidence in the use of hydrocarbon refrigerants, at least in domestic refrigeration subsector as well as the prices of the two substances. While R-600a at US $5.3/kg is about 40% cheaper than HFC-134a at US $7.5/kg it requires less of R-600a than HFC-134a to service the same refrigerator. Thus while HFC-134a has the largest share of all HFC and HFC blend imports its use could potentially decline if hydrocarbon refrigerants such as R-600a for domestic refrigeration and R-290 for some residential air conditioners gain greater market penetration as OEMs switch to hydrocarbons, especially R-600a as refrigerant of choice for domestic refrigerators and freezers and as HFC-134a and HCFC-22 become more expensive due to market dynamics. As highlighted by some participants at the Stakeholder Consultative Workshop on National Hydrofluorocarbon (HFC) Inventory Report held on 24 March 2015 in addition to socio-economic factors, other factors also affected the consumption of HFC-134a and R-600a. The energy efficiency programme implemented by the Energy Commission in collaboration with the EPA with the support of UNDP. This involved a rebate and turn-in scheme for owners of old

20
refrigerators to turn in their old refrigerators for the purchase of energy efficient refrigerators at a discounted price. (The refrigerator turned in is sent to a dismantling facility for the recovery of ODS (both the refrigerant and from the insulation foam). The programme was implemented in conjunction with the enforcement of the ban on the importation of second-hand refrigerators which took effect at the beginning of 2013. The impact of the two complementary programmes is believed to have been the reduction in the demand for HFC-134a for servicing of domestic refrigerators and freezers, in view of the trend in refrigerator manufacturing towards ODS-free manufacturing with R-600a as the preferred refrigerant. The other factor was the severe nationwide power load shedding which affected commercial and industrial activities, thus putting pressure on servicing costs resulting in the need for lower cost refrigerant. Although a temporary phenomenon it could have the effect of a shift towards the use of R-600a, due to reasons mentioned earlier. Should the trend towards the use of R-600a be sustained this could result in a more favourable carbon footprint for the country given the very low carbon intensity of R-600a as indicated in Tables 5.1 and 5.2 below. Table 5.1: Consumption of HFC, HFC Blend and R-600a, 2011-2014 (MT)
Year HFC-134a R-404A R-410A R-407C R-507A Total R-600a (MT)
2011 49.3 13.5 2.9 16 1.4 83.1 11.9
2012 108.4 41.4 13.1 14.5 5.7 183.1 36.8
2013 118.7 25.8 18.5 14.6 4.5 182.1 11.1
2014 65.3 11.7 29.3 4.4 0.1 110.8 21.8
Total 341.7 92.4 63.8 49.5 11.7 559.1 81.6
Average 85.4 23.1 16.0 12.4 2.9 139.8 20.4
Percentages of 4-year cumulative consumption
Per Cent 61.1 16.5 11.4 8.9 2.1 100
Percentages of 2014 consumption
Per Cent 58.9 10.6 26.4 4 0.1 100 33.4*
GWP 1,430 3,922 2,088 1,774 3,922 3
Average CO2 Equivalent (MT/year) 122,158 90,598 33,304 21,953 11,472
61
* Consumption of R-600a as a percentage of HFC-134a consumption in 2014.
5.1. Climate impact of HFC consumption
As greenhouse gases the relative extent of global warming of the emissions of the HFCs consumed in the country expressed as tonnes of Carbon Dioxide equivalent (CO2 eq) was calculated and is reproduced in Table 5.1(b) below. As can be seen from the table, in 2014 HFC-134a (GWP: 1,430) accounting for about 59% of the total consumption accounted for 46.5% of the total CO2 eq for the year while R-404A (GWP: 3,922) accounted for 10.6 of the consumption but 22.1% of the CO2 eq.

21
Table 5.2: Impact of Consumption of HFC and HFC blends, as well as R600a in 2011-2014 (Tonne CO2 eq)
Year HFC-134a R-404A R-410A R-407C R-507A Total HFC
and blends R-600a
2011 70,499 51,300 5,510 25,600 5,320 158,229 36-60
2012 155,012 157,320 24,890 23,200 21,660 382,082 110-184
2013 169,741 98,040 35,150 23,360 17,100 343,391 33-56
2014 93,379 44,460 55,670 7,040 380 200,929 65-109
Aggregate 488,631 351,120 121,220 79,200 44,460 1,084,631 273-409
Average 122,158 87,780 30,305 19,800 11,115 271,158 68-102
Percentage of consumption and CO2 eq by substance (2014)
Consumption 58.9 10.6 26.4 4.1 0 100
CO2 eq 46.5 22.1 27.8 3.6 0 100 < 0.1%
0
20,000
40,000
60,000
80,000
100,000
120,000
140,000
160,000
180,000
200,000
2011 2012 2013 2014
Fig. 5.1: Trend of HFC Consumption by Substance 2011 - 2014 in Mkg
HFC-134a
R404A
R410A
R407C
R-507A
Total

22
5.1. HFC consumption at end-user level
Data for HFC consumption at the end-user level was collected within a limited time in an effort to validate the consumption data obtained from Customs import records. Table 5.3 below provides HFC consumption at the end-user level by Sector for 2014. Domestic refrigeration sector in this survey included household use as well as commercial use of domestic refrigeration appliances (refrigerators and freezers), while commercial refrigeration included cold stores. According to the end-user survey HFC-134a accounted for nearly 70% of the consumption split almost evenly between domestic refrigeration and MAC application sectors. R-404A used mainly in the commercial refrigeration sector and R-410A used for servicing stationary air conditioning equipment account for 15% and 7% respectively of the HFC blends used.
5.1.1. Comparison with HFC refrigerant import data Comparison between the import data and the end-user survey data showed significant differences both in the level of consumption of the substances and their distribution by application sector. The higher levels of consumption recorded through the end-user survey run counter to the socio-economic conditions that had been responsible for suppressing industrial and commercial activities, including the servicing industry in 2014. While, for instance, the Customs data showed very insignificant or no import of R-507A in 2014, the end-user survey recorded nearly 6 tonnes of the refrigerant being used in commercial refrigeration. The discrepancies associated with the end-user survey data could arise from intrinsic errors associated with such surveys. Primary problem arises from possible lack of understanding of what constitutes consumption. As most end users rely on purchases from retailers and other suppliers such purchases whether from the current year’s stock or inventories from previous
59%
11%
26%
4%
0%
Fig. 5.2: Percentage of HFC Consumption by Substance, in MT, 2014
134a
404a
410a
407c
507
23
years could be presented as consumption for the year. In view of these difficulties a more accurate field survey may have to be undertaken in future to better establish the use patterns of the refrigerants in order to better facilitate programme planning in future.
Table 5.3: Consumption of HFCs by Sector, 2014 in Kg
Sector HFC-134a
R-404A R410A R407C R-507A Total %
Domestic refrigeration
55,430 0 0 0 0 55,430 34.3
Commercial refrigeration
0 22,440 0 0 5,980 28,420 17.6
Industrial refrigeration
0 1,085 0 830 0 1,915 1.2
Stationary ACs 0 0 11,520 8,980 0 20,500 12.7
MACs 55,200 0 0 0 0 55,200 33.2
Total, kg. 110,630 23,525 11,520 9,810 5,980 161,465 100
5.2 Projected trend of future consumption of HFCs and their potential alternatives Table 5.4 shows the projected growth in HFC consumption which is illustrated by the graph in Figure 5.7. Explanation for the growth pattern by substance is given below after the graph.
Table 5.4: Projected Future Consumption Trend of HFC (2015 -2020) (MT)
Year HFC-134a R-404A R-410A R-407C R-507 Total R 600a
2014 83 11.7 25 4.4 3.5 141.7 25
2015 109 15 32 12 4 171.7 33
2016 141 15 42 14 4 215.8 37
2017 177 11 52 17 4 261.1 41
2018 187 9 63 19 5 281.9 45
2019 199 8 76 21 6 309.6 49
2020 210 8 88 25 6 337.0 54
Please note that the HFC-134a base level (2014) was taken as the recorded consumption figure for 2014 (65 MT) increased by the adopted 28% growth rate (83) to compensate for the downturn in HFC-134a imports due to the adverse socio-economic factors in 2014.

24
142
172
216
261
282
310
337
83
109
141
177187
199210
25 32
4252
6376
88
0
50
100
150
200
250
300
350
400
2014 2015 2016 2017 2018 2019 2020
Fig. 5.3a: Projected Future HFC Consumption, 2014 - 2020 in MT
Total R134a R410
166,968
216,115
281,986
351,747
387,372
428,699
468,951
119,291
155,184
201,659
253,067266,695
284,427300,872
47,576 60,800
80,18098,515
120,498144,077
167,865
0
50,000
100,000
150,000
200,000
250,000
300,000
350,000
400,000
450,000
500,000
2014 2015 2016 2017 2018 2019 2020
Fig. 5.3b: Projected Future HFC Consumption, 2014 - 2020, in
CO2-eq T
Total R134a R410

25
5.3 HFC and HFC blend refrigerants The trend is predicted based on the assumption that the RAC industry will, in most cases, continue with a Business-As-Usual (BAU) approach and market dynamics evolving in the country. Following consultations and interviews with RAC industry drivers and stakeholders, the following growth trend by substance is projected: a. HFC-134a (GWP: 1,430)
Consumption in the Refrigerator sector will continue to rise. The country is experiencing a wave of shopping malls being constructed in the major cities nationwide. In addition, modern supermarket keep springing up in residential communities to ease shopping needs of residents which will also contribute to drive up the consumption of HFC-134a for servicing display cabinet, etc. In addition domestic refrigerator import continues to grow as a consequence of rising household income, GDP growth, rapid urbanization and sustained rural electrification programme which will push up the demand for HFC-134a. On the MACs side, the record of the Driver, Vehicle and Licensing Authority (DVLA) shows a steady stream of newly private motor vehicles, buses and coaches which are all fitted with air conditioners which will also push up the demand for HFC-134a.
b. R-404A (GWP: 3,922)
Demand for R-404A is projected to fall in the immediate future because in the cold store industry, especially the big refrigerated depots in Tema fishing harbor area, there is a new awakening to go back to the use of ammonia as refrigerant which used to be the practice in the nineteen seventies and eighties. A significant number of new installations that have been put up in the last five years operate on ammonia which has excellent thermodynamic properties and is more energy efficient. If this awakening continues to grow, R-404A usage will eventually be more concentrated among smaller tonnage cold stores on the coast and in the hinterland. With GWP of 3,800 it is the HFC-blend with the highest GWP in use in commercial stand alone equipment and could meet competition from HC refrigerants in application in these equipment.
c. R-410A (GWP: 2,088)
HCFC-22 offers stiff competition to R-410A in the window unit and single split unit air conditioners, but R-410A has the sole monopoly in the Variable Refrigerant Volume (VRV) air conditioners which is very popular in air conditioning of commercial and upscale residential buildings. Air conditioning of residential homes and work places has become a standard feature of modern lifestyle and with the increasing estate development going on in the country, this will push up demand for R-410A as HCFC-22 volumes diminish on the market as a result of Montreal Protocol phase-out measures. However its use in air conditioners, especially split and window types, could be replaced by hydrocarbon HC-290 as the high-GWP HFC refrigerants come under increasing pressure in jurisdictions like EU and USA.

26
d. R-407C (GWP: 1,774) R-407C will experience sluggish growth. It has not caught up as a popular refrigerant as the R-410A has among air conditioning service providers. In the local processing industry where it is used in chillers, demand is low because many industries in the country are struggling under erratic power supply which will take some time to resolve as well as competition from inexpensive Chinese imports of whatever they produce. Its use in air conditioners has also not picked up. Its demand in 2014 was about 30% that of the previous year.
e. R-507A (GWP: 3,922) R-507A application is projected to grow in two sub-sectors, refrigerated trucks and supermarket display cabinets. However, its high GWP of 3,800, the highest (together with R-404A) of all the HFC blends on the Ghanaian market, makes it unattractive as a long term refrigerant option. Atlantic climate which is the local agent of Thermo King trucks and trailers has started installing Thermo King refrigeration units on trucks to serve the refrigerated food industry, pharmaceutical, etc. and this could increase the country’s consumption of R-507A, which was less than 100 kg for the whole of 2014. Also the same reason adduced for HFC-134a use in supermarket display cabinets will apply to future growth in R-507A consumption.
5.4. Non-fluorinated alternatives a. R-600a (GWP: 3) R-600a (HC-600a) consumption rose over 3 times between 2011 and 2012 but dropped by the same margin in 2013 before rising again two-fold in 2014 for reasons that can be found in the ban on used refrigerator imports. Due to the wide price differential between this gas and HFC-134a, it is becoming very popular among fridge repairers and is expected to grow in the immediate future. Thousands of refrigeration technicians have been trained and retrained in retrofit and servicing of domestic refrigerators and freezers using the HC refrigerant. So its use is backed by availability of technical expertise on the market and as the pressure on competing HFCs grows with further potential increase in their prices and with diminishing products on the import market, the market penetration of HC-600a could continue to grow. b. R290 (GWP: 3) R-290 is a recommended climate-friendly refrigerant for use in split and window type residential and commercial air conditioners under the Ghana HPMP. Under the HPMP retrofit programme to convert HCFC-based split air conditioners started in 2013, the training of three experts as trainers in the HC conversion technology in Italy (with the support of the Italian bilateral programme under

27
the Multilateral Fund / MLF) was completed. This was followed by the organization of a four-day training workshop for 11 selected refrigeration service centres (RSCs) on safety issues related to hydrocarbons and distribution of retrofit/recovery equipment procured with funds from the MLF. The RSCs have begun the conversion project with the conversion of 397 HCFC-based split air-conditioners to R-290 refrigerant which are currently working efficiently without any problems. In parallel there is an ongoing activity to prepare codes of practice and safety standards for the safe conversion of HCFC-based commercial refrigeration residential and commercial air conditioners to the use of hydrocarbon refrigerants, R290 and other suitable HC refrigerants. Latest developments in the EU on F-Gas legislation and US EPA final rule on climate-friendly refrigerants could provide a boost that could influence the RAC market in the country to grow the application of R-290 refrigerant to a similar extent as currently enjoyed by R-600a.
c. R-717 (Ammonia – NH3) (GWP: 0)
Installed bank of R-717 is only about 7 tonnes. However, as earlier indicated its consumption is picking up in some applications. Therefore in the long term its use is expected to increase.

28
6. Conclusions The following conclusions result from this work: a. Countrywide, HFCs and HFC blends account for 48.1% of the total refrigerant bank, while HCFC
accounts for 47%. b. HFC-134a (GWP: 1,430) is the only pure HFC substance and the HFC substance with the lowest
GWP consumed in the country. The rest are HFC blends with high GWPs, which include R-404A (GWP: 3,922), R-410A (GWP: 2,088), R-407C (GWP: 1,774) and R-507A (GWP: 3,922).
c. HFCs and HFC blends are used solely as refrigerants in the Refrigeration and Air Conditioning (RAC) servicing industry.
d. The most consumed HFC substance in the country is HFC-134a and is mainly used in the refrigerator and MAC sectors.
e. There appears to be high potential for replacement of some HFC-134a consumption in the domestic refrigeration servicing sector.
f. Consumption of HCFC substances nationwide was more than twice the consumption of HFC substances in the period 2011-2013. However with the implementation of Ghana’s HPMP with its concomitant reductions in HCFC-22 consumption there would be the tendency to import alternatives, such as R-410A used for air conditioners.
g. Consumption of most of the HFC substances is projected to increase in the immediate future.

29
7. HFC replacement options and projects
7.1 Low GWP options The following low GWP replacement options are proposed for the various sectors in the country based on the report published by the Refrigeration Technical Options Committee (RTOC) of the Montreal Protocol and recently the USEPA SNAP.
Table 7.1: Low GWP Options for Relevant RAC Sectors
Sector Sub-sector Current substance Low GWP option
Refrigeration Domestic HFC-134a HC-600a, HFC-1234yf, Propane
Commercial (stand-alone equipment)
HFC 134a, R-404A
HC-600a and HC-290 for small units with charges
under 1.5kg, HFC-1234yf and CO2, Iso-butane, Propane
Display Cabinets R-404A, R-507A, HFC-134a
HC-290 and HC-1270, Iso-butane, Propane, R441A
Refrigerated trucks R-404A, HFC 134a HFC-1234yf as replacement of HFC-134a, Ethane
Reefers R-404A, HFC-134a CO2, Ethane
Air Conditioning
Split and Window type R407C, R-410A HC-290, HFC-32
Mobile HFC-134a HFC-1234yf, CO2
7.2 Projects On the basis of the surveys undertaken and the discussions and conclusions made, a number of projects have been proposed for any possible future follow-up action. The proposed projects cover activities that could be undertaken within the framework of the current institutional strengthening (IS) project funded by the Multilateral Fund as well as some projects that could serve as demonstration for adoption of technologies to reduce dependence on high GWP refrigerants in the country. Some of the activities will in effect be extension of activities currently being implemented with limited funding under the first stage HPMP, which is focused on introduction and promotion of HC technologies with a focus on safety, with the objective of avoiding transitional conversions to HFC technologies to the extent possible. The implementation of the proposed activities could be facilitated and coordinated by the National Ozone Unit (NOU) but would require some modest supplemental funding of the IS project or capacity enhancement of the NOU.
30
The proposed projects are listed in Table 7.2 below.
Table 7.2: Proposed Projects
Sector Project Outputs
4. Institutional Strengthening
v. Integration of HFCs inventory results in Ghana’s low carbon based development strategy
Green house emissions due to HFCs in Ghana calculated.
Abatement curves developed and disseminated.
Mitigation actions defined and prioritized.
vi. Integration of ODS consumption data collection with data collection of consumption of high GWP chemicals and their emissions from application processes.
Availability of up-to-date data on green house gases and other climate-impacting chemicals enhanced. Better coordination of ozone protection and climate change mitigation information.
vii. Public awareness on HFC substances, energy efficiency and climate issues (in collaboration with relevant agencies)
Stakeholders in RAC sector and general public made aware of nature of HFCs and blends and the socio-economic and environmental impact of their use.
viii. Programme monitoring and evaluation
Periodic and regular reports on progress of implementation of activities are made available. Assessment of various aspects of programme organized as required or facilitated.
5. Refrigeration Sub-Sector Activities
(c) Domestic and Small Scale Commercial Refrigeration Units
v. Recovery and recycling of HFC and HFC blend refrigerants in the servicing of domestic and commercial refrigeration equipment.
R and R programme of HPMP extended to domestic and commercial refrigeration equipment not covered under HPMP. Conservation of high GWP refrigerants improved. Import of virgin high GWP refrigerants (R-404A, R-507C, R-410A, HFC-134a) reduced.
vi. Conversion of stand-alone commercial units using HFC/HFC blend refrigerants to climate-friendly systems
Selected enterprises using stand-alone commercial units converted from high GWP refrigerant technology to low GWP hydrocarbon technology (HFC-134a replacement with R-600a; R-404A replacement with R290)
(d) Large Scale Commercial/Industrial Refrigeration Units
vii. Study of socio-economic and environmental impact of refrigeration and comfort cooling systems in supermarket operations.
Enhanced information on baseline data and on cost efficiencies and environmental impact of the use of HFC-based refrigeration systems and identification of potential mitigation activities.
viii. Demonstration projects in the supermarket subsector aiming at HFC replacement improvement and improvement of energy efficiency
d. Implementation of a demonstration project with a cascade system using R-717/R744 (CO2).
e. Implementation of a demonstration project with a cascade system using R-290 (propane)/R-744(CO2).
f. Implementation of a demonstration project with a trans-critical CO2 system
6. Air Conditioning
iv. Recovery and recycling of HFC and HFC blend refrigerants in the
R and R programme of HPMP extended to residential and commercial air conditioning equipment not covered under HPMP.
31
Sub-Sector Activities
servicing of residential and commercial air conditioning units.
Conservation of high GWP refrigerants improved. Reliance on virgin high GWP refrigerants (R-404A, R-507C, R-410A, HFC-134a) reduced
v. Study of socio-economic and environmental impact of comfort cooling systems in hotels and large commercial/office blocks without centralized cooling system.
Enhanced information on baseline data and on cost efficiencies and environmental impact of the use of HFC-based cooling systems and identification of potential mitigation activities.
vi. Demonstration project for the use of a low GWP options for central air conditioning system in commercial/office buildings
c. Implementation of a demonstration project with a hydrocarbon air conditioning system in hotels;
d. Implementation of a demonstration project with a low GWP air conditioning system in commercial/office buildings;
In terms of the most likely near-term opportunities for reducing/avoiding HFCs, it seems to appear that a crucial opportunity would be to ensure integration of recovery and recycling/reclaiming for HFCs with other ongoing programmes in Ghana (on CFCs in old refrigerators and HCFCs) would potentially have a major impact on avoiding future demand for HFCs. While it is difficult to estimate such impact, one could expect that such programmes could reduce by 10% the consumption of HFCs in the long run. This can also be achieved with minimal investment. Additionally, the importance of demonstration projects for low-GWP alternatives can be underlined, as it will demonstrate the feasibility to the private sector, which can then amplify this trend through replication. In this case, the potential impact compared to BAU is also very difficult to estimate, when one looks as specific demonstration, such as hydrocarbons in the air conditioning sector, or cascade systems in the supermarket subsector.

32
APPENDIX 1: (DRIVER, VEHICLE AND LICENSING AUTHORITY, GHANA)
TOTAL NUMBER OF VEHICLES REGISTERED IN GHANA BY
CATEGORY
YEAR MOTOR CYCLE
PTE MV UPTO 2000CC
COMM MV UPTO 2000CC
MV ABOVE 2000CC
BUSES AND COACHES
R/C TRUCKS UPTO 16TONS
R/C TRUCKS FROM 16-22 TONS
R/C TRUCKS ABOVE 22 TONS
ART TRUCKS UPTO 24 TONS
ART TRUCKS ABOVE 24-32 TONS
ART TRUCKS ABOVE 32 TONS
AGRIC EQUIP
COMBINE HARVESTERS
CONS EQUIP
MINING EQUIP
PART. ID. MARK
GROSS TOTAL
2000 6,440 27,552 5,104 5,196 5,469 1,428 395 229 120 305 126 337 30 149 1 0 52,881
2001 6,058 17,953 5,568 5,343 2,676 861 367 234 136 251 122 303 4 136 2 0 40,014
2002 6,430 18,512 6,015 7,143 2,601 1,044 300 281 138 201 168 206 36 172 10 0 43,257
2003 8,777 20,564 5,110 7,778 2,916 914 292 326 116 447 510 158 77 46 29 14 48,074
2004 14,462 20,333 7,642 7,189 4,882 2,065 603 442 447 376 489 510 20 56 11 21 59,548
2005 15,136 22,949 6,686 8,715 5,585 2,457 420 543 551 374 454 140 192 68 7 142 64,419
2006 18,051 23,806 7,249 11,127 7,399 2,747 475 1,024 269 188 637 320 154 489 16 296 74,247
2007 20,320 29,633 7,757 15,296 9,791 3,586 669 1,240 160 342 659 259 154 151 11 300 90,328
2008 25,475 31,628 7,040 17,374 11,737 3,997 861 1,303 89 284 566 171 266 287 19 401 101,498
2009 27,581 25,128 7,868 17,414 8,810 3,130 933 1,120 134 414 352 1,411 195 159 17 332 94,998
2010 36,097 22,444 8,321 17,442 9,506 3,898 1,509 907 334 380 533 305 171 325 6 152 102,330
TOTAL 184,827 260,502 74,360 120,017 71,372 26,127 6,824 7,649 2,494 3,562 4,616 4,120 1,299 2,038 129 1,658 771,594
33
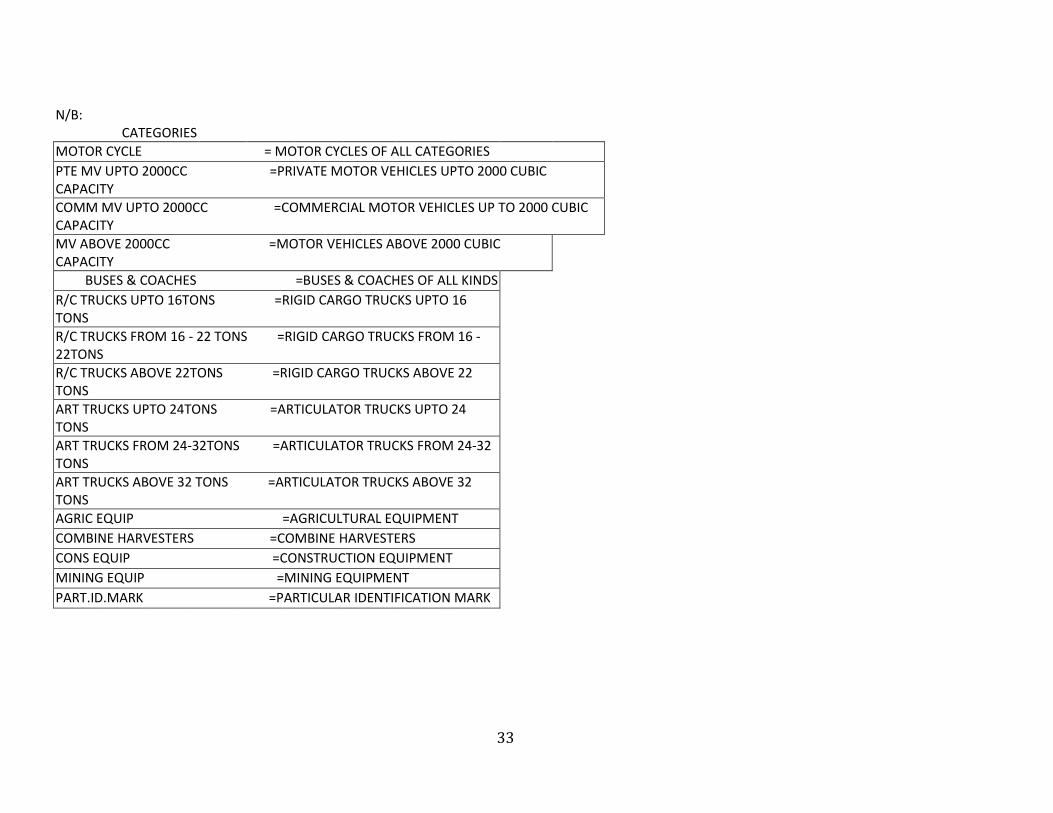
N/B: CATEGORIES
MOTOR CYCLE = MOTOR CYCLES OF ALL CATEGORIES
PTE MV UPTO 2000CC =PRIVATE MOTOR VEHICLES UPTO 2000 CUBIC CAPACITY
COMM MV UPTO 2000CC =COMMERCIAL MOTOR VEHICLES UP TO 2000 CUBIC CAPACITY
MV ABOVE 2000CC =MOTOR VEHICLES ABOVE 2000 CUBIC CAPACITY
BUSES & COACHES =BUSES & COACHES OF ALL KINDS
R/C TRUCKS UPTO 16TONS =RIGID CARGO TRUCKS UPTO 16 TONS
R/C TRUCKS FROM 16 - 22 TONS =RIGID CARGO TRUCKS FROM 16 -22TONS
R/C TRUCKS ABOVE 22TONS =RIGID CARGO TRUCKS ABOVE 22 TONS
ART TRUCKS UPTO 24TONS =ARTICULATOR TRUCKS UPTO 24 TONS
ART TRUCKS FROM 24-32TONS =ARTICULATOR TRUCKS FROM 24-32 TONS
ART TRUCKS ABOVE 32 TONS =ARTICULATOR TRUCKS ABOVE 32 TONS
AGRIC EQUIP =AGRICULTURAL EQUIPMENT
COMBINE HARVESTERS =COMBINE HARVESTERS
CONS EQUIP =CONSTRUCTION EQUIPMENT
MINING EQUIP =MINING EQUIPMENT
PART.ID.MARK =PARTICULAR IDENTIFICATION MARK

34
REFERENCES
1. Energy Efficient Refrigerating Appliance Manufacturing in Ghana: A Feasibility Study
Serengeti Capital & Atlantic International, 2014
2. Ghana Residential Energy Use and Appliance Ownership Survey: Final report on the Potential
Impact of Appliance Performance Standards in Ghana, by Ernest Orlando, Lawrence Berkeley
National laboratory, USA, 1999.