hetta lake subsistence sockeye salmon project: annual report 2009 › akssfapm ›...
TRANSCRIPT

Fishery Data Series No. 10-61
Hetta Lake Subsistence Sockeye Salmon Project: 2009 Annual and Final Report
by
Julie Bednarski
and
Steven C. Heinl
September 2010
Alaska Department of Fish and Game Divisions of Sport Fish and Commercial Fisheries

Symbols and Abbreviations The following symbols and abbreviations, and others approved for the Système International d'Unités (SI), are used without definition in the following reports by the Divisions of Sport Fish and of Commercial Fisheries: Fishery Manuscripts, Fishery Data Series Reports, Fishery Management Reports, and Special Publications. All others, including deviations from definitions listed below, are noted in the text at first mention, as well as in the titles or footnotes of tables, and in figure or figure captions. Weights and measures (metric) centimeter cm deciliter dL gram g hectare ha kilogram kg kilometer km liter L meter m milliliter mL millimeter mm Weights and measures (English) cubic feet per second ft3/s foot ft gallon gal inch in mile mi nautical mile nmi ounce oz pound lb quart qt yard yd Time and temperature day d degrees Celsius °C degrees Fahrenheit °F degrees kelvin K hour h minute min second s Physics and chemistry all atomic symbols alternating current AC ampere A calorie cal direct current DC hertz Hz horsepower hp hydrogen ion activity pH (negative log of) parts per million ppm parts per thousand ppt, ‰ volts V watts W
General Alaska Administrative Code AAC all commonly accepted abbreviations e.g., Mr., Mrs.,
AM, PM, etc. all commonly accepted professional titles e.g., Dr., Ph.D., R.N., etc. at @ compass directions:
east E north N south S west W
copyright © corporate suffixes:
Company Co. Corporation Corp. Incorporated Inc. Limited Ltd.
District of Columbia D.C. et alii (and others) et al. et cetera (and so forth) etc. exempli gratia (for example) e.g. Federal Information Code FIC id est (that is) i.e. latitude or longitude lat. or long. monetary symbols (U.S.) $, ¢ months (tables and figures): first three letters Jan,...,Dec registered trademark ® trademark ™ United States (adjective) U.S. United States of America (noun) USA U.S.C. United States
Code U.S. state use two-letter
abbreviations (e.g., AK, WA)
Mathematics, statistics all standard mathematical signs, symbols and abbreviations alternate hypothesis HA base of natural logarithm e catch per unit effort CPUE coefficient of variation CV common test statistics (F, t, χ2, etc.) confidence interval CI correlation coefficient (multiple) R correlation coefficient (simple) r covariance cov degree (angular ) ° degrees of freedom df expected value E greater than > greater than or equal to ≥ harvest per unit effort HPUE less than < less than or equal to ≤ logarithm (natural) ln logarithm (base 10) log logarithm (specify base) log2, etc. minute (angular) ' not significant NS null hypothesis HO percent % probability P probability of a type I error (rejection of the null hypothesis when true) α probability of a type II error (acceptance of the null hypothesis when false) β second (angular) " standard deviation SD standard error SE variance population Var sample var

FISHERY DATA SERIES NO. 10-61
HETTA LAKE SUBSISTENCE SOCKEYE SALMON PROJECT: ANNUAL REPORT 2009
By Julie Bednarski
Alaska Department of Fish and Game, Division of Commercial Fisheries, Douglas and
Steven C. Heinl Alaska Department of Fish and Game, Division of Commercial Fisheries, Ketchikan
September 2010
Alaska Department of Fish and Game Division of Sport Fish, Research and Technical Services 333 Raspberry Road, Anchorage, Alaska, 99518-1565
The Federal Subsistence Board approved the Falls Lake Sockeye Salmon Stock Assessment Project (Study Number OSM07-609). The project was funded by the U.S. Forest Service, managed by U.S. Fish and Wildlife Service Office of Subsistence Management, and is a cooperative project between the U.S. Forest Service (USFS), the Alaska Department of Fish and Game (ADF&G), and the Organized Village of Kake (OVK). This annual report partially fulfills contract obligations for Sikes Act Contracts AG-0109-C-07-0020 and AG-0109-P-08-0024. Additional funds for this project were provided by the Southeast Sustainable Salmon Fund.

ADF&G Fishery Data Series was established in 1987 for the publication of Division of Sport Fish technically oriented results for a single project or group of closely related projects, and in 2004 became a joint divisional series with the Division of Commercial Fisheries. Fishery Data Series reports are intended for fishery and other technical professionals and are available through the Alaska State Library and on the Internet: http://www.sf.adfg.state.ak.us/statewide/divreports/html/intersearch.cfm This publication has undergone editorial and peer review.
Julie Bednarski, Alaska Department of Fish and Game, Division of Commercial Fisheries,
802 Third Street, Douglas, Alaska 99824, USA
Steven C. Heinl, Alaska Department of Fish and Game, Division of Commercial Fisheries,
2030 Sea Level Drive, Suite 205, Ketchikan, Alaska 99901, USA This document should be cited as: Bednarski, J., and S. C. Heinl. 2010. Hetta Lake subsistence sockeye salmon project: annual report 2009. Alaska
Department of Fish and Game, Fishery Data Series No. 10-61, Anchorage.
If you believe you have been discriminated against in any program, activity, or facility please write: ADF&G ADA Coordinator, P.O. Box 115526, Juneau, AK 99811-5526
U.S. Fish and Wildlife Service, 4401 N. Fairfax Drive, MS 2042, Arlington, VA 22203 Office of Equal Opportunity, U.S. Department of the Interior, 1849 C Street NW MS 5230, Washington DC 20240
The department’s ADA Coordinator can be reached via phone at the following numbers: (VOICE) 907-465-6077, (Statewide Telecommunication Device for the Deaf) 1-800-478-3648,
(Juneau TDD) 907-465-3646, or (FAX) 907-465-6078 For information on alternative formats and questions on this publication, please contact:
ADF&G, Division of Sport Fish, Research and Technical Services, 333 Raspberry Road, Anchorage AK 99518 (907)267-2375.
The Alaska Department of Fish and Game (ADF&G) administers all programs and activities free from discrimination based on race, color, national origin, age, sex, religion, marital status, pregnancy, parenthood, or disability. The department administers all programs and activities in compliance with Title VI of the Civil Rights Act of 1964, Section 504 of the Rehabilitation Act of 1973, Title II of the Americans with Disabilities Act (ADA) of 1990, the Age Discrimination Act of 1975, and Title IX of the Education Amendments of 1972.
TABLE OF CONTENTS Page
LIST OF TABLES ......................................................................................................................................................... ii
LIST OF FIGURES ....................................................................................................................................................... ii
LIST OF APPENDICES ............................................................................................................................................... ii
ABSTRACT .................................................................................................................................................................. 1
INTRODUCTION ......................................................................................................................................................... 1
Objectives ...................................................................................................................................................................... 3
METHODS .................................................................................................................................................................... 3
Study Site....................................................................................................................................................................... 3 Subsistence Harvest ....................................................................................................................................................... 4 Sockeye Salmon Escapement Estimate ......................................................................................................................... 4
Weir Count ............................................................................................................................................................... 4 Sockeye Salmon Escapement Age and Length Composition ........................................................................................ 5 Sockeye Salmon Fry Population Assessment ................................................................................................................ 6
Hydroacoustic Survey ............................................................................................................................................... 6 Trawl Sampling ........................................................................................................................................................ 6 Data Analysis ............................................................................................................................................................ 6
Limnology ..................................................................................................................................................................... 7 Light and Temperature Profiles ................................................................................................................................ 7 Secondary Production ............................................................................................................................................... 7
RESULTS ...................................................................................................................................................................... 8
Subsistence Harvest ....................................................................................................................................................... 8 Sockeye Salmon Escapement Estimate ......................................................................................................................... 9
Weir Count ............................................................................................................................................................... 9 Sockeye Salmon Escapement Age and Length Composition ........................................................................................ 9 Sockeye Salmon Fry Population Assessment .............................................................................................................. 10
Light and Temperature Profiles .............................................................................................................................. 11 Secondary Production ............................................................................................................................................. 12
DISCUSSION .............................................................................................................................................................. 12
ACKNOWLEDGMENTS ........................................................................................................................................... 14
REFERENCES CITED ............................................................................................................................................... 14
APPENDICES ............................................................................................................................................................. 17
i

ii
LIST OF TABLES Table Page 1. Total 2009 subsistence salmon harvest on fishing grounds around Hydaburg, determined from
interviews of returning fishermen. .................................................................................................................. 8 2. Subsistence sockeye salmon harvests from Hetta Cove, 2001 through 2009, and estimated sockeye
salmon escapements into Hetta Lake. ............................................................................................................. 8 3. Age composition of adult sockeye salmon escapement in Hetta Lake, by sex, in 2009, weighted by
statistical week. ............................................................................................................................................. 10 4. Mean mideye-to-fork length of adult sockeye salmon in the 2009 Hetta Lake escapement, weighted by
statistical week. ............................................................................................................................................. 10 5. Small pelagic fish population estimates from hydroacoustic surveys of Hetta Lake, and estimated
species composition from trawl samples, 2004–2009. .................................................................................. 11 6. Euphotic zone depths at station B in Hetta Lake in 2009. ............................................................................. 11 7. Mean numerical density of zooplankton per m2 of lake surface area, by sampling date and taxon, in
Hetta Lake in 2009. ....................................................................................................................................... 12 8. Seasonal mean length and biomass of zooplankton in Hetta Lake in 2009 ................................................... 12
LIST OF FIGURES Figure Page 1. Hetta Lake bathymetric map with locations of inlet and outlet streams, mark-recapture and visual
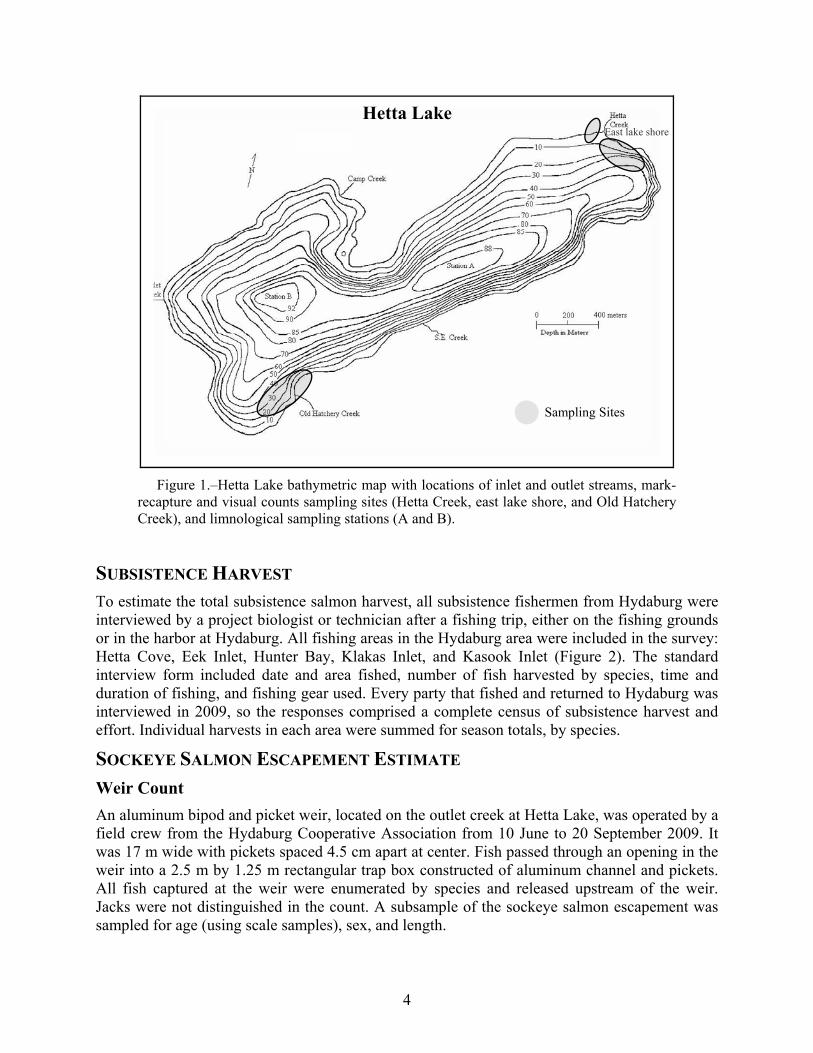
counts sampling sites (Hetta Creek, east lake shore, and Old Hatchery Creek), and limnological sampling stations (A and B). ........................................................................................................................... 4
2. The geographic location of Hetta Lake and subsistence fishing areas of Hetta Cove, Klakas Inlet, Hunter Bay, Kasook Inlet, and Eek Inlet shown in relationship to Hydaburg on southeast Prince of Wales Island.. .................................................................................................................................................. 5
3. Daily sockeye salmon escapement counts and water depth at the weir on the Hetta Lake outlet stream in 2009. ............................................................................................................................................................ 9
4. Water temperature profiles at station B in Hetta Lake in 2009. .................................................................... 11
LIST OF APPENDICES Appendix Page A1. Historical sockeye salmon commercial fishery information from Rich and Ball 1933. ................................ 18 A2. Water depth (m) at the weir, 2006–2009. ...................................................................................................... 19 A3. Approximate weekly sampling schedule for sockeye salmon at the Hetta Lake weir in 2009 (length,
sex, and scales). ............................................................................................................................................. 19 A4. Escapement sampling data analysis. .............................................................................................................. 20 A5. Daily weir counts for Hetta Lake sockeye salmon, 2009. ............................................................................. 21 A6. Age composition (proportion) of sockeye salmon in Hetta Lake escapement, 1982–2009. .......................... 22

ABSTRACT The Hydaburg Cooperative Association partnered with the Alaska Department of Fish and Game to continue the Hetta Lake sockeye salmon stock assessment program which started in 2001. A subsistence harvest survey and sockeye salmon escapement count were completed in 2009. Lake temperature, light profiles, and zooplankton populations were also measured, and hydroacoustic and trawl surveys were conducted to estimate small fish populations in the lake. The harvest survey documented a total harvest of 5,105 sockeye salmon from Hetta Cove, most of which were harvested from mid July to late August. A total escapement of 20,522 sockeye salmon was counted at the Hetta Creek weir from June through late September. Age-1.3 sockeye salmon dominated the escapement (85%). The total population estimate of small pelagic fish in Hetta Lake was 686,000. A comparison of past estimates of the sockeye fry population in Hetta Lake to subsequent adult returns showed that trawl surveys to estimate species composition are likely biased due to high abundance of threespine stickleback.
Key words: sockeye salmon, Onchorynchus nerka, subsistence, Hetta Lake, Hydaburg, Prince of Wales Island, Southeast Alaska, escapement, mark-recapture, harvest census, zooplankton, fry, threespine stickleback, hydroacoustic survey
INTRODUCTION The Hetta Lake sockeye salmon (Oncorhynchus nerka) is the primary subsistence resource for the residents of the village of Hydaburg on south Prince of Wales Island. Hetta Lake sockeye salmon played a central role in the history of this village, as well as former Haida and Tlingit settlements which pre-dated the modern village (Langdon 1977; Betts et al., Alaska Department of Fish and Game [ADF&G], Division of Subsistence, unpublished report). Subsistence fishing for sockeye salmon is still integral to the Hydaburg community, where 80 to 90% of households use this resource (Betts et al., ADF&G Division of Subsistence, unpublished report).
Directed commercial harvest in Hetta Inlet occurred between 1889 and 1924, with peak yearly harvests of 139,000 to 2,510,000 sockeye salmon during a 5-year period from 1896–1900 (Rich and Ball 1933; Appendix A1). Hetta Lake sockeye salmon were particularly vulnerable to fishing pressure because Hetta Inlet was easily barricaded (Moser 1899), and hatchery records indicate annual escapements into Hetta Lake had fallen to less than 10,000 sockeye salmon by 1914 (Roppel 1982). Hatchery supplementation (1900–1918) and several fishery regulations were carried out to protect this stock (Rich and Ball 1933; Roppel 1982), including protecting the terminal area from commercial fishing in 1925, but mixed-stock fisheries continued to develop in nearby waters (Rich and Ball 1933).
The first assessment of the Hetta Lake sockeye salmon run was conducted between 1967 and 1971, when the U.S. Fish and Wildlife Service operated a weir on the outlet stream of the lake. Sockeye salmon counts in those years ranged between 15,000 and 24,000 fish. Unfortunately, the absence of supporting information about the weir and other aspects of the sockeye salmon runs from this period prevents a more meaningful interpretation of typical escapement levels. Additionally, ADF&G operated a weir for a single year in 1982 and counted 5,387 fish, which was much smaller than those earlier counts. However, the 1982 count did not represent the entire season because the weir was only operated until 20 August and in the past 4 seasons about ½ the run has been counted through after 20 August (Blikshteyn and Conitz 2009; Conitz 2008; Conitz and Blikshteyn 2010; Host et al. 2008).
In 2001, ADF&G and the Hydaburg Cooperative Association began a cooperative sockeye salmon stock assessment project at Hetta Lake, which has continued annually through 2009. During the first few years of study, spawning populations were estimated using mark-recapture studies in the lake and stream spawning areas. In 2005, a weir was installed on the lake outlet
1

stream in order to improve the reliability of sockeye salmon escapement estimates, because biologists suspected that mark-recapture studies on the spawning grounds in 2001–2004 did not provide complete or reliable estimates, particularly for the lake spawning populations (Host et al. 2008). It is common practice in Southeast Alaska to conduct mark-recapture studies in conjunction with weir operations to validate counts in the event that fish were able to pass through the weir uncounted (e.g., Piston 2009, Piston and Heinl 2010, Vinzant et al. 2010), and mark-recapture studies were incorporated into the weir projects from 2005 to 2008. However, mark-recapture studies in 3 of those years either failed (Blikshteyn and Conitz 2009, Conitz and Blikshteyn 2010) or did not meet the objectives for precision (Conitz 2008). Although, adequate mark-recovery samples can be obtained in Hetta Creek and adjacent areas, it is difficult to sample the largest portion of the run, the lake-spawners (Conitz and Blikshteyn 2010), partly due to the topography of Hetta Lake and weather. Aside from the shallow mouth of the inlet streams, sockeye salmon spawn along lakeshores (Figure 1) that are too deep to sample with beach seines and other traditional methods, and where logs and large woody debris further limits sampling. In addition, the lake-spawning period extends into October, when it can be difficult for field crews to safely travel from Hydaburg to the lake to sample fish. This information was confirmed by the Hydaburg elders who have long known of the late-season and spatially variable spawning patterns of the lake-spawning portions of the Hetta Lake sockeye salmon run (R. Sanderson, technician, Hydaburg Cooperative Association, personal communication, 2001–2008). Because of these reasons, it was decided before the 2009 season to discontinue mark-recapture studies at Hetta Lake and instead rely on the weir, which can provide a solid minimum estimate of escapement (Conitz and Blikshteyn 2010).
The subsistence harvest of sockeye salmon has been monitored in conjunction with escapement since 2001, primarily by a Hydaburg biologist and elder who interviewed everyone returning to the Hydaburg dock or who was known to have participated in subsistence fishing. The size of the subsistence harvest has corresponded well with the size of the escapement into Hetta Lake. For example, in low escapement years of 2004 and 2005, poor harvests were also recorded in the terminal marine subsistence fishery: 630 sockeye salmon in 2004 and 350 sockeye salmon in 2005. In 2006, when more than 17,000 sockeye salmon were counted through the weir, the subsistence harvest reached almost 10,000 fish. Traditionally, subsistence users have supplemented low catches of Hetta sockeye salmon with sockeye salmon from nearby areas such as Eek and Klakas inlets and Hunter Bay (Betts et al., ADF&G Div. of Subsistence, unpublished report). However, Hetta Lake sockeye salmon remain the largest component of the Hydaburg subsistence fishery and small salmon runs to Hetta Lake and area streams may not adequately meet subsistence needs.
In addition to counting returning adult sockeye salmon, the Hetta Lake salmon stock assessment project has also included the collection of lake limnology data, genetic samples, zooplankton samples, and hydroacoustic surveys to estimate abundance of small pelagic fish. These data have been used to evaluate environmental and biological factors of the lake-rearing environment that affect the sockeye salmon population. Small pelagic fish surveys, using trawl and hydroacoustic sampling gear, have been conducted every year except 2007. Zooplankton sampling has been conducted annually to evaluate species composition and biomass of prey species available to rearing sockeye salmon fry.
2

The primary objectives of the Hetta Lake study in 2009 were to obtain reliable estimates of sockeye salmon escapement and subsistence harvest. The weir on the Hetta Lake outlet stream was operated for a fifth consecutive season; for the reasons noted above, however, we did not conduct a mark-recapture study in 2009. For the Hetta Lake project, the weir can provide a reliable escapement estimate because of favorable stream characteristics, including shallow water (mean 0.54 m) with gradual sloping banks and stream bank width less than 17 m across. Hence, if field operations include careful emphasis on accurate counting through a well maintained fish-tight weir, the count should provide a reasonable estimate of escapement.
OBJECTIVES 1. Survey all subsistence fishermen on the fishing grounds or after they return to Hydaburg,
to determine the total sockeye salmon harvest in the terminal areas of Hetta Lake and other sockeye salmon streams in the Hydaburg area.
2. Count the sockeye salmon escapement into Hetta Lake at an adult counting weir, throughout as much of the spawning migration period as feasible.
3. Estimate the age, length, and sex composition of the Hetta Lake sockeye salmon escapement.
4. Estimate the abundance and density of sockeye salmon fry and other pelagic fish species in Hetta Lake, such that the coefficient of variation of the estimate would be less than 15%.
5. Measure water column temperature and record light profiles in Hetta Lake during the sampling season. Estimate zooplankton species composition, size, density, and biomass.
METHODS STUDY SITE Hetta Lake (ADF&G stream no. 103-25-047; 55o10.17’N 132o34.03’W) is located on the southwestern side of Prince of Wales Island, at an elevation of 9.4 m (Figure 2). This dimictic oligotrophic lake has organically stained water, a surface area of 207 ha, with a mean depth of 48 m, and a maximum depth of 92 m (Figure 1). The volume of the lake is 99.4 million m3, and water residence time is about 12.6 months. The Hetta Lake watershed is a 24 km2 area of steep slopes covered with spruce, cedar, and hemlock forest, much of which was logged in the 1950s. The lake has 1 main tributary stream, Hetta Creek, which enters the lake on the northeastern side, and numerous small mountainside drainages, of which Old Hatchery Creek on the south side and Camp Creek on the north side are the largest. The lake outlet is on the west end, and the 600 m long outlet stream drains into Hetta Cove. Sockeye salmon spawn in Hetta Creek and along many shoreline areas including the gravel beaches at the east end of the lake and the area around the mouth of Old Hatchery Creek on the southern side of the lake. In addition to sockeye salmon, other fish species present in Hetta Lake include pink (O. gorbusha), chum (O. keta), and coho (O. kisutch) salmon, cutthroat (O. clarki) and steelhead (O. mykiss) trout, Dolly Varden char (Salvelinus malma), threespine stickleback (Gasterosteus aculeatus), and sculpins (Cottus sp.).
3
Hetta Lake East lake shore
Sampling Sites
Figure 1.–Hetta Lake bathymetric map with locations of inlet and outlet streams, mark-recapture and visual counts sampling sites (Hetta Creek, east lake shore, and Old Hatchery Creek), and limnological sampling stations (A and B).
SUBSISTENCE HARVEST To estimate the total subsistence salmon harvest, all subsistence fishermen from Hydaburg were interviewed by a project biologist or technician after a fishing trip, either on the fishing grounds or in the harbor at Hydaburg. All fishing areas in the Hydaburg area were included in the survey: Hetta Cove, Eek Inlet, Hunter Bay, Klakas Inlet, and Kasook Inlet (Figure 2). The standard interview form included date and area fished, number of fish harvested by species, time and duration of fishing, and fishing gear used. Every party that fished and returned to Hydaburg was interviewed in 2009, so the responses comprised a complete census of subsistence harvest and effort. Individual harvests in each area were summed for season totals, by species.
SOCKEYE SALMON ESCAPEMENT ESTIMATE Weir Count An aluminum bipod and picket weir, located on the outlet creek at Hetta Lake, was operated by a field crew from the Hydaburg Cooperative Association from 10 June to 20 September 2009. It was 17 m wide with pickets spaced 4.5 cm apart at center. Fish passed through an opening in the weir into a 2.5 m by 1.25 m rectangular trap box constructed of aluminum channel and pickets. All fish captured at the weir were enumerated by species and released upstream of the weir. Jacks were not distinguished in the count. A subsample of the sockeye salmon escapement was sampled for age (using scale samples), sex, and length.
4

Hetta
Hunter
Klakas Kasook Inlet
Figure 2.–The geographic location of Hetta Lake and subsistence fishing areas of Hetta
Cove, Klakas Inlet, Hunter Bay, Kasook Inlet, and Eek Inlet shown in relationship to Hydaburg on southeast Prince of Wales Island. Commercial salmon fishing subdistricts are also shown.
SOCKEYE SALMON ESCAPEMENT AGE AND LENGTH COMPOSITION About 620 sockeye salmon were sampled at the weir for scales, length measurement, and sex identification. Fish were selected systematically to prevent selection bias, and weekly sampling goals were set throughout the run based on average weekly escapements from previous years (Appendix A3). Length of each fish was measured from mid eye to tail fork, to the nearest millimeter (mm). Sex of the fish was identified by the length and shape of the kype or jaw. Three scales were taken from the preferred area of each fish (INPFC 1963) and prepared for analysis as described by Clutter and Whitesel (1956). Scale samples were analyzed at the ADF&G Salmon Age Laboratory in Douglas, Alaska. The weekly age-sex distribution, the seasonal age-sex distribution weighted by week, and the mean length by age and sex (weighted by week) were calculated using equations from Cochran (1977; Appendix A4). Age classes were designated by the European aging system where freshwater and saltwater years are separated by a period (e.g., 1.3 denotes a 5 year-old fish with 1 freshwater and 3 ocean years; Koo 1962).
5

SOCKEYE SALMON FRY POPULATION ASSESSMENT Hydroacoustic and mid-water trawl sampling methods were used to estimate abundance and age-size distributions of sockeye salmon fry and other small pelagic fish in Hetta Lake in 2009. To control year-to-year variation in our estimates, the acoustic survey in 2009 was conducted along the same 14 transects that were randomly chosen in 2002 (2 from each of 7 sampling sections of the lake) as permanent transects for this lake (see Lewis and Cartwright 2004). Hydroacoustic surveys have been conducted annually in the fall since 2004.
Hydroacoustic Survey
Surveys were conducted at night, starting immediately after sunset. Acoustic targets were acquired by surveying each transect from shore to shore, beginning and ending where depth was approximately 10 m, at a constant boat speed of about 2.0 m/sec. A Biosonics DT-X™1 scientific echosounder (430 kHz, 7.3° split-beam transducer) with Biosonics Visual Acquisition© version 5.0 software was used to collect the data. The ping rate was set at 5 pings/sec and the pulse width at 0.3 ms. Only target strengths ranging from –40 dB to –70 dB were recorded because this range represented fish within the size range of sockeye salmon fry and other small pelagic fish.
Trawl Sampling Midwater trawl sampling was conducted immediately following the hydroacoustic survey to estimate the species composition of the sonar fish count. Trawl sampling was started in the area and depth of the lake showing the highest concentration of fish on the hydroacoustic monitor, using a 2 m x 2 m elongated beam-trawl net with a cod-end. Subsequent tows were started at the termination point of the previous tow, in a direction such that a new area would be sampled. Tows were conducted at several depths between 2.5 and 12.5 m. The duration of each tow was approximately 20–30 minutes. The total sample size goal was at least 500 fish for estimation of species proportions.
All small fish from the trawl net were preserved in 90% alcohol. Samples from each tow were preserved in separate bottles, labeled with the date, time, tow number, tow depth, and tow duration. If adult fish were caught in the mid water trawl, they were identified and released. In the laboratory, fish were re-hydrated by soaking in tap water for 60 minutes prior to measurement. All fish were identified to species, and snout-fork length (to the nearest millimeter) and weight (to the nearest 0.1 gram) were measured on each fish. All sockeye salmon fry under 50 mm were assumed to be age-0.
Data Analysis Fish-target density (targets⋅m2) was estimated with Biosonics software (User Guide, Visual AnalyserTM 4.1, BioSonics, Inc.), using the echo integration technique as described in MacLennan and Simmonds (1992). For each of the 7 lake sections, the 2 transect densities were converted to population estimates by multiplying by the section area, and the mean and variance of the 2 population estimates were calculated. The total population estimate for the lake was the sum of the mean population estimates for each section. Because each section was sampled independently from other sections, the sampling variance for the whole-lake target population estimate was estimated as the sum of the section variances.
1 Product names used in this report are included for scientific completeness, but do not constitute a product endorsement.
6

The total fish population estimate was apportioned to species based on the species composition of the trawl sample. Commonly, researchers assume that the proportion of each species in such a sample follows a binomial distribution, an assumption of convenience but not necessarily a realistic reflection of actual sampling conditions. However, the hydroacoustic estimate provides a reasonably accurate assessment of the total planktivore population, and for the purpose of observing the dynamics between sockeye salmon and threespine stickleback populations in Hetta Lake over time, the binomial estimate was considered adequate.
LIMNOLOGY Limnology samples were taken at 2 long-term stations, A and B (Figure 1), at Hetta Lake on 5 June, 9 July, 4 August, 1 September, and 2 October 2009. Physical data were collected only at Station B. The results were averaged between stations.
Light and Temperature Profiles Underwater light intensity was recorded at 0.5 m intervals from just below the surface to the depth of 1% of measured intensity of the light reading just below the surface using an electronic light meter (Li-Cor). The natural log (ln) of the ratio of light intensity just below the surface to light intensity at depth z, I0/Iz, was calculated for each depth. The vertical light extinction coefficient (Kd) was estimated as the slope of ln(I0/Iz) versus depth. The euphotic zone depth (EZD) was defined as the depth at which light (photosynthetically available radiation at 400–700 nm) was attenuated to 1 percent of the intensity just below the lake surface (Schindler 1971) and calculated with the equation EZD = 4.6205/ Kd (Kirk 1994).
Temperature, in degrees centigrade (ºC), was measured with a Yellow Springs Instruments (YSI) Model 58 meter. Measurements were made at 1 m intervals to the first 10 m or the lower boundary of the thermocline (defined as the depth at which the change in temperature decreased to less than 1ºC per meter). Below this depth, measurements were made at 5 m intervals to 50 m.
Secondary Production To assess the quality of the prey base available to sockeye salmon fry rearing in Hetta Lake, zooplankton were collected using a 0.5 m diameter, 153 um mesh, 1:3 conical net. Vertical zooplankton tows were pulled from a maximum depth of 50 m, at a constant speed of 0.5 m/sec (approximated while hand towing). The net was rinsed prior to removing the organisms, and all specimens were preserved in neutralized 10% formalin (Koenings et al. 1987). Each zooplankton tow was sub-sampled in the laboratory, and technicians identified to species or genus, counted, and measured organisms in the sub-samples (Koenings et al. 1987). Density (individuals per m2 of lake surface area) was extrapolated from counts by taxon in the sub-samples, and seasonal mean density was estimated by taking the simple average of densities across sampling dates. The seasonal mean length for each taxon, weighted by density at each sampling date, was estimated and used to calculate a seasonal mean biomass estimate (weight per m2 surface area) based on known length-weight relationships (Koenings et al. 1987). Total seasonal mean zooplankton biomass and density were estimated by summing across all species.
7
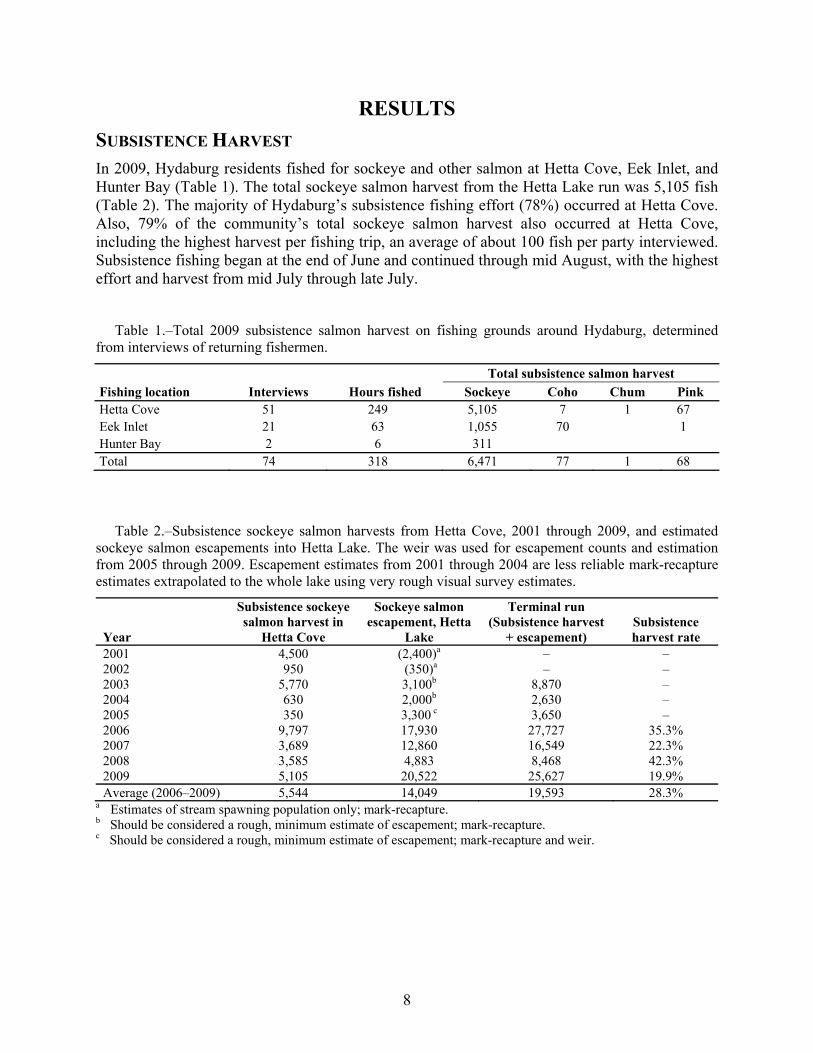
RESULTS SUBSISTENCE HARVEST In 2009, Hydaburg residents fished for sockeye and other salmon at Hetta Cove, Eek Inlet, and Hunter Bay (Table 1). The total sockeye salmon harvest from the Hetta Lake run was 5,105 fish (Table 2). The majority of Hydaburg’s subsistence fishing effort (78%) occurred at Hetta Cove. Also, 79% of the community’s total sockeye salmon harvest also occurred at Hetta Cove, including the highest harvest per fishing trip, an average of about 100 fish per party interviewed. Subsistence fishing began at the end of June and continued through mid August, with the highest effort and harvest from mid July through late July.
Table 1.–Total 2009 subsistence salmon harvest on fishing grounds around Hydaburg, determined
from interviews of returning fishermen.
Fishing location Interviews Hours fished Total subsistence salmon harvest
Sockeye Coho Chum Pink Hetta Cove 51 249 5,105 7 1 67 Eek Inlet 21 63 1,055 70 1 Hunter Bay 2 6 311 Total 74 318 6,471 77 1 68
Table 2.–Subsistence sockeye salmon harvests from Hetta Cove, 2001 through 2009, and estimated
sockeye salmon escapements into Hetta Lake. The weir was used for escapement counts and estimation from 2005 through 2009. Escapement estimates from 2001 through 2004 are less reliable mark-recapture estimates extrapolated to the whole lake using very rough visual survey estimates.
Year
Subsistence sockeye salmon harvest in
Hetta Cove
Sockeye salmon escapement, Hetta
Lake
Terminal run (Subsistence harvest
+ escapement) Subsistence harvest rate
2001 4,500 (2,400)a – – 2002 950 (350)a – – 2003 5,770 3,100b 8,870 – 2004 630 2,000b 2,630 – 2005 350 3,300 c 3,650 – 2006 9,797 17,930 27,727 35.3% 2007 3,689 12,860 16,549 22.3% 2008 3,585 4,883 8,468 42.3% 2009 5,105 20,522 25,627 19.9% Average (2006–2009) 5,544 14,049 19,593 28.3%
a Estimates of stream spawning population only; mark-recapture. b Should be considered a rough, minimum estimate of escapement; mark-recapture. c Should be considered a rough, minimum estimate of escapement; mark-recapture and weir.
8

SOCKEYE SALMON ESCAPEMENT ESTIMATE Weir Count Totals of 20,522 sockeye salmon (full size and jacks), 3,917 coho salmon, 46,608 pink salmon, 604 chum salmon, and 33 Dolly Varden char were counted at the Hetta weir between 10 June and 20 September 2009 (Appendix A5). By 20 September, the sockeye salmon migration had slowed to less than 10 fish per day but coho, chum, and pink salmon were still migrating past the weir in large numbers when the weir was removed for the season. The majority of the sockeye salmon were passed through the weir between 10 August and 10 September. The largest daily count occurred on 25 August when 5,048 sockeye salmon were counted past the weir (Figure 3). The water level at the weir fluctuated between 0.3 m and 0.7 m during the 3-month period of operation.
SOCKEYE SALMON ESCAPEMENT AGE AND LENGTH COMPOSITION The crew sampled 470 sockeye salmon for age, sex, and length composition, of which 402 scale samples were successfully aged. We fell short of our goal of 620 samples because 3 weeks (statistical weeks 26, 31, and 32) worth of samples were lost, and the crew did not collect scale samples during the last 2 weeks of the season (statistical weeks 36 and 37). Sockeye salmon from brood years 2003 to 2006 were represented in the escapement and the majority (85%) were age-1.3 fish from brood year 2004 (Table 3; Appendix A6). The mean lengths of fish corresponded with the time spent in the marine environment. Cohorts of ages 1.2 and 2.2 were smaller (490 mm and 521 mm), while age-1.3 fish were substantially larger (553 mm; Table 4).
Figure 3.–Daily sockeye salmon escapement counts and water depth at the weir on the Hetta Lake
outlet stream in 2009.
9

Table 3.–Age composition of adult sockeye salmon escapement in Hetta Lake, by sex, in 2009, weighted by statistical week.
Brood year, by age class Total aged,
by sex 2006 2005 2004 2003 Stratum 1.1 1.2 1.3 2.2 2.3 Male Sample size 12 25 141 2 1 181 Proportion of all fish 7.3% 12.5% 76.2% 2.1% 1.9% SE 0.2% 0.5% 3.6% 0.1% 0.1% Female Sample size 23 195 3 221 Proportion of all fish 5.1% 92.9% 2.0% SE 0.1% 1.9% 0.1% All Fish Sample size 12 48 336 2 4 402 Proportion of all fish 3.4% 9.0% 84.8% 0.9% 1.8% SE 0.0% 0.2% 2.2% 0.0% 0.0%
Table 4.–Mean mideye-to-fork length of adult sockeye salmon in the 2009 Hetta Lake escapement,
weighted by statistical week.
Brood year 2006 2005 2004 2004 2003 Total, aged by sex Age 1.1 1.2 1.3 2.2 2.3
Male Sample size 12 25 141 2 1 181 Mean length 356 495 560 518 540 SE 2.7 7.1 2.8 7.8 0.0 Female Sample size 23 195 3 221 Mean length 491 544 488 SE 8.5 3.5 16.5 All Fish Sample size 12 48 336 2 4 402 Mean length 356 483 553 521 524 SE 2.3 11.8 2.0 4.5 10.6
SOCKEYE SALMON FRY POPULATION ASSESSMENT We estimated a total population of 686,000 small pelagic fish (CV=4.1%; Table 5) in Hetta Lake on 1 September 2009, based on the hydroacoustic survey data. The species composition of 7 trawl surveys was 112 (37%) sockeye salmon fry and 188 (63%) sticklebacks; however the mid-water trawl samples do not accurately represent the abundance of sockeye salmon fry in Hetta Lake (see discussion).
10

Table 5.–Small pelagic fish population estimates from hydroacoustic surveys of Hetta Lake, and estimated species composition from trawl samples, 2004–2009.
Year Survey month Pelagic fish total % Sockeye fry % Stickleback 2004 Oct 885,000 53% 47% 2005 Oct 1,076,000 2% 98% 2006 Sep 1,024,000 2% 98% 2007 ND ND 2008 Sep 737,000 52% 48% 2009 Sep 685,000 37% 63%
Light and Temperature Profiles The euphotic zone depth in Hetta Lake fluctuated 2 m during the season and averaged about 11 m for the season (Table 6). The thermocline was already developing when temperature was first measured on 5 June and reached maximum measured values on 4 August (Figure 4).
Table 6.–Euphotic zone depths at station B in Hetta Lake in 2009.
Date Depth (m) 05 Jun 11.7 9 Jul 12.4 4 Aug 11.8 1 Sep 10.3 2 Oct 10.4 Seasonal mean 11.3
Figure 4.–Water temperature profiles at station B in Hetta Lake in 2009.
11

Secondary Production In 2009, the zooplankton assemblage in Hetta Lake was numerically dominated by 3 cladoceran genera that accounted for 79% of the population, but also included copepods and unspecified immature cladocerans (Table 7). The total Hetta Lake zooplantkon biomass was dominated by cladocerans (91% of the biomass; Table 8). Small-bodied Bosmina sp. accounted for the majority of the zooplankton (73.9%, Table 7) and also the highest biomass (88.7%, Table 8). Cyclops and Bosmina numbers increased rapidly during the summer months and Cyclops also increased in size while Bosmina did not (Table 8).
Table 7.–Mean numerical density of zooplankton per m2 of lake surface area, by sampling date and
taxon, in Hetta Lake in 2009. Density estimates from station A and B samples were averaged.
Taxon
Macrozooplankton density (number/m2), by sampling date Seasonal
mean density
Percent of seasonal
mean density 5 Jun 9 Jul 4 Aug 1 Sep 2 Oct
Cyclops sp. 7,811 2,590 1,019 1,104 891 2,683 4.8% Nauplii 8,236 3,057 4,160 15,283 13,372 8,822 15.9% Bosmina sp. 3,524 30,948 80,489 68,008 21,778 40,949 73.9% Daphnia longiremis 0 127 509 340 127 2,725 4.9% Holopedium sp. 0 0 85 0 0 221 0.4% Immature Cladocera 1,401 4,755 9,255 5,009 1,910 17 0.0% Total 20,971 41,476 95,517 89,744 38,079 55,417
Table 8.–Seasonal mean length and biomass of zooplankton in Hetta Lake in 2009. Estimates from station A and B samples were averaged.
Taxon
Macrozooplankton length (mm), by sampling date Seasonal Means
Percent of seasonal
mean
Length, weighted
(mm)Biomass (mg/m2) 5 Jun 9 Jul 4 Aug 1 Sep 2 Oct
Cyclops 0.6 0.5 0.5 0.6 0.6 0.4 2.9 9.2% Bosmina 0.3 0.3 0.3 0.3 0.3 0.3 25.2 81.2% Ovig. Bosmina 0.0 0.3 0.3 0.3 0.3 0.3 2.3 7.5% Daphnia l. 0.0 0.3 0.4 0.6 0.8 0.7 0.5 1.8% Holopedium 0.0 0.0 0.4 0.0 0.0 0.4 0.1 0.4%
Total 31
DISCUSSION The weir count of 20,522 sockeye salmon at Hetta Lake in 2009 provided a minimum estimate of escapement because the weir was not in operation for the entire sockeye salmon run and we did not verify the weir count with a mark-recapture study. A small proportion of the run likely entered the system uncounted prior to installation of the weir on 10 June and after the weir was removed on 20 September; however, we assume the weir was in operation for at least 95% of the run based 2005–2008 weir data. No high water events or known structural problems occurred that may have allowed additional fish to pass through the weir uncounted. Also, the crew cleaned the weir of debris and checked it for holes, loose pickets, and scouring every day to ensure it was fish-tight throughout the field season. Therefore, we believe the weir count of 20,522 fish accounted for majority of the sockeye salmon run in 2009.
12

The total terminal run to Hetta Lake (subsistence harvest plus escapement) in 2009 was 25,627 sockeye salmon, which was above the 4-year average, 2006–2009 (Table 2). About 20% of the terminal run was harvested in 2009. In the past 4 years, the subsistence harvest rate has ranged between 20% and 42% of the terminal run (Table 2).
In addition to estimating the sockeye salmon escapement and subsistence harvest in 2009, project objectives also included estimating the abundance of sockeye salmon fry and zooplankton density and biomass in Hetta Lake. Those objectives were accomplished but we had difficulty comparing these estimates with results from prior seasons, and we also concluded that trawl sampling to estimate species composition of pelagic fish at Hetta Lake is likely confounded by the high abundance of threespine stickleback.
The 2009 estimate of total pelagic fish abundance in Hetta Lake (685,000 fish; sockeye salmon fry + threespine stickleback) was the smallest estimate of the 5 years in which surveys were conducted in the fall (2004–2006, 2008, and 2009; Table 5). Hydroacoustic and mid-water trawl surveys were conducted in July during 2001–2003. Beginning in 2004, the surveys were conducted in September or October (Conitz et al. 2007, Conitz 2008, Host et al. 2008, Blikshteyn and Conitz 2009, Conitz and Blikshteyn 2010). Mid-summer and fall estimates of small pelagic fish abundance are not comparable because the abundance of species is seasonally different. The abundance of sockeye salmon fry can change substantially over the summer, depending on the time fry enter the lake and their survival rate over the course of the season. For example, the sockeye salmon fry population at Hugh Smith Lake, Southeast Alaska, showed summer-to-fall decreases of 29% to 61% during the four years that summer and fall surveys were conducted, 2004–2007 (Piston et al. 2007, Piston 2008).
The goal of the hydroacoustic and trawl surveys is to obtain sockeye salmon fry population estimates but results from our work in 2009 provided strong evidence that mid-water trawl samples do not accurately represent the abundance of sockeye salmon fry in Hetta Lake. Age composition data from 2009 (Table 3) showed that 86% of the escapement, 17,600 sockeye salmon, originated from brood year 2004. Those fish reared in Hetta Lake in 2005; however, the 2005 sockeye salmon fry population was estimated to be only 24,000 fish out of a total pelagic fish population of 1,076,000 (Host et al. 2008). The fry-to-adult survival rate of those fish would have to be greater than 73% to yield the 2009 return, which would be unprecedented. Marine mortality rates of sockeye salmon range from 50% to more than 95% (Burgner 1991) and those values would not include additional fry-to-smolt mortality. The sockeye salmon fry population was under-estimated because the estimate was confounded by the presence of threespine sticklebacks which have annually accounted for 47% to 98% of the fish caught in trawl surveys at Hetta Lake since 2004 (Table 5).
When two species of similar size (e.g., sockeye salmon fry and threespine stickleback) occur together, trawl surveys are used to apportion the hydroacoustic population estimate among the species found. However, trawl samples can be biased when catching multiple species. Sockeye salmon fry over 40 mm in length were found to avoid trawl nets in British Columbia lakes (Hyatt et al. 2005), which could inflate the proportion of threespine sticklebacks in trawl samples. Enzenhofer and Hume (1989) studied the effects of contamination in trawl surveys (fish entering open trawl nets while lowering and raising the net) in Shuswap Lake, British Columbia. They found the proportion of sockeye salmon fry caught in closed trawl nets (nets that were lowered to depth, then opened) was more than double the proportion caught in open trawl nets in which more stickleback were captured as the net was raised and lowered through shallower depths
13

(Enzenhofer and Hume 1989). These biases would result in incorrect species apportionment and likely accounted for the discrepancy between the sockeye salmon fry abundance estimate for Hetta Lake in 2005 and the number of adults that returned to the lake in 2009. We must conclude, therefore, that biases in the Hetta Lake trawl surveys indicate that previously reported estimates of sockeye salmon fry and threespine stickleback abundance should not be used. Zooplankton samples in 2009 were mostly comprised of cladocerans, a known food source for sockeye salmon fry (Burgner 1991). As an index of zooplankton abundance, 2009 results appear to be comparable to previous years (2001–2008) with no obvious anomalies (Conitz et al. 2007, Conitz 2008, Host et al. 2008, Blikshteyn and Conitz 2009, Conitz and Blikshteyn 2010). It would be difficult, however, to make a more detailed comparison among years because of gaps in seasonal data collection. For instance, no samples were collected in September of 2002, 2004, and 2005 (Lewis and Cartwright 2004) or July of 2003 and 2006 (Conitz 2008). The lack of samples for some months, particularly September, could greatly influence estimates of overall abundance, because annual zooplankton density and biomass are often estimated by simply averaging across all available data. Zooplankton biomass changes over the course of the season and often peaks in the fall when many of the data gaps occurred (McEwen et al. 2002, Lewis and Cartwright 2004, Cartwright et al. 2005, Conitz et al. 2007, Conitz 2008, Host et al. 2008, Blikshteyn and Conitz 2009, Conitz and Blikshteyn 2010).
ACKNOWLEDGMENTS The Hydaburg Cooperative Association (HCA), under the leadership of natural resources director Anthony Christianson, was the principal cooperator on this project. HCA was responsible for the field project operation, including installation, maintenance, and removal in the fall of the Hetta weir. We thank the HCA crew members, Lee Charles, Jeff Peele, and Pete Adams, HCA elder and retired biologist Robert Sanderson, and HCA employee Chris Tolson. Sue Domenowske served as the ADF&G field biologist overseeing data collection. ADF&G biologist Andy Piston organized and led the hydroacoustic and trawl surveys. Other ADF&G staff assisting with the project included Iris Frank, Steve Thomsen, Kim Vicchy, Rhonda Ren-Kingery, Renate Riffe, and Jim Craig.
REFERENCES CITED Blikshteyn, M. A., and J. M. Conitz. 2009. Hetta Lake subsistence sockeye salmon project: 2007 annual report.
Alaska Department of Fish and Game, Fishery Data Series No. 09-34, Anchorage.
Burgner, R. L. 1991. Life history of sockeye salmon (Oncorhynchus nerka). Pages 3–117. [In] C. Groot, and L. Margolis, editors. Pacific salmon life histories. UBC Press, Vancouver, British Columbia.
Cartwright, M. A., J. M. Conitz, R. W. Bale, K. S. Reppert, and B. A. Lewis. 2005. Hetta Lake sockeye salmon (Oncorhynchus nerka) stock assessment project 2003 annual report and 2001–2003 final report. Alaska Department of Fish and Game, Fishery Data Series No. 05-33, Anchorage.
Cochran, W. G . 1977. Sampling techniques, third edition. John Wiley and Sons Inc. New York, NY.
Conitz, J. M. 2008. Hetta Lake subsistence sockeye salmon project: 2006 Annual Report and 2004–2006 Final Report. Alaska Department of Fish and Game, Fishery Data Series No.08-52, Anchorage.
Conitz, J. M. and M. A. Blikshteyn. 2010. Hetta Lake subsistence sockeye salmon project: 2008 annual report. Alaska Department of Fish and Game, Fishery Data Series No.10-12, Anchorage.
Conitz, J. M., J. P. Stahl, R. W. Bale, and M. A. Cartwright. 2007. Hetta and Eek lakes subsistence sockeye salmon project: 2004 annual report. Alaska Department of Fish and Game, Fishery Data Series No. 07-19, Anchorage.
14

15
REFERENCES CITED (Continued) Clutter, R., and L. Whitesel. 1956. Collection and interpretation of sockeye salmon scales. Bulletin of the
International Pacific Salmon Fisheries Commission 9, New Westminster, British Columbia.
Enzenhofer, H. J., and J. M. Hume. 1989. Simple closing midwater trawl for small boats. North American Journal of Fisheries Management (9) 372–377.
Host, S. A., J. M. Conitz, and M. A. Cartwright. 2008. Hetta Lake subsistence sockeye salmon project: 2005 annual report. Alaska Department of Fish and Game, Fishery Data Series No. 08-09, Anchorage.
Hyatt, K. D., C. Ramcharan, D. J. McQueen, and K. L Cooper. 2005. Trophic triangles and competition among vertebrate (Onchorhynchus nerka, Gasterosteus aculeatus) and macroinvertebrate (Neomysis mercedis) planktivores in Muriel Lake, British Columbia, Canada. Ecoscience, 12(1): 11-26.
INPFC (International North Pacific Fisheries Commission). 1963. Annual Report 1961. Vancouver, British Columbia.
Kirk, J. T. O. 1994. Light and photosynthesis in aquatic ecosystems. Cambridge University Press, England.
Koenings, J. P., G. B. Kyle, J. A. Edmundson, and J. E. Edmundson. 1987. Limnology field and laboratory manual: methods for assessing aquatic production. Alaska Department of Fish and Game, Division of Fisheries Rehabilitation, Enhancement, and Development, Report No. 71, Juneau.
Koo, T. S. Y. 1962. Age designation in Salmon. Pages 37–48 [In] T. S. Y. Koo, editor. Studies of Alaska red salmon. University of Washington Publications in Fisheries, New Series Volume 1, Seattle.
Langdon, S. J. 1977. Technology, ecology, and economy: fishing systems in Southeast Alaska. Doctoral dissertation, Stanford University.
Lewis, B. A., and M. A. Cartwright. 2004. Hetta Lake sockeye salmon (Oncorhynchus nerka) stock assessment project 2002 annual report. Alaska Department of Fish and Game, Division of Commercial Fisheries, Regional Information Report No. 1J04-10, Juneau.
MacLennan, D. N., and E. J. Simmonds. 1992. Fisheries Acoustics. Van Nostrand-Reinhold, New York, NY.
McEwen, M., B. A. Lewis, and M. A. Cartwright. 2002. Hetta Lake sockeye salmon stock assessment project 2001 annual report. Alaska Department of Fish and Game, Division of Commercial Fisheries, Regional Information Report No. 1J02-26, Juneau.
Moser, J. F. 1899. The salmon and salmon fisheries of Alaska. Bulletin of the United States Fish Commission. U.S. Government Printing Office, Washington, D.C.
Piston, A. W. 2008. Hugh Smith Lake sockeye salmon adult and juvenile studies, 2007. Alaska Department of Fish and Game, Fishery Data Series No. 08-43, Anchorage.
Piston, A. W. 2009. Hugh Smith Lake sockeye salmon adult and juvenile studies, 2008. Alaska Department of Fish and Game, Fishery Data Series No. 09-61, Anchorage.
Piston, A. W., and S. C. Heinl. 2010. Disappearance Creek chum salmon weir study, 2008. Alaska Department of Fish and Game, Fishery Data Series No. 10-15, Anchorage.
Piston, A. W., S. C. Heinl, and H. J. Geiger. 2007. Hugh Smith Lake sockeye salmon adult and juvenile studies, 2006. Alaska Department of Fish and Game, Fishery Data Series No. 07-58, Anchorage.
Roppel, P. 1982. Alaska’s salmon hatcheries, 1891–1959. National Marine Fisheries Service, Portland, OR.
Rich, W. H., and E. M. Ball. 1933. Statistical review of the Alaska salmon fisheries. Part IV: Southeastern Alaska. Bulletin of the Bureau of Fisheries, Vol. XLVII (47), No. 13: 437–673.
Schindler, D. W. 1971. Light, temperature, and oxygen regimes of selected lakes in the experimental lakes area, northwestern Ontario. Journal of the Fisheries Research Board of Canada 28: 157–169.
Vinzant, R. F., J. M. Conitz, and M. A. Blikshteyn. 2010. Kanalku Lake subsistence sockeye salmon project: 2008 annual report. Alaska Department of Fish and Game, Fishery Data Series No. 10-13, Anchorage.

16

17
APPENDICES

Appendix A1.–Historical sockeye salmon commercial fishery information from Rich and Ball 1933.
Year Sockeye salmon1887 24,0221888 47,4681889 48,5851890 59,6731891 1,0891892 51,4791893 10,5861894 47,7691895 78,4641896 201,2991897 199,7761898 179,1091899 250,8341900 138,7331901 ND1902 ND1903 ND1904 51,6541905 53,0451906 42,7411907 18,6161908 37,3151909 54,2701910 28,3651911 51,7471912 61,1391913 48,6001914 66,2771915 61,3711916 11,2971917 32,6911918 26,0081919 34,1881920 37,4851921 13,8011922 18,9381923 19,7701924 2,101
18

Appendix A2.–Water depth (m) at the weir, 2006–2009.
Appendix A3.–Approximate weekly sampling schedule for sockeye salmon at the Hetta Lake weir in 2009 (length, sex, and scales).
Statistical Week Dates Number of fish
to sample 24 7–13 Jun 10 25 14–20 Jun 10 26 21–27 Jun 10 27 28 Jun–4 Jul 10 28 5–11 Jul 20 29 12–18 Jul 20 30 19–25 Jul 40 31 26 Jul–1 Aug 60 32 2–8 Aug 60 33 9–15 Aug 120 34 16–22 Aug 120 35 23–29 Aug 100 36 30 Aug–5 Sep 20 37 6–12 Sep 20
Total 620
19

Appendix A4.–Escapement sampling data analysis.
The weekly age-sex distribution, the seasonal age-sex distribution weighted by week, and the mean length by age and sex weighted by week, for smolt and adults, were calculated using equations from Cochran (1977; pages 52, 107-108, and 142-144). Let
h = index of the stratum (week),
j = index of the age class,
phj = proportion of the sample taken during stratum h that is age j,
nh = number of fish sampled in week h, and
nhj = number observed in class j, week h.
Then the age distribution was estimated for each week of the escapement in the usual manner:
hhjhj nnp =ˆ . (1)
If Nh equals the number of fish in the escapement in week h, standard errors of the weekly age class proportions are calculated in the usual manner (Cochran 1977, page 52, equation 3.12):
( ) ( )( ) [ ]hhh
hjhjhj Nn
npp
pSE −⎥⎦
⎤⎢⎣
⎡−
−= 1
1ˆ1ˆ
ˆ . (2)
The age distributions for the total escapement were estimated as a weighted sum (by stratum size) of the weekly proportions. That is,
( NNpp hh
hjj ∑=ˆ ) , (3)
such that N equals the total escapement. The standard error of a seasonal proportion is the square root of the weighted sum of the weekly variances (Cochran 1977, pages 107–108):
( ) ( )[ ] ( )∑=h
jhhjj NNpSEpSE 22ˆˆ . (4)
The mean length, by sex and age class (weighted by week of escapement), and the variance of the weighted mean length, were calculated using the following equations from Cochran (1977, pages 142-144) for estimating means over subpopulations. That is, let i equal the index of the individual fish in the age-sex class j, and yhij equal the length of the ith fish in class j, week h, so that,
( )
( )∑∑ ∑
=
hhjhh
h ihijhh
j nnN
ynNY , and (5)
( )( ) ( )
⎥⎥⎦
⎤
⎢⎢⎣
⎡⎟⎠⎞⎜
⎝⎛ −⎟⎟⎠
⎞⎜⎜⎝
⎛−+−
−−
=⎟⎠⎞⎜
⎝⎛ ∑∑
ijhj
h
hjhjhjhij
h hh
hhh
jj Yy
nn
nyynn
NnNN
YV2
22
2ˆ1
11
ˆ1ˆˆ .
20
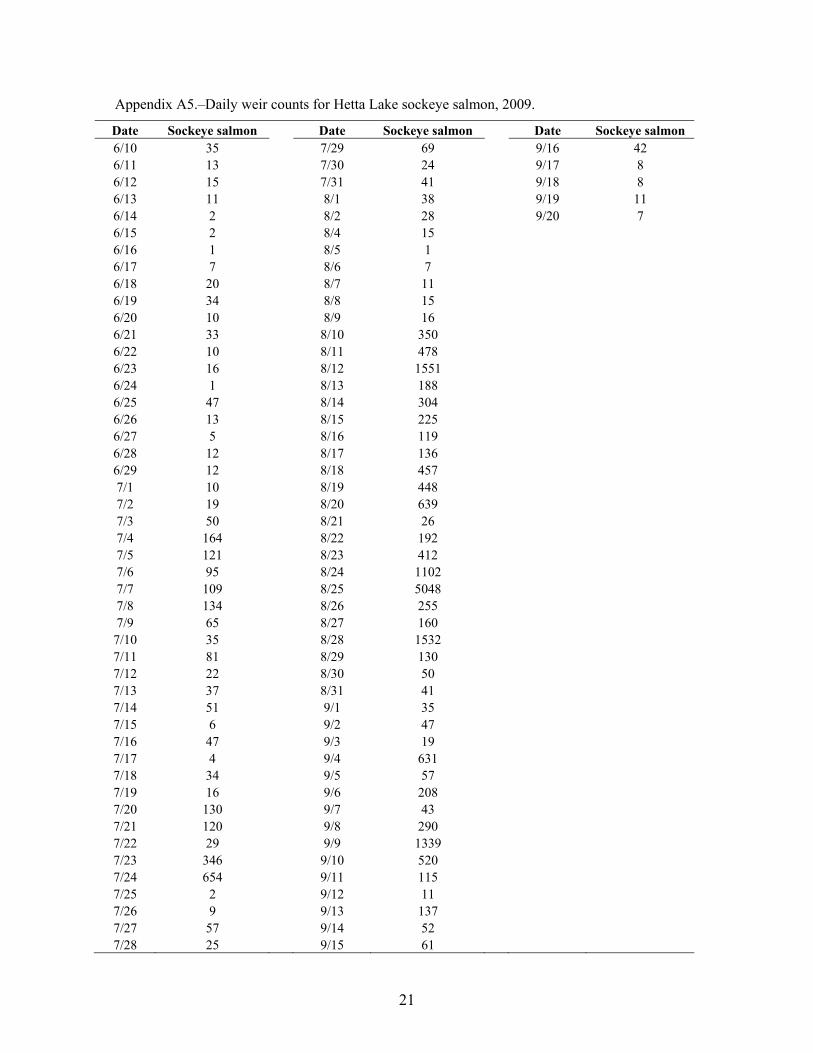
Appendix A5.–Daily weir counts for Hetta Lake sockeye salmon, 2009.
Date Sockeye salmon Date Sockeye salmon Date Sockeye salmon 6/10 35 7/29 69 9/16 42 6/11 13 7/30 24 9/17 8 6/12 15 7/31 41 9/18 8 6/13 11 8/1 38 9/19 11 6/14 2 8/2 28 9/20 7 6/15 2 8/4 15 6/16 1 8/5 1 6/17 7 8/6 7 6/18 20 8/7 11 6/19 34 8/8 15 6/20 10 8/9 16 6/21 33 8/10 350 6/22 10 8/11 478 6/23 16 8/12 1551 6/24 1 8/13 188 6/25 47 8/14 304 6/26 13 8/15 225 6/27 5 8/16 119 6/28 12 8/17 136 6/29 12 8/18 457 7/1 10 8/19 448 7/2 19 8/20 639 7/3 50 8/21 26 7/4 164 8/22 192 7/5 121 8/23 412 7/6 95 8/24 1102 7/7 109 8/25 5048 7/8 134 8/26 255 7/9 65 8/27 160 7/10 35 8/28 1532 7/11 81 8/29 130 7/12 22 8/30 50 7/13 37 8/31 41 7/14 51 9/1 35 7/15 6 9/2 47 7/16 47 9/3 19 7/17 4 9/4 631 7/18 34 9/5 57 7/19 16 9/6 208 7/20 130 9/7 43 7/21 120 9/8 290 7/22 29 9/9 1339 7/23 346 9/10 520 7/24 654 9/11 115 7/25 2 9/12 11 7/26 9 9/13 137 7/27 57 9/14 52 7/28 25 9/15 61
21

22
Appendix A6.–Age composition (proportion) of sockeye salmon in Hetta Lake escapement, 1982–2009.
Year 1.1 1.2 1.3 1.4 2.1 2.2 2.3 Age 1.- Age 2.- 1982 0.00 0.07 0.92 0.00 0.00 0.00 0.00 0.99 0.00 1983 0.11 0.26 0.62 0.00 0.00 0.00 0.00 1.00 0.00 1984 0.21 0.50 0.28 0.00 0.00 0.01 0.00 0.99 0.01 1985 0.12 0.27 0.57 0.00 0.00 0.00 0.03 0.96 0.04 1986 0.01 0.50 0.45 0.00 0.00 0.02 0.02 0.96 0.04 1987 0.01 0.02 0.96 0.00 0.00 0.00 0.02 0.98 0.02 1988 0.06 0.49 0.43 0.00 0.00 0.02 0.00 0.98 0.02 1990 0.03 0.40 0.55 0.00 0.00 0.01 0.01 0.97 0.03 1991 0.12 0.26 0.60 0.00 0.00 0.01 0.01 0.98 0.02 1992 0.04 0.42 0.52 0.00 0.00 0.01 0.01 0.98 0.02 1993 0.00 0.24 0.68 0.00 0.00 0.01 0.07 0.93 0.07 1994 0.08 0.07 0.82 0.00 0.00 0.00 0.01 0.98 0.02 1995 0.32 0.49 0.12 0.00 0.05 0.00 0.01 0.93 0.07 1996 0.00 0.33 0.66 0.00 0.00 0.01 0.00 0.99 0.01 1997 0.00 0.04 0.94 0.00 0.00 0.01 0.01 0.98 0.02 1998 0.48 0.14 0.34 0.00 0.02 0.01 0.01 0.96 0.04 1999 0.02 0.71 0.23 0.00 0.00 0.04 0.00 0.96 0.04 2000 0.00 0.21 0.75 0.00 0.00 0.01 0.03 0.96 0.04 2001 0.01 0.17 0.81 0.00 0.00 0.00 0.01 0.98 0.02 2002 0.04 0.70 0.22 0.00 0.00 0.03 0.00 0.96 0.04 2003 0.01 0.41 0.50 0.00 0.00 0.06 0.03 0.92 0.08 2004 0.08 0.31 0.54 0.00 0.00 0.03 0.04 0.93 0.07 2005 0.07 0.66 0.24 0.01 0.00 0.01 0.01 0.98 0.02 2006 0.00 0.53 0.43 0.00 0.00 0.04 0.00 0.96 0.04 2007 0.05 0.01 0.85 0.01 0.00 0.00 0.08 0.92 0.08 2008 0.04 0.86 0.07 0.02 0.00 0.01 0.00 0.99 0.01 2009 0.03 0.12 0.84 0.00 0.00 0.00 0.01 0.99 0.01 Average, all years 0.07 0.34 0.55 0.00 0.00 0.01 0.02 0.97 0.03 SE 0.06 0.09 0.10 0.01 0.02 0.02 0.03 0.03 0.03