heta 88-304-2326 niosh investigators: june 1993 richard · pdf fileheta 88-304-2326 niosh...
TRANSCRIPT

HETA 88-304-2326 NIOSH INVESTIGATORS:JUNE 1993 Richard W. Hartle, M.P.H., C.I.H.AMERICAN PETROLEUM INSTITUTE John E. Kelly, M.S.WASHINGTON, D.C. Nancy Clark Burton, M.P.H., M.S.
Calvin Cook
I. SUMMARY
The National Institute for Occupational Safety and Health (NIOSH) was contacted by theAmerican Petroleum Institute (API) regarding the expanding uses of methyl tert-butyl ether(MTBE) as an oxygenate and octane enhancer in gasoline. Discussions on the feasibility ofassessing airborne exposures to MTBE led to API's request for a NIOSH Health HazardEvaluation of gasoline-related exposures among service station attendants and operators.
Exposure to the gasoline components MTBE, benzene, toluene, and xylene was measuredamong attendants at six retail automotive service stations. To reflect the multiple uses andpotential exposures of MTBE, two of these facilities were selected to represent its ubiquitoususe as an octane enhancer (generally blended at less than 1% of the fuel), two facilities wereselected to represent requirements to use MTBE as an oxygenate (blended at 12-15% of thefuel), and two facilities equipped with phase II-type vapor recovery were selected todetermine the relative effectiveness of these engineering controls.
Only one of the 16 personal breathing zone (PBZ) samples for MTBE collected at stationsusing less than 1% MTBE as a fuel additive was above the lowest detectable concentration(LDC), at 0.16 part per million (ppm). At stations using fuels blended with approximately 12% MTBE, 41 PBZ samples ranged from 0.03 to 3.89 ppm, averaging 0.54. At the stations equipped with phase II vapor recovery 15 of the 48 PBZ samples weredetectable, with concentrations ranging from 0.02 to 0.73, averaging 0.18 ppm. No evaluation criteria have been established foroccupational exposure to MTBE. At the two stations using less than 1% MTBE, 28 of 32PBZ samples for benzene were above LDC, ranging from 0.01 to 0.29 ppm, averaging 0.06. At the high volume MTBE stations, the 41 measured benzene exposures ranged from 0.01 to0.52 ppm, averaging 0.07. At stations equipped with vapor recovery, 31 detectable benzene exposures ranged from 0.01 to 0.19, averaging 0.07 ppm.
The multiple sites provided for a wide range of climatic and work practice conditions, as wellas the presence/absence of vapor recovery. Linear regression analysis indicates that exposurelevels are affected most significantly by wind velocity, followed by the amount of fueldispensed by the attendant. Comparison of the benzene and MTBE exposure data collectedat vapor recovery and non-vapor recovery service stations indicates that vapor recoverysystems had no significant effect upon exposure levels, even after adjusting for climatic andwork practice variables.
This Health Hazard Evaluation (HHE) report and any recommendations made herein are for the specific facility evaluated and may not be universally applicable. Any recommendations made are not to be considered as final statements of NIOSH policy or of any agency or individual involved. Additional HHE reports are available at http://www.cdc.gov/niosh/hhe/reports
This Health Hazard Evaluation (HHE) report and any recommendations made herein are for the specific facility evaluated and may not be universally applicable. Any recommendations made are not to be considered as final statements of NIOSH policy or of any agency or individual involved. Additional HHE reports are available at http://www.cdc.gov/niosh/hhe/reports
This Health Hazard Evaluation (HHE) report and any recommendations made herein are for the specific facility evaluated and may not be universally applicable. Any recommendations made are not to be considered as final statements of NIOSH policy or of any agency or individual involved. Additional HHE reports are available at http://www.cdc.gov/niosh/hhe/reports
This Health Hazard Evaluation (HHE) report and any recommendations made herein are for the specific facility evaluated and may not be universally applicable. Any recommendations made are not to be considered as final statements of NIOSH policy or of any agency or individual involved.
This Health Hazard Evaluation (HHE) report and any recommendations made herein are for the specific facility evaluated and may not be universally applicable. Any recommendations made are not to be considered as final statements of NIOSH policy or of any agency or individual involved. Additional HHE reports are available at http://www.cdc.gov/niosh/hhe/reports
applicable. Any recommendations made are not to be considered as final statements of NIOSH policy or of any agency or individual involved. Additional HHE reports are available at http://www.cdc.gov/niosh/hhe/reports

MTBE exposure averaged less than 1 ppm, even at service stations using 12% MTBE motor fuel blends. Based upon the available toxicity information, no health hazardwould be expected from these exposures, other than the possibility of transient irritativesymptoms. Benzene exposures are apparently not affected by MTBE content of motor fuels. Atthe service stations monitored, vapor recovery had no effect on reducing exposures to MTBE orbenzene. Recommendations for further evaluation of service stations equipped with vaporrecovery are made in Section VII of this report.
KEYWORDS: SIC 5541 (Gasoline Service Stations), Methyl tert-butyl ether (MTBE),Benzene, Toluene, Xylene, Vapor recovery, Gasoline
Page 3 - Health Hazard Evaluation Report No. 88-304
II. INTRODUCTION
The United States currently consumes over seven million barrels of gasoline per day. Estimations on the number of general retail automotive service stations in the U.S. range from150,000 to 210,000. With the addition of government and private sector fuel dispensingfacilities, the total number is estimated to be greater than 400,000.1 Although the number ofservice station attendants dramatically decreased with the introduction of "self service", thereremains a vast population of workers with occupational exposure to gasoline through fueldispensing operations.
During the 1980's, methyl tert-butyl ether (MTBE) was initially used as an octane enhancerfollowing the Environmental Protection Agency's lead phase-down program. Currently,MTBE is also used as an oxygenated fuel additive in "reformulated" gasolines, to reducecarbon monoxide emissions. Termed "the world's fastest growing petrochemical", the demandfor MTBE could be as much as 300,000 barrels per day by mid-1993.2
Due to this new, extensive use in gasoline, an evaluation of MTBE exposures among servicestation attendants and operators was undertaken at the request of the American PetroleumInstitute (API). In October-November 1990, exposure to the gasoline components MTBE,benzene, toluene, and xylene was measured among attendants at six retail automotive servicestations. To reflect the multiple uses and potential exposures of MTBE, two of these facilitieswere selected to represent its ubiquitous use as an octane enhancer (generally blended at lessthan 1% of the fuel), two facilities were selected to represent requirements to use MTBE as anoxygenate toward reduction of carbon monoxide exhaust emissions (blended at 12-15% ofthe fuel), and two facilities equipped with phase II-type vapor recovery were selected to determine therelative effectiveness of these engineering controls. An interim report was distributed to APIin March, 1991 describing the evaluation methods and techniques, including summary statisticsfor all environmental data.
III. BACKGROUND
In 1977, the Division of Surveillance, Hazard Evaluations, and Field Studies of NIOSHconducted an extensive evaluation of benzene exposures among retail automotive servicestation attendants. This activity was at the request of the Occupational Safety and HealthAdministration (OSHA), in support of the Emergency Temporary Standard for benzene. Atotal of 141 personal breathing zone samples were collected at 28 service stations located in various geographical areas of the U.S. API's knowledge of thisevaluation prompted their original communication with NIOSH in 1988, concerning a similarpotential for occupational exposure to MTBE from its use as a fuel additive. API judged thatthe evaluation techniques used by NIOSH for benzene exposures would also be suitable fordetermining exposures to MTBE.

Page 4 - Health Hazard Evaluation Report No. 88-304
Related mutual interests included the potential influence of MTBE blending on exposures toother constituents of gasoline (particularly benzene), factors affecting the extent of exposure(i.e., work practices), and the effectiveness of vapor recovery systems in limiting exposures.
API contracted for a parallel effort to determine community exposures to MTBE at locationssurrounding service stations, and for assessment of exposures to self-service customers, at thesame time as the NIOSH occupational evaluations. Under this concept, API contracted forthe determination of "gasoline" exposures to self-service customers (breathing zone samples),plus community exposures via service station fenceline monitoring.
To apply any findings/conclusions from the NIOSH study to an audience beyond theevaluated sites, statistical analysis was designed to address 1) the significant climatic and workpractice variables affecting exposure, and 2) determine the degree of exposure reduction atservice stations equipped with vapor recovery systems.
IV. METHODS
A. Site Selection
In consideration of the three basic use/exposure scenarios (low MTBE content, highMTBE content, vapor recovery) three geographic areas reflecting these conditions wereselected. Cincinnati, Ohio was chosen to represent the low MTBE category (MTBEused only as an octane enhancer). API member companies identified two servicestations in the greater Cincinnati area which had the highest volume of sales, andrelatively large full service capacity. It should be noted that at the time of evaluations,fuel prices had recently undergone a substantial increase due to the Middle East crisis. The relative increase in full service fuel prices was in the range of 20 - 40% at thestations evaluated. This had a major impact on the number full service customer visits.
Phoenix, Arizona represented the high-MTBE use category. From November throughMarch, at least 12.6% MTBE is required in all gasoline sold in the Phoenix metropolitanarea. Similarly, two service stations in Los Angeles, California were identified to assess exposuresassociated with the use of vapor recovery systems.
B. Statistical Discussion
To determine an appropriate sample size, preliminary information and intended goals ofthe evaluation were submitted for statistical assessment. Based on an assumed CV of .40% (derived from results of the similar, 1978 NIOSH study) it was determined thatsampling consist of approximately 60 shifts, with 16 sampled shifts from Cincinnati, and22 sampled shifts each from Phoenix and Los

Page 5 - Health Hazard Evaluation Report No. 88-304
Angeles. The two primary objectives identified for statistical analysis were 1) identify theclimatic and work practice variables with the most impact on exposure variation, and 2)determine the effectiveness of vapor recovery. The sample size of 60 would produce95% confidence intervals on exposure factors within 25% of the mean. Weightedmultiple linear regression was used for this analysis (sample time as the weighting factor;samples collected over a relatively longer period had more influence in the analysis).
The data set consisted of 121 personal breathing zone samples collected forapproximately 4-hr periods (half-shift samples provided greater variability amongdependant/independent variables). As mentioned earlier, the cities selected provided arange of environmental conditions (temperature, humidity, wind velocity) as well as thepresence or absence of vapor recovery systems, and the presence or absence of MTBE. In addition to the dependant variables (PBZ exposures) a number of independentvariables were used, including the number of gallons of the various grades of fuel pumpedby the attendant, total fuel through put of the station, number and size of spills,temperature, wind speed, relative humidity, total number of pumping occurrences, andthe liquid volume % of the target components in the fuel. Created variables included"area" conversions of the spill data (3.14 x (diameter/2)2), and the "sum" of all gallons offuel pumped by the attendant.
All four dependent variables showed a distribution of their residuals in the regressionmodels that was highly skewed. Therefore, a log transform for each of the fourdependent variables was used. The analysis was confined to no more than second ordermodels (no more than two-way interactions, or quadratic terms for continuousindependent variables) due to the number of variables and the straightforward objectivesof the analysis.
C. Data Collection
Several work practice and climatic variables were measured during environmentalsample collection. These included:
1. liquid volume percent (LV%) MTBE, benzene, toluene, and xylene present in thevarious grades of fuels during sampling.
It has been suggested that the relationship between airborne exposures at servicestations and the amount of the target chemical in the fuel is approximately one-thirddependant on the mixture in the auto fuel tank and approximately two-thirdsdependant on the mixture of the delivered fuel.2 This relationship is undoubtedlyquite unstable, depending on a number of conditions, including fuel remaining in thetank, fuel temperature, recent use of the automobile, etc. Because
Page 6 - Health Hazard Evaluation Report No. 88-304
of the number of autos serviced, collection of representative samples from eachauto was impractical. However, bulk samples were collected of each gradedispensed at the station during the evaluation. The samples were collected at thebeginning of the evaluation, and following each bulk fuel delivery (4-6 hours after delivery to allow for mixing in the storage tanks and purging of thepumps and hoses). The 10 milliliter samples were analyzed for MTBE, benzene,toluene, and xylene (v/v). A total of 79 samples were collected from the six stations.
2. amount and grade of fuel dispensed by the attendant and at the service stationduring the sampling period.
At each refueling, the amount and grade of fuel dispensed by the attendant wasrecorded. For each environmental sample, a corresponding weighted averageliquid volume % was calculated for each of the measured components in the gradeof fuel.
3. amount of time required for each "re-fueling."
As in most situations involving exposures to airborne contaminants the extent ofexposure is greatly affected by the proximity of the worker to the source of thecontaminant. We defined this relationship in this evaluation as amount of time theattendant was in the vicinity of the vehicle while fuel was actually being dispensed. For each refueling, a summation of this time was recorded, along with the type andamount of fuel dispensed. In the statistical analysis, this information was used in theform of total time spent refueling during the sample period, number of refuelingevents during the sampling period, and percent of the sampling period or work shiftactually spent pumping fuel.
4. number and size spills during re-fueling.
If a spill occurred during refueling (i.e., tank over-fill or residual fuel in the nozzlespilled prior to, or after refueling) the NIOSH investigator recorded the number andsize. Size was estimated as the diameter of the spill. This information was laterconverted to area (3.14 x (diameter/2)2), for statistical analysis.
5. climatic conditions including temperature, relative humidity, and windspeed.
Temperature and relative humidity were measured using a battery operatedpsychron. Readings were recorded approximately every hour. Windspeed anddirection was measured at the sites with a Climatronics cup anemometer equippedwith a strip chart recorder. The mechanism was placed near the fuel pumps on a 5foot tripod. Because two stations were monitored during the same time period,logistics required that we use the windspeed/direction information generated by theAPI contractor (coinciding API evaluation of community exposures). A similardevice was used; however, the contractor elected to place their anemometer on theroof of the service station. All climatic data were averaged over the duration of thesampling period.

Page 7 - Health Hazard Evaluation Report No. 88-304
D. Sampling and Analysis
1. MTBE, Benzene, Toluene, and Xylene in Air
A sampling and analytical method (NIOSH Method 1615) was formally developedby NIOSH to measure airborne MTBE. The solid sorbent tubes consisted of twocharcoal tubes in series; the front tube containing 400 milligrams (mg) of coconutshell charcoal, and the back tube containing 200 mg. Specified flow rates were 0.1to 0.2 liters per minute; however, higher flow rates were used for a portion of theevaluation due to less than expected levels of exposure to the gasoline components(resulting from unusual work practice and climatic situations - to be discussed later). Analysis of the backup tubes for "breakthrough" at the increased flow rates wasnegative. Samples were collected for one-half the work shift, or two per 8-hr shift. The sampling media were attached to the lapel of the worker for acquisition of"breathing zone" samples. The samples were connected to battery-operated pumpscalibrated at flow rates of 0.1 to 0.5 liters per minute (lpm).
In addition to MTBE, NIOSH method 1615 was suitable for benzene, toluene, andxylene.
Desorption Process: 30 minutes in 2 ml of carbon disulfide.
Gas Chromatograph: Hewlett-Packard Model 5890 equipped with a flameionization detector.
Column: 50 meter by 0.3 millimeter fused silica capillary coatedinternally with 0.5 micro meter of HP-1.
Oven Conditions: -15o C for seven minutes, up to 25o C at a rate of 5o
C per minute. Following, up to 250o C for 5 minutesat a rate of 25o C per minute.
Page 8 - Health Hazard Evaluation Report No. 88-304
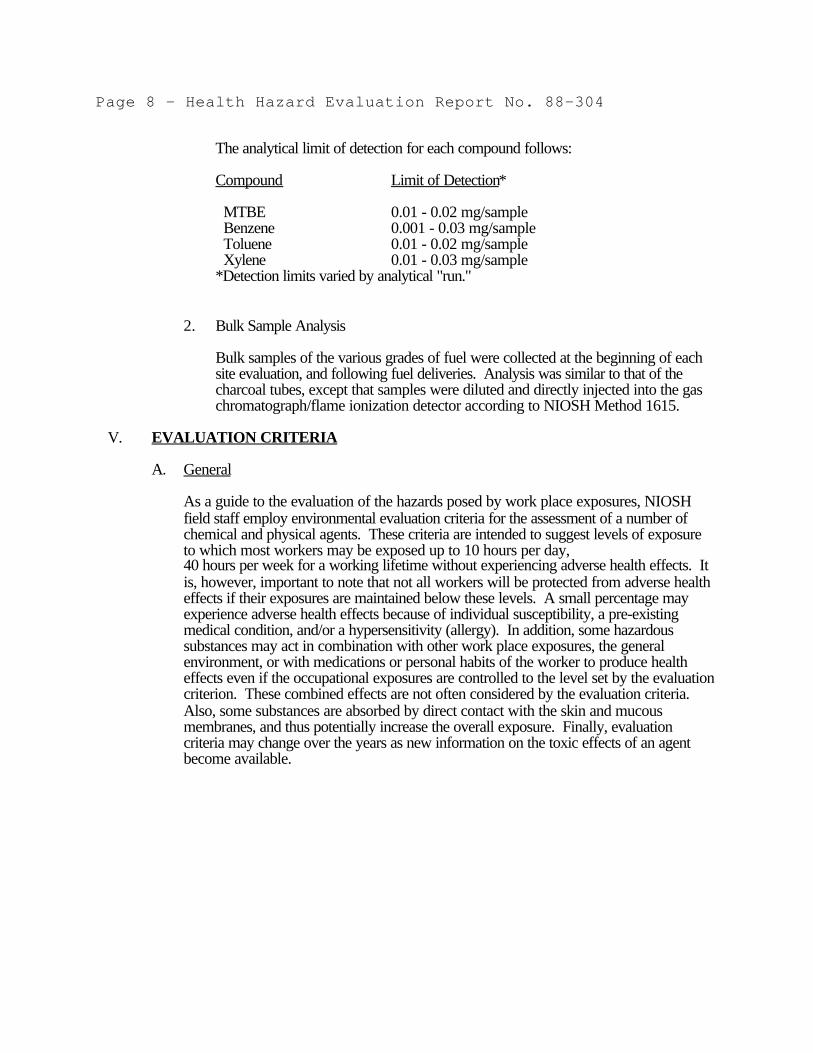
The analytical limit of detection for each compound follows:
Compound Limit of Detection*
MTBE 0.01 - 0.02 mg/sample Benzene 0.001 - 0.03 mg/sample Toluene 0.01 - 0.02 mg/sample Xylene 0.01 - 0.03 mg/sample*Detection limits varied by analytical "run."
2. Bulk Sample Analysis
Bulk samples of the various grades of fuel were collected at the beginning of eachsite evaluation, and following fuel deliveries. Analysis was similar to that of thecharcoal tubes, except that samples were diluted and directly injected into the gaschromatograph/flame ionization detector according to NIOSH Method 1615.
V. EVALUATION CRITERIA
A. General
As a guide to the evaluation of the hazards posed by work place exposures, NIOSHfield staff employ environmental evaluation criteria for the assessment of a number ofchemical and physical agents. These criteria are intended to suggest levels of exposureto which most workers may be exposed up to 10 hours per day, 40 hours per week for a working lifetime without experiencing adverse health effects. Itis, however, important to note that not all workers will be protected from adverse healtheffects if their exposures are maintained below these levels. A small percentage mayexperience adverse health effects because of individual susceptibility, a pre-existingmedical condition, and/or a hypersensitivity (allergy). In addition, some hazardoussubstances may act in combination with other work place exposures, the generalenvironment, or with medications or personal habits of the worker to produce healtheffects even if the occupational exposures are controlled to the level set by the evaluationcriterion. These combined effects are not often considered by the evaluation criteria. Also, some substances are absorbed by direct contact with the skin and mucousmembranes, and thus potentially increase the overall exposure. Finally, evaluationcriteria may change over the years as new information on the toxic effects of an agentbecome available.

Page 9 - Health Hazard Evaluation Report No. 88-304
The primary sources of environmental evaluation criteria for the work place are: 1)NIOSH Criteria Documents and Recommended Exposure Limits (RELs), 2) theAmerican Conference of Governmental Industrial Hygienists' (ACGIH) Threshold LimitValues (TLVs), and 3) the U.S. Department of Labor (OSHA) Permissible ExposureLimits (PELs). The OSHA PELs may be required to take into account the feasibility ofcontrolling exposures in various industries where the agents are used; theNIOSH-recommended exposure limits, by contrast, are based primarily on concernsrelating to the prevention of occupational disease. When considering the exposure levelsand the recommendations for reducing the levels found in this report, it should be notedthat industry is legally required to meet those levels specified by an OSHA PEL.
A time-weighted average (TWA) exposure refers to the average airborne concentrationof a substance during a normal 8- to 10-hour workday. Some substances haverecommended short-term exposure limits or ceiling values which are intended tosupplement the TWA where there are recognized toxic effects from high, short-termexposures.
B. Substance Specific Evaluation Criteria
1. Gasoline
Gasoline is a clear, volatile liquid with a characteristic odor. Although it cantheoretically contain as many as 1500 different hydrocarbons, gasoline is typically made up of 150-250 branched-chain paraffins, cycloparaffins, and aromatics. The relative concentrations of theseconstituents in the final blended gasoline vary with production techniques,seasonable variability, and the addition of proprietary additives.2,3 From a healthperspective, benzene is the most significant component of gasoline. Benzenecontent generally ranges from less than 1% to 2% (liquid volume percent), althoughit may contain as much as 4.8%.4,5 A previous NIOSH evaluation involving 28service stations measured benzene contents of 0.5 to 2.3%.
Acute toxicity is similar for all gasolines. They act generally as an anesthetic andare mucous membrane irritants. Acute symptoms of intoxication include headache,blurred vision, dizziness, and nausea. The threshold for immediate mild intoxicationis 900-1000 ppm.6 Although human population studies on the chronic effects ofexposure to gasoline are rare, a NIOSH study of cancer mortality patterns(standardized mortality odds ratio) by occupation for white males in the state ofMassachusetts using death records for the years 1971-1973 suggests an increasedmortality from bladder cancer among gas station owners and managers (SMOR =586).7 In a study of all deaths recorded from 1975 to 1985 among NewHampshire white

Page 10 - Health Hazard Evaluation Report No. 88-304
male residents (proportionate mortality ratio: measure of proportion of deathsattributable to a disease), workers in the service station industry were found to havea significant leukemia mortality excess (PMR = 328; dubrn = 3) and mental andpsychoneurotic and personality disorders (PMR = 394; n = 3).8 NIOSH considers gasoline to be a potential occupational carcinogen, andrecommends that exposures be limited to the lowest feasible level. The OSHAPEL specifies an 8-hr TWA of 300 ppm, and an STEL of 500 ppm.
2. Methyl tert-Butyl Ether (MTBE, CH3OC(CH3)3)
MTBE is a colorless, volatile liquid derived from the catalytic reaction of methanoland isobutene. It has a terpene-like odor, with an odor threshold of 0.6 ppm.
Several studies on the acute toxicity of MTBE revealed the following:9
Toxicity Assay Data Toxicity Ranking
Oral LD50 3.0-3.8 g/kg bd. wt. lowDermal LD50 >10 g/kg bd. wt. very lowInhalation LC50 23,630 - 33,000 ppm very lowSkin Irritation Moderate Reddening Not a primary
irritantEye Irritation Transient Effects No irreversible
effectsSkin Sensitization Response Not a skin
sensitizer
Data on chronic health effects from exposure to MTBE are limited. However,several animal studies are underway to identify any carcinogenic, mutagenic, orteratogenic properties.
Recent irritative symptoms attributed to MTBE among occupational and publicgroups in Alaska are currently being investigated by the Centers for DiseaseControl and Prevention (Centers for Environmental Health) and the EnvironmentalProtection Agency.
3. Benzene
Benzene is a colorless, volatile, highly flammable liquid. The lowest reported odorthreshold is 4.5 mg/m3. Acute exposure results in central nervous systemdepression, headache, dizziness, nausea, convulsion, coma, and death. The mostsignificant toxic effect of benzene exposure is an insidious and often irreversibleinjury to the bone marrow. Accumulated

Page 11 - Health Hazard Evaluation Report No. 88-304
case reports and epidemiologic studies suggest a leukemogenic action of benzene inhumans; the leukemia tending to be acute and myeloblastic in type, often followingaplastic changes in the bone marrow. Benzene may also induce chronic types ofleukemia.10 A series of NIOSH studies analyzed the mortality of workers exposedto benzene at two rubber hydrochloride manufacturing locations, whichdemonstrated an excess risk of leukemia. One of these studies demonstrated aStandardized Mortality Ratio (SMR) of 337 for leukemia and 409 for multiplemyeloma (an SMR of 100 is the normal value of an excess is not observed; anSMR of 200 represents a 100% excess risk above normal).11 The NIOSH RELfor benzene is reflected in its testimony on the OSHA Benzene final rule whichstates; "The data on benzene leave no doubt regarding the human carcinogenicpotential of this chemical. NIOSH recommends that occupational exposure tobenzene be controlled so that no worker is exposed to more than 0.1 ppm as an 8-hour time-weighted average (TWA) and that short-term exposure be controlled soas not to exceed 1 ppm as determined in any 15-minute sampling period." TheOSHA PEL is a TWA of 1 ppm, with an STEL of 5 ppm as averaged over any15-minute period. However, the PEL does not apply to "...storage, transportation,distribution, dispensing, sale or use of gasoline, motor fuels, or other fuels containingbenzene subsequent to its final discharge from bulk wholesale storage facilities,except that operations where gasoline or motor fuels are dispensed for more than 4hours per day in an indoor location...".12
4. Toluene
Toluene is a clear, colorless, noncorrosive liquid with a sweet, pungent, benzene-like odor (odor threshold between 8 and 150 mg/m3). Toluene may cause irritationof the eyes, respiratory tract, and skin. Repeated or prolonged contact with theliquid may cause removal of natural lipids from the skin, resulting in dry, fissureddermatitis. The liquid splashed in the eyes may cause irritation and reversibledamage. Acute exposure predominantly results in central nervous systemdepression. Symptoms and signs include headache, dizziness fatigue, muscularweakness, drowsiness, incoordination with staggering gait, skin paresthesia,collapse and coma.13 Toluene exposure does not result in the hematopoietic effectscaused by benzene. The myelotoxic effects previously attributed to toluene arejudged by more recent investigations to be the result of concurrent exposure tobenzene present as a contaminant in toluene solutions.10 The NIOSH REL is 100ppm TWA with provision for an STEL of 150 ppm. The OSHA PEL is the sameas the REL.
Page 12 - Health Hazard Evaluation Report No. 88-304
5. Xylene
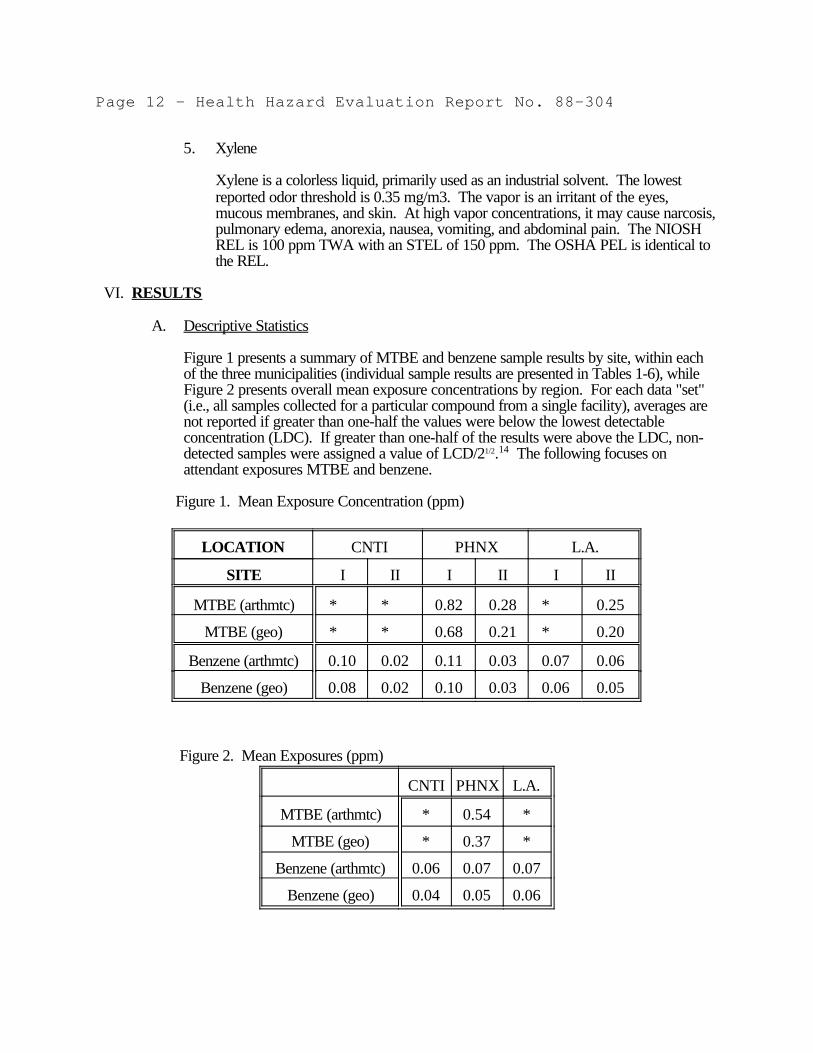
Xylene is a colorless liquid, primarily used as an industrial solvent. The lowestreported odor threshold is 0.35 mg/m3. The vapor is an irritant of the eyes,mucous membranes, and skin. At high vapor concentrations, it may cause narcosis,pulmonary edema, anorexia, nausea, vomiting, and abdominal pain. The NIOSHREL is 100 ppm TWA with an STEL of 150 ppm. The OSHA PEL is identical tothe REL.
VI. RESULTS
A. Descriptive Statistics
Figure 1 presents a summary of MTBE and benzene sample results by site, within eachof the three municipalities (individual sample results are presented in Tables 1-6), whileFigure 2 presents overall mean exposure concentrations by region. For each data "set"(i.e., all samples collected for a particular compound from a single facility), averages arenot reported if greater than one-half the values were below the lowest detectableconcentration (LDC). If greater than one-half of the results were above the LDC, non-detected samples were assigned a value of LCD/21/2.14 The following focuses onattendant exposures MTBE and benzene.
Figure 1. Mean Exposure Concentration (ppm)
LOCATION CNTI PHNX L.A.
SITE I II I II I II
MTBE (arthmtc) * * 0.82 0.28 * 0.25
MTBE (geo) * * 0.68 0.21 * 0.20
Benzene (arthmtc) 0.10 0.02 0.11 0.03 0.07 0.06
Benzene (geo) 0.08 0.02 0.10 0.03 0.06 0.05
Figure 2. Mean Exposures (ppm)
CNTI PHNX L.A.
MTBE (arthmtc) * 0.54 *
MTBE (geo) * 0.37 *
Benzene (arthmtc) 0.06 0.07 0.07
Benzene (geo) 0.04 0.05 0.06
Page 13 - Health Hazard Evaluation Report No. 88-304
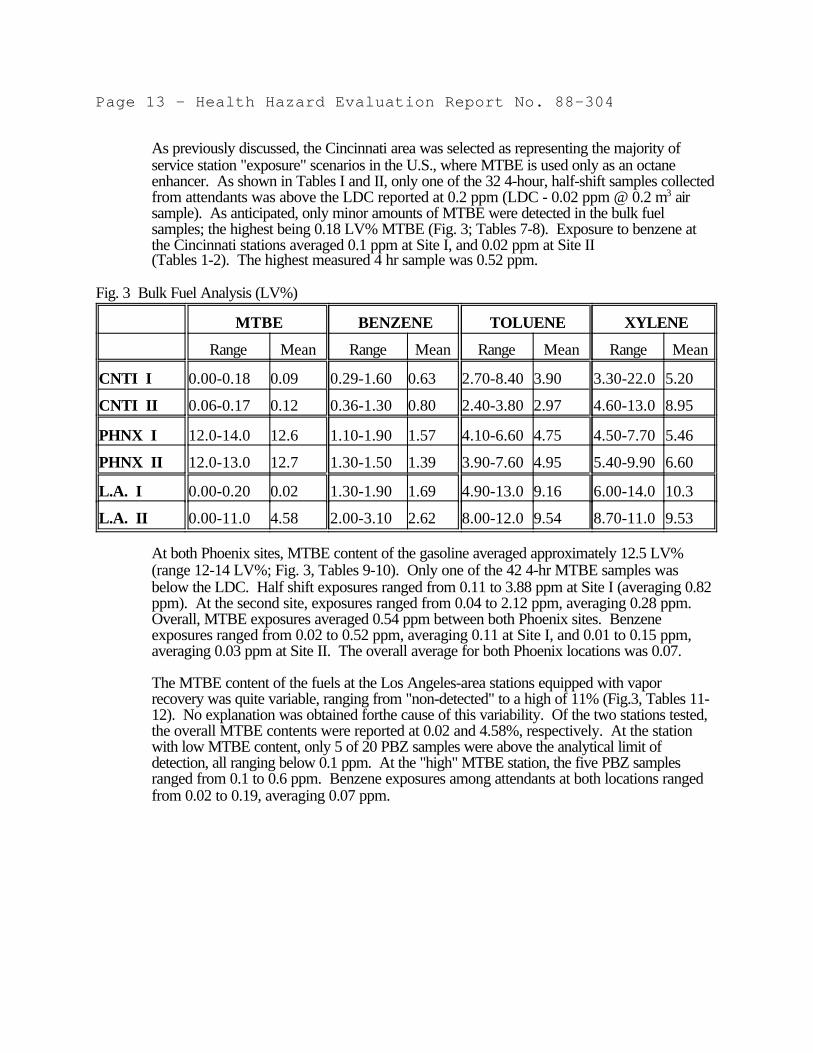
As previously discussed, the Cincinnati area was selected as representing the majority ofservice station "exposure" scenarios in the U.S., where MTBE is used only as an octaneenhancer. As shown in Tables I and II, only one of the 32 4-hour, half-shift samples collectedfrom attendants was above the LDC reported at 0.2 ppm (LDC - 0.02 ppm @ 0.2 m3 airsample). As anticipated, only minor amounts of MTBE were detected in the bulk fuelsamples; the highest being 0.18 LV% MTBE (Fig. 3; Tables 7-8). Exposure to benzene atthe Cincinnati stations averaged 0.1 ppm at Site I, and 0.02 ppm at Site II (Tables 1-2). The highest measured 4 hr sample was 0.52 ppm.
Fig. 3 Bulk Fuel Analysis (LV%)
MTBE BENZENE TOLUENE XYLENE
Range Mean Range Mean Range Mean Range Mean
CNTI I 0.00-0.18 0.09 0.29-1.60 0.63 2.70-8.40 3.90 3.30-22.0 5.20
CNTI II 0.06-0.17 0.12 0.36-1.30 0.80 2.40-3.80 2.97 4.60-13.0 8.95
PHNX I 12.0-14.0 12.6 1.10-1.90 1.57 4.10-6.60 4.75 4.50-7.70 5.46
PHNX II 12.0-13.0 12.7 1.30-1.50 1.39 3.90-7.60 4.95 5.40-9.90 6.60
L.A. I 0.00-0.20 0.02 1.30-1.90 1.69 4.90-13.0 9.16 6.00-14.0 10.3
L.A. II 0.00-11.0 4.58 2.00-3.10 2.62 8.00-12.0 9.54 8.70-11.0 9.53
At both Phoenix sites, MTBE content of the gasoline averaged approximately 12.5 LV%(range 12-14 LV%; Fig. 3, Tables 9-10). Only one of the 42 4-hr MTBE samples wasbelow the LDC. Half shift exposures ranged from 0.11 to 3.88 ppm at Site I (averaging 0.82ppm). At the second site, exposures ranged from 0.04 to 2.12 ppm, averaging 0.28 ppm. Overall, MTBE exposures averaged 0.54 ppm between both Phoenix sites. Benzeneexposures ranged from 0.02 to 0.52 ppm, averaging 0.11 at Site I, and 0.01 to 0.15 ppm,averaging 0.03 ppm at Site II. The overall average for both Phoenix locations was 0.07.
The MTBE content of the fuels at the Los Angeles-area stations equipped with vaporrecovery was quite variable, ranging from "non-detected" to a high of 11% (Fig.3, Tables 11-12). No explanation was obtained forthe cause of this variability. Of the two stations tested,the overall MTBE contents were reported at 0.02 and 4.58%, respectively. At the stationwith low MTBE content, only 5 of 20 PBZ samples were above the analytical limit ofdetection, all ranging below 0.1 ppm. At the "high" MTBE station, the five PBZ samplesranged from 0.1 to 0.6 ppm. Benzene exposures among attendants at both locations rangedfrom 0.02 to 0.19, averaging 0.07 ppm.
Page 14 - Health Hazard Evaluation Report No. 88-304
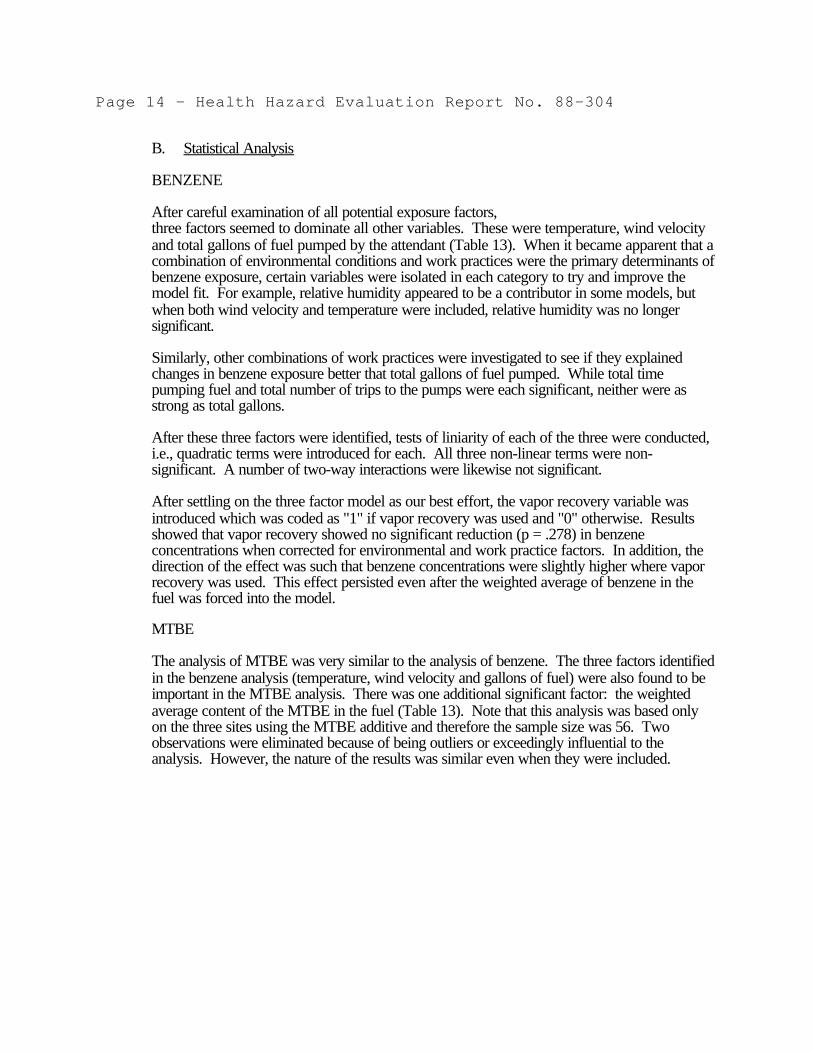
B. Statistical Analysis
BENZENE
After careful examination of all potential exposure factors, three factors seemed to dominate all other variables. These were temperature, wind velocityand total gallons of fuel pumped by the attendant (Table 13). When it became apparent that acombination of environmental conditions and work practices were the primary determinants ofbenzene exposure, certain variables were isolated in each category to try and improve themodel fit. For example, relative humidity appeared to be a contributor in some models, butwhen both wind velocity and temperature were included, relative humidity was no longersignificant.
Similarly, other combinations of work practices were investigated to see if they explainedchanges in benzene exposure better that total gallons of fuel pumped. While total timepumping fuel and total number of trips to the pumps were each significant, neither were asstrong as total gallons.
After these three factors were identified, tests of liniarity of each of the three were conducted,i.e., quadratic terms were introduced for each. All three non-linear terms were non-significant. A number of two-way interactions were likewise not significant.
After settling on the three factor model as our best effort, the vapor recovery variable wasintroduced which was coded as "1" if vapor recovery was used and "0" otherwise. Resultsshowed that vapor recovery showed no significant reduction (p = .278) in benzeneconcentrations when corrected for environmental and work practice factors. In addition, thedirection of the effect was such that benzene concentrations were slightly higher where vaporrecovery was used. This effect persisted even after the weighted average of benzene in thefuel was forced into the model.
MTBE
The analysis of MTBE was very similar to the analysis of benzene. The three factors identifiedin the benzene analysis (temperature, wind velocity and gallons of fuel) were also found to beimportant in the MTBE analysis. There was one additional significant factor: the weightedaverage content of the MTBE in the fuel (Table 13). Note that this analysis was based onlyon the three sites using the MTBE additive and therefore the sample size was 56. Twoobservations were eliminated because of being outliers or exceedingly influential to theanalysis. However, the nature of the results was similar even when they were included.

Page 15 - Health Hazard Evaluation Report No. 88-304
As with the benzene analysis, no quadratic or two-way interactions were detected. Vaporrecovery with MTBE was based on one Los Angeles station, but again there was nosignificant effect and the direction of the effect was counter-intuitive.
When sampling location was added to the model for MTBE, no significant difference wasfound. Therefore, for MTBE, correction for the environmental and work practice factorsremoved any significant differences in mean exposures across the three stations.
TOLUENE
Results of the analysis of toluene were slightly different than those for benzene or MTBE. Thebest fitting model involved three factors: wind velocity, total area of spills, and total gallons offuel pumped by the attendant (Table 13). No interactions or non-linear term were detectedfor toluene.
Again, there was no significant effect of vapor recovery (p = .112). There was, however, asignificant difference among stations even after correction for the other exposure factors (p =.001).
XYLENE
The analysis of the xylene data showed somewhat different exposure factors than the previousthree components. The only two significant factors were percent vicinity time and windvelocity (Table 13). No other exposure factors, non-linear terms or two-way interactionswere found.
Again, there was no significant effect of vapor recovery systems (p = .975). There were alsono significant differences among stations after correcting for the effect of wind velocity andpercent vicinity time (p = .320)
VII. CONCLUSIONS/RECOMMENDATIONS
The goals of this investigation were 1) determine the extent of exposure to MTBE, given itsnew use patterns in today's fuel markets, and identify those parameters most responsible forvariations in exposure, 2) determine whether the use of MTBE as a fuel additive affectsexposure levels to benzene, and 3) ascertain the effectiveness of vapor recovery in limitingexposures to gasoline component vapors.
Occupational exposure to MTBE among service station attendants at stations required to useat least 12% MTBE were less than 1 ppm (overall arithmetic average of 0.54; overallgeometric average of 0.37 ppm). Exposures were generally less than 0.1 ppm (below the analytical limit ofdetection) at stations using MTBE at less than 1% of the fuel. Of all variables monitored, three were observed to dominate variations inexposures to MTBE and benzene; temperature, wind

Page 16 - Health Hazard Evaluation Report No. 88-304
speed, and amount of fuel pumped by the attendant. Of interest here is that these variableswould not only effect exposures from the station's standpoint, but also from remaining fuel inthe automobile being serviced (with amount of fuel pumped being directly related to proximityto the auto). This finding certainly does not rule out the importance of the auto being servicedon variations in exposure.
There was no significant relationship between benzene exposures and MTBE content, evenwhen controlling for other dependant variables. If a positive (or negative) relationship doesexist, it does not appear to be substantial.
Surprisingly, and of major interest, was the finding that vapor recovery had no significant effecton reducing exposure to MTBE or benzene, when corrected for environmental and workpractice factors. Furthermore, the direction of the effect was such that higher levels weremeasured at stations equipped with vapor recovery. This is especially surprising given theresults of the similar 1977 NIOSH investigation, where an approximate twelve-fold reductionin exposures was measured at two stations equipped with vapor recovery. This finding maybe a combination of a number of factors, i.e., the VR not working to specification,benzene/MTBE exposures from the automobile being serviced, etc. Another possibilityinvolves the surface porosity of the asphalt/cement near the pumps. Although the number andsize of spills was recorded, the actual amount of fuel spilled would not be accurately recordedif there were large differences in surface characteristics (i.e., an ounce of fuel spilled on asmooth surface would cover a larger area than an ounce spilled on a rough, porous surface). The possibility of spills having a major impact on exposures is reinforced by investigatorreports of large, uncontrolled spills occuring during the sampling periods. These spillsreportedly occurred at the self-service islands, typically involving motorists apparentlyunfamiliar with the vapor recovery appartus.
Further evaluation of service stations equipped with vapor recovery may be best suited to thereal time, direct infrared imaging system recently developed by NIOSH.15 With this method,both the source and path of emissions can be identified, thus enabling identification of anymalfunction or alternate exposure source.
Page 17 - Health Hazard Evaluation Report No. 88-304
VIII. REFERENCES
1. ENVIRON Corporation [1990] Summary report on individual and population exposures togasoline. ENVIRON Corporation, Arlington, VA, November 28, 1990.
2. Ainsworth SJ [1991] Booming MTBE demand draws increasing number of producers. C&EN69(23):13-16 (June 10, 1991).
3. Sax NI, Lewis RJ [1987]. Condensed chemical dictionary. 11th ed. New York, NY: VanNostrand Reinhold Company Inc, pp. 554.
4. Phillips CF, Jones RK [1978] Gasoline vapor exposure during bulk handling operations.Am IndHyg J 39:119
5. McDermott HJ, Vos GA [1979] Service station attendants' exposure to benzene and gasolinevapors. Am Ind Hyg J 40(4):315-321.
6. ACGIH [1990]. Threshold limit values and biological exposure indices for 1990-1991. Cincinnati,OH: American Conference of Governmental Industrial Hygienists.
7. NIOSH [1984]. Occupational characteristics of cancer victims in Massachusetts 1971-1973.Cincinnati, OH: U.S. Department of Health and Human Services, Public Health Service, Centersfor Disease Control, National Institute for Occupational Safety and Health, DHHS (NIOSH)Publication No. 84-109.
8. Schwartz E [1987]. Proportionate mortality ratio analysis of automobile mechanics and gasolineservice station workers in New Hampshire. Am J of Ind Med 12:91-99.
9. Kneiss JJ [1991]. An overview of the MTBE toxicology testing program. Unpublished paperpresented at the National Conference on Octane Markets and reformulated gasoline, San Antonio,TX, March 19-20, 1991.
10. Proctor NH, Hughes JP, Fischman ML [1988]. Chemical hazards of the workplace. 2nd ed.Philadelphia, PA: JB Lippincott Company,pp. 90-95.
11. Rinsky RA, Smith AB [1987] Benzene and leukemia: an epidemiologic risk assessment. N Eng JMed 316:1044-1050.
12. Code of Federal regulations [1987]. Occupational Exposure to benzene; final rule. Washington,DC: U.S. Government Printing Office, Office of the Federal Register. [29 CFR 1910 (Sept. 11,1987)].
13. NIOSH [1977]. Occupational diseases - a guide to their recognition. Cincinnati, OH: U.S.Department of Health and Human Services, Public Health Service, Centers for Disease Control,National Institute for Occupational Safety and Health, DHHS (NIOSH) Publication No. 77-181.
14. Hornung RW, Reed LD [1990] Estimation of average concentration in the presence ofnondetectable values. Appl Occup Env Hyg 5(1):46-51
15. NIOSH [1992]. Analyzing Workplace Exposures Using Direct Reading Instruments and VideoExposure Monitoring Techniques. Cincinnati, OH: U.S. Department of Health and HumanServices, Public Health Service, Centers for Disease Control, National Institute for OccupationalSafety and Health, DHHS (NIOSH) Publication No. 92-104.
Page 18 - Health Hazard Evaluation Report No. 88-304
IX. AUTHORSHIP AND ACKNOWLEDGEMENTS
Report Prepared by: Richard W. HartleRegional Operations Coordinator
Field Assistance John KellyNancy BurtonCalvin Cook
Statistical Analysis Richard HornungAssociate Director
Analytical Support John PalassisChemist
Originating Office: Hazard Evaluations and TechnicalAssistance Branch,Division of Surveillance, HazardEvaluations, and Field Studies
X. DISTRIBUTION AND AVAILABILITY OF REPORT
Copies of this report may be freely reproduced and are not copyrighted. Single copies of thisreport will be available for a period of 90 days from the date of this report from the NIOSHPublications Office, 4676 Columbia Parkway, Cincinnati, Ohio 45226. To expedite yourrequest, include a self-addressed mailing label along with your written request. After this time,copies may be purchased from the National Technical Information Service (NTIS), 5825 PortRoyal Road, Springfield, Virginia 22161. Information regarding the NTIS stock number may beobtained from the NIOSH Publications Office at the Cincinnati address.
Copies of this report have been sent to:
1. American Petroleum Institute, Washington, D.C.2. NIOSH3. OSHA Region II
For the purpose of informing affected employees, copies of this report shall be posted by theemployer in a prominent place accessible to the employees for a period of 30 calendar days.

TABLE 1
Assessment of Exposures to Gasoline ConstituentsSITE I
CINCINNATI, OHIOHETA 88-304
October 16-19, 1990
______________________________________________________________________________ ------Time------- ------------Concentration (ppm)----------- # Date On Off ' (min) MTBE Benzene Toluene Xylene ______________________________________________________________________________
s01 1016 0753 - 1120 227 nd* 0.11 0.17 0.10 s02 1016 1125 - 1500 215 nd 0.06 0.10 0.03 TWA** 0753 - 1500 442 -- 0.08 0.13 0.06
s03 1016 1520 - 1854 205 nd 0.05 0.07 nd s04 1016 1925 - 2230 185 0.16 0.06 (0.05)*** nd TWA 1520 - 2230 390 -- 0.06 0.06 --
s05 1017 0710 - 1055 225 nd 0.08 0.12 nd s06 1017 1100 - 1458 238 nd 0.13 0.23 0.10 TWA 0710 - 1458 463 -- 0.11 0.18 --
s07 1017 1515 - 1855 220 nd 0.02 (0.05) nd s08 1017 1930 - 2236 186 nd 0.03 (0.05) nd TWA 1515 - 2236 406 -- 0.02 0.05 --
s09 1018 0733 - 1113 220 nd 0.05 0.06 nd s10 1018 1118 - 1440 202 nd 0.05 (0.05) nd TWA 0733 - 1440 422 -- 0.05 0.05 --
s11 1018 1513 - 1904 231 nd 0.08 0.06 nd s12 1018 1942 - 2250 188 nd 0.09 0.15 nd TWA 1513 -2250 419 -- 0.09 0.10 --
s13 1019 0820 - 1148 208 nd 0.10 0.13 nd s14 1019 1155 - 1458 183 nd 0.22 0.29 0.13 TWA 0820 - 1458 391 -- 0.15 0.20 --
s15 1019 1526 - 1926 240 nd 0.29 0.45 0.15 s16 1019 2004 - 2244 160 nd 0.19 0.34 0.15 TWA 1526 - 2244 400 -- 0.25 0.41 0.15 ______________________________________________________________________________
Site Average: Arithmetic **** 0.10 0.16 **** Geometric **** 0.08 0.11 ****
______________________________________________________________________________* nd = non-detected; below the lowest detectable concentration (LDC)** TWA = Time-weighted Average*** If greater than 1/2 the values of a sample set were above the LDC, nd's were assigned values at LDC/21/2. (x.xx) indicates "calculated" value. **** Less than 1/2 thevalues were above the LDC; averages not reported.
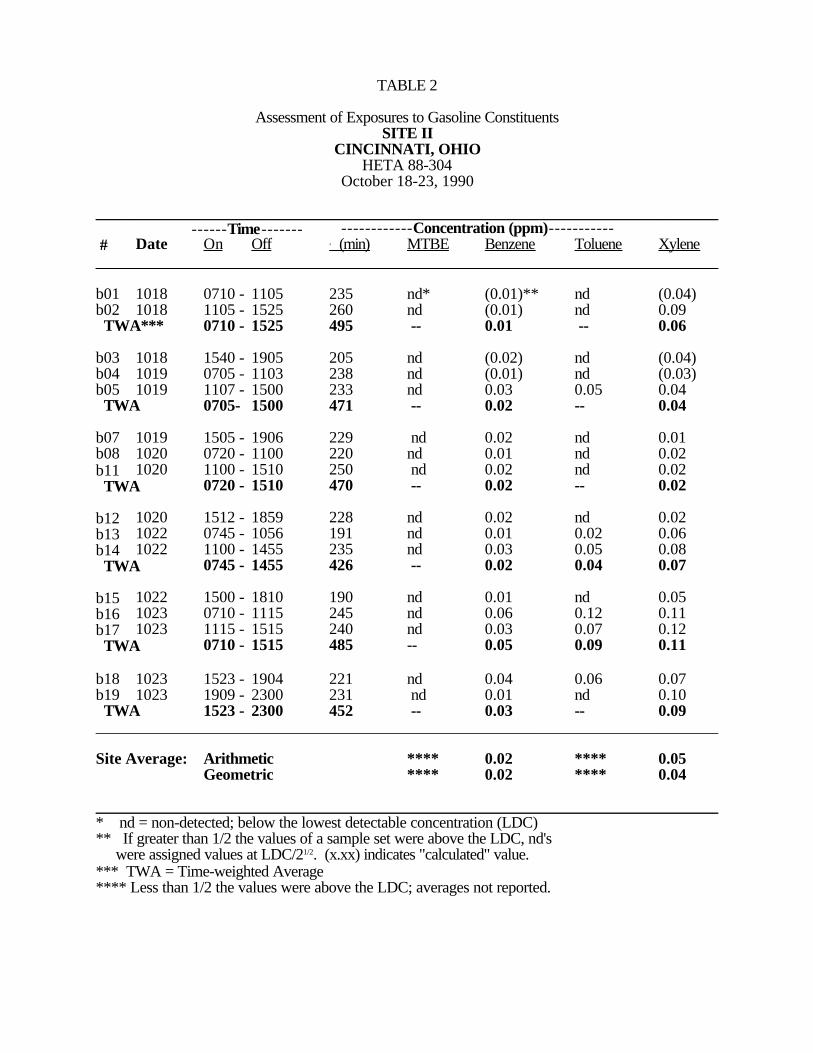
TABLE 2
Assessment of Exposures to Gasoline ConstituentsSITE II
CINCINNATI, OHIOHETA 88-304
October 18-23, 1990
______________________________________________________________________________ ------Time------- ------------Concentration (ppm)----------- # Date On Off ' (min) MTBE Benzene Toluene Xylene ______________________________________________________________________________
b01 1018 0710 - 1105 235 nd* (0.01)** nd (0.04)b02 1018 1105 - 1525 260 nd (0.01) nd 0.09 TWA*** 0710 - 1525 495 -- 0.01 -- 0.06
b03 1018 1540 - 1905 205 nd (0.02) nd (0.04)b04 1019 0705 - 1103 238 nd (0.01) nd (0.03)b05 1019 1107 - 1500 233 nd 0.03 0.05 0.04 TWA 0705- 1500 471 -- 0.02 -- 0.04
b07 1019 1505 - 1906 229 nd 0.02 nd 0.01b08 1020 0720 - 1100 220 nd 0.01 nd 0.02b11 1020 1100 - 1510 250 nd 0.02 nd 0.02 TWA 0720 - 1510 470 -- 0.02 -- 0.02
b12 1020 1512 - 1859 228 nd 0.02 nd 0.02b13 1022 0745 - 1056 191 nd 0.01 0.02 0.06b14 1022 1100 - 1455 235 nd 0.03 0.05 0.08 TWA 0745 - 1455 426 -- 0.02 0.04 0.07
b15 1022 1500 - 1810 190 nd 0.01 nd 0.05b16 1023 0710 - 1115 245 nd 0.06 0.12 0.11 b17 1023 1115 - 1515 240 nd 0.03 0.07 0.12 TWA 0710 - 1515 485 -- 0.05 0.09 0.11
b18 1023 1523 - 1904 221 nd 0.04 0.06 0.07b19 1023 1909 - 2300 231 nd 0.01 nd 0.10 TWA 1523 - 2300 452 -- 0.03 -- 0.09 ______________________________________________________________________________
Site Average: Arithmetic **** 0.02 **** 0.05 Geometric **** 0.02 **** 0.04
______________________________________________________________________________* nd = non-detected; below the lowest detectable concentration (LDC)** If greater than 1/2 the values of a sample set were above the LDC, nd's were assigned values at LDC/21/2. (x.xx) indicates "calculated" value. *** TWA = Time-weighted Average**** Less than 1/2 the values were above the LDC; averages not reported.

TABLE 3Assessment of Exposures to Gasoline Constituents
SITE IPHOENIX, ARIZONA
HETA 88-304October 29-November 2, 1990
______________________________________________________________________________ ------Time------- ------------Concentration (ppm)----------- # Date On Off ' (min) MTBE Benzene Toluene Xylene ______________________________________________________________________________
e01 1029 0625 - 0930 185 0.38 0.06 0.40 nd* e02 1029 1015 - 1400 225 0.65 0.07 0.41 nd TWA** 0625 - 1400 410 0.53 0.07 0.41 --
e06 1029 1608 - 2015 247 0.48 0.08 0.22 nd e05 1029 2015 - 2200 105 1.08 0.13 0.15 0.10 TWA 1608 - 2200 352 0.66 0.10 0.20 --
e07 1030 0625 - 1005 220 0.22 0.02 0.11 nd e08 1030 1045 - 1410 205 1.17 0.12 0.13 0.08 TWA 0625 - 1410 425 0.68 0.07 0.12 --
e09 1030 1505 - 1800 175 3.88 0.52 0.97 0.46e10 1030 1800 - 2200 240 0.35 0.04 0.13 nd TWA 1505 - 2200 415 1.84 0.24 0.48 --
e11 1031 0630 - 1005 215 0.68 0.06 0.19 nd e12 1031 1040 - 1350 190 0.93 0.15 0.97 nd TWA 0630 - 1350 405 0.80 0.10 0.56 --
e13 1031 1430 - 1830 240 1.65 0.41 0.33 0.07e14 1031 1830 - 2200 210 1.04 0.08 0.18 nd TWA 1430 - 2200 450 1.37 0.26 0.26 --
e15 1101 0643 - 1008 205 0.41 0.04 0.07 nd e16 1101 1023 - 1400 217 0.34 0.04 0.16 nd TWA 0643 - 1400 422 0.37 0.04 0.12 --
e17 1101 1415 - 1800 225 0.11 0.20 0.05 0.05e18 1101 1805 - 2200 235 0.17 0.03 0.14 nd TWA 1415 - 2200 460 0.14 0.11 0.10 --
e19 1102 0640 - 1008 208 0.38 0.04 0.15 nd e20 1102 1024 - 1400 216 1.42 0.11 0.14 nd TWA 0640 - 1400 424 0.91 0.08 0.15 --
e21 1102 1415 - 1800 225 (0.04)*** (0.01) 0.04 nd e22 1102 1810 - 2100 170 2.07 0.15 0.24 0.07 TWA 1415 - 2100 395 0.91 0.07 0.13 --______________________________________________________________________________Site Average: Arithmetic 0.83 0.11 0.25 ****
Geometric 0.68 0.10 0.21 ****
______________________________________________________________________________* nd = non-detected; below the lowest detectable concentration (LDC)** TWA = Time-weighted Average*** If greater than 1/2 the values of a sample set were above the LDC, nd's were assigned values at LDC/21/2. (x.xx) indicates "calculated" value. **** Less than 1/2 the values were above the LDC; averages not reported.

TABLE 4Assessment of Exposures to Gasoline Constituents
SITE IIPHOENIX, ARIZONA
HETA 88-304October 29 - November 2, 1990
______________________________________________________________________________ ------Time------- ------------Concentration (ppm)----------- # Date On Off ' (min) MTBE Benzene Toluene Xylene ______________________________________________________________________________t01 1029 0621-1026 245 0.11 0.10 0.05 0.38t02 1029 1052-1354 209 0.13 0.01 0.03 0.09 TWA* 0621-1354 454 0.12 0.06 0.04 0.25
t03 1029 1416-1805 229 0.12 0.01 0.09 0.08t06 1029 1805-2257 292 0.17 0.02 0.05 0.02 TWA 1416-2257 521 0.15 0.02 0.07 0.05
t04 1029 1414-1800 228 0.54 4.15*** 0.12 0.08t05 1029 1800-2257 297 0.12 0.02 0.05 0.02 TWA 1414-2257 525 0.30 0.02 0.08 0.05
t07 1030 0614-1015 241 0.74 0.07 0.07 0.06t08 1030 1016-1400 224 0.55 0.05 0.07 0.04 TWA 0614-1400 465 0.65 0.06 0.07 0.05
t09 1030 1415-1755 220 2.12 0.15 0.15 0.13t10 1030 1755-2250 295 0.06 0.01 0.07 0.02 TWA 1415-2250 515 0.94 0.07 0.12 0.07
t11 1031 0614-1023 249 0.13 0.02 0.04 0.02t12 1031 1023-1356 213 0.57 0.05 0.08 0.09 TWA 0614-1356 462 0.33 0.03 0.06 0.05
t13 1031 1405-1745 220 0.38 0.04 0.08 0.03t15 1031 1745-2250 305 0.11 0.02 0.04 0.02 TWA 1405-2250 525 0.22 0.03 0.06 0.02
t16 1101 0611-1020 249 0.11 0.02 0.04 0.02t17 1101 1021-1356 215 0.08 0.02 0.03 (0.02)** TWA 0611-1356 464 0.10 0.02 0.04 0.02
t18 1101 1410-1803 233 0.19 0.03 0.05 0.02t19 1101 1805-2145 220 0.05 0.02 0.10 0.02 TWA 1410-2145 453 0.12 0.03 0.07 0.02
t20 1102 0603-1015 252 0.04 0.01 0.02 0.02t21 1102 1015-1356 221 0.45 0.05 0.07 0.08 TWA 0603-1356 473 0.23 0.03 0.04 0.05
t22 1102 1406-1804 238 0.23 0.03 0.07 0.08t23 1102 1804-2158 234 0.05 0.01 0.02 (0.02) TWA 1406-2158 472 0.14 0.02 0.05 0.05 ______________________________________________________________________________Site Average: Arithmetic 0.30 0.03 0.06 0.06
Geometric 0.23 0.03 0.06 0.04______________________________________________________________________________* TWA = Time-weighted Average** If greater than 1/2 the values of a sample set were above the lowest detectable concentration
(LDC), non-detectable values were assigned LDC/21/2. (x.xx) indicates "calculated" value.
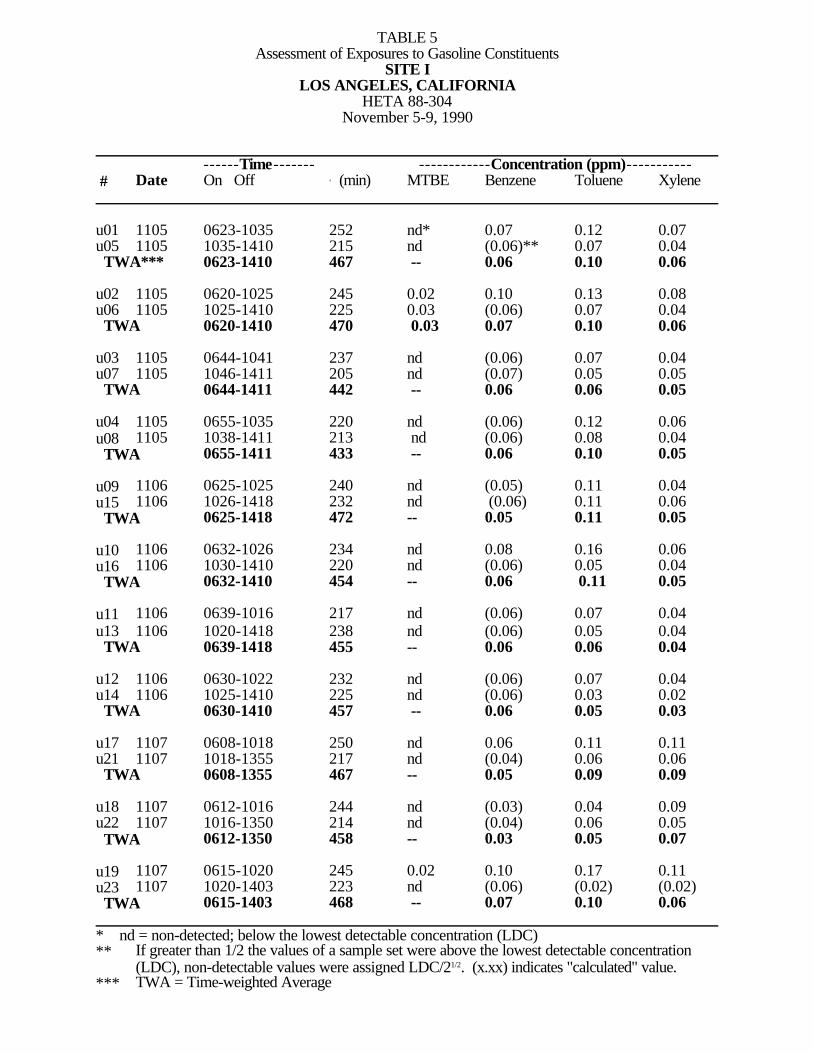
TABLE 5Assessment of Exposures to Gasoline Constituents
SITE ILOS ANGELES, CALIFORNIA
HETA 88-304November 5-9, 1990
______________________________________________________________________________ ------Time------- ------------Concentration (ppm)----------- # Date On Off ' (min) MTBE Benzene Toluene Xylene ______________________________________________________________________________
u01 1105 0623-1035 252 nd* 0.07 0.12 0.07 u05 1105 1035-1410 215 nd (0.06)** 0.07 0.04 TWA*** 0623-1410 467 -- 0.06 0.10 0.06
u02 1105 0620-1025 245 0.02 0.10 0.13 0.08 u06 1105 1025-1410 225 0.03 (0.06) 0.07 0.04 TWA 0620-1410 470 0.03 0.07 0.10 0.06
u03 1105 0644-1041 237 nd (0.06) 0.07 0.04u07 1105 1046-1411 205 nd (0.07) 0.05 0.05 TWA 0644-1411 442 -- 0.06 0.06 0.05
u04 1105 0655-1035 220 nd (0.06) 0.12 0.06 u08 1105 1038-1411 213 nd (0.06) 0.08 0.04 TWA 0655-1411 433 -- 0.06 0.10 0.05
u09 1106 0625-1025 240 nd (0.05) 0.11 0.04 u15 1106 1026-1418 232 nd (0.06) 0.11 0.06 TWA 0625-1418 472 -- 0.05 0.11 0.05
u10 1106 0632-1026 234 nd 0.08 0.16 0.06 u16 1106 1030-1410 220 nd (0.06) 0.05 0.04 TWA 0632-1410 454 -- 0.06 0.11 0.05
u11 1106 0639-1016 217 nd (0.06) 0.07 0.04 u13 1106 1020-1418 238 nd (0.06) 0.05 0.04 TWA 0639-1418 455 -- 0.06 0.06 0.04
u12 1106 0630-1022 232 nd (0.06) 0.07 0.04 u14 1106 1025-1410 225 nd (0.06) 0.03 0.02 TWA 0630-1410 457 -- 0.06 0.05 0.03
u17 1107 0608-1018 250 nd 0.06 0.11 0.11 u21 1107 1018-1355 217 nd (0.04) 0.06 0.06 TWA 0608-1355 467 -- 0.05 0.09 0.09
u18 1107 0612-1016 244 nd (0.03) 0.04 0.09 u22 1107 1016-1350 214 nd (0.04) 0.06 0.05 TWA 0612-1350 458 -- 0.03 0.05 0.07
u19 1107 0615-1020 245 0.02 0.10 0.17 0.11 u23 1107 1020-1403 223 nd (0.06) (0.02) (0.02) TWA 0615-1403 468 -- 0.07 0.10 0.06 ______________________________________________________________________________* nd = non-detected; below the lowest detectable concentration (LDC)** If greater than 1/2 the values of a sample set were above the lowest detectable concentration
(LDC), non-detectable values were assigned LDC/21/2. (x.xx) indicates "calculated" value. *** TWA = Time-weighted Average

TABLE 5 (cond.)Assessment of Exposures to Gasoline Constituents
SITE ILOS ANGELES, CALIFORNIA
______________________________________________________________________________ ------Time------- ------------Concentration (ppm)----------- # Date On Off ' (min) MTBE Benzene Toluene Xylene ______________________________________________________________________________
u20 1107 0710-1015 185 nd* 0.10 0.17 0.11 u24 1107 1015-1406 231 nd (0.06)** 0.12 0.08 TWA*** 0710-1406 416 -- 0.07 0.14 0.09
u25 1107 1405-1800 235 nd 0.06 0.07 0.10
u26 1107 1410-1800 230 nd 0.10 0.14 0.08
u27 1108 0618-1031 253 nd 0.09 0.13 0.06 u33 1108 1032-1433 241 nd 0.08 0.11 0.04 TWA 0618-1433 494 -- 0.09 0.12 0.05
u28 1108 0615-1015 240 0.03 0.06 0.08 0.05 u31 1108 1016-1414 238 nd 0.05 0.08 0.05 TWA 0615-1414 478 -- 0.06 0.08 0.05
u29 1108 0632-1015 223 nd 0.12 0.16 0.06 u32 1108 1015-1417 242 nd 0.04 0.07 0.04 TWA 0632-1417 465 -- 0.08 0.11 0.05
u35 1109 0617-1016 239 nd 0.14 0.22 0.14 u41 1109 1016-1420 244 0.11 0.09 0.13 0.09 TWA 0617-1420 483 -- 0.12 0.18 0.12
u36 1109 0614-1015 241 nd 0.04 0.07 0.07 u40 1109 1015-1415 240 nd 0.04 0.07 0.17 TWA 0614-1415 481 -- 0.04 0.07 0.12
u37 1109 0622-1005 223 0.06 0.19 0.24 0.14 u39 1109 1005-1415 250 nd 0.05 0.09 0.08 TWA 0622-1415 473 -- 0.12 0.16 0.12 ______________________________________________________________________________Site Average: Arithmetic **** 0.07 0.10 0.07
Geometric **** 0.06 0.09 0.06
______________________________________________________________________________* nd = non-detected; below the lowest detectable concentration (LDC)** If greater than 1/2 the values of a sample set were above the LDC, nd's were assigned values at LDC/21/2. (x.xx) indicates "calculated" value. *** TWA = Time-weighted Average**** Less than 1/2 the values were above the LDC; averages not reported.

TABLE 6
Assessment of Exposures to Gasoline ConstituentsSITE II
LOS ANGELES, CALIFORNIAHETA 88-304
November 5-9, 1990
______________________________________________________________________________ ------Time------- ------------Concentration (ppm)----------- # Date On Off ' (min) MTBE Benzene Toluene Xylene ______________________________________________________________________________
c01 1105 0706-1101 235 0.73 0.19 0.20 0.08 c02 1105 1101-1456 235 0.45 0.09 0.11 nd* TWA** 0706-1456 470 0.59 0.14 0.16 --
c03 1106 0904-1230 206 0.32 0.06 nd nd c04 1106 1230-1559 209 (0.04)*** 0.01 nd nd TWA 0904-1559 415 0.17 0.04 -- --
c05 1107 0814-1216 242 0.09 0.02 nd nd c06 1107 1216-1558 222 0.08 0.02 nd nd TWA 0814-1558 464 0.09 0.02 -- --
c07 1108 0818-1214 236 0.14 0.03 nd nd c08 1108 1214-1557 223 0.17 0.05 nd 0.48 TWA 0818-1214 459 0.16 0.04 -- --
c09 1109 0808-0930 082 0.21 0.07 0.11 0.06 c10 1109 1209-1555 226 0.22 0.06 0.09 nd TWA 0808-1555 308 0.22 0.06 0.10 -- ______________________________________________________________________________Site Average: Arithmetic 0.25 0.06 **** ****
Geometric 0.20 0.05 **** ****
______________________________________________________________________________* nd = non-detected; below the lowest detectable concentration (LDC)** TWA = Time-weighted Average*** If greater than 1/2 the values of a sample set were above the LDC, nd's were assigned values at LDC/21/2. (x.xx) indicates "calculated" value.ref. **** Less than 1/2 the values were above the LDC; averages not reported.
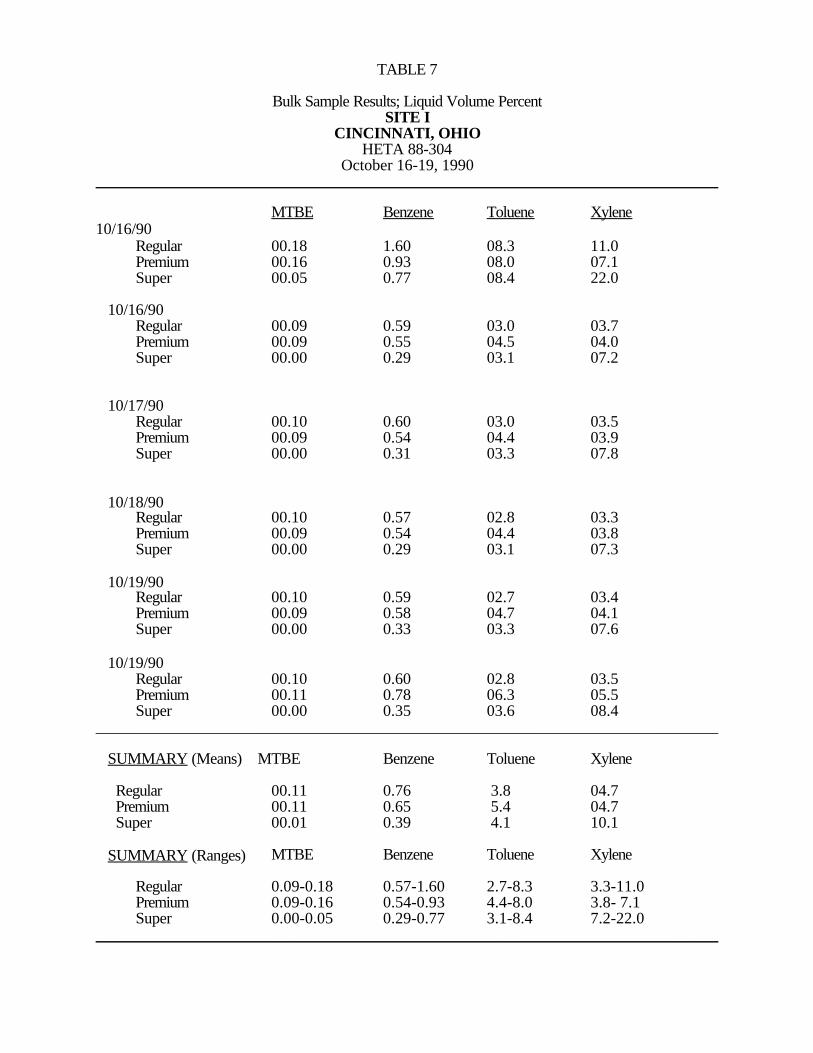
TABLE 7
Bulk Sample Results; Liquid Volume PercentSITE I
CINCINNATI, OHIOHETA 88-304
October 16-19, 1990______________________________________________________________________________
MTBE Benzene Toluene Xylene 10/16/90
Regular 00.18 1.60 08.3 11.0Premium 00.16 0.93 08.0 07.1
Super 00.05 0.77 08.4 22.0
10/16/90Regular 00.09 0.59 03.0 03.7Premium 00.09 0.55 04.5 04.0Super 00.00 0.29 03.1 07.2
10/17/90
Regular 00.10 0.60 03.0 03.5Premium 00.09 0.54 04.4 03.9Super 00.00 0.31 03.3 07.8
10/18/90
Regular 00.10 0.57 02.8 03.3 Premium 00.09 0.54 04.4 03.8
Super 00.00 0.29 03.1 07.3
10/19/90Regular 00.10 0.59 02.7 03.4Premium 00.09 0.58 04.7 04.1Super 00.00 0.33 03.3 07.6
10/19/90 Regular 00.10 0.60 02.8 03.5Premium 00.11 0.78 06.3 05.5Super 00.00 0.35 03.6 08.4
______________________________________________________________________________
SUMMARY (Means) MTBE Benzene Toluene Xylene
Regular 00.11 0.76 3.8 04.7 Premium 00.11 0.65 5.4 04.7 Super 00.01 0.39 4.1 10.1
SUMMARY (Ranges) MTBE Benzene Toluene Xylene
Regular 0.09-0.18 0.57-1.60 2.7-8.3 3.3-11.0Premium 0.09-0.16 0.54-0.93 4.4-8.0 3.8- 7.1Super 0.00-0.05 0.29-0.77 3.1-8.4 7.2-22.0
______________________________________________________________________________

TABLE 8
Bulk Sample Results; Liquid Volume PercentSITE II
CINCINNATI, OHIOHETA 88-304
October 16-19, 1990
______________________________________________________________________________ MTBE Benzene Toluene Xylene
10/18/90 Regular 00.17 1.10 03.3 05.3Premium 00.11 0.64 02.6 09.7Super 00.06 0.36 02.4 12.0
10/19/90 Regular 00.11 0.62 02.5 09.5Premium 00.17 1.20 03.3 04.6Super 00.06 0.40 02.7 13.0
10/22/90Regular 00.17 1.30 03.8 05.3Premium 00.12 0.81 03.2 13.0Super 00.06 0.43 02.5 12.0
______________________________________________________________________________
SUMMARY (Means) MTBE Benzene Toluene Xylene
Regular 0.15 1.10 3.2 6.7 Premium 0.13 0.88 3.0 9.1 Super 0.06 0.40 2.5 12.3
SUMMARY (Ranges) MTBE Benzene Toluene Xylene
Regular 0.11-0.17 0.62-1.30 2.5-3.8 5.3- 9.5Premium 0.11-0.17 0.64-1.20 2.6-3.3 4.6-13.0Super 0.06-0.06 0.36-0.43 2.4-2.7 12.0-13.0
______________________________________________________________________________
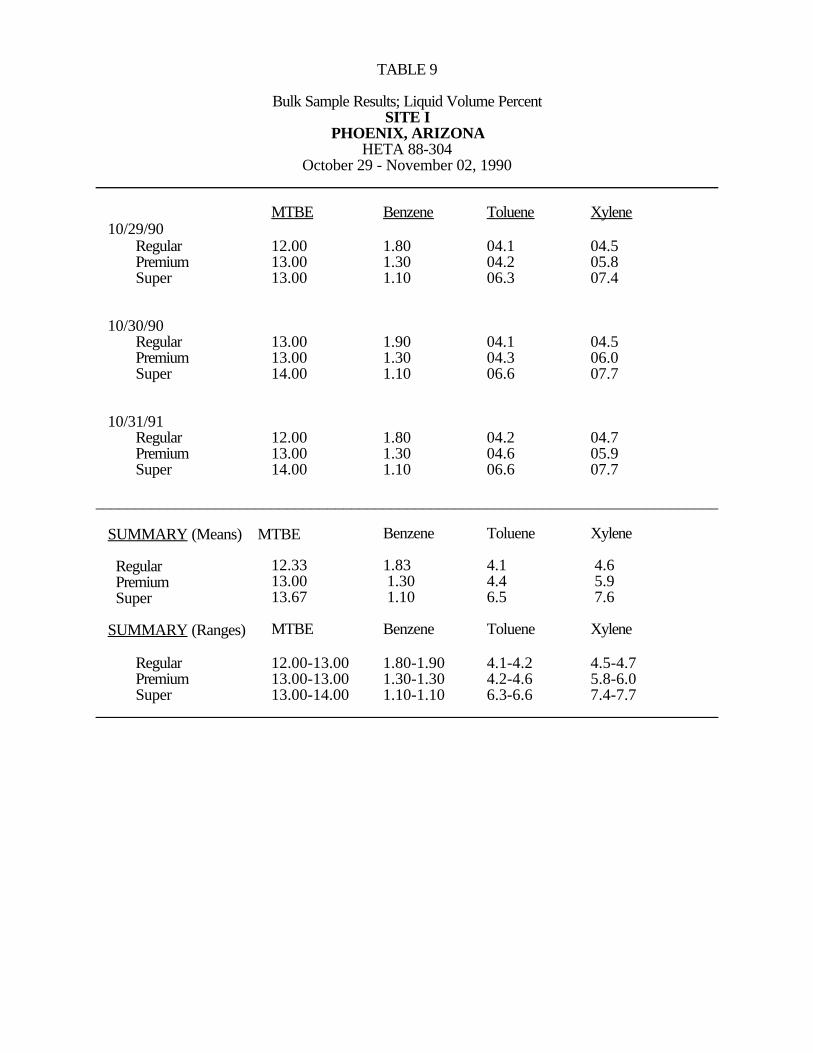
TABLE 9
Bulk Sample Results; Liquid Volume PercentSITE I
PHOENIX, ARIZONAHETA 88-304
October 29 - November 02, 1990______________________________________________________________________________
MTBE Benzene Toluene Xylene 10/29/90
Regular 12.00 1.80 04.1 04.5Premium 13.00 1.30 04.2 05.8Super 13.00 1.10 06.3 07.4
10/30/90Regular 13.00 1.90 04.1 04.5Premium 13.00 1.30 04.3 06.0Super 14.00 1.10 06.6 07.7
10/31/91Regular 12.00 1.80 04.2 04.7Premium 13.00 1.30 04.6 05.9Super 14.00 1.10 06.6 07.7
______________________________________________________________________________
SUMMARY (Means) MTBE Benzene Toluene Xylene
Regular 12.33 1.83 4.1 4.6 Premium 13.00 1.30 4.4 5.9 Super 13.67 1.10 6.5 7.6
SUMMARY (Ranges) MTBE Benzene Toluene Xylene
Regular 12.00-13.00 1.80-1.90 4.1-4.2 4.5-4.7Premium 13.00-13.00 1.30-1.30 4.2-4.6 5.8-6.0Super 13.00-14.00 1.10-1.10 6.3-6.6 7.4-7.7
______________________________________________________________________________

TABLE 10
Bulk Sample Results; Liquid Volume PercentSITE II
PHOENIX, ARIZONAHETA 88-304
October 29 - November 02, 1990
______________________________________________________________________________ MTBE Benzene Toluene Xylene 10/29/90
Regular 12.00 1.50 04.2 05.6Premium 13.00 1.30 04.5 06.0Super 13.00 1.30 07.6 09.9
10/31/90Regular 13.00 1.40 03.9 05.4Premium 13.00 1.30 04.4 05.9Super 13.00 1.30 07.5 09.7
______________________________________________________________________________
SUMMARY (Means) MTBE Benzene Toluene Xylene
Regular 12.50 1.45 4.1 5.5 Premium 13.00 1.30 4.5 6.0 Super 13.00 1.30 7.6 9.8
SUMMARY (Ranges) MTBE Benzene Toluene Xylene
Regular 12.00-13.00 1.40-1.50 3.9-4.2 5.4-5.6Premium 13.00-13.00 1.30-1.30 4.4-4.5 5.9-6.0Super 13.00-13.00 1.30-1.30 7.5-7.6 9.7-9.9
______________________________________________________________________________

TABLE 11Bulk Sample Results; Liquid Volume Percent
SITE ILOS ANGELES, CALIFORNIA
HETA 88-304November 5-9, 1990
______________________________________________________________________________
MTBE Benzene Toluene Xylene 11/05/90
Regular 00.00 1.30 06.2 07.4Premium 00.00 1.50 08.3 09.1Super 00.00 1.90 12.0 12.0
11/05/90Regular 00.00 1.60 06.5 08.4Premium 00.00 1.60 08.6 09.8Super 00.00 1.70 11.0 12.0
11/06/90Regular 00.00 1.70 06.6 08.4Premium 00.00 1.70 08.6 10.0Super 00.00 1.70 11.0 12.0
11/07/90Regular 00.00 1.70 06.5 08.3Premium 00.00 1.80 10.0 11.0Super 00.00 1.70 11.0 12.0
11/08/90Regular 00.00 1.80 06.7 08.4Premium 00.00 1.70 08.3 09.4Super 00.00 1.70 11.0 12.0
11/09/90Regular 00.20 1.40 04.9 06.0Premium 00.20 1.60 08.0 08.7Super 00.00 1.80 13.0 14.0
______________________________________________________________________________
SUMMARY (Means) MTBE Benzene Toluene Xylene
Regular 00.03 1.58 6.23 7.82 Premium 00.03 1.65 8.63 9.67 Super 00.00 1.75 11.50 12.33
SUMMARY (Ranges) MTBE Benzene Toluene Xylene
Regular 00.00-00.20 1.30-1.80 4.9-6.7 6.0- 8.4Premium 00.00-00.20 1.50-1.80 8.0-10.0 8.7-11.0Super 00.00-00.00 1.70-1.90 11.0-13.0 12.0-14.0
______________________________________________________________________________
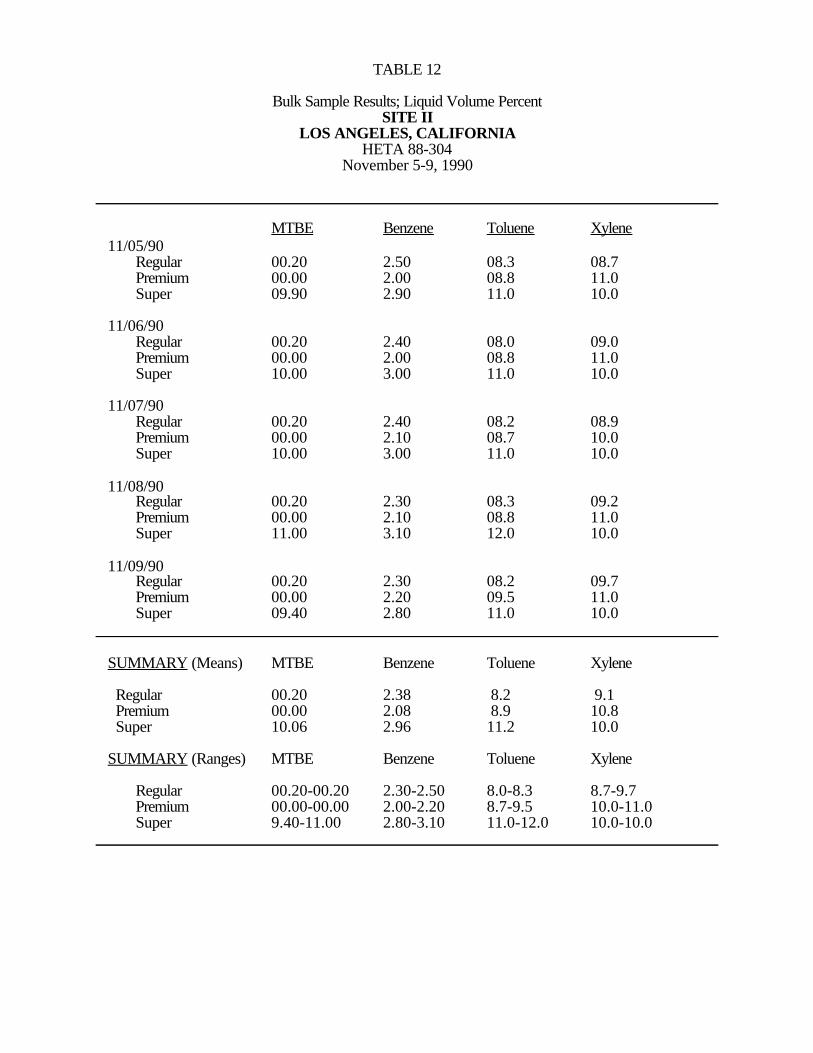
TABLE 12
Bulk Sample Results; Liquid Volume PercentSITE II
LOS ANGELES, CALIFORNIAHETA 88-304
November 5-9, 1990
______________________________________________________________________________
MTBE Benzene Toluene Xylene 11/05/90 Regular 00.20 2.50 08.3 08.7
Premium 00.00 2.00 08.8 11.0Super 09.90 2.90 11.0 10.0
11/06/90Regular 00.20 2.40 08.0 09.0Premium 00.00 2.00 08.8 11.0Super 10.00 3.00 11.0 10.0
11/07/90Regular 00.20 2.40 08.2 08.9Premium 00.00 2.10 08.7 10.0Super 10.00 3.00 11.0 10.0
11/08/90Regular 00.20 2.30 08.3 09.2Premium 00.00 2.10 08.8 11.0Super 11.00 3.10 12.0 10.0
11/09/90Regular 00.20 2.30 08.2 09.7Premium 00.00 2.20 09.5 11.0Super 09.40 2.80 11.0 10.0
______________________________________________________________________________
SUMMARY (Means) MTBE Benzene Toluene Xylene
Regular 00.20 2.38 8.2 9.1 Premium 00.00 2.08 8.9 10.8 Super 10.06 2.96 11.2 10.0
SUMMARY (Ranges) MTBE Benzene Toluene Xylene
Regular 00.20-00.20 2.30-2.50 8.0-8.3 8.7-9.7Premium 00.00-00.00 2.00-2.20 8.7-9.5 10.0-11.0Super 9.40-11.00 2.80-3.10 11.0-12.0 10.0-10.0
______________________________________________________________________________

Table 13Final ModelsHETA 88-304
November 1991
Benzene (log benzene)
Exposure Factor Regression Coefficient Std Error p-value
Intercept -4.68 .464 <.001
Temperature 0.020 .006 0.001
Wind Speed -0.104 .023 <.001
Gallons of fuel* 0.006 .001 <.001
R2 = 0.36
MTBE (log MTBE)
Exposure Factor Regression Coefficient Std Error p-value
Intercept -8.15 1.03 <.001
Temperature 0.057 0.014 <.001
Wind Speed -0.089 0.041 0.036
Gallons 0.013 0.002 <.001
AWAM** 0.164 0.027 <.001
R2 = 0.62
Toluene (log Toluene)
Exposure Factor Regression Coefficient Std Error p-value
Intercept -2.52 0.132 <.001
Wind Speed -0.084 0.025 <.001
Gallons 0.003 0.001 <.001
Cumulative Spill Area 0.001 .0005 0.003
R2 = 0.24
Xylene (log Xylene)
Exposure Factor Regression Coefficient Std Error p-value
Intercept -2.99 0.152 <.001
Wind Speed -0.059 0.026 0.028
% Vicinity Time 0.026 0.008 0.001
R2 = 0.17* Pumped by attendant** Weighted average of MTBE content; fuel pumped by attendant