hessequa 2014-2015 annual report - amazon web servicesmfmamirror.s3.amazonaws.com/documents/06....
TRANSCRIPT

HESSEQUA
2014-2015
ANNUAL REPORT

CONTENTS
HESSEQUA MUNICIPALITY 2014/15 ANNUAL REPORT
Contents ABOUT THE 2014/15 ANNUAL REPORT ................................................................................................... i
MESSAGE FROM THE EXECUTIVE MAYOR .............................................................................................. ii
MUNICIPAL MANAGER’S OVERVIEW ...................................................................................................... v
CHAPTER 1 - ABOUT HESSEQUA REGION ................................................................................................ 2
1.1 An overview of Hessequa’s demographics .......................................................................... 3
1.2 Overview of Hessequa’s Social and Economic Information ................................................... 4
1.3 Service Delivery Overview ................................................................................................. 6
1.3.1 Basic Service Delivery Performance Highlights ............................................................... 6
1.3.2 Basic Service Delivery Challenges ................................................................................... 7
1.3.3 Proportion of Households with access to Basic Services ................................................ 8
1.4 Financial Health Overview ................................................................................................. 9
1.4.1 Financial Viability Highlights ........................................................................................... 9
1.4.2 Financial Viability Challenges .......................................................................................... 9
1.4.3 National Key Performance Indicators – Municipal Financial Viability and Management (Ratios) 9
1.4.4 Financial Overview ........................................................................................................ 10
1.4.5 Operating Ratios ........................................................................................................... 10
1.4.6 Total Capital Expenditure .............................................................................................. 10
CHAPTER 2 ............................................................................................................................................ 12
COMPONENT A: POLITICAL AND ADMINISTRATIVE GOVERANCE ........................................................ 12
2.1 National Key Performance Indicators - Good Governance and Public Participation .............. 12
2.2 Performance Highlights – Good Governance and Public Participation .................................. 12
2.3 Challenges – Good Governance and Public Participation .................................................... 13
2.4 Governance Structure ..................................................................................................... 13
2.4.1 Political Governance Structure ..................................................................................... 13
2.4.2 Administrative Governance Structure .......................................................................... 20
COMPONENT B: INTERGOVERNMENTAL RELATIONS ........................................................................... 21
2.5 Intergovernmental Relations ........................................................................................... 21
2.5.1 National Intergovernmental Structures ........................................................................ 21
2.5.2 Provincial Intergovernmental Structures ...................................................................... 21
2.5.3 District Intergovernmental Structures .......................................................................... 21
COMPONENT C: PUBLIC ACCOUNTABILITY AND PARTICIPATION ........................................................ 21
2.6 Public Meetings .............................................................................................................. 22
2.6.2 Ward Committees ......................................................................................................... 22
2.6.3 Functionality of Ward Committees ............................................................................... 26
2.6.4 Labour Forum ................................................................................................................ 27
2.6.4 Mayoral Outreaches ..................................................................................................... 28

CONTENTS
HESSEQUA MUNICIPALITY 2014/15 ANNUAL REPORT
COMPONENT D: CORPORATE GOVERNANCE ....................................................................................... 29
2.7 Risk Management ........................................................................................................... 29
2.8 Anti-Fraud and Anti-Corruption ........................................................................................ 30
2.9 Audit Committee ............................................................................................................. 31
2.10 Internal Auditing ............................................................................................................. 32
2.11 By-laws .......................................................................................................................... 35
2.12 Communication............................................................................................................... 37
2.13 Website.......................................................................................................................... 38
2.14 Supply Chain Management ............................................................................................. 39
2.14.1 Competitive Bids in Excess of R200 000 ....................................................................... 39
2.14.2 Deviations from normal procurement processes ......................................................... 43
CHAPTER 3 ............................................................................................................................................ 45
3.1 Overview of Performance within Hessequa Municipality ..................................................... 45
3.1.1 LEGISLATIVE REQUIREMENTS ....................................................................................... 45
3.1.2 PERFORMANCE MANAGEMENT WITHIN HESSEQUA MUNICIPALITY ........................... 45
3.2 Actual Strategic and Municipal Performance for 2014/15 ................................................... 46
3.2.1 OVERVIEW OF ACTUAL PERFORMANCE FOR 2014/15 ................................................. 46
3.2.2 DETAIL PERFORMANCE PER STRATEGIC OBJECTIVE FOR 2014/15 ............................... 48
3.2.3 OVERVIEW OF PERFORMANCE PER DIRECTORATE ....................................................... 57
3.2.4 SERVICE PROVIDERS STRATEGIC PERFORMANCE ......................................................... 57
3.2.4 MUNICIPAL FUNCTIONS ....................................................................................................... 58
3.3 Component A: Basic Services................................................................................................... 60
3.3.1 WATER PROVISION ....................................................................................................... 60
3.3.2 Waste Water (Sanitation) Provision ............................................................................. 63
3.3.3 Electricity....................................................................................................................... 65
3.3.4 Waste Management (Refuse Collections, Waste Disposal, Street Cleaning and Recycling) ...................................................................................................................................... 68
3.3.5 HOUSING ....................................................................................................................... 69
3.3.6 FREE BASIC SERVICES AND INDIGENT SUPPORT ........................................................... 71
3.4 Component B: Road Transport ....................................................................................................... 74
3.4.1 Roads ............................................................................................................................. 74
3.4.2 Waste Water (Stormwater Drainage) ........................................................................... 77
3.5 Component C: Planning and Local Economic Development ........................................................... 79
3.5.1 PLANNING ..................................................................................................................... 79
3.5.2 LOCAL ECONOMIC DEVELOPMENT ............................................................................... 81
3.6 Component D: Community and Social Services....................................................................... 88
3.6.1 LIBRARIES ...................................................................................................................... 88
3.6.2 CEMETERIES .................................................................................................................. 90
3.6.3 CHILD CARE, AGED CARE AND SOCIAL PROGRAMMES ................................................. 91

CONTENTS
HESSEQUA MUNICIPALITY 2014/15 ANNUAL REPORT
3.7 COMPONENT E: ENVIRONMENTAL PROTECTION ................................................................... 97
3.7.1 INTRODUCTION TO ENVIRONMENT PROTECTION ....................................................... 97
3.8 COMPONENT F: SECURITY AND SAFETY ................................................................................ 100
3.8.1 INTRODUCTION TO SECURITY AND SAFETY ................................................................ 100
3.8.2 TRAFFIC SERVICES AND LAW ENFORCEMENT ............................................................. 100
3.8.3 DISASTER MANAGEMENT ........................................................................................... 103
3.9 Component G: Sport and Recreation .................................................................................... 103
3.9.1 SPORT AND RECREATION ............................................................................................ 104
3.10 Component H: Service Delivery Priorities for 2014/15 ......................................................... 107
3.10.1 AN ACCOUNTABLE LOCAL AUTHORITY ...................................................................... 107
3.10.2 ECONOMIC GROWTH ................................................................................................. 108
3.10.3 EFFECTIVE COMMUNICATION ................................................................................... 109
3.10.4 HERITAGE OF PRESERVATION .................................................................................... 109
3.10.5 MAINTENANCE AND DEVELOPMENT OF INFRASTRUCTURE ..................................... 109
3.10.6 SAFE COMMUNITIES .................................................................................................. 110
3.10.7 SOCIAL WELLBEING .................................................................................................... 110
CHAPTER 4 .......................................................................................................................................... 112
4.1 National Key Performance Indicators – Municipal Transformation and Organisational Development .................................................................................................................112
4.2 Introduction to the Municipal Workforce ..........................................................................112
4.2.1 EMPLOYMENT EQUITY ................................................................................................ 112
D) Occupational Levels - Race .................................................................................................... 114
4.2.2 VACANCY RATE............................................................................................................ 115
4.2.3 TURNOVER RATE ......................................................................................................... 116
4.3 MANAGING THE MUNICIPAL WORKFORCE ......................................................................116
4.3.1 INJURIES ...................................................................................................................... 116
4.3.2 SICK LEAVE .................................................................................................................. 117
4.3.3 HR POLICIES AND PLANS ............................................................................................. 117
4.3.4 EMPLOYEE PERFORMANCE REWARDS........................................................................ 118
4.4 CAPACITATING THE MUNICIPAL WORKFORCE ................................................................118
4.4.1 SKILL DEVELOPMENT – TRAINING PROVIDED ............................................................. 118
4.4.2 SKILL DEVELOPMENT – BUDGET ALLOCATION ........................................................... 119
4.4.3 MFMA COMPETENCIES ............................................................................................... 119
4.5 MANAGING THE MUNICIPAL WORKFORCE EXPENDITURE ......................................... 120
4.5.1 PERSONNEL EXPENDITURE ......................................................................................... 120
CHAPTER 5 .......................................................................................................................................... 124
A Statement of Comparison ...............................................................................................124
Component A: Statements Of Financial Performance ........................................................................ 127

CONTENTS
HESSEQUA MUNICIPALITY 2014/15 ANNUAL REPORT
5.1 Financial Summary ........................................................................................................127
5.1.1 Revenue collection by Vote ........................................................................................ 131
5.1.2 Revenue collection by Source ..................................................................................... 132
5.1.3 Operational Services Performance ............................................................................. 133
5.2 Financial Performance per Municipal Function ..................................................................134
5.2.1 Water Services ............................................................................................................ 134
Waste Water (Sanitation) ........................................................................................................... 134
Electricity135
Waste Management ................................................................................................................... 135
5.2.5 Housing ....................................................................................................................... 136
5.2.6 Roads ........................................................................................................................... 136
5.2.7 Planning ...................................................................................................................... 137
5.2.8 Local Economic Development ..................................................................................... 137
5.2.9 Community & Social Services ...................................................................................... 138
5.2.10 Environmental Protection ........................................................................................... 138
5.2.11 Security and Safety ..................................................................................................... 139
5.2.12 Sport and Recreation .................................................................................................. 139
5.2.13 Corporate Policy Offices & Other ................................................................................ 140
5.3 Grants ...........................................................................................................................141
5.3.1 Grant Performance : ................................................................................................... 141
5.3.2 Conditional Grants (Excluding MIG) ............................................................................ 142
5.3.4 Level of Reliance on Grants & Subsidies ..................................................................... 143
5.4 Asset Management ........................................................................................................144
5.4.1 Treatment of the Three Largest Assets ....................................................................... 144
5.4.2 Repairs and Maintenance ........................................................................................... 145
5.5 Financial Ratios Based on Key Performance Indicators .....................................................146
5.5.1 Liquidity Ratio ............................................................................................................. 146
5.5.2 IDP Regulation Financial Viability Indicators............................................................... 146
5.5.3 Creditors Management ...................................................................................................... 146
5.5.4 Borrowing Management ............................................................................................. 147
5.5.5 Employee costs ........................................................................................................... 147
COMPONENT B: SPENDING AGAINST CAPITAL BUDGET .................................................................... 147
5.6 Analysis of Capital and operating expenditure ..................................................................147
5.7 Sources of Finance.........................................................................................................149
5.8 Capital Spending on the 5 Largest Projects ......................................................................150
5.9 Basic Service and Infrastructure Backlogs – Overview ......................................................151
5.9.1 Municipal Infrastructure Grant (MIG) ......................................................................... 151
Component C: Cash Flow Management And Investments ................................................................. 152

CONTENTS
HESSEQUA MUNICIPALITY 2014/15 ANNUAL REPORT
5.10 Cash Flow table: ...........................................................................................................152
5.11 Gross Outstanding Debtors per Service ...........................................................................154
5.12 Total Debtors Age Analysis .............................................................................................156
5.13 Borrowing and Investments ............................................................................................156
5.13.1 Actual Borrowings ....................................................................................................... 156
Component D: Other Financial Matters .............................................................................................. 156
5.14 Supply Chain Management .............................................................................................156
5.15 GRAP Compliance ..........................................................................................................156
CHAPTER 6 .......................................................................................................................................... 158
Component A: Auditor-General Opinion 2014/15 .............................................................................. 158
6.1 AUDITOR GENERAL REPORT 2014/15 ...................................................................................158
Component B: Auditor General Opinion 2014/15 .............................................................................. 158
6.2 AUDITOR-GENERAL REPORT 2014/15 ...................................................................................158
Annexure A: Hessequa Annual Financial Statements – 30 June 2015 .............................................163
Annexure B: Oversight Report ....................................................................................................258

FOREWORD
i | P a g e
HESSEQUA MUNICIPALITY 2014/15 ANNUAL REPORT
ABOUT THE 2014/15 ANNUAL REPORT
Hessequa Municipality has endeavoured to deliver quality service and information and to engage in
decision-making forums which allows for active participation.
This report offers an overview of the operations, activities and performance of Hessequa Municipality
for the 2014/15 financial year. The Annual Report is prepared in terms of Section 121 (1) of the
Municipal Finance Management Act (MFMA), in terms of which the municipality must prepare an Annual
Report for each financial year.
The Annual Report consists of five chapters, each addressing specific reporting areas as well as the
supporting documentation in the form of Annexures. A broad overview of the report is as follows:
Chapter 1 - An overview of the Municipality’s social and demographic profile and key
highlights regarding Finance, Performance and Service Delivery.
Chapter 2 - Provides details about the governmental workings of the municipality
addressing the key aspects of good governance.
Chapter 3 - Highlights the Municipality’s performance for the year, focussing on the
service delivery and the Pre-determined objectives of the Council.
Chapter 4 - Provides insight into the Human Resources and organisational management
areas of the Municipality, focussing on organisational structure and
legislation.
Chapter 5 - An overview of the Municipality’s financial performance, reflecting on the
Municipality’s financial position, assets, cash flow and intergovernmental
grants received by the Municipality.
Annexure A - Audited Financial Statements
Annexure B - Auditor General’s Report
Annexure C - Oversight Committee Report
The Annual Report 2014/15 serves as a key record revealing the continuation of service delivery,
progress, growth and performance of the Hessequa Municipality.

FOREWORD – MESSAGE FROM THE EXECUTIVE MAYOR
ii | P a g e
HESSEQUA MUNICIPALITY 2014/15 ANNUAL REPORT
MESSAGE FROM THE EXECUTIVE MAYOR
It is with pride that I have this opportunity to present the 2014/15 Annual Report. The highlight of the year was of course the achievement of a Clean Audit Outcome for the 2013/14 budget year. We had been working towards that goal and reached it as planned. With a small staff component and the Chief Financial Officer who completes the Financial Statements by herself, we pride ourselves with this outcome. We do realise that the Clean Audit (Unqualified with no findings) is not the only or even the most important objective in Local Government. Service delivery to all is the first and foremost function that needs to be delivered.
We achieved the second place in the Greenest Municipality Awards and are the first Municipality in South Africa to have all six beaches feature in the Blue Flag programme. The first place in South Africa was
achieved in the Arbour City Awards for 2015, which is another feather in Hessequa Municipality’s cap.
Dit bly ‘n voorreg om na nog ‘n jaar ‘n terugblik te gee en ‘n opname te maak van wat bereik is deur ‘n jaar van alles insit, harde werk en die passie en entoesiasme wat heers soos daar gevorder word met beplanning en aksies om Hessequa ‘n beter plek te maak vir al ons gemeenskappe.
Daar is vele dokumente wat hierdie jaarverslag rig, vele gebeure wat aanvullend saamwerk om sukses te verseker. Hierdie dokumente is op die webwerf beskikbaar om meer inligting te verskaf.
Die gehalte en koste van dienslewering is gedurig onder die vergrootglas van diegene wie belastings moet betaal sowel as van diegene wie nie daarvoor kan betaal nie. Dit is tans munisipaliteite se uitdaging. Die verantwoordelikhede wat na plaaslike regering afgewentel word, sonder die nodige befondsing maak dit ‘n onhoudbare situasie.
Hessequa het ver gevorder om die DA-koalisie beheerde Raad se visie en misie te omskep in beleide en programme om aan die doelwitte wat verandering moet bring in die lewens van almal en veral diegene wat as gevolg van min permanente werksgeleenthede, sukkel om aan hul basiese behoeftes te voorsien. Die werklikhede toon ook hoe pensioenarisse veg teen voortdurende styging van lewenskostes.
Daarom die hernude pogings om innoverend en met nuwe denke te poog om verandering en verligting mee te bring gedurende elke begrotingsproses en oorweging te skenk aan verskuiwing van fokusareas waar nodig.
Die raad het hul verbind tot die Nasionale Ontwikkelings Plan asook die belyning daarvan met die Provinsiale Plan, om sodoende implimentering van projekte meer suksesvol te kan behartig, tot Hessequa se voordeel.

FOREWORD – MESSAGE FROM THE EXECUTIVE MAYOR
iii | P a g e
HESSEQUA MUNICIPALITY 2014/15 ANNUAL REPORT
Gelukkig kon belangrike kapitaalprojekte wat gemik is op inkomstegenerering asook voorbereiding vir behuisingsprojekte, gedurende 2014/15 afgehandel word. Die raad is verbind daartoe om infrastruktuur op standaard te hou sodat ontwikkeling en vooruitgang op alle vlakke kan plaasvind.
Om te voldoen aan die uitwissing van agterstande is ‘n behuisingsprojek in Slangrivier suksesvol afgehandel en is daar ook projekte in Melkhoutfontein, wat die laaste area is om sedert 1995 aan die beurt te kom, vir die vestiging van dienste en behuising.
Deernis word aan meer as 5000 huisgesinne gelewer en bring welkome verligting ten opsigte van gratis water en krag, afskrywing van uitstaande skuld en die vrystelling van basiese fooie vir al vier dienste en belasting op eiendomme met ‘n waarde tot R90 000.
Werksgeleenthede is beskikbaar gestel deur die EPWP projekte. Internskappe word bevorder deur hierdie geleenthede asook opleiding deur Provinsiale Departemente. Dit gee die student die opsie om by ‘n instansie geplaas te word en ‘n salaris vir nege maande te ontvang. Hierdie programme is spesifiek op jongmense gefokus.
Infrastuktuur opgradering deur middel van ‘n KV 66 lyn na Stilbaai gee die groenlig aan ontwikkelaars om hul projekte te implimenteer en daardeur werk te skep vir almal in Hessequa. Hierdeur word die ekonomie gestimuleer en nuwe hoop vir die toekoms gevestig. Opgradering van rioolwerke te Riversdal word eersdaags gedoen asook ander prioriteite in ons streek.
Die vestiging van ‘n Ekonomiese Forum na aanleiding van ‘n gesamentlike visie en identifisering van projekte deur midddel van werkswinkels in elke gemeenskap, is ‘n suksesstorie en doen die nuut gevestigde Departement Ekonomiese ontwikkeling wat toerisme insluit, innoverende werk.
Sportgronde van ‘n uitstaande gehalte is geskep in Albertinia wat dit nou vir hul moontlik maak om wedstryde tot op SARU vlak aan te bied. Ander dorpe waar hierdie aspek nog baie ontwikkeling nodig het, sal mettertyd ook aangespreek word.
Die dryfveer om ekonomiese groei te stimuleer is uiters belangrik in ‘n area waar die gebrek aan industrieë tot voordeel strek van ‘n pragtige en veilige omgewing wat met unieke binnelandse- en kusdorpe, iets bied vir elke smaak. Hiermee saam is die bemarking van Hessequa as ‘n leefstyl- en aftreebestemming ‘n ideaal en is Stilbaai een van die dorpe wat sterk ingekoop het om hierdie inisiatief te ondersteun.
‘n Suksesvolle Energie Beraad is in Hessequa gehou in samewerking met die Universiteit van Stellenbosch se Bestuurskool en die Goeie Regering Forum in die gepaardgaande Helix Program. Die drie dae het rigting gegee en aksieplanne tot gevolg en ook die gemeenskap op hoogte en aanboord gebring om met insig die pad te baan na eie opwekking van energie deur middel van die terugverkoop van ongebruikte krag aan die munisipaliteit. Kundigheid op vele terreine was teenwoordig by die beraad en is praktiese uitkomste bereik.
Effective Partnerships are a crucial part of what needs to be established in order to become more innovative and create improved communication. Partnerships are being strengthened ratepayers and communities, all who have specific skills that can
FOREWORD – MESSAGE FROM THE EXECUTIVE MAYOR
iv | P a g e
HESSEQUA MUNICIPALITY 2014/15 ANNUAL REPORT
enhance the functionality of the municipality. Partners as in the Grey Power Forum assist as an advisory committee on a variety of subjects. Their connections with the University of Stellenbosch Business School, afforded Hessequa Municipality to become part of the Good Governance Forum, SPL and this resulted in the structuring of the Hessequa Innovation Helix.
Work Studies are being completed per Department with the objective to enhance productivity, streamline the staff component and importantly, improve service delivery at all levels. This is an ongoing process and much of the funding was forthcoming from the Western Cape Province.
Hessequa Municipality is in a process of investing in partnerships and people to assist in stimulating the economy and needs to attract the interest of investors to the tranquil, pristine area that stands out for the quality of services rendered and offered.
Ek is oortuig dat Hessequa op pad is na groot hoogtes en dat hierdie raad die agterstande suksesvol sal aanspreek tot voordeel van elke inwoner. Daardeur word die doelwitte binne die Geïntregeerde Ontwikkelingsplan aangespreek en is dit ‘n aaneenlopende proses.
Die personeel se toegewydheid en ‘n Raad wat saamwerk, het hierdie prestasies saam bereik en daarvoor ‘n besondere waardering en woord van dank.
Emor Nel Uitvoerende Burgemeester/ Executive Mayor

FOREWORD – MUNICIPAL MANAGER’S OVERVIEW
v | P a g e
HESSEQUA MUNICIPALITY 2014/15 ANNUAL REPORT
MUNICIPAL MANAGER’S OVERVIEW
We are all aware of the challenges that local government are
facing within South Africa with poor economic growth and
rising cost of service delivery. Hessequa is not excluded to
these realities as the municipality strive to serve eleven
communities with very unique socio-economic circumstances,
growth trends, population size and needs. As overwhelming is
it all may sound, Hessequa is unique in its response to these
clear and present challenges.
The 2014/2015 financial year was the third year in the
implementation of our pioneering Long Term Financial Plan,
which has been revised and is setting the way for Hessequa
towards a sustainable financial local municipality. 2014/2015
was also the second year that the municipality has internalised
various good governance functions to provide clear controls and measures to monitor and evaluate
progress of implementation of the Integrated Development Plan.
With Hessequa receiving a “Clean” audit outcome from the Auditor General of South Africa, 2014/2015
reflected to be a year of continued good governance as all organisational systems where improved.
Hessequa has moved beyond the point of merely complying with legislation, but towards leadership in
governance.
This was shown through various awards given to the municipality and assessment outcomes as done
by Provincial Treasury and the Department of Local Government. Hessequa works hard to collaborate
with other spheres of government to ensure that service delivery is enhanced across our region. Inter-
governmental platforms such as the IDP Indaba’s and Municipal Technical Evaluation
Committees(MTEC) solidifies the good relationship that we have with the service delivery partners.
Hessequa also continues to engage with its communities through various mechanisms to ensure that
the public have the opportunity to participate in the affairs of local government. Council and all
committees appointed by the council are functioning well and are there regular engagements between
these platforms, councilors and the administration exist. Partnerships between the municipality and
stakeholders is one of the pillars of successful public participation.
I am proud to be part of the Hessequa legacy of good governance and in the midst of above mentioned
challenges, I am sure that there is a sustainable future for Hessequa.
J Jacobs
Municipal Manager

CHAPTER 1 – OVERVIEW OF HESSEQUA MUNICIPALITY
1 | P a g e
HESSEQUA MUNICIPALITY 2014/15 ANNUAL REPORT
Chapter 1:
Overview of Hessequa
Municipality

CHAPTER 1 – OVERVIEW OF HESSEQUA MUNICIPALITY
2 | P a g e
HESSEQUA MUNICIPALITY 2014/15 ANNUAL REPORT
CHAPTER 1 - ABOUT HESSEQUA REGION
The name Hessequa, meaning "people of the trees", refers to the tribe of Khoikhoi people that used to
live in the region. Hessequa is the gently curving edge of the continent just east of the southern-most
tip of Africa.
The municipality nestles at the foot of the Langeberg Mountains with boundaries stretching along the
Southern Cape coast from the Breede River to Gouritsmond. A region rich in natural beauty with rolling
hills of pristine limestone and mountain fynbos, dune thicket and Renosterveld and to the north
surrounded with rugged mountains and indigenous forests.
Pristine beaches stretch the entire length of her coastline. Ecological assets include four estuaries, a
world heritage forest site, several nature reserves which guard a number of rare and endangered floral
species and even a very special little frog.
Hessequa Municipality is situated in the Southern Cape Coast on the Garden Route; about 320 km's
from Cape Town on the N2 and is situated on the western border of the Eden District Municipality
between Swellendam and Mosselbay Municipalities. At present, the Municipal area of Hessequa includes
the towns of Riversdale, Heidelberg, Albertinia, Witsand, Gouritsmond, Slangrivier and Stilbaai.
Wards
The municipal area includes a number of big rural areas as well as towns. The Municipality is currently
structured into the following 8 Municipal Wards:
Ward Areas
1 Gouritsmond, Melkhoutfontein, Stilbaai East, Part of Stilbaai West and rural farming
areas
2 Albertinia
3 Vermaaklikheid, Jongensfontein, part of Stilbaai West and rural farming areas
4 Witsand, Part of Heidelberg and surrounding farms
5 Heidelberg
6 Part of Riversdale and rural areas
7 Part of Riversdale and rural areas
8 Part of Riversdale
Table 1.: Municipal Wards

CHAPTER 1 – OVERVIEW OF HESSEQUA MUNICIPALITY
3 | P a g e
HESSEQUA MUNICIPALITY 2014/15 ANNUAL REPORT
1.1 An overview of Hessequa’s demographics
At the time of Census 2011, the population of the Hessequa region constituted of 52 642 people made
up of 15 873 household units. The municipal area includes a number of big rural areas as well as
towns.
Population
The Municipality is estimated to account for 9% of the total Eden District’s population of 574 265
in 2011.
The table below indicates the total population within the Hessequa municipal area by race:
Table 2.: Population by race
Households
The average household size in the Hessequa municipal area is 3.1 as indicated in the table below:
Table 3.: Household size per ward

CHAPTER 1 – OVERVIEW OF HESSEQUA MUNICIPALITY
4 | P a g e
HESSEQUA MUNICIPALITY 2014/15 ANNUAL REPORT
a) Head of Household Gender profile by Ward
Table 4.: Head of Household Gender per Ward
b) Indigent Households
In 2014/15, indigent households in Hessequa, being those who applied for indigent status and met
Hessequa’s criteria, decreased slightly.
1.2 Overview of Hessequa’s Social and Economic Information
Social and Economic Growth
The social and economic for the municipal area is as follows:
Financial year Housing Backlog Households with No
Income (%)
People older than 14
years illiterate (%)
2014/15 6029 8 13
Table 5.: Social and Economic information

CHAPTER 1 – OVERVIEW OF HESSEQUA MUNICIPALITY
5 | P a g e
HESSEQUA MUNICIPALITY 2014/15 ANNUAL REPORT
a. Household Income by Ward
Table 6.: Household income by Ward
b. Education Levels
Table 7.: Education levels by Ward
Educational Levels by Ward - 2001 & 2011
Ward 1 Ward 2 Ward 3 Ward 4 Ward 5 Ward 6 Ward 7 Ward 8
2001 2011 2001 2011 2001 2011 2001 2011 2001 2011 2001 2011 2001 2011 2001 2011
Grade 0 124 245 61 268 179 272 139 172
No schooling 576 237 376 350 495 224 517 353 489 203 436 268 487 263 375 283
Grade 1 / Sub A 245 134 163 190 152 89 268 298 198 160 244 135 235 170 207 181
Grade 2 / Sub B 216 169 147 234 131 123 177 314 117 132 155 176 171 177 152 199
Grade 3 / Std 1/ABET 1Kha Ri Gude;SANLI
267 172 188 247 178 142 311 378 208 166 200 212 248 204 224 223
Grade 4 / Std 2 323 219 240 265 208 146 424 459 268 208 233 293 269 256 225 277
Grade 5 / Std 3/ABET 2
431 212 276 350 236 171 527 482 330 203 261 263 277 226 297 291
Grade 6 / Std 4 543 326 365 504 342 247 594 652 369 317 391 306 439 267 366 365
Grade 7 / Std 5/ ABET 3
521 479 509 533 273 257 574 759 544 418 392 465 575 384 612 577
Grade 8 / Std 6 / Form 1
561 533 359 713 322 379 469 904 676 615 472 670 574 529 505 735
Grade 9 / Std 7 / Form 2/ ABET 4
337 405 296 518 105 173 256 722 394 377 310 510 438 360 436 623
Grade 10 / Std 8 / Form 3
509 661 535 740 370 308 186 551 532 498 436 665 463 558 285 565
Grade 11 / Std 9 / Form 4
190 195 159 261 80 104 73 351 209 215 191 301 192 205 112 266
Grade 12 / Std 10 / Form 5
855 1374 916 1219 911 1067 359 950 768 1094 852 1007 602 1126 317 703
Other 878 1502 1034 1116 980 1347 772 1016 809 994 982 1374 805 1444 469 656
CHAPTER 1 – OVERVIEW OF HESSEQUA MUNICIPALITY
6 | P a g e
HESSEQUA MUNICIPALITY 2014/15 ANNUAL REPORT
1.3 Service Delivery Overview
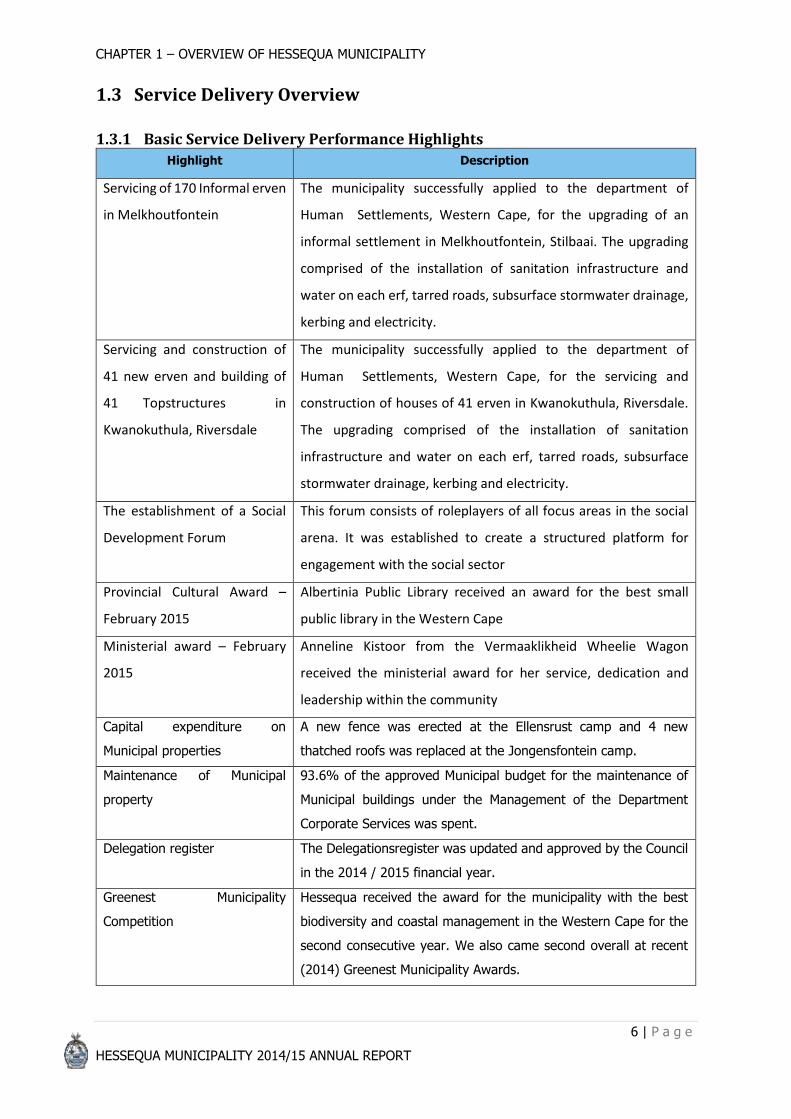
1.3.1 Basic Service Delivery Performance Highlights
Highlight Description
Servicing of 170 Informal erven
in Melkhoutfontein
The municipality successfully applied to the department of
Human Settlements, Western Cape, for the upgrading of an
informal settlement in Melkhoutfontein, Stilbaai. The upgrading
comprised of the installation of sanitation infrastructure and
water on each erf, tarred roads, subsurface stormwater drainage,
kerbing and electricity.
Servicing and construction of
41 new erven and building of
41 Topstructures in
Kwanokuthula, Riversdale
The municipality successfully applied to the department of
Human Settlements, Western Cape, for the servicing and
construction of houses of 41 erven in Kwanokuthula, Riversdale.
The upgrading comprised of the installation of sanitation
infrastructure and water on each erf, tarred roads, subsurface
stormwater drainage, kerbing and electricity.
The establishment of a Social
Development Forum
This forum consists of roleplayers of all focus areas in the social
arena. It was established to create a structured platform for
engagement with the social sector
Provincial Cultural Award –
February 2015
Albertinia Public Library received an award for the best small
public library in the Western Cape
Ministerial award – February
2015
Anneline Kistoor from the Vermaaklikheid Wheelie Wagon
received the ministerial award for her service, dedication and
leadership within the community
Capital expenditure on
Municipal properties
A new fence was erected at the Ellensrust camp and 4 new
thatched roofs was replaced at the Jongensfontein camp.
Maintenance of Municipal
property
93.6% of the approved Municipal budget for the maintenance of
Municipal buildings under the Management of the Department
Corporate Services was spent.
Delegation register The Delegationsregister was updated and approved by the Council
in the 2014 / 2015 financial year.
Greenest Municipality
Competition
Hessequa received the award for the municipality with the best
biodiversity and coastal management in the Western Cape for the
second consecutive year. We also came second overall at recent
(2014) Greenest Municipality Awards.

CHAPTER 1 – OVERVIEW OF HESSEQUA MUNICIPALITY
7 | P a g e
HESSEQUA MUNICIPALITY 2014/15 ANNUAL REPORT
Highlight Description
Tenders for Consulting
Engineers
Capital projects for the following 3 years (2014/15, 2015/16 and
2016/17) were successfully awarded. Tenders for construction
projects are currently underway and spending w.r.t. capital budget
over the said period should improve significantly
Youth Jobs in Waste 12 Temporary Jobs were created during the past 12 months to
assist the municipality w.r.t. waste management in Hessequa by
the Department of Environmental Affairs. This reduced the impact
on the municipal personnel budget
Training of Process Controllers LG SETA funded the training of 4 x Process Controllers at NQF
level 4 and 12 x Process Controllers at NQF level 2 for our Water
and Waste Water Treatment Facilities
Training of Infrastructure
Supervisors
LG SETA funded the training of 4 x Superintendents for a Junior
Management Course and 6 Foremen for a Supervisory
Management Course
Water and Sewer Master Plans Water and Sewer Master Plans were completed at the end of June
2015 that will help with the prioritisation of related upgrades
Funding for Flood Damage Hessequa Municipality received R77 million for flood damage
projects. The application was completed internally and without
making use of external consultants. Consultants were however
appointed for the implementation of the projects which are at
design phase presently
State of the Environment
Report
Successful update of the 2008 State of the Environment Report.
Upgrade of Slipways Kraaltjie Slipway upgrade & Gouritsmond Jetty reconstruction –
The Kraaltjie Slipway in Witsand was successfully overhauled (this
is a huge achievements as the structure is more than 100 years old
and is semi-submerged) and the Gouritsmond jetty was
reconstructed after the initial slip was swept away in the 2013
floods (this was done internally by the Environmental Section).
Table 8.: Basic Service Delivery Highlights
1.3.2 Basic Service Delivery Challenges
Service Area Challenge Actions to address
Water, roads, sanitation,
electrical
Inadequate funding (Grant &
Internal)
The financial plan of the
municipality clearly identifies
the investment needed to
maintain and develop services.

CHAPTER 1 – OVERVIEW OF HESSEQUA MUNICIPALITY
8 | P a g e
HESSEQUA MUNICIPALITY 2014/15 ANNUAL REPORT
Service Area Challenge Actions to address
More significant Provincial and
National investment in local
sphere of government
Water, roads, sanitation,
electrical
Procurement processes, budget
constraints (operation and
maintenance budget)
This issue needs to be taken
forward to National to
intervene with local
government to come up with
ways to help Local
Municipalities.
Water, roads, sanitation, refuse
removal
The availability of
infrastructure in remote areas
remains a huge problem
National support is needed to
effectively manage rural small
towns. Small towns with less
than 2 000 households are
huge challenge.
Procurement processes are
increasingly hampering service
delivery
None of the Capital
Engineering projects were
implemented in the 2013/2014
Financial year due to a dispute
on the Appointment of
Consulting Engineers Tender.
As a result projects were also
affected during the 2014/15
financial year
Timeously finalization of
appeals.
Table 9.: Basic Service Delivery Challenges
1.3.3 Proportion of Households with access to Basic Services
Proportion of Households with minimum level of Basic services
Service 2013/14 2014/15
Electricity service connections 100% 100%
Water - available within 200 m from dwelling 100% 100%
Sanitation - Households with at least VIP service 100% 100%
Waste collection - kerbside collection once a week 100% 100%
Table 10.: Households with minimum level of Basic Services
CHAPTER 1 – OVERVIEW OF HESSEQUA MUNICIPALITY
9 | P a g e
HESSEQUA MUNICIPALITY 2014/15 ANNUAL REPORT
1.4 Financial Health Overview
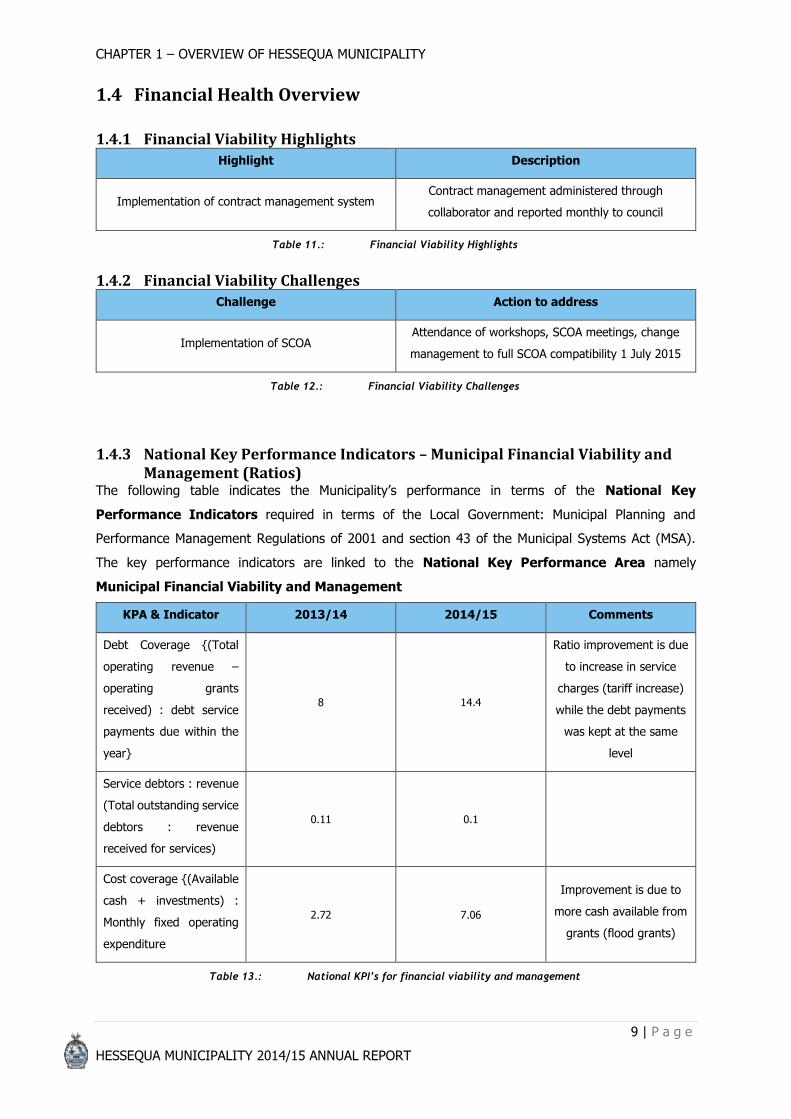
1.4.1 Financial Viability Highlights
Highlight Description
Implementation of contract management system Contract management administered through
collaborator and reported monthly to council
Table 11.: Financial Viability Highlights
1.4.2 Financial Viability Challenges
Challenge Action to address
Implementation of SCOA Attendance of workshops, SCOA meetings, change
management to full SCOA compatibility 1 July 2015
Table 12.: Financial Viability Challenges
1.4.3 National Key Performance Indicators – Municipal Financial Viability and Management (Ratios) The following table indicates the Municipality’s performance in terms of the National Key
Performance Indicators required in terms of the Local Government: Municipal Planning and
Performance Management Regulations of 2001 and section 43 of the Municipal Systems Act (MSA).
The key performance indicators are linked to the National Key Performance Area namely
Municipal Financial Viability and Management
KPA & Indicator 2013/14 2014/15 Comments
Debt Coverage {(Total
operating revenue –
operating grants
received) : debt service
payments due within the
year}
8 14.4
Ratio improvement is due
to increase in service
charges (tariff increase)
while the debt payments
was kept at the same
level
Service debtors : revenue
(Total outstanding service
debtors : revenue
received for services)
0.11 0.1
Cost coverage {(Available
cash + investments) :
Monthly fixed operating
expenditure
2.72 7.06
Improvement is due to
more cash available from
grants (flood grants)
Table 13.: National KPI’s for financial viability and management
CHAPTER 1 – OVERVIEW OF HESSEQUA MUNICIPALITY
10 | P a g e
HESSEQUA MUNICIPALITY 2014/15 ANNUAL REPORT
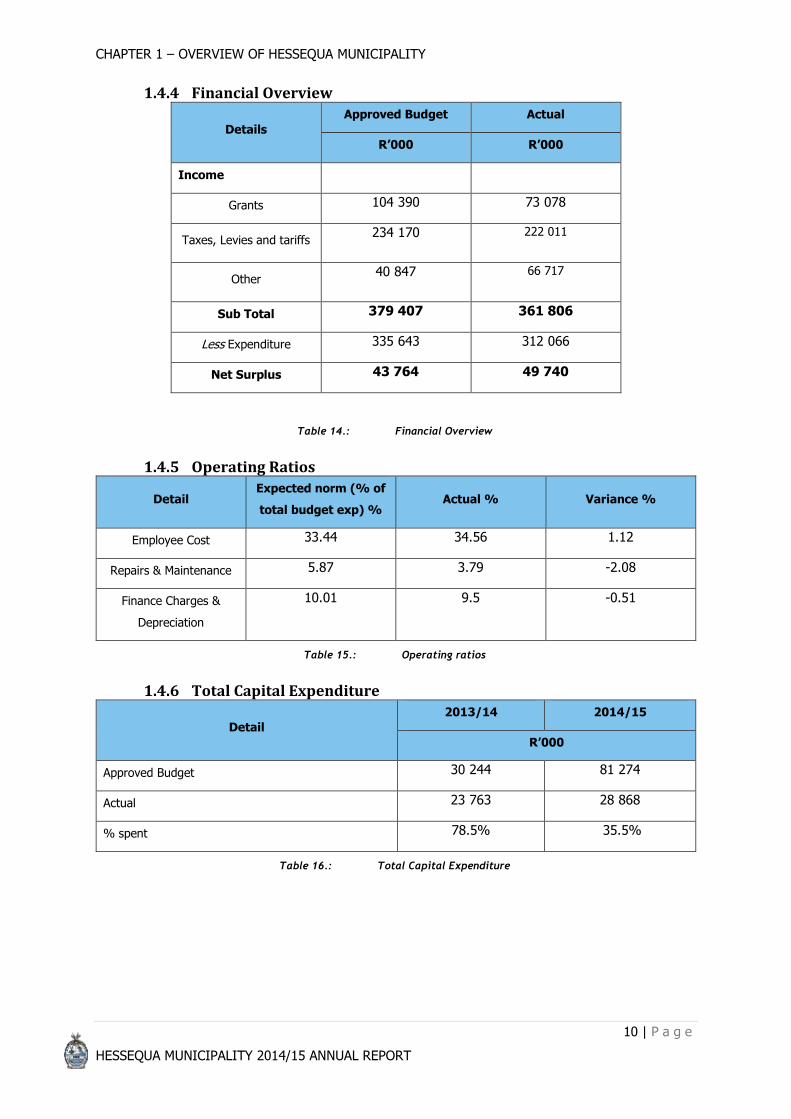
1.4.4 Financial Overview
Details
Approved Budget Actual
R’000 R’000
Income
Grants 104 390 73 078
Taxes, Levies and tariffs 234 170 222 011
Other 40 847 66 717
Sub Total 379 407 361 806
Less Expenditure 335 643 312 066
Net Surplus 43 764 49 740
Table 14.: Financial Overview
1.4.5 Operating Ratios
Detail Expected norm (% of
total budget exp) % Actual % Variance %
Employee Cost 33.44 34.56 1.12
Repairs & Maintenance 5.87 3.79 -2.08
Finance Charges &
Depreciation
10.01 9.5 -0.51
Table 15.: Operating ratios
1.4.6 Total Capital Expenditure
Detail
2013/14 2014/15
R’000
Approved Budget 30 244 81 274
Actual 23 763 28 868
% spent 78.5% 35.5%
Table 16.: Total Capital Expenditure

CHAPTER 2 – GOOD GOVERNANCE
11 | P a g e
HESSEQUA MUNICIPALITY 2014/15 ANNUAL REPORT
Chapter 2:
Good Governance

CHAPTER 2 – GOOD GOVERNANCE
12 | P a g e
HESSEQUA MUNICIPALITY 2014/15 ANNUAL REPORT
CHAPTER 2
COMPONENT A: POLITICAL AND ADMINISTRATIVE
GOVERANCE
Good governance has 8 major characteristics. It is participatory, consensus oriented, accountable,
transparent, responsive, effective and efficient, equitable and inclusive and follows the rule of law. It
assures that corruption is minimized, the views of minorities are taken into account and that the voices
of the most vulnerable in society are heard in decision-making. It is also responsive to the present and
future needs of society.
2.1 National Key Performance Indicators - Good Governance and
Public Participation
The following table indicates the municipality’s performance in terms of the National Key Performance
Indicators required in terms of the Local Government: Municipal Planning and the Performance
Management Regulations 7146 2001 and section 43 of the MSA. This key performance indicator is
linked to the National Key Performance Area - Good Governance and Public Participation.
KPA & Indicators
Municipal
Achievement
Municipal
Achievement
2013/14 2014/15
The percentage of a municipality’s capital
budget actually spent on capital projects identified for a particular financial year in terms of
the municipality’s integrated development plan
78.5% 35.52%
Table 17.: National KPIs - Good Governance and Public Participation Performance
2.2 Performance Highlights – Good Governance and Public
Participation
Highlight Description
Organisational Review
With assistance of a Provincial grant the Council is
conducting a critical analysis of its functional units to
assess and evaluate efficiency and consider possible
service delivery options. The organisational review of
Camps and Protection Services were completed in this
financial year.

CHAPTER 2 – GOOD GOVERNANCE
13 | P a g e
HESSEQUA MUNICIPALITY 2014/15 ANNUAL REPORT
Highlight Description
Review of Financial Plan
As legislation requires, the IDP should include a
financial plan and have Hessequa, with the assistance
of Provincial Treasury, reviewed the long term financial
plan
Establishment of LED Unit & Implementation of
Programmes & Projects
The LED unit have been vacant for more than 3 years
and have the needed capacity been employed to
manage the function amd implement programmes and
projects
Table 18.: Good Governance and Public Participation Performance Highlights
2.3 Challenges – Good Governance and Public Participation
Description Actions to address
Apathy of various communities in the processes of
public participation
Approved Public Participation Framework are being
implemented in the development of a long term
Strategic Framework.
Table 19.: Good Governance and Public Participation Challenges
2.4 Governance Structure
2.4.1 Political Governance Structure The Council performs both legislative and executive functions. They focus on legislative, oversight and
participatory roles, and have delegated its executive function to the Executive Mayor and the Mayoral
Committee. Their primary role is to debate issues publicly and to facilitate political debate and
discussion. Apart from their functions as decision makers, Councillors are also actively involved in
community work and the various social programmes in the municipal area.
a. Council
The Council comprises 15 elected Councillors, made up from 8 Ward Councillors and 6 Proportional
Representation (PR) Councillors. The portfolio committees are made up of Councillors drawn from
all political parties. The party representation in the Council is represented the table below. In the
table below the Councillors are categorised within their specific political parties and wards for the
2014/15 financial year:

CHAPTER 2 – GOOD GOVERNANCE
14 | P a g e
HESSEQUA MUNICIPALITY 2014/15 ANNUAL REPORT
Council
Members Capacity Political Party
Ward
representing
or
proportional
Percentage
Council
Meetings
Attendance
Percentage
Apologies for
non-
attendance
% %
E Nel Executive
Mayor DA PR 100 100
JJ Merkeur Executive
Deputy Mayor Cope PR 92
100
LJ Fourie Councillor DA PR 100 100
R Johannes Councillor DA PR 100 100
A Hartnick Councillor ANC Ward 5 92 100
CP Taute Councillor ANC Ward 8 92 100
ME Dayimani Councillor ANC PR 83 100
LC February Councillor ANC Ward 4 92 100
FC Carelse Councillor Civic
Independent PR 92
100
D Abrahams Councillor ANC PR 92 100
PR Claassens Councillor DA Ward 1 92 100
EJ Prins Speaker DA Ward 3 92 100
CAE Prins Councillor DA Ward 2 100 100
F Hartnick Councillor ANC Ward 6 83 100
AM Joubert Councillor DA Ward 7 92 100
Table 20.: Council Meetings
b. Executive Mayoral Committee
The Executive Mayor of the Municipality, Councillor E Nel, assisted by the Mayoral Committee,
heads the executive arm of the Municipality. The Executive Mayor is at the centre of the system of
governance, since executive powers are vested in him to manage the day-to-day affairs. This means
that he has an overarching strategic and political responsibility. The key element of the executive
model is that executive power is vested in the Executive Mayor, delegated by the Council, and as
well as the powers assigned by legislation. Although accountable for the strategic direction and
performance of the Municipality, the Executive Mayor operates in concert with the Mayoral
Committee.

CHAPTER 2 – GOOD GOVERNANCE
15 | P a g e
HESSEQUA MUNICIPALITY 2014/15 ANNUAL REPORT
The name and portfolio of each Member of the Mayoral Committee is listed in the table below for
the period 1 July 2014 to 30 June 2015:
Name of member Capacity
E Nel Executive Mayor
JJ Merkeur Executive Deputy Mayor
CAE Prins Mayco member
L Fourie Mayco member
FC Carelse Mayco member
Meeting dates Number of reports submitted to Council
30 July 2014 24
7 August 2014 1
26 August 2014 22
30 September 2014 23
7 October 2014 1
29 October 2014 18
25 November 2014 34
3 December 2014 6
23 January 2015 25
17 February 2015 2
24 February 2015 28
31 March 2015 29
24 April 2015 30
26 May 2015 35
26 June 2015 26
Table 21.: Executive Mayoral Committee
c. Portfolio Committees
In terms of section 80 of the Municipal Structures Act, 1998, if a council has an executive
committee; it may appoint in terms of section 79 committees of councillors to assist the executive
committee or executive mayor. Section 80 committees are permanent committees that specialise

CHAPTER 2 – GOOD GOVERNANCE
16 | P a g e
HESSEQUA MUNICIPALITY 2014/15 ANNUAL REPORT
in a specific functional area of the municipality and may in some instances make decisions on
specific functional issues. They advise the executive committee on policy matters and make
recommendations to Council.
The portfolio committees for the 2011/16 Mayoral term and their Chairpersons are as follow:
I. Corporate Services
Name of member Capacity
FC Carelse Chairperson
LJ Fourie Member
EJ Prins Member
JJ Merkeur Member
ME Dayimani Member
CP Taute Member
AM Joubert Member
Table 22.: Corporate Services Portfolio Committees
Meeting dates Number of reports submitted to Council
16 July 2014 35
12 August 2014 22
17 September 2014 31
15 October 2014 15
11 November 2014 29
11 February 2015 18
18 March 2015 29
15 April 2015 16
12 May 2015 14
10 June 2015 26
Table 23.: Corporate Services Portfolio Committee Meetings
II. Community Services, Local Economic Development and Protection Services
Name of member Capacity
CAE Prins Chairperson
LJ Fourie Member
R Johannes Member

CHAPTER 2 – GOOD GOVERNANCE
17 | P a g e
HESSEQUA MUNICIPALITY 2014/15 ANNUAL REPORT
Name of member Capacity
PR Claassens Member
FC Carelse Member
AM Joubert Member
D Abrahams Member
L February Member
A Hartnick Member
Table 24.: Community Services, Local Economic Development and Protection Services Portfolio Committee
Meeting dates Number of reports submitted to council
16 July 2014 7
12 August 2014 19
17 September 2014 10
15 October 2014 11
12 November 2014 8
11 February 2015 14
18 March 2015 6
15 April 2015 16
12 May 2015 7
10 June 2015 15
Table 25.: Community Services, Local Economic Development and Protection Services Portfolio Committee
Meetings
III. Technical Service
Name of member Capacity
JJ Merkeur Chairperson
LJ Fourie Member
R Johannes Member
PR Claassens Member
FC Carelse Member
ME Dayimani Member
F Hartnick Member
Table 26.: Technical Services Portfolio Committee

CHAPTER 2 – GOOD GOVERNANCE
18 | P a g e
HESSEQUA MUNICIPALITY 2014/15 ANNUAL REPORT
Meeting dates Number of reports submitted to council
16 July 2014 11
12 August 2014 10
17 September 2014 23
15 October 2014 18
11 November 2014 19
11 February 2015 27
18 March 2015 19
15 April 2015 19
12 May 2015 17
10 June 2015 23
Table 27.: Finance and Audit Portfolio Committee Meetings
IV. Finance and Audit Portfolio Committee
Name of member Capacity
LJ Fourie Chairperson
EJ Prins Member
PR Claassens Member
CAE Prins Member
R Johannes Member
JJ Merkeur Member
ME Dayimani Member
Table 28.: Finance and Audit Portfolio Committee
Meeting dates Number of reports submitted to council
16 July 2014 15
12 August 2014 19
17 September 2014 24
15 October 2014 10
11 November 2014 13

CHAPTER 2 – GOOD GOVERNANCE
19 | P a g e
HESSEQUA MUNICIPALITY 2014/15 ANNUAL REPORT
Meeting dates Number of reports submitted to council
11 February 2015 19
18 March 2015 13
15 April 2015 11
12 May 2015 9
10 June 2015 11
Table 29.: Finance and Audit Portfolio Committee Meetings
V. Spatial Planning and Environmental Management
Name of member Capacity
16 July 2014 15
12 August 2014 19
17 September 2014 24
15 October 2014 10
11 November 2014 13
11 February 2015 19
18 March 2015 13
Table 30.: Spatial Planning and Environmental Management Portfolio Committee
Meeting dates Number of reports submitted to council
16 July 2014 14
12 August 2014 11
17 September 2014 23
15 October 2014 4
11 November 2014 15
11 February 2015 7
18 March 2015 7
15 April 2015 8
12 May 2015 7
10 June 2015 10
Table 31.: Spatial Planning and Environmental Management Portfolio Committee Meetings

CHAPTER 2 – GOOD GOVERNANCE
20 | P a g e
HESSEQUA MUNICIPALITY 2014/15 ANNUAL REPORT
2.4.2 Administrative Governance Structure
The Municipal Manager is the Chief Accounting Officer of the Municipality. He is the head of the
administration, and primarily has to serve as chief custodian of service delivery and implementation of
political priorities. He is assisted by his direct reports, which constitutes the Management Team, whose
structure is outlined in the table below:
Name of Official Department
Performance agreement
signed
(Yes/No)
Mr. J Jacobs Municipal Manager Yes
Ms. AM Griesel Corporate Services Yes
Ms. HJ Viljoen Finance Yes
Mr. HS Visser Spatial Planning and
Environmental Management Yes
Mr. RR Wesso Technical Services Yes
Mr. C Onrust Community Services Yes
Table 32.: Administrative Governance Structure

CHAPTER 2 – GOOD GOVERNANCE
21 | P a g e
HESSEQUA MUNICIPALITY 2014/15 ANNUAL REPORT
COMPONENT B: INTERGOVERNMENTAL RELATIONS
2.5 Intergovernmental Relations
2.5.1 National Intergovernmental Structures
Hessequa Local Municipality does from time to time attend National Meetings. These however are kept
to a minimum to save on travel costs. When national meetings are held in the Western Cape, they are
attended if the agenda justifies attendance. We are very conservative with travel and subsistence
expenditure. We also do take part in National Competitions and do attend such functions where we are
finalists. The Housing and Green Energy Awards are examples of such events. Otherwise, SALGA
represents the Western Cape and Hessequa in national issues.
2.5.2 Provincial Intergovernmental Structures
Provincial SALGA meetings are attended diligently as well as meetings held and hosted by all Provincial
Departments. The meetings hosted by the Premier and MEC members are also attended. We have a
good working relationship with our provincial departments, especially the Provincial Treasury and the
Department of Local Government and Housing. The Municipal Manager also attends the Western Cape
Municipal Managers Forum often.
2.5.3 District Intergovernmental Structures
Hessequa Local Municipality is a member of the Eden District Municipality. We attend multiple district
forums and meetings and share information, strategies and best practice models, amongst each other.
The Speaker and Mayoral Forums are also held often and are also attended by our Executive. The
Municipal Manager also attends the Eden District Municipal Managers Forum.
COMPONENT C: PUBLIC ACCOUNTABILITY AND
PARTICIPATION
Section 16 of the Municipal Systems Act (MSA) refers specifically to the development of a culture of
community participation within municipalities. It states that a municipality must develop a culture of
municipal governance that complements formal representative government with a system of
participatory governance. For this purpose it must encourage and create conditions for the local
community to participate in the affairs of the community. Such participation is required in terms of:
the preparation, implementation and review of the IDP;
establishment, implementation and review of the performance management system;
monitoring and review of the performance, including the outcomes and impact of such
performance; and
preparation of the municipal budget.

CHAPTER 2 – GOOD GOVERNANCE
22 | P a g e
HESSEQUA MUNICIPALITY 2014/15 ANNUAL REPORT
2.6 Public Meetings
Public communication and participatory initiatives employed by the municipality include the following:
Public Meeting Description and feedback given to community
IDP Preparation, implementation and workshop of IDP process
Municipal Budget Comments and feedback required from public for yearly budget review
Annual Mayoral Outreaches Municipality communicate its programmes and progress directly to the public and receive feedback on service delivery, listen to concerns, grievances and advice on pace and direction of government work.
Environmental Education
Department Environmental Services works together with Cape Nature to promote a litter free community. Educational puppet shows were
created to educate primary school children on waste and the effects on the community
Nelson Mandela Day
The staff of Head Office arranged a soup kitchen for the children of the poor communities in Riversdale. Staff participated by donating food and money for the soup kitchen as well as offering up their time to help distribute the food
Quarterly Jamborees Jamborees are held on a rotation schedule in different towns to bring governmental services to their door
By-Law Policies All by-laws are submitted for public comment and recommendations during public meetings
Eden FM Weekly timeslots on Eden FM, every Wednesday between 17h00 – 17h30 to address pressing issues arising within the municipality.
Table 33.: Public Meetings
2.6.2 Ward Committees The ward committees support the Ward Councillor who receives reports on development, participate in
development planning processes, and facilitate wider community participation. To this end, the
municipality constantly strives to ensure that all ward committees function optimally with community
information provision; convening of meetings; ward planning; service delivery; IDP formulation and
performance feedback to communities.
CHAPTER 2 – GOOD GOVERNANCE
23 | P a g e
HESSEQUA MUNICIPALITY 2014/15 ANNUAL REPORT
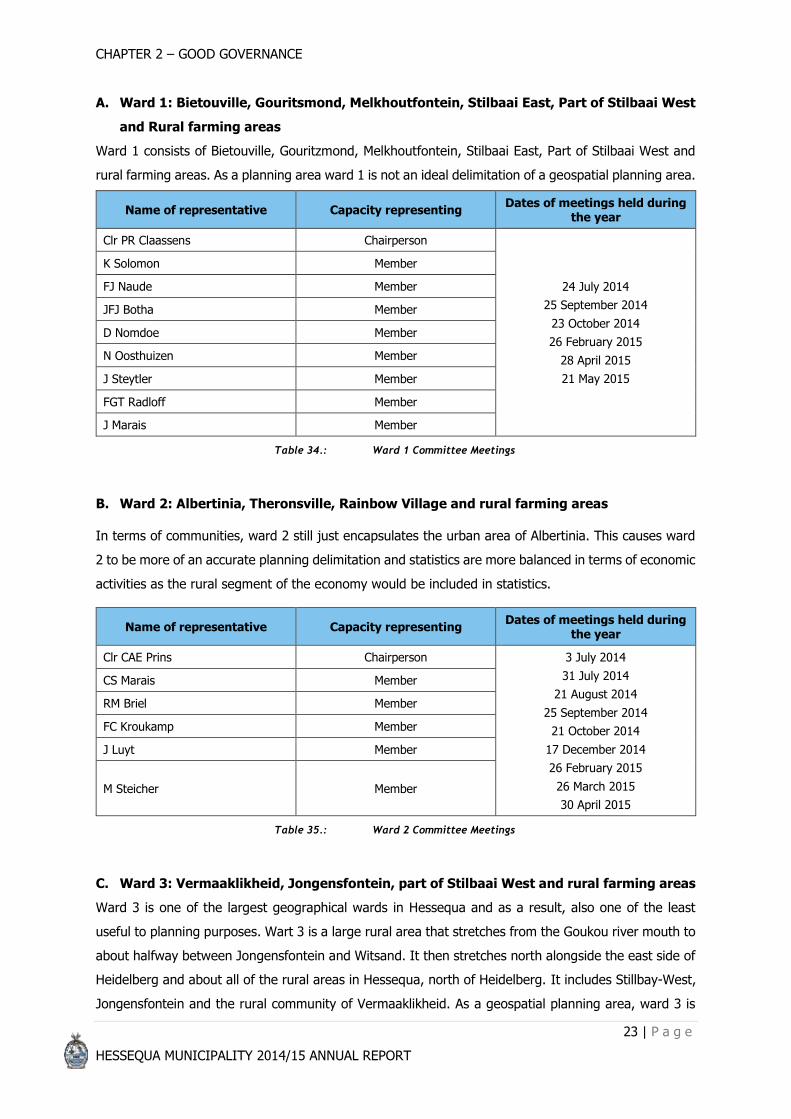
A. Ward 1: Bietouville, Gouritsmond, Melkhoutfontein, Stilbaai East, Part of Stilbaai West
and Rural farming areas
Ward 1 consists of Bietouville, Gouritzmond, Melkhoutfontein, Stilbaai East, Part of Stilbaai West and
rural farming areas. As a planning area ward 1 is not an ideal delimitation of a geospatial planning area.
Name of representative Capacity representing Dates of meetings held during
the year
Clr PR Claassens Chairperson
24 July 2014
25 September 2014
23 October 2014
26 February 2015
28 April 2015
21 May 2015
K Solomon Member
FJ Naude Member
JFJ Botha Member
D Nomdoe Member
N Oosthuizen Member
J Steytler Member
FGT Radloff Member
J Marais Member
Table 34.: Ward 1 Committee Meetings
B. Ward 2: Albertinia, Theronsville, Rainbow Village and rural farming areas
In terms of communities, ward 2 still just encapsulates the urban area of Albertinia. This causes ward
2 to be more of an accurate planning delimitation and statistics are more balanced in terms of economic
activities as the rural segment of the economy would be included in statistics.
Name of representative Capacity representing Dates of meetings held during
the year
Clr CAE Prins Chairperson 3 July 2014
31 July 2014
21 August 2014
25 September 2014
21 October 2014
17 December 2014
26 February 2015
26 March 2015
30 April 2015
CS Marais Member
RM Briel Member
FC Kroukamp Member
J Luyt Member
M Steicher Member
Table 35.: Ward 2 Committee Meetings
C. Ward 3: Vermaaklikheid, Jongensfontein, part of Stilbaai West and rural farming areas
Ward 3 is one of the largest geographical wards in Hessequa and as a result, also one of the least
useful to planning purposes. Wart 3 is a large rural area that stretches from the Goukou river mouth to
about halfway between Jongensfontein and Witsand. It then stretches north alongside the east side of
Heidelberg and about all of the rural areas in Hessequa, north of Heidelberg. It includes Stillbay-West,
Jongensfontein and the rural community of Vermaaklikheid. As a geospatial planning area, ward 3 is

CHAPTER 2 – GOOD GOVERNANCE
24 | P a g e
HESSEQUA MUNICIPALITY 2014/15 ANNUAL REPORT
one of the least practical areas to do planning as statistics are shared with a very large rural area and
two relatively well-off communities
Name of representative Capacity representing Dates of meetings held during
the year
Clr EJ Prins Chairperson
28 July 2014
29 September 2014
27 October 2014
24 November 2014
23 February 2015
28 April 2015
25 May 2015
22 June 2015
WP Jacobs Member
L le Roux Member
J Willemse Member
A Miggels Member
R Pretorius Member
N Palmer Member
J van der Hoven Member
Table 36.: Ward 3 Committee Meetings
D. Ward 4: Witsand, Joe-Slovo, Slangrivier, Heidelberg and surrounding farms
Ward 4 includes a relatively large rural area surrounding Witsand, Slangrivier and the Heidelberg area.
It’s boundary towards the west is the municipal boundary and stretches from the coast in the south to
the N2 on the northern boundary. As mentioned Witsand is included, Slangrivier and a relatively large
portion of Heidelberg town.
In terms of planning and statistical analysis the ward’s delimitation is very unpractical. It literally cuts
through the middle of a community and resulting in that area’s statistics to be included with Slangrivier
and Witsand. It is of no strategic value to look at statistics on the level of ward 4.
Name of representative Capacity representing Dates of meetings held during
the year
Clr L February Chairperson
21 August 2014
25 September 2014
19 February 2015
23 April 2015
28 May 2015
18 June 2015
J Swart Member
G Hartman Member
P Hartnick Member
JA Hoogbaard Member
S Botha Member
P February Member
Table 37.: Ward 4 Committee Meetings
E. Ward 5: Heidelberg and rural farming areas
The ward consists mostly out of the Heidelberg urban area with a small piece of rural area included
towards the north-west of the town. As planning area ward 5 would’ve worked well, but due to a
relatively large portion of the ward that is removed by the delimitation of ward 4, a core group of the
residents of Heidelberg is removed from statistics, thus renders the ward as geospatial planning area
useless.

CHAPTER 2 – GOOD GOVERNANCE
25 | P a g e
HESSEQUA MUNICIPALITY 2014/15 ANNUAL REPORT
Name of representative Capacity representing Dates of meetings held during
the year
Clr A Hartnick Chairperson
22 July 2014
23 September 2014
28 October 2014
18 November 2014
19 February 2015
21 April 2015
26 May 2015
RM Jacobs Member
N Horn (Removed February 2015) Member
S Pieterse Member
L Lots Member
V van Niekerk (Removed February 2015)
Member
G Mali Member
Table 38.: Ward 5 Committee Meetings
F. Ward 6: Part of Riversdale and rural areas
Ward 6 forms part of Riversdale and includes a small rural area within its borders. The largest portion
of ward 6’s residents is located in Riversdale by being separated from the rest of the town by the railway
line and Main Street on the western border. The rural area of ward 6 has a few concentrated farming
areas. Ward 6 is a difficult planning unit as it once again includes rural as well as urban areas.
Name of representative Capacity representing Dates of meetings held during
the year
Clr F Hartnick Chairperson 31 July 2014
21 August 2014
25 September 2014
26 March 2015
23 April 2015
21 May 2015
18 June 2015
N Juta Member
A Louw (Resigned April 2015) Member
M Hendricks Member
NA Joseph Member
M de Villiers Member
Table 39.: Ward 6 Committee Meetings
G. Ward 7: Riversdale, Alwynfleur, Kwanokuthula, Plankiesdorp and rural areas
The rural area that is included within ward 7 is towards the south-western side of Riversdale and
continues north over the Langeberg mountain range and includes all rural areas of the Hessequa
municipal area on the northern border behind the mountain range. Thus it consists of a substantial
amount of rural residents. Coming to its urban components, it includes a large part of Riversdale’s
centre of commerce and continues towards the north-westerly residential areas known as Alwynfleur
and surrounding areas. Another urban settlement was included in ward 7 and is known as
Kwanokuthula. This is primarily a formal residential area where almost all residents are indigent -7
makes it very difficult to use as a planning area as its vastness does not allow for planning to be
reflected in a useful manner if the complete ward is displayed.

CHAPTER 2 – GOOD GOVERNANCE
26 | P a g e
HESSEQUA MUNICIPALITY 2014/15 ANNUAL REPORT
Name of representative Capacity representing Dates of meetings held during
the year
Clr AM Joubert Chairperson 24 July 2014
21 August 2014
25 September 2014
23 October 2014
27 November 2014
26 February 2015
26 March 2015
21 May 2015
18 June 2015
M Stander Member
H Stroebel Member
K Victor Member
P de Kock Member
WM Davids Member
A Daniels Member
Table 40.: Ward 7 Committee Meetings
H. Ward 8: Aloeridge, Môrestond, Panorama, Beverley Hills and Melrose Place
Even though the ward does include a small amount of non-urban land, it has very few residents in that
part of the ward. The relatively high density communities of Môrestond, Aloeridge and Panorama are
the urban areas that house the relatively poor residents. Ward 8 is the only ward that can be used as
a planning area as it perfectly contains these communities as a whole.
Name of representative Capacity representing Dates of meetings held during
the year
Clr C Taute Chairperson
25 August 2014
25 September 2015
19 February 2015
26 March 2015
23 April 2015
21 May 2015
18 June 2015
C Merkeur Member
K Saayman Member
J van Staden Member
F Adams Member
K Adolf Member
A Eksteen Member
Table 41.: Ward 8 Committee Meetings
2.6.3 Functionality of Ward Committees The purpose of a ward committee is:
to get better participation from the community to inform council decisions;
to make sure that there is more effective communication between the Council and the
community; and
to assist the ward councillor with consultation and report-backs to the community.
Ward committees should be elected by the community they serve. A ward committee may not have
more than 10 members and should be representative. The ward councillor serves on the ward
committee and act as the chairperson. Although ward committees have no formal powers, they advise

CHAPTER 2 – GOOD GOVERNANCE
27 | P a g e
HESSEQUA MUNICIPALITY 2014/15 ANNUAL REPORT
the ward councillor who makes specific submissions directly to the council. These committees play a
very important role in the development and annual revision of the integrated development plan of the
area.
The table below provides information on the establishment of Ward Committees and their functionality:
Ward Number
Committee established
Yes / No
Number of reports submitted to the Speakers Office
Number meetings held during the year
1 Yes 6
2 Yes 4
3 Yes 7
4 Yes 7
5 Yes 8
6 Yes 6
7 Yes 8
8 Yes 5
Table 42.: Functioning of Ward Committees
2.6.4 Labour Forum The table below specifies the members of the Labour Forum for the 2014/15 financial year:
Name of representative Capacity Meeting dates
July 2014 - December 2014
Clr. L Fourie Councillor
14 July 2014
4 September 2014
2 October 2014
6 November 2014
Clr. EJ Prins Councillor
Clr. CAE Prins Councillor
Clr. R Johannes Councillor
Clr. ME Dayimani Councillor
Clr. F Hartnick Councillor
Mr. J Jacobs Employer
Ms. AM Griesel Employer
Mr. J Paige SAMWU
Mr. M Michiel SAMWU
Mr. J Nomdo SAMWU
Ms. E Snyers SAMWU
Ms. S Motha SAMWU
Mr. G Moses SAMWU
Mr. J Kleinhans IMATU
Mr S Hop IMATU
Mr F Rust IMATU

CHAPTER 2 – GOOD GOVERNANCE
28 | P a g e
HESSEQUA MUNICIPALITY 2014/15 ANNUAL REPORT
Name of representative Capacity Meeting dates
July 2014 - December 2014
Ms E Hobson IMATU
January 2015 – June 2015
Clr. L Fourie Councillor
5 March 2015
2 April 2015
7 May 2015
Clr. EJ Prins Councillor
Clr. CAE Prins Councillor
Clr. R Johannes Councillor
Clr. ME Dayimani Councillor
Clr. F Hartnick Councillor
Mr. J Jacobs Employer (Chairperson)
Ms. AM Griesel Employer
Mr. J Paige SAMWU
Mr J Saayman SAMWU
Mr. J Nomdo SAMWU
Mr S Sibotoboto SAMWU
Ms. S Motha SAMWU
Mr. M Saayman SAMWU
Ms E Hobson IMATU
Ms M Kiewiets IMATU
Mr F Rust IMATU
Mr H Abrahams IMATU
Table 43.: Labour Forum
2.6.4 Mayoral Outreaches The Mayoral Outreaches gives further effect and concrete expression to participatory democracy so
that communities can exercise their rights to be heard, and assist with the national effort to build a
better life for all.
It is a platform for enhancing dialogue and interaction between senior government executives and
ordinary people and provides an opportunity for government to communicate its programmes and
progress directly to the people. It also promotes participation of the public in the programmes to
improve their lives. Interaction through the Mayoral Outreaches highlights particular problems needing
attention, blockages in implementation of policy, or policy areas that may need review. It draws public
input into how best to tackle challenges and gives Council and Senior Management direct access to
what people say and feel about government and service delivery, to listen to their concerns, their
grievances and advice about the pace and direction of government’s work.
The table below provides the details of the Mayoral Outreaches that were held during the 2014/15
financial year:

CHAPTER 2 – GOOD GOVERNANCE
29 | P a g e
HESSEQUA MUNICIPALITY 2014/15 ANNUAL REPORT
Date of events Place where event was held
01/09/2014 Jongensfontein , Still Bay , Melkhoutfontein
02/09/2014 Gouritsmond /Albertinia
04/09/2014 Witsand
Slangrivier
09/10/2014 Heidelberg
14/10/2014 Albertinia Town Hall
20/10/2014 Jongensfontein, Still Bay
21/10/2014 Gouritsmond, Albertinia Theronsville
27/10/2014 Witsand
Slangrivier
28/10/2014 Riversdale
13/04/2015 Kwanokuthula
14/04/2015 Heidelberg Duivenhoks Community Hall
16/04/2015 Witsand, Slangrivier
21/04/2015 Gouritsmond, Albertinia Theronsville
23/04/2015 Jongensfontein, Still Bay, Melkhoutfontein
28/04/2015 Riversdale
30/04/2015 Heidelberg Town Hall
04/05/2015 Albertinia Town Hall
05/05/2015 Kwanokuthula
07/05/2015 Slangrivier
Table 44.: Mayoral Outreaches during 2014/15
COMPONENT D: CORPORATE GOVERNANCE
Corporate governance is the set of processes, practices, policies, laws and stakeholders affecting the
way an institution is directed, administered or controlled. Corporate governance also includes the
relationships among the many stakeholders involved and the goals for which the institution is governed.
2.7 Risk Management
The Municipality is required by the Municipal Finance Management Act (No 56 of 2003) to have a risk
management system in place. The legislation specifically reads under section 62 as follows:
(1) The Accounting Officer of a municipality is responsible for managing the financial administration of
the municipality, and must for this purpose take all reasonable steps to ensure - (c) that the municipality

CHAPTER 2 – GOOD GOVERNANCE
30 | P a g e
HESSEQUA MUNICIPALITY 2014/15 ANNUAL REPORT
has and maintains effective, efficient and transparent systems - (i) of financial and risk management
and internal control
In this regard the Provincial Treasury's Governance Unit has provided support and helped Hessequa
develop a Risk Management Strategy, Policy and Implementation Plan. The Head of Strategic Services
has been tasked to take responsibility for Enterprise Risk Management and the Senior Management
Team is assigned as the Risk Oversight Committee. In addition, they are also the Risk Champion for
their Department. Hessequa Local Municipality has thus made great strides in developing and advancing
Risk Management in the 2014/15 financial year as a fully functional Risk Management System have
been developed.
2.8 Anti-Fraud and Anti-Corruption
Section 83(c) of the MSA refers to the implementation of effective bidding structures to minimize the
possibility of fraud and corruption and the Municipal Finance Management Act (MFMA), section 112(1)
(m)(i) identify supply chain measures to be enforced to combat fraud and corruption, favouritism and
unfair and irregular practices. Section 115(1) of the MFMA states that the accounting officer must take
steps to ensure mechanisms and separation of duties in a supply chain management system to minimize
the likelihood of corruption and fraud.
a) Developed Strategies
Name of strategy Developed
Yes/No Date Adopted/Reviewed
Anti-corruption strategy Yes July 2007
Table 45.: Strategies developed
b) Implementation of Strategies
Strategies to implement Key Risk Areas Key measures to curb corruption and fraud
Fraud Hotline All fraud related risks as identified
in the municipal risk register
24/7 Fraud / Corruption Hotline that is ready to receive any reports
of possible fraudulent activities
Table 46.: Strategies implemented

CHAPTER 2 – GOOD GOVERNANCE
31 | P a g e
HESSEQUA MUNICIPALITY 2014/15 ANNUAL REPORT
2.9 Audit Committee
Section 166(2) of the MFMA states that an audit committee is an independent advisory body which
must - (a) advise the municipal council, the political office-bearers, the accounting officer and the
management staff of the municipality, on matters relating to –
internal financial control;
risk management;
performance Management; and
effective Governance.
a) Functions of the Audit Committee
The Council decided on 22 July 2010 that the Audit Committee will also act as the Performance
Committee. Their main functions include:
To advise the Council on all matters related to compliance and effective governance.
To review the annual financial statements to provide Council with an authoritative and credible
view of the financial position of the municipality, its efficiency and its overall level of compliance
with the MFMA, the annual Division of Revenue Act (DoRA) and other applicable legislation.
Respond to the council on any issues raised by the Auditor-General in the audit report.
To review the quarterly reports submitted to it by the internal audit.
To evaluate audit reports pertaining to financial, administrative and technical systems.
The compilation of reports to Council, at least twice during a financial year.
To review the performance management system and make recommendations in this regard to
Council.
To identify major risks to which Council is exposed and determine the extent to which risks
have been minimised.
To review the annual report of the municipality.
Review the plans of the Internal Audit function and in so doing; ensure that the plan addresses
the high-risk areas and ensure that adequate resources are available.
Provide support to the Internal Audit function.
Ensure that no restrictions or limitations are placed on the Internal Audit section.
Evaluate the activities of the Internal Audit function in terms of their role as prescribed by
legislation.
In terms of Section 14(4) (a) of the Regulations the performance audit committee has the responsibility
to -
i. review the quarterly reports produced and submitted by the internal audit process;
ii. review the municipality’s performance management system and make recommendations in this
regard to the council of the municipality; and
iii. at least twice during each financial year submit a performance audit report to the council of
the municipality.

CHAPTER 2 – GOOD GOVERNANCE
32 | P a g e
HESSEQUA MUNICIPALITY 2014/15 ANNUAL REPORT
b) Members of the Audit Committee
Name of representative Capacity Meeting dates
Prof. JA Döckel Chairperson 28 August 2014
28 August 2014 (Financial Statements)
19 November 2014
26 February 2015
9 April 2015 (Budget)
28 May 2015
Prof. PJ du Plessis Member (Performance)
Mr. KG Herbst Member
Mr. FH Zietsman Member
Mrs. S van Jaarsveld Member
Table 47.: Members: Audit Committee
2.10 Internal Auditing
Section 165 (2) (a), (b) (iv) of the MFMA requires that:
The internal audit unit of a municipality must –
a) prepare a risk based audit plan and an internal audit program for each financial year; and
b) advise the accounting officer and report to the audit committee on the implementation on the
internal audit plan and matters relating to:
c) risk and risk management.
The Internal Audit function is performed internally and consists of two staff members.
a) Annual Audit Plan
The Risk Based Audit Plan for 2014/2015 was implemented 100% with available resources. The table
below provides detail on audits completed:
Description No of Hours
Date completed
Phase 1
Revisiting current risk profile and priorities 80 May 2014
Phase 2
Compiling Risk Based Audit Plan 20 May 2014
Phase 3
Audit Engagement Departmental
System Detail
No of Hours
Date completed
Labour Relations Corporate Services
The following controls and processes have been checked:
1.Trial
2.Compliance with code of conduct
3.Staff Wellness Program
160 July 2014

CHAPTER 2 – GOOD GOVERNANCE
33 | P a g e
HESSEQUA MUNICIPALITY 2014/15 ANNUAL REPORT
Description No of
Hours Date completed
4.Labour forum
Budgets Financial Services
The following controls and processes have been checked.
1. Monthly Budget reporting
2.Trained staff
3. Compliance with deadlines.
4.Budget planning schedule
120 August 2014
Environment Planning
The following controls
and processes have been checked.
1.River Management
2.Law Enforcement
3.Cooperation with stakeholders
4.Prosecution
160
September 2014
Driving License Community Safety and Housing
The following controls and processes have been checked.
1. Qualified Personnel
2. Compliance with legislation
3. System controls
4. Documentation
controls
160 October 2014
Buildings Technical and Civil Services
The following controls and processes have been checked.
1.Buildings maintenance plan
2.Staff capacity
3.Budget
4.Conservation
5.Sub contractors
160 November 2014
IDP Municipal manager
The following controls and processes have been checked.
1.Updated master
planning
2.Approved process plan
3.Performance
management system
4. Budget process
160 January 2015

CHAPTER 2 – GOOD GOVERNANCE
34 | P a g e
HESSEQUA MUNICIPALITY 2014/15 ANNUAL REPORT
Description No of
Hours Date completed
Committee and board of support services
Corporate Services
The following controls and processes have been checked.
1. Municipal Manager approval
2. Year plan
3. Collaborator
4. Departmental management
5. Reminding emails
160 February 2015
Cemeteries Technical and Civil Services
The following controls and processes have been checked.
1.Identifying alternative site
2.Planning ahead
3.Work programs
4.Access control
5.Staff capacity
160 March 2015
Expenses Financial Services
The following controls and processes have been checked.
1. Internal control
2. Disciplinary procedures actions
120 April 2015
Law Enforcement Community, Safety and Housing
The following controls and processes have been checked.
1. Legislation 2. Law
Enforcement 3. Awareness 4. Involvement of
the community through platforms
120 May 2015
Follow-up audits Various Follow up on audits above
120 June 2015
Total Hours 1 740
Table 48.: Internal Audit Coverage Plan
Below are the functions of the Internal Audit Unit that was performed during the financial year under
review:

CHAPTER 2 – GOOD GOVERNANCE
35 | P a g e
HESSEQUA MUNICIPALITY 2014/15 ANNUAL REPORT
Function Date/Number
Risk analysis completed/reviewed November 2014
Risk based audit plan approved for 2015/16 financial year
28 May 2015
Internal audit programme drafted and approved 10
Number of audits conducted and reported on 10
Audit reports included the following key focus areas:
Internal controls
Accounting procedures and practices
Risk and risk management
Performance management
Loss control
Compliance with the MFMA and other legislation
Table 49.: Internal Audit Functions
2.11 By-laws
Section 11 of the MSA gives a Council the executive and legislative authority to pass and implement
by-laws and policies.
Below is a list of all the by-laws currently in force and not amended during the financial year:
By-laws in force and not amended in 2014/2015
Waste Water Management
Electricity Supply
Commonage
Disposal of solid waste
Sport Facilities
Airfields
Water and Sanitation
Cemeteries and crematoria
Air pollution
Fencing and Fences
Impoundment of animals
Irrigation water
Outdoor advertising
Public Amenities
Public Buses and Taxi’s
Prevention of Public Nuisance and Public Nuisances arising from the keeping of animals
Roads and Streets

CHAPTER 2 – GOOD GOVERNANCE
36 | P a g e
HESSEQUA MUNICIPALITY 2014/15 ANNUAL REPORT
By-laws in force and not amended in 2014/2015
Street trading
Storm water management
Water supply, sanitation and industrial effluent
Fire works
River Management
Heritage resources and cultural institutions
Order rules relating to meetings
Fire safety
Events
Table 50.: By-laws inforce and not amended
Below is a list of all the by-laws reviewed and adopted with amendments, during the financial year:
By-laws revised Date
adopted/reviewed by Council
Public Participation Conducted Prior to
adoption of By-Laws
Yes/No
Date of Publication in Government Gazette
Liquor trading hours 26/05/2015 Yes 30/06/2015
Table 51.: By-laws adopted with amendments
Below is a list of all the policies developed and reviewed during the financial year:
Policies developed/ revised Date adopted Approved by Council
Yes/No
Indiensneming op n 5/8 basis August 2015 Yes
E mail policy March 2015 Yes
Record management policy March 2015 Yes
Saal beleid May 2015 Yes
Opleidings en ontwikkelingsbeleid June 2015 Yes
Verlofbeleid June2015 Yes
Eiendomsadministrasiebeleid June 2015 Yes
Corporate govertnance of ICT policy framework
June 2015 Yes
Cash management Policy May 2015 Yes
Asset Management Policy 28 May 2015 Yes
Liquidity Policy 28 May 2015 Yes
Borrowing funds and reserves Policy
28 May 2015 Yes

CHAPTER 2 – GOOD GOVERNANCE
37 | P a g e
HESSEQUA MUNICIPALITY 2014/15 ANNUAL REPORT
Policies developed/ revised Date adopted Approved by Council
Yes/No
Municipal Supply Chain Management Policy
28 May 2015 Yes
Property Rates Policy 28 May 2015 Yes
Credit Control and Debt Collection Policy
28 May 2015 Yes
Principals and Policy on tariffs and free basic services
28 May 2015 Yes
Selfoontoelae en gebruik deur amptenare
Augustus 2014 Yes
Indiensneming op n 5/8 basis August 2015 Yes
Table 52.: Policies
2.12 Communication
Local government has a legal obligation and a political responsibility to ensure regular and effective
communication with the community. The Constitution of the Republic of South Africa Act 1996 and
other statutory enactments all impose an obligation on local government communicators and require
high levels of transparency, accountability, openness, participatory democracy and direct
communication with the communities to improve the lives of all.
The communities, on the other hand, have a right and a responsibility to participate in local government
affairs and decision-making and ample provision is made in the abovementioned legislation for them to
exercise their right in this respect. Our democratic government is committed to the principle of Batho
Pele and this, in simple terms, means that those we elect to represent us (councillors at the municipal
level) and those who are employed to serve us (the municipal officials at municipal level) must always
put people first in what they do.
South Africa has adopted a system of developmental local government, which addresses the
inequalities, and backlogs of the past while ensuring that everyone has access to basic services, to
opportunities and an improved quality of life.
To be successful, communications must focus on the issues that are shown to impact on the residents’
perceptions, quality of service, value for money and efficiencies. They should ideally look to close the
communication-consultation loop, i.e. tell people how they can have a say and demonstrate how those
who have given their views have had a real impact.
Below is a communication checklist of the compliance to the communication requirements:

CHAPTER 2 – GOOD GOVERNANCE
38 | P a g e
HESSEQUA MUNICIPALITY 2014/15 ANNUAL REPORT
Communication activities Yes/No
Communication unit Yes
Communication strategy Yes, the communication strategy forms part of the communication policy
Communication Policy Yes
Communication Satisfaction Survey Yes
Functional complaint management systems
No
Newsletters distributed at least quarterly
Yes – monthly newsletter
Table 53.: Communication Activities
2.13 Website
A municipal website should be an integral part of a municipality’s communication infrastructure and
strategy. It serves as a tool for community participation, improves stakeholder involvement and
facilitates stakeholder monitoring and evaluation of municipal performance. Section 75 of the MFMA
requires that the municipalities place key documents and information on their website, including the
IDP, the annual budget, adjustments budgets and budget related documents and policies.
Below is a website checklist to indicate the compliance to Section 75 of the MFMA:
Documents published on the Municipal website
Published
Yes/No
Current annual and adjustments budgets and all budget-related documents, including SDBIP
Yes
Tariff policy Yes
Credit control policy Yes
Rates policy Yes
SCM policy Yes
Annual report for 2013/14 Yes
Annual Financial Statements for 2013/14 Yes
All service delivery agreements for 2014/15 All service delivery agreements received
from the departments were placed on the Hessequa website
All supply chain management contracts above the prescribed value for 2014/15
Yes
Performance agreements required in terms of section 57 (1) (b) of the Municipal Systems Act for 2014/15
Yes
All quarterly reports tabled in the council in terms of section 52 (d) of the MFMA during 2014/15
Yes
Table 54.: Website Checklist

CHAPTER 2 – GOOD GOVERNANCE
39 | P a g e
HESSEQUA MUNICIPALITY 2014/15 ANNUAL REPORT
2.14 Supply Chain Management
2.14.1 Competitive Bids in Excess of R200 000 a) Bid Committee
The following table details the number of bid committee meetings held for the 2014/15 financial
year:
Bid Specification Committee Bid Evaluation Committee Bid Adjudication Committee
34 45 38
Table 55.: Bid Committee Meetings
The attendance figures of members of the bid specification committee are as follows:
Member Attendance
H. Visser 27 (79.41%)
F. Bergh 29 (85.29%)
A. Riddles 32 (94.12%)
A. Carelse 28 (82.35%)
R. Bent (Seconded) 2 (100%)
Table 56.: Attendance of members of bid specification committee
The attendance figures of members of the bid evaluation committee are as follows:
MR. R.R. WESSO - TECHNICAL SERVICES
Member Attendance
R. Wesso 5
R. Van Rooi 6
A. Carelse 19
S. Kennedy 3
N. Daries 3
N. La Grange 15
B. van Deventer 1
A. Hansen 1
H. Thesner 4
J. Vermeulen 4
J. Solomons 4
MS. L. VILJOEN - FINANCIAL SERVICES

CHAPTER 2 – GOOD GOVERNANCE
40 | P a g e
HESSEQUA MUNICIPALITY 2014/15 ANNUAL REPORT
Member Attendance
A. Carelse 5
C. Oosthuizen 2
P. Mostert 2
T. Maddison 1
J. Heunis 3
N. La Grange 5
B. Van Deventer 1
L. Saayman 2
MS. A.M GRIESEL - CORPORATE SERVICES
Member Attendance
M. Cronje 1
L. Kleynhans 1
A. Carelse 12
S. Geldenhuys 1
N. La Grange 11
A. Kleynhans 7
J. Morwagaye 1
J.S. Smit 1
E. Smit 1
D. Joubert 1
MR. C. ONRUST – SOCIAL DEVELOPMENT, HOUSING & PROTECTION SERVICES
Member Attendance
C. Onrust 1
A.R. Voss 1
N. Muller 1
N. Esau 1
M. Dyason 1
A. Carelse 3
N. La Grange 2
N. Daries 1
MR. H. VISSER – PLANNING AND ENVIRONMENTAL SERVICES
Member Attendance
S. Carelse 3
A. Carelse 3
N. La Grange 3

CHAPTER 2 – GOOD GOVERNANCE
41 | P a g e
HESSEQUA MUNICIPALITY 2014/15 ANNUAL REPORT
MR. J. JACOBS – INFORMATION TECHNOLOGY
Member Attendance
J. Kleinhans 2
N. La Grange 1
A. Carelse 1
H.J. Pienaar 1
B. van Deventer 1
Table 57.: Attendance of members of bid evaluation committee
The attendance figures of members of the bid adjudication committee are as follows:
Member Attendance
L. Viljoen 3 (7.9%)
T. Maddison 38 (100%)
R. Bent 36 (94.74%)
L. Saayman 34 (89.47%)
J. Booysen (acted as secondi when there was no quorum present)
6 (100%)
Table 58.: Attendance of members of bid adjudication committee
The percentages as indicated above include the attendance of those officials acting in the position of a
bid committee member.
b) Awards Made by the Bid Adjudication Committee
The ten highest bids awarded by the bid adjudication committee are as follows:
Bid number Title of bid Directorate and section
Successful Bidder
Value of bid awarded (Vat
Excl.)
HES-EL 03/1415 SUPPLY AND DELIVERY OF 1 NEW FREFUSE COMPACTOR
Technical Services
SHORTS NISSAN CC 1 222 809.00
HES-SSPO 08/1415 UPGRADING OF ALOERIDGE
STORMWATER IN RIVERSDALE
Technical Services
MOVE IT CIVILS 1 222 980.00
HES-EL 07/1415
IMPLEMENTATION OF ENERGY SAVING MESURES
AND INITIATIVES FOR HESSEQUA MUNICIPALITY: HEAT PUMP INSTALLATION
Technical Services
GARDEN ROUTE COOLING CC
1 529 501.00
`HES-WRS 05/1415 UPGRADING OF STILL BAY
WWTW & ALBERTINIA WWTW INLET WORKS
Technical Services
KHUBEKA CONSTRUCTION
3 695 015.5
HES-EL 08/1415
IMPLEMENTATION OF ENERGY SAVING MESURES
AND INITIATIVES FOR HESSEQUA MUNICIPALITY:
AIR-CONDITIONING INSTALLATION
Technical Services
ANIL M JESSA CC T/A DHANESH
ELECTRICAL & MECHANICAL
752 677.00

CHAPTER 2 – GOOD GOVERNANCE
42 | P a g e
HESSEQUA MUNICIPALITY 2014/15 ANNUAL REPORT
Bid number Title of bid Directorate
and section
Successful
Bidder
Value of bid
awarded (Vat Excl.)
HES-EL 09/1415
IMPLEMENTATION OF ENERGY SAVING MESURES
AND INITIATIVES FOR HESSEQUA MUNICIPALITY:
STREET AREA AND BUILDING LIGHTING LAMPS
Technical Services
MDL ELECTRICAL 570 175.00
HES-FIN 05/1415 MANAGEMENT OF SHORT
TERM INSURANCE PORTFOLIO
Financial Services
INDWE RISK SERVICES (PTY) LTD
900 970.00
HES-EL 04/1415 SUPPLY AND DELIVERY OF
ONE NEW SIX CUBIC METER TIPPER TRUCK
Technical Services
SHORTS NISSAN CC 687 074.95
HES-SSPO 10/1415 CONSTRUCTION OF A NEW
SIDEWALK IN KWANOKUTHULA (EPWP)
Technical Services
SR CIVIL CONTRACTORS (PTY)
LTD 465 758.05
HES-FIN 03/1415
TARIFF STRUCTURE INVESTIGATION AND
REVIEW AND UPDATED OF THE PROERTY RATES;
CREDIT CONTROL AND DEB COLLECTION; TARIFF
POLICIE4S AND BY-LAWS AND THE IDIGENT SUPPORT
POLICY
Technical Services
I @ CONSULTING (PTY) LTD
441 500.00
Table 59.: Ten highest bids awarded by bid adjudication committee
c) Awards Made by the Accounting Officer
Bids awarded by the Accounting Officer are as follows:
Bid number Title of bid Directorate and
section
Value of bid awarded
R ( EXCL. VAT)
HES-EL 01/1415
SUPPLY, INSTALLATION AND COMMISSIONING
STILL BAY WEST 66/11KV SUBSTATION
Technical Services 15 757 523.76
Table 60.: Awards made by Accounting Officer
d) Objections lodged by aggrieved bidders
Four (4) objections were lodged by aggrieved bidders on awards made in terms of regulation 49 of
the Municipal Finance Management Act: Supply Chain Management Regulations of 2005 of which
zero (0) the objections were successful.
e) Awards Made to Historically Disadvantaged Individuals (HDI’s), IN GENERAL and
Enterprises within the HESSEQUA Municipal Area
The following tables details the value of competitive bids awarded to historically disadvantaged
individuals (HDI owners) in general, as well as enterprises within the Hessequa municipal area
during the 2014/13 financial year:

CHAPTER 2 – GOOD GOVERNANCE
43 | P a g e
HESSEQUA MUNICIPALITY 2014/15 ANNUAL REPORT
Number of contracts awarded
Number of
contracts awarded to
wholly or partly owned HDI companies
Amount of
contracts awarded to
wholly or partly owned HDI companies
Number of contracts
awarded to local companies
Amount of contracts
awarded to local companies)
46 37 1 929 176.77 11 1 678 138.15
Table 61.: HDI Bid Awards
2.14.2 Deviations from normal procurement processes The following table provides a summary of deviations approved on an annual and monthly basis
respectively:
Type of deviation Number of deviations Value of deviations
R
Percentage of total deviations value
<R2 000 283 R 263 949 2.22%
Sole Supplier 0 R 0 0%
Emergency 47 R 33 445 0.28%
Exceptional Circumstances 236 R 230 504 1.94%
R2 000 – R30 000 178 R 1 537 697 12.96%
Sole Supplier 6 R 75 356 0.64%
Emergency 20 R 159 161 1.34%
Exceptional Circumstances 152 R 1 303 180 10.98%
R30 000 – R200 000 47 R 2 811 500 24.77%
Sole Supplier 4 R 141 281 1.32%
Emergency 11 R 311 106 4.34%
Exceptional Circumstances 32 R 2 359 113 19.11%
>R200 000 4 R 7 125 241 60.05%
Exceptional Circumstances
4 R 7 125 241 60.05%
486 R 11 738 387 100%
Table 62.: Summary of deviations

CHAPTER 3 – SERVICE DELIVERY PERFORMANCE
44 | P a g e
HESSEQUA MUNICIPALITY 2014/15 ANNUAL REPORT
Chapter 3:
Service Delivery Performance

CHAPTER 3 – SERVICE DELIVERY PERFORMANCE
45 | P a g e
HESSEQUA MUNICIPALITY 2014/15 ANNUAL REPORT
CHAPTER 3
3.1 Overview of Performance within Hessequa Municipality
Performance Management is a process which measures the implementation of the municipality’s strategy.
It is also a management tool to assist the municipality with planning, monitoring, measuring and
reviewing of performance indicators to ensure effective and efficient service delivery.
3.1.1 LEGISLATIVE REQUIREMENTS The Municipal Systems Act (MSA) 2000 requires municipalities to establish a performance management
system. Further, the MSA and the Municipal Finance Management Act (MFMA) requires the Integrated
Development Plan (IDP) to be aligned to the municipal budget and to be monitored for the performance
of the budget against the IDP via the Service Delivery Budget Implementation Plan (SDBIP).
In terms of section 46(1) (a) a municipality must prepare for each financial year a performance report
reflecting –
i. The performance of the municipality and of each external service provider during that financial
year;
ii. A comparison of the performances referred to in paragraph (i) with targets set for and
performances in the previous financial year; and
iii. Measures taken to improve performance.
3.1.2 PERFORMANCE MANAGEMENT WITHIN HESSEQUA MUNICIPALITY
A) Performance Management System
The Performance Management System (PMS) of the municipality is the institutional system that is
employed to develop, monitor and evaluate performance of the municipality. The performance
management process of Hessequa Municipality is integrated with the IDP and budget. The IDP is the
municipal planning stage and the performance management is the implementation, monitoring and
evaluation of the IDP.
The reviewed 2012 – 2017 IDP and the Budget for 2014/15 was approved by Council on 27 May 2014.
The SDBIP for 2014/15 was approved by the Executive Mayor on 04 June 2014. Performance agreements
with Senior Managers were signed on 31 July 2014 and placed on the municipal website.
Key Performance Indicators (KPI’s) are developed for the Municipal Manager and each Senior Manager
reporting to the Municipal Manager. The KPI’s are annual measures relating to either a Service Delivery
Target or a Financial Revenue or Expenditure target.

CHAPTER 3 – SERVICE DELIVERY PERFORMANCE
46 | P a g e
HESSEQUA MUNICIPALITY 2014/15 ANNUAL REPORT
Hessequa Municipality utilizes an electronic web based system on which the users update actual
performance on a monthly basis, documenting the actual performance, performance comment and
remedial actions in the instances were performance targets were not met. A portfolio of evidence is
maintained to support actual performance results updated.
B) Monitoring and Evaluation of Performance within Hessequa Municipality
Performance is monitored and evaluated via the SDBIP and the process can be summarised as follows:
Two formal performance evaluations (in terms of the signed performance agreements – Mid Year
and Final);
Two informal performance evaluations (quarter 1 and 3); and
Internal Audit compiles quarter performance reports. The findings are reported to the
Performance Audit Committee, bi-annually
3.2 Actual Strategic and Municipal Performance for 2014/15
3.2.1 OVERVIEW OF ACTUAL PERFORMANCE FOR 2014/15 The purpose of strategic performance reporting is to report specifically on the implementation and
achievement of IDP outcomes. This section aims to provide an overview on the strategic achievement
of the municipality in terms of strategic intent and deliverables as stated in the IDP.
In the paragraphs below the performance achieved is illustrated according to the strategic objectives as
set out in the IDP.
The following table explains the method by which the overall assessment of actual performance against
targets set for the key performance indicators (kpi’s) of the SDBIP is measured:
Figure 1. : SDBIP Measurement Categories

CHAPTER 3 – SERVICE DELIVERY PERFORMANCE
47 | P a g e
HESSEQUA MUNICIPALITY 2014/15 ANNUAL REPORT
The graphs below display the overall performance, per strategic objective (as set out in the IDP) for the
2014/15 financial year:
Graph 1.: Overall performance per National Key Performance Area

CHAPTER 3 – SERVICE DELIVERY PERFORMANCE
48 | P a g e
HESSEQUA MUNICIPALITY 2014/15 ANNUAL REPORT
3.2.2 DETAIL PERFORMANCE PER STRATEGIC OBJECTIVE FOR 2014/15
Accountable Local Authority
Ref KPI Unit of
Measurement
Quarterly Target Overall Performance for 2014/15
Q1 Q2 Q3 Q4
Targ
et
Act
ual
R Corrective Measures
TL1 Development of a Performance Management Policy
Number of 0 0 0 1 1 1 G None
TL2 Development of Integrated Strategic Framework
Number of 0 0 0 1 1 1 G None
TL3 Establishment of ICT Disaster Recovery(DR) Site
Number of 0 0 0 1 1 1 G None
TL4 Annual Software licensing audit Number of 0 0 0 1 1 1 G None
TL5 Submission of ICT Governance Framework for approval by Council
Number of 0 0 0 1 1 1 G None
TL6 Implementation of Domain Group Policies
Number of 0 1 0 0 1 1 G None
TL7 Development of Area Plans for Kwanokuthula, Melkhoutfontein and Bitouville
Number of 0 2 0 0 2 4 B None
TL8 Compiling the IDP 2014/2015 Executive Summary
Number of 0 0 1 0 1 1 G None
TL12 Maintain a Vacancy Rate of less than 10% of budgeted staff establishment
% Vacancy Rate
10% 10% 10% 10% 10% 6.23% B None

CHAPTER 3 – SERVICE DELIVERY PERFORMANCE
49 | P a g e
HESSEQUA MUNICIPALITY 2014/15 ANNUAL REPORT
TL13 Organisational Review of Resorts and Public Safety Functions
Number of reports submitted to Portfolio Committee Meeting
0 0 0 1 1 1 G None
TL17 Review of Client Service Standards Number of review reports submitted to Portfolio Committee Meeting
1 0 0 0 1 1 G None
TL18 Submit a Liquidity Report of the Municipality to the Financial Portfolio Committee by end November 2014.
Number of liquidity reports submitted to Portfolio Committee
0 1 0 0 1 1 G None
TL19 Submit a report on Borrowing Funds and Reserves to the Financial Portfolio Commitee
Number of borrowing and reserve funds reports submitted to Portfolio Committee
0 1 0 0 1 1 G None
TL20 Management of Income thresholds higher than 95%
% Income 95% 0% 0% 0% 95% 98.25% G2 None
TL22 Evaluate land use applications within 60 days after receipt of all outstanding and relevant information and documents
% applications evaluated
90% 90% 90% 90% 90% 100% G2 None

CHAPTER 3 – SERVICE DELIVERY PERFORMANCE
50 | P a g e
HESSEQUA MUNICIPALITY 2014/15 ANNUAL REPORT
TL23 Approve/reject building plans within 30 days for buildings less than 500m2 and 60 days for buildings larger than 500m2 after all information required is correctly submitted
% of plans evaluated
90% 90% 90% 90% 90% 99.08% G2 None
TL27 Submission of reviewed Human Settlements Plan to Executive Mayoral Committee
Number of 0 0 0 1 1 0 R The Human Settlements Plan will be revised with assistance of the Provincial Human Settlements and Environmental Planning Departments
TL28 Development of a HCE Implementation Plan
Number of 1 0 0 0 1 1 G None
TL29 Development of a database of all outstanding transfers of pre - 1994 housing schemes, in the Hessequa region
Number of 0 1 0 0 1 1 G None
TL35 Limit Water losses to 30% % unaccounted water
0% 0% 0% 30% 30% 34.50% R The first step to lower the total volume of water lossses is to ensure that all bulk measuring devices are in place and in good working order. A current programme is in place where all bulkmeters are replaced or installed. Longterm measures include a pipe replacement programme as well as meters at all consumering points.
TL36 Limited Electricity losses to 10% % unaccounted electricity
0% 0% 0% 10% 10% 9.68% B None
TL40 Monthly Head and Sups progress meetings
Number of meetings held
3 2 2 3 10 8 O Only 8 meetings took place in 2014/15 financial year. A contributing factor was the resignation of the Head Civil Planning and Project Management
Table 63.: Actual performance for 2014/15 for the strategic objective : Accountable Local Authority

CHAPTER 3 – SERVICE DELIVERY PERFORMANCE
51 | P a g e
HESSEQUA MUNICIPALITY 2014/15 ANNUAL REPORT
Safe Communities
Ref KPI Unit of
Measurement
Quarterly Target Overall Performance for 2014/15
Q1 Q2 Q3 Q4
Targ
et
Act
ual
R Departmental Corrective Measures
TL24 Achieve an average of 80% Formal Provincial audits on the Licensing Agency Services
Avarage % achieved
0% 0% 0% 80% 80% 93.30% G2 None
TL25 Traffic safety initiatives per quarter Number of initatives per quarter
3 3 3 3 12 13 G2 None
TL26 Number of integrated vehicle checkpoints per quarter
Number of integrated vehicle checkpoints per quarter
1 1 1 1 4 13 B None
Table 64.: Actual performance for 2014/15 for the strategic objective : Safe Communities
Effective Communication
Ref KPI Unit of
Measurement
Quarterly Target Overall Performance for 2014/15
Q1 Q2 Q3 Q4 Ta
rge
t
Act
ual
R Departmental Corrective Measures

CHAPTER 3 – SERVICE DELIVERY PERFORMANCE
52 | P a g e
HESSEQUA MUNICIPALITY 2014/15 ANNUAL REPORT
TL16 Complete a Public Communication Survey and submit the report to the Portfolio Committee by end November 2014
Number of reports submitted to Portfolio Committee Meeting
0 1 0 0 1 1 G None
Table 65.: Actual performance for 2014/15 for the strategic objective: Effective Communication
Social Wellbeing
Ref KPI Unit of
Measurement
Quarterly Target Overall Performance for 2014/15
Q1 Q2 Q3 Q4
Targ
et
Act
ua
l
R Departmental Corrective Measures
TL30 Establishment of the Hessequa Social Development Advisory Forum
Number of 0 1 0 0 1 1 G None
TL31 Social Development Summit Number of 1 0 0 0 1 1 G None
TL32 Review of the Social Development Plan Number of 0 0 0 1 1 1 G None
Table 66.: Actual performance for 2014/15 for the strategic objective: Social Wellbeing

CHAPTER 3 – SERVICE DELIVERY PERFORMANCE
53 | P a g e
HESSEQUA MUNICIPALITY 2014/15 ANNUAL REPORT
Heritage of Preservation
Ref KPI Unit of
Measurement
Quarterly Target Overall Performance for 2014/15
Q1 Q2 Q3 Q4
Targ
et
Act
ua
l
R Departmental Corrective Measures
TL21 Review of the State of the Environment Report (SOER) by June 2015
Number of SOER reviewed
0 0 0 1 1 1 G None
Table 67.: Actual performance for 2014/15 for the strategic objective: Heritage of Preservation
Maintenance and Development of Infrastructure
Ref KPI Unit of
Measurement
Quarterly Target Overall Performance for 2014/15
Q1 Q2 Q3 Q4
Targ
et
Act
ual
R Departmental Corrective Measures
TL14 95% Expenditure of approved budget for maintenance of Municipal properties
% budget spent
15% 40% 60% 95% 95% 93.60% O None
TL15 Development of a Municipal Property Maintenance Plan
Number of reports submitted to Mayoral Committee
0 0 1 0 1 1 G None

CHAPTER 3 – SERVICE DELIVERY PERFORMANCE
54 | P a g e
HESSEQUA MUNICIPALITY 2014/15 ANNUAL REPORT
TL33 90% Expenditure of the approved Capital Budget (Technical Department)
% capital budget spent
15% 40% 60% 90% 90% 67.17% R The high underspending on the 2014/15 capital
budget can be attributed to the following factors:
1. In the Gazette No 38613 of December 2014 Hessequa Municipality received R22 million flood damage funds plus an additional R 3,462 million MIG funding. The communication from National Treasury in March 2015 specifically stated that municipalities with additional allocation qualify for an automatic rollover should they fail to spend the additional funds
by the end of the 2014/15 financial year. The said communication was however received after approval of the municipal adjustment budget in February 2015, that included the R22 million plus R 3 462 million. The funds were subsequently rollover to the 2015/16 budget
2. The Municipality intended to call for tenders for consulting Engineers in June 2014 with the express intention of having construction tenders appointed by October 2014. The latter unfortunately didn’t realise due to appeals lodged on a previous similar tender which led
to the said tender only closing in October 2014. Further appeals on the second consulting engineering tender lead to the appointment of consultants being confirmed in December 2014. The impact of the late appointment of the consulting engineers lead to the late appointment of contractors which significantly impacted on the ability to spending the capital budget.
The scenario above eventually required the municipality to appropriate a large sum of the 2014/15 capital budget to the 2015/16 budget and
all the projects are correctly under construction with no indication of a repeat of the underspending in 2015/16.

CHAPTER 3 – SERVICE DELIVERY PERFORMANCE
55 | P a g e
HESSEQUA MUNICIPALITY 2014/15 ANNUAL REPORT
Ref KPI Unit of
Measurement
Quarterly Target Overall Performance for 2014/15
Q1 Q2 Q3 Q4
Targ
et
Act
ual
R Departmental Corrective Measures
TL34 80% Expenditure of the approved Operational Budget (Technical Department)
% Operational budget spent
20% 40% 60% 80% 80% 91% B None
TL37 Provision of waste disposal facility operation license
Number of 0 0 0 3 3 3 G None
TL38 Extension of cemeteries Albertinia and Heidelberg
Number of projects completed
0 0 0 2 2 2 G None
TL39 Temporary jobs created through EPWP (as measured in Full Time Equivalent / FTE’s)
Number of jobs created
5 5 10 15 35 43 B None
Table 68.: Actual performance for 2014/15 for the strategic objective: Maintenance and Development of Infrastructure

CHAPTER 3 – SERVICE DELIVERY PERFORMANCE
56 | P a g e
HESSEQUA MUNICIPALITY 2014/15 ANNUAL REPORT
Economic Growth
Ref KPI Unit of
Measurement
Quarterly Target Overall Performance for 2014/15
Q1 Q2 Q3 Q4
Targ
et
Act
ual
R Departmental Corrective Measures
TL9 Compile a SMME Framework for small, medium and micro enterprises and implementation Plan and submit to Portfolio Committee
Number of 0 1 0 0 1 1 G None
TL10 Compile a Commonage Framework and submit to Portfolio Committee
Number of 0 1 0 0 1 1 G None
TL11 Compile a Destination Marketing Plan and submit to Portfolio Committee
Number of 0 1 0 0 1 1 G None
Table 69.: Actual performance for 2014/15 for the strategic objective: Economic Growth

CHAPTER 3 – SERVICE DELIVERY PERFORMANCE
57 | P a g e
HESSEQUA MUNICIPALITY 2014/15 ANNUAL REPORT
3.2.3 OVERVIEW OF PERFORMANCE PER DIRECTORATE The performance statistics in the table below and all the graphs on in the following sub paragraphs
include performance in terms of the SDBIP for the 2014/15 financial year and where applicable, in
comparison to the 2013/14 financial year.
Directorates Financial
Year Total KPIs
KPIs Extremely Well Met
KPIs Well Met
KPIs Met KPIs
almost Met KPIs not
Met
Municipal Manager
2014/15 11 1 10
2013/14 40 1 2 30 1 6
Corporate Services (Admin, HR, Property Administration, Communication, Library & Legal Services)
2014/15 6 1 4 1
2013/14 35 4 10 16 1 4
Social &Economic Development, Protection Services &Housing
2014/15 9 1 2 5 1
2013/14 50 13 6 22 1 8
Financial Services 2014/15 3 1 2
2013/14 27 - 5 17 4 1
Planning& Environment
2014/15 3 2 1
2013/14 15 1 3 3 8 -
Technical Services 2014/15 8 1 1 2 1 3
2013/14 73 10 7 22 15 19
Table 70.: Summary of total performance per Directorate
3.2.4 SERVICE PROVIDERS STRATEGIC PERFORMANCE Section 76(b) of the MSA states that KPIs should inform the indicators set for every municipal entity and
service provider with whom the municipality has entered into a service delivery agreement. A service
provider:
means a person or institution or any combination of persons and institutions which provide to or
for the benefit of the local community
External service provider means an external mechanism referred to in section 76(b) which
provides a municipal service for a municipality
Service delivery agreement means an agreement between a municipality and an institution or
person mentioned in section 76(b) in terms of which a municipal service is provided by that
institution or person, either for its own account or on behalf of the municipality

CHAPTER 3 – SERVICE DELIVERY PERFORMANCE
58 | P a g e
HESSEQUA MUNICIPALITY 2014/15 ANNUAL REPORT
Hessequa Municipality rates Service Providers using a 1-5 point scale, as set out below;
Service Rating Explanation
1 Excellent Service
2 Good Service
3 Satisfactory Service
4 Bad Service
5 Recommend Blacklisting
Table 71.: Service Provider rating categories
During the year under review the municipality appointed two service providers who provided municipal
services to or for the benefit of the local community on behalf of the municipality. The details of the
service providers as set out in the table below:
Service Provider Service Agreement /
Tender Rating
Comments
Henque Waste – Recyclable Waste
Removal HES –WRS 04/1213 2.64
We receive positive feedback
from the public regarding the
services rendered by Henque
Waste. They are prompt
with the supply of recycle
statistics which enables us to
report and budget more
efficiently.
FFA Fire Operations (PTY) Ltd – Hessequa
Fire Services
BAC: 24/10/2014
Collab no: 834941 2
On average the services
rendered was of a very good
standard
Table 72.: Section 76 (b) Service providers for 2014/15
All other contract appointments are regularly monitored and ensured, that the requirements of the
contract are complied with.
3.2.4 MUNICIPAL FUNCTIONS The municipal function areas for the 2014/15 financial year are indicated below:
Municipal Function Municipal Function
Yes / No
Constitution Schedule 4, Part B functions:
Air pollution Yes
Building regulations Yes
Child care facilities No
Electricity and gas reticulation Yes
Fire fighting services No
Local tourism Yes

CHAPTER 3 – SERVICE DELIVERY PERFORMANCE
59 | P a g e
HESSEQUA MUNICIPALITY 2014/15 ANNUAL REPORT
Municipal Function Municipal Function
Yes / No
Municipal airports No
Municipal planning Yes
Municipal health services No
Municipal public transport Yes
Municipal public works only in respect of the needs of municipalities in the discharge of their responsibilities to administer functions specifically assigned to them under this Constitution or any other law
Yes
Pontoons, ferries, jetties, piers and harbours, excluding the regulation of international and national shipping and matters related thereto
Yes
Stormwater management systems in built-up areas Yes
Trading regulations Yes
Water and sanitation services limited to potable water supply systems and domestic waste-water and sewage disposal systems
Yes
Constitution Schedule 5, Part B functions:
Beaches and amusement facilities Yes
Billboards and the display of advertisements in public places Yes
Cemeteries, funeral parlours and crematoria Yes
Cleansing Yes
Control of public nuisances Yes
Control of undertakings that sell liquor to the public Yes
Facilities for the accommodation, care and burial of animals Yes
Fencing and fences Yes
Licensing of dogs Yes
Licensing and control of undertakings that sell food to the public No
Local amenities Yes
Local sport facilities Yes
Markets Yes
Municipal abattoirs Yes
Municipal parks and recreation Yes
Municipal roads Yes
Noise pollution Yes
Pounds Yes
Public places Yes
Refuse removal, refuse dumps and solid waste disposal Yes
Street trading Yes
Street lighting Yes
Traffic and parking Yes
Table 73.: Functional Areas

CHAPTER 3 – SERVICE DELIVERY PERFORMANCE
60 | P a g e
HESSEQUA MUNICIPALITY 2014/15 ANNUAL REPORT
3.3 COMPONENT A: BAS IC SERV ICES
This component includes basic service delivery highlights and challenges, including details of services
provided for water, waste water (sanitation), electricity, waste management, housing services and a
summary of free basic services.
3.3.1 WATER PROVISION
A) Introduction to Water Provision
Hessequa Municipality is in terms of the Water Act of 1998, the WSA of the region and therefore
accountable and responsible for ensuring that water services are provided to consumers. Water is
provided by the municipality to 6 towns and two settlements, Vermaaklikheid and Dennedal Garcia. The
Overberg Water Board provides the towns of Witsand, Slangrivier and Heidelberg with bulk water;
however the municipality is still responsible for ensuring provision of water services within the area of
their jurisdiction and is accountable to their citizens.
In addressing sustainable water services to the consumer, there are three major goals that the
municipality should aim to achieve.
These are:
o Delivery of sustainable water services;
o Integrated water resource management and
o Efficient and effective water services institutional arrangements
Water Service Delivery Levels
Households
Description
2014/15 2013/14
Actual Actual
No. No.
Water: (above min level)
Piped water inside dwelling or yard 13 349 10 936
Using public tap (within 200m from dwelling ) 399 455
Other water supply (within 200m) 0 0
Minimum Service Level and Above sub-total 13 748 11391
Minimum Service Level and Above Percentage 100 100
Water: (below min level)
Using public tap (more than 200m from dwelling) 0 0

CHAPTER 3 – SERVICE DELIVERY PERFORMANCE
61 | P a g e
HESSEQUA MUNICIPALITY 2014/15 ANNUAL REPORT
Water Service Delivery Levels
Households
Description
2014/15 2013/14
Actual Actual
No. No.
Other water supply (more than 200m from dwelling 0 0
No water supply 0 0
Below Minimum Service Level sub-total 0 0
Below Minimum Service Level Percentage 0 0
Total number of households 13748 11391
Include informal settlements
Table 74.: Water Service Delivery levels: Households
Employees: Water and Sewerage
Job Level
2013/14 2014/15
Employees Posts Employees
Vacancies
(fulltime
equivalents)
Vacancies (as a
% of total posts)
No. No. No. No. %
0 – 3 30 33 32 1 3%
4 – 6 31 30 30 0 0%
7 – 9 7 4 4 0 0%
10 – 12 4 5 5 0 0%
13 – 15 1 0 0 0 0%
16 – 18 0 0 0 0 0%
19 – 20 0 0 0 0 0%
Total 73 72 71 1 1%
Employees and Posts numbers are as at 30 June.
Table 75.: Employees : Water Services

CHAPTER 3 – SERVICE DELIVERY PERFORMANCE
62 | P a g e
HESSEQUA MUNICIPALITY 2014/15 ANNUAL REPORT
Capital Expenditure 2014/15: Water
R
Capital Projects
Adjusted
Budget
Actual
Expenditure
Variance from
adjusted budget Comments
Water meters
550 000 0 (550 000)
There are still enough water
meters in stock and therefore no
water meters was purchased in
the 2014/15 financial year. Funds
was shift to the 2015/16 financial
year.
Replace low
pressure water
line
201 122
28 893.62 (172, 228.38)
Due to the Upgrading of the water
networks project across Hessequa
Municipality being a three year
project only R 32 946 (VAT incl)
was spent on professional fees
and construction will commence in
the 2015/16 financial year.
Upgrading of
water supply
405 038
58 188.64 (346, 849.36)
Due to the Upgrading of the water
networks project across Hessequa
Municipality being a three year
projects only R 66 349.61 (VAT
Incl) was spent on professional
fees and construction will
commence in the 2015/16
financial year.
Replacement of
Water
aqueduct/condu
it
201 122
28 893.62 (172, 228.38)
Due to the Upgrading of the water
networks project across Hessequa
Municipality being a three year
projects only R 32 946 (VAT incl)
was spent on professional fees
and construction will commence in
the 2015/16 financial year.
Upgrading of Network
173 189 24 880.71 (148, 308.29)
Due to the Upgrading of the water
networks project across Hessequa
Municipality being a three year
projects only R 28 370 (VAT Incl)
was spent on professional fees
and construction will commence in
the 2015/16 financial year.
Replacement of Water
aqueduct/conduit
201 122 28 893.62 (172, 228.38) Due to the Upgrading of the water
networks project across Hessequa

CHAPTER 3 – SERVICE DELIVERY PERFORMANCE
63 | P a g e
HESSEQUA MUNICIPALITY 2014/15 ANNUAL REPORT
Capital Expenditure 2014/15: Water
R
Capital Projects
Adjusted
Budget
Actual
Expenditure
Variance from
adjusted budget Comments
Municipality being a three year
projects only R 32 946 (VAT incl)
will be spend on professional fees
and construction will commence in
the 2015/16 financial year.
Melkhoutfontein New Bulk Water
2 300 000 131 578.95
(2, 168, 421.05)
The consultant Engineer is
currently busy with the design
and only R150 000 (VAT incl) was
spend on fees in the 2014/15
financial year. The remaining
balance of R 2150 000 (VAT incl)
was transferred to the 2015/16 FY
and Construction will only
commence in 2015/16.
Decalcification of household
water 46 200 46 200 0
Table 76.: Capital Expenditure 2014/15: Water
3.3.2 Waste Water (Sanitation) Provision
A) Introduction to Sanitation Provision
In addressing sustainable Sanitation services delivery to the consumer, there are three major goals that
the municipality should be aim to achieve. These are:
o Integrated sanitation resource management;
o Efficient and effective sanitation services;
o Institutional arrangements and
o Ensure continuous service delivery at the required standards.
Sanitation Service Delivery Levels
Households
Description
2014/15 2013/14
Actual Actual
No. No.
Sanitation/sewerage: (above minimum level)

CHAPTER 3 – SERVICE DELIVERY PERFORMANCE
64 | P a g e
HESSEQUA MUNICIPALITY 2014/15 ANNUAL REPORT
Sanitation Service Delivery Levels
Households
Description
2014/15 2013/14
Actual Actual
No. No.
Flush toilet (connected to sewerage) 13 358 11 520
Flush toilet (with septic tank) 1 713 1 713
Chemical toilet 0 0
Pit toilet (ventilated) 74 74
Other toilet provisions (above minimum service level) 0 0
Minimum Service Level and Above sub-total 15 145 13 307
Minimum Service Level and Above Percentage 100 100
Sanitation/sewerage: (below minimum level)
Bucket toilet 0 0
Other toilet provisions (below minimum service level) 0 0
No toilet provisions 0 0
Below Minimum Service Level sub-total 0 0
Below Minimum Service Level Percentage 0 0
Total households 15145 13307
Including informal settlements
Table 77.: Sanitation Service Delivery level

CHAPTER 3 – SERVICE DELIVERY PERFORMANCE
65 | P a g e
HESSEQUA MUNICIPALITY 2014/15 ANNUAL REPORT
3.3.3 Electricity
A) Introduction to Electricity
The Hessequa Municipality adopted a Green Vision in 2008 with three key objectives, one which is to be
energy independent and carbon neutral by 2020.
Focus areas are
o To ensure that all residents have access to electricity by eradicating backlogs with the assistance
of the MIG program
o To reduce consumption by implementing the Energy Efficiency and Demand Side Management
Program, through consumer awareness and incentive programs
o To establish renewable energy sources in Hessequa to reduce our carbon footprint and become
energy neutral.
o To identify appropriate mechanisms through which council may develop its own assets and
assist the private sector to establish renewable energy projects in Hessequa which will generate
an income stream to council which will compensate for loss of revenue as a result of increased
energy efficiency.
We are driving the process on three levels:
o With our own resources- municipal land, grants, own funds.
o Combined resources-strategic partnerships with knowledge partners, of the government
departments and the private sector.
o Creating an enabling environment - encouraging and supporting private economic initiatives:
incentives, access to land and services, rebates etc.
Electricity Service Delivery Levels
Households
Description
2014/15 2013/14
Actual Actual
No. No.
Energy: (above minimum level)
Electricity (at least minimum service level) 4 333 4250
Electricity - prepaid (minimum service level) 10 224 9869
Minimum Service Level and Above sub-total 14 557 14119
Minimum Service Level and Above Percentage 100 100
Energy: (below minimum level)
Electricity (< minimum service level) 0 0
Electricity - prepaid (< min. service level) 0 0

CHAPTER 3 – SERVICE DELIVERY PERFORMANCE
66 | P a g e
HESSEQUA MUNICIPALITY 2014/15 ANNUAL REPORT
Electricity Service Delivery Levels
Households
Description
2014/15 2013/14
Actual Actual
No. No.
Other energy sources 0 0
Below Minimum Service Level sub-total 0 0
Below Minimum Service Level Percentage 0 0
Total number of households 14557 14 356
Table 78.: Electricity Service Delivery Levels
Employees: Electricity Services
Job Level
2013/14 2014/15
Employees Posts Employees Vacancies (fulltime
equivalents)
Vacancies (as a
% of total posts)
No. No. No. No. %
0 – 3 0 1 1 0 0%
4 – 6 28 27 24 3 11%
7 – 9 6 6 5 1 16%
10 – 12 8 7 7 0 0%
13 – 15 0 2 1 1 50%
16 – 18 0 0 0 0 0%
19 – 20 0 0 0 0 0%
Total 42 43 38 5 12%
Employees and Posts numbers are as at 30 June.
Table 79.: Employees : Electricity

CHAPTER 3 – SERVICE DELIVERY PERFORMANCE
67 | P a g e
HESSEQUA MUNICIPALITY 2014/15 ANNUAL REPORT
Capital Expenditure 2014/15: Electricity
Capital Projects
Adjusted
Budget
Actual
Expenditur
e
Variance
from
Adjusted
budget
Comments
Upgrading 11 KV
Main sub-station
- Riversdal
439 300 426 574.44 (12, 725.56) The budget was amended in February 2015
Upgrading of
network -
Riversdal
511 500 502 707.56 (8, 792.44) The budget was amended in February 2015
Installation of
66/11 KV Main
sub-station -
Stilbaai
16 500 000 3 706 764.99 (12 793 235)
The project was amended and due to the
transformer not being deliver on site before 30
Junie 2015, only R 3 706 764 was spend.
Upgrading of
network - Stilbaai
- West/East
558 800 545 868.93 (12, 931.07) The budget was amended in February 2015
Upgrading 11 KV
Main sub-station
- Heidelberg
442 000 428 869.80 (13, 130.2) The budget was amended in February 2015
Upgrading of sub-
stations -
Heidelberg
231 300 227 245.29 (4, 054.71) The budget was amended in February 2015
Upgrading of
network –
Heidelberg
355 900 349 772.34 (6,127.66) The budget was amended in February 2015
Upgrading of sub-
stations - Station
Road /
Theronsville
245 200 239 138.67 (6, 061.33) The budget was amended in February 2015
Kwanokuthula
Electrification 545 000 0 (545 000)
The balance will be spend in the 2015/16 financial
year.
Upgrading of sub-
stations - Witsand 245 200 239 138.67 (6, 061.33) The budget was amended in February 2015
Table 80.: Capital Expenditure 2014/15 : Electricity Services

CHAPTER 3 – SERVICE DELIVERY PERFORMANCE
68 | P a g e
HESSEQUA MUNICIPALITY 2014/15 ANNUAL REPORT
3.3.4 Waste Management (Refuse Collections, Waste Disposal, Street Cleaning and Recycling)
A) Introduction to Waste Management
The SA Constitution states that the people of South Africa have the right to an environment that is not
detrimental to human health and Local Government is assigned the responsibility for refuse removal,
refuse dumps and solid waste disposal. Therefore, all the towns in the municipal area have a solid waste
programme in place and all households are serviced once a week and all businesses at least three times
a week. Recycling at source is encouraged throughout the area.
The Waste Management goal is to optimize the waste management strategy to ensure continuous cost
effective services by also encouraging waste minimization and recycling activities to enhance in proper
management services.
Hessequa Municipality has also adopted its Green Vision to be a Zero Waste Society by 2020 and since
2008 been in partnership with a private concern for the recycling of all waste. The Hessequa Integrated
Waste Management plan was completed and approved by Council in April 2014.
Solid Waste Service Delivery Levels
Description
Households
2013/14 2014/15
Actual Actual
No. No.
Solid Waste Removal: (Minimum level)
Removed at least once a week 13 715 14 601
Minimum Service Level and Above sub-total 13 715 14 601
Minimum Service Level and Above percentage 100 100
Solid Waste Removal: (Below minimum level)
Removed less frequently than once a week 0 0
Using communal refuse dump 0 0
Using own refuse dump 0 0
Other rubbish disposal 0 0
No rubbish disposal 0 0
Below Minimum Service Level sub-total 0 0
Below Minimum Service Level percentage 0 0
Total number of households 15 873 14 601
Table 81.: Solid Waste Service Delivery Levels

CHAPTER 3 – SERVICE DELIVERY PERFORMANCE
69 | P a g e
HESSEQUA MUNICIPALITY 2014/15 ANNUAL REPORT
3.3.5 HOUSING
A) Introduction to Housing
Hessequa Municipality consists of several towns: Riversdale, Albertinia, Gouritsmond, Heidelberg,
Slangrivier, Melkhoutfontein, Stilbaai, Jongensfontein and Witsand. Housing projects have been
successfully completed in Albertinia, Gouritsmond, Riversdale, Heidelberg and Slangrivier in previous
financial years.
During the period under reporting, the following projects were completed:
Melkhoutfontein North Housing Project
The first phase for the installation of civil engineering services was approved by the Western Cape
provincial department of Human Settlements, and comprised the formalisation of an informal settlement
in Melkhoutfontein, Stilbaai.
One hundred and seventy (170) serviced sites were created – each with its own water and sanitation
facilities. The upgrade were done in line with the new A-Grade standard/level of civil engineering services
comprising of tarred roads, kerbing, subsoil stormwater drainage, water reticulation, sanitation and
electricity.
Kwanokuthula Housing Project
This project was approved by the Western Cape department of Human Settlements for forty one (41)
serviced sites and top structures (houses). The civil engineering services were also done according to the
new A-Grade standard comprising of tarred roads, kerbing, electricity, water and sanitation network to
each house connected to the municipal services network.
Both the abovementioned projects were completed in conjunction with the municipality’s housing
Implementing Agent, ASLA and their team of professionals. Additional project applications for the towns
of Heidelberg, Melkhoutfontein and Riversdale (GAP), were formulated and submitted to the Provincial
Department of Human Settlements for their consideration.
Percentage of Households Provided with access to basic housing
Year end
Total households
Provided
(including in formal and
informal settlements)
Households in formal
settlements provided
Percentage of households
provided with access to
basic housing
2013/14 455 250 54
2014/15 41 41 100
Table 82.: Percentage of Households with access to basic housing

CHAPTER 3 – SERVICE DELIVERY PERFORMANCE
70 | P a g e
HESSEQUA MUNICIPALITY 2014/15 ANNUAL REPORT
The following table shows the increase/decrease in the number of people on the housing demand
database. The demand for housing opportunities was 6 298 for the 2013/2014 financial year and for
the 2014/2015 financial year a total of 7811 as per collaborator
Table 83.: Housing Waiting List
Hessequa became part of the data cleaning project of the Western Cape department of Human
Settlement. This is a progressive process that entails the “cleaning” of data on the housing demand
database duplicated, removing of data of those that passed away, as well as removing of beneficiaries
already assisted with housing opportunities. Based on the data “cleansing” exercise, the provincial
database reflects a demand of 6 298 housing opportunities as at end June 2014.
Financial year
Allocation
Amount spent
% spent Number of
houses built Number of
sites serviced
2012/13 16 800 16 800 100 250 250
2013/14 0 0 0 0 0
2014/15 11 108 536 11 108 536 100 41 170
Table 84.: Houses built in 2014/15
Employees: Housing
Job Level
2013/14 2014/15
Employees Posts Employees Vacancies (fulltime
equivalents)
Vacancies (as a
% of total posts)
No. No. No. No. %
0 - 3 0 0 0 0 0%
4 - 6 0 0 0 0 0%
7 - 9 1 1 1 0 0%
10 - 12 2 2 2 0 0%
Financial year No of housing units on waiting list
% Housing waiting list
increase/decrease from previous
year
2012/13 6317
2013/14 6298 -0.30
2014/15 7811 24%

CHAPTER 3 – SERVICE DELIVERY PERFORMANCE
71 | P a g e
HESSEQUA MUNICIPALITY 2014/15 ANNUAL REPORT
Employees: Housing
Job Level
2013/14 2014/15
Employees Posts Employees Vacancies (fulltime
equivalents)
Vacancies (as a
% of total posts)
No. No. No. No. %
13 - 15 0 0 0 0 0%
16 - 18 0 0 0 0 0%
19 - 20 0 0 0 0 0%
Total 3 3 3 0 0%
Employees and Posts numbers are as at 30 June.
Table 85.: Employees : Housing and LED
3.3.6 FREE BASIC SERVICES AND INDIGENT SUPPORT
A) Introduction to Free Basic Services and Indigent Support
The Municipal Council must give priority to the basic needs of the community, promote the social and
economic development of the community and ensure that all residents and communities in the
Municipality have access to at least the minimum level of basic municipal services in terms of
Section152(1)(b) and 153(b) of the Constitution. To achieve the purpose it is important to set a fair
threshold level, and then to provide a fair subsidy of tariffs. The customer, in order to qualify as an
indigent, needs to complete the necessary documentation as required and agree to regulations and
restrictions stipulated by Hessequa Municipality.
The table indicates the percentage of indigent households that have access to free basic municipal
services. In accordance with the approved indigent policy of the municipality, all households earning less
than R3 500 per month will receive the free basic services as prescribed by national policy. The table,
furthermore, indicates the total number of indigent households and other households that received free
basic services in the past financial year:
Financial
year
Number of households
Total
no of
HH
(Censu
s 2011)
Free Basic
Electricity Free Basic Water
Free Basic
Sanitation
Free Basic Refuse
Removal
No.
Access %
No.
Access %
No.
Access %
No.
Access %
2014/15 14 487 4 968 34.3 4 782 33.6 4 879 33.7 4 943 34.1
Table 86.: Free basic services to indigent households

CHAPTER 3 – SERVICE DELIVERY PERFORMANCE
72 | P a g e
HESSEQUA MUNICIPALITY 2014/15 ANNUAL REPORT
Electricity
Financial year
Indigent Households Non-indigent households Households in Eskom areas
No. of
HH
Unit
per HH
(kwh)
Value No. of
HH
Unit
per HH
(kwh)
Value No. of
HH
Unit
per HH
(kwh)
Value
R R R
2014/15 4 397 50kWh 1 989 115 N/A N/A N/A 571 50kWh 241 525
Table 87.: Free basic Electricity services to indigent households
Water
Financial year
Indigent Households Non-indigent households
No. of HH Unit per
HH (kl)
Value
No. of HH Unit per
HH (kl)
Value
R R
2014/15 4 782 6kl 4 805 348 N/A N/A N/A
Table 88.: Free basic Water to indigent households
Sanitation
Financial year
Indigent Households Non-indigent households
No. of HH R value
per HH
Value
No. of HH
Unit per
HH per
month
Value
R R
2014/15 4 879 5 847 800 N/A N/A N/A
Table 89.: Free basic Sanitation to indigent households
Refuse Removal
Financial year
Indigent Households Non-indigent households
No. of HH
Service per
HH per
week
Value
No. of HH
Unit per
HH per
month
Value
R R
2014/15 4 943 Once a week
4 472 249 N/A N/A N/A
Table 90.: Free basic Refuse Removal services to indigent households

CHAPTER 3 – SERVICE DELIVERY PERFORMANCE
73 | P a g e
HESSEQUA MUNICIPALITY 2014/15 ANNUAL REPORT
Financial Performance 2014/15: Cost to Municipality of Free Basic Services Delivered
Services Delivered
2013/14 2014/15
Actual Budget R’000 Actual
R’000
Variance to
Budget
R’000
Water 5 489 4 917 4 805 111
Waste Water (Sanitation) 5 858 6 248 5 848 401
Electricity 2 107 2 478 2 231 247
Waste Management (Solid Waste) 4 526 4 4842 4 472 370
Total 17 980 18 485 17 356 1 129
Table 91.: Financial Performance 2014/15: Cost to Municipality of Free Basic Services Delivered
The purpose of the Indigent Policy is to ensure that the subsidy scheme for indigent households forms
part of the financial management system of Hessequa Municipality and to ensure that the same
procedure is followed for each individual case. The policy also emanates from the objectives determined
in Council’s anti-corruption policy.
It is therefore against the above background that the Hessequa Municipality undertakes to promote the
following principles:-
o To ensure that the portion for free basic services allocated as part of the equitable share
received annually will be utilized for the benefit of the poor only and not to subsidize rates and
services charges of those who can afford to pay;
o To link this policy with the Municipality’s Integrated Development Plan (IDP),
o Local Economic Development (LED) initiatives and poverty alleviation programmes;
o To promote an integrated approach of free basic service delivery; and
o To engage the community in the development and implementation of this policy.
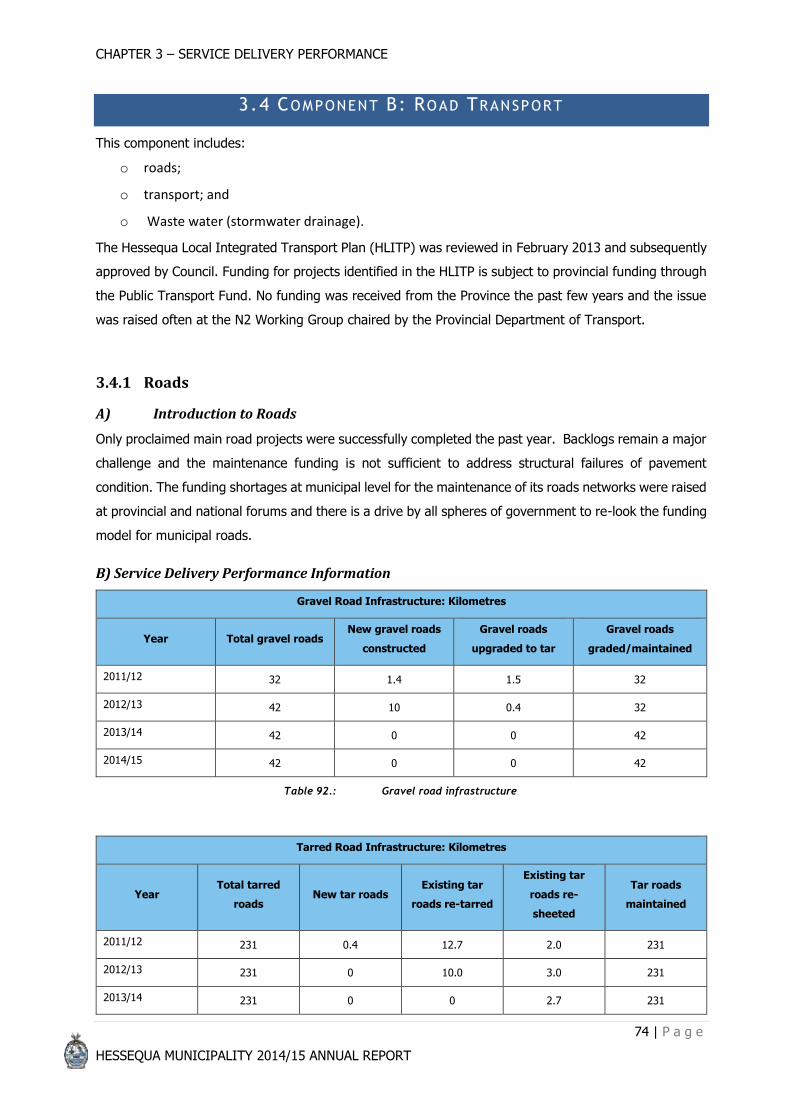
CHAPTER 3 – SERVICE DELIVERY PERFORMANCE
74 | P a g e
HESSEQUA MUNICIPALITY 2014/15 ANNUAL REPORT
3.4 COMPONENT B: ROAD TRANSPORT
This component includes:
o roads;
o transport; and
o Waste water (stormwater drainage).
The Hessequa Local Integrated Transport Plan (HLITP) was reviewed in February 2013 and subsequently
approved by Council. Funding for projects identified in the HLITP is subject to provincial funding through
the Public Transport Fund. No funding was received from the Province the past few years and the issue
was raised often at the N2 Working Group chaired by the Provincial Department of Transport.
3.4.1 Roads
A) Introduction to Roads
Only proclaimed main road projects were successfully completed the past year. Backlogs remain a major
challenge and the maintenance funding is not sufficient to address structural failures of pavement
condition. The funding shortages at municipal level for the maintenance of its roads networks were raised
at provincial and national forums and there is a drive by all spheres of government to re-look the funding
model for municipal roads.
B) Service Delivery Performance Information
Gravel Road Infrastructure: Kilometres
Year Total gravel roads New gravel roads
constructed
Gravel roads
upgraded to tar
Gravel roads
graded/maintained
2011/12 32 1.4 1.5 32
2012/13 42 10 0.4 32
2013/14 42 0 0 42
2014/15 42 0 0 42
Table 92.: Gravel road infrastructure
Tarred Road Infrastructure: Kilometres
Year Total tarred
roads New tar roads
Existing tar
roads re-tarred
Existing tar
roads re-
sheeted
Tar roads
maintained
2011/12 231 0.4 12.7 2.0 231
2012/13 231 0 10.0 3.0 231
2013/14 231 0 0 2.7 231

CHAPTER 3 – SERVICE DELIVERY PERFORMANCE
75 | P a g e
HESSEQUA MUNICIPALITY 2014/15 ANNUAL REPORT
Tarred Road Infrastructure: Kilometres
Year Total tarred
roads New tar roads
Existing tar
roads re-tarred
Existing tar
roads re-
sheeted
Tar roads
maintained
2014/15 231 0 0 0 231
Table 93.: Tarred road infrastructure
The table below shows the costs involved for the maintenance and construction of roads within the
municipal area:
Cost of Construction/Maintenance:R’000
Year Gravel Tar
New Gravel- Tar Maintained New Re-worked Maintained
2011/12 150 4 000 110 0.5 15.2 900
2012/13 5 000 150 3 000 1.5 9 000 2 000
2013/14 0.0 0.0 360 0.0 2 462 321
2014/15 0.0 0.0 137 0.0 0.00 1 233
Table 94.: Cost of construction / maintenance of roads
Employees: Roads
Job Level
2013/14 2014/15
Employees Posts Employees Vacancies (fulltime
equivalents)
Vacancies (as a
% of total posts)
No. No. No. No. %
0 - 3 16 16 15 1 6%
4 - 6 44 43 39 4 9%
7 - 9 14 14 12 2 14%
10 - 12 3 4 4 0 0%
13 - 15 0 0 0 0 0%
16 - 18 0 0 0 0 0%
19 - 20 0 0 0 0 0%
Total 76 77 70 7 9%
Employees and Posts numbers are as at 30 June.
Table 95.: Employees : Roads

CHAPTER 3 – SERVICE DELIVERY PERFORMANCE
76 | P a g e
HESSEQUA MUNICIPALITY 2014/15 ANNUAL REPORT
Capital Expenditure 2014/15: Road Transport
R
Capital
Projects
2014/15
Adjusted budget Actual
Expenditure
Variance from
adjusted
budget
Comments
Upgrading of
Sidewalks -
Paving
856 800 687 892 (168, 908.14)
The tender prices for the sidewalk project come
in much lower than the original cost estimate,
thus led to a unspent balance of R 74 000 . The
remaining unspent balance is for social and
environmental project.
Upgrading of
Streets -
Slangrivier
0 0 0 The project didn’t start due to changes in the
MIG Priorities
Stormwater &
Kerbing -
Riversdal
Rehabilitation
of pipes
0 0 0 The project didn’t start due to changes in the
MIG Priorities
STORMWATER
ALOERIDGE -
RIVERSDAL
1 736 764 1 521 883,20 (214, 880.80) It a saving on the project
Repair of
Streets
damaged by
floods -
Kwanokuthula
2 491 949 0 (2 491 949)
Hessequa Municipality received flood damage
funds only in January 2015 and therefore the
funds was rolled over to the 2015/16 financial
year
Repair Streets
damaged by
floods -
Oosthuizen Str
1 442 100 0 (1 442 100)
Hessequa Municipality received flood damage
funds only in January 2015 and therefore the
funds was rolled over to the 2015/16 financial
year
Repair Major
Stormwater
damaged by
floods - R/D
7 515 761 0 (7 515 761)
Hessequa Municipality received flood damage
funds
Only in January 2015 and therefore the funds
was rolled over to the 2015/16 financial year
Repair
Stormwater
damaged by
floods - Martin
Johnson
10 718 768 0 (10 718 768)
Hessequa Municipality received flood damage
funds only in January 2015 and therefore the
funds was rolled over to the 2015/16 financial
year
Repair of
Streets
damaged by
floods
227 500 227 500 0 Budgeted amount spent.
Repair
Stormwater 126 000 67 126.00 (58, 874) Construction will only commence in the 2015/16

CHAPTER 3 – SERVICE DELIVERY PERFORMANCE
77 | P a g e
HESSEQUA MUNICIPALITY 2014/15 ANNUAL REPORT
Table 96.: Capital Expenditure 2014/15 : Road Transport
3.4.2 Waste Water (Stormwater Drainage)
A) Introduction to Stormwater Drainage
The principles and procedures for stormwater management establishment and formalization were focused
on:
o The hydrological modelling of urban and rural drainage regions;
o The hydraulic analysis of conduits and natural waterways;
o The compilation of management scenarios;
o To identify, prioritize, find solutions and costing to upgrade sub-standard systems and
o Maintenance management
B) Service Delivery Information
The table below shows the total kilometres of stormwater maintained and upgraded as well as the
kilometres of new stormwater pipes installed:
Stormwater Infrastructure: Kilometres
Year Total Stormwater
measures
New stormwater
measures
Stormwater
measures upgraded
Stormwater
measures
maintained
2011/12 80.4 1.0 1.0 80.4
2012/13 81.4 0.7 0 82.1
2013/14 82.1 0 0 82.1
2014/15 82.1 0 0.15 82.1
Table 97.: Stormwater Infrastructure
damaged by
floods
Financial year and therefore only fees was
spend in the 2014/15 year. The project was
later adjusted to only spend R86 000 in the
2014/15 year.
New Paved
Streets -
Jongensfontei
n (300m)
80 000 30 172.98 (49, 827.02)
Construction will only commence in the 2015/16
Financial year and therefore only fees was
spend in the 2014/15 year.
1 X 5m3
Tipper - Public
Works
700 000 687 074.95 (12 925.05) The tipper was purchased and the variance is a
saving.
Reseal Main
Road 985104 0 (985 104) The project is managed by Province

CHAPTER 3 – SERVICE DELIVERY PERFORMANCE
78 | P a g e
HESSEQUA MUNICIPALITY 2014/15 ANNUAL REPORT
Stormwater Infrastructurecost:R’000
Year New Upgraded Maintained
2014/15 0.00 1 716 232
Table 98.: Cost of construction / maintenance of stormwater systems
Capital Expenditure 2014/15: Waste Water Management
R
Capital Projects
2014/15
Adjusted
Budget
Actual
Expenditure
Variance from
Adjusted
budget
Comments
Upgrading of
Bulk Sewerage 1 964 043 0 ( 1 964 043)
The Project formed part of the Consulting
Engineers tender which had an appeal
which led to final appointment by end of
February 2015. The tender was only
advertised in May 2015 and therefore the
funds could not be spend and was
transferred to the 2015/16 financial year.
Refurbishment
Sewerage Works (
Riversdale)
840 970 220 226.79 (620 743.21) The funding was for counter funding for
a MIG Project.
Refurbishment
Sewerage Works (
Riversdale)
5 647 325
5 010 347.23 (636,977.77) Project is completed.
Upgrading of
Sewerage Works
( Stilbay)
1 500 000 780 365.06 (719 634.94)
The project was adjusted to only spend
R750 000 in the 2014/15 financial year
and the remaining R750 000 was
transferred to the 2015/16 financial year
Upgrading of
Sewerage Works 200 000 0 (200 000)
The adjusted R 200 000 was transferred
to the 2015/16 financial year.
Melkhoutfontein
Bulk Sewer 2 300 000 131 578.95 (2 168 421.02)
The consultant Engineer is currently busy
with the design and was only R150 000
(VAT Incl) spend on fees in the 2014/15
financial year. The remaining balance of
R 2150 000 was transferred to the
2015/16 FY and will Construction only
commence in 2015/16.
Table 99.: Capital Expenditure 2014/15: Waste Water Management

CHAPTER 3 – SERVICE DELIVERY PERFORMANCE
79 | P a g e
HESSEQUA MUNICIPALITY 2014/15 ANNUAL REPORT
3.5 COMPONENT C: PLANNING AND LOCAL ECONOMIC DEVELOPMENT
The Department of Development Planning consists of the following three sections namely:
o Town Planning
o Building Control
o Environmental Management
The department focus primarily on the planning, design, implementation and management of public
interventions in the development and use of land from site to supranational level. The intentions of these
interventions are to widen choice, promote equity and ensure sustainable development. Individuals,
groups and communities generate within society and economic activities, which place demand on the use
of land. This department is concerned with the arrangement and allocations of these land uses and must
ensure that development will take place in a healthy and orderly way to the social and economic
advantage of the community.
3.5.1 PLANNING
A) Introduction to Planning
The following spatial development strategies have been formulated to correspond with the spatial
development objectives:
o Consolidate and integrate spatial development by developing land in proximity to public transport
facilities and existing services.
o Identifying zones of opportunity according to land needs.
o Pro-actively manage land use and set appropriate levels of service to achieve sustainability.
o Implement the principles of integrated Environmental Management
o Identify resources and manage land use in valuable resource areas.
The main focus on service delivery is the processing of land use applications and building plans and to
investigate illegal building activities. With the introduction of a new GIS system and software, most land
use applications and building plans can be processed within two weeks and finalized within three months.
B) Service Delivery Information
Applications for Land Use Development
Detail
Formalization of Townships
Rezoning Built Environment
2014/15 2013/14 2014/15 2013/14 2014/15 2013/14
Applications received 64 2 17 20 679 612

CHAPTER 3 – SERVICE DELIVERY PERFORMANCE
80 | P a g e
HESSEQUA MUNICIPALITY 2014/15 ANNUAL REPORT
Applications for Land Use Development
Detail
Formalization of Townships
Rezoning Built Environment
2014/15 2013/14 2014/15 2013/14 2014/15 2013/14
Determination made in year of receipt
19 0 8 10 679 612
Determination made in following year
0 0 0 0 0 0
Applications withdrawn 2 1 0 1 0 0
Applications outstanding at year end
39 0 9 10 0 0
Table 100.: Application for Land Use Development
Employees: Planning and Environmental Services
Job Level
2012/13 2014/15
Employees Posts Employees Vacancies (fulltime
equivalents)
Vacancies (as a
% of total posts)
No. No. No. No. %
0 - 3 1 6 1 5 83.33%
4 - 6 1 1 1 0 0%
7 - 9 5 2 2 0 0%
10 - 12 1 3 3 0 0%
13 - 15 2 4 3 1 25%
16 - 18 0 0 0 0 0%
19 - 20 0 0 0 0 0%
Total 10 16 10 6 37%
Employees and Posts numbers are as at 30 June (includes 0 additional people on learnership)
Table 101.: Employees: Planning

CHAPTER 3 – SERVICE DELIVERY PERFORMANCE
81 | P a g e
HESSEQUA MUNICIPALITY 2014/15 ANNUAL REPORT
3.5.2 LOCAL ECONOMIC DEVELOPMENT
A) Performance Highlights
Performance highlights with regard to the implementation of the LED strategy for 2014/2015 financial
year are:
Highlights Description
Incentive Policy
APPROVAL OF INCENTIVE POLICY, providing financial and non-financial
incentives to attract new business to the area and expand local businesses to
stimulate economic growth and creating employment opportunities was approved by
Council on 02 December 2014.
SMME Development & Training
initiatives
WORKS SKILLS PLACEMENT PROGRAMME
Collaboration between the Municipality, the Department of Economic Development &
Tourism and two local businesses in
Heidelberg, where twenty (20) local
unemployment youth were placed
obtain life skills and work readiness
training. During the six month
placement period at the businesses, the
learners received a stipend of R1500.00
per month.
SMME ENTREPRENEURS WEEK
Entrepreneurs week held in partnership with the Department of Economic
Development, SARS, Dept of Trade and Industry, National Youth Development
Agency (NYDA), SEFA by having small business seminars across Hessequa
Municipal Area focussing on business readiness, tender training, access to finance
and human resource management.
Table 102.: LED Highlights
AHI ENTREPRENEURIAL TRAINING

CHAPTER 3 – SERVICE DELIVERY PERFORMANCE
82 | P a g e
HESSEQUA MUNICIPALITY 2014/15 ANNUAL REPORT
An entrepreneurial training week was held in Albertinia, a partnership between the
Municipality, Albertinia Business Chambers and Afrikaanse Handelsinstituut. The focus
of the five day training programme was to train local entrepreneurs, where after training
certificates was issued to all
twenty five participants
whom completed the
programme. Local
participants were placed
post the training
programme with local
businesses as part of the
mentoring support post the
training.
INFORMAL TRADING SURVEY
A survey was conducted on informal traders in Heidelberg and Riversdale. The aim of the
survey was to identify type of informal traders, identification of needs i.e. business
infrastructure, access to financial and non-financial resources, proposed amendments to
municipal informal by-law, in order to identify interventions to support informal traders to
enter the formal economy of Hessequa.
SMALL FARMERS SURVEY
A survey was conducted in all towns in small scale farmer activities. The aim of the survey
was to identify type of farming activity, identification of needs i.e. infrastructure, access to
financial and non-financial resources, in order to identify interventions to support small
farmers with farming activities.
SEDA SMME TRAINING & INFORMATION TRAININGSESSIONS
SEDA in partnership with Hessequa Municipality, held a number of training and
information sessions with local entrepreneurs, specifically start-up businesses on basic
business skills and provided information on services and support offered by SEDA. i.e.
business plan development, marketing, access to finance etc.
ENTREPRENEURS WEEK
An Entrepreneurs week was held during October 2014 in collaboration with Department
of Economic Development, SARS, Department of Trade & Industry, NYDA, SEFA and the
Dept of Labour, whereby a range of seminars were presented on financial readiness,
tender training and business plan development.
. NATIONAL YOUTH DEVELOPMENT PROGRAMME
An on-going development programme for youth entrepreneurs facilitated in joint effort
between Hessequa Municipality and the NYDA. The purpose of the Entrepreneurial

CHAPTER 3 – SERVICE DELIVERY PERFORMANCE
83 | P a g e
HESSEQUA MUNICIPALITY 2014/15 ANNUAL REPORT
Development Programme is to equip youth emerging SMME’s with skills and knowledge
to become self-employed and build sustainable businesses.
CAREER GUIDANCE EXHIBITION
A total of 20 external stakeholder departments committed themselves to the project and
contributed to a successful series of
exhibitions i.e. South Cape Nursing
College, PETROSA, Department of
Health, Working on Fire, Department of
Social Development, Independent
Electoral Commission, SARS,
Department of Agriculture, Forestry
and Fisheries, Cape Peninsula
University of Technology, Droom,
LGSETA, CHIETA, PSETA,
Department of Correctional Services,
Department of Justice, UNISA, South
Cape College, Department of
Agriculture, and National Youth Development Agency. The event was attended by both
current students and out of school youth, looking for career development opportunities.
The information given at the exhibition stalls were absorbed with great enthusiasm, and
the motivational talks from local role
models gave many participants new
perspective on their lives. There was
a great need for career information
from students, while out of school
youth indicated the need for skills
training, learnerships, jobs and self-
employment opportunities.
CONTRACTOR DEVELOPMENT TRAINING
Contractor Development training session was held in partnership with the Supply Chain
Management Section, with
local contractors focussing on
compliance, health and
safety, tendering and tender
processes, costing & pricing
and human resource
management. The training
was attended by 37 local
contractors from the local
area of Hessequa.
Establishment of LED
Forum
The LOCAL ECONOMIC DEVELOPMENT FORUM was established in November 2014,
whereby an interim committee was elected. LED Forum established to create a platform
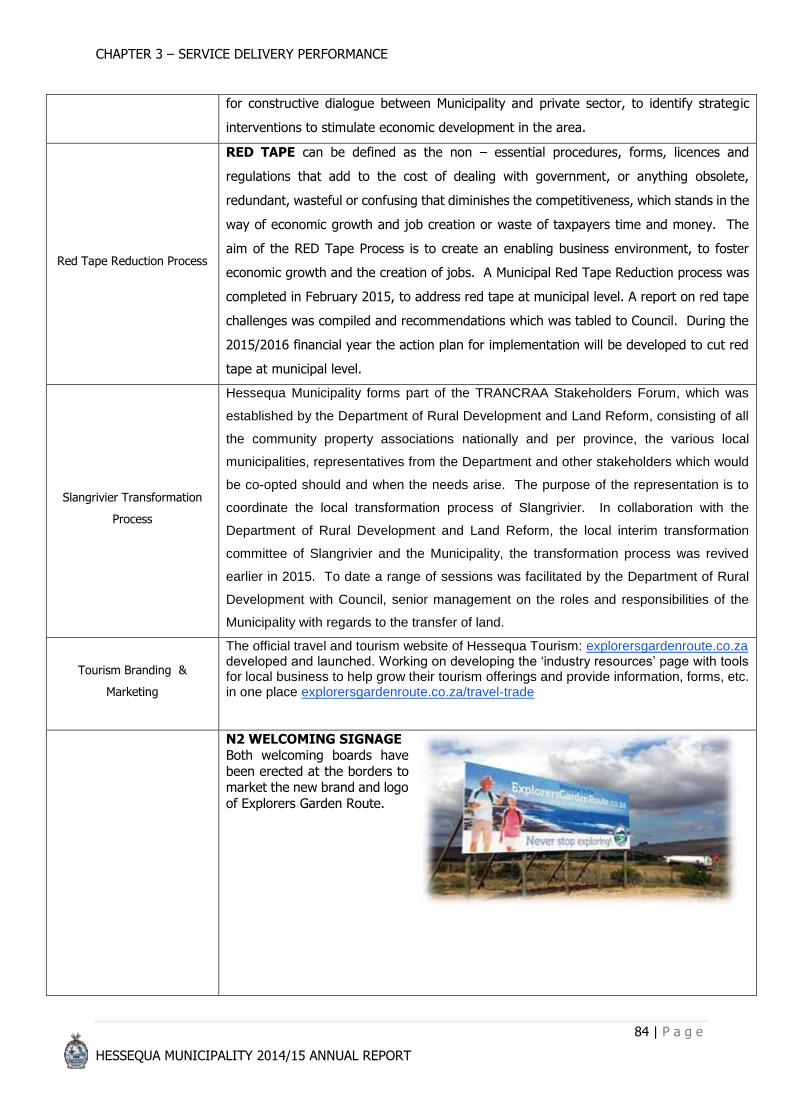
CHAPTER 3 – SERVICE DELIVERY PERFORMANCE
84 | P a g e
HESSEQUA MUNICIPALITY 2014/15 ANNUAL REPORT
for constructive dialogue between Municipality and private sector, to identify strategic
interventions to stimulate economic development in the area.
Red Tape Reduction Process
RED TAPE can be defined as the non – essential procedures, forms, licences and
regulations that add to the cost of dealing with government, or anything obsolete,
redundant, wasteful or confusing that diminishes the competitiveness, which stands in the
way of economic growth and job creation or waste of taxpayers time and money. The
aim of the RED Tape Process is to create an enabling business environment, to foster
economic growth and the creation of jobs. A Municipal Red Tape Reduction process was
completed in February 2015, to address red tape at municipal level. A report on red tape
challenges was compiled and recommendations which was tabled to Council. During the
2015/2016 financial year the action plan for implementation will be developed to cut red
tape at municipal level.
Slangrivier Transformation
Process
Hessequa Municipality forms part of the TRANCRAA Stakeholders Forum, which was
established by the Department of Rural Development and Land Reform, consisting of all
the community property associations nationally and per province, the various local
municipalities, representatives from the Department and other stakeholders which would
be co-opted should and when the needs arise. The purpose of the representation is to
coordinate the local transformation process of Slangrivier. In collaboration with the
Department of Rural Development and Land Reform, the local interim transformation
committee of Slangrivier and the Municipality, the transformation process was revived
earlier in 2015. To date a range of sessions was facilitated by the Department of Rural
Development with Council, senior management on the roles and responsibilities of the
Municipality with regards to the transfer of land.
Tourism Branding &
Marketing
The official travel and tourism website of Hessequa Tourism: explorersgardenroute.co.za developed and launched. Working on developing the ‘industry resources’ page with tools for local business to help grow their tourism offerings and provide information, forms, etc. in one place explorersgardenroute.co.za/travel-trade
N2 WELCOMING SIGNAGE
Both welcoming boards have
been erected at the borders to market the new brand and logo
of Explorers Garden Route.

CHAPTER 3 – SERVICE DELIVERY PERFORMANCE
85 | P a g e
HESSEQUA MUNICIPALITY 2014/15 ANNUAL REPORT
REGIONAL DESK MAP PADS
Regional desk maps pads designed inhouse and distributed showcasing tourism activities in Hessequa Region as
part of the marketing
campaign to market Explorer’s Garden
Route.
REGIONAL DL BROCHURES
Designed in house with short generic sentence of each ton.

CHAPTER 3 – SERVICE DELIVERY PERFORMANCE
86 | P a g e
HESSEQUA MUNICIPALITY 2014/15 ANNUAL REPORT
BASIC CUSTOMER
CARE SERVICE
TRAINING
Basic customer service training provided to local businesses, across Hessequa. In total 79 participants attended from local business from various sectors. The aim of the workshop
focused on basic customer care skills in order to successfully deal and communicate
with customers in a professional manner.
Delegates gained basic understanding, knowledge and skills in communicating as
well the foundation blocks to building relationships with customers.
B) Challenges: LED
Challenges with regard to the implementation of the LED strategy are:
Description Actions to address
Key challenge is the absence of a long term strategic
framework providing direction to harness socio-
economic development.
Focus in 2015/2016 financial year, in collaboration with
the Strategic Services Section, to drive the process of
developing a long term strategic framework guiding

CHAPTER 3 – SERVICE DELIVERY PERFORMANCE
87 | P a g e
HESSEQUA MUNICIPALITY 2014/15 ANNUAL REPORT
Description Actions to address
municipal and civil society’s interventions with the aim
to harness socio-economic development in the
Hessequa Municipal Area.
Table 103.: Challenges: LED
C) LED Strategy
Hessequa Municipality through a PACA Process developed the LED Strategy, whereby seventeen
initiatives were identified clustered into five themes i.e. sectoral (i.e. tourism, agriculture, property
development), smme support & development, responsible and enabling public sector. Through the
establishment of the LED Forum, the Municipality in collaboration with the external stakeholders,
implement the initiatives. The LED Strategy is a working progress document and will be reviewed in the
2015/2016 financial year as part of aligning the document to the long term strategic development plan
for Hessequa.
Employees: Libraries
Job Level
2013/14 2014/15
Employees Posts Employees Vacancies (fulltime
equivalents)
Vacancies (as a
% of total posts)
No. No. No. No. %
0 - 3 0 0 0 0 0%
4 - 6 0 0 0 0 20%
7 - 9 1 1 1 0 0%
10 - 12 1 1 1 0 0%
13 - 15 1 1 1 0 0%
16 - 18 0 0 0 0 0%
19 - 20 0 0 0 0 0%
Total 3 3 3 0 0%
Employees and Posts numbers are as at 30 June.
Table 104.: Employees: LED and Tourisms

CHAPTER 3 – SERVICE DELIVERY PERFORMANCE
88 | P a g e
HESSEQUA MUNICIPALITY 2014/15 ANNUAL REPORT
3.6 COMPONENT D: COMMUNITY AND SOCIAL SERV ICES
Hessequa Municipality, in collaboration with the Provincial Library Service of the Western Cape provides
a comprehensive library service to the people in the area. The Library Service strives to improve the
quality of life of all inhabitants, change and uplift communities and promote literacy.
The Library Service endeavours to promote awareness of the benefits of library use within the whole
community and continuously promotes a reading and learning culture with free access to information.
The 10 formal library service points and 4 Wheelie Wagons make great effort to develop an educated
society through programs that enhance literacy and culture including lifelong learning.
The museum service aims to promote respect for cultural diversity in South Africa and appreciation of
our natural heritage. The museum service therefore sets out to build understanding and pride of our
diverse heritage through the affiliated museums. Hessequa comprise of 2 official private sector driven
museums and 1 Africana Centre managed by the municipality, which develops and promotes exhibitions
and programs for educational purposes and the public interest.
Hessequa comprise of sporting facilities in all of its towns and is primarily used to host and promote
competitive sporting events and secondary used to optimize social behaviour through sport and recreation
especially for the school going youth through the MOD Centre program of the department of Cultural
Affairs and Sport.
3.6.1 LIBRARIES
A) Highlights: Libraries
Highlights Description
Mandela Day, July 2014
Outreach activities ranged from clean-up campaigns,
food donations, visits to schools, old age homes,
storytelling sessions and soup and sandwiches.
September 2014
International Day for People with Disabilities
A discussion was held on the topic of disabled people
and their needs. Disabled people as well as some of
their relatives did the presentation.
February 2015
Provincial Cultural Awards
Albertinia Public Library received an award for the best
small public library in the Western Cape.
February 2015
Ministerial award
Anneline Kistoor from the Vermaaklikheid Wheelie
Wagon received the ministerial award for her service,
dedication and leadership within the community.

CHAPTER 3 – SERVICE DELIVERY PERFORMANCE
89 | P a g e
HESSEQUA MUNICIPALITY 2014/15 ANNUAL REPORT
Highlights Description
March 2015
South African Library Week
South African Library Week was celebrated from 14 –
21 March 2015 with the theme; Connect @ your
library. A wide range of activities were presented.
April 2015
World Book Day
World Book Day was celebrated with a competition for
the best designed bookmark by learners of the Christ-
like Academy. Library orientation classes dealing with
the aspects of using a library were offered.
May 2015 Africa Day
Film festival in collaboration with the Provincial Library
Service. Films were shown to Grade 6 and 7 learners
from the three primary schools in Riversdale as well as
the senior citizens from the old age homes.
May 2015
Readers Day
The SV Petersen Leesdag was held with presentations
by the authors, Abraham de Vries, Marie Heese and
Elias Nel
June 2015
SALGA Western Cape PEC Engagement – Eden District
Municipalities, Brenton-on-Sea, Knysna
The Municipal Manager, mr J Jacobs, gave a
presentation on the future of libraries
Table 105.: Libraries Highlights
B) Service Statistics for Libraries
Type of service 2014/2015 2013/14
Library members 15236 15 048
Items circulated 462 463 457 502
Exhibitions held 571 585
Internet users 6130 3 236
Literacy initiatives 2900 1616
Table 106.: Service Statistics for libraries

CHAPTER 3 – SERVICE DELIVERY PERFORMANCE
90 | P a g e
HESSEQUA MUNICIPALITY 2014/15 ANNUAL REPORT
Employees: Libraries
Job Level
2013/14 2014/15
Employees Posts Employees Vacancies (fulltime
equivalents)
Vacancies (as a
% of total posts)
No. No. No. No. %
0 - 3 2 2 2 0 0%
4 - 6 23 20 16 4 20%
7 - 9 1 6 6 0 0%
10 - 12 1 2 2 0 0%
13 - 15 1 1 1 0 0%
16 - 18 0 0 0 0 0%
19 - 20 0 0 0 0 0%
Total 28 31 27 4 12.9%
Employees and Posts numbers are as at 30 June.
Table 107.: Employees: Libraries
3.6.2 CEMETERIES
A) Highlights: Cemeteries
Highlights Description
Heidelberg cemetery extension
Aim Consulting Services prepared the final report
for the approval of the EIA by the Dept or
Environmental Affairs to extend the cemetery at erf 557 Heidelberg.
Albertinia cemetery extension
The Council negotiate to buy 3.57ha of land from
owner of the farm Lentelus at Albertinia to extend the existing cemetery.
Table 108.: Cemeteries Highlights
B) Challenges: Cemeteries
Description Actions to address
Environmental Authorization takes too long for approved.
Department of Environmental Affairs needs to provide Environmental Authorization quicker.
Table 109.: Challenges: Cemeteries

CHAPTER 3 – SERVICE DELIVERY PERFORMANCE
91 | P a g e
HESSEQUA MUNICIPALITY 2014/15 ANNUAL REPORT
3.6.3 CHILD CARE, AGED CARE AND SOCIAL PROGRAMMES
A) Introduction to Child Care, Aged Care and Social Programmes
In Hessequa the aspects/programs/interventions for child- and aged care, falls under the ambit of the
broader social development programs rolled out through the Thusong Centre program.
The municipality partner with various stakeholders, organizations and sector departments to assist with
child care and Early Childhood Development (ECD) if and when required, for example; with registrations,
capacity building, making available suitable land, as well as financial assistance.
The Youth Development Programme aims to enable youth to take responsibility for a positive lifestyle
and to contribute through skills development, behaviour modification, recreation and to participate in
family and community activities, as well as for their own mental health and emotional well-being. The
programme operates from premise of encouraging positive behaviour through integrated social
development programs utilizing social inclusion of "out of school" and "in school" youth to become
responsible citizens through sport, life skills training, internships, etc. Hessequa municipality embraced
the Chrysalis program of the provincial department of Public Safety as a conduit to achieve life skills
development of youth. The youth are placed within the various departments in the municipality to further
prepare them for the job market.
Emphasis is also on people with disabilities, drug abuse, gender and HIV/AIDS. Partnerships are also
formed with relevant stakeholders to ensure bigger impact.
B) Highlights: Child Care, Aged Care and Social Programmes
Highlights Description
Thusong Centre Mobile outreach Programme
The Thusong Centre Mobile Community outreach programme
was the only Municipal outreach programme that reached a
100% target within the Western Cape. The aim of the
programme is ;
To build communities and to change lives;
To bring government services to communities especially to our
rural areas;
To build partnerships with national, provincial and local service
providers;
To give effect to the principles of “Batho Pele “we belong, we
care, we serve.
Six outreach programs were conducted in the 2014/2015
financial year. These areas included, Slangrivier, Heidelberg,

CHAPTER 3 – SERVICE DELIVERY PERFORMANCE
92 | P a g e
HESSEQUA MUNICIPALITY 2014/15 ANNUAL REPORT
Highlights Description
Riversdale, Melkhoutfontein and Albertinia. The number of
citizens that was reached through this initiative was four
thousand eight hundred and twelve (4812).
The success of this program lies within the fact that all our
partners/ roll players are committed to bring along change
within our communities;
The Hessequa municipality are committed to continue with this
program because we can see the impact this program makes
within the lives of our people.
Hessequa Sport programs
“Sport has the power to change the world. It has the power to
inspire. It has the
power to unite people in a way that little else can. Sport can
awaken hope where there was previously only despair.”
(Nelson Mandela, Laureus World Sports Awards Ceremony
2000)
Our people love sport. Its values –fitness, fair play, teamwork
and the pursuit of excellence are universal. At its best, it brings
people together no matter what their origin, background,
religious beliefs or economic status.
When young people participate in sport or have access to
physical education, they can build up their health and self-
esteem, use their talents to the fullest, learn the ideals of
teamwork and tolerance, and be drawn away from the dangers
of drugs and crime.
That is why the Department of Community services is turning
more and more often to sport for help in our work in
development and in our effort to achieve our goals.
The sporting programs that the department conducted in this
financial year included;
Chess, Rugby, Netball, Mini Cricket, Golden Games, Athletics,
Indigenous games, Table tennis, Soccer and Holiday programs.
More than two thousand citizens could be reached through this
programme.
Initiatives that target the youth and unemployed are expected
to contribute to crime prevention. Sport alone cannot prevent
conflict or build peace. However, it can contribute to broader,
more comprehensive efforts in a range of important ways. Sport
can bridge relationships across social, economic and cultural
divides within society, and build a sense of shared identity and
fellowship among groups that might otherwise be inclined to

CHAPTER 3 – SERVICE DELIVERY PERFORMANCE
93 | P a g e
HESSEQUA MUNICIPALITY 2014/15 ANNUAL REPORT
Highlights Description
threaten each other with distrust, hostility or violence. The
Department recognizes sport as a socially acceptable way for
the youth to spend their time and energy without getting into
trouble on the streets. The expression ‘a child on court is a
child out of court’ has special relevance in this regard. The
Department would like to provide for participation opportunities
as an alternative to taking drugs and pursuing anti-social
activities. Violence is often the result of deep-seated frustration
and idleness. Such frustration can easily be redirected through
sport, and this is a key focus of the Departments sporting
programme.
Table 110.: Child Care, Aged Care and Social Programmes Highlights
C) Challenges: Child Care, Aged Care and Social Programmes
Description Actions to address
The lack of funding will always be a big challenge in
addressing social needs.
As department it will be impossible to address social
needs alone. That is why it is important to partner with
relevant stakeholders in addressing these needs. If you
share resources a more effective service can be
delivered and a bigger impact will be made.
Inter Departmental Relationships: Many challenges,
internally, derive from poor inter departmental
relationships. Poor relationships between
departments, hampers effective service delivery. In
our department , because of the nature of our work,
it is necessary that we must get the buy in of other
departments like Technical services, Co-operate
services, Local economic development etc.
It is important that this challenge be addressed on
management level.
Table 111.: Child Care, Aged Care and Social Programmes Challenges
D) Service Statistics for Child Care, Aged Care and Social Programmes
Description 2014/15
Municipal Outreach
Programs ( Jamboree’s )
Six mobile programs has been conducted;
Slangrivier ( twice) ( 864 )
Heidelberg (1363)
Albertinia (1150)

CHAPTER 3 – SERVICE DELIVERY PERFORMANCE
94 | P a g e
HESSEQUA MUNICIPALITY 2014/15 ANNUAL REPORT
Description 2014/15
Melkhoutfontein (563)
Riversdale (872)
The total number of people reached : 4812
Delivery of water tanks The amount of 132 water tanks was delivered over this period.
Hessequa Pro20 Rugby
tournament
The Hessequa Pro20 rugby tournament took place on the 8 and 15 November 2014.
This event formed part of the build-up to the Hessequa Rugby cup tournament, with
eight participating teams;
Rural, Slangrivier, Heidelberg, Riversdale Blues, Riversdale, Hessequa Municipality,
Albertinia, Melkhoutfontein.
Sport and Coaching Clinics
There was two MOD centres (Mass opportunity Development and Growth centres)
established within Hessequa, one in Heidelberg and Riversdale. The aim of these
centres is to promote
Mass Participation – Providing school sport coaching for the masses;
Opportunity and access : Creating sport based access and opportunity for all;
Development and Growth : Developing and growing basic skills;
Sport : Providing school sport
These coaching clinics are conducted daily with + - 40 learners participating on a
daily basis.
The sporting codes include chess, Hockey, Rugby, netball, Volleyball, indigenous
sport, athletics, cricket, football and table tennis.
During the Hessequa Rugby Cup 800 learners participated in the rugby development
programme.
During the opening of the Albertinia sport stadium mini cricket and Rugby clinics was
conducted by South Western Districts.
Life Skills Programs/ Nation
Building
Thusong E-Centre programme conducting basic computer training, C.V writing,
access to internet etc.
Month Number of visits
July 2014 355
August 2014 551
September 2014 603
October 2014 - January 2015 1419
February 2015 459
March 2015 602
April 2015 678
May 2015 681
June 2014 443
TOTAL 5791
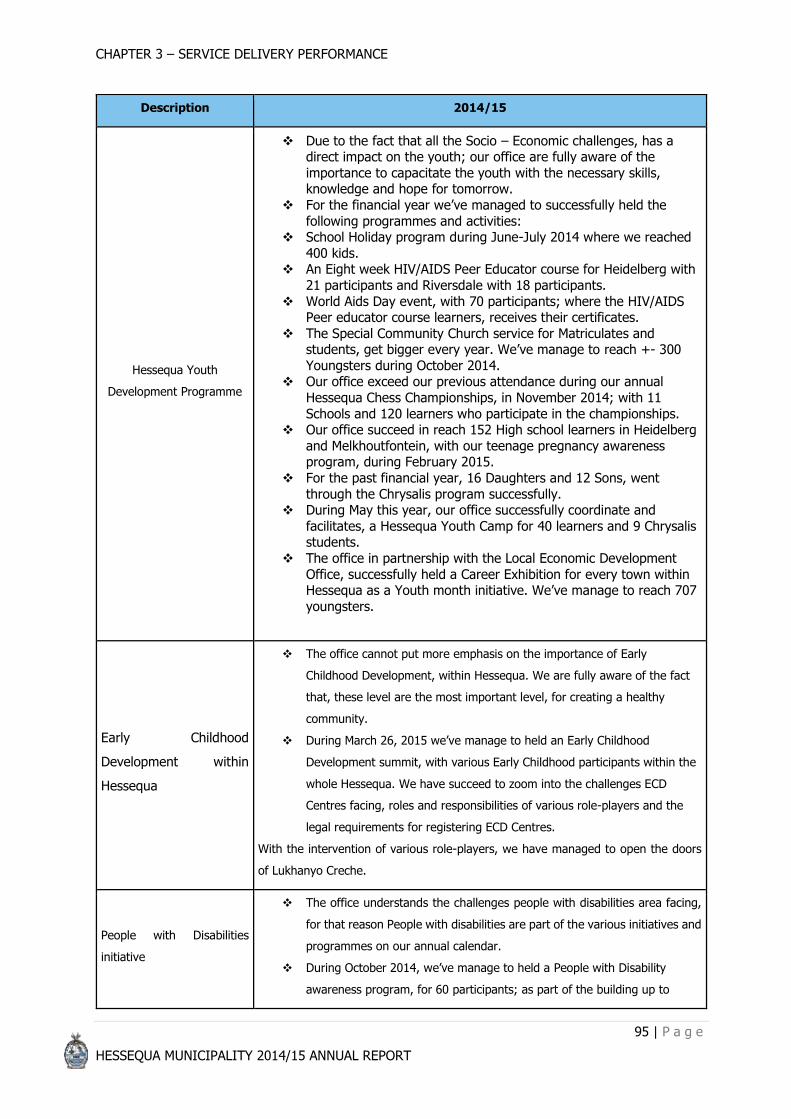
CHAPTER 3 – SERVICE DELIVERY PERFORMANCE
95 | P a g e
HESSEQUA MUNICIPALITY 2014/15 ANNUAL REPORT
Description 2014/15
Hessequa Youth
Development Programme
Due to the fact that all the Socio – Economic challenges, has a direct impact on the youth; our office are fully aware of the
importance to capacitate the youth with the necessary skills, knowledge and hope for tomorrow.
For the financial year we’ve managed to successfully held the
following programmes and activities: School Holiday program during June-July 2014 where we reached
400 kids. An Eight week HIV/AIDS Peer Educator course for Heidelberg with
21 participants and Riversdale with 18 participants.
World Aids Day event, with 70 participants; where the HIV/AIDS Peer educator course learners, receives their certificates.
The Special Community Church service for Matriculates and students, get bigger every year. We’ve manage to reach +- 300
Youngsters during October 2014. Our office exceed our previous attendance during our annual
Hessequa Chess Championships, in November 2014; with 11
Schools and 120 learners who participate in the championships. Our office succeed in reach 152 High school learners in Heidelberg
and Melkhoutfontein, with our teenage pregnancy awareness program, during February 2015.
For the past financial year, 16 Daughters and 12 Sons, went
through the Chrysalis program successfully. During May this year, our office successfully coordinate and
facilitates, a Hessequa Youth Camp for 40 learners and 9 Chrysalis students.
The office in partnership with the Local Economic Development
Office, successfully held a Career Exhibition for every town within Hessequa as a Youth month initiative. We’ve manage to reach 707
youngsters.
Early Childhood
Development within
Hessequa
The office cannot put more emphasis on the importance of Early
Childhood Development, within Hessequa. We are fully aware of the fact
that, these level are the most important level, for creating a healthy
community.
During March 26, 2015 we’ve manage to held an Early Childhood
Development summit, with various Early Childhood participants within the
whole Hessequa. We have succeed to zoom into the challenges ECD
Centres facing, roles and responsibilities of various role-players and the
legal requirements for registering ECD Centres.
With the intervention of various role-players, we have managed to open the doors
of Lukhanyo Creche.
People with Disabilities
initiative
The office understands the challenges people with disabilities area facing,
for that reason People with disabilities are part of the various initiatives and
programmes on our annual calendar.
During October 2014, we’ve manage to held a People with Disability
awareness program, for 60 participants; as part of the building up to

CHAPTER 3 – SERVICE DELIVERY PERFORMANCE
96 | P a g e
HESSEQUA MUNICIPALITY 2014/15 ANNUAL REPORT
Description 2014/15
November 2014 as People with Disability awareness month and the 16
days of activism, against violence on women and children.
Hessequa Social
Development Advisory
Forum
The office manage to hold a successful Hessequa Social Development
Summit, with the aim to gather all the Social Development role-players and
zoom into the Social Development issues within Hessequa. The ultimate
outcome of the summit was to, establish a Hessequa Social Development
Advisory Forum. It is good to report that the Advisory forum is up and
running.
Older person initiative
One of the most important target groups is our Older persons. Our office
manage to successfully hold the Older Persons sports day on the 24
September of each year. From this year on, we will take part in the Regional,
Provincial and National Golden Games. For the Region Golden Games which
were held in Mosselbay on May 26th; 28 Older Persons took part.
Planning
Due to limited funds and human resources within our office, we could not
zoom into Older Persons programmes and Substance Abuse. These two
important initiatives will form part of our priorities for 2015/2016.
Special events hosted
Sporting/ Cultural Events:
The opening of the Albertinia sport stadium was on 1 May 2015 with a provincial
rugby game between SWD eagles and Border.
The Hessequa municipality hosted the Regional Domino tournament on 27 July 2014
with participating teams from Boland, SWD and Hessequa.
The Hessequa Municipality hosted successful Arts Cape productions on the 1st and
2nd October 2014. Training courses for local community choirs was also conducted.
The Eden Drama Festival took place on 8 August 2014 to promote drama within our
local communities.
The Hessequa Rugby Cup tournament forms part of the Municipalities yearly
tournaments which take place in February, March every year.
The Hessequa Schools athletics fund raising event took place on 13 March 2015 with
more than 200 athlete’s participating.
Table 112.: Service statistics for Child Care, Aged Care and Social Programmes

CHAPTER 3 – SERVICE DELIVERY PERFORMANCE
97 | P a g e
HESSEQUA MUNICIPALITY 2014/15 ANNUAL REPORT
Employees: Child Care, Aged Care, Social Programmes
Job Level
2013/14 2014/15
Employees Posts Employees Vacancies (fulltime
equivalents)
Vacancies (as a
% of total posts)
No. No. No. No. %
0 - 3 1 0 0 0 0%
4 - 6 2 2 2 0 0%
7 - 9 0 6 1 5 83%
10 - 12 2 2 2 0 0%
13 - 15 0 1 0 1 100%
16 - 18 0 0 0 0 0%
19 - 20 0 0 0 0 0%
Total 5 11 5 6 54%
Employees and Posts numbers are as at 30 June
Table 113.: Employees: Child Care, Aged Care and Social Programmes
3.7 COMPONENT E: ENVIRONMENTAL PROTECTION
This component includes:
o Pollution control
o Biodiversity and landscape
o Coastal protection
3.7.1 INTRODUCTION TO ENVIRONMENT PROTECTION Hessequa Municipality developed an Air Quality Control plan as well as a Climate Change Adaptation Plan
during the 2013/14 financial year, for both these plans 2014/15 was their first year of implementation.
It should be noted that both plans were adopted by Council and an Air Quality Management Officer as
well as a Climate Change Management Officer was appointed as a direct result of the adoption of these
plans. We are also in the process of addressing the dune management issue for our region. During
2014/15 two dune management plans was submitted to the Department of Environmental Affairs and
Development Planning (DEA&DP) for approval.
River control on our four rivers took on the form of access control points and physical patrols on the
estuaries itself in order to ensure compliance with environmental legislation and municipal bylaws. The
inauguration of National Estuary Management Protocol in 2014 means that the Breede River (Estuary)

CHAPTER 3 – SERVICE DELIVERY PERFORMANCE
98 | P a g e
HESSEQUA MUNICIPALITY 2014/15 ANNUAL REPORT
now falls under the mandate of DEA&DP and the management authority for the Gouritz Estuary is Eden
District Municipality (EDM).
The municipality has a range of nature reserves with an assortment of critically endangered biomes and
we are in the process of registering it under the Stewardship Program as rolled out by Cape Nature.
DEA&DP awarded Hessequa Municipality as the Best Municipality within the Western Cape with regards
to Bio-diversity and Coastal Management for the third consecutive year, during the annual Greenest
Municipality Awards. The Greenest Municipality Competition entails the submission of a questionnaire
with associated evidence to proof that projects (as indicated in questionnaire) was done. The themes
covered by the competition includes Biodiversity and Coastal Management, Climate Change, Leadership,
Water and Waste. All municipalities within the Western Cape are invited to enter and for 2014 19
municipalities entered excluding the districts and Metro, in this regards Hessequa Municipality came
second overall. The municipality also registered nine Eco-Schools during 2014/15.
3.7.1.1 POLLUTION CONTROL
The Hessequa Municipality has Air Quality By-laws which was adopted and approved by Council and which
is currently being enforced by Eden District Municipality in conjunction with Hessequa. Hessequa
Municipality also have a dedicated air quality officer (approved by Council) as well as an approved Air Quality
Management Plan, therefore completing the municipality’s air quality infrastructure as required under the
National Environmental Management: Air Quality Act, 2004 (Act 39 of 2004) (AQMA). In terms of section
15(2) of the Act each municipality must include in its Integrated Development Plan (IDP) contemplated in
chapter 5 of the Municipal Systems Act, an air quality management plan (AQMP), this has also been done.
Other initiatives under air quality management was the designing, printing and distribution of an Air Quality
Management Flyer and Brochure. These two documents are available on the municipal internet site.
The Hessequa Municipality in conjunction with Eden District Municipality: District Air Quality Unit recently
embarked on an air quality project, namely the Clean Fire Campaign. The project was identified due to poor
air quality in especially the informal settlements, caused by fires used for household purposes such as cooking
and heating.
This project rolled out in Albertinia and Riversdale during the week of 13-17 April 2015. The project entailed
the selection of peer educators by the Hessequa Municipality: Environmental Services. Twenty Peer educators
were recruited through a selection process.
SA Teacher was the appointed service provider to educate peer educators on air pollution, the health effects
thereof and how the communities that are largely dependent on fires for household purposes, can reduce
the effects of fires on the environment and their health.

CHAPTER 3 – SERVICE DELIVERY PERFORMANCE
99 | P a g e
HESSEQUA MUNICIPALITY 2014/15 ANNUAL REPORT
3.7.1.2. BIO-DIVERSITY AND LANDSCAPE
As previously mentioned the municipality is in the final stages of registering our nature reserves under
the Cape Nature Stewardship Program.
Follow-up and alien clearance projects totals approximately 350ha on municipal land including the Pauline
Bohnen and Werner Frehse Nature Reserves. In addition to the aliens cleared, erosion control projects
were also rolled out in areas with hiking trails such as those in the municipal nature reserves. For 2014/15
the municipality again invested large amounts of resources into the expansion of the Tuin-op-die-Brak.
The municipality entered two environmental orientated competitions one the Arbour City awards
(National) and the Greenest Municipality Awards (Provincial). We won the category for Biodiversity and
Coastal Management (best municipality in the Western Cape in managing these biomes) and came second
overall.
The municipality successfully revised their 2008 State of the Environment Report (SOER) in 2014/15 which
is now called the 2015 Revised SOER. In addition a booklet which was distributed to the relevant municipal
departments regarding the National Environmental Management Act: Listed Activities was also developed.
The rationale behind the booklet is to ensure that Building Control, Town Planning and the Technical
Department can make informed decisions with regards to what activities is allow and which are not. The
booklet has also been made available on the municipal website. Another booklet which was developed
was the “INDIGENOUS VEGETATION INFORMATION & MANAGEMENT GUIDELINE” which strives to direct
the municipality in the management of indigenous vegetation which includes relevant guidelines and a list
of protected trees relevant to our area. This guideline was also distributed to the relevant departments
and made available to the public on the municipal website.
2014/15 also saw the launching of the municipality’s #100000TreeCampaign which is mostly internet
based. The campaign strives to plant 100 000 indigenous trees within the municipal area, with the
cooperation and assistance of the community. Community members are encouraged to register all the
indigenous trees they plant and make it part of the tally.
Coastal Protection
A Maintenance Management Plan for work to the Kraaltjie (slipway) was compiled and submitted to
DEA&DP, an Environmental Authorizations was accordingly obtained in the 2014/15 financial year and
actual construction commenced in May 2015. Another Maintenance Management Plan was compiled for
the Jongensfontein ‘Swemstrand’ and Environmental Authorization was also obtained for a period of 5
years.
Environmental Authorization was obtained from the department to construct a Jetty in Gouritsmond in
2012. The Jetty was demolished by a flood in January 2014 and reconstructed in November 2014 by the
municipality.

CHAPTER 3 – SERVICE DELIVERY PERFORMANCE
100 | P a g e
HESSEQUA MUNICIPALITY 2014/15 ANNUAL REPORT
The western bank of the Goukou estuary for a distance of 1.7 km from the mouth of the river was
stabilized by the municipality during April – June 2015 as the area experienced serious erosion problems.
Continuous maintenance to the Lappiesbaai dunes also took place.
3.8 COMPONENT F: SECURITY AND SAFETY
This component includes:
o traffic;
o law enforcement;
o fire and
o disaster management
3.8.1 INTRODUCTION TO SECURITY AND SAFETY The department Protection Services consists of the following sections:
o Traffic law enforcement
o Traffic agency services
Motor registrations
Licensing
Roadworthiness
o Law enforcement (by-laws)
Municipal Animal pound
Technical services (road maintenance)
o Disaster management
o Fire Brigade Services (contracted service)
3.8.2 TRAFFIC SERVICES AND LAW ENFORCEMENT
A) Highlights: Traffic Services and Law Enforcement
Highlights Description
1st Prize for Traffic exhibition – Riversdale show grounds Uniform disciplines showcase their gadgets and provide useful information to public
Learners License Scholar Patrol project fully operational in 4 schools
Students were taught and tested for learners license, at no cost to them and officials did it afterhours without numeration
Scholar Patrol project fully operational in 3 schools Scholar patrol is now established and will soon be implemented in most of Hessequa’s schools, the schools that first targeted was, Panorama, Bertie Barnard and Albertinia Primary
Training of Law Enforcement Officers to Traffic Wardens We had officers that was trained as Law Enforcement Officers and was only able to enforce the Municipal By-laws, they were

CHAPTER 3 – SERVICE DELIVERY PERFORMANCE
101 | P a g e
HESSEQUA MUNICIPALITY 2014/15 ANNUAL REPORT
Table 114.: Traffic Services and Law Enforcement Highlights
B) Challenges: Traffic Services and Law Enforcement
Description Actions to address
Unable to address all law offences and other municipal by-laws due to personnel constraints.
Appoint more law enforcement officers and funding for additional vehicles
Unable to serve all the towns within the Hessequa region due to personnel and vehicle shortages
Appoint more law enforcement officers and funding for additional vehicles
Poor morale of traffic officers Training of personnel (K53 -DRIVING LICENSE), EOV (Examiners of Vehicles), Advance Driving, Self-defence courses.
Table 115.: Traffic Services and Law Enforcement Challenges
C) SERVICE STATISTICS FOR TRAFFIC SERVICES AND LAW ENFORCEMENT
No. Details 2014/15
Actual No.
1 Number of by-law infringements attended 404
2 Number of officers in the field on an average day 5
3 Number of officers on duty on an average day 9
Table 116.: Service Statistics: Law Enforcement
Additional Performance Information for Traffic Services and Law Enforcement
Type of service 2014/15 2013/14
Animals impounded 789 45
Motor vehicle licenses processed 22 381 19 999
Learner driver licenses processed 1 352 1 132
Driver licenses processed 2 489 3 650
Driver licenses issued 575 2 587
sent to City of Cape Town Metro to be trained as Traffic Wardens that enable them to still enforce the Municipal By – laws but also enforce part of the National Road Traffic Act 93 of 1996 (NRTA)
The Roadworthy Centre achieving a 100% audit report from the Provincial Department of Transport
The Roadworthy Centre will get an unscheduled inspection from the Provincial or National Department of Transport, to see that the centre is in compliance with National and Provincial. If the centre is not compliant they, the National Department of Transport, can close the centre and that can lead to disruption on service delivery.
Hessequa Career Exhibition
The Hessequa Career exhibition was held throughout the Hessequa region.All towns Stilbay,Albertinia,Heidelberg Slangrivier and Riversdale were visited in conjuction with other Goverment and non government organisations.Protection services were discussed as career as well as giving advice on traffic related matters.

CHAPTER 3 – SERVICE DELIVERY PERFORMANCE
102 | P a g e
HESSEQUA MUNICIPALITY 2014/15 ANNUAL REPORT
Fines issued for traffic offenses 3173 2 720
R-value of fines collected 1330200 929 111
Operational call-outs 30 9
Roadblocks held 5 6
Complaints attended to by Traffic Officers 212 34
Special Functions–Escorts 24 11
Awareness initiatives on public safety
School project = Daantjie kat 12 interventions.
Schools are visited to inform scholars on traffic safety
Pianting and training of toddlers on junior traffic training centre
Eden Soup drive =3
Show grounds traffic exhibition =1
The show ground have an annual exhibition in Riversdale and we have been part of the exhibition for the passed years.
We have this year, 2015 won the first price for the most informative exhibition.
December and Easter welcoming =2
Smoke emission tests =1
Scholar patrols =20
School projects (Danny Cat) =8
School projects (learners training and classes) per school =3
School project = Daantjie kat
Eden Soup drive =3
Show grounds traffic exhibition =1
December and Easter welcoming =2
Smoke emission tests =1
Scholar patrols =20
Driver of the Year (DOTY)
Table 117.: Additional performance information for Traffic Services and Law Enforcement
Employees: Traffic Services and Law Enforcement
Job Level
2012/13 2014/15
Employees Posts Employees Vacancies (fulltime
equivalents)
Vacancies (as a
% of total
posts)
No. No. No. No. %
0 – 3 3 3 3 0 0%
4 - 6 8 9 9 0 0%
7 - 9 14 7 7 0 0%
10 - 12 5 10 10 0 0%
13 - 15 1 2 2 0 0%
16 - 18 0 1 1 0 0%
19 - 20 0 0 0 0 0%
Total 31 32 32 0 0%
Employees and Posts numbers are as at 30 June
Table 118.: Employees: Traffic Services and Law Enforcement
The Fire Brigade Services for the 2014/15 financial year was partially rendered by Eden District
Municipality via a service level agreement from July 2014 till September 2014. Assistance under the

CHAPTER 3 – SERVICE DELIVERY PERFORMANCE
103 | P a g e
HESSEQUA MUNICIPALITY 2014/15 ANNUAL REPORT
agreement made provision for the rendering of a service in instances of structural fires, road traffic
accidents and commonage fires.
From October 2014, the service was rendered by a service provider called FFA Operations (Pty) Ltd, until
end June 2015. The contract were also extended with 1 month until end of July 2015
Negotiations were initialised with Eden for assistance to establish a Hessequa Fire Brigade services
internally, but was not successful. A request was also forwarded to the Minister of Local Government,
Western Cape, to appoint a category of authorised persons to conduct an investigation into the
establishment of a Hessequa Fire Brigade Services. The request was approved by the Minister and the
investigation was conducted during April 2014. The CAPS report was received and contained
recommendations based on the prescripts of the relevant SANS Codes.
The implementation of an internal fire brigade services proved to be a costly exercise for the municipality,
and a phased approach will have to be followed to eventually establish a fully fledge service as required
by legislation and SANS Codes. A well-motivated input will be referred to the 2016/17 budgetary process.
Further negotiations will also be undertaken with Eden District municipality in order to conclude a Mutual
Aid Agreement, as well as other potential government structures, including PetroSA. The provincial
government will also be engaged for further assistance in this regard.
3.8.3 DISASTER MANAGEMENT During the period of July 2014 and end of June 2015 we did not have any major Disaster incidents in the
Hessequa Municipal area. We had normal rains and the challenges was that we had request for informal
structural integrity that was compromised, and we had to assist by providing material to mitigate the
problem of roof leakages.
Schools were visited to promote the awareness of disasters with special emphasis being placed on veldt
fires as these are common in our region.
3.9 COMPONENT G: SPORT AND RECREATION
This component includes:
o community parks;
o sports fields;
o sports halls;
o stadiums;
o swimming pools; and
o Camp sites.

CHAPTER 3 – SERVICE DELIVERY PERFORMANCE
104 | P a g e
HESSEQUA MUNICIPALITY 2014/15 ANNUAL REPORT
3.9.1 SPORT AND RECREATION
A) Introduction
The extent of the existing infrastructure for parks and resorts are summarized in the following table:
Asset Unit Number
Parks Play parks 32
Sports Grounds Community sport grounds 7
Camp Site Resorts for public 6
Swimming Pools Community pools 3
Table 119.: Summary of existing assets: Sport and Recreation
B) Highlights: Sport and Recreation
Highlights Description
Marketing and uplifting of resorts.
Maintenance and extension of facilities.
Awards
All the resort become members of Western Cape Resort Association. Hessequa website promotes the Resorts.
The Council approved much more capital projects in the 2014/15 capital budget as in the past - R1.3m Previously about R400 000. (Facilities can be upgraded.)
The periodic inspections and maintenance of play parks and other recreational facilities improves.
A new extension of Riversdale cemetery was developed and Albertinia and Heidelberg cemeteries are in the process of being extension.
The use of contractors to manage the cleaning and security of resorts and blue flag beaches during peak season was implemented and cost effective.
Hessequa Municipality is the first Municipality in South Africa that have all their beaches on the Blueflag program
Hessequa Municipality submitted the Application for the Greenest Municipality Competition and Arbor City Award.
Table 120.: Sport and Recreation Highlights
C) Challenges: Sport and Recreation
Description Actions to address
Budget and upgrading.
Communication
To improve the income (profits) of resorts in general and to get more tourists to visits our resorts and tourism attractions.
To identify events and organize events that improve tourists amounts to our region and resorts for example bike events and festivals.
To uplift our customer care / services of resorts and facilities in Hessequa
Create opportunities for growth of visitors.
Improve skills of workers.
Electronic booking systems to all resorts.
Approving of all 6 beaches by WESSA as blue flag beaches for 2014 season.

CHAPTER 3 – SERVICE DELIVERY PERFORMANCE
105 | P a g e
HESSEQUA MUNICIPALITY 2014/15 ANNUAL REPORT
Description Actions to address
(Upgrade and marketing to improve visitors)
Table 121.: Challenges: Sport and Recreation
D) Service Statistic for Sport and Recreation
Type of service 2014/15 2013/2014
Community parks
Number of parks with play park equipment 32 28
Number of wards with community parks 8 8
Swimming pools
Number of visitors per annum +- 13800 +- 12000
R-value collected from entrance fees R59 984 +- 52000
Camp sites/Resorts
Number of visitors per annum 40 000 34 500
R-value collected from visitation and/or accommodation fees 9 173 389 7 500 000
Sport fields
Number of wards with sport fields 7 8
Number of sport associations utilizing sport fields 10 15
R-value collected from utilization of sport fields 19 369 26 000
Sport halls
Number of wards with sport halls 12 8
Number of sport associations utilizing sport halls 15 15
R-value collected from rental of sport halls (community halls) 238 848 280 000
Table 122.: Additional performance information for Sport and Recreation

CHAPTER 3 – SERVICE DELIVERY PERFORMANCE
106 | P a g e
HESSEQUA MUNICIPALITY 2014/15 ANNUAL REPORT
Employees: Parks and Recreation
Job Level
2013/14 2014/15
Employees Posts Employees Vacancies (fulltime
equivalents)
Vacancies (as a
% of total
posts)
No. No. No. No. %
0 - 3 52 56 50 6 11%
4 - 6 49 35 32 3 9%
7 - 9 12 7 7 0 0%
10 - 12 0 3 0 3 100%
13 - 15 0 0 0 0 0%
16 - 18 0 0 0 0 0%
19 - 20 0 0 0 0 0%
Total 113 101 89 12 12%
Employees and Posts numbers are as at 30 June
Table 123.: Employees: Parks and Recreation
Capital Expenditure 2014/15: Sport and Recreation
R
Capital Projects
2014/2015
Adjusted
Budget
Actual
Expenditure
Variance
from
Adjusted
budget
Comments
UPGRADING OF
SPORT
FACILITIES -
THERONSVI
1 627 918 1 422 133.66 (205, 784.34) The project was successfully completed
Upgrading of
Theronsville –
Phase 1
543 364 543 364 0.00 Project is complete
Upgrading of
Theronsville –
Phase 1
847 917 444 956.14 (402 960.86)
Project are completed. The balance are allocated
toward Retention which will be paid out after 12
month liability period.
Table 124.: Capital Expenditure 2014/15 : Sport and Recreation

CHAPTER 3 – SERVICE DELIVERY PERFORMANCE
107 | P a g e
HESSEQUA MUNICIPALITY 2014/15 ANNUAL REPORT
3.10 COMPONENT H: SERV ICE DEL IVERY PR IOR IT IES FOR 2014/15
The main development and service delivery priorities for 2014/15 forms part of the Municipality’s top
layer SDBIP for 2014/15 and are indicated in the table below:
3.10.1 AN ACCOUNTABLE LOCAL AUTHORITY
Ref KPI Unit of Measurement Wards Annual Target
TL1 Development of a Performance
Management Policy Number of All 1
TL2 Development of Integrated Strategic
Framework Number of All 1
TL3 Establishment of ICT Disaster
Recovery(DR) Site Number of All 1
TL4 Annual Software licensing audit Number of All 1
TL5 Submission of ICT Governance Framework
for approval by Council Number of All 1
TL6 Implementation of Domain Group Policies Number of All 1
TL7
Development of Area Plans for
Kwanokuthula, Melkhoutfontein and
Bietouville
Number of 2; 8 2
TL8 Compiling the IDP 2014/2015 Executive
Summary Number of All 1
TL12 Maintain a Vacancy Rate of less than 10%
of budgeted staff establishment % Vacancy Rate All 10%
TL13 Organisational Review of the Municipal
Manager's Office and Resorts
Number of reports submitted to Portfolio
Committee Meeting All 1
TL17 Review of Client Service Standards Number of review reports submitted to
Portfolio Committee Meeting All 1
TL18
Submit a Liquidity Report of the
Municipality to the Financial Portfolio
Committee by end November 2014.
Number of liquidity reports submitted to
Portfolio Committee All 1
TL19
Submit a report on Borrowing Funds and
Reserves to the Financial Portfolio
Committee
Number of borrowing and reserve funds
reports submitted to Portfolio Committee All 1
TL20 Management of Income thresholds higher
than 95% % Income All 95%

CHAPTER 3 – SERVICE DELIVERY PERFORMANCE
108 | P a g e
HESSEQUA MUNICIPALITY 2014/15 ANNUAL REPORT
Ref KPI Unit of Measurement Wards Annual Target
TL22
Evaluate land use applications within 60
days after receipt of all outstanding and
relevant information and documents
% applications evaluated All 90%
TL23
Approve/reject building plans within 30
days for buildings less than 500m2 and 60
days for buildings larger than 500m2 after
all information required is correctly
submitted
% of plans evaluated All 90%
TL27
Submission of reviewed Human
Settlements Plan to Executive Mayoral
Committee
Number of All 1
TL28 Development of a HCE Implementation
Plan Number of All 1
TL29
Development of a database of all
outstanding transfers of pre - 1994
housing schemes, in the Hessequa region
Number of All 1
TL35 Limit Water losses to 30% % unaccounted water All 30%
TL36 Limited Electricity losses to 10% % unaccounted electricity All 10%
TL40 Monthly Head and Sups progress
meetings Number of meetings held All 10
Table 125.: Service Delivery Priority for 2014/15 : An Accountable Local Authority
3.10.2 ECONOMIC GROWTH
Ref KPI Unit of Measurement Wards Annual Target
TL9
Compile a SMME Framework for small,
medium and micro enterprises and
implementation Plan and submit to
Council
Number of All 1
TL10 Compile a Commonage Framework and
submit to Portfolio Committee Number of All 1
TL11 Compile a Destination Marketing Plan and
submit to Council Number of All 1
Table 126.: Service Delivery Priority for 2014/15: Economic Growth

CHAPTER 3 – SERVICE DELIVERY PERFORMANCE
109 | P a g e
HESSEQUA MUNICIPALITY 2014/15 ANNUAL REPORT
3.10.3 EFFECTIVE COMMUNICATION
Ref KPI Unit of Measurement Wards Annual Target
TL16
Complete a Public Communication Survey
and submit the report to the Portfolio
Committee by end November 2014
Number of reports submitted to Portfolio
Committee Meeting All 1
Table 127.: Service Delivery Priority for 2014/15: Effective Communication
3.10.4 HERITAGE OF PRESERVATION
Ref KPI Unit of Measurement Wards Annual Target
TL21 Review of the State of the Environment
Report (SOER) by June 2015 Number of SOER reviewed All 1
Table 128.: Service Delivery Priority for 2014/15: Heritage of preservation
3.10.5 MAINTENANCE AND DEVELOPMENT OF INFRASTRUCTURE
Ref KPI Unit of Measurement Wards Annual Target
TL14 95% Expenditure of approved budget for
maintenance of Municipal properties % budget spent All 95%
TL15 Development of a Municipal Property
Maintenance Plan
Number of reports submitted to Mayoral
Committee All 1
TL33 90% Expenditure of the approved Capital
Budget % capital budget spent All 90%
TL34 80% Expenditure of the approved
Operational Budget % Operational budget spent All 80%
TL37 Provision of waste disposal facility
operation license Number of All 3
TL38 Extension of cemeteries Albertinia en
Heidelberg Number of projects completed 3; 6 2
TL39 Temporary jobs created through EPWP Number of jobs created All 49
Table 129.: Service Delivery Priority for 2014/15:Maintenance and development of infrastructure

CHAPTER 3 – SERVICE DELIVERY PERFORMANCE
110 | P a g e
HESSEQUA MUNICIPALITY 2014/15 ANNUAL REPORT
3.10.6 SAFE COMMUNITIES
Ref KPI Unit of Measurement Wards Annual Target
TL24
Achieve an average of 80% Formal
Provincial audits on the Licensing Agency
Services
Average % achieved All 80%
TL25 Traffic safety initiatives per quarter Number of initiatives per quarter All 12
TL26 Number of integrated vehicle checkpoints
per quarter
Number of integrated vehicle checkpoints
per quarter All 4
Table 130.: Service Delivery Priority for 2014/15: Safe Communities
3.10.7 SOCIAL WELLBEING
Ref KPI Unit of Measurement Wards Annual Target
TL30 Establishment of the Hessequa Social
Development Advisory Forum Number of All 1
TL31 Social Development Summit Number of All 1
TL32 Review of the Social Development Plan Number of All 1
Table 131.: Service Delivery Priority for 2014/15: Social Wellbeing

CHAPTER 4 – ORGANISATIONAL DEVELOPMENT PERFORMANCE
111 | P a g e
HESSEQUA MUNICIPALITY 2014/15 ANNUAL REPORT
Chapter 4:
Organisational Development
Performance

CHAPTER 4 – ORGANISATIONAL DEVELOPMENT PERFORMANCE
112 | P a g e
HESSEQUA MUNICIPALITY 2014/15 ANNUAL REPORT
CHAPTER 4
4.1 National Key Performance Indicators – Municipal Transformation
and Organisational Development
The following table indicates the municipality’s performance in terms of the National Key Performance
Indicators required in terms of the Local Government: Municipal Planning and the Performance
Management Regulations of 2001 and section 43 of the Municipal Systems Act of 2000. These key
performance indicators are linked to the Municipal Transformation and Organisational Development
National Performance Area:
Municipal Transformation and Organisational Development.
KPA & Indicators
Municipal
Achievement
Municipal
Achievement
2013/14 2014/15
The number of people from employment equity target groups employed in
the three highest levels of management in compliance with a municipality’s
approved employment equity plan
36 28*
The percentage of a municipality’s budget actually spent on implementing
its workplace skills plan
0.8% based on
personnel budget
0.85% based on
personnel budget
Table 132.: National KPIs– Municipal Transformation and Organisational Development
* Excludes white females as reflected in 2014/15
4.2 Introduction to the Municipal Workforce
The Hessequa Municipality currently employs 545 (including fixed term contract employees) officials,
who individually and collectively contribute to the achievement of Municipality’s objectives.
4.2.1 EMPLOYMENT EQUITY The Employment Equity Act (1998) Chapter 3, Section 15 (1) states that affirmative action measures
are measures designed to ensure that suitable qualified people from designated groups have equal
employment opportunities and are equitably represented in all occupational categories and levels in the
workforce of a designated employer. The national performance indicator also refers to: “Number of
people from employment equity target groups employed in the three highest levels of management in
compliance with a municipality’s approved employment equity plan”
A) Employment Equity targets/actual

CHAPTER 4 – ORGANISATIONAL DEVELOPMENT PERFORMANCE
113 | P a g e
HESSEQUA MUNICIPALITY 2014/15 ANNUAL REPORT
African Coloured Indian White
Target
June
Actual
June
Target
June
Actual
June
Target
June
Actual
June
Target
June
Actual
June
42 37 467 423 0 0 111 85
Table 133.: 2013/14 EE targets/Actual by racial classification
Male Female Disability
Target
June
Actual
June
Target
reach
Target
June
Actual
June
Target
reach
Target
June
Actual
June Target reach
385 381 98% 235 164 69% 4 4 100%
Table 134.: 2014/15 EE targets/actual by gender classification
B) Employment Equity vs. Population
Description African Coloured Indian White Total
Population numbers 3 905 36 069 199 12 233 52 406
% Population 7.5% 68.8% 0.4% 23.3% 100%
Number for positions filled 37 423 0 85 545
% for Positions filled 6.7% 77.6% 0% 15.6% 100%
Table 135.: EE population 2014/15
C) Occupational Levels - Categories
Below is a table that indicates the number of employees by race and gender within the specific
occupational categories: (excluding councillors):
Posts filled
Occupational Male Female
Total
categories A C I W A C I W
Managers 0 3 0 5 0 1 0 4 13
Professionals 1 12 0 13 1 9 0 11 47
Technicians and Trade
Workers 2 39 0 12 0 0 0 0 53
Clerical and Administrative 0 7 0 1 2 32 0 15 57
Community and Personal
Service 0 2 0 0 0 0 0 0 2

CHAPTER 4 – ORGANISATIONAL DEVELOPMENT PERFORMANCE
114 | P a g e
HESSEQUA MUNICIPALITY 2014/15 ANNUAL REPORT
Posts filled
Occupational Male Female
Total
categories A C I W A C I W
Sales Workers 1 33 0 6 0 14 0 2 56
Machinery and Drivers 2 32 0 0 0 0 0 0 34
Elementary Workers 22 176 0 5 4 47 0 0 254
Total permanent 28 304 0 42 7 103 0 32 516
Fixed-term Contracts 0 5 0 2 2 11 0 9 29
Grand total 28 309 0 44 9 114 0 41 545
Table 136.: Occupational Categories
D) Occupational Levels - Race
The table below categorizes the number of employees by race and gender within the occupational
levels (excluding councillors):
Occupational Male Female
Total
Levels A C I W A C I W
Top Management 0 2 0 1 0 0 0 2 5
Senior Management 0 6 0 11 0 1 0 1 19
Mid-Management/Prof. 1 13 0 11 1 4 0 8 38
Skilled Tech/Junior Man. 1 25 0 9 0 6 0 5 46
Semi-Skilled 6 122 0 7 2 48 0 16 201
Unskilled 20 136 0 3 4 44 0 0 207
Total permanent 28 304 0 42 7 103 0 32 516
Fixed-term Contracts 0 5 0 2 2 11 0 9 29
Grand Total 28 309 0 44 9 114 0 41 545
Table 137.: Occupational Levels

CHAPTER 4 – ORGANISATIONAL DEVELOPMENT PERFORMANCE
115 | P a g e
HESSEQUA MUNICIPALITY 2014/15 ANNUAL REPORT
4.2.2 VACANCY RATE The approved organogram for the municipality had 656 posts for the 2014/15 financial year. This
reflects the ideal number of post and not the number of posts budgeted for. The number of posts that
are budgeted for in the financial year is dependent on municipal revenue and associated fiscal demands
and are funded at the commencement of the financial year. The number of posts that were vacant and
budgeted for, as well as the actual positions filled is indicated in the tables below by post level and
functional level. 35 funded posts were vacant at the end of the financial year representing a vacancy
rate of 6.4%. A vacancy rate above 10% is regarded as a risk. In Departments where work-study
investigations are currently underway, vacancies are not immediately filled pending the outcomes of
the work-study and organisational review reports.
Below is a table that indicates the filled and budgeted vacant posts within the municipality:
Per Functional Level
Functional area Filled Vacant and Funded
Municipal Manager 21 0
Corporate Services 88 5
Technical Services 321 28
Community Services 41 1
Financial Services 63 1
Planning and Environment 11 0
Total 545 35
Table 138.: Vacancy rate per post and functional level
The table below indicates the number of staff per level expressed as total positions and current funded
vacancies.
Salary Level Number of current critical vacancies
Total posts as per organogram
Vacancy job title Vacancies (as a
proportion of total posts per category)
Municipal Manager 0 1 n/a 0%
Chief Financial Officer 0 1 n/a 0%
Other Section 57 Managers
0 4 n/a 0%
Senior management 3 22
Head : Community Development
Head: Planning and Project Management
Head: Electrical Services
13.6%
Professional/Highly Skilled
1 39 Labour Relations Officer
2.5%
Total 4 67 5.9%
Table 139.: Vacancy rate per salary level

CHAPTER 4 – ORGANISATIONAL DEVELOPMENT PERFORMANCE
116 | P a g e
HESSEQUA MUNICIPALITY 2014/15 ANNUAL REPORT
4.2.3 TURNOVER RATE
A high staff turnover may be costly to a municipality and might negatively affect productivity, service
delivery and institutional memory/organizational knowledge. The turnover rate is determined by the
following formula:
The turnover rate for 2014/2015 remained relatively consistent over the last two years at 6% and 5.7%
respectively.
The table below indicates the turn-over rate over the last two years:
Financial year New
appointments Number of Terminations
during the year Turn-over Rate
2013/14 47 35 6.1%
35____ (597* + 536)/2 x 100 = 6.1%
2014/15 23 31 5.7%
31____ (536 + 545)/2 x 100 = 5.7%
Table 140.: Turnover Rate
4.3 MANAGING THE MUNICIPAL WORKFORCE
Managing the municipal workforce refers to analysing and coordinating employee behaviour.
4.3.1 INJURIES
An occupational injury is a personal injury, disease or death resulting from an occupational accident at
the workplace. The health and safety of employees is of paramount importance. The injury on duty
cases decreased by 1 from 90 to 89. No serious injuries were reported. Health and Safety
representatives are appointed in each workplace and are trained. Monthly reports are completed by the
Safety Committee structures and progress is reported via a quarterly chairpersons’ meeting and the
Health and Safety Officer to the respective Managers to complete a feedback loop for reporting, acting
upon and correcting unsafe work areas.
The table below indicates the total number of injuries on duty reported within the different
departments:
Directorates 2013/14 2014/15
Municipal Manager 0 0

CHAPTER 4 – ORGANISATIONAL DEVELOPMENT PERFORMANCE
117 | P a g e
HESSEQUA MUNICIPALITY 2014/15 ANNUAL REPORT
Directorates 2013/14 2014/15
Corporate Services 4 1
Technical Services 74 82
Community Services 8 2
Financial Services 4 3
Planning 0 1
Total 90 89
Table 141.: Injuries
4.3.2 SICK LEAVE
The number of sick leave days taken by employees has service delivery and cost implications. The
monitoring of sick leave identifies certain patterns or trends. Once these patterns are identified,
corrective action must be taken. The management of sick leave has enjoyed specific attention in the
last half of the review period. The total number of workdays lost due to sick leave during the 2014/15
financial year shows a decrease of 250.5 days compared to the previous financial year.
The table below indicates the total number sick leave days taken within the different directorates:
Directorates 2013/14 2014/15
Municipal Manager 37 86.5
Corporate Services 395 471
Technical Services 2 410 2078.5
Community Services 255.5 311
Financial Services 383.5 247.5
Planning 15.5 24.5
Total 3 496.5 3219
Table 142.: Sick Leave
4.3.3 HR POLICIES AND PLANS
Policies and plans provide guidance for fair and consistent service conditions for staff.
The table below shows the HR policies that were approved and/or reviewed in this financial year.
Name of policy Date approved/ revised
5/8th Employment Policy 27 August 2014
Cell-phone usage Policy 27 August 2014
Acting Policy 2 April 2015
Bereavement Policy 2 April 2015
Leave Policy 26 June 2015
Training and Development Policy 26 June 2015
Table 143.: HR policies and plans
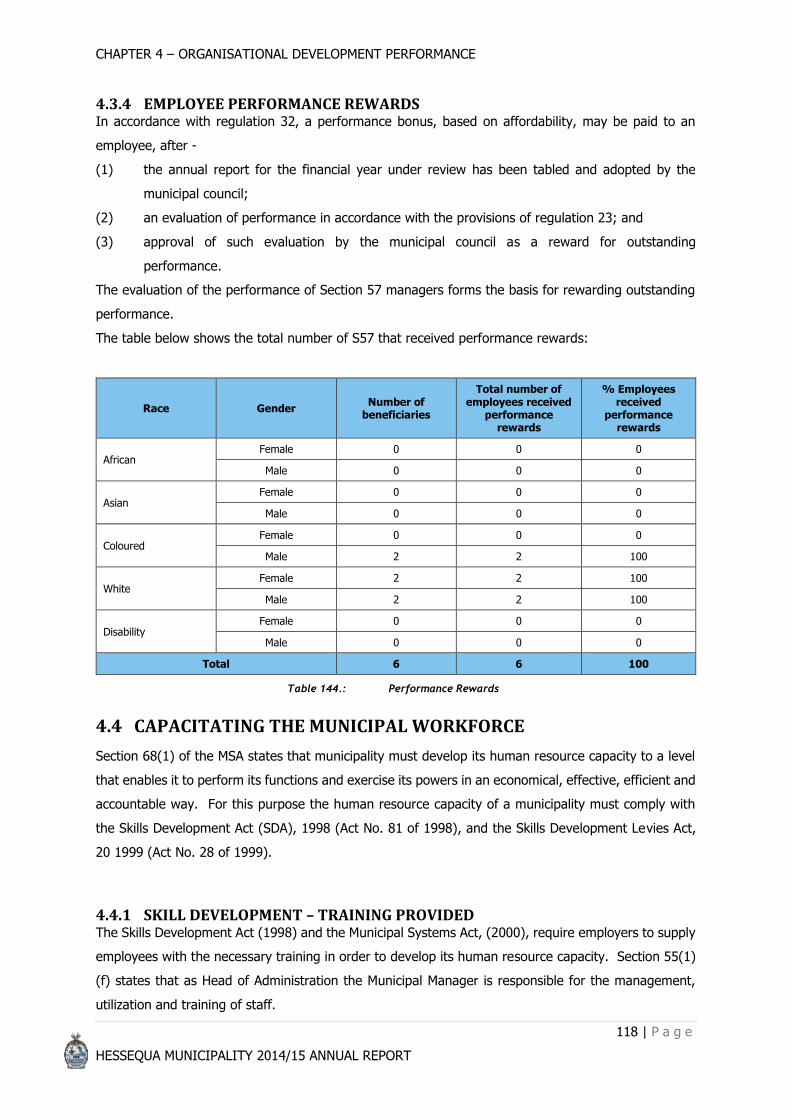
CHAPTER 4 – ORGANISATIONAL DEVELOPMENT PERFORMANCE
118 | P a g e
HESSEQUA MUNICIPALITY 2014/15 ANNUAL REPORT
4.3.4 EMPLOYEE PERFORMANCE REWARDS In accordance with regulation 32, a performance bonus, based on affordability, may be paid to an
employee, after -
(1) the annual report for the financial year under review has been tabled and adopted by the
municipal council;
(2) an evaluation of performance in accordance with the provisions of regulation 23; and
(3) approval of such evaluation by the municipal council as a reward for outstanding
performance.
The evaluation of the performance of Section 57 managers forms the basis for rewarding outstanding
performance.
The table below shows the total number of S57 that received performance rewards:
Race Gender Number of
beneficiaries
Total number of employees received
performance rewards
% Employees received
performance rewards
African Female 0 0 0
Male 0 0 0
Asian Female 0 0 0
Male 0 0 0
Coloured Female 0 0 0
Male 2 2 100
White Female 2 2 100
Male 2 2 100
Disability Female 0 0 0
Male 0 0 0
Total 6 6 100
Table 144.: Performance Rewards
4.4 CAPACITATING THE MUNICIPAL WORKFORCE
Section 68(1) of the MSA states that municipality must develop its human resource capacity to a level
that enables it to perform its functions and exercise its powers in an economical, effective, efficient and
accountable way. For this purpose the human resource capacity of a municipality must comply with
the Skills Development Act (SDA), 1998 (Act No. 81 of 1998), and the Skills Development Levies Act,
20 1999 (Act No. 28 of 1999).
4.4.1 SKILL DEVELOPMENT – TRAINING PROVIDED The Skills Development Act (1998) and the Municipal Systems Act, (2000), require employers to supply
employees with the necessary training in order to develop its human resource capacity. Section 55(1)
(f) states that as Head of Administration the Municipal Manager is responsible for the management,
utilization and training of staff.

CHAPTER 4 – ORGANISATIONAL DEVELOPMENT PERFORMANCE
119 | P a g e
HESSEQUA MUNICIPALITY 2014/15 ANNUAL REPORT
The table below shows the training interventions per occupational categories.
Occupational categories
Gender
Training provided within the reporting period (2014/2015)
Learnerships Skills programmes & other short courses
Total
Actual Target Actual Target Actual Target %
Variance
Managers Female - - 1 0 1 0 -
Male - - 1 0 1 0 -
Professionals Female - - 2 2 2 2 100.00%
Male - - 2 1 2 1 200.00%
Technicians and Trade Workers
Female - - 0 0 0 0 -
Male 13 - 52 52 65 63 103.17%
Clerical and Administrative
Female - - 2 2 2 2 100.00%
Male - - 3 1 3 1 300.00%
Community and Personal Service
Female - - 0 0 0 0 -
Male - - 1 1 1 1 100.00%
Sales Workers Female 1 1 - - 1 1 100.00%
Male - - 19 18 19 18 105.56%
Machinery and Drivers
Female - - 0 0 0 0 -
Male - - 27 25 27 25 108.00%
Elementary Workers
Female - - 10 10 10 10 100.00%
Male 2 - 64 64 66 66 100.00%
Sub total Female - - 16 15 16 15 106.67%
Male - - 184 175 184 175 105.14%
Total 0 0 200 190 200 190 105.26%
Table 145.: Skills Development
4.4.2 SKILL DEVELOPMENT – BUDGET ALLOCATION The table below indicates that a total amount of R957 175 was allocated to the workplace skills plan
and that 93.8% of the total amount was spent in the 2014/15 financial year. Unspent grants from the
previous year was used for training, therefore more money was spent on training than was allocated
Total personnel budget Total Allocated Total Spent % Spent
R R R
112 198 052 957 175 897 700 93.8104
Table 146.: Budget allocated and spent for skills development
4.4.3 MFMA COMPETENCIES The Government Gazette of 14 March 2014 (37432) outlined that the Finance Minister Pravin Gordhan
has extended the cut-off date by which municipalities are required to employ financially qualified

CHAPTER 4 – ORGANISATIONAL DEVELOPMENT PERFORMANCE
120 | P a g e
HESSEQUA MUNICIPALITY 2014/15 ANNUAL REPORT
officials in terms of the Municipal Regulations on Minimum Competency Levels. The regulations, which
were published in June 2007 in terms of the Municipal Finance Management Act, required municipalities
to employ only officials with a designated higher education financial qualification and a required
minimum competency level.
The exemption is for the period 1 April 2014 to 30 September 2015.
Municipalities will be required to implement the following conditions –
(a) A financial official or supply chain management official who is employed by virtue of the
exemption in paragraph 1(a) must attain the required qualification and competency levels by
30 September 2015. This requirement must be included in the official’s personal development
plan, which forms part of his or her performance agreement.
(b) Such an official appointed by virtue of the exemption in paragraph 1(b) must attain the
required qualification and competency levels within 12 months from the date of appointment.
The employment contract must stipulate that if the required levels are not attained within 12
months, the official’s employment will terminate automatically within one month after the end
of the 12-month period.
(c) A municipality or municipal entity must post the performance agreements and personal
development plans, on its website.
(d) A municipality must submit a report to the National Treasury on the implementation of
these conditions in such format and on such dates as determined by the Treasury.
Three (3) senior managers have completed the required MMC competency levels whilst two (2) have
partially completed the requirements.
4.5 MANAGING THE MUNICIPAL WORKFORCE EXPENDITURE Section 66 of the MSA states that the accounting officer of a municipality must report to the Council on
all expenditure incurred by the municipality on staff salaries, wages, allowances and benefits. This is
in line with the requirements of the Public Service Regulations, (2002), as well as National Treasury
Budget and Reporting Regulations SA22 and SA23.
4.5.1 PERSONNEL EXPENDITURE The percentage personnel expenditure is essential in the budgeting process as it reflects on current
and future efficiency. The table below indicates the percentage of the municipal budget that was spent
on salaries and allowance for the past two financial years and that the municipality is well within the
national norm of between 35 to 40%:
Financial year
Total Expenditure salary and allowances
Total Operating Expenditure Percentage
R’000 R’000
2013/14 108 601 (including Council)
103458 (excluding Council 311 174
33.25
30.72
113 656 (including Council) 312 066 36.42

CHAPTER 4 – ORGANISATIONAL DEVELOPMENT PERFORMANCE
121 | P a g e
HESSEQUA MUNICIPALITY 2014/15 ANNUAL REPORT
Financial year
Total Expenditure salary and allowances
Total Operating Expenditure Percentage
R’000 R’000
2014/15 107 866(excluding Council 34.56
Table 147.: Personnel Expenditure
Below is a summary of Councillor and staff benefits for the year under review:
Financial year 2013/14 2014/15
Description Actual Approved Budget Actual
R’000 R’000 R’000
Councillors (Political Office Bearers plus Other)
Basic Salary 3 440 3936 3901
UIF, Medical and Pension Fund 143 164 167
Vehicle 1 194 1366 1356
Cellphone 365 392 367
Housing 0
Performance 0
Other 0
In-kind Benefits 0
Sub Total 5142 5858 5791
% increase/(decrease) 11.21%
Senior Managers of the Municipality
Salary 3 938 3977 3977 4263
UIF, Medical Aid– and Pension Contributions
846 904 904 918
Medical Aid Contributions 0
Motor Vehicle Allowance 409 390 390 372
Cell phone Allowance 52 52 52 114
Housing allowance 0
Performance Bonus 725 769 769 706
Other Benefits or Allowances 2 051 415 415 78
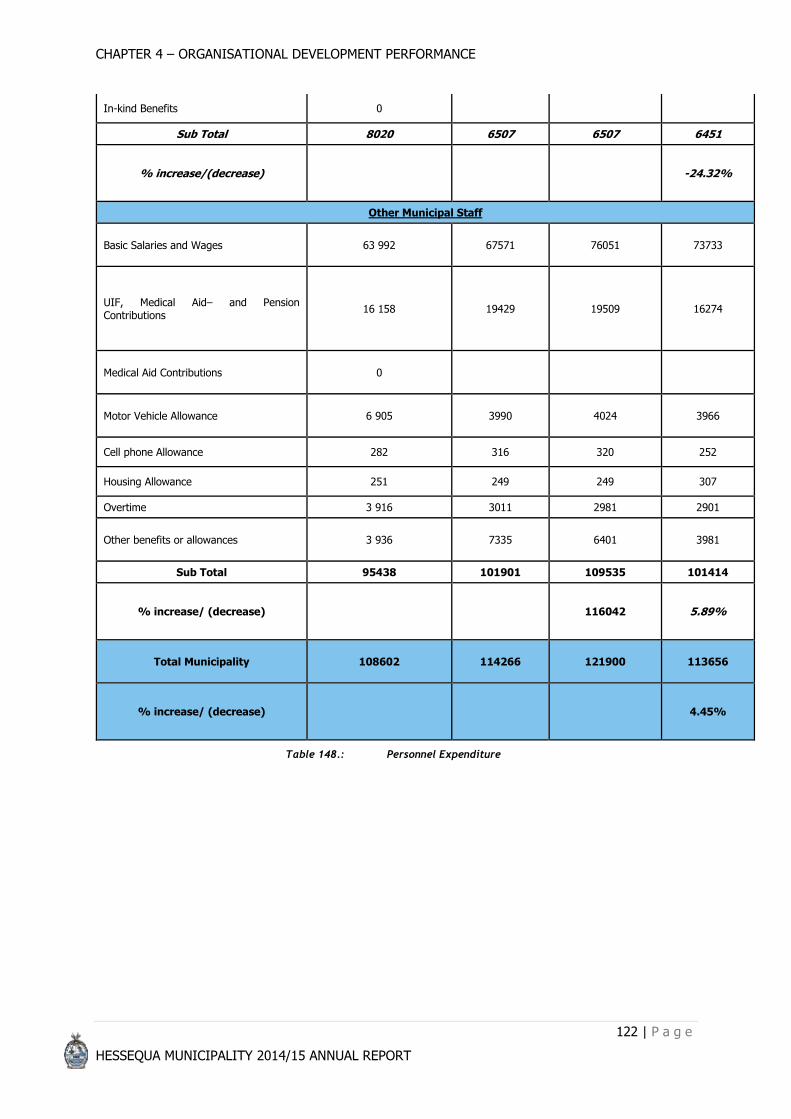
CHAPTER 4 – ORGANISATIONAL DEVELOPMENT PERFORMANCE
122 | P a g e
HESSEQUA MUNICIPALITY 2014/15 ANNUAL REPORT
In-kind Benefits 0
Sub Total 8020 6507 6507 6451
% increase/(decrease) -24.32%
Other Municipal Staff
Basic Salaries and Wages 63 992 67571 76051 73733
UIF, Medical Aid– and Pension Contributions
16 158 19429 19509 16274
Medical Aid Contributions 0
Motor Vehicle Allowance 6 905 3990 4024 3966
Cell phone Allowance 282 316 320 252
Housing Allowance 251 249 249 307
Overtime 3 916 3011 2981 2901
Other benefits or allowances 3 936 7335 6401 3981
Sub Total 95438 101901 109535 101414
% increase/ (decrease) 116042 5.89%
Total Municipality 108602 114266 121900 113656
% increase/ (decrease) 4.45%
Table 148.: Personnel Expenditure

CHAPTER 5 – FINANCIAL PERFORMANCE
123 | P a g e
HESSEQUA MUNICIPALITY 2014/15 ANNUAL REPORT
Chapter 5:
Financial Performance

CHAPTER 5 – FINANCIAL PERFORMANCE
124 | P a g e
HESSEQUA MUNICIPALITY 2014/15 ANNUAL REPORT
Statement of Financial Performance Figures in Rand
RevenueApproved
budgetAdjustments Final Budget
Actual amounts
on comparable
basis
Difference
between final
budget and
actual
Reference
Revenue from non-exchange transactions Note 57
Property Rates 62 412 084 -500 000 61 912 084 60 793 273 -1 118 811
Fines 4 316 357 17 637 118 21 953 475 36 681 634 14 728 159 Rev 1
Licences and permits 307 136 0 307 136 208 337 -98 799
Income from agency services 1 520 959 0 1 520 959 1 660 214 139 255
Donated Property, Plant & Equipment 0 381 000 381 000
Government grants and subsidies 72 299 100 32 091 012 104 390 112 73 077 921 -31 312 191 Rev 2
Gain on revaluation of Investment Property 9 896 600 9 896 600 Rev 6
Revenue from exchange transactions
Service Charges 172 449 789 -191 723 172 258 066 161 217 271 -11 040 795 Rev 3
Rental of facilities and equipment 3 698 489 3 698 489 4 023 975 325 486
Interest earned - external investments 2 580 000 2 580 000 6 051 531 3 471 531 Rev 4
Interest earned - outstanding receivables 1 046 683 1 046 683 1 390 519 343 836
Other income 3 113 634 1 626 112 4 739 746 5 681 950 942 204
Gains on disposal of property, plant and equipment 5 000 000 0 5 000 000 741 332 -4 258 668 Rev 5
Total Revenue 328 744 231 50 662 519 379 406 750 361 805 558 -17 601 191
ExpenditureEmployee related costs 108 408 389 7 633 356 116 041 745 107 865 593 -8 176 152 Exp 1
Remuneration of Councillors 5 857 571 5 857 571 5 791 455 -66 116
Bad debts 3 056 367 14 653 389 17 709 756 28 733 822 11 024 066 Exp 2
Collection costs 1 604 474 1 112 612 2 717 086 2 501 108 -215 978
Depreciation and amortisation 21 794 896 21 794 896 19 922 542 -1 872 354 Exp 3
Repairs and maintenance 20 349 256 -7 201 065 13 148 191 11 836 798 -1 311 393 Exp 4
Interest paid 8 763 154 8 763 154 9 851 156 1 088 002 Exp 5
Bulk purchases 75 204 747 75 204 747 73 946 463 -1 258 284
Contracted services 5 939 247 595 497 6 534 744 6 298 152 -236 592
General expenses 59 266 027 8 604 657 67 870 684 45 318 809 -22 551 875 Exp 6
Total Expenditure 310 244 128 25 398 446 335 642 574 312 065 898 -23 576 677
Surplus/(Deficit) For The Year 18 500 103 25 264 073 43 764 176 49 739 660 5 975 486
HESSEQUA MUNICIPALITY
STATEMENT OF COMPARISON OF BUDGET AND ACTUAL AMOUNTS AT 30 JUNE 2015
CHAPTER 5
This chapter provides details regarding the financial performance of the municipality for the 2014/15 financial year.
A Statement of Comparison

CHAPTER 5 – FINANCIAL PERFORMANCE
125 | P a g e
HESSEQUA MUNICIPALITY 2014/15 ANNUAL REPORT
Statement of Financial PositionApproved
budgetAdjustments Final Budget
Actual amounts
on comparable
basis
Difference
between final
budget and
actual
Reference
Figures in Rand
ASSETS Note 57
Current Assets 70 593 908 39 516 009 110 109 917 174 287 849 64 177 932
Inventory 861 000 -50 682 810 318 905 653 95 335
Trade receivables from exchange transactions 9 561 785 6 585 229 16 147 014 16 750 566 603 552
Trade receivables from non-exchange transactions 13 884 428 5 194 123 19 078 551 18 358 087 -720 464
VAT Receivable 1 473 420 564 771 2 038 191 1 351 217 -686 974 Fp1
Bank, Cash and Cash Equivalents 44 549 000 27 222 568 71 771 568 136 699 553 64 927 985 Fp2
Operating Lease Assets 262 275 0 262 275 220 694 -41 581
Current Portion of Long-term Receivables 2 000 0 2 000 2 080 80
Non-Current Assets 676 955 467 -44 525 892 632 429 575 643 888 990 11 459 415
Property, Plant and Equipment 636 099 468 -52 863 324 583 236 144 584 495 461 1 259 317
Intangible assets 313 000 13 557 326 557 363 545 36 988
Investment Property 40 524 999 0 40 524 999 50 690 000 10 165 001 Fp3
Heritage Assets 0 8 321 875 8 321 875 8 321 875 0
Long-term Receivables 18 000 2 000 20 000 18 110 -1 890
Total Assets 747 549 375 -5 009 883 742 539 492 818 176 839 75 637 347
LIABILITIES
Current Liabilities 49 663 000 2 194 529 51 857 529 97 775 196 45 917 667
Consumer Deposits 3 430 000 31 317 3 461 317 3 741 830 280 513
Provisions 5 000 000 880 983 5 880 983 6 124 344 243 361
Creditors 29 400 000 1 282 229 30 682 229 38 562 580 7 880 351 Fp4
Unspent Conditional Grants and Receipts 1 755 000 0 1 755 000 37 734 862 35 979 862 Fp5
Operating Lease Liabilities 0 0 0 52 742 52 742
Current Portion of Long-term Liabilities 10 078 000 0 10 078 000 11 558 838 1 480 838 Fp6
Non-Current Liabilities 173 651 882 -19 643 414 154 008 468 192 237 165 38 228 697
Long-term Liabilities 107 190 882 -22 117 955 85 072 927 78 840 740 -6 232 187 Fp7
Retirement Benefit Liabilities 52 816 000 934 541 53 750 541 42 945 001 -10 805 540 Fp8
Non-current Provisions 13 645 000 -154 000 13 491 000 68 679 302 55 188 302 Fp9
Trust Fund 1 694 000 1 694 000 1 772 122 78 122
Total Liabilities 223 314 882 -17 448 885 205 865 997 290 012 361 84 146 364
Total Assets and Liabilities 524 234 493 12 439 002 536 673 495 528 164 478 -8 509 017
NET ASSETS 524 234 493 12 439 002 536 673 378 528 164 478 -8 509 017
Statutory Funds 13 807 000 109 441 13 916 441 245 694 -13 670 864 Fp10
Accumulated Surplus 510 427 493 12 329 561 522 756 937 527 918 784 5 161 847 Fp11
Total Net Assets 524 234 493 12 439 002 536 673 495 528 164 478 -8 509 017
HESSEQUA MUNICIPALITY
STATEMENT OF COMPARISON OF BUDGET AND ACTUAL AMOUNTS AT 30 JUNE 2015
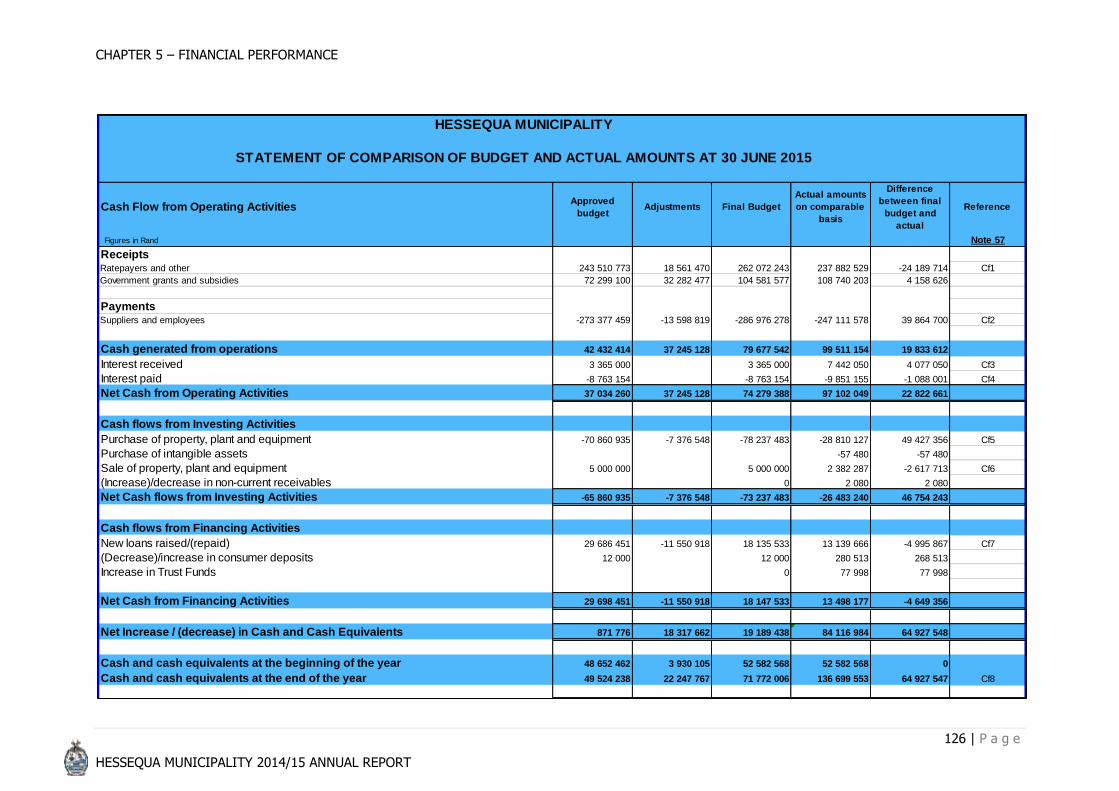
CHAPTER 5 – FINANCIAL PERFORMANCE
126 | P a g e
HESSEQUA MUNICIPALITY 2014/15 ANNUAL REPORT
Approved
budgetAdjustments Final Budget
Actual amounts
on comparable
basis
Difference
between final
budget and
actual
Reference
Figures in Rand Note 57
ReceiptsRatepayers and other 243 510 773 18 561 470 262 072 243 237 882 529 -24 189 714 Cf1
Government grants and subsidies 72 299 100 32 282 477 104 581 577 108 740 203 4 158 626
PaymentsSuppliers and employees -273 377 459 -13 598 819 -286 976 278 -247 111 578 39 864 700 Cf2
Cash generated from operations 42 432 414 37 245 128 79 677 542 99 511 154 19 833 612
Interest received 3 365 000 3 365 000 7 442 050 4 077 050 Cf3
Interest paid -8 763 154 -8 763 154 -9 851 155 -1 088 001 Cf4
Net Cash from Operating Activities 37 034 260 37 245 128 74 279 388 97 102 049 22 822 661
Cash flows from Investing Activities
Purchase of property, plant and equipment -70 860 935 -7 376 548 -78 237 483 -28 810 127 49 427 356 Cf5
Purchase of intangible assets -57 480 -57 480
Sale of property, plant and equipment 5 000 000 5 000 000 2 382 287 -2 617 713 Cf6
(Increase)/decrease in non-current receivables 0 2 080 2 080
Net Cash flows from Investing Activities -65 860 935 -7 376 548 -73 237 483 -26 483 240 46 754 243
Cash flows from Financing Activities
New loans raised/(repaid) 29 686 451 -11 550 918 18 135 533 13 139 666 -4 995 867 Cf7
(Decrease)/increase in consumer deposits 12 000 12 000 280 513 268 513
Increase in Trust Funds 0 77 998 77 998
Net Cash from Financing Activities 29 698 451 -11 550 918 18 147 533 13 498 177 -4 649 356
Net Increase / (decrease) in Cash and Cash Equivalents 871 776 18 317 662 19 189 438 84 116 984 64 927 548
Cash and cash equivalents at the beginning of the year 48 652 462 3 930 105 52 582 568 52 582 568 0
Cash and cash equivalents at the end of the year 49 524 238 22 247 767 71 772 006 136 699 553 64 927 547 Cf8
HESSEQUA MUNICIPALITY
STATEMENT OF COMPARISON OF BUDGET AND ACTUAL AMOUNTS AT 30 JUNE 2015
Cash Flow from Operating Activities
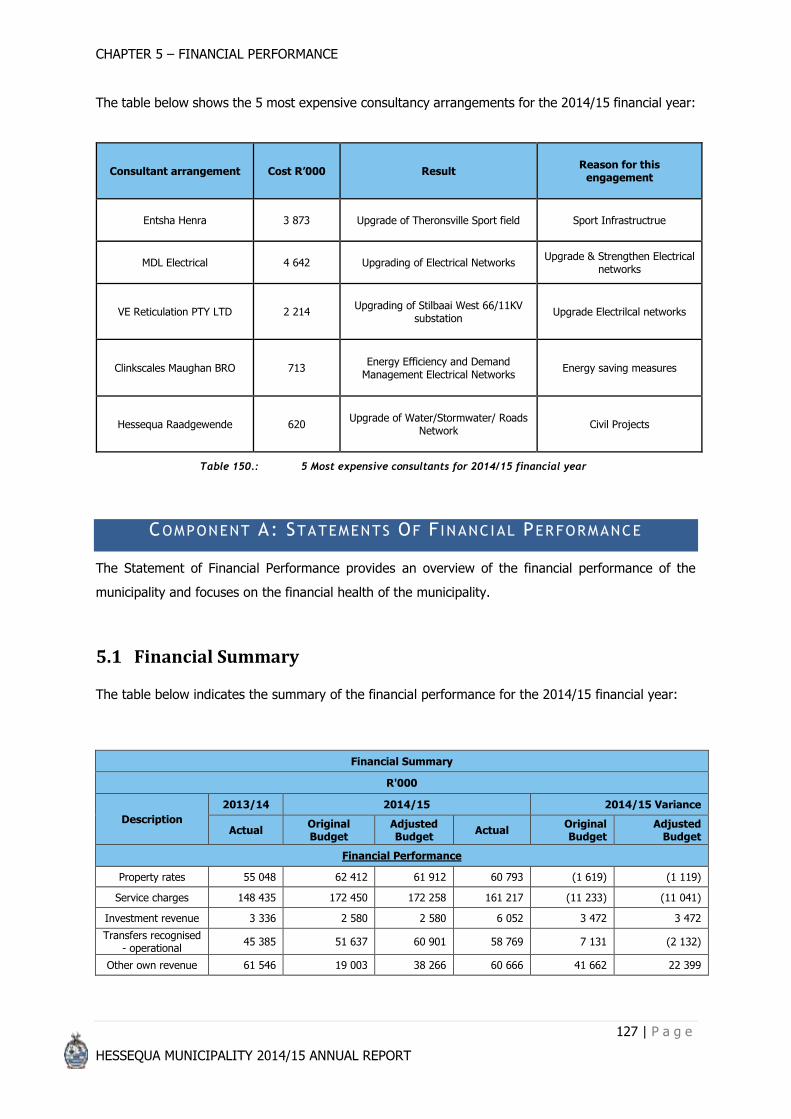
CHAPTER 5 – FINANCIAL PERFORMANCE
127 | P a g e
HESSEQUA MUNICIPALITY 2014/15 ANNUAL REPORT
The table below shows the 5 most expensive consultancy arrangements for the 2014/15 financial year:
Consultant arrangement Cost R’000 Result Reason for this
engagement
Entsha Henra 3 873 Upgrade of Theronsville Sport field Sport Infrastructrue
MDL Electrical 4 642 Upgrading of Electrical Networks Upgrade & Strengthen Electrical
networks
VE Reticulation PTY LTD 2 214 Upgrading of Stilbaai West 66/11KV
substation Upgrade Electrilcal networks
Clinkscales Maughan BRO 713 Energy Efficiency and Demand
Management Electrical Networks Energy saving measures
Hessequa Raadgewende 620 Upgrade of Water/Stormwater/ Roads
Network Civil Projects
Table 150.: 5 Most expensive consultants for 2014/15 financial year
COMPONENT A: STATEMENTS OF F INANCIAL PERFORMANCE
The Statement of Financial Performance provides an overview of the financial performance of the
municipality and focuses on the financial health of the municipality.
5.1 Financial Summary
The table below indicates the summary of the financial performance for the 2014/15 financial year:
Financial Summary
R'000
Description
2013/14 2014/15 2014/15 Variance
Actual Original Budget
Adjusted Budget
Actual Original Budget
Adjusted Budget
Financial Performance
Property rates 55 048 62 412 61 912 60 793 (1 619) (1 119)
Service charges 148 435 172 450 172 258 161 217 (11 233) (11 041)
Investment revenue 3 336 2 580 2 580 6 052 3 472 3 472
Transfers recognised - operational
45 385 51 637 60 901 58 769 7 131 (2 132)
Other own revenue 61 546 19 003 38 266 60 666 41 662 22 399

CHAPTER 5 – FINANCIAL PERFORMANCE
128 | P a g e
HESSEQUA MUNICIPALITY 2014/15 ANNUAL REPORT
Financial Summary
R'000
Description
2013/14 2014/15 2014/15 Variance
Actual Original Budget
Adjusted Budget
Actual Original Budget
Adjusted Budget
Financial Performance
Total Revenue (excluding capital
transfers and contributions)
313 750 308 082 335 917 347 496 39 414 11 579
Employee costs 103 459 108 408 116 042 107 866 -543 (8 176)
Remuneration of councillors
5 143 5 858 5 858 5 791 (66) (66)
Depreciation & asset impairment
38 338 21 795 21 795 19 923 (1 872) (1 872)
Finance charges 8 900 8 763 8 763 9 851 1 088 1 088
Materials and bulk purchases
67 246 75 205 75 205 73 946 (1 258) (1 258)
Transfers and grants 0 0 0 0 0 0
Other expenditure 88 007 90 215 107 980 94 689 4 473 (13 292)
Total Expenditure 311 093 310 244 335 643 312 066 1 822 (23 577)
Surplus/(Deficit) 2576 (2 162) 275 35 431 37 592 35 156
Transfers recognised - capital
16 221 20 662 40 489 14 309 (6 353) (29 180)
Contributions recognised - capital & contributed assets
0 0 0 0 0 0
Surplus/(Deficit) after capital transfers &
contributions
18 878 18 500 43 764 49 740 31 240 5 975
Share of surplus/ (deficit) of associate
0 0 0 0 0 0
Surplus/(Deficit) for the year
18 878 18 500 43 764 49 740 31 240 5 975
Capital expenditure & funds sources
Capital expenditure
Transfers recognised - capital
10 986 20 662 43 489 12 777 (7 885) (27 676)
Public contributions & donations
0 0 0 0 0 0
Borrowing 10 275 39 765 28 214 11 264 (28 501) (16 950)
Internally generated funds
2 502 10 434 9 571 4 827 (5 608) (4 744)
Total sources of capital funds
23 763 70 861 81 274 28 868 (41 993) (49 370)
Financial position
Total current assets 85 878 70 594 110 110 174 288 103 694 64 178
Total non current assets
579 282 676 955
632 430
643 889
(33 066)
8 423
Total current liabilities
54 798 49 663 51 858 97 775 48 112 45 918

CHAPTER 5 – FINANCIAL PERFORMANCE
129 | P a g e
HESSEQUA MUNICIPALITY 2014/15 ANNUAL REPORT
Financial Summary
R'000
Description
2013/14 2014/15 2014/15 Variance
Actual Original Budget
Adjusted Budget
Actual Original Budget
Adjusted Budget
Financial Performance
Total non current liabilities
131 937 173 652 154 008 192 237 18 585 38 229
Community wealth/Equity
478 425 524 235 536 673 528 164 3 930 (11 545)
Cash flows
Net cash from (used) operating
40 996 37 034 74 279 97 102 60 068 22 823
Net cash from (used) investing
-23 632 (65 861) (73 237) (26 483) 39 378 46 754
Net cash from (used) financing
-9 837 29 698 18 148 13 498 16 200) (4 649)
Cash/cash equivalents at the
year end 7 527 45528 71 772 136 700 87 175 64 928
Cash backing/surplus reconciliation
Cash and investments
available 52 583 44 549 71 772 136 700 92 151 64 928
Application of cash and investments
-10 323 20 304 9 555 34 281 13 977 24 726
Balance - surplus (shortfall)
42 260 24 245 62 217 102 419 78 174 40 202
Asset management
Asset register summary (WDV)
575 967 636 412 748 656 818 159 181 746 69 502
Depreciation & asset impairment
37 363 21 795 21 795 19 923 (1 872) (1 872)
Renewal of Existing Assets
23 763 29 534 41 891 13 406 (16 128) (28 485)
Repairs and Maintenance
10 901 20 349 13 213 11 837 (8 512) (1 376)
Free services
Cost of Free Basic Services provided
22 307 18 485 18 485 17 356 (1 129) (1 129)
Revenue cost of free services provided
22 307 23 592 23 592 23 265 (328) (328)
Households below minimum service level
Water 0 0 0 0 0 0
Sanitation/sewerage 0 0 0 0 0 0
Energy 0 0 0 0 0 0
Refuse 0 0 0 0 0 0
Variances are calculated by dividing the difference between actual and original/adjustments budget by the actual.
Table 151.: Financial Performance 2014/15
The table below shows a summary of performance against budgets:

CHAPTER 5 – FINANCIAL PERFORMANCE
130 | P a g e
HESSEQUA MUNICIPALITY 2014/15 ANNUAL REPORT
Financial Year
Revenue Operating expenditure
Budget Actual Diff. %
Budget Actual Diff. %
R’000 R’000 R’000 R’000 R’000 R’000
2013/14 293 858 329 971 -36 113 112.29% 292 019 311 174 -19 155 106.56%
2014/15 379 407 361 806 -17 601 95% 335 643 312 066 -23 577 93%
Table 152.: Performance against budgets
The following graph indicates the various types of revenue items in the municipal budget
for 2014/15.
Graph 3.: Revenue
The following graph indicates the various types of expenditure items in the municipal
budget for 2014/15.

CHAPTER 5 – FINANCIAL PERFORMANCE
131 | P a g e
HESSEQUA MUNICIPALITY 2014/15 ANNUAL REPORT
Graph 4.: Operating expenditure
5.1.1 Revenue collection by Vote
The table below indicates the Revenue collection performance by Vote:
Vote
Description
2013/14 2014/15 2014/15 Variance
Actual Original
Budget
Adjusted
Budget Actual
Original
Budget
Adjusted
Budget
R’000
Vote1 - Executive and Council
30 157 30 571 32 127 32 116 1 545 (11)
Vote2 - Budget and Treasury Office
62 331 68 030 68 216 70 815 3 499 3 313
Vote3 - Corporate Services
20 234 1 428 3 411 13 269 11 841 9 858
Vote4 - Planning and Development
2 584 6 181 6 352 2 921 (3 259) (3 431)
Vote5 - Public Safety
32 514 7 115 24 930 39 607 32 492 14 677
Vote6 - Health 0
Vote7 - Community and Social Services
5 425 6 382 6 404 5 801 (581) (603)
Vote8 - Sports and Recreation
12 059 9 408 13 224 13 681 4 273 457
Vote9 - Housing
8 489 1 791 11 426 11 460 9 669 34

CHAPTER 5 – FINANCIAL PERFORMANCE
132 | P a g e
HESSEQUA MUNICIPALITY 2014/15 ANNUAL REPORT
Vote 10 - Waste Management
8 834 14 381 14 381 10 189 4 192 4 192
Vote11 - Road Transport
7 032 17 049 32 110 8 871 (8 178) (23 239)
Vote12 - Waste Water Management
15 226 28 485 29 563 20 724 (7 761) (8 838)
Vote13 - Water
23 707 28 238 30 579 27 097 (1 141) (3 483)
Vote14 - Electricity
101 095 109 165 106 129 104 784 (4 382) (1 345)
Vote15 - Environmental Management
284 520 555 470 (50) (85)
Total Revenue by
Vote 329 971 328 744 379 407 361 806 33 061 -(17 601)
Variances are calculated by dividing the difference between actual and original/adjustments budget by the actual.
Table 153.: Revenue by Vote
5.1.2 Revenue collection by Source
The table below indicates the revenue collection performance by source for the 2014/15 financial year:
Description
2013/14 2014/15 2014/15 Variance
Actual Original Budget
Adjusted Budget
Actual Original Budget
Adjusted Budget
R’000
Property rates 55 048 62 412 61 912 60 793 (1 619 (1 119)
Property rates - penalties & collection charges
0 0 0 0 0 0
Service Charges - electricity revenue 98 305 105 057 105 057 103 699 (1 358) (1 358)
Service Charges - water revenue 22 320 27 556 27 364 26 265 (1 291) (1 100)
Service Charges - sanitation revenue 12 798 19 109 19 109 14 257 (4 852) (4 852)
Service Charges - refuse revenue 8 780 14 333 14 333 10 137 (4 197) (4 197)
Service Charges - other 6 232 6 394 6 394 6 859 465 465
Rentals of facilities and equipment 3 624 3 698 3 698 4 024 325 325
Interest earned - external investments 3 336 2 580 2 580 6 052 3 472 3 472
Interest earned - outstanding debtors 949 1047 1047 1 391 344 344
Dividends received 0 – – – – –
Fines 29 855 4 316 21 953 36 682 32 365 14 728
Licences and permits 272 307 307 208 (99) (99)
Agency services 1 550 1 521 1 521 1 660 139 139
Transfers recognised - operational 45 092 51 637 60 901 58 769 7 131 (2 132)
Other revenue 6 260 3 114 4 740 5 682 2 568 942
Gains on disposal of PPE 139 5 000 5 000 741 (4 259) (4 259 )
Gains on Revaluation of Investment Property
9897 9897 9897

CHAPTER 5 – FINANCIAL PERFORMANCE
133 | P a g e
HESSEQUA MUNICIPALITY 2014/15 ANNUAL REPORT
Donated PPE 18 897 – – 381 381 381
Environmental Protection 0 – – – – –
Total Revenue (excluding capital transfers and contributions)
313 750 308 082 335 917 347 496 39 414 11 579
Variances are calculated by dividing the difference between actual and original/adjustments budget by the actual.
Table 154.: Revenue by Source
5.1.3 Operational Services Performance
The table below indicates the Operational services performance for the 2014/15 financial year:
Description R’000
2013/14 2014/15 2014/15 Variance
Actual Original Budget
Adjusted Budget
Actual Original Budget
Adjusted Budget
Operating Cost
Water 6 068 8 594 10 378 7 187 (1 407) (3 191)
Waste Water (Sanitation) -275 12 938 14 047 5 995 (6 943) (8 051)
Electricity 18 049 12 850 13 021 14 165 1 316 1 144
Waste Management 325 2 720 2 613 (2 604) (5 325) (5 218)
Housing 109 36) 17 128 164 111
Component A: sub-total 24 276 37 066 40 076 24 871 (12 195) (15 205)
Waste Water (Stormwater Drainage)
0 –
Roads -25 708 (18 241) (3 823) (25 064) (6 823) (21 241)
Transport 0 –
Component B: sub-total -25 708 (18 241) (3 823) (25 064) (6 823) (21 241)
Planning -3 797 (121) (81) (3 190) (3069) (3110)
Local Economic Development 0 (1204) (1014) (829) 374 184
Component C: sub-total - 3797 (1 325) (1 094) (4 019) (2 695) (2 925)
Community & Social Services -4 034 (3 960) (4 029) (3 665) 295 365
Environmental Protection -648 (576) (498) (427) 149 70
Health – –
Security and Safety 156 (5 874) (3 611) 3 611 9 485 7 223
Sport and Recreation -7 581 (7 524) (3 541) (2 112) 5 412 1 429
Corporate Policy Offices and Other 36 134 18 934 20 286 56 545 37 612 36 260
Component D: sub-total 24 027 1 000 8 606 53 952 52 953 45 347
Total Expenditure 18 798 18 500 43 764 49 740 31 240 5 975
In this table operational income (but not levies or tariffs) is offset ageist operational expenditure leaving a net operational expenditure total for each service. Variances are calculated by dividing the difference between actual and
original/adjustments budget by the actual.
Table 155.: Operational Services Performance

CHAPTER 5 – FINANCIAL PERFORMANCE
134 | P a g e
HESSEQUA MUNICIPALITY 2014/15 ANNUAL REPORT
5.2 Financial Performance per Municipal Function
5.2.1 Water Services
Description
2013/14 2014/15
Actual Original Budget
Adjusted Budget
Actual Variance to
Budget
R’000 Water
Total Operational Revenue 23 707 28 238 30 579 27 097 -3 482
Expenditure:
Employees 6 796 3 370 6 450 6 182 -268
Repairs and Maintenance 933 4 097 1 125 1 063 -62
Other 9 910 12 177 12 626 12 665 39
Total Operational Expenditure
17 639 19 644 20 201 19 910 -291
Net Operational (Service) Expenditure
6 068 8 594 10 378 7 187 -3 191
Variances are calculated by dividing the difference between the actual and original budget by the actual.
Table 156.: Financial Performance: Water services
Waste Water (Sanitation)
Description
2013/14 2014/15
Actual Original Budget
Adjusted Budget
Actual Variance to
Budget
R’000 Waste Water
Total Operational Revenue
15 226 28 485 29 563 20 724 -8 839
Expenditure:
Employees 6 496 6 070 7 240 6 770 -470
Repairs and Maintenance 936 2 219 1 109 1 048 -61
Other 8 069 7 258 7 167 6 911 -256
Total Operational Expenditure
15 501 15 547 15 516 14 729 -787
Net Operational (Service) Expenditure
-275 12 938 14 047 5 995 - 8 052
Variances are calculated by dividing the difference between the actual and original budget by the actual.
Table 157.: Financial Performance: Waste Water (Sanitation) services

CHAPTER 5 – FINANCIAL PERFORMANCE
135 | P a g e
HESSEQUA MUNICIPALITY 2014/15 ANNUAL REPORT
Electricity
Description
2013/14 2014/15
Actual Original Budget Adjusted Budget
Actual Variance to
Budget
R’000 Electricity
Total Operational Revenue
101 095 109 165 106 129 104 784 -1 345
Expenditure:
Employees 8 629 6 813 9 730 8 958 -772
Repairs and Maintenance 2 004 5 579 2 608 2 191 -417
Other 72 413 83 924 80 770 79 469 - 1 301
Total Operational Expenditure
83 046 96 316 93 108 90 618 -2 490
Net Operational (Service) Expenditure
18 049 12 849 13 021 14 166 1 145
Variances are calculated by dividing the difference between the actual and original budget by the actual.
Table 158.: Financial Performance: Electricity
Waste Management
Description
2013/14 2014/15
Actual Original Budget
Adjusted Budget
Actual Variance to
Budget
R’000 Waste Management
Total Operational Revenue
8 834 14 381 14 381 10 189 280
Expenditure:
Employees 6 237 6 518 6 564 6 566 2
Repairs and Maintenance 756 741 831 798 -33
Other 1 516 4 401 4 372 5 429 1 057
Total Operational Expenditure
8 509 11 660 11 767 12 793 1 026
Net Operational (Service) Expenditure
325 2 721 2 614 -2604 -5218
Variances are calculated by dividing the difference between the actual and original budget by the actual.
Table 159.: Financial Performance: Waste Management

CHAPTER 5 – FINANCIAL PERFORMANCE
136 | P a g e
HESSEQUA MUNICIPALITY 2014/15 ANNUAL REPORT
5.2.5 Housing
Description
2013/14 2014/15
Actual Original Budget
Adjusted Budget
Actual Variance to
Budget
R’000 Housing
Total Operational Revenue
8 489 1 791 11 426 11 460 34
Expenditure:
Employees 0 0 0 0 0
Repairs and Maintenance
0 0 0 0 0
Other 8 380 1 828 11 409 11 332 -77
Total Operational Expenditure
8 380 1 828 11 409 11 332 111
Net Operational (Service)
Expenditure 109 -37 17 128 111
Variances are calculated by dividing the difference between the actual and original budget by the actual.
Table 160.: Financial Performance: Housing
5.2.6 Roads
Description
2013/14 2014/15
Actual Original Budget
Adjusted Budget
Actual Variance to
Budget
R’000 Roads
Total Operational Revenue
7 032 17 049 32 110 8 871 -23 239
Expenditure:
Employees 13 991 17 747 17 600 17 436 -164
Repairs and Maintenance
3 465 3 759 3 682 3 443 -239
Other 15 284 13 784 14 651 13 055 -1 597
Total Operational Expenditure
32 740 35 290 35 933 33 934 -2000
Net Operational (Service)
Expenditure -25 708 -18 241 -3 823 -25 063 -21 240
Variances are calculated by dividing the difference between the actual and original budget by the actual.
Table 161.: Financial Performance: Roads

CHAPTER 5 – FINANCIAL PERFORMANCE
137 | P a g e
HESSEQUA MUNICIPALITY 2014/15 ANNUAL REPORT
5.2.7 Planning
Description
2013/14 2014/15
Actual Original Budget
Adjusted Budget
Actual Variance to
Budget
R’000 Planning & Development
(Excluding LED)
Total Operational Revenue
2 584 6 181 6 352 2 921 -3 431
Expenditure:
Employees 4 918 4 935 4 910 5 337 427
Repairs and Maintenance
22 37 34 23 -11
Other 513 1 330 1 489 751 -738
Total Operational Expenditure
5 453 6 302 6 433 6 111 -322
Net Operational (Service)
Expenditure -2 869 -121 -81 -3 190 -3 109
Variances are calculated by dividing the difference between the actual and original budget by the actual.
Table 162.: Financial Performance: Planning
5.2.8 Local Economic Development
Description
2013/14 2014/15
Actual Original Budget
Adjusted Budget
Actual Variance to
Budget
R’000 Local Economic Development
Total Operational Revenue
0 0 0 0 0
Expenditure:
Employees 135 598 598 592 -6
Repairs and Maintenance 0
Other 793 606 416 237 -179
Total Operational Expenditure
928 1 204 1 014 829 -185
Net Operational (Service) Expenditure
-928 -1 204 -1 014 -829 185
Variances are calculated by dividing the difference between the actual and original budget by the actual.
Table 163.: Financial Performance: Local Economic Development

CHAPTER 5 – FINANCIAL PERFORMANCE
138 | P a g e
HESSEQUA MUNICIPALITY 2014/15 ANNUAL REPORT
5.2.9 Community & Social Services
Description
2013/14 2014/15
Actual Original Budget
Adjusted Budget
Actual Variance to
Budget
R’000 Community & Social Services
Total Operational Revenue 5 425 6 382 6 404 5 801 -603
Expenditure:
Employees 5 549 7 087 7 087 6 676 -411
Repairs and Maintenance 388 428 422 328 -94
Other 3 522 2 827 2 924 2 462 -462
Total Operational Expenditure 9 459 10 342 10 433 9 466 -967
Net Operational (Service) Expenditure
-4 034 -3 960 -4 029 -3 665 364
Variances are calculated by dividing the difference between the actual and original budget by the actual.
Table 164.: Financial Performance: Community & Social Services
5.2.10 Environmental Protection
Description
2013/14 2014/15
Actual Original Budget
Adjusted Budget
Actual Variance to
Budget
R’000 Environmental Protection
Total Operational Revenue 284 520 555 470 -85
Expenditure:
Employees 3 3 3 4 1
Repairs and Maintenance 54 65 63 13 -50
Other 875 1 028 987 881 -106
Total Operational Expenditure
932 1 096 1 053 898 -155
Net Operational (Service) Expenditure
-648 -576 -498 -428 70
Variances are calculated by dividing the difference between the actual and original budget by the actual.
Table 165.: Financial Performance: Environmental Protection

CHAPTER 5 – FINANCIAL PERFORMANCE
139 | P a g e
HESSEQUA MUNICIPALITY 2014/15 ANNUAL REPORT
5.2.11 Security and Safety
Description
2013/14 2014/15
Actual Original Budget
Adjusted Budget
Actual Variance to
Budget
R’000 Security & Safety
Total Operational Revenue
32 514 7 115 24 930 39 607 14 677
Expenditure:
Employees 6 172 6 803 6 913 6 867 -46
Repairs and Maintenance
483 741 709 636 -73
Other 25 704 5 445 20 921 28 493 7 572
Total Operational Expenditure
32 359 12 989 28 543 35 996 7 453
Net Operational (Service)
Expenditure 155 5 874 -3 613 3 611 7 224
Variances are calculated by dividing the difference between the actual and original budget by the actual.
Table 166.: Financial Performance: Security and Safety
5.2.12 Sport and Recreation
Description
2013/14 2014/15
Actual Original Budget
Adjusted Budget
Actual Variance to
Budget
R’000 Sport & Recreation
Total Operational Revenue
12 059 9 408 13 224 13 681 457
Expenditure:
Employees 9 327 10 154 10 163 9 340 -823
Repairs and Maintenance
1 037 1 510 1 387 1 255 -132
Other 9 276 5 268 5 215 5 199 -16
Total Operational Expenditure
19 640 16 932 16 765 15 794 -971
Net Operational (Service)
Expenditure -7 581 -7 524 -3 541 -2 113 1 428
Variances are calculated by dividing the difference between the actual and original budget by the actual.
Table 167.: Financial Performance: Sport and Recreation

CHAPTER 5 – FINANCIAL PERFORMANCE
140 | P a g e
HESSEQUA MUNICIPALITY 2014/15 ANNUAL REPORT
5.2.13 Corporate Policy Offices & Other
Description
2013/14 2014/15
Actual Original Budget
Adjusted Budget
Actual Variance to
Budget
R’000 Corporate Policy Offices & Other
Total Operational Revenue
113 503 100 029 103 755 116 991 13 236
Expenditure:
Employees 29 209 38 309 38 783 33 138 -5 645
Repairs and Maintenance
823 1 173 1 180 1 039 -141
Other 60 954 41 613 43 505 25 478 -3 274
Total Operational Expenditure
90 986 81 095 83 468 59 655 -9 060
Net Operational (Service)
Expenditure 22 517 18 934 20 287 56 546 36 259
Variances are calculated by dividing the difference between the actual and original budget by the actual.
Table 168.: Financial Performance: Corporate Policy Offices & Other

CHAPTER 5 – FINANCIAL PERFORMANCE
141 | P a g e
HESSEQUA MUNICIPALITY 2014/15 ANNUAL REPORT
5.3 Grants
5.3.1 Grant Performance : Grant Performance
R'000
Description 2013/14 2014/15 2014/15 Variance
Actual Budget Adjusted Budget
Actual Original Budget
Adjusted Budget
Operating Transfers and Grants
National
Government:
31 238 42 659 40 371 40 278 -2 381 -93
Equitable share 28 189 29 993 29 993 29 993 – –
Municipal Systems
Improvement
890 819 820 934 1 15 114
Finance Management 1 258 1 333 1 333 1 450 117 117
Energy Efficiency &
Demand Management
3 509 845 885 (2 624) 40
Expended Public Works
programme (EPWP)
129 335 478 346 11 (132)
Disaster Recovery Grant 6 021 6 021 6 021 – –
Mig 5% 650 883 650 – (233)
Provincial
Government:
13 322 7 608 19 036 17 901 (1 135) (1 135)
Housing 8 354 1 721 11 300 11 250 (50) (50)
Housing Consumer
education
1 (1) (1)
Housing Correction
Previous claims
141 (141) (141)
National Emergency
Housing Programme
50 50 – –
Tuin op die brak 300 300 – –
Financial Support Grant 292 163 997 864 (133) (133)

CHAPTER 5 – FINANCIAL PERFORMANCE
142 | P a g e
HESSEQUA MUNICIPALITY 2014/15 ANNUAL REPORT
Performance
Management Grant
125 – –
Thusong Centre 218 – –
Capacity Building 500 102 (398) (398)
Libraries, CDW, Road
Maintenance
4 333 5 724 5 746 5 336 (411) (411)
Other grant providers 551 646 646 589 (57) (57)
Seta/Disaster
Relief/Trade
Union/HCE/ASLA
551 569 569 569 (0) (0)
National Lottery fund 0 77 77 20 (57) (57)
Total Operating
Transfers and Grants
45 111 50 914 60 055 58 293 (4 049) (1 762)
Variances are calculated by dividing the difference between actual and original/adjustments budget by the actual.
Table 169.: Grant Performance for 2014/15
5.3.2 Conditional Grants (Excluding MIG) Conditional Grants: excluding MIG
R' 000
Details Budget Adjusted Budget
Actual
Variance Major conditions applied by
donor Budget
Adjusted Budget
FMG, MSIG, NEP, EPWP, DME, PGWC:LIBRARY GRANTS , PGWC: FINANCIAL SUPPORT GRANT
8 296 9 155 9 437 1 140 281
Total 8 296 9 155 9 437 1 140 281
This includes Neighbourhood Development Partnership Grant, Public Transport Infrastructure and Systems Grant and any other grant excluding Municipal Infrastructure Grant (MIG). Variances are calculated by dividing the difference between
actual and original/adjustments budget by the actual.
Table 170.: Conditional Grant (excl. MIG)
The municipality has spent all its grant money and meet the conditions thereof.

CHAPTER 5 – FINANCIAL PERFORMANCE
143 | P a g e
HESSEQUA MUNICIPALITY 2014/15 ANNUAL REPORT
5.3.4 Level of Reliance on Grants & Subsidies
Financial year
Total grants Total
Percentage
and subsidies received Operating Revenue
R’000 R’000 %
2013/14 61606 329971 18.67%
2014/15 73077 361806 20.20%
Table 171.: Reliance on grants
The following graph indicates the municipality’s reliance on grants as percentage for the
last two financial years.
Graph 5.: Reliance on grants
The Municipality’s dependency on Grants is more than the previous financial year.
20%
80%
Reliance on Grants 2014/2015
Grants
Revenue
19%
81%
Reliance on grants 2013/2014
Grants
Revenue

CHAPTER 5 – FINANCIAL PERFORMANCE
144 | P a g e
HESSEQUA MUNICIPALITY 2014/15 ANNUAL REPORT
5.4 Asset Management
The Municipality maintained its infrastructure and immovable assets.
5.4.1 Treatment of the Three Largest Assets
Asset 1
Name Stilbaai 66kV Power Line
Description To provide a reliable and sufficient source of electricity.
Asset Type Infrastructure
Key Staff Involved
Manager Technical Services: R Wesso & Head: Civil Civil planning-
Shahida Kennedy
Staff Responsibilities Project management
Asset Value 2013/14 2014/15
0 3 076
Table 172.: Summary of Largest Asset
Asset 2
Name UPGRADING OF SEWERAGE WORKS - RIVERSDAL
Description
Refurbish the existing Riversdale WWTW to a total design capacity of
2.3Ml/d (ADWF)
Asset Type Infrastructure
Key Staff Involved
Manager Technical Services: R Wesso & Head: Civil Civil planning-
Shahida Kennedy
Staff Responsibilities Project management
Asset Value 2013/14 2014/15
0 5 010
Table 173.: Summary of 2nd Largest Asset
Asset 3
Name UPGRADING OF SPORT FACILITIES -THERONSVILLE ALBERTINIA
Description To upgrade existing sport facilities up to league level.
Asset Type Infrastructure
Key Staff Involved
Manager Technical Services: R Wesso & Head: Civil Civil planning-
Shahida Kennedy
Staff Responsibilities Project management
Asset Value 2013/14 2014/15
0 2 410
Table 174.: Summary of 3rd Largest Asset

CHAPTER 5 – FINANCIAL PERFORMANCE
145 | P a g e
HESSEQUA MUNICIPALITY 2014/15 ANNUAL REPORT
One of the recommendations in the approved financial plan of the Council is not to neglect the
replacement of existing assets.
5.4.2 Repairs and Maintenance
Description 2013/14 2014/15
R’000 R’000
Total Operating Expenditure 311 174 312066
Repairs and Maintenance 10 901 11 837
% of total OPEX 3.50% 3.79%
Table 175.: Repairs & maintenance as % of total Operating Expenditure
The following graph indicates the percentage of the budget that was spent on repairs &
maintenance in relation to the operational expenditure.
Graph 6.: Repairs &Maintenances. Operational Expenditure
The repairs and maintenance costs above do not include employee costs associated with repairs and
maintenance, since the municipality do not take these costs into account when calculating the total
repairs and maintenance costs. The aforementioned will bring the percentage spend on repairs and
maintenance costs closer to the norm of approximately 7%.
96%
4%
Repairs & Maintenance
Total OperatingExpenditure
Repairs and Maintenance

CHAPTER 5 – FINANCIAL PERFORMANCE
146 | P a g e
HESSEQUA MUNICIPALITY 2014/15 ANNUAL REPORT
5.5 Financial Ratios Based on Key Performance Indicators
5.5.1 Liquidity Ratio
Description Basis of calculation
2013/14 2014/15
Audited outcome
Audit outcome
Current Ratio Current assets/current liabilities 1.66 1.78
Current Ratio adjusted for aged debtors
Current assets less debtors > 90 days/current liabilities
1.6 1.5
Liquidity Ratio Monetary Assets/Current Liabilities 1.64 1.77
Table 176.: Liquidity Financial Ratio
Financial year Total Assets Total Liabilities
Ratio
R’000 R’000
2013/14 662 311 478 271 1.38:1
2014/15 818 178 290 012 2. 82:1
Table 177.: Liquidity Financial Ratio
5.5.2 IDP Regulation Financial Viability Indicators
Description Basis of calculation
2013/14 2014/15
Audited outcome Audit outcome
Cost Coverage (Available cash + Investments)/monthly fixed operational expenditure
2.72 7.06
Total Outstanding Service Debtors to Revenue
Total outstanding service debtors/annual revenue received for services
0.11 0.1
Debt coverage (Total Operating Revenue - Operating Grants)/Debt service payments due within financial year)
8 14.4
Table 178.: Financial Viability National KPAs
5.5.3 Creditors Management
Description Basis of calculation 2013/14 2014/15
Audited outcome Audit outcome
Creditors System Efficiency % of Creditors Paid Within Terms (within`MFMA' s 65(e))
100% 100%
Table 179.: Creditors Management

CHAPTER 5 – FINANCIAL PERFORMANCE
147 | P a g e
HESSEQUA MUNICIPALITY 2014/15 ANNUAL REPORT
5.5.4 Borrowing Management
Description Basis of calculation
2013/14 2014/15
Audited outcome Audit outcome
Capital Charges to Operating Expenditure
Interest & Principal Paid /Operating Expenditure
6.05% 6.42%
Table 180.: Borrowing Management
5.5.5 Employee costs
Description Basis of calculation 2013/14 2014/15
Audited outcome Audit outcome
Employee costs Employee costs/(Total Revenue
- capital revenue) 32.85% 31.04%
Table 181.: Employee Costs
COMPONENT B: SPENDING AGAINST CAPITAL BUDGET
5.6 Analysis of Capital and operating expenditure
R million Original Budget
Adjusted Budget
Actual Original Budget
variance
Adjusted Budget
Variance
Capital Expenditure 70 861 81 274 28 868 41 993 52 406
Operating Expenditure 310 244 335 642 312 066 1 822 23 576
Total expenditure (Capital) 70 861 81 274 28 868 41 993 52 406
Water and sanitation 20 750 18 432 7 025 -13 725 2 763
Electricity 27 692 21 681 7 845 -19 847 1 845
Housing 0 0 0 0
Roads, Pavements, Bridges and storm water 13 094 26 763 2 604 -10 490 599
Other 9 325 14 398 11 394 2 069 1 274
Total Finance Source - Capital 70 861 81 274 28 868 -41 993 -52 406
External Loans 39 765 28 214 11 264 -28 501 -16 950
Internal contributions 10 434 9 571 4 827 -5 608 -4 744
Grants and subsidies 20 662 43 489 12 777 -7 885 -30 712
Other 0 0 0

CHAPTER 5 – FINANCIAL PERFORMANCE
148 | P a g e
HESSEQUA MUNICIPALITY 2014/15 ANNUAL REPORT
R million Original Budget
Adjusted Budget
Actual Original Budget
variance
Adjusted Budget
Variance
Salaries, wages and allowances 108 408 116 042 111 638 5 230 -4 404
External loans repaid 8 763 8 763 8 587 -176 -176
Operating Revenue 328744 379407 361806 33062 -17601
Property rates 62674 62174 60793 -1881 -1381
Service charges 172449 172258 161512 -10937 -10746
Other own revenue 93621 144975 139501 45880 -5474
Operating Expenditure 310244 335643 312066 1821 -23578
Employee related costs 108408 116042 107866 -542 -8176
Provision for working capital 3056 17710 28733 25677 11023
Repairs and maintenance 20349 13148 11837 -8512 -1311
Bulk purchases 75205 75205 73946 -1259 -1259
Other expenditure 103226 113538 89683 -13543 -23855
109165 106128 104784 3 477 -1 252
Service charges: Electricity 105057 105057 103699 -1358 -1358
Grants & subsidies: Electricity 4000 963 985 -3015 22
Other revenue: Electricity 108 108 100 -8 -8
96316 93107 90618 -5698 -2489
Employee related costs: Electricity 6813 9730 8958 2145 -772
Provision for working capital: Electricity 1894 1894 2678 784 784
Repairs and maintenance: Electricity 5579 2608 2191 -3388 -417
Bulk purchases: Electricity 69816 69816 68621 -1195 -1195
Other expenditure: Electricity 12214 9059 8170 -4044 -889
28238 30579 27097 -1141 -3482
Service charges: Water 27556 27364 26265 -1291 -1091
Grants & subsidies: Water 650 3183 800 150 -2383
Other revenue: Water 32 32 32 0 0
19644 20201 19910 266 -291
Employee related costs: Water 3370 6450 6182 2812 -268
Provision for working capital: Water 509 509 1003 494 494
Repairs and maintenance: Water 4097 1125 1063 -3034 -62
Bulk purchases: Water 5389 5389 5325 -64 -64
Other expenditure: Water 6279 6728 6337 58 -391
Table 182.: Analysis of Capital and Operating Expenditure

CHAPTER 5 – FINANCIAL PERFORMANCE
149 | P a g e
HESSEQUA MUNICIPALITY 2014/15 ANNUAL REPORT
5.7 Sources of Finance
The table below indicates the capital expenditure by funding source for the 2014/15 financial year:
Capital Expenditure - Funding Sources 2013/14 to 2014/15
R'000
Details
2013/14 2014/15
Actual Original Budget
(OB)
Adjustment Budget
Actual Adjustment
to OB Variance
Actual to OB Variance
External loans 10 275 39765 28214 11264 -28501 -16950
Public contributions and donations
Grants and subsidies 10 986 20662 43489 12777 -7885 -30712
Other / CRR 0 10434 9571 4827 -5608 -4744
Total 23 763 70861 81274 28868 -41993 -52406
Percentage of finance
External loans 43.24% 56.12% 34.71% 39.02% 67.87% 32.34%
Public contributions and donations 0.00%
Grants and subsidies 46.23% 29.16% 53.51% 44.26% 18.78% 58.60%
Other 10.53% 14.72% 11.78% 16.72% 13.35% 9.05%
Water and sanitation 7 263 20750 18432 7025 -13725 -11407
Electricity 4 806 27692 21681 7845 -19847 -13836
Housing 0 0 0 0
Roads and stormwater 5 881 13094 26763 2604 -10490 -24159
Other 5 813 9325 14398 11394 2069 -3004
Total 23763 70861 81274 28868 -41993 -52406
Percentage of expenditure
Water and sanitation 30.56% 29.28% 22.68% 24.33% 32.68% 21.77%
Electricity 20.22% 39.08% 26.68% 27.18% 47.26% 26.40%
Housing 0.00%
Roads and stormwater 24.75% 18.48% 32.93% 9.02% 24.98% 46.10%
Other 24.46% 13.16% 17.72% 39.47% -4.93% 5.73%
Table 183.: Capital Expenditure by funding source
Funding of the capital budget consist of a mix of external loans, grants & subsidies and own funds.
The effect of interest rates on external borrowings was taken into account with the compilation of the
budget.

CHAPTER 5 – FINANCIAL PERFORMANCE
150 | P a g e
HESSEQUA MUNICIPALITY 2014/15 ANNUAL REPORT
5.8 Capital Spending on the 5 Largest Projects
Projects with the highest capital expenditure in 2014/15
Name of Project*
Current Year: 2014/15 Variance Current Year: 2014/15
Approved
Budget
Actual Expenditur
e variance
REFURBISHMENT SEWERAGE WORKS 5 647 5 010 -637
INSTALLATION OF 66/11 KV MAIN SUB-STATIO 16 500 3 707 -12 793
HEAT PUMP INSTALLIONS(ENERGY SAVING) 1 888 1 745 -143
STORMWATER ALOERIDGE - RIVERSDAL 1 737 1 522 -215
UPGRADING OF SPORT FACILITIES -THERONSVILE 1 628 1 422 -206
Table 184.: Capital Expenditure on the 5 Largest Projects
Name of Project INSTALLATION OF 66/11 KV MAIN SUB-STATIO
Objective of Project To provide a reliable and sufficient source of electricity.
Delays None
Future Challenges Time Constraints
Anticipated citizen benefits 6045 ( STILBAY (3513) + MHFT (2532))
Table 185.: Summary of Installation of 66/11 KV Main Sub-station Still Bay
Name of Project UPGRADING OF SEWERAGE WORKS - RIVERSDALE
Objective of Project
Refurbish the existing Riversdale WWTW to a total design capacity of 2.3Ml/d (ADWF)
Delays Approx 2 months delay while awaiting approval of additional funding
Future Challenges
No challenges whatsoever. None future challenges expected.
Anticipated citizen benefits
16172 ( Riversdal)
Table 186.: Summary of Upgrading of Sewerage Works - Riversdale

CHAPTER 5 – FINANCIAL PERFORMANCE
151 | P a g e
HESSEQUA MUNICIPALITY 2014/15 ANNUAL REPORT
Name of Project HEAT PUMP INSTALLATIONS (ENERGY SAVING)
Objective of Project
To upgrade existing sport facilities up to league level.
Delays
Approx. 3 months delay while awaiting approval of additional funding.
Future Challenges
Obtaining funding for phase 2 ( Tennis, Netbal and Lighting)
Anticipated citizen benefits
6372 ( Albertinia)
Table 187.: Summary of Heat Pump installations (energy saving)
Name of Project STORMWATER ALOERIDGE - RIVERSDALE
Objective of Project
Energy saving implements was installed to lower the usage of electricity
Delays None
Future Challenges None
Anticipated citizen benefits 52641
Table 188.: Summary of Upgrading of Stormwater Aloeridge – Riversdale
Name of Project UPGRADING OF SPORT FACILITIES -THERONSVILLE
Objective of Project To upgrade the stormwater infrastructure of Aloeridge
Delays Additional works caused delays of approximately 2 weeks
Future Challenges None
Anticipated citizen benefits 16172
Table 189.: Summary of Upgrading of Sport Facilities - Theronsville
5.9 Basic Service and Infrastructure Backlogs – Overview
5.9.1 Municipal Infrastructure Grant (MIG)
This grant is intended to provide specific capital finance for basic municipal infrastructure backlogs for
poor households, micro enterprises and social institutions servicing poor communities.

CHAPTER 5 – FINANCIAL PERFORMANCE
152 | P a g e
HESSEQUA MUNICIPALITY 2014/15 ANNUAL REPORT
Municipal Infrastructure Grant (MIG)* Expenditure 2014/15 on Service backlogs
R 000
Details Approved
Budget Actual
Variance from
Approved
Budget
Infrastructure - Road transport 1737 1522 -215.00
Storm water
Infrastructure - Electricity 0 0 0
Street Lighting
Infrastructure - Water 2300 132 -2168.00
Dams & Reservoirs
Infrastructure - Sanitation 9911 5142 -4769.00
Reticulation
Other: 1628 1422 -206.00
Total 15576 8218 -7358
* MIG is a government grant program designed to fund a reduction in service backlogs, mainly: Water; Sanitation; Roads; Electricity. Expenditure on new, upgraded and renewed infrastructure. Variances are calculated by dividing the difference between actual and original/adjustments budget by the actual.
Table 190.: Municipal Infrastructure Grant (MIG)
All MIG funds received are utilised to improve and provided services to previously disadvantaged areas.
COMPONENT C: CASH FLOW MANAGEMENT AND INVESTMENTS
Accurate cash flow projections will enable the Council to invest surplus funds at the best interest rate.
Stricter measures have been implemented to ensure more accurate cash flow projections.
The collection of debtors influence the cash flow of the municipality and all the necessary steps are
taken to increase debt recovery.
5.10 Cash Flow table:
Cash Flow Outcomes
R'000
Description
2013/14 2014/15
Actual Approved
Budget Actual
Cash flow from operating activities
Receipts 280 867 370019 353 710
Ratepayers and other 214 658 262072 237528

CHAPTER 5 – FINANCIAL PERFORMANCE
153 | P a g e
HESSEQUA MUNICIPALITY 2014/15 ANNUAL REPORT
Cash Flow Outcomes
R'000
Description
2013/14 2014/15
Actual Approved
Budget Actual
Cash flow from operating activities
Government - operating 45 703 64129 59747
Government - capital 16 221 40453 48993
Interest 4 285 3365 7442
Dividends 0
Payments -239 871 -295739 256 608
Suppliers and employees -230 971 -286976 246757
Finance charges -8 900 -8763 9851
Transfers and Grants
Net cash from/(used) operating activities 40 996 74280 97102
Cash flows from investing activities
Receipts 138 5000 2384
Proceeds on disposal of PPE 136 5000 2382
Decrease (Increase) in non-current debtors
Decrease (increase) other non-current receivables 2 2
Decrease (increase) in non-current investments
Payments -23770 -78237 -28867
Capital assets -23 770 -78237 -28867
Net cash from/(used) investing activities -23 632 -73237 -26 483
Cash flows from financing activities

CHAPTER 5 – FINANCIAL PERFORMANCE
154 | P a g e
HESSEQUA MUNICIPALITY 2014/15 ANNUAL REPORT
Cash Flow Outcomes
R'000
Description
2013/14 2014/15
Actual Approved
Budget Actual
Cash flow from operating activities
Receipts 255 28226 25 140
Short term loans 46
Borrowing long term/refinancing 0 28214 24781
Increase (decrease) in consumer deposits 209 12 281
Payments -10 092 -10078 11 645
Repayment of borrowing -10 092 -10078 11 645
Net cash from/(used) financing activities -9 837 18148 13 495
Net increase/ (decrease) in cash held 7 527 19189 84114
Cash/cash equivalents at the year begin: 45 055 52583 52583
Cash/cash equivalents at the yearend: 52 582 71772 136697
Table 191.: Cash flow
5.11 Gross Outstanding Debtors per Service
Financial year Rates
Trading services
Economic services
Housing rentals
Other Total (Electricity and
Water)
(Sanitation and
Refuse)
R’000 R’000 R’000 R’000 R’000 R’000
2013/14 10425 17866 6487 0 11208 45986
2014/15 10000 19196 7807 0 17343 54346
Difference 425 -1330 -1320 0 -6135 -8360
% growth year on year -4.25% 6.93% 16.91% 0% 35.37% 15.38%
Note: Figures exclude provision for bad debt
Table 192.: Gross outstanding debtors per service
The following graphs indicate the total outstanding debt per type of service for 2013/14
and 2014/15.

CHAPTER 5 – FINANCIAL PERFORMANCE
155 | P a g e
HESSEQUA MUNICIPALITY 2014/15 ANNUAL REPORT
Graph 7.: Service debtors age analysis for the 2014/15 and 2013/14 financial years.
23%
28%
11%
9%
5%
24%
Outstanding debtors as at 30 June 2014
Rates
Electricity
Water
Sanitation
Refuse
Other
Electricity19%
Water10%
Sewerage8%
Waste Management
28%
Other7%
Rates28%
Net Outstanding debtors as at 30 June 2015

CHAPTER 5 – FINANCIAL PERFORMANCE
156 | P a g e
HESSEQUA MUNICIPALITY 2014/15 ANNUAL REPORT
5.12 Total Debtors Age Analysis
Financial year Less than 30 days
Between 30-60 days
Between 60-90 days
More than 90 days
Total
R’000 R’000 R’000 R’000 R’000
2013/14 17406 2677 1008 24895 45986
2014/15 17827 3181 1470 31868 54346
Difference -421 -504 -462 -6973 -8360
% growth year on year 2.36% 15.84% 31.43% 21.88% 15.38%
Note: Figures exclude provision for bad debt. - ( Impairment i.r.o. Traffic Fines is included )
Table 193.: Service debtor age analysis
THERE IS A YEAR ON YEAR INCREASE IN OUTSTANDING DEBTORS; HOWEVER THE MUNICIPALITY MAINTAINED A
COLLECTION RATE OF 98% WHICH IS WELL ABOVE THE NORM FOR MUNICIPALITIES.
5.13 Borrowing and Investments
The outstanding loan of R76 933 at the end of June 2014 do not reflect the 2014/2015 capital spending
of approximately R12 million. The loan was only raised in the 2014/2015 financial year.
5.13.1 Actual Borrowings R'000
Instrument 2013/14 2014/15
Long-Term Loans (annuity/reducing balance) 76 933 90 256
Total 76 933 90 256
Table 194.: Actual Borrowings
COMPONENT D: OTHER F INANCIAL MATTERS
5.14 Supply Chain Management
The Municipality reviews the Supply Chain management Policy annually and complies with the
legislative requirements.
No councillors are members of any committee handling supply chain processes.
Contract management and performance of suppliers are currently being done by SCM in conjunction
with Managers.
5.15 GRAP Compliance
The municipality is GRAP compliant.

CHAPTER 6 – AUDITOR GENERAL FINDINGS
157 | P a g e
HESSEQUA MUNICIPALITY 2014/15 ANNUAL REPORT
Chapter 6:
Auditor General Findings

CHAPTER 6 – AUDITOR GENERAL FINDINGS
158 | P a g e
HESSEQUA MUNICIPALITY 2014/15 ANNUAL REPORT
CHAPTER 6
COMPONENT A: AUDITOR -GENERAL OP IN ION 2014/15
6.1 AUDITOR GENERAL REPORT 2014/15
Auditor-General Report on Performance Information 2014/15
No material findings was raised on the usefulness and
reliability of the reported performance information for the
selected objective, Maintenance and Development of all
infrastructure and services.
No findings
Non-Compliance Issues Findings
A procedure was performed to obtain evidence that the
municipality had complied with applicable legislation
regarding financial matters, financial management and other
related matters. I did not ifentify any instances of material
non-compliance with specific matter in key legislation, as set
out in the general notice in terms of the PAA.
No findings
Table 195.: AG Report on Performance information & Compliance2014/15
COMPONENT B: AUDITOR GENERAL OP IN ION 2014/15
6.2 AUDITOR-GENERAL REPORT 2014/15
Auditor-General Report on Financial Performance 2014/15
Financial Statements presents fairly in all material
aspects, the financial position of the Hessequa Municipality
as at 30 June 2015 and its financial performance and cash
flows for the year then ended, in accordance with SA
Standards of GRAP and the requirements of the MFMA and
DoRa
Unqualified Audit opinion (Cleant Audit)
Table 196.: AG Report on Financial Performance 2014/15

CHAPTER 6 – AUDITOR GENERAL FINDINGS
159 | P a g e
HESSEQUA MUNICIPALITY 2014/15 ANNUAL REPORT

CHAPTER 6 – AUDITOR GENERAL FINDINGS
160 | P a g e
HESSEQUA MUNICIPALITY 2014/15 ANNUAL REPORT

CHAPTER 6 – AUDITOR GENERAL FINDINGS
161 | P a g e
HESSEQUA MUNICIPALITY 2014/15 ANNUAL REPORT

CHAPTER 6 – AUDITOR GENERAL FINDINGS
162 | P a g e
HESSEQUA MUNICIPALITY 2014/15 ANNUAL REPORT

ANNEXURE A – ANNUAL FINANCIAL STATEMENTS & REPORTS AS AT 30 JUNE 2014
163 | P a g e
HESSEQUA MUNICIPALITY 2014/15 ANNUAL REPORT
Annexure A: Hessequa Annual Financial Statements – 30 June 2015

ANNEXURE B – OVERSIGHT REPORT 2014/15
258 | P a g e
HESSEQUA MUNICIPALITY 2014/15 ANNUAL REPORT
Annexure B: Oversight Report (to be included after oversight process
is finalised)