hershey 2004ar
DESCRIPTION
TRANSCRIPT
UNITED STATESSECURITIES AND EXCHANGE COMMISSION
WASHINGTON, D.C. 20549
FORM 10-KH Annual Report Pursuant to Section 13 or 15(d) of the Securities Exchange Act of 1934
For the fiscal year ended December 31, 2004
OR
h Transition Report Pursuant to Section 13 or 15(d) of the Securities Exchange Act of 1934
For the transition period from ______________ to ______________
Commission File Number 1-183
Registrant, State of Incorporation, Address and Telephone Number
HERSHEY FOODS CORPORATION(a Delaware corporation)
100 Crystal A DriveHershey, Pennsylvania 17033
(717) 534-6799
I.R.S. Employer Identification Number 23-0691590
Securities registered pursuant to Section 12(b) of the Act:
Title of each class: Name of each exchange on which registered:
Common Stock, one dollar par value New York Stock Exchange
Securities registered pursuant to Section 12(g) of the Act: Class B Common Stock, one dollar par value
(Title of class)
Indicate by check mark whether the registrant (1) has filed all reports required to be filed by Section 13or 15(d) of the Securities Exchange Act of 1934 during the preceding 12 months (or for such shorter period thatthe registrant was required to file such reports), and (2) has been subject to such filing requirements for the past90 days. Yes H No h
Indicate by check mark if disclosure of delinquent filers pursuant to Item 405 of Regulation S-K is notcontained herein, and will not be contained, to the best of registrant’s knowledge, in definitive proxy orinformation statements incorporated by reference in Part III of this Form 10-K or any amendment to thisForm 10-K. h
Indicate by check mark whether the registrant is an accelerated filer (as defined in Rule 12b-2 of theSecurities Exchange Act of 1934). Yes H No h
State the aggregate market value of the voting and non-voting common equity held by non-affiliatescomputed by reference to the price at which the common equity was last sold, or the average bid and asked priceof such common equity, as of the last business day of the registrant’s most recently completed secondfiscal quarter.
Common Stock, one dollar par value—$7,788,775,836 as of July 2, 2004.Class B Common Stock, one dollar par value—$10,566,512 as of July 2, 2004. While the Class B Common
Stock is not listed for public trading on any exchange or market system, shares of that class are convertible intoshares of Common Stock at any time on a share-for-share basis. The market value indicated is calculated basedon the closing price of the Common Stock on the New York Stock Exchange on July 2, 2004.
Indicate the number of shares outstanding of each of the registrant’s classes of common stock as of the latestpracticable date.
Common Stock, one dollar par value—184,977,601 shares, as of February 22, 2005.Class B Common Stock, one dollar par value—60,836,826 shares, as of February 22, 2005.
DOCUMENTS INCORPORATED BY REFERENCEPortions of the Company’s Proxy Statement for the Company’s 2005 Annual Meeting of Stockholders are
incorporated by reference into Part III of this report.
20
04
An
nu
al R
ep
ort to
Sto
ck
ho
lde
rs

PART I
Item 1. BUSINESS
Hershey Foods Corporation, its wholly-owned subsidiaries and entities in which it has a controllingfinancial interest (the “Company”) are engaged in the manufacture, distribution and sale ofconfectionery, snack, refreshment and grocery products. The Company was organized under thelaws of the State of Delaware on October 24, 1927, as a successor to a business founded in 1894 byMilton S. Hershey.
The Company’s principal product groups include: confectionery and snack products sold in the formof bar goods, bagged items and boxed items; refreshment products sold in the form of gum and mints;and grocery products in the form of baking ingredients, chocolate drink mixes, peanut butter, desserttoppings and beverages. The Company believes it is a leader in many of these product groups in theUnited States, Canada and Mexico. Operating profit margins vary among individual products andproduct groups.
The Company manufactures confectionery and snack products in a variety of packaged formsand markets them under more than 50 brands. The different packaged forms include variousarrangements of the same bar products, such as boxes, trays and bags, as well as a variety of differentsizes and weights of the same bar products, such as snack size, standard, king size, large andgiant bars.
The principal confectionery products sold in the United States include:
ALMOND JOY candy bar HERSHEY’S milk chocolate bar withALMOND JOY, HEATH, HERSHEY’S, almonds
KIT KAT, MR. GOODBAR, REESE’S, HERSHEY’S MINIATURES chocolate barsROLO, and YORK BITES candies HERSHEY’S NUGGETS chocolates
ALMOND JOY, HERSHEY’S, REESE’S, HERSHEY’S S’MORES candy barand YORK SWOOPS candies JOLLY RANCHER candy
HERSHEY’S KISSES brand filled with KIT KAT wafer barcaramel milk chocolates MOUNDS candy bar
HERSHEY’S KISSES brand milk PAYDAY candy barchocolates REESE’S peanut butter cups
HERSHEY’S KISSES brand milk REESE’S PIECES candychocolates with almonds TWIZZLERS candy
HERSHEY’S milk chocolate bar YORK peppermint pattie
The principal snack products sold in the United States include:
HERSHEY’S 1GRAM SUGAR CARB bars HERSHEY’S SMARTZONE nutrition barHERSHEY’S, HERSHEY’S S’MORES and HERSHEY’S, ALMOND JOY, REESE’S
REESE’S SNACK BARZ rice and and YORK cookiesmarshmallow bars
In December 2004, the Company acquired Mauna Loa Macadamia Nut Corporation (“Mauna Loa”).Mauna Loa is the leading processor and marketer of macadamia snacks, with annual sales ofapproximately $80 million. Mauna Loa’s principal products include macadamia nuts and macadamianut confectionery, cookie and snack items sold under the Mauna Loa brand name.
The principal refreshment products sold in the United States include:
BREATH SAVERS mints ICE BREAKERS mints and chewing gumICE BREAKERS LIQUID ICE mints KOOLERZ chewing gum
1
Other confectionery products include:
5TH AVENUE candy bar KIT KAT BIG KAT wafer barCADBURY chocolate bar KRACKEL chocolate barCARAMELLO candy bars MILK DUDS candyFAST BREAK candy bar MR. GOODBAR chocolate barGOOD & PLENTY candy REESE’S NUTRAGEOUS candy barHEATH toffee bar REESE’S SUGAR FREE peanut butterHERSHEY’S, HERSHEY’S KISSES, KIT cups
KAT and REESE’S CARB REESESTICKS wafer barALTERNATIVES chocolate candies ROLO caramels in milk chocolate
HERSHEY’S COOKIES ‘N’ CREME candy SKOR toffee barbar SPECIAL DARK chocolate bar
HERSHEY’S HUGS chocolates SYMPHONY milk chocolate barHERSHEY’S POT OF GOLD boxed TAKE5 candy bar
chocolates WHATCHAMACALLIT candy barHERSHEY’S SUGAR FREE chocolate WHOPPERS malted milk balls
candy YORK SUGAR FREE peppermint pattiesJOLLY RANCHER SUGAR FREE hard ZAGNUT candy bar
candy ZERO candy bar
The Company also manufactures and/or markets grocery products in the baking, beverage, peanutbutter and toppings categories. Principal products in the United States include:
HERSHEY’S BAKE SHOPPE baking chips HERSHEY’S syrupand pieces HERSHEY’S toppings
HERSHEY’S chocolate milk mix REESE’S baking chipsHERSHEY’S cocoa REESE’S peanut butterHERSHEY’S hot cocoa mix
HERSHEY’S chocolate and strawberry flavored milks are produced and sold under license by variousdairies throughout the United States. Baking and various other products are produced and sold underthe HERSHEY’S and REESE’S brand names by third parties that have been granted licenses by theCompany to use these trademarks.
Principal products in Canada include CHIPITS chocolate chips, GLOSETTE chocolate-coveredraisins, peanuts and almonds, OH HENRY! candy bars, POT OF GOLD boxed chocolates, REESEPEANUT BUTTER CUPS candy and TWIZZLERS candy. The Company also manufactures, imports,markets, sells and distributes chocolate products in Mexico under the HERSHEY’S brand name. InOctober 2004, Hershey Mexico, a subsidiary of the Company and one of the leading companiesmanufacturing and selling chocolate, confectionery and flavored milk products in Mexico, acquiredGrupo Lorena, one of Mexico’s top confectionery companies. Grupo Lorena, with annual sales of over$30 million, is the leader in the spicy candy market in Mexico with its PELÓN PELO RICO brand.
The Company has license agreements with several companies to manufacture and/or sell productsworldwide. Among the more significant are agreements with affiliated companies of CadburySchweppes p.l.c. to manufacture and/or market and distribute YORK, PETER PAUL ALMOND JOYand PETER PAUL MOUNDS confectionery products worldwide as well as CADBURY andCARAMELLO confectionery products in the United States. The Company’s rights under theseagreements are extendible on a long-term basis at the Company’s option. The license for CADBURYand CARAMELLO products is subject to a minimum sales requirement that the Company exceededin 2004. The Company also has an agreement with Societe des Produits Nestle SA, which licensesthe Company to manufacture and distribute KIT KAT and ROLO confectionery products in theUnited States. The Company’s rights under this agreement are extendible on a long-term basis atthe Company’s option, subject to certain conditions, including minimum unit volume sales. In 2004,the minimum unit volume requirements were exceeded. The Company has an agreement with an
2
affiliate of Huhtamaki Oy (“Huhtamaki”) pursuant to which it licenses the use of certain trademarks,including GOOD & PLENTY, HEATH, JOLLY RANCHER, MILK DUDS, PAYDAY and WHOPPERSfor confectionery products worldwide. The Company’s rights under this agreement are extendible ona long-term basis at the Company’s option.
The Company’s products are sold primarily to wholesale distributors, chain grocery stores, massmerchandisers, chain drug stores, vending companies, wholesale clubs, convenience stores andconcessionaires by full-time sales representatives, food brokers and part-time retail salesmerchandisers throughout the United States, Canada and Mexico. The Company believes itsproducts are sold in over 2 million retail outlets in North America. In 2004, sales to McLane Company,Inc., one of the largest wholesale distributors in the United States to convenience stores, drug stores,wholesale clubs and mass merchandisers, amounted to approximately 25 percent of the Company’stotal net sales.
The Company manufactures, imports, markets, sells and distributes chocolate products in Brazilunder the HERSHEY’S brand name, including IO-IO hazelnut creme items, and chocolate andconfectionery products sold under the VISCONTI brand name. In Japan, Korea and the Philippines,the Company imports and/or markets selected confectionery and grocery products. The Company alsomarkets confectionery and grocery products in over 60 countries worldwide.
The Company’s marketing strategy is based upon its strong brand equities, product innovation, theconsistently superior quality of its products, manufacturing expertise and mass distributioncapabilities. In addition, the Company devotes considerable resources to the identification,development, testing, manufacturing and marketing of new products. The Company utilizes a varietyof promotional programs for customers as well as advertising and promotional programs forconsumers. The Company employs promotional programs at various times during the year tostimulate sales of certain products. The Company’s sales have typically been highest during the thirdand fourth quarters of the year.
The Company recognizes that the distribution of its products is an important element in maintainingsales growth and providing service to its customers. The Company attempts to meet the changingdemands of its customers by planning optimum stock levels and reasonable delivery times consistentwith achievement of efficiencies in distribution. To achieve these objectives, the Company hasdeveloped a distribution network from its manufacturing plants, distribution centers and fieldwarehouses strategically located throughout the United States, Canada and Mexico. The Companyuses a combination of public and contract carriers to deliver its products from the distribution pointsto its customers. In conjunction with sales and marketing efforts, the distribution system has beeninstrumental in the growth of sales.
From time to time, the Company has changed the prices and weights of its products to accommodatechanges in manufacturing costs, the competitive environment and profit objectives, while at the sametime maintaining consumer value. In December 2004, the Company announced an increase in thewholesale prices of approximately half of its domestic confectionery line. A weighted average increaseof approximately 6 percent on the Company’s standard bar, king-size bar, 6-pack and vending lineswas effective in January 2005 and a weighted average price increase of approximately 4 percent onpackaged candy was effective in February 2005. The price increases represent an average increaseof 3 percent over the entire domestic product line and will help to offset increases in the Company’sinput costs, including raw and packaging materials, fuel, utilities, transportation and employeebenefits. In January 2003, the Company implemented an increase in the wholesale price of itsdomestic standard size, king size, variety pack, 6-pack and 10-pack lines. The effect of all theincreases translated into an approximate 3 percent increase over the entire domestic product line.
The most significant raw material used in the production of the Company’s chocolate products is cocoabeans. This commodity is imported principally from Far Eastern, West African and South Americanequatorial regions. West Africa accounts for approximately 70 percent of the world’s crop. Cocoa beansare not uniform, and the various grades and varieties reflect the diverse agricultural practices and
3
natural conditions found in the many growing areas. The Company buys a mix of cocoa beans andcocoa products to meet its manufacturing requirements.
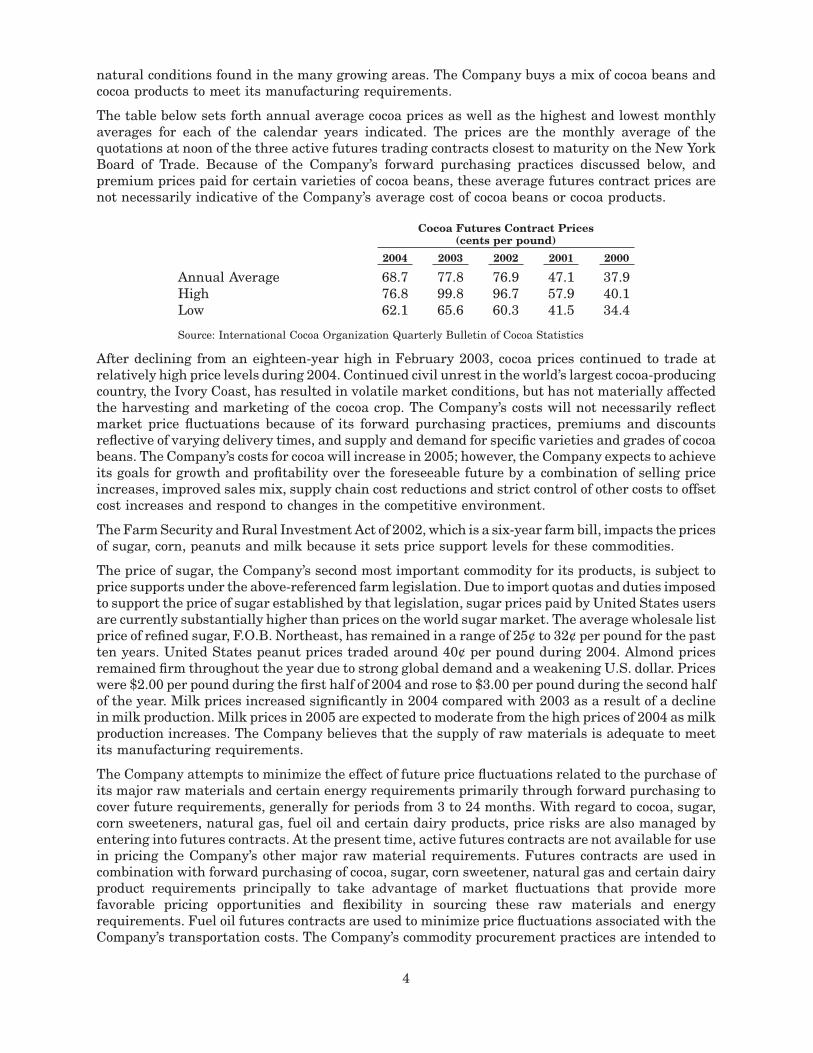
The table below sets forth annual average cocoa prices as well as the highest and lowest monthlyaverages for each of the calendar years indicated. The prices are the monthly average of thequotations at noon of the three active futures trading contracts closest to maturity on the New YorkBoard of Trade. Because of the Company’s forward purchasing practices discussed below, andpremium prices paid for certain varieties of cocoa beans, these average futures contract prices arenot necessarily indicative of the Company’s average cost of cocoa beans or cocoa products.
Cocoa Futures Contract Prices(cents per pound)
2004 2003 2002 2001 2000
Annual Average 68.7 77.8 76.9 47.1 37.9High 76.8 99.8 96.7 57.9 40.1Low 62.1 65.6 60.3 41.5 34.4
Source: International Cocoa Organization Quarterly Bulletin of Cocoa Statistics
After declining from an eighteen-year high in February 2003, cocoa prices continued to trade atrelatively high price levels during 2004. Continued civil unrest in the world’s largest cocoa-producingcountry, the Ivory Coast, has resulted in volatile market conditions, but has not materially affectedthe harvesting and marketing of the cocoa crop. The Company’s costs will not necessarily reflectmarket price fluctuations because of its forward purchasing practices, premiums and discountsreflective of varying delivery times, and supply and demand for specific varieties and grades of cocoabeans. The Company’s costs for cocoa will increase in 2005; however, the Company expects to achieveits goals for growth and profitability over the foreseeable future by a combination of selling priceincreases, improved sales mix, supply chain cost reductions and strict control of other costs to offsetcost increases and respond to changes in the competitive environment.
The Farm Security and Rural Investment Act of 2002, which is a six-year farm bill, impacts the pricesof sugar, corn, peanuts and milk because it sets price support levels for these commodities.
The price of sugar, the Company’s second most important commodity for its products, is subject toprice supports under the above-referenced farm legislation. Due to import quotas and duties imposedto support the price of sugar established by that legislation, sugar prices paid by United States usersare currently substantially higher than prices on the world sugar market. The average wholesale listprice of refined sugar, F.O.B. Northeast, has remained in a range of 25¢ to 32¢ per pound for the pastten years. United States peanut prices traded around 40¢ per pound during 2004. Almond pricesremained firm throughout the year due to strong global demand and a weakening U.S. dollar. Priceswere $2.00 per pound during the first half of 2004 and rose to $3.00 per pound during the second halfof the year. Milk prices increased significantly in 2004 compared with 2003 as a result of a declinein milk production. Milk prices in 2005 are expected to moderate from the high prices of 2004 as milkproduction increases. The Company believes that the supply of raw materials is adequate to meetits manufacturing requirements.
The Company attempts to minimize the effect of future price fluctuations related to the purchase ofits major raw materials and certain energy requirements primarily through forward purchasing tocover future requirements, generally for periods from 3 to 24 months. With regard to cocoa, sugar,corn sweeteners, natural gas, fuel oil and certain dairy products, price risks are also managed byentering into futures contracts. At the present time, active futures contracts are not available for usein pricing the Company’s other major raw material requirements. Futures contracts are used incombination with forward purchasing of cocoa, sugar, corn sweetener, natural gas and certain dairyproduct requirements principally to take advantage of market fluctuations that provide morefavorable pricing opportunities and flexibility in sourcing these raw materials and energyrequirements. Fuel oil futures contracts are used to minimize price fluctuations associated with theCompany’s transportation costs. The Company’s commodity procurement practices are intended to
4

reduce the risk of future price increases, but may also potentially limit the ability to benefit frompossible price decreases.
The primary effect on liquidity from using futures contracts is associated with margin requirementsfor futures contracts related to cocoa, sugar, corn sweeteners, natural gas, fuel oil and certain dairyproducts. Cash outflows and inflows result from original margins that are “good faith deposits”established by futures exchanges to ensure that market participants will meet their contractualfinancial obligations. Additionally, variation margin payments and receipts are required when thevalue of open positions is adjusted to reflect daily price movements. The magnitude of such cashinflows and outflows is dependent upon price coverage levels and the volatility of the markets. Cashflows related to margin requirements historically have not been material to the Company’s totalworking capital requirements.
The Company manages the purchase of forward and futures contracts by developing and monitoringprocurement strategies for each of its major commodities. These procurement strategies are directlylinked to the overall planning and management of the Company’s business, since the cost of rawmaterials, energy and transportation accounts for a significant portion of cost of sales. Procurementstrategies with regard to cocoa, sugar and other major raw material requirements, energyrequirements and transportation costs are developed by the analysis of fundamentals, includingweather and crop analysis, imbalances between supply and demand, currency exchange rates,political unrest in producing countries, speculative influences and by discussions with marketanalysts, brokers and dealers. Procurement strategies are determined, implemented and monitoredon a regular basis by senior management. Procurement activities for all major commodities are alsoreported to the Company’s Board of Directors (the “Board”) on a regular basis.
CompetitionMany of the Company’s brands enjoy wide consumer acceptance and are among the leading brandssold in the marketplace. However, these brands are sold in highly competitive markets and competewith many other multinational, national, regional and local firms, some of which have resources inexcess of those available to the Company.
TrademarksThe Company owns various registered and unregistered trademarks and service marks andhas rights under licenses to use various trademarks that are of material importance to theCompany’s business.
Backlog of OrdersThe Company manufactures primarily for stock and fills customer orders from finished goodsinventories. While at any given time there may be some backlog of orders, such backlog is not materialin respect to total annual sales, nor are the changes from time to time significant.
Research and DevelopmentThe Company engages in a variety of research activities. These principally involve development ofnew products, improvement in the quality of existing products, improvement and modernization ofproduction processes and the development and implementation of new technologies to enhance thequality and value of both current and proposed product lines. Information concerning the Company’sresearch and development expense is contained in Note 1 of the Notes to the Consolidated FinancialStatements (Item 8. Financial Statements and Supplementary Data).
RegulationThe Company’s domestic plants are subject to inspection by the Food and Drug Administration andvarious other governmental agencies, and its products must comply with regulations under theFederal Food, Drug and Cosmetic Act and with various comparable state statutes regulating themanufacturing and marketing of food products.
5
Environmental Considerations
In the past the Company has made investments based on compliance with environmental laws andregulations. Such expenditures have not been material with respect to the Company’s capitalexpenditures, earnings or competitive position.
Employees
As of December 31, 2004, the Company had approximately 13,700 full-time and 2,300 part-timeemployees, of whom approximately 5,100 were covered by collective bargaining agreements. TheCompany considers its employee relations to be good.
Financial Information by Geographic Area
The Company’s principal operations and markets are located in the United States. The Company alsomanufactures, markets, sells and distributes confectionery and grocery products in Canada, Mexicoand Brazil, imports and/or markets selected confectionery products in the Philippines, Japan andSouth Korea and markets confectionery products in over 60 countries worldwide. Net sales and long-lived assets of businesses outside of the United States were not significant.
Available Information
The Company’s Annual Report on Form 10-K, Quarterly Reports on Form 10-Q, Current Reports onForm 8-K and amendments to all of the foregoing reports are available, free of charge, in the InvestorRelations section of the Company’s website, www.hersheys.com, as soon as reasonably practicableafter the reports are electronically filed with or furnished to the United States Securities andExchange Commission.
The Board has adopted a Code of Ethical Business Conduct (“CEBC”) applicable to the Company’sdirectors, officers and employees, including without limitation the Company’s Chief Executive Officerand “senior financial officers” (including the Chief Financial Officer, Chief Accounting Officer,Corporate Controller and persons performing similar functions). The CEBC is posted on theCompany’s website at www.hersheys.com in the Investor Relations section. Any amendment of theCEBC or waiver thereof applicable to any director or executive officer of the Company, including theChief Executive Officer or any senior financial officer, will be disclosed on the Company’s websitewithin four business days of the date of such amendment or waiver. In the case of a waiver, the natureof the waiver, the name of the person to whom the waiver was granted and the date of the waiverwill also be disclosed.
The Board has also adopted and posted in the Investor Relations section of its website the Company’sCorporate Governance Guidelines and Charters for each of the Board’s standing committees. TheCompany will provide without charge to each beneficial owner of its Common Stock and Class BCommon Stock (“Class B Stock”), upon such stockholder’s request, a copy of the CEBC, the Company’sCorporate Governance Guidelines or the Charter of any standing committee of the Board. TheCompany will also provide to any such stockholder, upon the stockholder’s request, a copy of one ormore of the Exhibits listed in Part IV of this report upon payment by the stockholder of a nominalfee approximating the Company’s reasonable cost to provide such copy or copies. Requests forcopies should be addressed to Hershey Foods Corporation, Attn: Investor Relations Department,100 Crystal A Drive, Hershey, Pennsylvania 17033-0810.
Safe Harbor Statement
The nature of the Company’s operations and the environment in which it operates subject it tochanging economic, competitive, regulatory and technological conditions, risks and uncertainties. Inconnection with the “safe harbor” provisions of the Private Securities Litigation Reform Act of 1995,the Company notes the following factors that, among others, could cause future results to differmaterially from the forward-looking statements, expectations and assumptions expressed or implied
6
herein. Many of the forward-looking statements contained in this document may be identified by theuse of forward-looking words such as “intend,” “believe,” “expect,” “anticipate,” “should,” “planned,”“estimated,” and “potential,” among others. Factors which could cause results to differ include, butare not limited to: changes in the Company’s business environment, including actions of competitorsand changes in consumer preferences; customer and consumer response to selling price increases;changes in governmental laws and regulations, including taxes; market demand for new and existingproducts; changes in raw material and other costs; pension cost factors, such as actuarialassumptions, market performance and employee retirement decisions; successful resolution ofupcoming labor contract negotiations; and the Company’s ability to implement improvements to andreduce costs associated with the Company’s supply chain.
Item 2. PROPERTIES
The following is a list of the Company’s principal manufacturing properties. The Company owns eachof these properties.
UNITED STATESHershey, Pennsylvania—confectionery and grocery products (3 principal plants)Lancaster, Pennsylvania—confectionery productsOakdale, California—confectionery and grocery productsRobinson, Illinois—confectionery, snack and grocery productsStuarts Draft, Virginia—confectionery, snack and grocery products
CANADASmiths Falls, Ontario—confectionery and grocery products
The following is a list of the locations of the Company’s principal distribution facilities all of whichare leased on a long-term basis.
UNITED STATESEdwardsville, IllinoisPalmyra, PennsylvaniaRedlands, California
CANADAMississauga, Ontario
In addition to the locations indicated above, the Company owns or leases several other propertiesused for manufacturing its products and for sales, distribution and administrative functions. TheCompany’s facilities are efficient and well maintained. These facilities generally have adequatecapacity and can accommodate seasonal demands, changing product mixes and certain additionalgrowth. The largest facilities are located in Hershey, Pennsylvania. Many additions andimprovements have been made to these facilities over the years and they include equipment of thelatest type and technology.
Item 3. LEGAL PROCEEDINGS
The Company has no material pending legal proceedings, other than ordinary routine litigationincidental to its business.
Item 4. SUBMISSION OF MATTERS TO A VOTE OF SECURITY HOLDERS
Not applicable.
7

PART II
Item 5. MARKET FOR THE REGISTRANT’S COMMON EQUITY
On April 21, 2004, the Company’s Board of Directors approved a two-for-one stock split to be effectedin the form of a 100 percent stock dividend to stockholders of record on May 25, 2004. The additionalshares were distributed on June 15, 2004. The Company’s stockholders received one additional sharefor each share in their possession on that date. This did not change the proportionate interest astockholder maintained in the Company. Unless otherwise indicated, all shares and per shareamounts set forth in this report have been adjusted for the two-for-one stock split.
Cash dividends paid on the Company’s Common Stock and Class B Stock were $205.7 million in 2004and $184.7 million in 2003. After adjustment for the two-for-one stock split, the annual dividend rate onthe Common Stock in 2004 was $.88 per share, an increase of 11% over the 2003 rate of $.79 per share.The 2004 dividend increase represented the 30th consecutive year of Common Stock dividend increases.
On February 15, 2005, the Company’s Board of Directors declared a quarterly dividend of $.22 pershare of Common Stock payable on March 15, 2005, to stockholders of record as of February 25, 2005.It is the Company’s 301st consecutive Common Stock dividend. A quarterly dividend of $.20 per shareof Class B Stock also was declared.
The Company’s Common Stock is listed and traded principally on the New York Stock Exchange(“NYSE”) under the ticker symbol “HSY.” Approximately 193.0 million shares of the Company’sCommon Stock were traded during 2004. The Class B Stock is not publicly traded.
The closing price of the Common Stock on December 31, 2004, was $55.54. There were 39,789stockholders of record of the Common Stock and the Class B Stock as of December 31, 2004.
The following table shows the dividends paid per share of Common Stock and Class B Stock and theprice range of the Common Stock for each quarter of the past two years:
Dividends PaidPer Share
Common StockPrice Range*
CommonStock
Class BStock High Low
20041st Quarter $.1975 $.1788 $43.90 $37.282nd Quarter .1975 .1788 46.50 40.553rd Quarter .2200 .2000 49.94 45.034th Quarter .2200 .2000 56.75 45.98
Total $.8350 $.7576
Dividends PaidPer Share
Common StockPrice Range*
CommonStock
Class BStock High Low
20031st Quarter $.1638 $.1475 $34.50 $30.352nd Quarter .1638 .1475 36.41 31.233rd Quarter .1975 .1788 37.10 34.474th Quarter .1975 .1788 39.33 36.34
Total $.7226 $.6526
* NYSE-Composite Quotations for Common Stock by calendar quarter.
The Company’s Board of Directors approved a share repurchase program authorizing the repurchaseof up to $500.0 million of the Company’s Common Stock in December 2002. There were no purchasesof Common Stock by the Company during the fourth quarter of 2004. As of December 31, 2004,$55.0 million remained available for repurchases of Common Stock under the repurchase program.
8
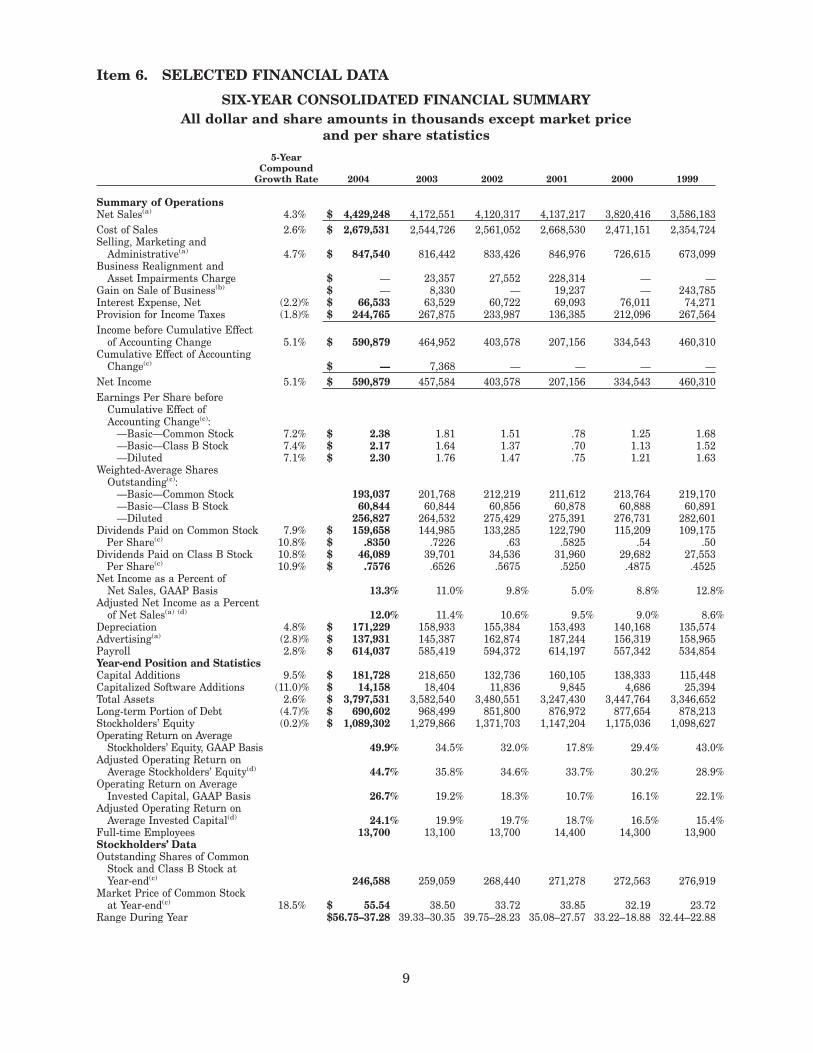
Item 6. SELECTED FINANCIAL DATA
SIX-YEAR CONSOLIDATED FINANCIAL SUMMARYAll dollar and share amounts in thousands except market price
and per share statistics5-Year
CompoundGrowth Rate 2004 2003 2002 2001 2000 1999
Summary of OperationsNet Sales(a) 4.3% $ 4,429,248 4,172,551 4,120,317 4,137,217 3,820,416 3,586,183Cost of Sales 2.6% $ 2,679,531 2,544,726 2,561,052 2,668,530 2,471,151 2,354,724Selling, Marketing and
Administrative(a) 4.7% $ 847,540 816,442 833,426 846,976 726,615 673,099Business Realignment and
Asset Impairments Charge $ — 23,357 27,552 228,314 — —Gain on Sale of Business(b) $ — 8,330 — 19,237 — 243,785Interest Expense, Net (2.2)% $ 66,533 63,529 60,722 69,093 76,011 74,271Provision for Income Taxes (1.8)% $ 244,765 267,875 233,987 136,385 212,096 267,564Income before Cumulative Effect
of Accounting Change 5.1% $ 590,879 464,952 403,578 207,156 334,543 460,310Cumulative Effect of Accounting
Change(c) $ — 7,368 — — — —Net Income 5.1% $ 590,879 457,584 403,578 207,156 334,543 460,310Earnings Per Share before
Cumulative Effect ofAccounting Change(c):
—Basic—Common Stock 7.2% $ 2.38 1.81 1.51 .78 1.25 1.68—Basic—Class B Stock 7.4% $ 2.17 1.64 1.37 .70 1.13 1.52—Diluted 7.1% $ 2.30 1.76 1.47 .75 1.21 1.63
Weighted-Average SharesOutstanding(c):
—Basic—Common Stock 193,037 201,768 212,219 211,612 213,764 219,170—Basic—Class B Stock 60,844 60,844 60,856 60,878 60,888 60,891—Diluted 256,827 264,532 275,429 275,391 276,731 282,601
Dividends Paid on Common Stock 7.9% $ 159,658 144,985 133,285 122,790 115,209 109,175Per Share(c) 10.8% $ .8350 .7226 .63 .5825 .54 .50
Dividends Paid on Class B Stock 10.8% $ 46,089 39,701 34,536 31,960 29,682 27,553Per Share(c) 10.9% $ .7576 .6526 .5675 .5250 .4875 .4525
Net Income as a Percent ofNet Sales, GAAP Basis 13.3% 11.0% 9.8% 5.0% 8.8% 12.8%
Adjusted Net Income as a Percentof Net Sales(a) (d) 12.0% 11.4% 10.6% 9.5% 9.0% 8.6%
Depreciation 4.8% $ 171,229 158,933 155,384 153,493 140,168 135,574Advertising(a) (2.8)% $ 137,931 145,387 162,874 187,244 156,319 158,965Payroll 2.8% $ 614,037 585,419 594,372 614,197 557,342 534,854Year-end Position and StatisticsCapital Additions 9.5% $ 181,728 218,650 132,736 160,105 138,333 115,448Capitalized Software Additions (11.0)% $ 14,158 18,404 11,836 9,845 4,686 25,394Total Assets 2.6% $ 3,797,531 3,582,540 3,480,551 3,247,430 3,447,764 3,346,652Long-term Portion of Debt (4.7)% $ 690,602 968,499 851,800 876,972 877,654 878,213Stockholders’ Equity (0.2)% $ 1,089,302 1,279,866 1,371,703 1,147,204 1,175,036 1,098,627Operating Return on Average
Stockholders’ Equity, GAAP Basis 49.9% 34.5% 32.0% 17.8% 29.4% 43.0%Adjusted Operating Return on
Average Stockholders’ Equity(d) 44.7% 35.8% 34.6% 33.7% 30.2% 28.9%Operating Return on Average
Invested Capital, GAAP Basis 26.7% 19.2% 18.3% 10.7% 16.1% 22.1%Adjusted Operating Return on
Average Invested Capital(d) 24.1% 19.9% 19.7% 18.7% 16.5% 15.4%Full-time Employees 13,700 13,100 13,700 14,400 14,300 13,900Stockholders’ DataOutstanding Shares of Common
Stock and Class B Stock atYear-end(c) 246,588 259,059 268,440 271,278 272,563 276,919
Market Price of Common Stockat Year-end(c) 18.5% $ 55.54 38.50 33.72 33.85 32.19 23.72
Range During Year $56.75–37.28 39.33–30.35 39.75–28.23 35.08–27.57 33.22–18.88 32.44–22.88
9

(a) All years have been restated in accordance with final FASB Emerging Issues Task Force consensuses reached on variousissues regarding the reporting of certain sales incentives.
(b) Includes the gain on the sale of gum brands in 2003, the gain on the sale of the Luden’s throat drops business in 2001and the gain on the sale of the Company’s pasta business in 1999.
(c) All shares and per share amounts have been adjusted for the two-for-one stock split effected in the form of a 100 percentstock dividend distributed on June 15, 2004 to stockholders of record as of May 25, 2004.
(d) Net Income as a Percent of Net Sales, Operating Return on Average Stockholders’ Equity and Operating Return on AverageInvested Capital have been calculated using Net Income, excluding the after-tax impacts of the elimination of amortizationof intangibles for all years, the reduction of the provision for income taxes resulting from the adjustment of the incometax contingency reserves in 2004, the after-tax effect of the 2003, 2002 and 2001 Business Realignment and AssetImpairments Charges, the after-tax effect of incremental expenses to explore the possible sale of the Company in 2002,the 2003, 2001 and 1999 Gain on the Sale of Businesses and the 2000 gain on the sale of certain Corporate aircraft.
Item 7. MANAGEMENT’S DISCUSSION AND ANALYSIS OF FINANCIALCONDITION AND RESULTS OF OPERATIONS
OVERVIEW
The Company concluded a strong year in 2004. Operating results were consistent with management’sstrategies to profitably grow net sales, improve gross margin and carefully control selling, marketingand administrative costs, resulting in balanced, consistent growth in earnings. The Company gainedmarket share in key classes of trade, introduced new product platforms that provide future growthopportunities, offset substantial increases in the cost of major raw materials, primarily cocoa anddairy products, and executed a $500 million share purchase from its major shareholder. The resultwas record sales, profits and earnings per share for the year.
The Company’s long-term goals include increasing net sales 3%–4% per year, increasing gross margin70–90 basis points per year, increasing earnings before interest and income taxes 7%–9% per yearand to increase earnings per share 9%–11% per year. These goals are intended to achieve balanced,sustainable growth over time. In 2004, the Company exceeded all of these goals, except gross marginexpansion which was up 50 basis points, slightly less than the long-term goal.
The Company’s strategy to profitably grow net sales is based upon the introduction of innovative newproducts and limited edition items utilizing its key brands, such as Hershey’s, Reese’s and Hershey’sKisses. During 2004, sales gains included product introductions such as Hershey’s Kisses filled withcaramel, Swoops candies, Reese’s white chocolate peanut butter cups, Ice Breakers Liquid Ice mints,Hershey’s 1Gram Sugar Carb bar, and Hershey’s Take5 candy bar.
The trends of key operating drivers, such as market share, are expected to continue to show positiveresults. During 2004, the Company achieved gains in market share each quarter and strengthenedits confectionery category leadership position. Market share in measured channels increased 1.1share points in the fourth quarter and .6 share points for the year. Measured channels include salesin the food, drug, convenience store and mass merchandiser classes of trade, excluding sales to Wal-Mart Stores, Inc.
Net sales increased approximately 6% in 2004, compared with 2003 net sales, which wereapproximately 1% above 2002. The increase in 2004, and over the three-year period, primarilyresulted from higher unit sales volume due to the introduction of new products and limited editionitems, along with the impact of price increases, improved exchange rates on Canadian sales and, in2004, improved trade promotion efficiency resulting in lower promotional spending as a percentageof sales.
The Company’s strategy to expand gross margin is based upon obtaining price realization byachieving a larger part of its sales growth in its most highly profitable products and channels,improving the efficiency and effectiveness of its trade promotion programs and improving efficienciesin its supply chain. The Company has also implemented selected price increases and weight decreasesto help offset increases in raw material costs, particularly for cocoa and dairy products.
10
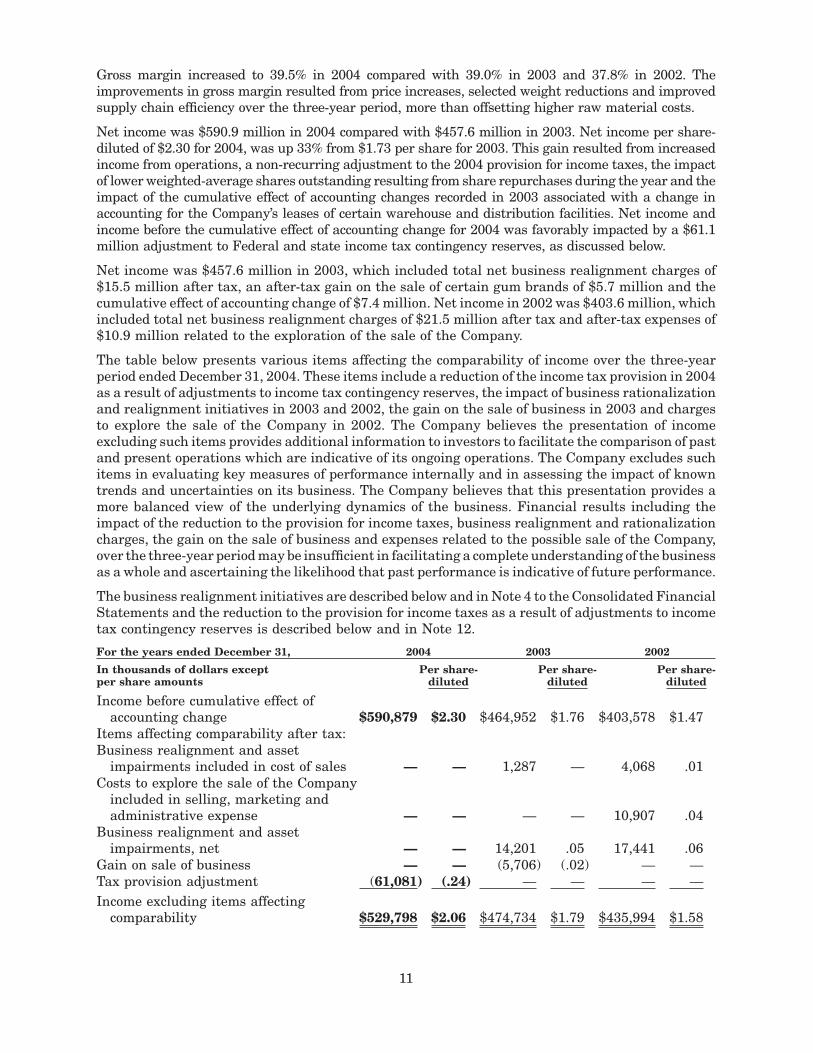
Gross margin increased to 39.5% in 2004 compared with 39.0% in 2003 and 37.8% in 2002. Theimprovements in gross margin resulted from price increases, selected weight reductions and improvedsupply chain efficiency over the three-year period, more than offsetting higher raw material costs.
Net income was $590.9 million in 2004 compared with $457.6 million in 2003. Net income per share-diluted of $2.30 for 2004, was up 33% from $1.73 per share for 2003. This gain resulted from increasedincome from operations, a non-recurring adjustment to the 2004 provision for income taxes, the impactof lower weighted-average shares outstanding resulting from share repurchases during the year and theimpact of the cumulative effect of accounting changes recorded in 2003 associated with a change inaccounting for the Company’s leases of certain warehouse and distribution facilities. Net income andincome before the cumulative effect of accounting change for 2004 was favorably impacted by a $61.1million adjustment to Federal and state income tax contingency reserves, as discussed below.
Net income was $457.6 million in 2003, which included total net business realignment charges of$15.5 million after tax, an after-tax gain on the sale of certain gum brands of $5.7 million and thecumulative effect of accounting change of $7.4 million. Net income in 2002 was $403.6 million, whichincluded total net business realignment charges of $21.5 million after tax and after-tax expenses of$10.9 million related to the exploration of the sale of the Company.
The table below presents various items affecting the comparability of income over the three-yearperiod ended December 31, 2004. These items include a reduction of the income tax provision in 2004as a result of adjustments to income tax contingency reserves, the impact of business rationalizationand realignment initiatives in 2003 and 2002, the gain on the sale of business in 2003 and chargesto explore the sale of the Company in 2002. The Company believes the presentation of incomeexcluding such items provides additional information to investors to facilitate the comparison of pastand present operations which are indicative of its ongoing operations. The Company excludes suchitems in evaluating key measures of performance internally and in assessing the impact of knowntrends and uncertainties on its business. The Company believes that this presentation provides amore balanced view of the underlying dynamics of the business. Financial results including theimpact of the reduction to the provision for income taxes, business realignment and rationalizationcharges, the gain on the sale of business and expenses related to the possible sale of the Company,over the three-year period may be insufficient in facilitating a complete understanding of the businessas a whole and ascertaining the likelihood that past performance is indicative of future performance.
The business realignment initiatives are described below and in Note 4 to the Consolidated FinancialStatements and the reduction to the provision for income taxes as a result of adjustments to incometax contingency reserves is described below and in Note 12.
For the years ended December 31, 2004 2003 2002
In thousands of dollars exceptper share amounts
Per share-diluted
Per share-diluted
Per share-diluted
Income before cumulative effect ofaccounting change $590,879 $2.30 $464,952 $1.76 $403,578 $1.47
Items affecting comparability after tax:Business realignment and asset
impairments included in cost of sales — — 1,287 — 4,068 .01Costs to explore the sale of the Company
included in selling, marketing andadministrative expense — — — — 10,907 .04
Business realignment and assetimpairments, net — — 14,201 .05 17,441 .06
Gain on sale of business — — (5,706) (.02) — —Tax provision adjustment (61,081) (.24) — — — —Income excluding items affecting
comparability $529,798 $2.06 $474,734 $1.79 $435,994 $1.58
11
Income per share-diluted excluding items affecting comparability increased 15% in 2004 and 13%in 2003, reflecting the impact of the Company’s increased sales, improved gross margin, control ofselling, marketing and administrative costs and share repurchases during the period. Thisperformance also drove increases in operating return on average invested capital during the period,as discussed under the heading Return Measures on page 32.
During 2005, the Company expects continued sales growth of 6%−7%, including growth at the topend of its long-term 3%−4% goal for the ongoing business, enhanced by the first year impact of theMauna Loa and Grupo Lorena acquisitions.
The Company expects to continue to improve gross margin in 2005, despite higher input costs,particularly for commodities, transportation and employee benefits. These costs will be more thanoffset by price increases on its bar and packaged candy lines, announced in December 2004, thataverage approximately 3% over the entire domestic product line, and continued improvements insupply chain efficiency. Gross margin is expected to improve 30–40 basis points in 2005, includinggrowth approaching the lower end of the Company’s long-term goal of 70–90 basis points for theongoing business, reduced by the impact of integrating the lower margin Grupo Lorena and MaunaLoa businesses.
The Company expects to achieve 2005 growth in earnings per share-diluted of 9%–11%, excludingitems affecting comparability, in line with its long-term goal. This growth will result from the salesand gross margin increases discussed above, combined with continued control of selling, marketing,and administrative costs and the impact of lower shares outstanding resulting from the sharerepurchases in 2004.
The Company’s cash flow from operations is expected to remain strong. During 2005, the Companywill repay the $201.2 million of 6.7% Notes due in 2005 by utilizing cash provided from operationsand additional short-term borrowings.
Primary challenges in 2005 and beyond include profitable sales growth within the core confectionerycategory and entry into the broader snack market. Focus will continue to be placed on higher marginand faster growth channels. The achievement of the Company’s objectives for sales growth andprofitability will also be challenged by changes in the business and competitive environment whichwill continue to be characterized by increased global competition and retailer consolidation, alongwith social issues such as childhood obesity concerns. In 2005, the Company will continue to be facedwith achieving increased price realization and improved productivity in order to offset higher inputcosts for ingredients, transportation and employee benefits. Successfully meeting these challengesis critical to the Company’s achievement of its growth objectives.
RESULTS OF OPERATIONS
Net Sales
Net sales increased $256.7 million, or 6%, from 2003 to 2004. Net sales were favorably impacted byincreased sales volume, especially within the United States, primarily driven by the introduction ofinnovative new products and limited edition items. Net sales of the Company’s Canadian, Mexicanand Brazilian businesses also improved as a result of higher sales volume. Favorable foreign currencyexchange rates also resulted in increased sales for the Company’s international businesses,particularly in Canada. The positive impact of increased unit sales volume contributed more than75% of the consolidated net sales growth. Higher selling prices, a more efficient rate of promotionalspending and the acquisition of the Grupo Lorena business in Mexico also contributed to the net salesincrease. Sales were unfavorably affected by the divestiture of certain gum brands in September2003, decreased sales of remaining gum brands, and higher returns, discounts and allowances,relating primarily to the sales volume growth, along with lower export sales in Asia, particularly inChina and Taiwan.
Net sales increased $52.2 million, or 1%, from 2002 to 2003, resulting primarily from the selling priceincrease, volume growth in sales of key confectionery brands reflecting the introduction of new
12
products and limited edition items in the United States, and increased selling prices and salesvolume, as well as the impact of favorable currency exchange rates for the Company’s Canadianbusiness. These sales increases were substantially offset by higher promotional allowances, thecontinued rationalization of certain under-performing products and brands, including the divestitureof the Heide brands in June 2002, the discontinuance of the Company’s aseptically packaged drinkproducts in the United States in March 2002 and the divestiture of certain gum brands in September2003, and by a prior year buy-in associated with the January 2003 price increase discussed below.Net sales were also reduced by declines in export sales to Latin America and Asia, due primarily tochanges in distributor relationships in certain markets and the discontinuance of certain products.
In December 2002, the Company announced an increase of 11% in the price of standard-size candybars effective January 1, 2003, representing an average increase of approximately 3% over the entiredomestic product line. A buy-in prior to the January 1, 2003 price increase resulted in an approximate1% to 2% increase in fourth quarter 2002 sales.
Cost of Sales
Cost of sales increased $134.8 million, or 5%, from 2003 to 2004. The cost increase was primarilycaused by higher sales volume and higher raw material costs, principally associated with increasedprices for cocoa and dairy products. These cost of sales increases were partially offset by lower costsprimarily resulting from product weight reductions and reduced costs for packaging materials.
Gross margin increased from 39.0% in 2003 to 39.5% in 2004. The margin expansion reflectedimproved price realization, primarily from reduced product weights and reduced promotionalspending as a percentage of sales, as well as efficiency improvements in manufacturing operations.The margin improvements were partially offset by increases in raw material costs.
Cost of sales decreased $16.3 million from 2002 to 2003. The cost decline was primarily caused bythe divestitures and rationalization of certain products and lower supply chain costs, principallyassociated with reduced costs for raw materials, packaging, shipping and distribution. Lower rawmaterial costs primarily for peanuts and dairy products were partially offset by higher costs for cocoa.These cost reductions were offset somewhat by sales volume increases for key confectionery brands.Cost of sales included costs associated with business realignment initiatives of $2.1 million and$6.4 million in 2003 and 2002, respectively. Business realignment costs in 2003 related to the write-offof certain inventories associated with discontinued products and, in 2002, reflected the relocation ofmanufacturing equipment due to the rationalization and consolidation of production lines.
Gross margin increased from 37.8% in 2002 to 39.0% in 2003. The margin expansion reflected theimpact of the price increase, an improved sales mix and the aforementioned decrease in supply chaincosts. These margin improvements were partially offset by increases in promotional allowances.
Selling, Marketing and Administrative
Selling, marketing and administrative expenses for 2004 increased by $31.1 million, or 4%, from2003. The increase was primarily attributable to higher employee compensation costs, increasedconsumer promotion expenses, termination costs associated with the closing of certain warehousefacilities, and litigation expenses associated with the introduction of Hershey’s SmartZone nutritionbars. These increases were offset somewhat by lower advertising expenses and a reduction inallowances for doubtful accounts, as described below. Selling, marketing and administrativeexpenses as a percentage of sales, decreased from 19.6% in 2003 to 19.1% in 2004. During the fourthquarter, the Company reached an agreement with Fleming Reclamation Creditor’s Trust, whichresolved most significant matters related to the bankruptcy of Fleming Companies, Inc., one of theCompany’s customers. Based on this agreement, the Company reduced its bad debt reserves by the$5.0 million which had been added at the time of the bankruptcy announcement in April 2003.
Selling, marketing and administrative expenses for 2003 decreased by 2% from 2002, primarilyattributable to a charge of $17.2 million in 2002 related to the exploration of the sale of the Company.Advertising and consumer promotion expenses were also lower in 2003 as a result of decisions to shift
13
spending to promotional allowances, as discussed above, and more efficient agency contracts. Thesecost reductions were offset somewhat by increased compensation and employee benefits costs,packaging development and marketing research expenses.
On July 25, 2002, the Company confirmed that the Hershey Trust Company, as Trustee for the benefitof Milton Hershey School (the “Milton Hershey School Trust”) which at that time controlled 77.6%of the combined voting power of the Company’s Common Stock and Class B Stock, had informed theCompany that it had decided to diversify its holdings and in this regard wanted Hershey FoodsCorporation to explore a sale of the entire Company. On September 17, 2002, the Milton HersheySchool Trust informed the Company that it had elected not to sell its controlling interest andrequested that the process to explore a sale be terminated.
Business Realignment Initiatives
In July 2003, the Company announced a number of initiatives continuing its value-enhancingstrategy. These initiatives included realigning the sales organization and streamlining the supplychain by divesting or eliminating certain non-strategic brands and products, and by productionline rationalization.
During 2003, these actions resulted in a net charge of approximately $17.2 million, or $.04 per share-diluted. The $17.2 million net charge consisted of the write-off of certain inventories of $2.1 millionincluded in cost of sales, a net business realignment and asset impairments charge of $23.4 millionand an $8.3 million net gain resulting from the divestiture of certain brands.
The net business realignment and asset impairments charge of $23.4 million consisted of earlyretirement and involuntary termination costs of $10.0 million, sales office closing and relocation costsof $7.3 million, fixed asset impairment charges of $5.7 million, equipment removal costs of $.7 millionand a net gain of $.3 million relating to the elimination of non-strategic brands and products. Indetermining the fixed asset impairment losses, fair value was estimated based on the expectedsales proceeds. Cash payments during 2003 reduced the liability balance, primarily relating to theaforementioned charges for employee termination, sales office closing and relocation costs, to$8.8 million as of December 31, 2003. Cash payments during 2004 reduced the liability balance to$3.9 million as of December 31, 2004.
In late October 2001, the Company’s Board of Directors approved a plan to improve the efficiencyand profitability of the Company’s operations. The plan included asset management improvements,product line rationalization, supply chain efficiency improvements and a voluntary work forcereduction program (collectively, the “2001 business realignment initiatives”). Total costs for the 2001business realignment initiatives recorded in 2002 and 2001 were $312.4 million.
During 2002, charges to cost of sales and business realignment and asset impairments were recordedtotaling $34.0 million before tax. The total included a charge to cost of sales of $6.4 million associatedwith the relocation of manufacturing equipment and a net business realignment and assetimpairments charge of $27.6 million. Components of the net $27.6 million pre-tax charge includeda $28.8 million charge for pension settlement losses resulting from a voluntary work force reductionprogram (“VWRP”), a $3.0 million charge for pension curtailment losses and special terminationbenefits resulting from manufacturing plant closures, a $.1 million charge relating to involuntarytermination benefits and a $.1 million charge relating to the realignment of the domestic salesorganization, partially offset by a $4.4 million favorable adjustment reflecting higher than estimatedproceeds from the sale of certain assets. The major components of the 2001 business realignmentinitiatives were completed as of December 31, 2002. Remaining transactions primarily pertain to thesale of certain real estate associated with the closure of facilities, as discussed below.
Product line rationalization plans included the sale or exit of certain businesses, the discontinuanceof certain non-chocolate confectionery products and the realignment of the Company’s salesorganizations. Costs associated with the realignment of the sales organizations related primarily tosales office closings and terminating the use of certain sales brokers. During 2002, sales offices wereclosed as planned and the use of certain sales brokers was discontinued which resulted in an
14
additional charge of $.1 million. During the second quarter of 2002, the sale of a group of theCompany’s non-chocolate confectionery candy brands to Farley’s & Sathers Candy Company, Inc.(“Farley’s & Sathers”) was completed. Included in the transaction were the Heide, Jujyfruits,Wunderbeans and Amazin’ Fruit trademarked confectionery brands, as well as the rights to sellChuckles branded products, under license. Proceeds of $12.0 million associated with the sale ofcertain confectionery brands to Farley’s & Sathers exceeded the 2001 estimates which resulted ina $4.4 million favorable adjustment. Also during the second quarter of 2002, the Companydiscontinued and subsequently licensed the sale of its aseptically packaged drink products in theUnited States. Net sales for these brands were $11.6 million in 2002. The sale of certain confectionerybrands to Farley’s & Sathers resulted in the closure of a manufacturing facility in New Brunswick,New Jersey which was being held for sale as of December 31, 2002. The manufacturing facility wassold in May 2003. An additional charge of $.7 million relating to pension curtailment losses andspecial termination benefits associated with the closure of the facility was recorded in 2002.
To improve supply chain efficiency and profitability, three manufacturing facilities, a distributioncenter and certain other facilities were planned to be closed. These included manufacturing facilitiesin Denver, Colorado; Pennsburg, Pennsylvania; and Palmyra, Pennsylvania and a distribution centerand certain minor facilities located in Oakdale, California. During the first quarter of 2002, themanufacturing facility in Palmyra, Pennsylvania was closed and additional costs of $.1 million wererecorded, as incurred, relating to retention payments. During the second quarter, operations utilizingthe distribution center in Oakdale, California ceased. The manufacturing facilities in Denver,Colorado and Pennsburg, Pennsylvania were closed in the fourth quarter of 2002. An additionalcharge of $2.3 million relating to pension curtailment losses and special termination benefitsassociated with the facility closures was recorded in 2002. The Denver, Colorado and the Pennsburg,Pennsylvania facilities were being held for sale as of December 31, 2004. The Denver, Colorado facilitywas sold in February 2005.
In October 2001, the Company offered the VWRP to certain eligible employees in the United States,Canada and Puerto Rico in order to reduce staffing levels and improve profitability. The VWRPconsisted of an early retirement program which provided enhanced pension, post-retirement andcertain supplemental benefits and an enhanced mutual separation program which providedincreased severance and temporary medical benefits. A reduction of approximately 500 employeesoccurred during 2002 as a result of the VWRP. Additional pension settlement costs of $28.8 millionwere recorded in 2002, principally associated with lump sum payments of pension benefits.
Gain on Sale of Business
As part of the Company’s business realignment initiatives, the sale of a group of gum brands toFarley’s & Sathers was completed in September 2003. The gum brands included Fruit Stripe chewinggum, Rain-Blo gum balls and Super Bubble bubble gum. In the third quarter of 2003, the Companyreceived cash proceeds from the sale of $20.0 million and recorded a gain of $8.3 million before tax,or $5.7 million after tax, as a result of the transaction.
Interest Expense, Net
Net interest expense for 2004 was $3.0 million higher than in 2003 primarily reflecting higher short-term interest expense, partially offset by increased capitalized interest. The increase in short-terminterest expense was associated with commercial paper borrowings during 2004 for repurchases ofCommon Stock, business acquisitions and other funding requirements. Net interest expense for 2003was $2.8 million higher than in 2002, primarily reflecting lower interest income and higher fixedinterest expense, principally due to interest expense associated with the consolidation of three formeroff-balance sheet arrangements for the leasing of certain warehouse and distribution facilities, asdiscussed below.
15
Income Taxes
The Company’s effective income tax rate was 29.3% in 2004, 36.6% in 2003 and 36.7% in 2002. Theeffective income tax rate for 2004 is not comparable with the rates for 2003 and 2002 because theCompany’s provision for income taxes was reduced by the $61.1 million adjustment to incometax contingency reserves recorded in the second quarter of 2004. The non-cash reduction of incometax expense resulted from the settlement of Federal tax audits for the 1999 and 2000 tax years,as well as the resolution of a number of state tax audit issues. Based upon the results of theaudits, the income tax contingency reserves were adjusted, resulting in a reduction of $61.1 millionin income tax expense. The income tax contingency reserve adjustments related primarily to thedeductibility and timing of certain expenses, interest on potential assessments, and acquisition anddivestiture matters.
The reduction in the 2004 provision for income taxes resulting from the adjustment to income taxcontingency reserves reduced the effective income tax rate by 7.3 percentage points. The decreasein the effective income tax rate from 2002 to 2003 reflected the impact of the effective tax rates onbusiness rationalization and realignment initiatives and the gain on sale of business in 2003.
Cumulative Effect of Accounting Change
An after-tax charge of $7.4 million, or $.03 per share-diluted, was recorded in 2003 to reflect thecumulative effect of a change in accounting for the Company’s leases of certain warehouse anddistribution facilities as discussed further under the heading Off-Balance Sheet Arrangements,Contractual Obligations and Contingent Liabilities and Commitments.
Net Income
Net income was $590.9 million in 2004 compared with $457.6 million in 2003. Net income per share-diluted of $2.30 for 2004, was up 33% from $1.73 per share for 2003 as a result of the reduction tothe 2004 provision for income taxes resulting from the adjustment to income tax contingencyreserves, increased income from operations and the impact of lower weighted-average sharesoutstanding resulting from share repurchases during the year and the impact of the cumulative effectof accounting change recorded in 2003.
Net income was $457.6 million in 2003 compared with $403.6 million in 2002. Net income pershare-diluted of $1.73 for 2003, was up 18% from $1.47 per share for 2002 as a result of increasedincome from operations and the impact of lower weighted-average shares outstanding resulting fromshare repurchases during the year. Income before the cumulative effect of accounting change was$465.0 million for 2003, a 15% increase over 2002. Income per share-diluted before the cumulativeeffect of accounting change was $1.76 for 2003, 20% higher than in 2002. Income before thecumulative effect of accounting change for 2003 included total net business realignment charges of$15.5 million after tax and a gain on the sale of certain gum brands of $5.7 million after tax.
Net income in 2002 was $403.6 million including total net business realignment charges of$21.5 million after tax and after-tax expenses of $10.9 million related to the exploration of the saleof the Company.
FINANCIAL CONDITION
The Company’s financial condition remained very strong during 2004. The capitalization ratio (totalshort-term and long-term debt as a percent of stockholders’ equity, short-term and long-term debt)increased to 55% as of December 31, 2004, from 43% as of December 31, 2003. The highercapitalization ratio in 2004 primarily reflected additional borrowings to finance the purchase ofCommon Stock from the Milton Hershey School Trust (described below) and the related decrease instockholders’ equity as a result of the additional Treasury Stock. The ratio of current assets to currentliabilities decreased to .9:1 as of December 31, 2004, from 1.9:1 as of December 31, 2003 primarilyreflecting a decrease in cash and cash equivalents, an increase in short-term borrowings and anincrease in the current portion of long-term debt, resulting from reclassification of $201.2 million of
16
6.7% Notes due in 2005 and $76.8 million related to certain lease agreements. The Company expectsto satisfy these obligations using cash provided from operations and commercial paper borrowings.
In December 2004, the Company acquired Mauna Loa for $127.8 million. Mauna Loa is the leadingprocessor and marketer of macadamia snacks, with annual sales of approximately $80 million. InOctober 2004, the Company’s Mexican subsidiary, Hershey Mexico, acquired Grupo Lorena, one ofMexico’s top confectionery companies for $39.0 million. This business has annual sales of over$30 million. Included in the acquisition was the Pelon Pelo Rico brand. Had the results of theacquisitions been included in the consolidated results for the full year of 2004, the effect would nothave been material.
In July 2004, the Company purchased 11,281,589 shares of its Common Stock from the MiltonHershey School Trust, in a privately negotiated transaction. The Company paid $44.32 per share, orapproximately $500.0 million for the shares and fees of $1.4 million associated with the transaction.
In September 2003, the Company completed the sale of certain gum brands to Farley’s & Sathersfor $20.0 million in cash as part of its business realignment initiatives. The gum brands includedFruit Stripe chewing gum, Rain-Blo gum balls and Super Bubble bubble gum.
In June 2002, the Company completed the sale of certain confectionery brands to Farley’s & Sathersfor $12.0 million in cash as part of its 2001 business realignment initiatives. Included in thetransaction were the Heide, Jujyfruits, Wunderbeans and Amazin’ Fruit trademarked confectionerybrands, as well as the rights to sell Chuckles branded products, under license.
Assets
Total assets increased $215.0 million, or 6% as of December 31, 2004, primarily as a result of higherinventories, deferred taxes, property, plant, and equipment, goodwill and other intangibles, partiallyoffset by a decrease in cash and cash equivalents. These increases were principally associated withthe acquisition of the Grupo Lorena and Mauna Loa businesses.
Current assets increased by $50.9 million principally reflecting increased inventories to supporthigher anticipated sales in early 2005 prior to the effective date of selling price increases andinventories of $24.3 million related to the acquired businesses. The increase of current deferredincome taxes was primarily related to the Mauna Loa acquisition and the tax effect on temporarydifferences associated with accrued liabilities for promotional allowances, inventories and gains orlosses on derivatives included in other comprehensive income. The decrease in cash and cashequivalents reflected increased funding requirements for share repurchases, payment of dividends,capital additions and business acquisitions during the year.
Property, plant and equipment was higher than the prior year primarily due to capital additions of$181.7 million and the acquisition of the Grupo Lorena and Mauna Loa businesses, partially offsetby depreciation expense of $171.2 million. Goodwill increased as a result of the business acquisitions,partially offset by a $12.6 million adjustment to goodwill as a result of the adjustment to the Federaland state tax contingencies. The increase in other intangibles primarily reflected the estimated valueof trademarks from the business acquisitions. The decrease in other assets primarily reflectedreduced pension assets as a result of pension expense recorded in 2004.
Liabilities
Total liabilities increased by $405.6 million as of December 31, 2004, primarily reflecting an increasein short-term borrowings, partially offset by a reduction in deferred income tax liabilities resultingfrom the adjustment to income tax contingency reserves, net of an increase associated with thebusiness acquisitions. The increase in accounts payable was due to the business acquisitions. Higheraccrued liabilities were primarily related to increased promotional allowances and employeecompensation in addition to $11.8 million associated with the business acquisitions. The increase inshort-term debt of $331.2 million reflected commercial paper borrowings primarily associated withthe repurchase of Common Stock from the Milton Hershey School Trust and the acquisition of the
17
Grupo Lorena and Mauna Loa businesses, along with other funding requirements. The increase incurrent portion of long-term debt and the corresponding decrease in long-term debt was associatedwith the reclassification of $201.2 million of 6.7% Notes due in 2005 and $76.8 million related tocertain lease agreements. The increase in other long-term liabilities was primarily associated withincentive compensation.
Capital Structure
The Company has two classes of stock outstanding, Common Stock and Class B Stock. Holders ofthe Common Stock and the Class B Stock generally vote together without regard to class on matterssubmitted to stockholders, including the election of directors, with the Common Stock having one voteper share and the Class B Stock having ten votes per share. However, the Common Stock, votingseparately as a class, is entitled to elect one-sixth of the Board of Directors. With respect to dividendrights, the Common Stock is entitled to cash dividends 10% higher than those declared and paid onthe Class B Stock.
In December 2000, the Company’s Board of Directors unanimously adopted a Stockholder ProtectionRights Agreement (“Rights Agreement”). The Company’s largest stockholder, the Milton HersheySchool Trust, supported the Rights Agreement. This action was not in response to any specific effortto acquire control of the Company. Under the Rights Agreement, the Company’s Board of Directorsdeclared a dividend of one right (“Right”) for each outstanding share of Common Stock and Class BStock payable to stockholders of record at the close of business on December 26, 2000. The Rightswill at no time have voting power or receive dividends. The issuance of the Rights has no dilutiveeffect, will not affect reported earnings per share, is not taxable and will not change the manner inwhich the Company’s Common Stock is traded. The Rights Agreement is discussed further in Note15 to the Consolidated Financial Statements.
LIQUIDITY AND CAPITAL RESOURCES
Historically, the Company’s major source of financing has been cash generated from operations. TheCompany’s income and, consequently, cash provided from operations during the year are affected byseasonal sales patterns, the timing of new product introductions, business acquisitions anddivestitures, and price changes. Sales have typically been highest during the third and fourthquarters of the year, representing seasonal and holiday-related sales patterns. Generally,seasonal working capital needs peak during the summer months and have been met by issuingcommercial paper.
Over the past three years, cash provided from operating activities totaled $2.0 billion, net of cashcontributions to pension plans of $436.4 million. Cash from operations combined with short-termborrowings was sufficient to fund share repurchases, capital expenditures, capitalized softwareadditions, dividend payments and business acquisitions which totaled $2.3 billion. Total debtincreased during the period by $428.0 million, reflecting increased short-term borrowings, asdiscussed above, in addition to an increase in long-term debt resulting from the consolidation ofSpecial Purpose Trusts (“SPTs”) associated with certain lease agreements in 2003, offset somewhatby the repayment of long-term debt. Cash and cash equivalents decreased by $79.3 million duringthe period.
The Company anticipates that capital expenditures and capitalized software additions will be in therange of $175 million to $200 million per annum during the next several years primarily for continuedefficiency improvements in existing facilities and capacity expansion to support sales growth and newproducts, along with continued improvement and enhancements of computer software. As ofDecember 31, 2004, the Company’s principal capital commitments included manufacturing capacityexpansion to support sales growth and new products, modernization and efficiency improvementsand selected enhancements of computer software.
As of December 31, 2004, the fair value of the Company’s pension plan assets exceeded benefitsobligations. Contributions totaling $8.0 million, $120.3 million and $308.1 million were made to the
18
pension plans during 2004, 2003 and 2002, respectively, primarily to improve the funded status asa result of negative returns on pension plan assets during 2002.
Under share repurchase programs which began in 1993, a total of 51,682,864 shares of Common Stockhave been repurchased for approximately $1.3 billion, including purchases from the Milton HersheySchool Trust of 8,000,000 shares for $103.1 million in 1993 and 3,159,558 shares for $100.0 millionin 1999. Of the shares repurchased, 1,056,000 shares were retired and 21,361,107 shares werereissued to satisfy stock option obligations, Supplemental Retirement Contributions and employeestock ownership trust (“ESOP”) obligations. Of the shares reissued, 16,765,409 shares wererepurchased in the open market to replace the reissued shares. Additionally, the Company haspurchased a total of 67,282,661 shares of its Common Stock to be held as Treasury Stock from theMilton Hershey School Trust for $1.5 billion in privately negotiated transactions, including11,281,589 shares for approximately $500 million in 2004. As of December 31, 2004, a total of113,313,827 shares were held as Treasury Stock and $55.0 million remained available forrepurchases of Common Stock under the $500 million share repurchase program approved by theCompany’s Board of Directors in December 2002.
As of December 31, 2004, $250 million of debt securities remained available for issuance under anAugust 1997 Form S-3 Registration Statement. Proceeds from any offering of the $250 million of debtsecurities available under the shelf registration may be used for general corporate requirements,which include reducing existing commercial paper borrowings, financing capital additions and sharerepurchases, and funding future business acquisitions and working capital requirements.
In November 2004, the Company entered into a Five Year Credit Agreement (the “Credit Agreement”)with the banks, financial institutions and other institutional lenders listed on the respectivesignature pages thereof (“Lenders”), Citibank, N.A., as administrative agent for the Lenders(as defined therein), Bank of America, N.A., as syndication agent, UBS Loan Finance LLC, asdocumentation agent, and Citigroup Global Markets, Inc. and Banc of America Securities LLC, asjoint lead arrangers and joint book managers. The Credit Agreement establishes an unsecuredrevolving credit facility under which the Company may borrow up to $900 million with the optionto increase borrowings by an additional $600 million with the concurrence of the Lenders. Fundsborrowed may be used for general corporate purposes, including commercial paper backstop andbusiness acquisitions. Advances other than competitive bid advances may be repaid without penaltyat any time prior to the last day of the Credit Agreement. Competitive bid advances must be paidat maturity, and may not be prepaid. The Credit Agreement contains a financial covenant wherebythe ratio of (a) pre-tax income from continuing operations from the most recent four fiscal quartersto (b) consolidated interest expense for the most recent four fiscal quarters may not be less than 2.0to 1 at the end of each fiscal quarter. The Credit Agreement contains customary representations andwarranties and events of default. Payment of outstanding advances may be accelerated, at the optionof the Lenders, should the Company default in its obligations under the Credit Agreement.
With the execution of the Credit Agreement in November 2004, short-term and long-term committedcredit facilities previously maintained by the Company in the United States (together the “PriorFacilities”) were terminated. The Prior Facilities consisted of the following: (x) Amended andRestated Five-Year Credit Agreement dated as of November 27, 2001 ($200 million) among theCompany, the banks, financial institutions and other institutional lenders listed on the signaturepages thereof, and Citibank, N.A. as administrative agent, Bank of America, N.A. as syndicationagent, and Salomon Smith Barney Inc. and Banc America Securities LLC, as joint lead arrangersand joint book managers; (y) Amended and Restated 364-Day Credit Agreement dated as ofNovember 27, 2001 (as subsequently amended and renewed November 26, 2002 and November 25,2003) ($200 million) among the Company, the banks, financial institutions and other institutionallenders listed on the signature pages thereof, and Citibank, N.A. as administrative agent, Bank ofAmerica, N.A. as syndication agent, and Salomon Smith Barney Inc. and Banc America SecuritiesLLC, as joint lead arrangers and joint book managers; and (z) 364-Day Credit Agreement dated asof July 28, 2004 ($500 million) among the Company, the banks, financial institutions and otherinstitutional lenders listed on the signature pages thereof, and Citibank, N.A. as administrative
19
agent, Bank of America, N.A. as syndication agent, and Citigroup Global Markets Inc. and BancAmerica Securities LLC, as joint lead arrangers and joint book managers. The representations andwarranties, events of default, financial covenant and other terms of the Prior Facilities aresubstantially similar to the provisions contained in the new Credit Agreement.
The Company also maintains lines of credit with domestic and international commercial banks,under which it could borrow in various currencies up to approximately $60.3 million and $43.6 millionas of December 31, 2004 and 2003, respectively. The higher lines of credit as of December 31,2004, were primarily associated with the Company’s businesses in Canada and China.
Cash Flow ActivitiesOver the past three years, cash from operating activities provided approximately $2.0 billion. Overthis period, cash used by or provided from accounts receivable and inventories has tended to fluctuateas a result of sales during December and inventory management practices. The change in cashrequired for or provided from other assets and liabilities between the years was primarily relatedto hedging transactions, the timing of payments for accrued liabilities, including income taxes, andvariations in the funded status of pension plans. In 2004, the adjustment of deferred income taxesprimarily reflects the deferred tax benefit resulting from the $61.1 million adjustment to income taxcontingency reserves recorded in the second quarter of 2004 and an increase resulting from theMauna Loa acquisition.
Investing activities included capital additions, capitalized software additions, and severalbusiness acquisitions and divestitures. Capital additions during the past three years included thepurchase of manufacturing equipment, and expansion and modernization of existing facilities.Capitalized software additions over the past three years were associated primarily with the ongoingenhancement of information systems.
In December 2004, the Company acquired Mauna Loa, a leading processor and marketer of macadamiasnacks, for $127.8 million and in October 2004, the Company’s Mexican subsidiary, Hershey Mexico,acquired Grupo Lorena, one of Mexico’s top confectionery companies, for $39.0 million.
In July 2004, the Company purchased 11,281,589 shares of its Common Stock from the MiltonHershey School Trust in a privately negotiated transaction. The Company paid $44.32 per share, orapproximately $500.0 million, for the shares and fees of $1.4 million associated with the transaction.
In August 2003, the Company completed the sale of a group of gum brands to Farley’s & Sathers for$20.0 million in cash as part of its business realignment initiatives and in June 2002, the Companycompleted the sale of certain confectionery brands to Farley’s & Sathers for $12.0 million in cash aspart of its 2001 business realignment initiatives.
Financing activities included debt borrowings and repayments, payments of dividends, the exerciseof stock options, incentive plan transactions and the repurchase of Common Stock. During the pastthree years, short-term borrowings in the form of commercial paper or bank borrowings were usedto fund seasonal working capital requirements and finance share repurchase programs, including thepurchase of Common Stock from the Milton Hershey School Trust. During the past three years, atotal of 20,138,634 shares of Common Stock have been repurchased for $1.0 billion. Cash used forincentive plan transactions of $325.8 million during the past three years was partially offset by cashreceived from the exercise of stock options of $221.2 million. Cash used by incentive plan transactionsreflected purchases of the Company’s Common Stock in the open market to replace Treasury Stockissued for stock options exercises. The Company intends to repurchase shares to replace shares issuedfor stock options exercises. The value of shares purchased in a given period will vary based upon stockoptions exercises over time and market conditions. As of December 31, 2004, approximately 1.9million shares issued for stock options exercises in 2004 and 2003 remained to be repurchased. Mostof these shares were repurchased in early 2005.
Net cash provided from operating activities was $797.5 million for 2004, an increase of $204.5 millioncompared with the prior year. The primary contributors to the increase were higher net incomeand increases in cash provided from other assets and liabilities and accounts receivable. These
20
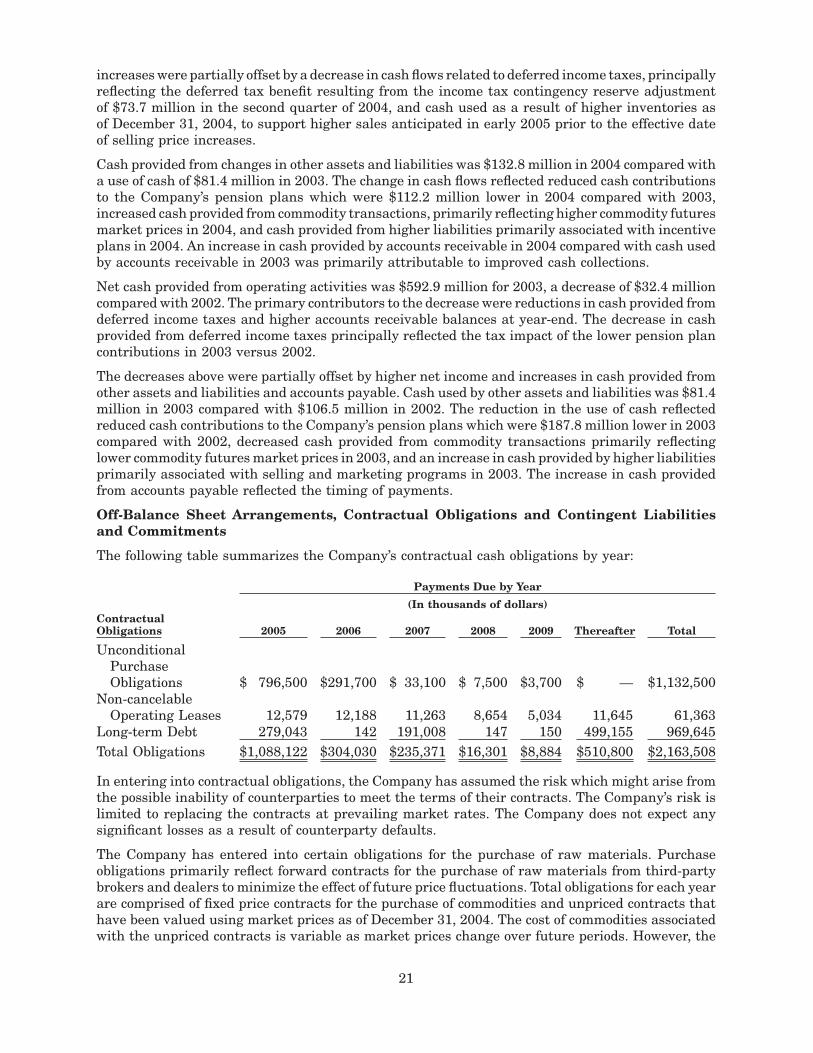
increases were partially offset by a decrease in cash flows related to deferred income taxes, principallyreflecting the deferred tax benefit resulting from the income tax contingency reserve adjustmentof $73.7 million in the second quarter of 2004, and cash used as a result of higher inventories asof December 31, 2004, to support higher sales anticipated in early 2005 prior to the effective dateof selling price increases.
Cash provided from changes in other assets and liabilities was $132.8 million in 2004 compared witha use of cash of $81.4 million in 2003. The change in cash flows reflected reduced cash contributionsto the Company’s pension plans which were $112.2 million lower in 2004 compared with 2003,increased cash provided from commodity transactions, primarily reflecting higher commodity futuresmarket prices in 2004, and cash provided from higher liabilities primarily associated with incentiveplans in 2004. An increase in cash provided by accounts receivable in 2004 compared with cash usedby accounts receivable in 2003 was primarily attributable to improved cash collections.
Net cash provided from operating activities was $592.9 million for 2003, a decrease of $32.4 millioncompared with 2002. The primary contributors to the decrease were reductions in cash provided fromdeferred income taxes and higher accounts receivable balances at year-end. The decrease in cashprovided from deferred income taxes principally reflected the tax impact of the lower pension plancontributions in 2003 versus 2002.
The decreases above were partially offset by higher net income and increases in cash provided fromother assets and liabilities and accounts payable. Cash used by other assets and liabilities was $81.4million in 2003 compared with $106.5 million in 2002. The reduction in the use of cash reflectedreduced cash contributions to the Company’s pension plans which were $187.8 million lower in 2003compared with 2002, decreased cash provided from commodity transactions primarily reflectinglower commodity futures market prices in 2003, and an increase in cash provided by higher liabilitiesprimarily associated with selling and marketing programs in 2003. The increase in cash providedfrom accounts payable reflected the timing of payments.
Off-Balance Sheet Arrangements, Contractual Obligations and Contingent Liabilitiesand Commitments
The following table summarizes the Company’s contractual cash obligations by year:
Payments Due by Year
(In thousands of dollars)ContractualObligations 2005 2006 2007 2008 2009 Thereafter Total
UnconditionalPurchaseObligations $ 796,500 $291,700 $ 33,100 $ 7,500 $3,700 $ — $1,132,500
Non-cancelableOperating Leases 12,579 12,188 11,263 8,654 5,034 11,645 61,363
Long-term Debt 279,043 142 191,008 147 150 499,155 969,645Total Obligations $1,088,122 $304,030 $235,371 $16,301 $8,884 $510,800 $2,163,508
In entering into contractual obligations, the Company has assumed the risk which might arise fromthe possible inability of counterparties to meet the terms of their contracts. The Company’s risk islimited to replacing the contracts at prevailing market rates. The Company does not expect anysignificant losses as a result of counterparty defaults.
The Company has entered into certain obligations for the purchase of raw materials. Purchaseobligations primarily reflect forward contracts for the purchase of raw materials from third-partybrokers and dealers to minimize the effect of future price fluctuations. Total obligations for each yearare comprised of fixed price contracts for the purchase of commodities and unpriced contracts thathave been valued using market prices as of December 31, 2004. The cost of commodities associatedwith the unpriced contracts is variable as market prices change over future periods. However, the
21
variability of such costs is mitigated to the extent of the Company’s futures price cover for thoseperiods. Accordingly, increases or decreases in market prices will be offset by gains or losses oncommodity futures contracts to the extent that the unpriced contracts are hedged as of December 31,2004 and in future periods. Taking delivery of the specific commodities for use in the manufactureof finished goods satisfies these obligations. For each of the three years in the period endedDecember 31, 2004, such obligations were fully satisfied by taking delivery of and making paymentfor the specific commodities.
In January 2003, the Financial Accounting Standards Board (“FASB”) issued Interpretation No. 46,Consolidation of Variable Interest Entities, an interpretation of ARB No. 51 (“Interpretation No. 46”).Interpretation No. 46 addresses consolidation by business enterprises of special-purpose entities(“SPEs”), such as SPTs, to which the usual condition for consolidation described in AccountingResearch Bulletin No. 51, Consolidated Financial Statements, does not apply because the SPEs haveno voting interests or otherwise are not subject to control through ownership of voting interests.
The Company adopted Interpretation No. 46 as of June 30, 2003, resulting in the consolidation ofthree off-balance sheet arrangements with SPTs. As of December 31, 2004 and 2003, the Companyhad no off-balance sheet arrangements. The consolidation of the SPTs resulted in an adjustment torecord the cumulative effect of the accounting change of approximately $7.4 million, or $.03 per share-diluted, in the third quarter of 2003, reflecting the after-tax effect of accumulated depreciation forthese facilities from lease inception through June 29, 2003. Additionally, the consolidation of theseentities resulted in a net increase to property, plant and equipment of approximately $107.7 million,with a corresponding increase to long-term debt of $115.5 million and to other long-term liabilitiesof $4.4 million, reflecting the third party equity interest associated with the lease arrangements.Prior to June 30, 2003, expenses associated with the lease arrangements were classified as rentexpense and included in cost of sales in the Consolidated Statements of Income. Subsequent to theconsolidation of these entities, expenses were classified as interest expense associated with thecorresponding long-term debt. The consolidation of these entities resulted in an increase to interestexpense of $2.8 million in 2003, offset by a decrease in rental expense for these facilities includedin cost of sales. An increase in depreciation expense of $2.6 million in 2003 also resulted from theconsolidation of these entities, with a total of $5.4 million of depreciation expense recorded in 2004.
During 1999 and 2000, the Company entered into off-balance sheet arrangements for the leasing ofcertain warehouse and distribution facilities. These off-balance sheet arrangements enabled theCompany to lease these facilities under more favorable terms than other leasing alternatives. Thelease arrangements are with SPTs whereby the Company leases warehouse and distribution facilitiesin Redlands, California; Atlanta, Georgia; and Hershey, Pennsylvania, as discussed below. The SPTswere formed to facilitate the acquisition and subsequent leasing of the facilities to the Company. TheSPTs financed the acquisition of the facilities by issuing notes and equity certificates to independentthird-party financial institutions. The independent third-party financial institutions that hold theequity certificates are the owners of the SPTs. The owners of the SPTs have made substantive residualequity capital investments in excess of 3% which will be at risk during the entire term of each lease.Accordingly, the Company did not consolidate the SPTs prior to June 30, 2003 because all of theconditions for consolidation had not been met.
In December 2000, the Company entered into a lease agreement with the owner of the warehouseand distribution facility in Redlands, California. The lease term was approximately ten years, withoccupancy to begin upon completion of the facility. The lease agreement contained an option for theCompany to purchase the facility. In January 2002, the Company assigned its right to purchase thefacility to an SPT that in turn purchased the completed facility and leased it to the Company undera new lease agreement. The lease term is five years, with up to four renewal periods of five yearseach with the consent of the lessor. The cost incurred by the SPT to acquire the facility, includingland, was $40.1 million.
In October 2000, the Company entered into a lease agreement with an SPT for the leasing of awarehouse and distribution facility near Atlanta, Georgia. The lease term is five years, with up to
22
four renewal periods of five years each with the consent of the lessor. The cost incurred by the SPTto acquire the facility, including land, was $18.2 million.
In July 1999, the Company entered into a lease agreement with an SPT for the construction andleasing of a warehouse and distribution facility located on land owned by the Company near Hershey,Pennsylvania. Under the agreement, the lessor paid construction costs totaling $61.7 million. Thelease term is six years, including the one-year construction period, with up to four renewal periodsof five years each with the consent of the lessor.
Aside from the residual guarantees and instrument guarantees associated with the individualleasing arrangements, as discussed below, the Company has provided no other guarantees orcapitalization of these entities. The Company has not collateralized the obligations in connection withthese leases. The Company has no obligations with respect to refinancing of the lessor’s debt, wouldincur no significant penalties which would result in the reasonable assurance of continuation of theleases and has no significant guarantees other than the residual and instrument guaranteesdiscussed below. There are no other material commitments or contingent liabilities associated withthe leasing arrangements. The Company’s transactions with the SPTs are limited to the leaseagreements. The Company does not anticipate entering into any other arrangements involving SPEs.
The leases include substantial residual guarantees by the Company for a significant amount of thefinancing and options to purchase the facilities at original cost. Pursuant to instrument guarantees,in the event of a default under the lease agreements, the Company guaranteed to the note holdersand certificate holders payment in an amount equal to all sums then due under the leases.
There are no penalties or other disincentives under the lease agreements if the Company decides notto renew any of the three leases. The terms for each renewal period under each of the three leasearrangements are identical to the initial terms and do not represent bargain lease terms.
If the Company were to exercise its options to purchase the three facilities at original cost at the endof the respective initial lease terms, the Company could purchase the facilities for a total ofapproximately $120.0 million, $79.9 million for the Pennsylvania and Georgia facilities in 2005 and$40.1 million for the California facility in 2007. If the Company chooses not to renew the leases orpurchase the assets at the end of the lease terms, the Company is obligated under the residualguarantees for approximately $103.2 million in total for the three leases. Additionally, the Companyis obligated to re-market each property on the lessor’s behalf and, upon sale, distribute a portion ofthe proceeds to the note holders and certificate holders up to an amount equal to the remaining debtand equity certificates and to pay closing costs. If the Company chooses not to renew or purchase theassets at the end of the lease terms, the Company does not anticipate a material disruption tooperations, since such facilities are not unique, facilities with similar racking and storage capabilitiesare available in each of the areas where the facilities are located, there are no significant leaseholdimprovements that would be impaired, there would be no adverse tax consequences, the financingof replacement facilities would not be material to the Company’s cash flows and costs related torelocation would not be significant to income.
The facility located near Hershey, Pennsylvania was constructed on land owned by the Company. TheCompany entered into a ground lease with the lessor, an SPT. The initial term of the ground leaseextends to the date that is the later of (i) the date the facility lease is no longer in effect, or (ii) thedate when the Company satisfies the residual guarantee associated with the lease. An additionalterm for the ground lease begins upon the end of the initial ground lease term and ends upon thelater of the date all sums required to be paid under the lease agreement are paid in full and the 75thanniversary of the ground lease commencement date. If the Company chooses not to renew thebuilding lease or purchase the building, it must re-market the building on the lessor’s behalf subjectto the ground lease, which will continue in force until the earlier of the date all sums required to bepaid under the lease agreement are paid in full and the 75th anniversary of the ground lease inceptiondate. The lease of the warehouse and distribution facility does not include any provisions which wouldrequire the Company to sell the land to the SPT.
23
The Company’s provision for income taxes, accrued income taxes and deferred income taxes are basedupon income, statutory tax rates, the legal structure of the Company and interpretation of tax laws.As a matter of course, the Company is regularly audited by Federal, state and foreign tax authorities.From time to time, these audits result in assessments of additional tax. The Company maintainsreserves for such assessments. The reserves are determined based upon the Company’s judgment ofassessment risk and are adjusted, from time to time, based upon changing facts and circumstances,such as receiving audit assessments or clearing of an item for which a reserve has been established.
A settlement of Federal tax audits for the 1999 and 2000 tax years, as well as the resolution of anumber of state tax audit issues were concluded during the second quarter of 2004. Based upon theresults of the audits, the income tax contingency reserves were adjusted resulting in a reductionof income tax reserves by $73.7 million, reflecting a reduction of the provision for income taxes by$61.1 million and a reduction to goodwill of $12.6 million. The income tax contingency reserveadjustments related primarily to the deductibility and timing of certain expenses, interest onpotential assessments, and acquisition and divestiture matters. Assessments of additionaltax require use of the Company’s cash. The Company is not aware of any significant incometax assessments.
ACCOUNTING POLICIES AND MARKET RISKS ASSOCIATED WITH DERIVATIVEINSTRUMENTS
The Company utilizes certain derivative instruments, from time to time, including interest rateswaps, foreign currency forward exchange contracts and options, and commodities futures contracts,to manage interest rate, currency exchange rate and commodity market price risk exposures. Interestrate swaps and foreign currency contracts and options are entered into for periods consistent withrelated underlying exposures and do not constitute positions independent of those exposures.Commodities futures contracts are entered into for varying periods and are intended to be and areeffective as hedges of market price risks associated with anticipated raw material purchases, energyrequirements and transportation costs. The Company does not hold or issue derivative instrumentsfor trading purposes and is not a party to any instruments with leverage or prepayment features.In entering into these contracts, the Company has assumed the risk that might arise from the possibleinability of counterparties to meet the terms of their contracts. The Company does not expect anysignificant losses as a result of counterparty defaults.
The Company accounts for derivative instruments in accordance with Statement of FinancialAccounting Standards No. 133, Accounting for Derivative Instruments and Hedging Activities, asamended (“SFAS No. 133, as amended”). SFAS No. 133, as amended, provides that the effectiveportion of the gain or loss on a derivative instrument designated and qualifying as a cash flow hedginginstrument be reported as a component of other comprehensive income and be reclassified intoearnings in the same period or periods during which the transaction affects earnings. The remaininggain or loss on the derivative instrument, if any, must be recognized currently in earnings. For aderivative designated as hedging the exposure to changes in the fair value of a recognized asset orliability or a firm commitment (referred to as a fair value hedge), the gain or loss must be recognizedin earnings in the period of change together with the offsetting loss or gain on the hedged itemattributable to the risk being hedged. The effect of that accounting is to reflect in earnings the extentto which the hedge is not effective in achieving offsetting changes in fair value. All derivativeinstruments currently utilized by the Company, including variable to fixed interest rate swaps,foreign exchange contracts and options and commodities futures contracts, are designated andaccounted for as cash flow hedges. The Company adopted SFAS No. 133, as amended, as of January 1,2001. Additional information with regard to accounting policies associated with derivativeinstruments is contained in Note 6 to the Consolidated Financial Statements, DerivativeInstruments and Hedging Activities.
24

The information below summarizes the Company’s market risks associated with long-term debt andderivative instruments outstanding as of December 31, 2004. This information should be read inconjunction with Note 1, Note 6 and Note 8 to the Consolidated Financial Statements.
Long-Term Debt
The table below presents the principal cash flows and related interest rates by maturity date for long-term debt, including the current portion, as of December 31, 2004. The fair value of long-term debtwas determined based upon quoted market prices for the same or similar debt issues.
Maturity Date
(In thousands of dollars except for rates)
2005 2006 2007 2008 2009 Thereafter TotalFair
Value
Long-term Debt $279,043 $142 $191,008 $147 $150 $499,155 $969,645 $1,094,281Interest Rate 5.9% 2.0% 6.3% 2.0% 2.0% 7.4% 6.8%
Interest rates on variable rate obligations were calculated using the rate in effect as of December 31,2004. Interest rates on certain long-term debt have been converted from variable to fixed rates asdiscussed under the heading Interest Rate Swaps below.
Interest Rate Swaps
In order to minimize its financing costs and to manage interest rate exposure, the Company, fromtime to time, enters into interest rate swap agreements. In October 2003, the Company entered intointerest rate swap agreements to effectively convert interest payments on long-term debt from fixedto variable rates. Interest payments on $200.0 million of 6.7% Notes due in October 2005 and $150.0million of 6.95% Notes due in March 2007 were converted from the respective fixed rates to variablerates based on the London Interbank Offered Rate, LIBOR. In March 2004, the Company terminatedthese agreements, resulting in cash receipts totaling $5.2 million, with a corresponding increase tothe carrying value of the long-term debt. This increase is being amortized over the remaining termof the respective long-term debt as a reduction to interest expense. In February 2001, the Companyentered into interest rate swap agreements that effectively converted variable-interest-ratepayments on certain leases from a variable to a fixed rate of 6.1%.
The fair value of interest rate swaps is defined as the difference in the present values of cash flowscalculated at the contracted interest rates and at current market interest rates at the end of theperiod. The fair value of the swap agreements is calculated quarterly based upon the quoted marketprice for the same or similar financial instruments. The fair value of the variable to fixed interestrate swaps was a liability of $1.7 million and $5.2 million as of December 31, 2004 and 2003,respectively. The potential net loss in fair value of interest rate swaps of ten percent resulting froma hypothetical near-term adverse change in market rates was $.2 million and $.5 million as ofDecember 31, 2004 and 2003, respectively. The Company’s risk related to the interest rate swapagreements is limited to the cost of replacing the agreements at prevailing market rates.
Foreign Exchange Forward Contracts and OptionsThe Company enters into foreign exchange forward contracts and options to hedge transactionsprimarily related to firm commitments to purchase or forecasted purchases of equipment, certain rawmaterials and finished goods denominated in foreign currencies and to hedge payment of forecastedintercompany transactions with its subsidiaries outside the United States. These contracts reducecurrency risk from exchange rate movements. Foreign currency price risks are hedged generally forperiods from 3 to 24 months.
Foreign exchange forward contracts and options are intended to be and are effective as hedges ofidentifiable, foreign currency commitments. Foreign exchange forward contracts are designated ascash flow hedging derivatives and the fair value of such contracts is recorded on the ConsolidatedBalance Sheets as either an asset or liability. Gains and losses on these contracts are recorded as
25
a component of other comprehensive income and are reclassified into earnings in the same periodduring which the hedged transaction affects earnings.
As of December 31, 2004, the Company had foreign exchange forward contracts and options maturingprimarily in 2005 and 2006 to purchase $103.1 million in foreign currency, primarily Australiandollars, Canadian dollars and euros, and to sell $30.8 million in foreign currency, primarily Mexicanpesos and Japanese yen, at contracted forward rates.
As of December 31, 2003, the Company had foreign exchange forward contracts and options maturingprimarily in 2004 and 2005 to purchase $57.7 million in foreign currency, primarily Canadian dollars,and to sell $18.0 million in foreign currency, primarily Japanese yen, at contracted forward rates.
The fair value of foreign exchange contracts and options is defined as the amount of the differencebetween contracted and current market foreign currency exchange rates as of the end of the period.On a quarterly basis, the fair value of foreign exchange forward contracts and options is estimatedby obtaining market quotes for future contracts with similar terms, adjusted where necessary formaturity differences. The fair value of foreign exchange forward contracts and options was an assetof $4.4 million and $1.6 million as of December 31, 2004 and 2003, respectively. The potential netloss in fair value of foreign exchange forward contracts and options of ten percent resulting from ahypothetical near-term adverse change in market rates was $.4 million and $.2 million as ofDecember 31, 2004 and 2003, respectively. The Company’s risk related to the foreign exchangecontracts and options is limited to the cost of replacing the contracts at prevailing market rates.
Commodity Price Risk Management
The Company’s most significant raw material requirements include cocoa, sugar, milk, peanuts andalmonds. The Company attempts to minimize the effect of future price fluctuations related to thepurchase of these raw materials primarily through forward purchasing to cover futuremanufacturing requirements, generally for periods from 3 to 24 months. With regard to cocoa, sugar,corn sweeteners, natural gas, fuel oil and certain dairy products, price risks are also managed byentering into futures contracts. At the present time, active futures contracts are not available for usein pricing the Company’s other major raw material requirements. Futures contracts are used incombination with forward purchasing of cocoa, sugar, corn sweetener, natural gas and certain dairyproduct requirements principally to take advantage of market fluctuations that provide morefavorable pricing opportunities and flexibility in sourcing these raw material and energyrequirements. Fuel oil futures contracts are used to minimize price fluctuations associated with theCompany’s transportation costs. The Company’s commodity procurement practices are intended toreduce the risk of future price increases, but also may potentially limit the ability to benefit frompossible price decreases.
The cost of cocoa beans and the prices for the related commodity futures contracts historically havebeen subject to wide fluctuations attributable to a variety of factors, including the effect of weatheron crop yield, other imbalances between supply and demand, currency exchange rates, politicalunrest in producing countries and speculative influences. After declining from an eighteen-year highin February 2003, cocoa continued to trade at relatively high price levels during 2004. Continued civilunrest in the world’s largest cocoa-producing country, the Ivory Coast, resulted in volatile marketconditions, but has not materially affected the harvesting and marketing of the cocoa crop. TheCompany’s costs during 2005 and beyond will not necessarily reflect market price fluctuationsbecause of its forward purchasing practices, premiums and discounts reflective of relative values,varying delivery times, and supply and demand for specific varieties and grades of cocoa beans. TheCompany’s costs for cocoa will increase in 2005; however, the Company expects to achieve its long-term goals for growth and profitability by a combination of selling price increases, supply chain costreductions and strict control of other costs to offset cost increases and respond to changes in thecompetitive environment.
26
Commodities Futures Contracts
In connection with the purchasing of cocoa, sugar, corn sweeteners, natural gas, fuel oil and certaindairy products for anticipated manufacturing requirements and to hedge transportation costs, theCompany enters into commodities futures contracts as deemed appropriate to reduce the effect ofprice fluctuations. Exchange traded futures contracts are used to fix the price of physical forwardpurchase contracts. Cash transfers reflecting changes in the value of futures contracts (unrealizedgains and losses) are made on a daily basis. The Company accounts for commodities futures contractsin accordance with SFAS No. 133, as amended, and accordingly, cash transfers are reported as acomponent of other comprehensive income. Such cash transfers will be offset by higher or lower cashrequirements for payment of invoice prices of raw materials, energy requirements and transportationcosts in the future. Futures being held in excess of the amount required to fix the price of unpricedphysical forward contracts are effective as hedges of anticipated purchases.
The following sensitivity analysis reflects the market risk of the Company to a hypothetical adversemarket price movement of ten percent, based on the Company’s net commodity positions at four datesspaced equally throughout the year. The Company’s net commodity positions consist of the excessof futures contracts held over unpriced physical forward contracts for the same commodities, relatingto cocoa, sugar, corn sweeteners, natural gas, fuel oil and certain dairy products. Inventories, pricedforward contracts and estimated anticipated purchases not yet contracted for were not included inthe sensitivity analysis calculations. A loss is defined, for purposes of determining market risk, asthe potential decrease in fair value or the opportunity cost resulting from the hypothetical adverseprice movement. The fair values of net commodity positions were based upon quoted marketprices or estimated future prices including estimated carrying costs corresponding with the futuredelivery period.
For the years ended December 31, 2004 2003
In millions of dollarsFair
Value
Market Risk(Hypothetical10% Change)
FairValue
Market Risk(Hypothetical10% Change)
Highest long position $128.2 $12.8 $115.0 $11.5Lowest long position (30.1) 3.0 (14.3) 1.4Average position (long) 62.7 6.3 54.9 5.5
The increase in fair values from 2003 to 2004 primarily reflected an increase in commodity pricesduring 2004. The negative positions primarily resulted as unpriced physical forward contract futuresrequirements exceeded the amount of commodities futures being held at certain points in time duringthe years.
Sensitivity analysis disclosures represent forward-looking statements, which are subject to certainrisks and uncertainties that could cause actual results to differ materially from those presentlyanticipated or projected. The important factors that could affect the sensitivity analysis disclosuresinclude significant increases or decreases in market prices reflecting fluctuations attributable to theeffect of weather on crop yield, other imbalances between supply and demand, currency exchangerates, political unrest in producing countries and speculative influences in addition to changes in theCompany’s hedging strategies.
USE OF ESTIMATES AND OTHER CRITICAL ACCOUNTING POLICIESThe preparation of financial statements in conformity with U.S. generally accepted accountingprinciples requires management to make estimates and assumptions that affect the reportedamounts of assets and liabilities at the date of the financial statements and revenues and expensesduring the period. Significant accounting policies employed by the Company, including the use ofestimates, are presented in the Notes to Consolidated Financial Statements.
Critical accounting estimates involved in applying the Company’s accounting policies are those thatrequire management to make assumptions about matters that are highly uncertain at the time theaccounting estimate was made and those for which different estimates reasonably could have been
27
used for the current period, or changes in the accounting estimate that are reasonably likely to occurfrom period to period, and would have a material impact on the presentation of the Company’sfinancial condition, changes in financial condition or results of operations. The Company’s mostcritical accounting estimates, discussed below, pertain to accounting policies for accountsreceivable—trade, accrued liabilities and pension and other post-retirement benefit plans.
Accounts Receivable—Trade
In the normal course of business, the Company extends credit to customers that satisfy pre-definedcredit criteria. The Company believes that it has little concentration of credit risk due to the diversityof its customer base. Accounts Receivable—Trade, as shown on the Consolidated Balance Sheets,were net of allowances and anticipated discounts. An allowance for doubtful accounts is determinedthrough analysis of the aging of accounts receivable at the date of the financial statements,assessments of collectibility based on historical trends and an evaluation of the impact of current andprojected economic conditions. The Company monitors the collectibility of its accounts receivable onan ongoing basis by analyzing the aging of its accounts receivable, assessing the credit worthinessof its customers and evaluating the impact of reasonably likely changes in economic conditions thatmay impact credit risks. Estimates with regard to the collectibility of accounts receivable arereasonably likely to change in the future.
Over the three-year period ended December 31, 2004, the Company recorded expense averagingapproximately $1.4 million per year for potential uncollectible accounts, including a $5.0 millionprovision in 2003 related to the estimate of probable exposure to the bankruptcy of one of theCompany’s customers, Fleming Companies, Inc. This provision was reversed in the fourth quarterof 2004 upon the agreement with Fleming Reclamation Creditor’s Trust which resolved mostsignificant matters related to the bankruptcy. Write-offs of uncollectible accounts, net of recoveries,averaged approximately $2.0 million over the same period. The provision for uncollectible accountsis recognized as selling, marketing and administrative expense in the Consolidated Statements ofIncome. Over the past three years, the allowance for doubtful accounts has ranged from 2% to 3%of gross accounts receivable. If reasonably possible near-term changes in the most materialassumptions were made with regard to the collectibility of accounts receivable, the amounts by whichthe annual provision would have changed would have resulted in a reduction in expense ofapproximately $2.5 million to an increase in expense of approximately $1.4 million. Changes inestimates for future uncollectible accounts receivable would not have a material impact on theCompany’s liquidity or capital resources.
Accrued Liabilities
Accrued liabilities requiring the most difficult or subjective judgments include liabilities associatedwith marketing promotion programs and potentially unsaleable products. The Company utilizesnumerous trade promotion programs. The costs of such programs are recognized as a reduction tonet sales with the recording of a corresponding accrued liability based on estimates at the time ofproduct shipment. The accrued liability for marketing promotions is determined through analysisof programs offered, historical trends, expectations regarding customer and consumer participation,sales and payment trends, and experience with payment patterns associated with similar programsthat had been previously offered. The estimated costs of these programs are reasonably likely tochange in the future as a result of changes in trends with regard to customer and consumerparticipation, particularly for new programs and for programs related to the introduction of newproducts. Promotional costs were $557.5 million, $551.2 million and $461.6 million in 2004, 2003 and2002, respectively. Reasonably possible near-term changes in the most material assumptionsregarding the cost of promotional programs would have resulted in changes ranging from a reductionin such costs of approximately $12.0 million to an increase in costs of approximately $10.0 million,with an increase or decrease to net sales and income before income taxes within that range. Overthe last three years, actual promotion costs have not deviated from the estimated amounts by morethan 4%. Changes in estimates related to the cost of promotion programs would not have a materialimpact on the Company’s liquidity or capital resources.
28
At the time of sale, the Company estimates a cost for the possibility that products will become agedor unsaleable in the future. The estimated cost is included as a reduction to net sales. A relatedaccrued liability is determined using statistical analysis that incorporates historical sales trends,seasonal timing and sales patterns, and product movement at retail. Estimates for costs associatedwith unsaleable products may change as a result of inventory levels in the distribution channel,current economic trends, changes in consumer demand, the introduction of new products and changesin trends of seasonal sales in response to promotion programs. Over the three-year period endedDecember 31, 2004, costs associated with aged or unsaleable products have amounted toapproximately 2% of gross sales. Reasonably possible near-term changes in the most materialassumptions regarding the estimates of such costs would have increased or decreased net sales andincome before income taxes in a range from $.5 million to $1.0 million. In each of the years in thethree-year period ended December 31, 2004, actual costs have not deviated from the Company’sestimates by more than 1%. Reasonably possible near-term changes in the estimates of costsassociated with unsaleable products would not have a material impact on the Company’s liquidityor capital resources.
Pension and Other Post-Retirement Benefit Plans
The Company sponsors a number of defined benefit pension plans. The principal plans are theHershey Foods Corporation Retirement Plan and the Hershey Foods Corporation Retirement Planfor Hourly Employees which are cash balance plans that provide pension benefits for most domesticemployees. The Company is monitoring legislative and regulatory developments regarding cashbalance plans, as well as recent court cases, for any impact on its plans. The Company also sponsorstwo primary post-retirement benefit plans. The health care plan is contributory, with participants’contributions adjusted annually, and the life insurance plan is non-contributory.
The Company’s policy is to fund domestic pension liabilities in accordance with the minimum andmaximum limits imposed by the Employee Retirement Income Security Act of 1974 and Federalincome tax laws, respectively. Non-domestic pension liabilities are funded in accordance withapplicable local laws and regulations. Plan assets are invested in a broadly diversified portfolioconsisting primarily of domestic and international common stocks and fixed income securities. Short-term and long-term liabilities associated with benefit plans are primarily determined based onactuarial calculations. These calculations are made considering payroll and employee data, includingage and years of service, along with actuarial assumptions at the date of the financial statements.The Company takes into consideration long-term projections with regard to economic conditions,including interest rates, return on assets and the rate of increase in compensation levels. With regardto liabilities associated with other post-retirement benefit plans that provide health care and lifeinsurance, the Company takes into consideration the long-term annual rate of increase in the percapita cost of the covered benefits. In compliance with the provisions of Statement of FinancialAccounting Standards No. 87, Employers’ Accounting for Pensions, and Statement of FinancialAccounting Standards No. 106, Employers’ Accounting for Postretirement Benefits Other ThanPensions, the discount rate assumption is reviewed and may be revised annually. The expected long-term rate of return on assets assumption (“asset return assumption”) for funded plans is by its natureof a longer duration and would be revised only when long-term asset return projections demonstratethat need.
Pension Plans
The net periodic pension benefits cost for the Company sponsored plans was $33.6 million, $51.0million and $29.8 million, respectively, in 2004, 2003 and 2002. For 2005, net periodic pension benefitscost is expected to be comparable to 2004 primarily due to a higher than expected return on planassets during 2004 and cash contributions to the pension plans in 2005, offset by the lower 2005discount rate. The recognized net actuarial losses will be higher in 2005 due to the lower discountrate. Actuarial gains and losses may arise when actual experience differs from assumed experienceor when the actuarial assumptions used to value the plan’s obligations are revised from time to time.The Company’s policy is to amortize only unrecognized net actuarial gains/losses in excess of 10%
29
of the respective plan’s projected benefit obligation, or fair market value of assets, if greater. Theestimated recognized net actuarial loss component of net periodic pension benefits cost for 2005 is$10.0 million based on the December 31, 2004 unrecognized net actuarial loss presented in Note 13,Pension and Other Post-Retirement Benefit Plans, of $243.9 million and an amortization period ofprimarily between thirteen and fifteen years, the average remaining service period of activeemployees expected to receive benefits under the plans (“average remaining service period”). Changesto the assumed rates of participant termination, disability and retirement would impact the averageremaining service period. An increase in these rates would decrease the average remaining serviceperiod and a decrease in these rates would have the opposite effect. However, changes to theseassumed rates are not anticipated at this time. The 2004 recognized net actuarial loss componentof net periodic pension benefits cost was $9.8 million. Projections beyond 2005 are dependent on avariety of factors such as changes to the discount rate and the actual return on pension plan assets.
The Company used an average discount rate assumption of 6.0%, 6.3% and 6.9% for 2004, 2003 and2002, respectively, in the calculation of net periodic pension benefits cost for its plans. The use of adifferent discount rate assumption can significantly impact net periodic pension benefits cost. A onepercentage point decrease in the discount rate assumption would have increased 2004 net periodicpension benefits cost by $12.0 million and a one percentage point increase in the discount rateassumption would have decreased 2004 net periodic pension benefits cost by $10.2 million. TheCompany’s discount rate represents the estimated rate at which pension benefits could be effectivelysettled. In order to estimate this rate, the Company considers the yields of high quality securities,which are generally considered to be those receiving a rating no lower than the second highest givenby a recognized rating agency.
The Company reduced its average discount rate assumption to 5.7% for valuing obligations as ofDecember 31, 2004, from 6.0% as of December 31, 2003, due to the declining interest rateenvironment. A one percentage point decrease in the discount rate assumption would have increasedthe December 31, 2004 pension benefits obligations by $125.0 million and a one percentage pointincrease in the discount rate assumption would have decreased the December 31, 2004 pensionbenefits obligations by $106.1 million.
Asset return assumptions of 8.5%, 8.5% and 9.5% were used in the calculation of net periodic pensionbenefits cost for 2004, 2003 and 2002, respectively, and the expected return on plan assets componentof net periodic pension benefits cost was based on the fair market value of pension plan assets. Todetermine the expected return on plan assets, the Company considers the current and expected assetallocations, as well as historical and expected returns on the categories of plan assets. The historicalgeometric average return over the 17 years prior to December 31, 2004 was approximately 9.7%. Theactual return on assets was 10.7% during 2004, with gains during 2003 of approximately 21.1% andlosses during 2002 of (13.1)%. The use of a different asset return assumption can significantly impactnet periodic pension benefits cost. A one percentage point decrease in the asset return assumptionwould have increased 2004 net periodic pension benefits cost by $9.0 million and a one percentagepoint increase in the asset return assumption would have decreased 2004 net periodic pensionbenefits cost by $9.0 million.
The Company’s pension asset investment policies specify ranges of pension asset allocationpercentages for each asset class. The ranges for the domestic pension plans were as follows: equitysecurities, 40%–85%; debt securities, 15%–60%; and cash, 0%–10%. As of December 31, 2004, theactual allocations were within the ranges. The level of volatility in pension plan asset returns isexpected to be in line with the overall volatility of the markets and weightings within the assetclasses disclosed.
For 2004 and 2003, the Company had no minimum funding requirements for the domestic plans andminimum funding requirements for the non-domestic plans were not material. However, the Companymade contributions of $8.0 million in 2004 and $120.3 million in 2003 to improve the funded status. Thesecontributions were fully tax deductible. A one percentage point change in the discount rate or asset returnassumptions would not have changed the 2004 minimum funding requirements for the domestic plans.
30
For 2005, there will be no minimum funding requirements for the domestic plans and minimum fundingrequirements for the non-domestic plans will not be material. However, the Company contributed$40.0 million to the domestic plans in January 2005 to improve the funded status.
Post-Retirement Benefit Plans
Other post-retirement benefits costs relate primarily to health care and life insurance benefits. Netperiodic other post-retirement benefits costs for the Company sponsored plans were $24.3 million,$23.9 million and $23.7 million in 2004, 2003 and 2002, respectively. For the calculation of netperiodic other post-retirement benefits costs, discount rate assumptions of 6.0%, 6.3% and 7.0% wereused for 2004, 2003 and 2002, respectively. The use of a different discount rate assumption cansignificantly impact net periodic other post-retirement benefits costs. A one percentage pointdecrease in the discount rate assumption would have increased 2004 net periodic other post-retirement benefits costs by $1.5 million and a one percentage point increase in the discount rateassumption would have decreased 2004 net periodic other post-retirement benefits costs by$1.3 million.
The Company used discount rate assumptions of 5.7% and 6.0% to value the other post-retirementbenefits obligations as of December 31, 2004 and 2003, respectively. A one percentage point decreasein the discount rate assumption would have increased the December 31, 2004 other post-retirementbenefits obligations by $36.4 million and a one percentage point increase in the discount rateassumption would have decreased the December 31, 2004 other post-retirement benefits obligationsby $30.4 million.
On December 8, 2003, the President of the United States signed into law the Medicare PrescriptionDrug, Improvement and Modernization Act of 2003 (the “2003 Medicare Act”). The 2003 MedicareAct introduced a prescription drug benefit under Medicare (“Medicare Part D”) as well as a Federalsubsidy to sponsors of retiree health care benefit plans that provide a benefit that is at leastactuarially equivalent to Medicare Part D. The Company believes that certain prescription drugbenefits offered under post-retirement health care plans will qualify for the subsidy under MedicarePart D. The Federal subsidy to be provided by the 2003 Medicare Act reduced net periodic benefitscosts in 2004 by approximately $3.0 million and lowered the accumulated post-retirement benefitsobligation by approximately $25.2 million.
Other critical accounting policies employed by the Company include the following:
Goodwill and Other Intangible Assets
The Company accounts for goodwill and other intangible assets in accordance with Statement ofFinancial Accounting Standards No. 142, Goodwill and Other Intangible Assets. Other intangibleassets consist primarily of trademarks, customer-related intangible assets and patents obtainedthrough business acquisitions. The useful lives of trademarks were determined to be indefinite and,therefore, these assets are not being amortized. Customer-related intangible assets are beingamortized over their estimated useful lives of approximately ten years. Patents are being amortizedover their remaining legal lives of approximately sixteen years.
The impairment evaluation for goodwill is conducted annually, or more frequently if events orchanges in circumstances indicate that an asset might be impaired. The evaluation is performed byusing a two-step process. In the first step, the fair value of each reporting unit is compared with thecarrying amount of the reporting unit, including goodwill. The estimated fair value of the reportingunit is generally determined on the basis of discounted future cash flows. If the estimated fair valueof the reporting unit is less than the carrying amount of the reporting unit, then a second step mustbe completed in order to determine the amount of the goodwill impairment that should be recorded.In the second step, the implied fair value of the reporting unit’s goodwill is determined by allocatingthe reporting unit’s fair value to all of its assets and liabilities other than goodwill (including anyunrecognized intangible assets) in a manner similar to a purchase price allocation. The resulting
31

implied fair value of the goodwill that results from the application of this second step is then comparedto the carrying amount of the goodwill and an impairment charge is recorded for the difference.
The evaluation of the carrying amount of intangible assets with indefinite lives is conducted annually,or more frequently if events or changes in circumstances indicate that an asset might be impaired.The evaluation is performed by comparing the carrying amount of these assets to their estimatedfair value. If the estimated fair value is less than the carrying amount of the intangible assets withindefinite lives, then an impairment charge is recorded to reduce the asset to its estimated fair value.The estimated fair value is generally determined on the basis of discounted future cash flows.
The assumptions used in the estimate of fair value are generally consistent with the past performanceof each reporting unit and are also consistent with the projections and assumptions that are usedin current operating plans. Such assumptions are subject to change as a result of changing economicand competitive conditions.
Goodwill was assigned to reporting units and transitional impairment tests were performed forgoodwill and other intangible assets during the first quarter of 2002 and the annual impairment testswere performed in the fourth quarters of 2002, 2003 and 2004. No impairment of assets wasdetermined as a result of these tests.
Commodities Futures Contracts
In connection with the purchasing of cocoa, sugar, corn sweeteners, natural gas, fuel oil and certaindairy products for anticipated manufacturing requirements and to hedge transportation costs,the Company enters into commodities futures contracts as deemed appropriate to reduce the effectof price fluctuations. Commodities futures contracts utilized by the Company are designated andaccounted for as cash flow hedges under SFAS No. 133, as amended. Additional information withregard to accounting policies associated with derivative instruments is contained in Note 6,Derivative Instruments and Hedging Activities.
The net after-tax impact of cash flow hedging derivatives on comprehensive income (loss) reflecteda $16.3 million gain in 2004, a $20.2 million loss in 2003 and a $106.7 million gain in 2002. Net gainsand losses on cash flow hedging derivatives were primarily associated with commodities futurescontracts. Reclassification adjustments from accumulated other comprehensive income (loss) toincome, for gains or losses on cash flow hedging derivatives, were reflected in cost of sales.Reclassification of gains of $26.1 million, $51.9 million, and $17.9 million for 2004, 2003 and 2002,respectively, were associated with commodities futures contracts. Gains on commodities futurescontracts recognized in cost of sales as a result of hedge ineffectiveness were approximately$.4 million, $.4 million and $1.5 million before tax for the years ended December 31, 2004, 2003 and2002, respectively. No gains or losses on cash flow hedging derivatives were reclassified fromaccumulated other comprehensive income (loss) into income as a result of the discontinuance of ahedge because it became probable that a hedged forecasted transaction would not occur. There wereno components of gains or losses on cash flow hedging derivatives that were recognized in incomebecause such components were excluded from the assessment of hedge effectiveness. The amount ofnet gains on cash flow hedging derivatives, including foreign exchange forward contracts and options,interest rate swap agreements and commodities futures contracts, expected to be reclassified intoearnings in the next twelve months was approximately $18.7 million after tax as of December 31,2004, which were principally associated with commodities futures contracts.
RETURN MEASURES
Operating Return on Average Stockholders’ Equity
The Company’s operating return on average stockholders’ equity, on a GAAP basis, was 49.9% in2004. The Company’s adjusted operating return on average stockholders’ equity was 44.7% in 2004.For the purpose of calculating the adjusted operating return on average stockholders’ equity, earningsis defined as net income adjusted to reflect the impact of the elimination of the amortization of
32
intangibles for all years and excluding the impact of the adjustment to income tax contingencyreserves on the provision for income taxes in 2004, the after-tax effect of the business realignmentinitiatives in 2003, 2002 and 2001, the after-tax effect of incremental expenses to explore the possiblesale of the Company in 2002 and the after-tax gains on the sale of a group of the Company’s gumbrands in 2003, the sale of the Luden’s throat drops business in 2001, the sale of corporate aircraftin 2000 and the sale of the pasta business in 1999. Over the most recent six-year period, the adjustedreturn has ranged from 28.9% in 1999 to 44.7% in 2004.
Operating Return on Average Invested Capital
The Company’s operating return on average invested capital, on a GAAP basis, was 26.7% in 2004.The Company’s adjusted operating return on average invested capital was 24.1% in 2004. Averageinvested capital consists of the annual average of beginning and ending balances of long-term debt,deferred income taxes and stockholders’ equity. For the purpose of calculating the adjusted operatingreturn on average invested capital, earnings is defined as net income adjusted to reflect the impactof the elimination of the amortization of intangibles for all years and excluding the impact of theadjustment to income tax contingency reserves on the provision for income taxes in 2004, the after-taxeffect of the business realignment initiatives in 2003, 2002 and 2001, the after-tax effect ofincremental expenses to explore the possible sale of the Company in 2002, the after-tax gains on thesale of a group of the Company’s gum brands in 2003, the sale of the Luden’s throat drops businessin 2001, the sale of corporate aircraft in 2000, and the sale of the pasta business in 1999, and theafter-tax effect of interest on long-term debt. Over the most recent six-year period, the adjusted returnhas ranged from 15.4% in 1999 to 24.1% in 2004.
OUTLOOK
The outlook section contains a number of forward-looking statements, all of which are based oncurrent expectations. Actual results may differ materially. Key risks to achieving future performanceinclude: the continued ability to accelerate the introduction of new products, while balancing therationalization of under-performing items; customer and consumer acceptance of announced priceincreases; achievement of targeted cost improvements; successful resolution of upcoming laborcontract negotiations; intensified competitive activity in certain markets; changes to customers’businesses and in the retail environment; changes in the regulatory environment, which includes taxlaws as well as initiatives which could restrict or limit certain product sales; the ability to improveprofitability of international businesses which are subject to certain volatility with regard to theeconomic and foreign currency exchange environment in certain countries; and the risk of increasesin raw material and other costs.
During the three years ended December 31, 2004, the Company significantly improved operatingresults as it implemented its strategies. Over the long-term these strategies seek to deliver averagenet sales growth of 3%–4% per year, gross margin improvement of 70–90 basis points per year, 7%–9%annual growth in earnings before interest expense and income taxes (“EBIT”) and 9%–11% earningsper share-diluted (“EPS”) growth per year.
The Company expects continued sales growth in 2005 to be 6%−7%, including growth at the top endof its long-term goal for the ongoing business, enhanced by the first year impact of the Mauna Loaand Grupo Lorena acquisitions. The Company will continue to introduce new items and limitededition line extensions. During 2005 these will include a full year of sales for the following items thatwere introduced in 2004: Hershey’s Kisses brand filled with caramel milk chocolates, Ice BreakersLiquid Ice mints, Hershey’s Snack Barz rice and marshmallow bars, Hershey’s SmartZone nutritionbars, Take5 candy bars, Hershey’s, Almond Joy, York and Reese’s cookies, Reese’s Pieces candy withpeanuts, and Reese’s Big Cup, previously sold as a limited edition item.
Geographically, net sales growth is expected to be concentrated primarily in North America. Growthoutside North America will be focused on limited geographic areas offering attractive marketopportunities.
33
Gross margin is expected to improve 30–40 basis points in 2005, including growth approaching thelower end of the Company’s long-term goal of 70−90 basis points for the ongoing business, reducedby the impact of integrating the lower margin Grupo Lorena and Mauna Loa businesses. Marginimprovement is affected by various factors, including selling prices, promotional allowances, rawmaterial costs, supply chain efficiencies and the mix of products sold in any period. During 2005,improved price realization resulting from a combination of selling price increases and product weightchanges, combined with improved supply chain efficiencies will more than offset higher input costs,primarily for raw materials, transportation and employee benefits.
EBIT is expected to grow within the range of the long-term goal in 2005, as a result of the net salesgrowth and gross margin expansion, combined with careful control of selling, marketing andadministrative costs.
Net income and EPS in 2004 benefited from the non-recurring adjustment to income tax contingencyreserves, which reduced the tax rate and income tax expense. In 2005, the tax rate will return to amore normal rate, estimated at 36.6%, offsetting the EBIT gains and resulting in relatively flat netincome and EPS versus 2004. Excluding the impact of this non-recurring adjustment, net income andEPS are expected to increase within the range of the Company’s long-term goals.
The Company expects strong cash flows from operating activities in 2005. Net cash provided fromoperating activities is expected to exceed cash requirements for capital additions, capitalizedsoftware additions and anticipated dividend payments. The Company will continue to monitor thefunded status of pension plans based on market performance and make future contributions asappropriate. The plans were sufficiently funded at the end of 2004, however, in January 2005, acontribution of $40.0 million was made to improve the funded status of the domestic plans. TheCompany’s cash flow from operations is expected to remain strong. During 2005, the Company willrepay the $201.2 million of 6.7% Notes due in 2005 by utilizing cash provided from operations andadditional short-term borrowings.
NEW ACCOUNTING PRONOUNCEMENTS
In December 2004, the FASB issued Statement of Financial Accounting Standards No. 123R,Share-Based Payment, an amendment of FASB Statements No. 123 and 95 (“SFAS No. 123R”). SFASNo. 123R addresses the accounting for transactions in which an enterprise exchanges its valuableequity instruments for employee services. It also addresses transactions in which an enterpriseincurs liabilities that are based on the fair value of the enterprise’s equity instruments or that maybe settled by the issuance of those equity instruments in exchange for employee services. For publicentities, the cost of employee services received in exchange for equity instruments, includingemployee stock options, would be measured based on the grant-date fair value of those instruments.That cost would be recognized as compensation expense over the requisite service period (often thevesting period). Generally, no compensation cost would be recognized for equity instruments thatdo not vest.
SFAS No. 123R is effective for periods beginning after June 15, 2005. SFAS No. 123R will apply toawards granted, modified, or settled in cash on or after that date. Companies may choose from oneof three methods when transitioning to the new standard, which may include restatement of priorannual and interim periods. The impact on EPS of expensing stock options will be dependent uponthe method to be used for valuation of stock options and the transition method determined by theCompany. The total impact on an annualized basis could range from approximately $.06 to $.08 pershare-diluted, assuming option grants continue at the same level as in 2004.
34
In November 2004, the FASB issued Statement of Financial Accounting Standards No. 151, InventoryCosts, an amendment of ARB No. 43, Chapter 4 (“SFAS No. 151”). SFAS No. 151 amends the guidancein ARB No. 43, Chapter 4, “Inventory Pricing,” to clarify the accounting for abnormal amounts of idlefacility expense, freight, handling costs, and wasted material (spoilage). Paragraph 5 of ARB No. 43,Chapter 4, previously stated that “...under some circumstances, items such as idle facility expense,excessive spoilage, double freight, and rehandling costs may be so abnormal as to require treatmentas current period charges...” SFAS No. 151 requires that those items be recognized as current-periodcharges regardless of whether they meet the criterion of “so abnormal.” In addition, SFAS No. 151requires that allocation of fixed production overheads to the costs of conversion be based on thenormal capacity of the production facilities. The Company does not expect any significant changesto its financial accounting and reporting as a result of the implementation of SFAS No. 151.
Item 7A. QUANTITATIVE AND QUALITATIVE DISCLOSURES ABOUT MARKETRISK
The information required by this item with respect to market risk is set forth in the section entitled“Accounting Policies and Market Risks Associated with Derivative Instruments,” found on pages 24through 27.
Item 8. FINANCIAL STATEMENTS AND SUPPLEMENTARY DATA
INDEX TO CONSOLIDATED FINANCIAL STATEMENTSPAGE
Responsibility for Financial Statements 36Report of Independent Registered Public Accounting Firm on
Consolidated Financial Statements 37Consolidated Statements of Income for the years ended
December 31, 2004, 2003 and 2002 38Consolidated Balance Sheets as of December 31, 2004 and 2003 39Consolidated Statements of Cash Flows for the years ended
December 31, 2004, 2003 and 2002 40Consolidated Statements of Stockholders’ Equity for the years ended
December 31, 2004, 2003 and 2002 41Notes to Consolidated Financial Statements 42
35
RESPONSIBILITY FOR FINANCIAL STATEMENTS
Hershey Foods Corporation is responsible for the financial statements and other financialinformation contained in this report. The Company believes that the financial statements havebeen prepared in conformity with U.S. generally accepted accounting principles appropriate underthe circumstances to reflect in all material respects the substance of applicable events andtransactions. In preparing the financial statements, it is necessary that management make informedestimates and judgments. The other financial information in this annual report is consistent withthe financial statements.
The Company maintains a system of internal accounting controls designed to provide reasonableassurance that financial records are reliable for purposes of preparing financial statements and thatassets are properly accounted for and safeguarded. The concept of reasonable assurance is based onthe recognition that the cost of the system must be related to the benefits to be derived. The Companybelieves its system provides an appropriate balance in this regard. The Company maintains anInternal Audit Department which reviews the adequacy and tests the application of internalaccounting controls.
The 2004, 2003 and 2002 financial statements have been audited by KPMG LLP, an independentregistered public accounting firm. KPMG LLP’s report on the Company’s 2004 and 2003 financialstatements is included on page 37.
The Audit Committee of the Board of Directors of the Company, consisting solely of independent, non-management directors, meets regularly with the independent auditors, internal auditors andmanagement to discuss, among other things, the audit scopes and results. KPMG LLP and theinternal auditors both have full and free access to the Audit Committee, with and without thepresence of management.
Richard H. LennyChairman of the Board, Presidentand Chief Executive Officer
David J. WestSenior Vice PresidentChief Financial Officer
36
REPORT OF INDEPENDENT REGISTERED PUBLIC ACCOUNTING FIRM
The Board of Directors and StockholdersHershey Foods Corporation:
We have audited the accompanying consolidated balance sheets of Hershey Foods Corporation andsubsidiaries (the “Corporation”) as of December 31, 2004 and 2003, and the related consolidatedstatements of income, cash flows and stockholders’ equity for each of the years in the three-yearperiod ended December 31, 2004. These consolidated financial statements are the responsibility ofthe Corporation’s management. Our responsibility is to express an opinion on these consolidatedfinancial statements based on our audits.
We conducted our audits in accordance with the standards of the Public Company AccountingOversight Board (United States). Those standards require that we plan and perform the audit toobtain reasonable assurance about whether the financial statements are free of materialmisstatement. An audit includes examining, on a test basis, evidence supporting the amounts anddisclosures in the financial statements. An audit also includes assessing the accounting principlesused and significant estimates made by management, as well as evaluating the overall financialstatement presentation. We believe that our audits provide a reasonable basis for our opinion.
In our opinion, the consolidated financial statements referred to above present fairly, in all materialrespects, the financial position of Hershey Foods Corporation and subsidiaries as of December 31, 2004and 2003, and the results of their operations and their cash flows for each of the years in the three-yearperiod ended December 31, 2004, in conformity with U.S. generally accepted accounting principles.
As discussed in Note 2, the Corporation adopted Financial Accounting Standards BoardInterpretation No. 46, Consolidation of Variable Interest Entities, an interpretation of ARB No. 51,on June 30, 2003.
We also have audited, in accordance with the standards of the Public Company Accounting OversightBoard (United States), the effectiveness of the Corporation’s internal control over financial reportingas of December 31, 2004, based on criteria established in Internal Control-Integrated Frameworkissued by the Committee of Sponsoring Organizations of the Treadway Commission (COSO), and ourreport dated March 3, 2005 expressed an unqualified opinion on management’s assessment of, andthe effective operation of, internal control over financial reporting.
New York, New YorkMarch 3, 2005
37
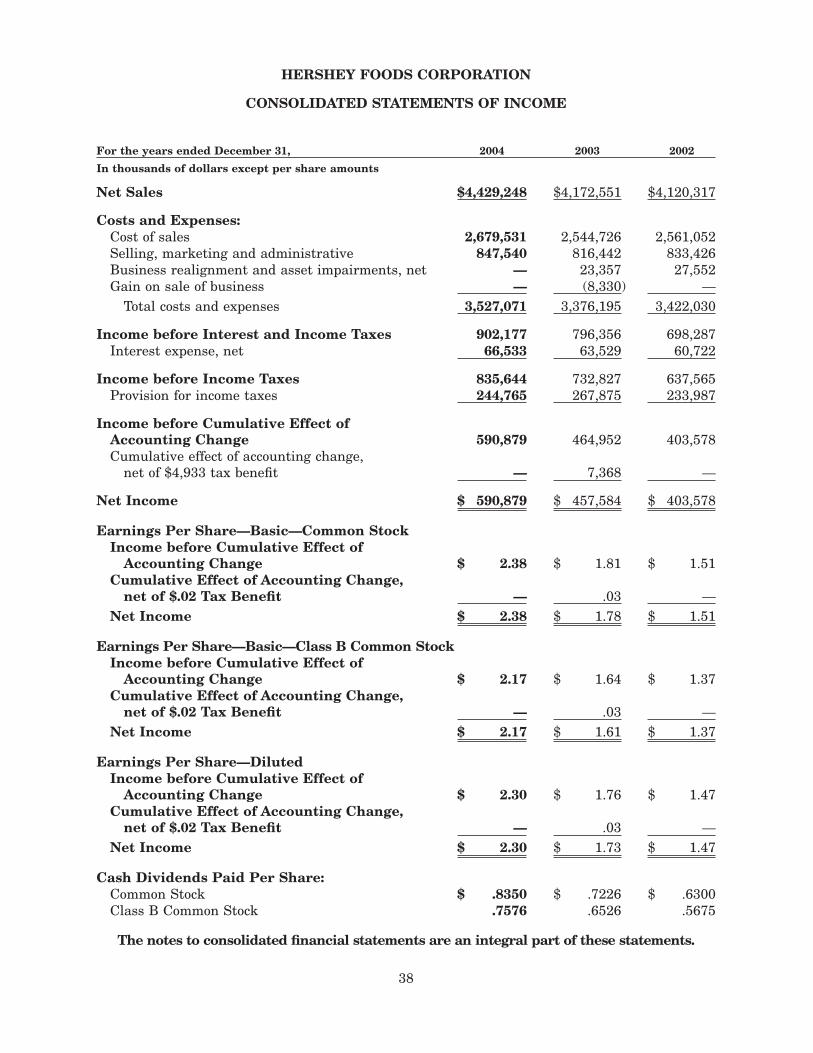
HERSHEY FOODS CORPORATION
CONSOLIDATED STATEMENTS OF INCOME
For the years ended December 31, 2004 2003 2002
In thousands of dollars except per share amounts
Net Sales $4,429,248 $4,172,551 $4,120,317
Costs and Expenses:Cost of sales 2,679,531 2,544,726 2,561,052Selling, marketing and administrative 847,540 816,442 833,426Business realignment and asset impairments, net — 23,357 27,552Gain on sale of business — (8,330) —
Total costs and expenses 3,527,071 3,376,195 3,422,030
Income before Interest and Income Taxes 902,177 796,356 698,287Interest expense, net 66,533 63,529 60,722
Income before Income Taxes 835,644 732,827 637,565Provision for income taxes 244,765 267,875 233,987
Income before Cumulative Effect ofAccounting Change 590,879 464,952 403,578Cumulative effect of accounting change,
net of $4,933 tax benefit — 7,368 —
Net Income $ 590,879 $ 457,584 $ 403,578
Earnings Per Share—Basic—Common StockIncome before Cumulative Effect of
Accounting Change $ 2.38 $ 1.81 $ 1.51Cumulative Effect of Accounting Change,
net of $.02 Tax Benefit — .03 —Net Income $ 2.38 $ 1.78 $ 1.51
Earnings Per Share—Basic—Class B Common StockIncome before Cumulative Effect of
Accounting Change $ 2.17 $ 1.64 $ 1.37Cumulative Effect of Accounting Change,
net of $.02 Tax Benefit — .03 —Net Income $ 2.17 $ 1.61 $ 1.37
Earnings Per Share—DilutedIncome before Cumulative Effect of
Accounting Change $ 2.30 $ 1.76 $ 1.47Cumulative Effect of Accounting Change,
net of $.02 Tax Benefit — .03 —Net Income $ 2.30 $ 1.73 $ 1.47
Cash Dividends Paid Per Share:Common Stock $ .8350 $ .7226 $ .6300Class B Common Stock .7576 .6526 .5675
The notes to consolidated financial statements are an integral part of these statements.
38

HERSHEY FOODS CORPORATION
CONSOLIDATED BALANCE SHEETS
December 31, 2004 2003
In thousands of dollars
ASSETSCurrent Assets:
Cash and cash equivalents $ 54,837 $ 114,793Accounts receivable—trade 408,930 407,612Inventories 557,180 492,859Deferred income taxes 46,503 13,285Prepaid expenses and other 114,991 103,020
Total current assets 1,182,441 1,131,569Property, Plant and Equipment, Net 1,682,698 1,661,939Goodwill 463,947 388,960Other Intangibles 125,233 38,511Other Assets 343,212 361,561
Total assets $ 3,797,531 $ 3,582,540
LIABILITIES AND STOCKHOLDERS’ EQUITYCurrent Liabilities:
Accounts payable $ 148,686 $ 132,222Accrued liabilities 472,096 416,181Accrued income taxes 42,280 24,898Short-term debt 343,277 12,032Current portion of long-term debt 279,043 477
Total current liabilities 1,285,382 585,810Long-term Debt 690,602 968,499Other Long-term Liabilities 403,356 370,776Deferred Income Taxes 328,889 377,589
Total liabilities 2,708,229 2,302,674
Stockholders’ Equity:Preferred Stock, shares issued: none in 2004 and 2003 — —Common Stock, shares issued: 299,060,235 in 2004
and 149,528,776 on a pre-split basis in 2003 299,060 149,528Class B Common Stock, shares issued: 60,841,509 in
2004 and 30,422,096 on a pre-split basis in 2003 60,841 30,422Additional paid-in capital 28,614 4,034Unearned ESOP compensation (6,387) (9,580)Retained earnings 3,469,169 3,263,988Treasury—Common Stock shares, at cost:
113,313,827 in 2004 and 50,421,139 on a pre-splitbasis in 2003 (2,762,304) (2,147,441)
Accumulated other comprehensive income (loss) 309 (11,085)Total stockholders’ equity 1,089,302 1,279,866Total liabilities and stockholders’ equity $ 3,797,531 $ 3,582,540
The notes to consolidated financial statements are an integral part of these balance sheets.
39
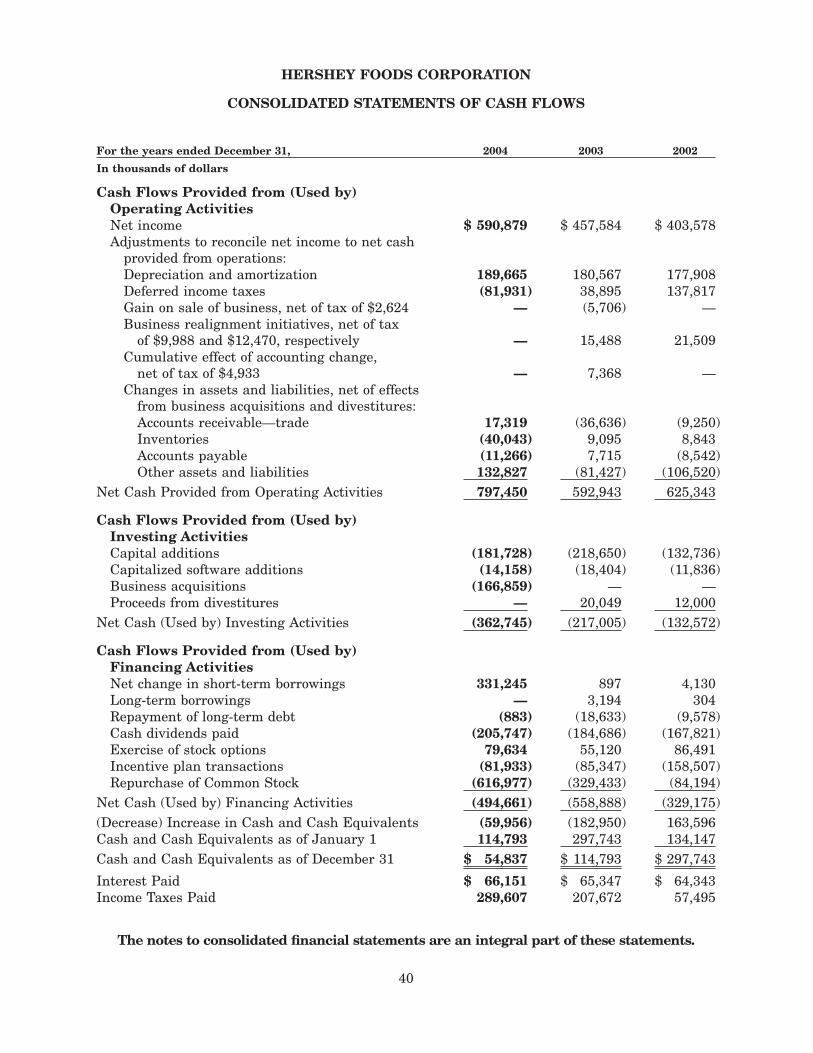
HERSHEY FOODS CORPORATION
CONSOLIDATED STATEMENTS OF CASH FLOWS
For the years ended December 31, 2004 2003 2002
In thousands of dollars
Cash Flows Provided from (Used by)Operating ActivitiesNet income $ 590,879 $ 457,584 $ 403,578Adjustments to reconcile net income to net cash
provided from operations:Depreciation and amortization 189,665 180,567 177,908Deferred income taxes (81,931) 38,895 137,817Gain on sale of business, net of tax of $2,624 — (5,706) —Business realignment initiatives, net of tax
of $9,988 and $12,470, respectively — 15,488 21,509Cumulative effect of accounting change,
net of tax of $4,933 — 7,368 —Changes in assets and liabilities, net of effects
from business acquisitions and divestitures:Accounts receivable—trade 17,319 (36,636) (9,250)Inventories (40,043) 9,095 8,843Accounts payable (11,266) 7,715 (8,542)Other assets and liabilities 132,827 (81,427) (106,520)
Net Cash Provided from Operating Activities 797,450 592,943 625,343
Cash Flows Provided from (Used by)Investing ActivitiesCapital additions (181,728) (218,650) (132,736)Capitalized software additions (14,158) (18,404) (11,836)Business acquisitions (166,859) — —Proceeds from divestitures — 20,049 12,000
Net Cash (Used by) Investing Activities (362,745) (217,005) (132,572)
Cash Flows Provided from (Used by)Financing ActivitiesNet change in short-term borrowings 331,245 897 4,130Long-term borrowings — 3,194 304Repayment of long-term debt (883) (18,633) (9,578)Cash dividends paid (205,747) (184,686) (167,821)Exercise of stock options 79,634 55,120 86,491Incentive plan transactions (81,933) (85,347) (158,507)Repurchase of Common Stock (616,977) (329,433) (84,194)
Net Cash (Used by) Financing Activities (494,661) (558,888) (329,175)(Decrease) Increase in Cash and Cash Equivalents (59,956) (182,950) 163,596Cash and Cash Equivalents as of January 1 114,793 297,743 134,147Cash and Cash Equivalents as of December 31 $ 54,837 $ 114,793 $ 297,743
Interest Paid $ 66,151 $ 65,347 $ 64,343Income Taxes Paid 289,607 207,672 57,495
The notes to consolidated financial statements are an integral part of these statements.
40
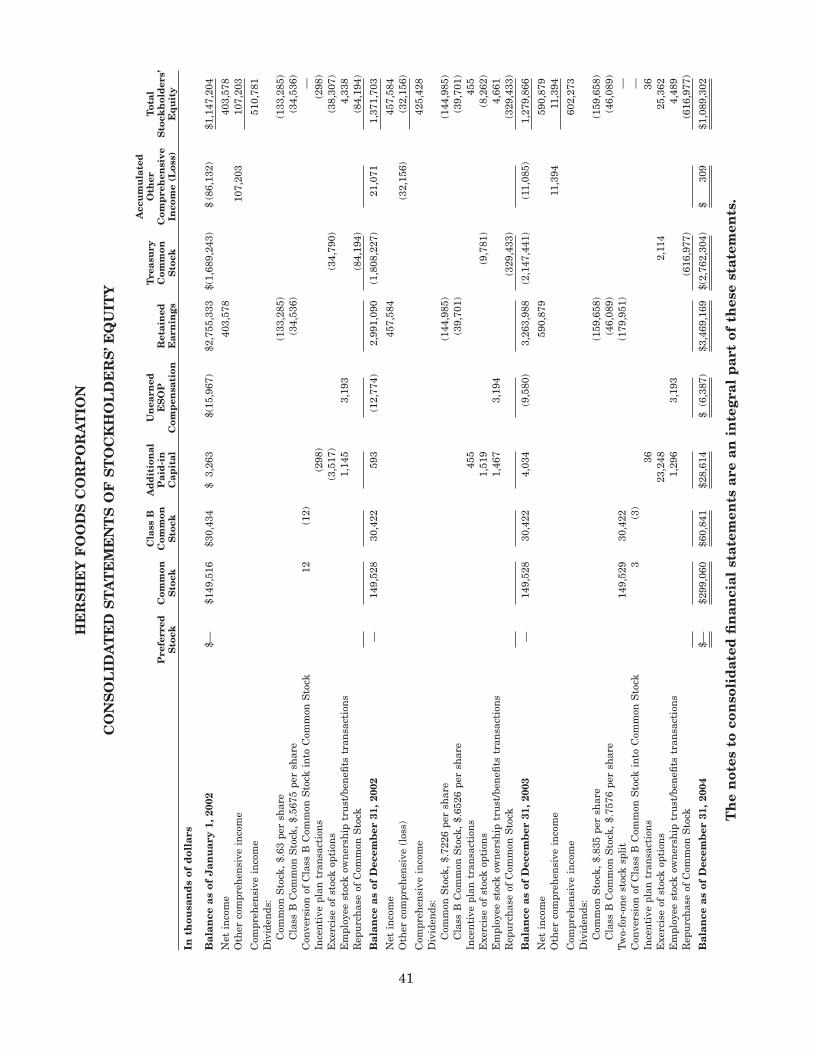
HE
RS
HE
YF
OO
DS
CO
RP
OR
AT
ION
CO
NS
OL
IDA
TE
DS
TA
TE
ME
NT
SO
FS
TO
CK
HO
LD
ER
S’E
QU
ITY
Pre
ferr
edS
tock
Com
mon
Sto
ck
Cla
ssB
Com
mon
Sto
ck
Ad
dit
ion
alP
aid
-in
Cap
ital
Un
earn
edE
SO
PC
omp
ensa
tion
Ret
ain
edE
arn
ings
Tre
asu
ryC
omm
onS
tock
Acc
um
ula
ted
Oth
erC
omp
reh
ensi
veIn
com
e(L
oss)
Tot
alS
tock
hol
der
s’E
qu
ity
Inth
ousa
nd
sof
dol
lars
Bal
ance
asof
Jan
uar
y1,
2002
$—$1
49,5
16$3
0,43
4$
3,26
3$(
15,9
67)
$2,7
55,3
33$(
1,68
9,24
3)$
(86,
132)
$1,1
47,2
04
Net
inco
me
403,
578
403,
578
Oth
erco
mpr
ehen
sive
inco
me
107,
203
107,
203
Com
preh
ensi
vein
com
e51
0,78
1D
ivid
ends
:C
omm
onS
tock
,$.
63pe
rsh
are
(133
,285
)(1
33,2
85)
Cla
ssB
Com
mon
Sto
ck,
$.56
75pe
rsh
are
(34,
536)
(34,
536)
Con
vers
ion
ofC
lass
BC
omm
onS
tock
into
Com
mon
Sto
ck12
(12)
—In
cen
tive
plan
tran
sact
ion
s(2
98)
(298
)E
xerc
ise
ofst
ock
opti
ons
(3,5
17)
(34,
790)
(38,
307)
Em
ploy
eest
ock
own
ersh
iptr
ust
/ben
efits
tran
sact
ion
s1,
145
3,19
34,
338
Rep
urc
has
eof
Com
mon
Sto
ck(8
4,19
4)(8
4,19
4)
Bal
ance
asof
Dec
emb
er31
,200
2—
149,
528
30,4
2259
3(1
2,77
4)2,
991,
090
(1,8
08,2
27)
21,0
711,
371,
703
Net
inco
me
457,
584
457,
584
Oth
erco
mpr
ehen
sive
(los
s)(3
2,15
6)(3
2,15
6)
Com
preh
ensi
vein
com
e42
5,42
8D
ivid
ends
:C
omm
onS
tock
,$.
7226
per
shar
e(1
44,9
85)
(144
,985
)C
lass
BC
omm
onS
tock
,$.
6526
per
shar
e(3
9,70
1)(3
9,70
1)In
cen
tive
plan
tran
sact
ion
s45
545
5E
xerc
ise
ofst
ock
opti
ons
1,51
9(9
,781
)(8
,262
)E
mpl
oyee
stoc
kow
ner
ship
tru
st/b
enefi
tstr
ansa
ctio
ns
1,46
73,
194
4,66
1R
epu
rch
ase
ofC
omm
onS
tock
(329
,433
)(3
29,4
33)
Bal
ance
asof
Dec
emb
er31
,200
3—
149,
528
30,4
224,
034
(9,5
80)
3,26
3,98
8(2
,147
,441
)(1
1,08
5)1,
279,
866
Net
inco
me
590,
879
590,
879
Oth
erco
mpr
ehen
sive
inco
me
11,3
9411
,394
Com
preh
ensi
vein
com
e60
2,27
3D
ivid
ends
:C
omm
onS
tock
,$.
835
per
shar
e(1
59,6
58)
(159
,658
)C
lass
BC
omm
onS
tock
,$.
7576
per
shar
e(4
6,08
9)(4
6,08
9)Tw
o-fo
r-on
est
ock
spli
t14
9,52
930
,422
(179
,951
)—
Con
vers
ion
ofC
lass
BC
omm
onS
tock
into
Com
mon
Sto
ck3
(3)
—In
cen
tive
plan
tran
sact
ion
s36
36E
xerc
ise
ofst
ock
opti
ons
23,2
482,
114
25,3
62E
mpl
oyee
stoc
kow
ner
ship
tru
st/b
enefi
tstr
ansa
ctio
ns
1,29
63,
193
4,48
9R
epu
rch
ase
ofC
omm
onS
tock
(616
,977
)(6
16,9
77)
Bal
ance
asof
Dec
emb
er31
,200
4$—
$299
,060
$60,
841
$28,
614
$(6
,387
)$3
,469
,169
$(2,
762,
304)
$30
9$1
,089
,302
Th
en
otes
toco
nso
lid
ated
fin
anci
alst
atem
ents
are
anin
tegr
alp
art
ofth
ese
stat
emen
ts.
41
HERSHEY FOODS CORPORATION
NOTES TO CONSOLIDATED FINANCIAL STATEMENTS
1. SUMMARY OF SIGNIFICANT ACCOUNTING POLICIES
Significant accounting policies employed by the Company are discussed below and in other notes tothe consolidated financial statements.
Items Affecting Comparability
The Company’s effective income tax rate was 29.3% in 2004, 36.6% in 2003 and 36.7% in 2002. Theeffective income tax rate for 2004 is not comparable with the effective income tax rates for 2003 and2002 because the Company’s provision for income taxes was benefited by a $61.1 million adjustmentto income tax contingency reserves recorded in the second quarter of 2004. The non-cash reductionof income tax expense resulted from the settlement of Federal tax audits for the 1999 and 2000 taxyears, as well as the resolution of a number of state tax audit issues. Based upon the results of theaudits, the income tax contingency reserves were adjusted, resulting in a reduction of income taxreserves by $73.7 million reflecting a reduction of the provision for income taxes by $61.1 million anda reduction to goodwill of $12.6 million. The income tax contingency reserve adjustments relatedprimarily to the deductibility and timing of certain expenses, interest on potential assessments, andacquisition and divestiture matters.
The consolidated financial statements include the impact of the Company’s business realignmentinitiatives as described in Note 4. Cost of sales included pre-tax charges resulting from the businessrealignment initiatives of $2.1 million and $6.4 million for the years ended December 31, 2003 and2002, respectively. Additionally, selling, marketing and administrative expenses for the year endedDecember 31, 2002, included expenses of $17.2 million associated with the exploration of the potentialsale of the Company.
In January 2003, the Financial Accounting Standards Board (“FASB”) issued Interpretation No. 46,Consolidation of Variable Interest Entities, an interpretation of ARB No. 51 (“Interpretation No. 46”).Interpretation No. 46 addresses consolidation by business enterprises of special-purpose entities(“SPEs”) to which the usual condition for consolidation described in Accounting Research BulletinNo. 51, Consolidated Financial Statements, does not apply because the SPEs have no voting interestsor otherwise are not subject to control through ownership of voting interests. The Company adoptedInterpretation No. 46 as of June 30, 2003. Additional information regarding the adoption ofInterpretation No. 46 is contained in Note 2, Cumulative Effect of Accounting Change.
Principles of Consolidation
The consolidated financial statements include the accounts of the Company and its wholly-ownedsubsidiaries and entities in which it has a controlling financial interest after the elimination ofintercompany accounts and transactions. The Company has a controlling financial interest if it ownsa majority of the outstanding voting common stock or has significant control over an entity throughcontractual or economic interests in which the Company is the primary beneficiary.
Use of Estimates
The preparation of financial statements in conformity with U.S. generally accepted accountingprinciples requires management to make estimates and assumptions that affect the reportedamounts of assets and liabilities at the date of the financial statements, and revenues and expensesduring the reporting period. Critical accounting estimates involved in applying the Company’saccounting policies are those that require management to make assumptions about matters that arehighly uncertain at the time the accounting estimate was made and those for which different
42

estimates reasonably could have been used for the current period, or changes in the accountingestimate that are reasonably likely to occur from period to period, and would have a material impacton the presentation of the Company’s financial condition, changes in financial condition or resultsof operations. The Company’s most critical accounting estimates pertain to accounting policies foraccounts receivable—trade, accrued liabilities and pension and other post-retirement benefit plans.
Revenue Recognition
The Company records sales when all of the following criteria have been met: a valid customer orderwith a fixed price has been received; a delivery appointment with the customer has been made; theproduct has been shipped in accordance with the delivery appointment within the required lead time;there is no further significant obligation to assist in the resale of the product; and collectibility isreasonably assured. Net sales include revenue from the sale of finished goods and royalty income,net of allowances for trade promotions, consumer coupon programs and other sales incentives, andallowances and discounts associated with aged or potentially unsaleable products. Trade promotionsand sales incentives primarily include reduced price features, merchandising displays, sales growthincentives, new item allowances and cooperative advertising.
Cost of Sales
Cost of sales represents costs directly related to the manufacture and distribution of the Company’sproducts. Primary costs include raw materials, packaging, direct labor, overhead, shipping andhandling, warehousing and the depreciation of manufacturing, warehousing and distributionfacilities. Manufacturing overhead and related expenses include salaries, wages, employee benefits,utilities, maintenance and property taxes.
Selling Marketing and Administrative
Selling, marketing and administrative expenses represent costs incurred in generating revenues andin managing the business of the Company. Such costs include advertising and other marketingexpenses, salaries, employee benefits, incentive compensation, research and development, travel,office expenses, amortization of capitalized software and depreciation of administrative facilities.
Cash Equivalents
Cash equivalents consist of highly liquid debt instruments, time deposits and money marketfunds with original maturities of three months or less. The fair value of cash and cash equivalentsapproximates the carrying amount.
Commodities Futures Contracts
In connection with the purchasing of cocoa, sugar, corn sweeteners, natural gas, fuel oil and certaindairy products for anticipated manufacturing requirements and to hedge transportation costs, theCompany enters into commodities futures contracts as deemed appropriate to reduce the effect ofprice fluctuations.
The Company accounts for commodities futures contracts in accordance with Statement of FinancialAccounting Standards No. 133, Accounting for Derivative Instruments and Hedging Activities, asamended (“SFAS No. 133, as amended”). SFAS No. 133, as amended, provides that the effectiveportion of the gain or loss on a derivative instrument designated and qualifying as a cash flow hedginginstrument be reported as a component of other comprehensive income and be reclassified intoearnings in the same period or periods during which the transaction affects earnings. The remaininggain or loss on the derivative instrument, if any, must be recognized currently in earnings. For aderivative designated as hedging the exposure to changes in the fair value of a recognized asset orliability or a firm commitment (referred to as a fair value hedge), the gain or loss must be recognized
43
in earnings in the period of change together with the offsetting loss or gain on the hedged itemattributable to the risk being hedged. The effect of that accounting is to reflect in earnings the extentto which the hedge is not effective in achieving offsetting changes in fair value. All derivativeinstruments currently utilized by the Company, including commodities futures contracts, aredesignated and accounted for as cash flow hedges. Additional information with regard to accountingpolicies associated with derivative instruments is contained in Note 6, Derivative Instruments andHedging Activities.
Property, Plant and Equipment
Property, plant and equipment are stated at cost and are depreciated on a straight-line basis overthe estimated useful lives of the assets, as follows: 3 to 15 years for machinery and equipment; and25 to 40 years for buildings and related improvements. Maintenance and repair expenditures arecharged to expense as incurred. Applicable interest charges incurred during the construction of newfacilities and production lines are capitalized as one of the elements of cost and are amortized overthe assets’ estimated useful lives.
The Company reviews long-lived assets for impairment whenever events or changes in circumstancesindicate that the carrying amount of such assets may not be recoverable. Recoverability of assets tobe held and used is measured by a comparison of the carrying amount of long-lived assets to futureundiscounted net cash flows expected to be generated, in accordance with Statement of FinancialAccounting Standards No. 144, Accounting for the Impairment or Disposal of Long-Lived Assets. Ifsuch assets are considered to be impaired, the impairment recognized is measured by the amountby which the carrying amount of the assets exceeds the fair value of the assets. Assets to be disposedof are reported at the lower of the carrying amount or fair value less cost to sell.
Goodwill and Other Intangible Assets
The Company accounts for goodwill and other intangible assets in accordance with Statement ofFinancial Accounting Standards No. 142, Goodwill and Other Intangible Assets. Other intangibleassets primarily consist of trademarks, customer-related intangible assets and patents obtainedthrough business acquisitions. The useful lives of trademarks were determined to be indefinite and,therefore, these assets are not being amortized. Customer-related intangible assets are beingamortized over their estimated useful lives of approximately ten years. Patents are being amortizedover their remaining legal lives of approximately sixteen years.
The impairment evaluation for goodwill is conducted annually, or more frequently, if events orchanges in circumstances indicate that an asset might be impaired. The evaluation is performed byusing a two-step process. In the first step, the fair value of each reporting unit is compared with thecarrying amount of the reporting unit, including goodwill. The estimated fair value of the reportingunit is generally determined on the basis of discounted future cash flows. If the estimated fair valueof the reporting unit is less than the carrying amount of the reporting unit, then a second step mustbe completed in order to determine the amount of the goodwill impairment that should be recorded.In the second step, the implied fair value of the reporting unit’s goodwill is determined by allocatingthe reporting unit’s fair value to all of its assets and liabilities other than goodwill (including anyunrecognized intangible assets) in a manner similar to a purchase price allocation. The resultingimplied fair value of the goodwill that results from the application of this second step is then comparedto the carrying amount of the goodwill and an impairment charge is recorded for the difference.
The impairment evaluation of the carrying amount of intangible assets with indefinite lives isconducted annually, or more frequently if events or changes in circumstances indicate that an assetmight be impaired. The evaluation is performed by comparing the carrying amount of these assetsto their estimated fair value. If the estimated fair value is less than the carrying amount of theintangible assets with indefinite lives, then an impairment charge is recorded to reduce the asset toits estimated fair value. The estimated fair value is generally determined on the basis of discountedfuture cash flows.
44
The assumptions used in the estimate of fair value are generally consistent with the past performanceof each reporting unit and are also consistent with the projections and assumptions that are usedin current operating plans. Such assumptions are subject to change as a result of changing economicand competitive conditions.
Comprehensive Income
Comprehensive income (loss) is reported on the Consolidated Statements of Stockholders’Equity and accumulated other comprehensive income (loss) is reported on the ConsolidatedBalance Sheets. Additional information regarding comprehensive income is contained in Note 7,Comprehensive Income.
Results of operations for foreign entities are translated using the average exchange rates during theperiod. For foreign entities, assets and liabilities are translated to U.S. dollars using the exchangerates in effect at the balance sheet date. Resulting translation adjustments are recorded as acomponent of other comprehensive income (loss), “Foreign Currency Translation Adjustments.”
A minimum pension liability adjustment is required when the actuarial present value of accumulatedpension plan benefits exceeds plan assets and accrued pension liabilities, less allowable intangibleassets. Minimum pension liability adjustments, net of income taxes, are recorded as a component ofother comprehensive income (loss), “Minimum Pension Liability Adjustments.”
Gains and losses on cash flow hedging derivatives, to the extent effective, are included in othercomprehensive income (loss). Reclassification adjustments reflecting such gains and losses areratably recorded in income in the same period as the hedged items affect earnings. Additionalinformation with regard to accounting policies associated with derivative instruments is containedin Note 6, Derivative Instruments and Hedging Activities.
Foreign Exchange Forward Contracts and Options
The Company enters into foreign exchange forward contracts and options to hedge transactionsprimarily related to firm commitments to purchase or forecasted purchases of equipment, certain rawmaterials and finished goods denominated in foreign currencies, and to hedge payment of forecastedintercompany transactions with its subsidiaries outside the United States. These contracts reducecurrency risk from exchange rate movements.
Foreign exchange forward contracts and options are intended to be and are effective as hedges ofidentifiable foreign currency commitments and forecasted transactions. Foreign exchange forwardcontracts and options are designated as cash flow hedging derivatives and the fair value ofsuch contracts is recorded on the Consolidated Balance Sheets as either an asset or liability.Gains and losses on these contracts are recorded as a component of other comprehensive income andare reclassified into earnings in the same period during which the hedged transaction affectsearnings. Additional information with regard to accounting policies for derivative instruments,including foreign exchange forward contracts and options, is contained in Note 6, DerivativeInstruments and Hedging Activities.
License Agreements
The Company has entered into license agreements under which it has access to certain trademarksand proprietary technology, and manufactures and/or markets and distributes certain products. Therights under these agreements are extendible on a long-term basis at the Company’s option subjectto certain conditions, including minimum sales levels, which the Company has met. License fees androyalties, payable under the terms of the agreements, are expensed as incurred and included inselling, marketing and administrative expenses.
45
Research and Development
The Company expenses research and development costs as incurred. Research and developmentexpense was $23.2 million, $24.5 million and $23.4 million in 2004, 2003 and 2002, respectively, andis included in selling, marketing and administrative expenses.
Advertising
The Company expenses advertising costs as incurred. Advertising expense included in selling,marketing and administrative expenses was $137.9 million, $145.4 million and $162.9 millionin 2004, 2003 and 2002, respectively. Prepaid advertising as of December 31, 2004 and 2003, was$1.5 million and $4.2 million, respectively.
Computer Software
The Company capitalizes costs associated with software developed or obtained for internal use whenboth the preliminary project stage is completed and it is probable that computer software beingdeveloped will be completed and placed in service. Capitalized costs include only (i) external directcosts of materials and services consumed in developing or obtaining internal-use software, (ii) payrolland other related costs for employees who are directly associated with and who devote time to theinternal-use software project and (iii) interest costs incurred, when material, while developinginternal-use software. Capitalization of such costs ceases no later than the point at which the projectis substantially complete and ready for its intended purpose.
The unamortized amount of capitalized software as of December 31, 2004 and 2003, was $36.1 millionand $39.3 million, respectively. Software costs are amortized using the straight-line method over theshorter of five years or the expected life of the software. Accumulated amortization of capitalizedsoftware was $116.5 million and $99.1 million as of December 31, 2004 and 2003, respectively.
The Company reviews the carrying value of software and development costs for impairment inaccordance with its policy pertaining to the impairment of long-lived assets. Generally, measurementof impairment occurs when internal use computer software is not expected to provide substantiveservice potential, a significant change occurs in the extent or manner in which the software is usedor is expected to be used, a significant change is made or will be made to the software program, orcosts of developing or modifying internal-use computer software significantly exceed the amountoriginally expected to develop or modify the software.
Employee Stock Options
The Company currently sponsors two stock-based employee compensation plans, which are describedmore fully in Note 16, Stock Compensation Plans. The Company applies the recognition andmeasurement principles of Accounting Principles Board Opinion No. 25, Accounting for Stock Issuedto Employees, and related Interpretations in accounting for those plans. No employee compensationexpense for stock options is reflected in net income as all stock options granted under those planshad an exercise price equal to the market value of the underlying common stock on the date of grant.The following table illustrates the effect on net income and earnings per share in each period if theCompany had applied the fair value recognition provisions of Statement of Financial AccountingStandards No. 123, Accounting for Stock-Based Compensation (“SFAS No. 123”), to stock-basedemployee compensation.
46
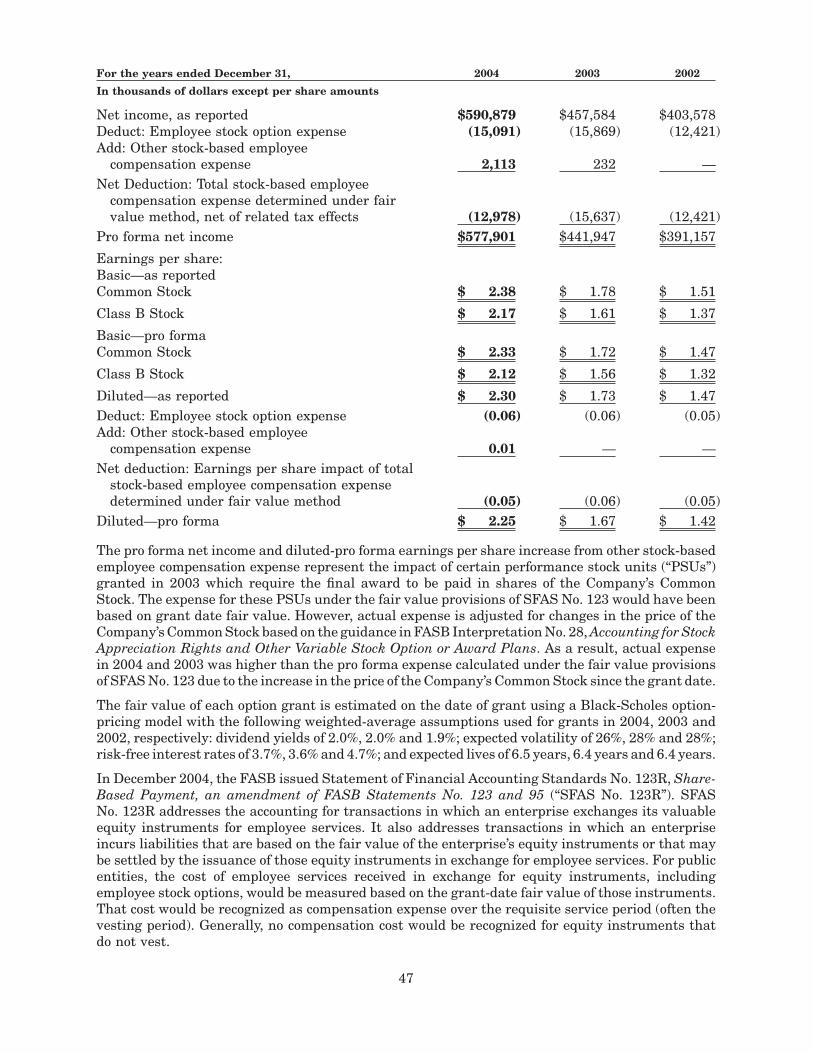
For the years ended December 31, 2004 2003 2002
In thousands of dollars except per share amounts
Net income, as reported $590,879 $457,584 $403,578Deduct: Employee stock option expense (15,091) (15,869) (12,421)Add: Other stock-based employee
compensation expense 2,113 232 —Net Deduction: Total stock-based employee
compensation expense determined under fairvalue method, net of related tax effects (12,978) (15,637) (12,421)
Pro forma net income $577,901 $441,947 $391,157
Earnings per share:Basic—as reportedCommon Stock $ 2.38 $ 1.78 $ 1.51
Class B Stock $ 2.17 $ 1.61 $ 1.37
Basic—pro formaCommon Stock $ 2.33 $ 1.72 $ 1.47
Class B Stock $ 2.12 $ 1.56 $ 1.32
Diluted—as reported $ 2.30 $ 1.73 $ 1.47Deduct: Employee stock option expense (0.06) (0.06) (0.05)Add: Other stock-based employee
compensation expense 0.01 — —Net deduction: Earnings per share impact of total
stock-based employee compensation expensedetermined under fair value method (0.05) (0.06) (0.05)
Diluted—pro forma $ 2.25 $ 1.67 $ 1.42
The pro forma net income and diluted-pro forma earnings per share increase from other stock-basedemployee compensation expense represent the impact of certain performance stock units (“PSUs”)granted in 2003 which require the final award to be paid in shares of the Company’s CommonStock. The expense for these PSUs under the fair value provisions of SFAS No. 123 would have beenbased on grant date fair value. However, actual expense is adjusted for changes in the price of theCompany’s Common Stock based on the guidance in FASB Interpretation No. 28, Accounting for StockAppreciation Rights and Other Variable Stock Option or Award Plans. As a result, actual expensein 2004 and 2003 was higher than the pro forma expense calculated under the fair value provisionsof SFAS No. 123 due to the increase in the price of the Company’s Common Stock since the grant date.
The fair value of each option grant is estimated on the date of grant using a Black-Scholes option-pricing model with the following weighted-average assumptions used for grants in 2004, 2003 and2002, respectively: dividend yields of 2.0%, 2.0% and 1.9%; expected volatility of 26%, 28% and 28%;risk-free interest rates of 3.7%, 3.6% and 4.7%; and expected lives of 6.5 years, 6.4 years and 6.4 years.
In December 2004, the FASB issued Statement of Financial Accounting Standards No. 123R, Share-Based Payment, an amendment of FASB Statements No. 123 and 95 (“SFAS No. 123R”). SFASNo. 123R addresses the accounting for transactions in which an enterprise exchanges its valuableequity instruments for employee services. It also addresses transactions in which an enterpriseincurs liabilities that are based on the fair value of the enterprise’s equity instruments or that maybe settled by the issuance of those equity instruments in exchange for employee services. For publicentities, the cost of employee services received in exchange for equity instruments, includingemployee stock options, would be measured based on the grant-date fair value of those instruments.That cost would be recognized as compensation expense over the requisite service period (often thevesting period). Generally, no compensation cost would be recognized for equity instruments thatdo not vest.
47
SFAS No. 123R is effective for periods beginning after June 15, 2005. SFAS No. 123R will apply toawards granted, modified, or settled in cash on or after that date. Companies may choose from oneof three methods when transitioning to the new standard, which may include restatement of priorannual and interim periods. The impact on earnings per share-diluted of expensing stock options willbe dependent upon the method to be used for valuation of stock options and the transition methoddetermined by the Company. The total impact on an annualized basis could range from approximately$.06 to $.08 per share-diluted, assuming option grants continue at the same level as in 2004.
2. CUMULATIVE EFFECT OF ACCOUNTING CHANGE
The Company adopted Interpretation No. 46 as of June 30, 2003, resulting in the consolidation of threeoff-balance sheet arrangements with special-purpose trusts (“SPTs”) for the leasing of certain warehouseand distribution facilities. The consolidation of these entities resulted in an adjustment to record thecumulative effect of the accounting change of approximately $7.4 million, or $.03 per share-diluted, inthe third quarter of 2003 reflecting the after-tax effect of accumulated depreciation for these facilitiesfrom lease inception through June 29, 2003. Additionally, the consolidation of these entities resulted ina net increase to property, plant and equipment of approximately $107.7 million, with a correspondingincrease to long-term debt of $115.5 million and to other long-term liabilities of $4.4 million, reflectingthe third party equity interest associated with the lease arrangements. Prior to June 30, 2003, expensesassociated with the lease arrangements were classified as rent expense and included in cost of sales inthe Consolidated Statements of Income. Subsequent to the consolidation of these entities, expenses wereclassified as interest expense associated with the corresponding long-term debt. An increase indepreciation expense of $2.6 million in 2003 also resulted from the consolidation of these entities, witha total of $5.4 million of depreciation expense recorded in 2004.
3. ACQUISITIONS AND DIVESTITURES
In December 2004, the Company acquired Mauna Loa Macadamia Nut Corporation (“Mauna Loa”)for $127.8 million. Mauna Loa is the leading processor and marketer of macadamia snacks withannual sales of approximately $80 million.
In October 2004, the Company’s Mexican subsidiary, Hershey Mexico, acquired Grupo Lorena, oneof Mexico’s top confectionery companies, for $39.0 million. This business has annual sales of over$30 million. Included in the acquisition was the Pelon Pelo Rico brand.
In accordance with the purchase method of accounting, the purchase prices of the acquisitions wereallocated to the underlying assets and liabilities at the dates of the acquisition based on theirpreliminary estimated respective fair values which may be revised at a later date. The Company isin the process of obtaining valuations for the acquired net assets. Total liabilities assumed were$67.8 million. Results subsequent to the dates of acquisition were included in the consolidatedfinancial statements. Had the results of the acquisitions been included in the consolidated resultsfor the full year of 2004 the effect would not have been material.
In September 2003, the Company completed the sale of certain gum brands to Farley’s & SathersCandy Company, Inc. (“Farley’s & Sathers”) for $20.0 million in cash as part of its businessrealignment initiatives. In the third quarter of 2003, the Company recorded a gain on the sale of$8.3 million before tax, $5.7 million after tax. The gum brands included Fruit Stripe chewing gum,Rain-blo gum balls and Super Bubble bubble gum.
In June 2002, the Company completed the sale of certain confectionery brands to Farley’s & Sathers for$12.0 million in cash as part of its 2001 business realignment initiatives. In the second quarter of 2002,the Company recorded a gain of $4.4 million before tax, $2.8 million after tax, due to the transaction.The gain was included as an adjustment to the Company’s business realignment and asset impairmentscharge. Included in the transaction were the Heide, Jujyfruits, Wunderbeans and Amazin’ Fruittrademarked confectionery brands, as well as the rights to sell Chuckles branded products, under license.
48
4. BUSINESS REALIGNMENT INITIATIVES
In July 2003, the Company announced a number of initiatives continuing its value-enhancingstrategy. These initiatives included realigning the sales organization and streamlining the supplychain by divesting or eliminating certain non-strategic brands and products, and by productionline rationalization.
During 2003, these actions resulted in a net charge of approximately $17.2 million, or $.04 per share-diluted. The $17.2 million net charge consisted of the write-off of certain inventories of $2.1 millionincluded in cost of sales, a net business realignment and asset impairments charge of $23.4 millionand an $8.3 million net gain resulting from the divestiture of certain brands.
The net business realignment and asset impairments charge of $23.4 million consisted of earlyretirement and involuntary termination costs of $10.0 million, sales office closing and relocation costsof $7.3 million, fixed asset impairment charges of $5.7 million, equipment removal costs of $.7 millionand a net gain of $.3 million relating to the elimination of non-strategic brands and products. Indetermining the fixed asset impairment losses, fair value was estimated based on the expected salesproceeds. Cash payments during the third and fourth quarters of 2003 reduced the liability balance,primarily relating to the aforementioned charges for employee termination, sales office closing andrelocation costs, to $8.8 million as of December 31, 2003. Cash payments during 2004 reduced theliability balance to $3.9 million as of December 31, 2004.
In late October 2001, the Company’s Board of Directors approved a plan to improve the efficiencyand profitability of the Company’s operations. The plan included asset management improvements,product line rationalization, supply chain efficiency improvements and a voluntary work forcereduction program (collectively, the “2001 business realignment initiatives”). Total costs for the 2001business realignment initiatives recorded in 2002 and 2001 were $312.4 million.
During 2002, charges to cost of sales and business realignment and asset impairments were recordedtotaling $34.0 million before tax. The total included a charge to cost of sales of $6.4 million associatedwith the relocation of manufacturing equipment and a net business realignment and assetimpairments charge of $27.6 million. Components of the net $27.6 million pre-tax charge includeda $28.8 million charge for pension settlement losses resulting from a voluntary work force reductionprogram (“VWRP”), a $3.0 million charge for pension curtailment losses and special terminationbenefits resulting from manufacturing plant closures, a $.1 million charge relating to involuntarytermination benefits and a $.1 million charge relating to the realignment of the domestic salesorganization, partially offset by a $4.4 million favorable adjustment reflecting higher than estimatedproceeds from the sale of certain assets. The major components of the 2001 business realignmentinitiatives were completed as of December 31, 2002. Remaining transactions primarily pertain to thesale of certain real estate associated with the closure of facilities, as discussed below.
Rationalization plans included the sale or exit of certain product lines, the discontinuance of certainnon-chocolate confectionery products and the realignment of the Company’s sales organizations.Costs associated with the realignment of the sales organizations related primarily to sales officeclosings and terminating the use of certain sales brokers. During 2002, sales offices were closed asplanned and the use of certain sales brokers was discontinued which resulted in an additional chargeof $.1 million. During the second quarter of 2002, the sale of a group of the Company’s non-chocolateconfectionery candy brands to Farley’s & Sathers was completed. Included in the transaction werethe Heide, Jujyfruits, Wunderbeans and Amazin’ Fruit trademarked confectionery brands, as well asthe rights to sell Chuckles branded products, under license. Proceeds of $12.0 million associated withthe sale of certain confectionery brands to Farley’s & Sathers exceeded the 2001 estimates whichresulted in a $4.4 million favorable adjustment. The sale of certain confectionery brands to Farley’s& Sathers resulted in the closure of a manufacturing facility in New Brunswick, New Jersey whichwas being held for sale as of December 31, 2002. The manufacturing facility was sold in May 2003.Also during the second quarter of 2002, the Company discontinued and subsequently licensed thesale of its aseptically packaged drink products in the United States. Net sales for these brands were
49
$11.6 million in 2002. An additional charge of $.7 million relating to pension curtailment losses andspecial termination benefits associated with the closure of the facility was recorded in 2002.
To improve supply chain efficiency and profitability, three manufacturing facilities, a distribution centerand certain other facilities were planned to be closed. These included manufacturing facilities in Denver,Colorado; Pennsburg, Pennsylvania; and Palmyra, Pennsylvania and a distribution center and certainminor facilities located inOakdale,California.During thefirstquarterof2002, themanufacturing facilityin Palmyra, Pennsylvania was closed and additional costs of $.1 million were recorded, as incurred,relating to retention payments. During the second quarter, operations utilizing the distribution centerin Oakdale, California ceased. The manufacturing facilities in Denver, Colorado and Pennsburg,Pennsylvania were closed in the fourth quarter of 2002. An additional charge of $2.3 million relating topension curtailment losses and special termination benefits associated with the facility closures wasrecorded in 2002. The Denver, Colorado and the Pennsburg, Pennsylvania facilities were being held forsale as of December 31, 2004. The Denver, Colorado facility was sold in February 2005.
In October 2001, the Company offered the VWRP to certain eligible employees in the United States,Canada and Puerto Rico in order to reduce staffing levels and improve profitability. The VWRPconsisted of an early retirement program which provided enhanced pension, post-retirement andcertain supplemental benefits and an enhanced mutual separation program that provided increasedseverance and temporary medical benefits. A reduction of approximately 500 employees occurredduring 2002 as a result of the VWRP. Additional pension settlement costs of $28.8 million wererecorded in 2002, principally associated with lump sum payments of pension benefits.
5. COMMITMENTS
The Company has entered into certain obligations for the purchase of raw materials. Purchaseobligations primarily reflect forward contracts for the purchase of raw materials from third-partybrokers and dealers to minimize the effect of future price fluctuations. Total obligations for each yearare comprised of fixed price contracts for the purchase of commodities and unpriced contracts thathave been valued using market prices as of December 31, 2004. The cost of commodities associatedwith the unpriced contracts is variable as market prices change over future periods. However, thevariability of such costs is mitigated to the extent of the Company’s futures price cover for thoseperiods. Accordingly, increases or decreases in market prices will be offset by gains or losses oncommodity futures contracts to the extent that the unpriced contracts are hedged as of December 31,2004 and in future periods. Taking delivery of the specific commodities for use in the manufactureof finished goods satisfies these obligations. For each of the three years in the period endedDecember 31, 2004, such obligations were fully satisfied by taking delivery of and making paymentfor the specific commodities.
As of December 31, 2004, the Company had entered into purchase agreements with various suppliers.Subject to the Company’s quality standards being met, the purchase obligations covered by theseagreements aggregated approximately $796.5 million in 2005, $291.7 million in 2006, $33.1 millionin 2007, $7.5 million in 2008 and $3.7 million in 2009.
As previously discussed in Note 2, Cumulative Effect of Accounting Change, the Company adoptedInterpretation No. 46 as of June 30, 2003, resulting in the consolidation of the three off-balance sheetarrangements with SPTs. The consolidation of these entities resulted in an adjustment to record thecumulative effect of the accounting change of approximately $7.4 million, or $.03 per share-diluted, inthe third quarter of 2003, reflecting the after-tax effect of accumulated depreciation for these facilitiesfrom lease inception through June 29, 2003. Additionally, the consolidation of these entities resulted ina net increase to property, plant and equipment of approximately $107.7 million, with a correspondingincrease to long-term debt of $115.5 million and to other long-term liabilities of $4.4 million, reflectingthe third party equity interest associated with the lease arrangements. Prior to June 30, 2003, expensesassociated with the lease arrangements were classified as rent expense and included in cost of sales inthe Consolidated Statements of Income. Subsequent to the consolidation of these entities, expenseswere classified as interest expense associated with the corresponding long-term debt. An increase in
50
depreciation expense of $2.6 million in 2003 also resulted from the consolidation of these entities, witha total of $5.4 million in depreciation expense recorded in 2004.
During 1999 and 2000 the Company entered into off-balance sheet arrangements for the leasing ofcertain warehouse and distribution facilities. These off-balance sheet arrangements enabled theCompany to lease these facilities under more favorable terms than other leasing alternatives. Thelease arrangements are with SPTs whereby the Company leases warehouse and distribution facilitiesin Redlands, California; Atlanta, Georgia; and Hershey, Pennsylvania, as discussed below. The SPTswere formed to facilitate the acquisition and subsequent leasing of the facilities to the Company. TheSPTs financed the acquisition of the facilities by issuing notes and equity certificates to independentthird-party financial institutions. The independent third-party financial institutions that hold theequity certificates are the owners of the SPTs. The owners of the SPTs have made substantive residualequity capital investments in excess of 3%, which will be at risk during the entire term of each lease.Accordingly, the Company did not consolidate the SPTs prior to June 30, 2003 because not all of theconditions for consolidation had been met.
In December 2000, the Company entered into a lease agreement with the owner of the warehouseand distribution facility in Redlands, California. The lease term was approximately ten years, withoccupancy to begin upon completion of the facility. The lease agreement contained an option for theCompany to purchase the facility. In January 2002, the Company assigned its right to purchase thefacility to an SPT that in turn purchased the completed facility and leased it to the Company undera new lease agreement. The lease term is five years, with up to four renewal periods of five yearseach with the consent of the lessor. The cost incurred by the SPT to acquire the facility, includingland, was $40.1 million.
In October 2000, the Company entered into a lease agreement with an SPT for the leasing of awarehouse and distribution facility near Atlanta, Georgia. The lease term is five years, with up tofour renewal periods of five years each with the consent of the lessor. The cost incurred by the SPTto acquire the facility, including land, was $18.2 million.
In July 1999, the Company entered into a lease agreement with an SPT for the construction andleasing of a warehouse and distribution facility located on land owned by the Company near Hershey,Pennsylvania. Under the agreement, the lessor paid construction costs totaling $61.7 million. Thelease term is six years, including the one-year construction period, with up to four renewal periodsof five years each with the consent of the lessor.
Aside from the residual guarantees and instrument guarantees associated with the individualleasing arrangements, as discussed below, the Company has provided no other guarantees orcapitalization of these entities. The Company has not collateralized the obligations in connection withthese leases. The Company has no obligations with respect to refinancing of the lessor’s debt, wouldincur no significant penalties that would result in the reasonable assurance of continuation of theleases and has no significant guarantees other than the residual and instrument guaranteesdiscussed below. There are no other material commitments or contingent liabilities associated withthe leasing arrangements. The Company’s transactions with the SPTs are limited to the leaseagreements. The Company does not anticipate entering into any other arrangements involving SPEs.
The leases include substantial residual guarantees by the Company for a significant amount of thefinancing and options to purchase the facilities at original cost. Pursuant to instrument guarantees,in the event of a default under the lease agreements, the Company guaranteed to the note holdersand certificate holders payment in an amount equal to all sums then due under the leases.
There are no penalties or other disincentives under the lease agreements if the Company decides notto renew any of the three leases. The terms for each renewal period under each of the three leasearrangements are identical to the initial terms and do not represent bargain lease terms.
If the Company were to exercise its options to purchase the three facilities at original cost at the endof the respective initial lease terms, the Company could purchase the facilities for a total ofapproximately $120.0 million, $79.9 million for the Pennsylvania and Georgia facilities in 2005 and
51
$40.1 million for the California facility in 2007. If the Company chooses not to renew the leases orpurchase the assets at the end of the lease terms, the Company is obligated under the residualguarantees for approximately $103.2 million in total for the three leases. Additionally, the Companyis obligated to re-market each property on the lessor’s behalf and, upon sale, distribute a portion ofthe proceeds to the note holders and certificate holders up to an amount equal to the remaining debtand equity certificates and to pay closing costs. If the Company chooses not to renew or purchase theassets at the end of the lease terms, the Company does not anticipate a material disruption tooperations, since such facilities are not unique, facilities with similar racking and storage capabilitiesare available in each of the areas where the facilities are located, there are no significant leaseholdimprovements that would be impaired, there would be no adverse tax consequences, the financingof replacement facilities would not be material to the Company’s cash flows and costs related torelocation would not be significant to income.
The facility located near Hershey, Pennsylvania was constructed on land owned by the Company. TheCompany entered into a ground lease with the lessor, an SPT. The initial term of the ground leaseextends to the date that is the later of (i) the date the facility lease is no longer in effect, or (ii) thedate when the Company satisfies the residual guarantee associated with the lease. An additionalterm for the ground lease begins upon the end of the initial ground lease term and ends upon thelater of the date all sums required to be paid under the lease agreement are paid in full and the 75thanniversary of the ground lease commencement date. If the Company chooses not to renew thebuilding lease or purchase the building, it must re-market the building on the lessor’s behalf subjectto the ground lease, which will continue in force until the earlier of the date all sums required to bepaid under the lease agreement are paid in full and the 75th anniversary of the ground lease inceptiondate. The lease of the warehouse and distribution facility does not include any provisions that wouldrequire the Company to sell the land to the SPT.
Rent expense was $29.1 million, $32.6 million and $34.6 million for 2004, 2003 and 2002, respectively.Rent expense pertains to all operating leases, which were principally related to certainadministrative buildings, warehouse and distribution facilities and transportation equipment.
Future minimum rental payments under non-cancelable operating leases with a remaining term inexcess of one year as of December 31, 2004, totaled $61.4 million (2005—$12.6 million; 2006—$12.2million; 2007—$11.3 million; 2008—$8.7 million; 2009—$5.0 million; 2010 and beyond—$11.6 million).
6. DERIVATIVE INSTRUMENTS AND HEDGING ACTIVITIES
The Company adopted SFAS No. 133, as amended, as of January 1, 2001. SFAS No. 133, as amended,requires the Company to recognize all derivative instruments as either assets or liabilities in thebalance sheet at fair value. The accounting for the change in fair value of the derivative depends onwhether the instrument qualifies for and has been designated as a hedging relationship and on thetype of hedging relationship. There are three types of hedging relationships: a cash flow hedge, a fairvalue hedge and a hedge of foreign currency exposure of a net investment in a foreign operation. Thedesignation is based upon the exposure being hedged. All derivative instruments currently utilizedby the Company are designated and accounted for as cash flow hedges.
Objectives, Strategies and Accounting Policies Associated withDerivative Instruments
The Company utilizes certain derivative instruments, from time to time, including interest rateswaps, foreign currency forward exchange contracts and options, and commodities futures contracts,to manage variability in cash flows associated with interest rate, currency exchange rate andcommodity market price risk exposures. The interest rate swaps and foreign currency contracts areentered into for periods consistent with related underlying exposures and do not constitute positionsindependent of those exposures. Commodities futures contracts are entered into for varying periods,are intended to be, and are effective as hedges of market price risks associated with anticipated rawmaterial purchases, energy requirements and transportation costs. If it is probable that hedgedforecasted transactions will not occur either by the end of the originally specified time period or within
52

an additional two-month period of time, derivative gains and losses reported in accumulated othercomprehensive income (loss) on the Consolidated Balance Sheets are immediately reclassified intoearnings. Gains and losses on terminated derivatives designated as hedges are accounted for as partof the originally hedged transaction. Gains and losses on derivatives designated as hedges of itemsthat mature or are sold or terminated, are recognized in income in the same period as the originallyhedged transaction was anticipated to affect earnings. The Company utilizes derivative instrumentsfor hedging purposes only and does not hold or issue derivative instruments for trading purposes.In entering into these contracts, the Company has assumed the risk that might arise from the possibleinability of counterparties to meet the terms of their contracts. The Company does not expect anysignificant losses as a result of counterparty defaults.
Interest Rate Swaps
In order to minimize its financing costs and to manage interest rate exposure, the Company, fromtime to time, enters into interest rate swap agreements. In October 2003, the Company enteredinto interest rate swap agreements to effectively convert interest payments on long-term debt fromfixed to variable rates. Interest payments on $200.0 million of 6.7% Notes due in October 2005 and$150.0 million of 6.95% Notes due in March 2007 were converted from the respective fixed rates tovariable rates based on the London Interbank Offered Rate (“LIBOR”). In March 2004, the Companyterminated these agreements, resulting in cash receipts totaling $5.2 million, with a correspondingincrease to the carrying value of the long-term debt. This increase is being amortized over theremaining term of the respective long-term debt as a reduction to interest expense.
In February 2001, the Company entered into interest rate swap agreements that effectivelyconverted variable-interest-rate payments on certain leases from a variable to a fixed rate. Paymentson leases associated with the financing of construction of a warehouse and distribution facility nearHershey, Pennsylvania for $61.7 million and the financing of the purchase of a warehouse anddistribution facility near Atlanta, Georgia for $18.2 million are variable based on LIBOR. Suchvariable payments are forecasted transactions as defined by SFAS No. 133, as amended. The interestrate swap agreements effectively converted the variable-interest-rate payments on the leases fromLIBOR to a fixed rate of 6.1%. Future changes in LIBOR are offset by changes in the value of theinterest rate swap agreements, resulting in interest expense at the fixed rate of 6.1%.
As previously discussed in Note 2, Cumulative Effect of Accounting Change, the Company adoptedInterpretation No. 46 as of June 30, 2003, resulting in the consolidation of the Company’s three off-balance sheet arrangements with SPTs for the leasing of certain warehouse and distribution facilities.The consolidation of those entities resulted in the recording of long-term debt of $59.4 million and$17.5 million associated with the warehouse and distribution facilities near Hershey and Atlanta,respectively, corresponding to the aforementioned interest rate swap agreements. As of June 30, 2003,the Company designated a new hedging relationship contemporaneous with the discontinuance of thepre-existing hedging relationship due to the consolidation of the two corresponding SPTs. Prospectively,beginning on June 30, 2003, the interest rate differential on the interest rate swap agreements wasclassified as an adjustment to interest expense.
The variable to fixed interest rate swap agreements qualify as cash flow hedges and the notionalamounts, interest rates and terms of the swap agreements are consistent with the underlying leaseagreements they are intended to hedge and, therefore, there is no hedge ineffectiveness. Gains andlosses on the interest rate swap agreements are included in other comprehensive income and arerecognized in cost of sales in the same period as the hedged interest payments affect earnings. Thefair value of variable to fixed interest rate swap agreements was a liability of $1.7 million and$5.2 million as of December 31, 2004 and 2003, respectively, and was included on the ConsolidatedBalance Sheets as other long-term liabilities, with the offset reflected in accumulated othercomprehensive income (loss), net of income taxes.
Cash flows from interest rate swap agreements are classified as net cash provided from operatingactivities on the Consolidated Statements of Cash Flows. The Company’s risk related to the interestrate swap agreements is limited to the cost of replacing the agreements at prevailing market rates.
53
Foreign Exchange Forward Contracts and Options
The Company enters into foreign exchange forward contracts and options to hedge transactionsprimarily related to firm commitments to purchase or forecasted purchases of equipment, certain rawmaterials and finished goods denominated in foreign currencies, and to hedge payment of forecastedintercompany transactions with its subsidiaries outside the United States. These contracts reducecurrency risk from exchange rate movements. Foreign currency price risks are hedged generally forperiods from 3 to 24 months.
Foreign exchange forward contracts and options are intended to be and are effective as hedges ofidentifiable foreign currency commitments or forecasted transactions denominated in foreigncurrencies. Since there is a direct relationship between the foreign currency derivatives and theforeign currency denomination of the transactions, foreign currency derivatives are highly effectivein hedging cash flows related to transactions denominated in the corresponding foreign currencies.These contracts meet the criteria for cash flow hedge accounting treatment and, accordingly, gainsand losses are included in other comprehensive income and are recognized in cost of sales or selling,marketing and administrative expense in the same period that the hedged items affect earnings. Inentering into these contracts the Company has assumed the risk that might arise from the possibleinability of counterparties to meet the terms of their contracts. The Company does not expect anysignificant losses as a result of counterparty defaults.
The fair value of foreign exchange forward contracts and options was estimated by obtaining quotes forfuture contracts with similar terms, adjusted where necessary for maturity differences. The fair valueof foreign exchange forward contracts and options was an asset of $4.4 million and $1.6 million as ofDecember 31, 2004 and 2003, respectively, included on the Consolidated Balance Sheets as other currentassets with the offset reflected in accumulated other comprehensive income (loss), net of income taxes.Cash flows from foreign exchange forward contracts and options designated as hedges of foreign currencyprice risks associated with the purchase of equipment are classified as net cash flows (used by) providedfrom investing activities on the Consolidated Statements of Cash Flows. Cash flows from other foreignexchange forward contracts and options are classified as net cash provided from operating activities.
Commodities Futures Contracts
In connection with the purchasing of cocoa, sugar, corn sweeteners, natural gas, fuel oil and certaindairy products for anticipated manufacturing requirements and to hedge transportation costs, theCompany enters into commodities futures contracts as deemed appropriate to reduce the effect ofprice fluctuations. Commodity price risks are hedged generally for periods from 3 to 24 months.Commodities futures contracts meet the hedge criteria and are accounted for as cash flow hedges.Accordingly, gains and losses are included in other comprehensive income and are recognized ratablyin cost of sales in the same period that the hedged raw material manufacturing requirements arerecorded in cost of sales.
In order to qualify as a hedge of commodity price risk, it must be demonstrated that the changes in fairvalue of the commodities futures contracts are highly effective in hedging price risks associated withcommodity purchases for manufacturing requirements and with transportation costs. The assessmentof hedge effectiveness for commodities futures is performed on a quarterly basis by calculating the changein switch values relative to open commodities futures contracts being held and the number of futurescontracts needed to price raw material purchases for anticipated manufacturing requirements and tohedge transportation costs. Tracking changes in basis differentials as discussed below also monitorseffectiveness. The prices of commodities futures contracts reflect delivery to the same locations wherethe Company takes delivery of the physical commodities and, therefore, there is no ineffectivenessresulting from differences in location between the derivative and the hedged item. Commodities futurescontracts have been deemed to be highly effective in hedging price risks associated with correspondingraw material purchases for manufacturing requirements and transportation costs.
Because of the rollover strategy used for commodities futures contracts, which is required by futuresmarket conditions, some ineffectiveness may result in hedging forecasted manufacturing requirements
54
as futures contracts are switched from nearby contract positions to contract positions which are requiredto fix the price of raw material purchases for manufacturing requirements. Hedge ineffectiveness mayalso result from variability in basis differentials associated with the purchase of raw materials formanufacturing requirements. Hedge ineffectiveness is measured on a quarterly basis and the ineffectiveportion of gains or losses on commodities futures is recorded currently in cost of sales in accordance withSFAS No. 133, as amended.
Exchange traded futures contracts are used to fix the price of physical forward purchase contracts.Cash transfers reflecting changes in the value of futures contracts (unrealized gains and losses) aremade on a daily basis and are included in accumulated other comprehensive income (loss), net ofincome taxes, on the Consolidated Balance Sheets. Such cash transfers will be offset by higher orlower cash requirements for payment of invoice prices of raw materials, energy requirements andtransportation costs in the future. Cash flows from commodities futures contracts are classified asnet cash provided from operating activities on the Consolidated Statements of Cash Flows. Futurescontracts being held in excess of the amount required to fix the price of unpriced physical forwardcontracts are effective as hedges of anticipated manufacturing requirements for each commodity.Physical commodity forward purchase contracts meet the SFAS No. 133, as amended, definition of“normal purchases and sales” and, therefore, are not considered derivative instruments.
The net after-tax impact of cash flow hedging derivatives on comprehensive income (loss) reflecteda $16.3 million gain in 2004, a $20.2 million loss in 2003 and a $106.7 million gain in 2002. Net gainsand losses on cash flow hedging derivatives were primarily associated with commodities futurescontracts. Reclassification adjustments from accumulated other comprehensive income (loss) toincome, for gains or losses on cash flow hedging derivatives, were reflected in cost of sales.Reclassification of gains of $26.1 million, $51.9 million, and $17.9 million for 2004, 2003 and 2002,respectively, were associated with commodities futures contracts. Gains on commodities futurescontracts recognized in cost of sales as a result of hedge ineffectiveness were approximately$.4 million, $.4 million and $1.5 million before tax for the years ended December 31, 2004, 2003 and2002, respectively. No gains or losses on cash flow hedging derivatives were reclassified fromaccumulated other comprehensive income (loss) into income as a result of the discontinuance of ahedge because it became probable that a hedged forecasted transaction would not occur. There wereno components of gains or losses on cash flow hedging derivatives that were recognized in incomebecause such components were excluded from the assessment of hedge effectiveness. As ofDecember 31, 2004, the amount of net after-tax gains on cash flow hedging derivatives, includingforeign exchange forward contracts and options, interest rate swap agreements and commoditiesfutures contracts, expected to be reclassified into earnings in the next twelve months wasapproximately $18.7 million, which was primarily associated with commodities futures contracts.
7. COMPREHENSIVE INCOME
A summary of the components of comprehensive income is as follows:
For the year ended December 31, 2004Pre-TaxAmount
Tax (Expense)Benefit
After-TaxAmount
In thousands of dollars
Net income $590,879Other comprehensive income (loss):
Foreign currency translation adjustments $ 21,229 $ — 21,229Minimum pension liability adjustments, net of tax 81 (32) 49Cash flow hedges:
Gains (losses) on cash flow hedging derivatives 25,571 (9,314) 16,257Reclassification adjustments (41,222) 15,081 (26,141)
Total other comprehensive income $ 5,659 $ 5,735 11,394
Comprehensive income $602,273
55
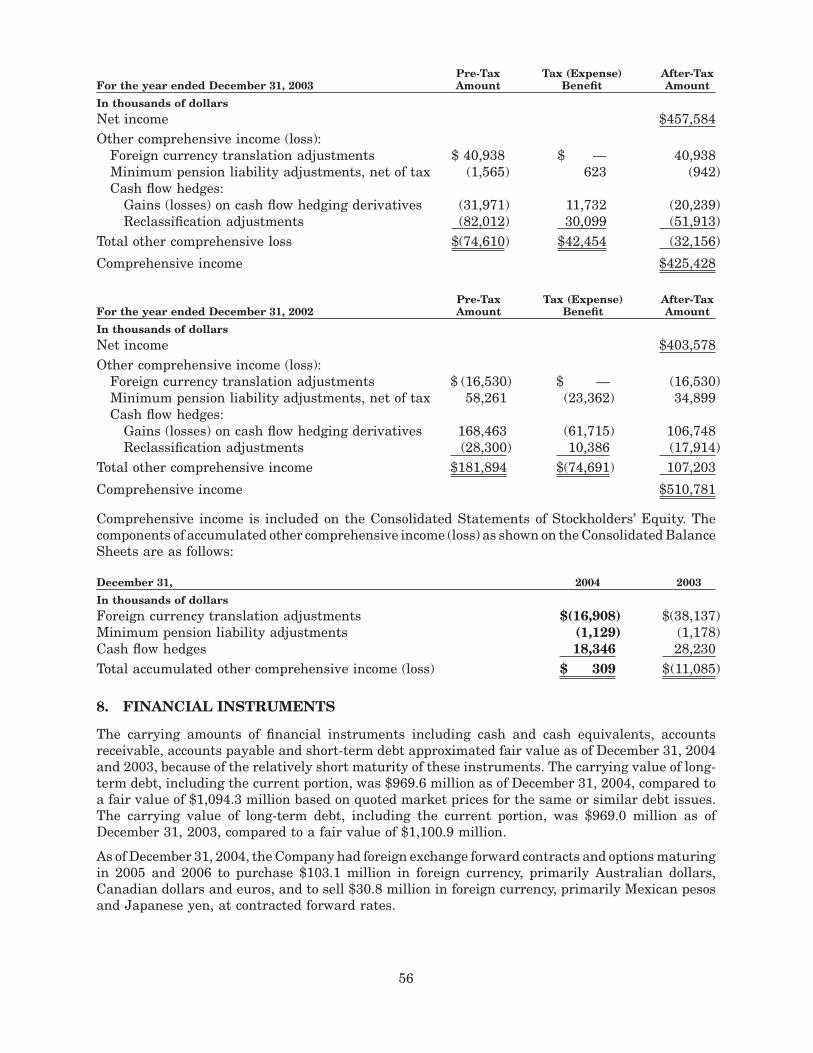
For the year ended December 31, 2003Pre-TaxAmount
Tax (Expense)Benefit
After-TaxAmount
In thousands of dollarsNet income $457,584Other comprehensive income (loss):
Foreign currency translation adjustments $ 40,938 $ — 40,938Minimum pension liability adjustments, net of tax (1,565) 623 (942)Cash flow hedges:
Gains (losses) on cash flow hedging derivatives (31,971) 11,732 (20,239)Reclassification adjustments (82,012) 30,099 (51,913)
Total other comprehensive loss $(74,610) $42,454 (32,156)
Comprehensive income $425,428
For the year ended December 31, 2002Pre-TaxAmount
Tax (Expense)Benefit
After-TaxAmount
In thousands of dollarsNet income $403,578Other comprehensive income (loss):
Foreign currency translation adjustments $ (16,530) $ — (16,530)Minimum pension liability adjustments, net of tax 58,261 (23,362) 34,899Cash flow hedges:
Gains (losses) on cash flow hedging derivatives 168,463 (61,715) 106,748Reclassification adjustments (28,300) 10,386 (17,914)
Total other comprehensive income $181,894 $(74,691) 107,203
Comprehensive income $510,781
Comprehensive income is included on the Consolidated Statements of Stockholders’ Equity. Thecomponents of accumulated other comprehensive income (loss) as shown on the Consolidated BalanceSheets are as follows:
December 31, 2004 2003
In thousands of dollarsForeign currency translation adjustments $(16,908) $(38,137)Minimum pension liability adjustments (1,129) (1,178)Cash flow hedges 18,346 28,230Total accumulated other comprehensive income (loss) $ 309 $(11,085)
8. FINANCIAL INSTRUMENTS
The carrying amounts of financial instruments including cash and cash equivalents, accountsreceivable, accounts payable and short-term debt approximated fair value as of December 31, 2004and 2003, because of the relatively short maturity of these instruments. The carrying value of long-term debt, including the current portion, was $969.6 million as of December 31, 2004, compared toa fair value of $1,094.3 million based on quoted market prices for the same or similar debt issues.The carrying value of long-term debt, including the current portion, was $969.0 million as ofDecember 31, 2003, compared to a fair value of $1,100.9 million.
As of December 31, 2004, the Company had foreign exchange forward contracts and options maturingin 2005 and 2006 to purchase $103.1 million in foreign currency, primarily Australian dollars,Canadian dollars and euros, and to sell $30.8 million in foreign currency, primarily Mexican pesosand Japanese yen, at contracted forward rates.
56
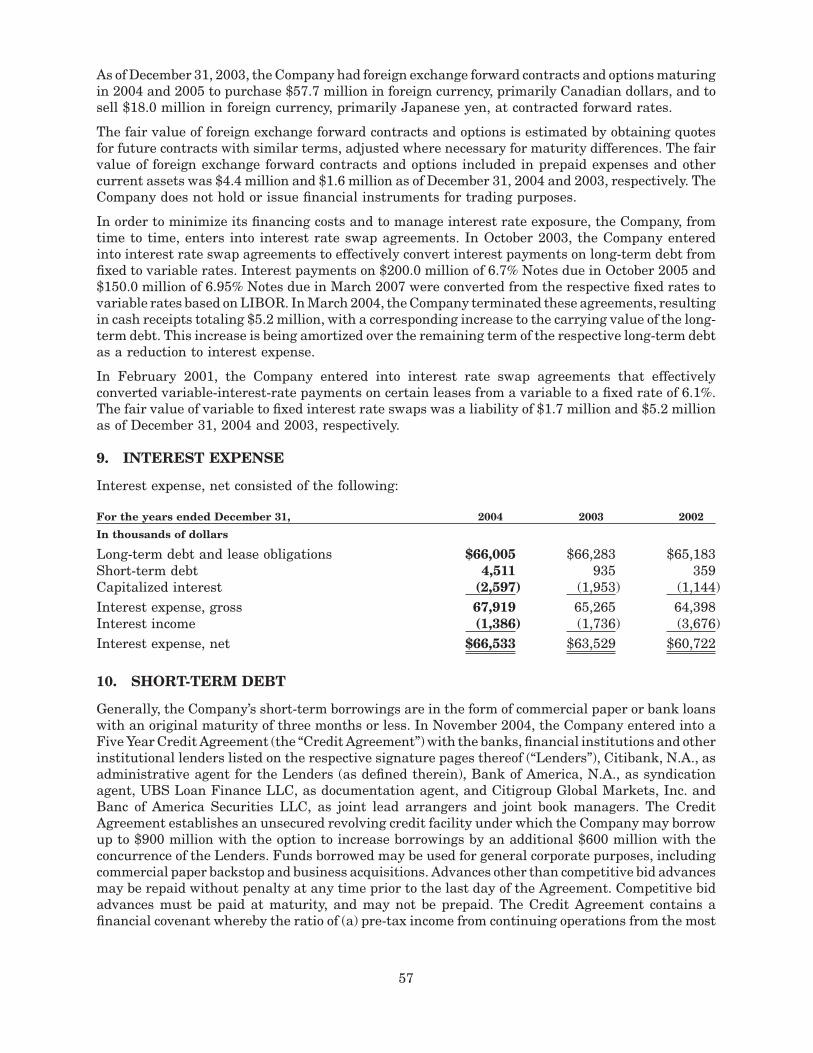
As of December 31, 2003, the Company had foreign exchange forward contracts and options maturingin 2004 and 2005 to purchase $57.7 million in foreign currency, primarily Canadian dollars, and tosell $18.0 million in foreign currency, primarily Japanese yen, at contracted forward rates.
The fair value of foreign exchange forward contracts and options is estimated by obtaining quotesfor future contracts with similar terms, adjusted where necessary for maturity differences. The fairvalue of foreign exchange forward contracts and options included in prepaid expenses and othercurrent assets was $4.4 million and $1.6 million as of December 31, 2004 and 2003, respectively. TheCompany does not hold or issue financial instruments for trading purposes.
In order to minimize its financing costs and to manage interest rate exposure, the Company, fromtime to time, enters into interest rate swap agreements. In October 2003, the Company enteredinto interest rate swap agreements to effectively convert interest payments on long-term debt fromfixed to variable rates. Interest payments on $200.0 million of 6.7% Notes due in October 2005 and$150.0 million of 6.95% Notes due in March 2007 were converted from the respective fixed rates tovariable rates based on LIBOR. In March 2004, the Company terminated these agreements, resultingin cash receipts totaling $5.2 million, with a corresponding increase to the carrying value of the long-term debt. This increase is being amortized over the remaining term of the respective long-term debtas a reduction to interest expense.
In February 2001, the Company entered into interest rate swap agreements that effectivelyconverted variable-interest-rate payments on certain leases from a variable to a fixed rate of 6.1%.The fair value of variable to fixed interest rate swaps was a liability of $1.7 million and $5.2 millionas of December 31, 2004 and 2003, respectively.
9. INTEREST EXPENSE
Interest expense, net consisted of the following:
For the years ended December 31, 2004 2003 2002
In thousands of dollars
Long-term debt and lease obligations $66,005 $66,283 $65,183Short-term debt 4,511 935 359Capitalized interest (2,597) (1,953) (1,144)Interest expense, gross 67,919 65,265 64,398Interest income (1,386) (1,736) (3,676)Interest expense, net $66,533 $63,529 $60,722
10. SHORT-TERM DEBT
Generally, the Company’s short-term borrowings are in the form of commercial paper or bank loanswith an original maturity of three months or less. In November 2004, the Company entered into aFive Year Credit Agreement (the “Credit Agreement”) with the banks, financial institutions and otherinstitutional lenders listed on the respective signature pages thereof (“Lenders”), Citibank, N.A., asadministrative agent for the Lenders (as defined therein), Bank of America, N.A., as syndicationagent, UBS Loan Finance LLC, as documentation agent, and Citigroup Global Markets, Inc. andBanc of America Securities LLC, as joint lead arrangers and joint book managers. The CreditAgreement establishes an unsecured revolving credit facility under which the Company may borrowup to $900 million with the option to increase borrowings by an additional $600 million with theconcurrence of the Lenders. Funds borrowed may be used for general corporate purposes, includingcommercial paper backstop and business acquisitions. Advances other than competitive bid advancesmay be repaid without penalty at any time prior to the last day of the Agreement. Competitive bidadvances must be paid at maturity, and may not be prepaid. The Credit Agreement contains afinancial covenant whereby the ratio of (a) pre-tax income from continuing operations from the most
57
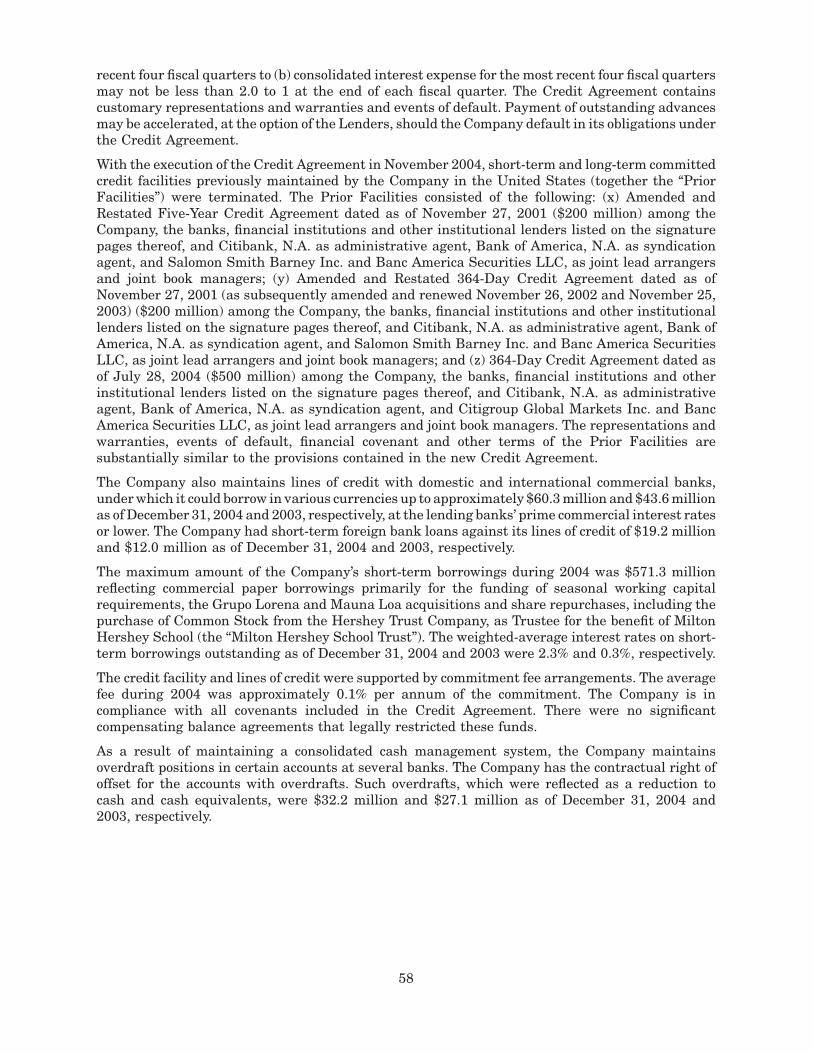
recent four fiscal quarters to (b) consolidated interest expense for the most recent four fiscal quartersmay not be less than 2.0 to 1 at the end of each fiscal quarter. The Credit Agreement containscustomary representations and warranties and events of default. Payment of outstanding advancesmay be accelerated, at the option of the Lenders, should the Company default in its obligations underthe Credit Agreement.
With the execution of the Credit Agreement in November 2004, short-term and long-term committedcredit facilities previously maintained by the Company in the United States (together the “PriorFacilities”) were terminated. The Prior Facilities consisted of the following: (x) Amended andRestated Five-Year Credit Agreement dated as of November 27, 2001 ($200 million) among theCompany, the banks, financial institutions and other institutional lenders listed on the signaturepages thereof, and Citibank, N.A. as administrative agent, Bank of America, N.A. as syndicationagent, and Salomon Smith Barney Inc. and Banc America Securities LLC, as joint lead arrangersand joint book managers; (y) Amended and Restated 364-Day Credit Agreement dated as ofNovember 27, 2001 (as subsequently amended and renewed November 26, 2002 and November 25,2003) ($200 million) among the Company, the banks, financial institutions and other institutionallenders listed on the signature pages thereof, and Citibank, N.A. as administrative agent, Bank ofAmerica, N.A. as syndication agent, and Salomon Smith Barney Inc. and Banc America SecuritiesLLC, as joint lead arrangers and joint book managers; and (z) 364-Day Credit Agreement dated asof July 28, 2004 ($500 million) among the Company, the banks, financial institutions and otherinstitutional lenders listed on the signature pages thereof, and Citibank, N.A. as administrativeagent, Bank of America, N.A. as syndication agent, and Citigroup Global Markets Inc. and BancAmerica Securities LLC, as joint lead arrangers and joint book managers. The representations andwarranties, events of default, financial covenant and other terms of the Prior Facilities aresubstantially similar to the provisions contained in the new Credit Agreement.
The Company also maintains lines of credit with domestic and international commercial banks,under which it could borrow in various currencies up to approximately $60.3 million and $43.6 millionas of December 31, 2004 and 2003, respectively, at the lending banks’ prime commercial interest ratesor lower. The Company had short-term foreign bank loans against its lines of credit of $19.2 millionand $12.0 million as of December 31, 2004 and 2003, respectively.
The maximum amount of the Company’s short-term borrowings during 2004 was $571.3 millionreflecting commercial paper borrowings primarily for the funding of seasonal working capitalrequirements, the Grupo Lorena and Mauna Loa acquisitions and share repurchases, including thepurchase of Common Stock from the Hershey Trust Company, as Trustee for the benefit of MiltonHershey School (the “Milton Hershey School Trust”). The weighted-average interest rates on short-term borrowings outstanding as of December 31, 2004 and 2003 were 2.3% and 0.3%, respectively.
The credit facility and lines of credit were supported by commitment fee arrangements. The averagefee during 2004 was approximately 0.1% per annum of the commitment. The Company is incompliance with all covenants included in the Credit Agreement. There were no significantcompensating balance agreements that legally restricted these funds.
As a result of maintaining a consolidated cash management system, the Company maintainsoverdraft positions in certain accounts at several banks. The Company has the contractual right ofoffset for the accounts with overdrafts. Such overdrafts, which were reflected as a reduction tocash and cash equivalents, were $32.2 million and $27.1 million as of December 31, 2004 and2003, respectively.
58
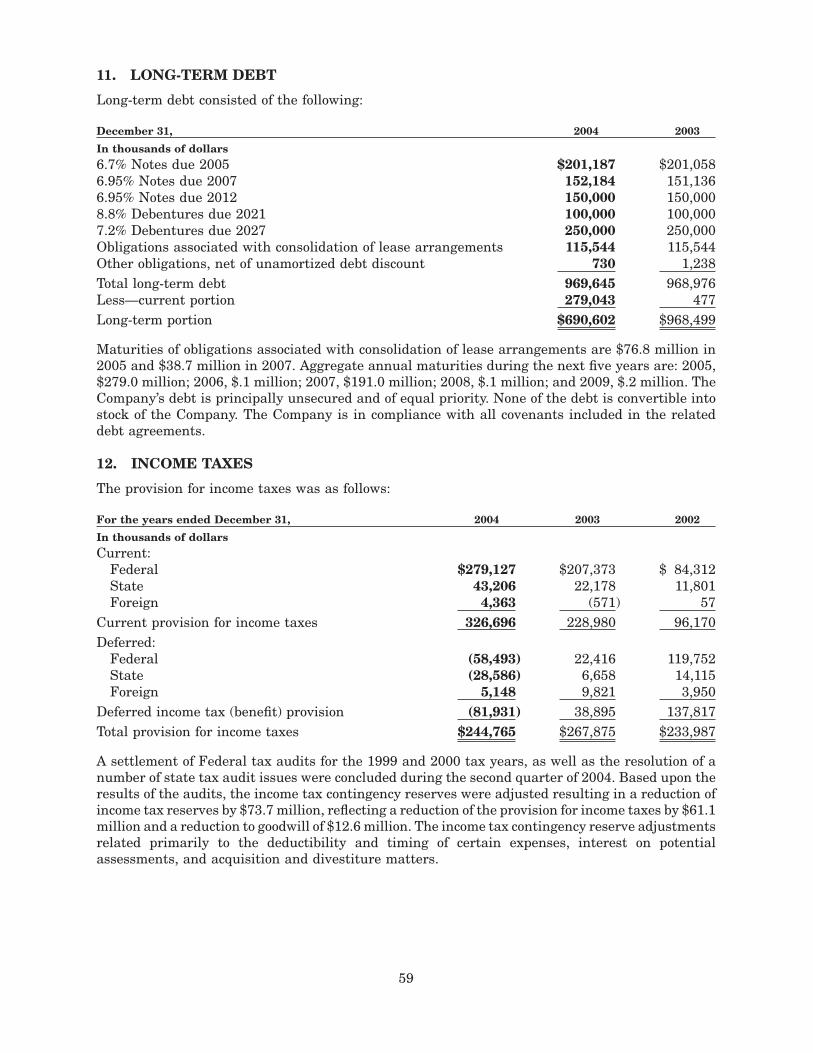
11. LONG-TERM DEBT
Long-term debt consisted of the following:
December 31, 2004 2003
In thousands of dollars6.7% Notes due 2005 $201,187 $201,0586.95% Notes due 2007 152,184 151,1366.95% Notes due 2012 150,000 150,0008.8% Debentures due 2021 100,000 100,0007.2% Debentures due 2027 250,000 250,000Obligations associated with consolidation of lease arrangements 115,544 115,544Other obligations, net of unamortized debt discount 730 1,238Total long-term debt 969,645 968,976Less—current portion 279,043 477Long-term portion $690,602 $968,499
Maturities of obligations associated with consolidation of lease arrangements are $76.8 million in2005 and $38.7 million in 2007. Aggregate annual maturities during the next five years are: 2005,$279.0 million; 2006, $.1 million; 2007, $191.0 million; 2008, $.1 million; and 2009, $.2 million. TheCompany’s debt is principally unsecured and of equal priority. None of the debt is convertible intostock of the Company. The Company is in compliance with all covenants included in the relateddebt agreements.
12. INCOME TAXES
The provision for income taxes was as follows:
For the years ended December 31, 2004 2003 2002
In thousands of dollarsCurrent:
Federal $279,127 $207,373 $ 84,312State 43,206 22,178 11,801Foreign 4,363 (571) 57
Current provision for income taxes 326,696 228,980 96,170Deferred:
Federal (58,493) 22,416 119,752State (28,586) 6,658 14,115Foreign 5,148 9,821 3,950
Deferred income tax (benefit) provision (81,931) 38,895 137,817Total provision for income taxes $244,765 $267,875 $233,987
A settlement of Federal tax audits for the 1999 and 2000 tax years, as well as the resolution of anumber of state tax audit issues were concluded during the second quarter of 2004. Based upon theresults of the audits, the income tax contingency reserves were adjusted resulting in a reduction ofincome tax reserves by $73.7 million, reflecting a reduction of the provision for income taxes by $61.1million and a reduction to goodwill of $12.6 million. The income tax contingency reserve adjustmentsrelated primarily to the deductibility and timing of certain expenses, interest on potentialassessments, and acquisition and divestiture matters.
59
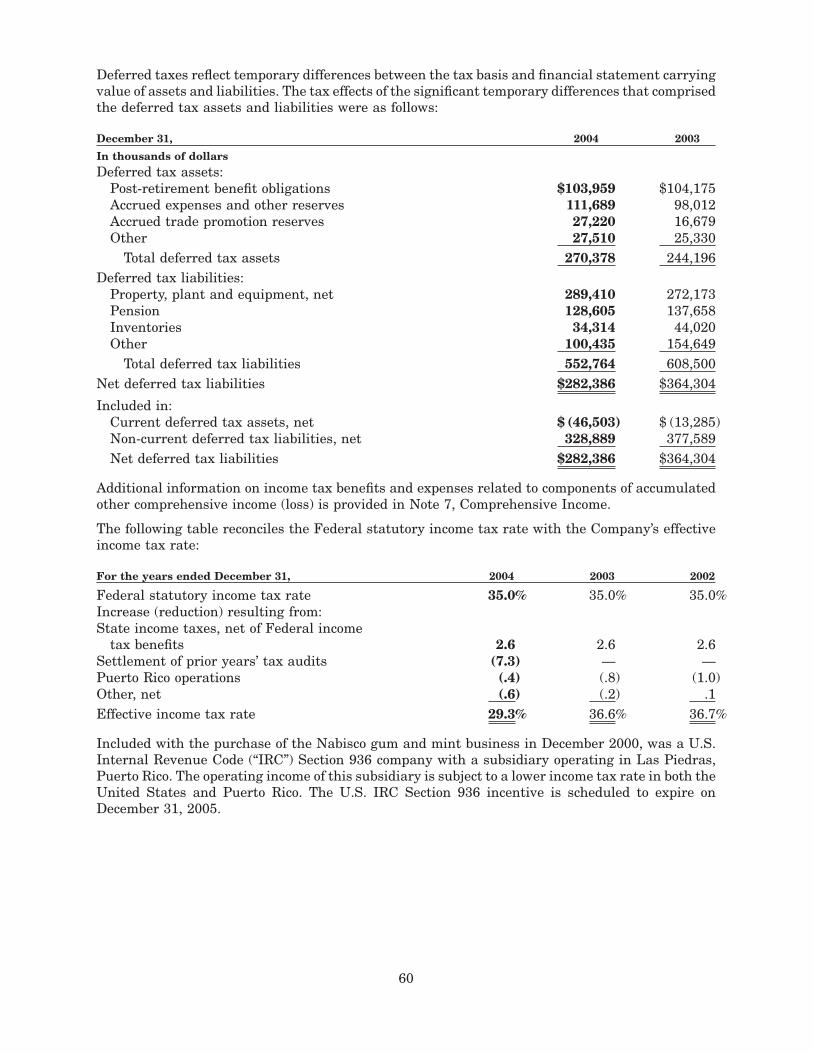
Deferred taxes reflect temporary differences between the tax basis and financial statement carryingvalue of assets and liabilities. The tax effects of the significant temporary differences that comprisedthe deferred tax assets and liabilities were as follows:
December 31, 2004 2003
In thousands of dollarsDeferred tax assets:
Post-retirement benefit obligations $103,959 $104,175Accrued expenses and other reserves 111,689 98,012Accrued trade promotion reserves 27,220 16,679Other 27,510 25,330
Total deferred tax assets 270,378 244,196Deferred tax liabilities:
Property, plant and equipment, net 289,410 272,173Pension 128,605 137,658Inventories 34,314 44,020Other 100,435 154,649
Total deferred tax liabilities 552,764 608,500Net deferred tax liabilities $282,386 $364,304
Included in:Current deferred tax assets, net $ (46,503) $ (13,285)Non-current deferred tax liabilities, net 328,889 377,589Net deferred tax liabilities $282,386 $364,304
Additional information on income tax benefits and expenses related to components of accumulatedother comprehensive income (loss) is provided in Note 7, Comprehensive Income.
The following table reconciles the Federal statutory income tax rate with the Company’s effectiveincome tax rate:
For the years ended December 31, 2004 2003 2002
Federal statutory income tax rate 35.0% 35.0% 35.0%Increase (reduction) resulting from:State income taxes, net of Federal income
tax benefits 2.6 2.6 2.6Settlement of prior years’ tax audits (7.3) — —Puerto Rico operations (.4) (.8) (1.0)Other, net (.6) (.2) .1Effective income tax rate 29.3% 36.6% 36.7%
Included with the purchase of the Nabisco gum and mint business in December 2000, was a U.S.Internal Revenue Code (“IRC”) Section 936 company with a subsidiary operating in Las Piedras,Puerto Rico. The operating income of this subsidiary is subject to a lower income tax rate in both theUnited States and Puerto Rico. The U.S. IRC Section 936 incentive is scheduled to expire onDecember 31, 2005.
60
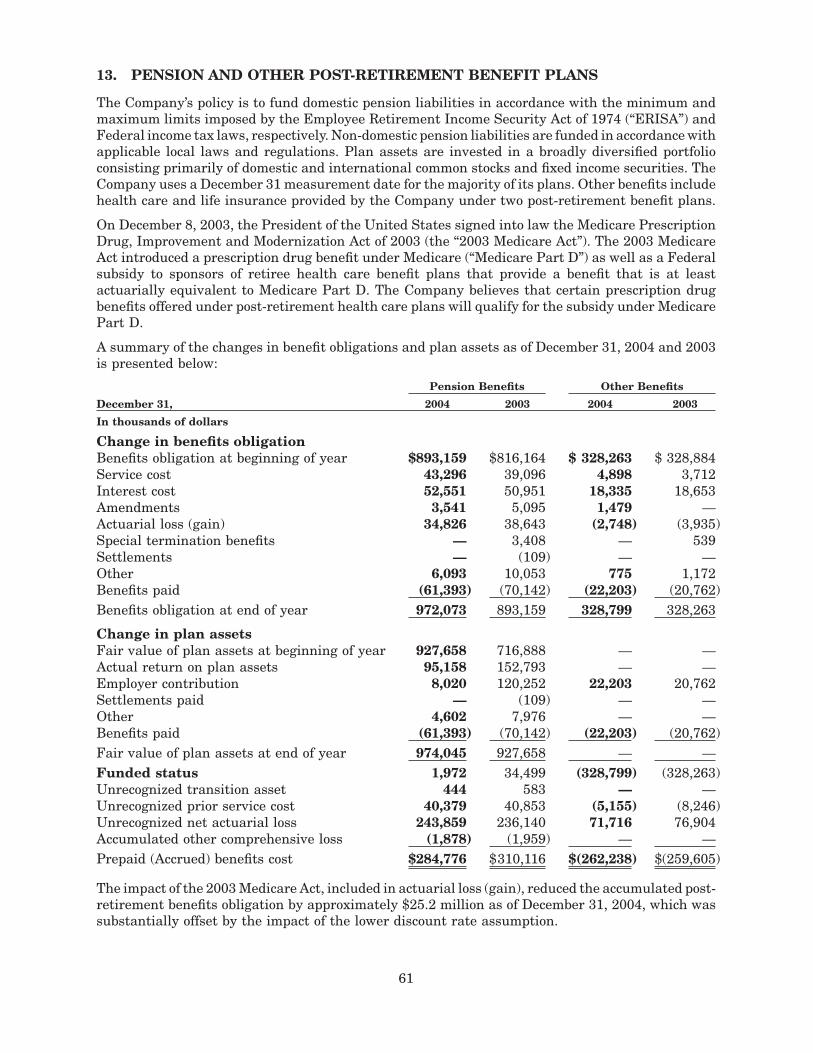
13. PENSION AND OTHER POST-RETIREMENT BENEFIT PLANS
The Company’s policy is to fund domestic pension liabilities in accordance with the minimum andmaximum limits imposed by the Employee Retirement Income Security Act of 1974 (“ERISA”) andFederal income tax laws, respectively. Non-domestic pension liabilities are funded in accordance withapplicable local laws and regulations. Plan assets are invested in a broadly diversified portfolioconsisting primarily of domestic and international common stocks and fixed income securities. TheCompany uses a December 31 measurement date for the majority of its plans. Other benefits includehealth care and life insurance provided by the Company under two post-retirement benefit plans.
On December 8, 2003, the President of the United States signed into law the Medicare PrescriptionDrug, Improvement and Modernization Act of 2003 (the “2003 Medicare Act”). The 2003 MedicareAct introduced a prescription drug benefit under Medicare (“Medicare Part D”) as well as a Federalsubsidy to sponsors of retiree health care benefit plans that provide a benefit that is at leastactuarially equivalent to Medicare Part D. The Company believes that certain prescription drugbenefits offered under post-retirement health care plans will qualify for the subsidy under MedicarePart D.
A summary of the changes in benefit obligations and plan assets as of December 31, 2004 and 2003is presented below:
Pension Benefits Other Benefits
December 31, 2004 2003 2004 2003
In thousands of dollars
Change in benefits obligationBenefits obligation at beginning of year $893,159 $816,164 $ 328,263 $ 328,884Service cost 43,296 39,096 4,898 3,712Interest cost 52,551 50,951 18,335 18,653Amendments 3,541 5,095 1,479 —Actuarial loss (gain) 34,826 38,643 (2,748) (3,935)Special termination benefits — 3,408 — 539Settlements — (109) — —Other 6,093 10,053 775 1,172Benefits paid (61,393) (70,142) (22,203) (20,762)Benefits obligation at end of year 972,073 893,159 328,799 328,263
Change in plan assetsFair value of plan assets at beginning of year 927,658 716,888 — —Actual return on plan assets 95,158 152,793 — —Employer contribution 8,020 120,252 22,203 20,762Settlements paid — (109) — —Other 4,602 7,976 — —Benefits paid (61,393) (70,142) (22,203) (20,762)Fair value of plan assets at end of year 974,045 927,658 — —Funded status 1,972 34,499 (328,799) (328,263)Unrecognized transition asset 444 583 — —Unrecognized prior service cost 40,379 40,853 (5,155) (8,246)Unrecognized net actuarial loss 243,859 236,140 71,716 76,904Accumulated other comprehensive loss (1,878) (1,959) — —Prepaid (Accrued) benefits cost $284,776 $310,116 $(262,238) $(259,605)
The impact of the 2003 Medicare Act, included in actuarial loss (gain), reduced the accumulated post-retirement benefits obligation by approximately $25.2 million as of December 31, 2004, which wassubstantially offset by the impact of the lower discount rate assumption.
61
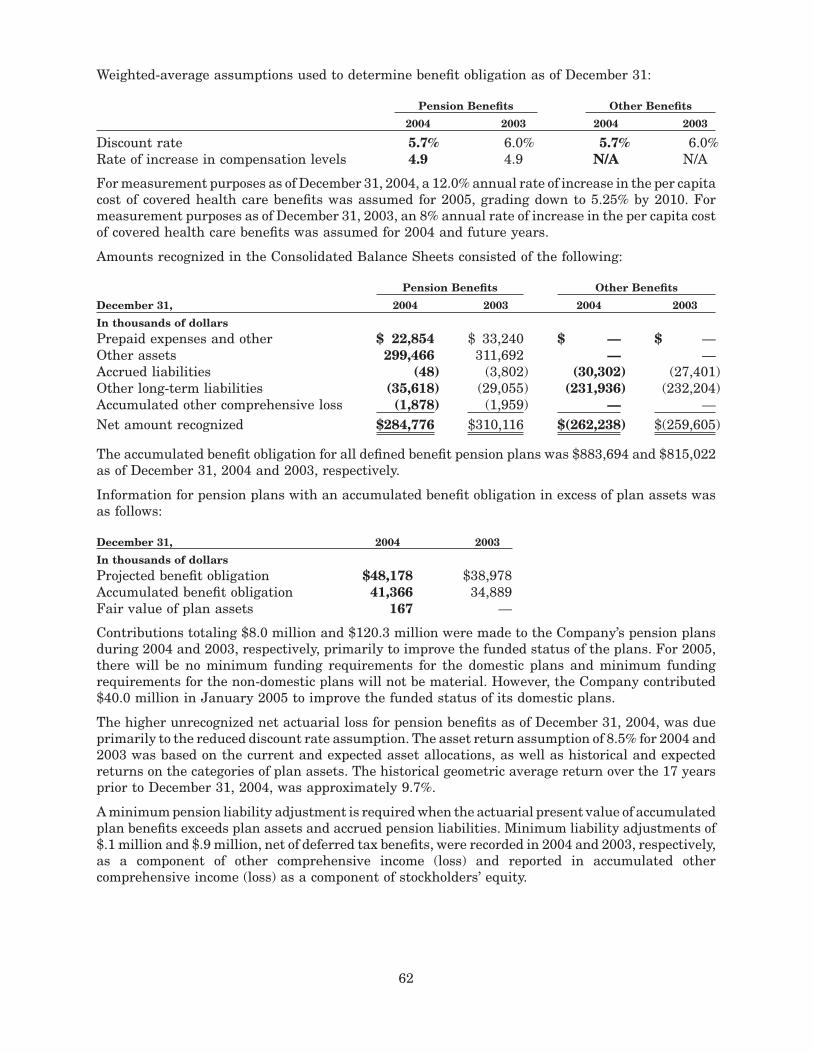
Weighted-average assumptions used to determine benefit obligation as of December 31:
Pension Benefits Other Benefits
2004 2003 2004 2003
Discount rate 5.7% 6.0% 5.7% 6.0%Rate of increase in compensation levels 4.9 4.9 N/A N/A
For measurement purposes as of December 31, 2004, a 12.0% annual rate of increase in the per capitacost of covered health care benefits was assumed for 2005, grading down to 5.25% by 2010. Formeasurement purposes as of December 31, 2003, an 8% annual rate of increase in the per capita costof covered health care benefits was assumed for 2004 and future years.
Amounts recognized in the Consolidated Balance Sheets consisted of the following:
Pension Benefits Other Benefits
December 31, 2004 2003 2004 2003
In thousands of dollarsPrepaid expenses and other $ 22,854 $ 33,240 $ — $ —Other assets 299,466 311,692 — —Accrued liabilities (48) (3,802) (30,302) (27,401)Other long-term liabilities (35,618) (29,055) (231,936) (232,204)Accumulated other comprehensive loss (1,878) (1,959) — —Net amount recognized $284,776 $310,116 $(262,238) $(259,605)
The accumulated benefit obligation for all defined benefit pension plans was $883,694 and $815,022as of December 31, 2004 and 2003, respectively.
Information for pension plans with an accumulated benefit obligation in excess of plan assets wasas follows:
December 31, 2004 2003
In thousands of dollarsProjected benefit obligation $48,178 $38,978Accumulated benefit obligation 41,366 34,889Fair value of plan assets 167 —
Contributions totaling $8.0 million and $120.3 million were made to the Company’s pension plansduring 2004 and 2003, respectively, primarily to improve the funded status of the plans. For 2005,there will be no minimum funding requirements for the domestic plans and minimum fundingrequirements for the non-domestic plans will not be material. However, the Company contributed$40.0 million in January 2005 to improve the funded status of its domestic plans.
The higher unrecognized net actuarial loss for pension benefits as of December 31, 2004, was dueprimarily to the reduced discount rate assumption. The asset return assumption of 8.5% for 2004 and2003 was based on the current and expected asset allocations, as well as historical and expectedreturns on the categories of plan assets. The historical geometric average return over the 17 yearsprior to December 31, 2004, was approximately 9.7%.
A minimum pension liability adjustment is required when the actuarial present value of accumulatedplan benefits exceeds plan assets and accrued pension liabilities. Minimum liability adjustments of$.1 million and $.9 million, net of deferred tax benefits, were recorded in 2004 and 2003, respectively,as a component of other comprehensive income (loss) and reported in accumulated othercomprehensive income (loss) as a component of stockholders’ equity.
62

A summary of the components of net periodic benefits cost for the years ended December 31, 2004,2003 and 2002 is presented below:
Pension Benefits Other Benefits
For the years ended December 31, 2004 2003 2002 2004 2003 2002
In thousands of dollars
Components of net periodicbenefits cost
Service cost $ 43,296 $ 39,096 $ 31,890 $ 4,898 $ 3,712 $ 3,157Interest cost 52,551 50,951 50,372 18,335 18,653 19,674Expected return on plan assets (76,438) (59,557) (60,443) — — —Amortization of prior service cost 4,245 4,486 3,906 (1,507) (1,654) (1,858)Amortization of unrecognized
transition balance 139 (331) (326) — — —Recognized net actuarial loss 9,812 16,377 4,371 2,554 3,171 2,774Company sponsored plans 33,605 51,022 29,770 24,280 23,882 23,747Multi-employer plans — — 483 — — —Administrative expenses 773 517 423 — — —Net periodic benefits cost 34,378 51,539 30,676 24,280 23,882 23,747Special termination benefits — 3,383 809 — 539 —Curtailment loss — 28 2,116 — — —Settlement loss — 7 30,118 — — —Total amount reflected in earnings $ 34,378 $ 54,957 $ 63,719 $24,280 $24,421 $23,747
The lower net periodic benefits cost related to other benefits for the year ended December 31, 2004,was due primarily to the impact of the 2003 Medicare Act, which was substantially offset by theimpact of the lower discount rate. The Federal subsidy to be provided by the 2003 Medicare Actreduced net periodic benefits costs in 2004 by approximately $3.0 million.
A summary of the weighted-average assumptions used to determine net periodic benefits cost isas follows:
Pension Benefits Other Benefits
For the years ended December 31, 2004 2003 2002 2004 2003 2002
In thousands of dollars except percentsDiscount rate 6.0% 6.3% 6.9% 6.0% 6.3% 7.0%Expected long-term return on
plan assets 8.5 8.5 9.5 N/A N/A N/ARate of compensation increase 4.9 4.9 4.9 N/A N/A N/AAdditional information:(Increase) decrease in minimum
liability included in othercomprehensive income $81 $(1,565) $58,261 N/A N/A N/A
The Company’s pension plan asset target allocation for 2005 and the actual allocation as ofDecember 31, 2004 and 2003 are as follows:
Percentage of PlanAssets as of December 31,
Asset CategoryTarget Allocation
2005 2004 2003
Equity securities 40–85% 75% 61%Debt securities 15–60 24 37Other 0–10 1 2Total 100% 100%
63
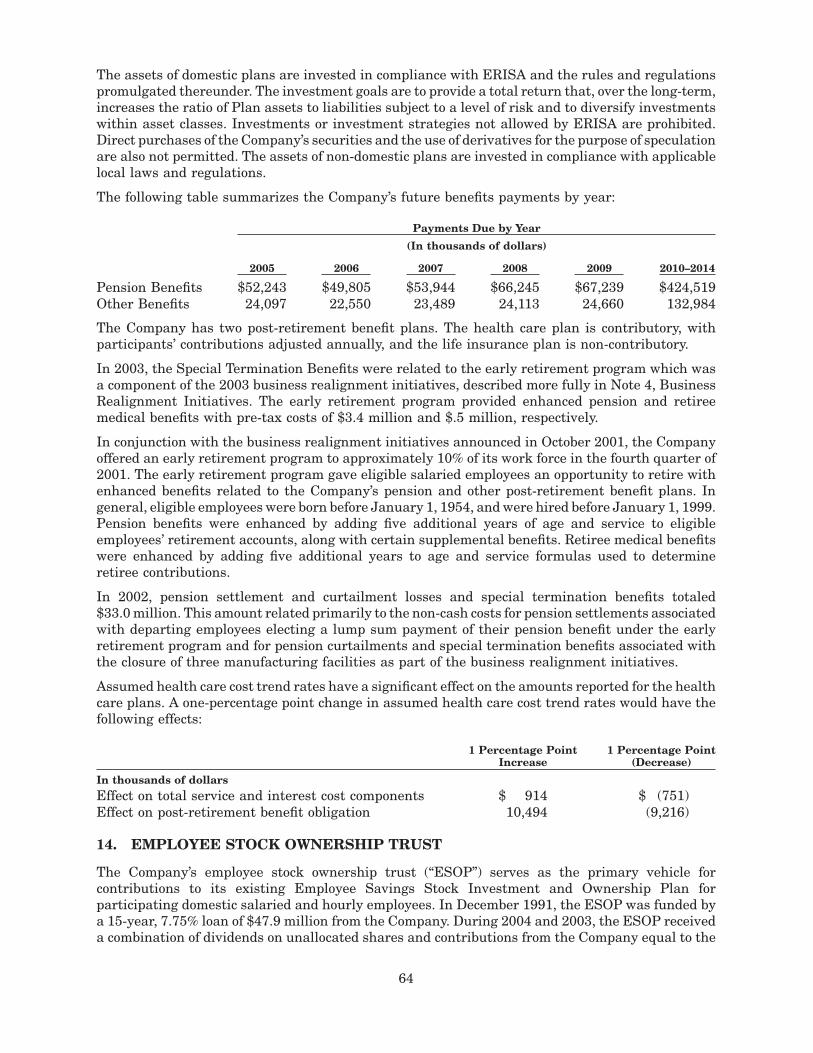
The assets of domestic plans are invested in compliance with ERISA and the rules and regulationspromulgated thereunder. The investment goals are to provide a total return that, over the long-term,increases the ratio of Plan assets to liabilities subject to a level of risk and to diversify investmentswithin asset classes. Investments or investment strategies not allowed by ERISA are prohibited.Direct purchases of the Company’s securities and the use of derivatives for the purpose of speculationare also not permitted. The assets of non-domestic plans are invested in compliance with applicablelocal laws and regulations.
The following table summarizes the Company’s future benefits payments by year:
Payments Due by Year
(In thousands of dollars)
2005 2006 2007 2008 2009 2010–2014
Pension Benefits $52,243 $49,805 $53,944 $66,245 $67,239 $424,519Other Benefits 24,097 22,550 23,489 24,113 24,660 132,984
The Company has two post-retirement benefit plans. The health care plan is contributory, withparticipants’ contributions adjusted annually, and the life insurance plan is non-contributory.
In 2003, the Special Termination Benefits were related to the early retirement program which wasa component of the 2003 business realignment initiatives, described more fully in Note 4, BusinessRealignment Initiatives. The early retirement program provided enhanced pension and retireemedical benefits with pre-tax costs of $3.4 million and $.5 million, respectively.
In conjunction with the business realignment initiatives announced in October 2001, the Companyoffered an early retirement program to approximately 10% of its work force in the fourth quarter of2001. The early retirement program gave eligible salaried employees an opportunity to retire withenhanced benefits related to the Company’s pension and other post-retirement benefit plans. Ingeneral, eligible employees were born before January 1, 1954, and were hired before January 1, 1999.Pension benefits were enhanced by adding five additional years of age and service to eligibleemployees’ retirement accounts, along with certain supplemental benefits. Retiree medical benefitswere enhanced by adding five additional years to age and service formulas used to determineretiree contributions.
In 2002, pension settlement and curtailment losses and special termination benefits totaled$33.0 million. This amount related primarily to the non-cash costs for pension settlements associatedwith departing employees electing a lump sum payment of their pension benefit under the earlyretirement program and for pension curtailments and special termination benefits associated withthe closure of three manufacturing facilities as part of the business realignment initiatives.
Assumed health care cost trend rates have a significant effect on the amounts reported for the healthcare plans. A one-percentage point change in assumed health care cost trend rates would have thefollowing effects:
1 Percentage PointIncrease
1 Percentage Point(Decrease)
In thousands of dollarsEffect on total service and interest cost components $ 914 $ (751)Effect on post-retirement benefit obligation 10,494 (9,216)
14. EMPLOYEE STOCK OWNERSHIP TRUST
The Company’s employee stock ownership trust (“ESOP”) serves as the primary vehicle forcontributions to its existing Employee Savings Stock Investment and Ownership Plan forparticipating domestic salaried and hourly employees. In December 1991, the ESOP was funded bya 15-year, 7.75% loan of $47.9 million from the Company. During 2004 and 2003, the ESOP receiveda combination of dividends on unallocated shares and contributions from the Company equal to the
64
amount required to meet its principal and interest payments under the loan. Simultaneously, theESOP allocated to participants 318,351 shares of Common Stock each year. As of December 31, 2004,the ESOP held 2,406,495 allocated shares and 636,688 unallocated shares. All ESOP shares areconsidered outstanding for income per share computations.
The Company recognized net compensation expense equal to the shares allocated multiplied by theoriginal cost of $10.03 per share less dividends received by the ESOP on unallocated shares.Compensation (income) expense related to the ESOP for 2004, 2003 and 2002 was $(.1) million,$1.6 million and $.9 million, respectively. Dividends paid on unallocated ESOP shares for 2004, 2003and 2002 were $.7 million, $.8 million and $.9 million, respectively. Dividends paid on all ESOP sharesare recorded as a reduction to retained earnings. The unearned ESOP compensation balance instockholders’ equity represented deferred compensation expense to be recognized by the Companyin future years as additional shares are allocated to participants.
15. CAPITAL STOCK AND NET INCOME PER SHARE
As of December 31, 2004, the Company had 530,000,000 authorized shares of capital stock. Of thistotal, 450,000,000 shares were designated as Common Stock, 75,000,000 shares as Class B CommonStock (“Class B Stock”) and 5,000,000 shares as Preferred Stock, each class having a par value of onedollar per share. As of December 31, 2004, a combined total of 359,901,744 shares of both classes ofcommon stock had been issued of which 246,587,917 shares were outstanding. No shares of thePreferred Stock were issued or outstanding during the three-year period ended December 31, 2004.
In April 2004, the Company’s Board of Directors approved a two-for-one stock split to be effected inthe form of a 100 percent stock dividend to stockholders of record on May 25, 2004. The additionalshares were distributed on June 15, 2004. The Company’s stockholders received one additional sharefor each share in their possession on that date. This did not change the proportionate interest astockholder maintained in the Company. Unless otherwise indicated, all shares and per shareamounts have been adjusted for the two-for-one stock split.
Holders of the Common Stock and the Class B Stock generally vote together without regard to classon matters submitted to stockholders, including the election of directors, with the Common Stockhaving one vote per share and the Class B Stock having ten votes per share. However, the CommonStock, voting separately as a class, is entitled to elect one-sixth of the Board of Directors. With respectto dividend rights, the Common Stock is entitled to cash dividends 10% higher than those declaredand paid on the Class B Stock.
Class B Stock can be converted into Common Stock on a share-for-share basis at any time. During2004 a total of 2,683 shares of Class B Stock were converted into Common Stock and during 2003and 2002, on a pre-split basis, a total of 212 shares and 11,500 shares, respectively, of Class B Stockwere converted into Common Stock.
In December 2000, the Company’s Board of Directors unanimously adopted a Stockholder ProtectionRights Agreement and declared a dividend of one right (“Right”) for each outstanding share ofCommon Stock and Class B Stock payable to stockholders of record at the close of business onDecember 26, 2000. The Rights will at no time have voting power or receive dividends. The issuanceof the Rights has no dilutive effect, will not affect reported earnings per share, is not taxable andwill not change the manner in which the Company’s Common Stock is traded.
The Rights become exercisable only upon (i) resolution of the Board of Directors after any person hascommenced a tender offer that would result in such person becoming the beneficial owner of 15% ormore of the Common Stock, (ii) the Company’s announcement that a person or group has acquired15% or more of the outstanding shares of Common Stock, or (iii) a person or group becoming thebeneficial owner of more than 35% of the voting power of all of the outstanding Common Stock andClass B Stock. When exercisable, each Right entitles its registered holder to purchase from theCompany, at a pre-determined exercise price, one one-thousandth of a share of Series A ParticipatingPreferred Stock, par value $1.00 per share (which would be convertible by holders of Class BStock into Series B Participating Preferred Stock on the basis of one one-thousandth of a share of
65
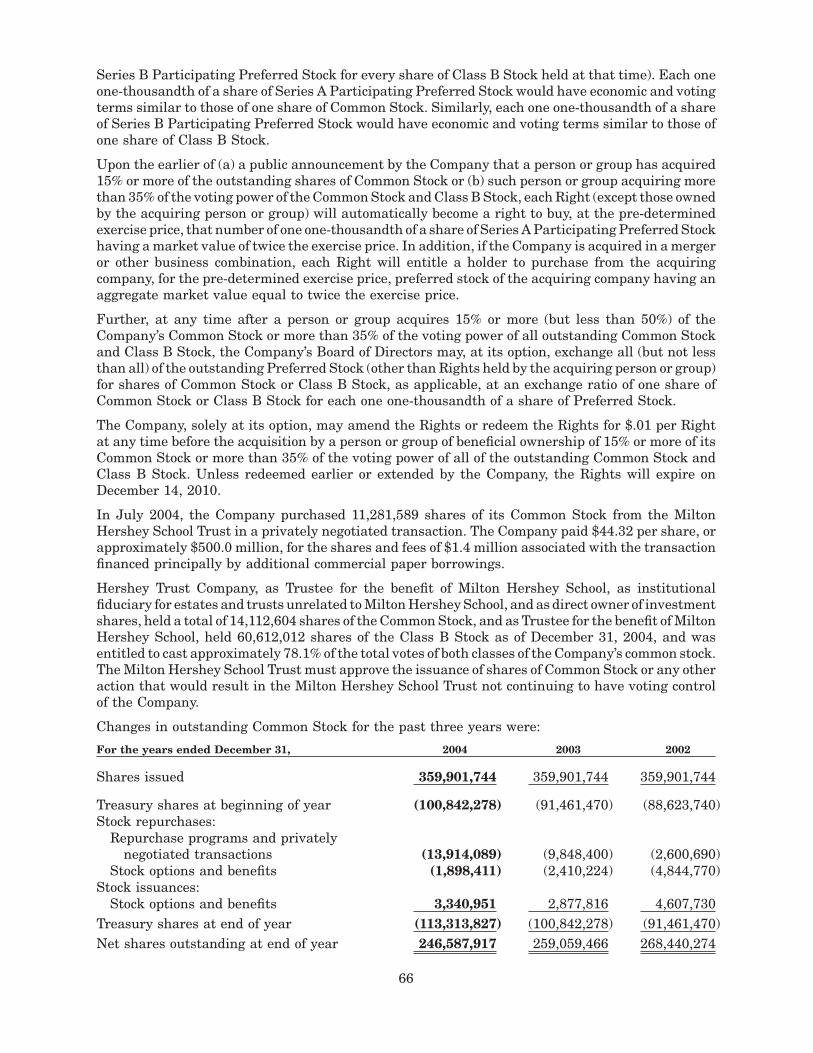
Series B Participating Preferred Stock for every share of Class B Stock held at that time). Each oneone-thousandth of a share of Series A Participating Preferred Stock would have economic and votingterms similar to those of one share of Common Stock. Similarly, each one one-thousandth of a shareof Series B Participating Preferred Stock would have economic and voting terms similar to those ofone share of Class B Stock.
Upon the earlier of (a) a public announcement by the Company that a person or group has acquired15% or more of the outstanding shares of Common Stock or (b) such person or group acquiring morethan 35% of the voting power of the Common Stock and Class B Stock, each Right (except those ownedby the acquiring person or group) will automatically become a right to buy, at the pre-determinedexercise price, that number of one one-thousandth of a share of Series A Participating Preferred Stockhaving a market value of twice the exercise price. In addition, if the Company is acquired in a mergeror other business combination, each Right will entitle a holder to purchase from the acquiringcompany, for the pre-determined exercise price, preferred stock of the acquiring company having anaggregate market value equal to twice the exercise price.
Further, at any time after a person or group acquires 15% or more (but less than 50%) of theCompany’s Common Stock or more than 35% of the voting power of all outstanding Common Stockand Class B Stock, the Company’s Board of Directors may, at its option, exchange all (but not lessthan all) of the outstanding Preferred Stock (other than Rights held by the acquiring person or group)for shares of Common Stock or Class B Stock, as applicable, at an exchange ratio of one share ofCommon Stock or Class B Stock for each one one-thousandth of a share of Preferred Stock.
The Company, solely at its option, may amend the Rights or redeem the Rights for $.01 per Rightat any time before the acquisition by a person or group of beneficial ownership of 15% or more of itsCommon Stock or more than 35% of the voting power of all of the outstanding Common Stock andClass B Stock. Unless redeemed earlier or extended by the Company, the Rights will expire onDecember 14, 2010.
In July 2004, the Company purchased 11,281,589 shares of its Common Stock from the MiltonHershey School Trust in a privately negotiated transaction. The Company paid $44.32 per share, orapproximately $500.0 million, for the shares and fees of $1.4 million associated with the transactionfinanced principally by additional commercial paper borrowings.
Hershey Trust Company, as Trustee for the benefit of Milton Hershey School, as institutionalfiduciary for estates and trusts unrelated to Milton Hershey School, and as direct owner of investmentshares, held a total of 14,112,604 shares of the Common Stock, and as Trustee for the benefit of MiltonHershey School, held 60,612,012 shares of the Class B Stock as of December 31, 2004, and wasentitled to cast approximately 78.1% of the total votes of both classes of the Company’s common stock.The Milton Hershey School Trust must approve the issuance of shares of Common Stock or any otheraction that would result in the Milton Hershey School Trust not continuing to have voting controlof the Company.
Changes in outstanding Common Stock for the past three years were:
For the years ended December 31, 2004 2003 2002
Shares issued 359,901,744 359,901,744 359,901,744
Treasury shares at beginning of year (100,842,278) (91,461,470) (88,623,740)Stock repurchases:
Repurchase programs and privatelynegotiated transactions (13,914,089) (9,848,400) (2,600,690)
Stock options and benefits (1,898,411) (2,410,224) (4,844,770)Stock issuances:
Stock options and benefits 3,340,951 2,877,816 4,607,730Treasury shares at end of year (113,313,827) (100,842,278) (91,461,470)Net shares outstanding at end of year 246,587,917 259,059,466 268,440,274
66
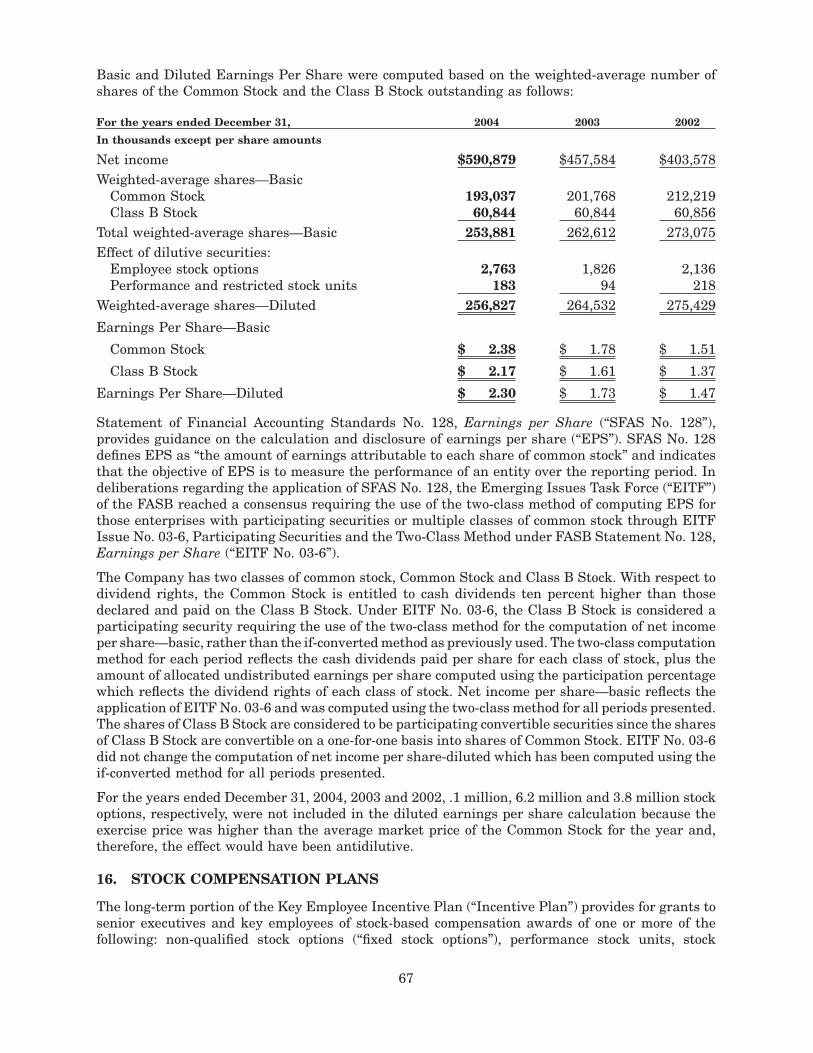
Basic and Diluted Earnings Per Share were computed based on the weighted-average number ofshares of the Common Stock and the Class B Stock outstanding as follows:
For the years ended December 31, 2004 2003 2002
In thousands except per share amounts
Net income $590,879 $457,584 $403,578Weighted-average shares—Basic
Common Stock 193,037 201,768 212,219Class B Stock 60,844 60,844 60,856
Total weighted-average shares—Basic 253,881 262,612 273,075Effect of dilutive securities:
Employee stock options 2,763 1,826 2,136Performance and restricted stock units 183 94 218
Weighted-average shares—Diluted 256,827 264,532 275,429
Earnings Per Share—Basic
Common Stock $ 2.38 $ 1.78 $ 1.51
Class B Stock $ 2.17 $ 1.61 $ 1.37
Earnings Per Share—Diluted $ 2.30 $ 1.73 $ 1.47
Statement of Financial Accounting Standards No. 128, Earnings per Share (“SFAS No. 128”),provides guidance on the calculation and disclosure of earnings per share (“EPS”). SFAS No. 128defines EPS as “the amount of earnings attributable to each share of common stock” and indicatesthat the objective of EPS is to measure the performance of an entity over the reporting period. Indeliberations regarding the application of SFAS No. 128, the Emerging Issues Task Force (“EITF”)of the FASB reached a consensus requiring the use of the two-class method of computing EPS forthose enterprises with participating securities or multiple classes of common stock through EITFIssue No. 03-6, Participating Securities and the Two-Class Method under FASB Statement No. 128,Earnings per Share (“EITF No. 03-6”).
The Company has two classes of common stock, Common Stock and Class B Stock. With respect todividend rights, the Common Stock is entitled to cash dividends ten percent higher than thosedeclared and paid on the Class B Stock. Under EITF No. 03-6, the Class B Stock is considered aparticipating security requiring the use of the two-class method for the computation of net incomeper share—basic, rather than the if-converted method as previously used. The two-class computationmethod for each period reflects the cash dividends paid per share for each class of stock, plus theamount of allocated undistributed earnings per share computed using the participation percentagewhich reflects the dividend rights of each class of stock. Net income per share—basic reflects theapplication of EITF No. 03-6 and was computed using the two-class method for all periods presented.The shares of Class B Stock are considered to be participating convertible securities since the sharesof Class B Stock are convertible on a one-for-one basis into shares of Common Stock. EITF No. 03-6did not change the computation of net income per share-diluted which has been computed using theif-converted method for all periods presented.
For the years ended December 31, 2004, 2003 and 2002, .1 million, 6.2 million and 3.8 million stockoptions, respectively, were not included in the diluted earnings per share calculation because theexercise price was higher than the average market price of the Common Stock for the year and,therefore, the effect would have been antidilutive.
16. STOCK COMPENSATION PLANS
The long-term portion of the Key Employee Incentive Plan (“Incentive Plan”) provides for grants tosenior executives and key employees of stock-based compensation awards of one or more of thefollowing: non-qualified stock options (“fixed stock options”), performance stock units, stock
67
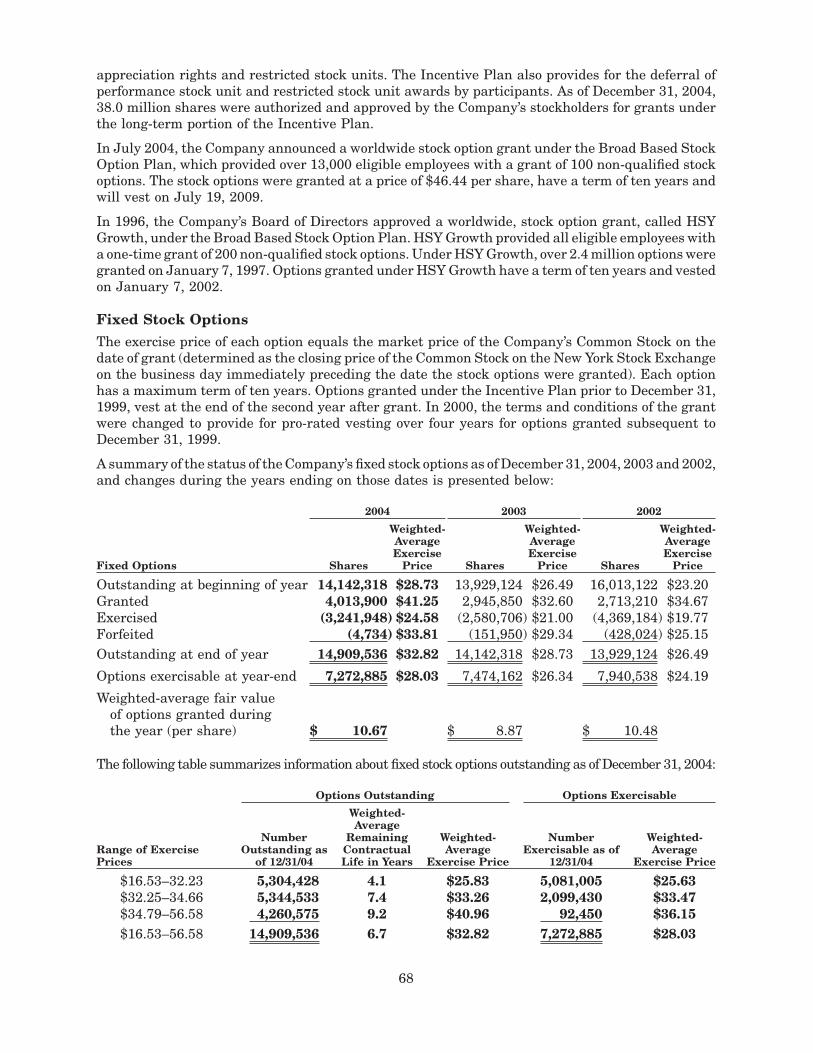
appreciation rights and restricted stock units. The Incentive Plan also provides for the deferral ofperformance stock unit and restricted stock unit awards by participants. As of December 31, 2004,38.0 million shares were authorized and approved by the Company’s stockholders for grants underthe long-term portion of the Incentive Plan.
In July 2004, the Company announced a worldwide stock option grant under the Broad Based StockOption Plan, which provided over 13,000 eligible employees with a grant of 100 non-qualified stockoptions. The stock options were granted at a price of $46.44 per share, have a term of ten years andwill vest on July 19, 2009.
In 1996, the Company’s Board of Directors approved a worldwide, stock option grant, called HSYGrowth, under the Broad Based Stock Option Plan. HSY Growth provided all eligible employees witha one-time grant of 200 non-qualified stock options. Under HSY Growth, over 2.4 million options weregranted on January 7, 1997. Options granted under HSY Growth have a term of ten years and vestedon January 7, 2002.
Fixed Stock OptionsThe exercise price of each option equals the market price of the Company’s Common Stock on thedate of grant (determined as the closing price of the Common Stock on the New York Stock Exchangeon the business day immediately preceding the date the stock options were granted). Each optionhas a maximum term of ten years. Options granted under the Incentive Plan prior to December 31,1999, vest at the end of the second year after grant. In 2000, the terms and conditions of the grantwere changed to provide for pro-rated vesting over four years for options granted subsequent toDecember 31, 1999.
A summary of the status of the Company’s fixed stock options as of December 31, 2004, 2003 and 2002,and changes during the years ending on those dates is presented below:
2004 2003 2002
Fixed Options Shares
Weighted-AverageExercise
Price Shares
Weighted-AverageExercise
Price Shares
Weighted-AverageExercise
Price
Outstanding at beginning of year 14,142,318 $28.73 13,929,124 $26.49 16,013,122 $23.20Granted 4,013,900 $41.25 2,945,850 $32.60 2,713,210 $34.67Exercised (3,241,948) $24.58 (2,580,706) $21.00 (4,369,184) $19.77Forfeited (4,734) $33.81 (151,950) $29.34 (428,024) $25.15Outstanding at end of year 14,909,536 $32.82 14,142,318 $28.73 13,929,124 $26.49
Options exercisable at year-end 7,272,885 $28.03 7,474,162 $26.34 7,940,538 $24.19
Weighted-average fair valueof options granted duringthe year (per share) $ 10.67 $ 8.87 $ 10.48
The following table summarizes information about fixed stock options outstanding as of December 31, 2004:
Options Outstanding Options Exercisable
Range of ExercisePrices
NumberOutstanding as
of 12/31/04
Weighted-Average
RemainingContractualLife in Years
Weighted-Average
Exercise Price
NumberExercisable as of
12/31/04
Weighted-Average
Exercise Price
$16.53–32.23 5,304,428 4.1 $25.83 5,081,005 $25.63$32.25–34.66 5,344,533 7.4 $33.26 2,099,430 $33.47$34.79–56.58 4,260,575 9.2 $40.96 92,450 $36.15$16.53–56.58 14,909,536 6.7 $32.82 7,272,885 $28.03
68
Performance Stock Units and Restricted Stock Units
Under the long-term portion of the Incentive Plan, each February the Company grants selectedexecutives and other key employees performance stock units whose vesting is contingent upon theachievement of certain performance objectives. If at the end of the applicable three-year performancecycle targets for financial measures are met, the full number of shares is awarded to the participants.The performance scores for 2004 grants of performance stock units can range from 0% to 250% ofthe targeted amounts. Restricted stock units were awarded in 2004, 2003 and 2002 under the long-term portion of the Incentive Plan to certain executive officers and other key employees. Restrictedstock units were also awarded quarterly to non-employee directors of the Company as part of theDirectors’ Compensation Plan. The compensation amount charged against income for performanceand restricted stock units was $24.3 million, $7.2 million and $6.4 million for 2004, 2003 and 2002,respectively. The compensation cost associated with the performance stock units is recognized ratablyover the three-year term based on the year-end market value of the stock, except for the 2003 grants.An additional three-year vesting term was imposed for the 2003 grants with accelerated vesting forretirement, disability or death. The compensation cost for the 2003 grants is being recognized overa period from three to six years. The compensation cost associated with employee restricted stockunits is recognized over a specified restriction period based on the year-end market value of the stock.The compensation cost associated with non-employee director restricted stock units is recognized atthe grant date and adjusted based on the year-end market value of the stock.
Performance stock units and restricted stock units granted for potential future distribution wereas follows:
For the years ended December 31, 2004 2003 2002
Shares granted 332,162 228,224 121,230Weighted-average fair value at date of grant $40.53 $33.17 $33.40
Deferred performance stock units, deferred restricted stock units, deferred directors’ fees andaccumulated dividend amounts totaled 609,217 shares as of December 31, 2004.
No stock appreciation rights were outstanding as of December 31, 2004.
17. SUPPLEMENTAL BALANCE SHEET INFORMATION
Accounts Receivable—Trade
In the normal course of business, the Company extends credit to customers that satisfy pre-definedcredit criteria. The Company believes that it has little concentration of credit risk due to the diversityof its customer base. As of December 31, 2004, McLane Company, Inc., one of the largest wholesaledistributors in the United States to convenience stores, drug stores, wholesale clubs and massmerchandisers, accounted for approximately 13% of the Company’s total accounts receivable. As ofDecember 31, 2004, no other customer accounted for more than 10% of the Company’s total accountsreceivable. Receivables, as shown on the Consolidated Balance Sheets, were net of allowances andanticipated discounts of $17.6 million and $21.1 million as of December 31, 2004 and 2003,respectively. The lower amount as of December 31, 2004, was principally related to a reduction inthe allowance for doubtful accounts of $5.0 million upon resolution of most significant matters relatedto the bankruptcy of Fleming Companies, Inc. An increase in the allowance for doubtful accounts of$5.0 million as of December 31, 2003, had been recorded to cover estimated exposure to thebankruptcy announced in early 2003.
Inventories
The Company values the majority of its inventories under the last-in, first-out (“LIFO”) method andthe remaining inventories at the lower of first-in, first-out (“FIFO”) cost or market. Inventoriesinclude material, labor and overhead. LIFO cost of inventories valued using the LIFO method was
69
$369.9 million and $321.0 million as of December 31, 2004 and 2003, respectively, and inventorieswere stated at amounts that did not exceed realizable values. Total inventories were as follows:
December 31, 2004 2003
In thousands of dollarsRaw materials $166,813 $158,859Goods in process 70,440 53,744Finished goods 384,094 327,415Inventories at FIFO 621,347 540,018Adjustment to LIFO (64,167) (47,159)Total inventories $557,180 $492,859
Property Plant and Equipment
Property, plant and equipment balances included construction in progress of $74.8 million and $153.7million as of December 31, 2004 and 2003, respectively. Net write-downs of property, plant andequipment of $5.7 million were recorded as a result of asset impairments associated with theCompany’s business realignment initiatives recorded in the fourth quarter of 2003. These initiativesincluded realigning the sales organizations and streamlining the supply chain by divesting oreliminating certain non-strategic brands and products and by product line rationalization. Majorclasses of property, plant and equipment were as follows:
December 31, 2004 2003
In thousands of dollarsLand $ 84,563 $ 78,744Buildings 688,642 633,362Machinery and equipment 2,595,997 2,514,917Property, plant and equipment, gross 3,369,202 3,227,023Accumulated depreciation (1,686,504) (1,565,084)Property, plant and equipment, net $ 1,682,698 $ 1,661,939
Certain real estate with a net realizable value of $7.0 million and $1.5 million was being held for saleas of December 31, 2004 and 2003, respectively. These assets were associated with the closure offacilities as part of the Company’s business realignment initiatives.
Goodwill and Other Intangible Assets
Goodwill and intangible assets were as follows:
December 31, 2004 2003
In thousands of dollarsUnamortized intangible assets:
Goodwill $463,947 $388,960
Trademarks $100,335 $ 31,593Amortized intangible assets, gross:
Customer-related 18,567 —Patents 8,317 8,317
Total other intangible assets, gross 127,219 39,910Accumulated amortization (1,986) (1,399)Other intangibles $125,233 $ 38,511
Goodwill increased $82.9 million as a result of the acquisition of the Grupo Lorena and Mauna Loabusinesses and $5.1 million as a result of currency translation adjustments. These increases werepartially offset by a $12.6 million adjustment to goodwill as a result of the adjustment to the Federal
70
and state tax contingencies. The increases in trademarks and customer-related intangible assetswere also due to the Grupo Lorena and Mauna Loa acquisitions. The useful lives of trademarks weredetermined to be indefinite and, therefore, these assets are not being amortized. Customer-relatedintangible assets are being amortized over their estimated useful lives of approximately ten years.Patents are being amortized over their remaining legal lives of approximately sixteen years. Totalamortization expense for other intangible assets was $.6 million, $.5 million and $.5 million in 2004,2003 and 2002, respectively. The estimated aggregate amortization expense will be approximately$2.3 million on an annual basis over the next five years based upon the preliminary purchase priceallocations as of December 31, 2004.
Accrued Liabilities
Accrued liabilities were as follows:
December 31, 2004 2003
In thousands of dollarsPayroll, compensation and benefits $146,515 $127,222Advertising and promotion 218,376 191,382Other 107,205 97,577Total accrued liabilities $472,096 $416,181
Other Long-term Liabilities
Other long-term liabilities were as follows:
December 31, 2004 2003
In thousands of dollarsAccrued post-retirement benefits $231,967 $232,398Other 171,389 138,378Total other long-term liabilities $403,356 $370,776
18. SEGMENT INFORMATION
The Company operates as a single reportable segment, encompassing the manufacture, distributionand sale of confectionery, snack, refreshment and grocery products. The Company’s five operatingsegments are comprised of geographic areas including the United States, Canada, Mexico, Brazil andthe combination of the Company’s other international operations. For purposes of segment reporting,the Company’s operations in the Americas, the United States, Canada, Mexico and Brazil, have beenaggregated in accordance with the criteria of Statement of Financial Accounting Standards No. 131,“Disclosures about Segments of an Enterprise and Related Information.” The Company’s operationsin the Americas were aggregated on the basis of their similar economic characteristics and thesimilarity of their products and services, production processes, types or classes of customers for theirproducts and services, methods used to distribute products and the nature of the regulatoryenvironments. The Company’s other international operations were aggregated with its operationsin the Americas to form one reportable segment, since the other international operations combinedshare most of the aggregation criteria and represent less than 10% of consolidated revenues,operating profits and assets. Consolidated net sales represented primarily sales of confectionery andsnack products.
The Company’s principal operations and markets are located in the United States. The Companymanufactures, markets, sells and distributes confectionery and grocery products in Canada, Mexicoand Brazil, imports and/or markets selected confectionery products in the Philippines, Japan andSouth Korea and markets confectionery products in over 60 countries worldwide. Net sales and long-lived assets of businesses outside of the United States were not significant.
71

Sales to McLane Company, Inc. exceeded 10% of total net sales and approximated $1.1 billion and$930.1 million in 2004 and 2003, respectively. Sales to Wal-Mart Stores, Inc. and subsidiariesexceeded 10% of total net sales in 2002 and amounted to approximately $857.9 million.
19. QUARTERLY DATA (Unaudited)
Summary quarterly results were as follows:
Year 2004 First Second Third Fourth
In thousands of dollars except per share amounts
Net sales $1,013,089 $893,688 $1,254,508 $1,267,963Gross profit 387,457 360,484 498,100 503,676Net income 107,147 147,217 166,229 170,286
Per share—Basic—Common(a) .42 .58 .68 .71Per share—Basic—Class B .38 .53 .62 .64Per share—Diluted(a) .41 .56 .66 .68
Year 2003 First Second Third Fourth
In thousands of dollars except per share amounts
Net sales $953,162 $849,115 $1,191,019 $1,179,255Gross profit 356,283 333,745 466,834 470,963Income before cumulative effect of
accounting change 97,558 71,484 150,972 144,938Per share—Basic—Common .37 .28 .59 .57Per share—Basic—Class B(a) .34 .25 .54 .52Per share—Diluted(a) .36 .27 .57 .55
Net income 97,558 71,484 143,604 144,938Per share—Basic—Common(a) .37 .28 .57 .57Per share—Basic—Class B(a) .34 .25 .51 .52Per share—Diluted .36 .27 .55 .55
(a) Quarterly income per share amounts do not total to the annual amounts due to changes in weighted-average sharesoutstanding during the year.
Item 9. CHANGES IN AND DISAGREEMENTS WITH ACCOUNTANTS ONACCOUNTING AND FINANCIAL DISCLOSURE
None.
72
Item 9A. CONTROLS AND PROCEDURES
As required by Rule 13a-15 under the Securities Exchange Act of 1934 (the “Exchange Act”), theCompany conducted an evaluation of the effectiveness of the design and operation of the Company’sdisclosure controls and procedures as of December 31, 2004. This evaluation was carried outunder the supervision and with the participation of the Company’s management, including theCompany’s Chief Executive Officer and Chief Financial Officer. Based upon that evaluation, theChief Executive Officer and Chief Financial Officer concluded that the Company’s disclosurecontrols and procedures are effective. There has been no change during the most recent fiscal quarterin the Company’s internal control over financial reporting identified in connection with the evaluationthat has materially affected, or is likely to materially affect, the Company’s internal control overfinancial reporting.
Disclosure controls and procedures are controls and other procedures that are designed to ensure thatinformation required to be disclosed in the Company’s reports filed or submitted under the ExchangeAct is recorded, processed, summarized and reported within the time periods specified in theSecurities and Exchange Commission’s rules and forms. Disclosure controls and procedures include,without limitation, controls and procedures designed to ensure that information required to bedisclosed in the Company’s reports filed under the Exchange Act is accumulated and communicatedto management, including the Company’s Chief Executive Officer and Chief Financial Officer, asappropriate, to allow timely decisions regarding required disclosure.
The Company’s Common Stock is listed on the New York Stock Exchange (“NYSE”) under the tickersymbol “HSY.” On May 4, 2004, the Company’s Chief Executive Officer, Richard H. Lenny, certifiedto the NYSE pursuant to Rule 303A.12(a) that, as of the date of that certification, he was not awareof any violation by the Company of the NYSE’s Corporate Governance listing standards.
MANAGEMENT REPORT ON INTERNAL CONTROL OVER FINANCIAL REPORTING
The management of Hershey Foods Corporation is responsible for establishing and maintainingadequate internal control over financial reporting, as such term is defined in Exchange Act Rule 13a-15(f). The Company’s internal control system was designed to provide reasonable assurance to theCompany’s management and Board of Directors regarding the preparation and fair presentation ofpublished financial statements.
All internal control systems, no matter how well designed, have inherent limitations. Therefore, eventhose systems determined to be effective can provide only reasonable assurance with respect tofinancial statement preparation and presentation.
The Company’s management, including the Company’s Chief Executive Officer and Chief FinancialOfficer, assessed the effectiveness of the Company’s internal control over financial reporting as ofDecember 31, 2004. In making this assessment, the Company’s management used the criteria setforth by the Committee of Sponsoring Organizations of the Treadway Commission (COSO) in InternalControl—Integrated Framework. Based on this assessment, management believes that, as ofDecember 31, 2004, the Company’s internal control over financial reporting was effective based onthose criteria.
KPMG LLP, an independent registered public accounting firm, has issued an audit report onmanagement’s assessment of the Company’s internal control over financial reporting. This reportappears on page 74.
Richard H. LennyChairman of the Board, Presidentand Chief Executive Officer
David J. WestSenior Vice PresidentChief Financial Officer
73
REPORT OF INDEPENDENT REGISTERED PUBLIC ACCOUNTING FIRM
The Board of Directors and StockholdersHershey Foods Corporation:
We have audited management’s assessment, included in the accompanying Management Report onInternal Control Over Financial Reporting, that Hershey Foods Corporation and subsidiaries (the“Corporation”) maintained effective internal control over financial reporting as of December 31, 2004,based on criteria established in Internal Control-Integrated Framework issued by the Committee ofSponsoring Organizations of the Treadway Commission (COSO). The Corporation’s management isresponsible for maintaining effective internal control over financial reporting and for its assessmentof the effectiveness of internal control over financial reporting. Our responsibility is to express anopinion on management’s assessment and an opinion on the effectiveness of the Corporation’sinternal control over financial reporting based on our audit.
We conducted our audit in accordance with the standards of the Public Company AccountingOversight Board (United States). These standards require that we plan and perform the audit toobtain reasonable assurance about whether effective internal control over financial reporting wasmaintained in all material respects. Our audit included obtaining an understanding of internalcontrol over financial reporting, evaluating management’s assessment, testing and evaluating thedesign and operating effectiveness of internal control, and performing such other procedures as weconsidered necessary in the circumstances. We believe that our audit provides a reasonable basis forour opinion.
A company’s internal control over financial reporting is a process designed to provide reasonableassurance regarding the reliability of financial reporting and the preparation of financial statementsfor external purposes in accordance with generally accepted accounting principles. A company’sinternal control over financial reporting includes those policies and procedures that (1) pertain to themaintenance of records that, in reasonable detail, accurately and fairly reflect the transactions anddispositions of the assets of the company; (2) provide reasonable assurance that transactions arerecorded as necessary to permit preparation of financial statements in accordance with generallyaccepted accounting principles, and that receipts and expenditures of the company are being madeonly in accordance with authorizations of management and directors of the company; and (3) providereasonable assurance regarding prevention or timely detection of unauthorized acquisition, use, ordisposition of the company’s assets that could have a material effect on the financial statements.
Because of its inherent limitations, internal control over financial reporting may not prevent or detectmisstatements. Also, projections of any evaluation of effectiveness to future periods are subject tothe risk that controls may become inadequate because of changes in conditions, or that the degreeof compliance with the policies or procedures may deteriorate.
In our opinion, management’s assessment that the Corporation maintained effective internal controlover financial reporting as of December 31, 2004, is fairly stated, in all material respects based oncriteria established in Internal Control-Integrated Framework issued by COSO. Also in our opinion,the Corporation maintained, in all material respects, effective internal control over financialreporting as of December 31, 2004, based on criteria established in Internal Control-IntegratedFramework issued by COSO.
We also have audited, in accordance with the standards of the Public Company Accounting OversightBoard (United States), the consolidated balance sheets of the Corporation as of December 31, 2004and 2003, and the related consolidated statements of income, cash flows and stockholders’ equity foreach of the years in the three-year period ended December 31, 2004, and our report dated March 3,2005 expressed an unqualified opinion on those consolidated financial statements.
New York, New YorkMarch 3, 2005
74
Item 9B. OTHER INFORMATION
On December 7, 2004, the Board of Directors, following a review of benchmark data, approved anincrease in the quarterly restricted stock unit (“RSU”) component of the Directors’ CompensationPlan to the number of shares of Common Stock, valued at the average closing price on the New YorkStock Exchange of the Common Stock on the three days preceding the grant, equal to $20,000, from$15,000, effective January 1, 2005. RSUs are granted to directors on the first day of January, April,July and October.
On December 6, 2004, the Compensation and Executive Organization Committee of the Board ofDirectors approved changes to the compensation of Mr. David J. West in recognition of his promotionto Senior Vice President, Chief Financial Officer effective January 1, 2005. As of January 1, 2005,Mr. West’s base salary was increased from $415,000 to $450,000, his target percentage under theAnnual Incentive Program of the Incentive Plan was increased, and he was granted 6,000 additionalstock options under the Incentive Plan. He was also granted, effective December 6, 2004, anadditional 2,150 contingent PSUs under the Incentive Plan for the 2004-2006 performance cycle, withany award to be determined under the performance factors applicable to that performance cycle,namely, (i) the Company’s earnings per share-diluted growth (three-year compound annual growthrate) measured against an internal target and measured against the earnings per share-dilutedgrowth (three-year compound annual growth rate) of a peer group of 16 food, beverage and consumerpackaged goods companies and (ii) the cumulative three-year improvement in the Company’seconomic return on invested capital measured against an internal target.
75
PART III
Item 10. DIRECTORS AND EXECUTIVE OFFICERS OF THE REGISTRANT
The names, ages, positions held with the Company, periods of service as a director, principaloccupations, business experience and other directorships of nominees for director of the Companyare set forth in the Proxy Statement in the section entitled “Election of Directors,” which informationis incorporated herein by reference.
Executive Officers of the Company as of February 22, 2005
Name Age Positions Held During the Last Five Years
R. H. Lenny(1) 53 Chairman of the Board, President and Chief Executive Officer (2002);President and Chief Executive Officer (2001)
M. K. Arline 52 Senior Vice President, Chief People Officer (2004); Senior VicePresident, Human Resources and Corporate Affairs (2002);Senior Vice President, Human Resources (2002); Vice President,Human Resources (2001); Vice President, Quality and RegulatoryCompliance (1999)
C. J. Baldwin(2) 42 Senior Vice President, Global Chief Customer Officer (2004)J. P. Bilbrey(3) 48 Senior Vice President, President Hershey International (2003)R. Brace 61 Senior Vice President, Operations (2004); Vice President, Operations
and Technology (2002); Vice President, Conversion and Procurement(2000); Senior Vice President, Operations (1999)
T. K. Hernquist(4) 46 Senior Vice President, Chief Marketing Officer (2003)B. H. Snyder 57 Senior Vice President, General Counsel and Secretary (2003); General
Counsel, Secretary, and Senior Vice President, International (2002);Senior Vice President—Public Affairs, General Counsel and Secretary(2002); Vice President and Assistant General Counsel (2000);Assistant General Counsel (1993)
D. J. West(5) 41 Senior Vice President, Chief Financial Officer (2004); Senior VicePresident, Chief Customer Officer (2004); Senior Vice President, Sales(2002); Senior Vice President, Business Planning and Development(2002); Vice President, Business Planning and Development (2001)
C. D. Azzara 50 Vice President, Global Research and Development (2004); VicePresident, Research and Development (2002); Director, Confectionery/Reduced Fat and Calorie Product Development (2001); AssociateDirector, Product Development (1999)
G. F. Davis(6) 56 Vice President, Chief Information Officer (2000)D. N. Eshleman 50 Vice President, Strategy and Innovation (2002); Vice President
Marketing, Brand Integration (2002); Vice President Marketing, NewProducts (2000); Vice President Marketing, Grocery Products (1999)
D. W. Tacka 51 Vice President and Chief Accounting Officer (2004); Vice President,Corporate Controller and Chief Accounting Officer (2000); CorporateController and Chief Accounting Officer (1995)
There are no family relationships among any of the above-named officers of the Company.(1) Mr. Lenny was elected President and Chief Executive Officer effective March 12, 2001. Prior to joining the Company
he was Group Vice President, Kraft Foods, Inc. and President, Nabisco Biscuit and Snacks (2001); President, NabiscoBiscuit Company (1998).
(2) Mr. Baldwin was elected Senior Vice President, Global Chief Customer Officer effective October 25, 2004. Prior to joiningthe Company he was National Vice President, Field Sales and Logistics, Kraft Foods, Inc. (2004); National Vice PresidentSales and Logistics, Direct Store Delivery—Kraft Foods (2003); Vice President, Sales and Integrated Logistics, NabiscoBiscuit (2002); Vice President, Sales, Nabisco Biscuit and Snacks (2001); Customer Vice President, West, Nabisco BiscuitCompany (1999).
76
(3) Mr. Bilbrey was elected Senior Vice President, President Hershey International effective November 5, 2003. Prior tojoining the Company he was Executive Vice President, Sales—Mission Foods (2003); President and Chief ExecutiveOfficer—Danone Waters of North America, Inc., a division of Groupe Danone, Paris (2001); Executive Vice President,Retail Sales, North America—Danone Waters of North America, Inc., a division of Groupe Danone, Paris (2000); Ownerand Operator, Commercial Cattle Operations—Bilbrey Farms and Ranch (1999).
(4) Mr. Hernquist was elected Senior Vice President, Chief Marketing Officer effective April 28, 2003. Prior to joining theCompany he was Senior Vice President, Marketing—Jim Beam Brands, Fortune Brands (2002); President and ChiefExecutive Officer—Sierra On-line, Vivendi Universal (2001); Senior Vice President, Marketing—Nabisco BiscuitCompany (2000).
(5) Mr. West was elected Vice President, Business Planning and Development effective May 30, 2001. Prior to joining theCompany he was Senior Vice President Finance, Kraft Foods—Nabisco Biscuit, Confectionery and Snacks (2001); SeniorVice President and Chief Financial Officer, Nabisco Biscuit Company (1999).
(6) Mr. Davis was elected Vice President, Chief Information Officer effective December 14, 2000. Prior to joining theCompany Mr. Davis was Vice President—Global Infrastructure Services, Computer Sciences Corporation (2000);Director—Global Infrastructure Services, Computer Sciences Corporation (1999).
Executive Officers are generally elected each year at the organization meeting of the Board in April.
Information regarding the identification of the Audit Committee as a separately-designated standingcommittee of the Board is set forth in the Proxy Statement in the section entitled “BoardCommittees,” and information regarding the status of one or more members of the Audit Committeebeing an “audit committee financial expert” is set forth in the Proxy Statement in the section entitled“Audit Committee Report,” which information is incorporated herein by reference.
Reporting of any inadvertent late filings under Section 16(a) of the Securities Exchange Act of 1934,as amended, is set forth in the section of the Proxy Statement entitled “Section 16(a) BeneficialOwnership Reporting Compliance.” This information is incorporated herein by reference.
Information regarding the Company’s Code of Ethical Business Conduct applicable to the Company’sdirectors, officers and employees is set forth in Part I of this Annual Report on Form 10-K, underthe heading “Available Information.”
Item 11. EXECUTIVE COMPENSATION
Information concerning compensation of each of the named executive officers, including the ChiefExecutive Officer, of the Company during 2004, and compensation of directors, is set forth in thesections entitled, respectively, “2004 Executive Compensation” and “Directors’ Compensation” in theProxy Statement, which information is incorporated herein by reference.
77
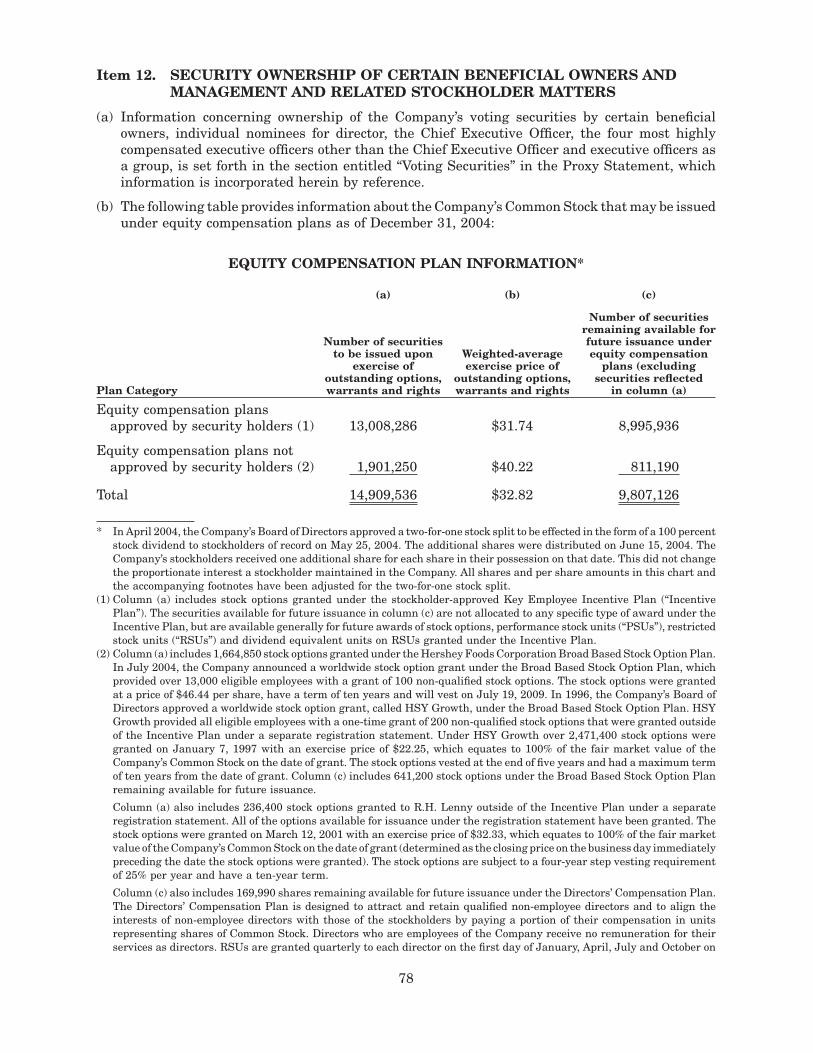
Item 12. SECURITY OWNERSHIP OF CERTAIN BENEFICIAL OWNERS ANDMANAGEMENT AND RELATED STOCKHOLDER MATTERS
(a) Information concerning ownership of the Company’s voting securities by certain beneficialowners, individual nominees for director, the Chief Executive Officer, the four most highlycompensated executive officers other than the Chief Executive Officer and executive officers asa group, is set forth in the section entitled “Voting Securities” in the Proxy Statement, whichinformation is incorporated herein by reference.
(b) The following table provides information about the Company’s Common Stock that may be issuedunder equity compensation plans as of December 31, 2004:
EQUITY COMPENSATION PLAN INFORMATION*
(a) (b) (c)
Plan Category
Number of securitiesto be issued upon
exercise ofoutstanding options,warrants and rights
Weighted-averageexercise price of
outstanding options,warrants and rights
Number of securitiesremaining available forfuture issuance underequity compensation
plans (excludingsecurities reflected
in column (a)
Equity compensation plansapproved by security holders (1) 13,008,286 $31.74 8,995,936
Equity compensation plans notapproved by security holders (2) 1,901,250 $40.22 811,190
Total 14,909,536 $32.82 9,807,126
* In April 2004, the Company’s Board of Directors approved a two-for-one stock split to be effected in the form of a 100 percentstock dividend to stockholders of record on May 25, 2004. The additional shares were distributed on June 15, 2004. TheCompany’s stockholders received one additional share for each share in their possession on that date. This did not changethe proportionate interest a stockholder maintained in the Company. All shares and per share amounts in this chart andthe accompanying footnotes have been adjusted for the two-for-one stock split.
(1) Column (a) includes stock options granted under the stockholder-approved Key Employee Incentive Plan (“IncentivePlan”). The securities available for future issuance in column (c) are not allocated to any specific type of award under theIncentive Plan, but are available generally for future awards of stock options, performance stock units (“PSUs”), restrictedstock units (“RSUs”) and dividend equivalent units on RSUs granted under the Incentive Plan.
(2) Column (a) includes 1,664,850 stock options granted under the Hershey Foods Corporation Broad Based Stock Option Plan.In July 2004, the Company announced a worldwide stock option grant under the Broad Based Stock Option Plan, whichprovided over 13,000 eligible employees with a grant of 100 non-qualified stock options. The stock options were grantedat a price of $46.44 per share, have a term of ten years and will vest on July 19, 2009. In 1996, the Company’s Board ofDirectors approved a worldwide stock option grant, called HSY Growth, under the Broad Based Stock Option Plan. HSYGrowth provided all eligible employees with a one-time grant of 200 non-qualified stock options that were granted outsideof the Incentive Plan under a separate registration statement. Under HSY Growth over 2,471,400 stock options weregranted on January 7, 1997 with an exercise price of $22.25, which equates to 100% of the fair market value of theCompany’s Common Stock on the date of grant. The stock options vested at the end of five years and had a maximum termof ten years from the date of grant. Column (c) includes 641,200 stock options under the Broad Based Stock Option Planremaining available for future issuance.
Column (a) also includes 236,400 stock options granted to R.H. Lenny outside of the Incentive Plan under a separateregistration statement. All of the options available for issuance under the registration statement have been granted. Thestock options were granted on March 12, 2001 with an exercise price of $32.33, which equates to 100% of the fair marketvalue of the Company’s Common Stock on the date of grant (determined as the closing price on the business day immediatelypreceding the date the stock options were granted). The stock options are subject to a four-year step vesting requirementof 25% per year and have a ten-year term.
Column (c) also includes 169,990 shares remaining available for future issuance under the Directors’ Compensation Plan.The Directors’ Compensation Plan is designed to attract and retain qualified non-employee directors and to align theinterests of non-employee directors with those of the stockholders by paying a portion of their compensation in unitsrepresenting shares of Common Stock. Directors who are employees of the Company receive no remuneration for theirservices as directors. RSUs are granted quarterly to each director on the first day of January, April, July and October on
78
the basis of the number of shares of Common Stock, valued at the average closing price on the New York Stock Exchangeof the Common Stock on the last three trading days preceding the grant, equal to $15,000. While the value of the annualRSU grant is targeted at $60,000, the actual value of the grant may be higher or lower depending upon the performanceof the Common Stock following the grant dates. Beginning January 1, 2005, the target for the annual RSU grant wasincreased to $80,000, with the quarterly grant equal to a value of $20,000. A director’s RSUs will vest and be distributedupon his or her retirement from the Board. Directors may elect to receive all or a portion of their retainer in cash or CommonStock, although committee chair fees are paid only in cash. A director may defer receipt of the retainer and committee chairfees until his or her retirement from the Board.
Item 13. CERTAIN RELATIONSHIPS AND RELATED TRANSACTIONS
Information concerning “Certain Relationships and Related Transactions” is set forth in the sectionentitled “Certain Transactions and Relationships” in the Proxy Statement, which information isincorporated herein by reference.
Item 14. PRINCIPAL ACCOUNTANT FEES AND SERVICES
Information concerning “Principal Accountant Fees and Services,” including the Pre-Approval PolicyRegarding Independent Auditor Services, is set forth in the section entitled “Independent AuditorFees” in the Proxy Statement, which information is incorporated herein by reference.
79
PART IV
Item 15. EXHIBITS AND FINANCIAL STATEMENT SCHEDULES
Item 15(a)(1): Financial Statements
The audited consolidated financial statements of the Company and its subsidiaries and the Reportof the Independent Registered Public Accounting Firm thereon, as required to be filed with thisreport, are set forth under Item 8 of this report.
Item 15(a)(2): Financial Statement Schedule
The following consolidated financial statement schedule of the Company and its subsidiaries for theyears ended December 31, 2004, 2003 and 2002 is filed herewith on the indicated page in responseto Item 15(c):
Schedule II—Valuation and Qualifying Accounts (Page 86)
Other schedules have been omitted as not applicable or required, or because information requiredis shown in the consolidated financial statements or notes thereto.
Financial statements of the parent company only are omitted because the Company is primarily anoperating company and there are no significant restricted net assets of consolidated andunconsolidated subsidiaries.
Item 15(a)(3): Exhibits
The following items are attached or incorporated by reference in response to Item 15(c):
(3) Articles of Incorporation and By-laws
The Company’s Restated Certificate of Incorporation, as amended, is incorporated byreference from Exhibit 3 to the Company’s Quarterly Report on Form 10-Q for the quarterended April 3, 1988. The By-laws, as amended and restated as of December 1, 1998, areincorporated by reference from Exhibit 3 to the Company’s Annual Report on Form 10-Kfor the fiscal year ended December 31, 1998.
(4) Instruments defining the rights of security holders, including indentures
a. Stockholder Protection Rights Agreement between Hershey Foods Corporation andMellon Investor Services LLC, as Rights Agent, dated December 14, 2000, isincorporated by reference from Exhibit 4.1 to the Company’s Annual Report onForm 10-K for the fiscal year ended December 31, 2000.
b. The Company has issued certain long-term debt instruments, no one class of whichcreates indebtedness exceeding 10% of the total assets of the Company and itssubsidiaries on a consolidated basis. These classes consist of the following:
1) 6.7% Notes due 2005
2) 6.95% Notes due 2007
3) 6.95% Notes due 2012
4) 8.8% Debentures due 2021
5) 7.2% Debentures due 2027
6) Obligations Associated with Consolidation of Lease Arrangements
7) Other Obligations
80
The Company will furnish copies of the above debt instruments to the Commission upon request.
(10) Material contracts
a. Kit Kat and Rolo License Agreement (the “License Agreement”) between HersheyFoods Corporation and Rowntree Mackintosh Confectionery Limited is incorporatedby reference from Exhibit 10(a) to the Company’s Annual Report on Form 10-K forthe fiscal year ended December 31, 1980. The License Agreement was amended in1988 and the Amendment Agreement is incorporated by reference from Exhibit 19to the Company’s Quarterly Report on Form 10-Q for the quarter ended July 3, 1988.The License Agreement was assigned by Rowntree Mackintosh ConfectioneryLimited to Societe des Produits Nestle SA as of January 1, 1990. The AssignmentAgreement is incorporated by reference from Exhibit 19 to the Company’s AnnualReport on Form 10-K for the fiscal year ended December 31, 1990.
b. Peter Paul/York Domestic Trademark & Technology License Agreement betweenHershey Foods Corporation and Cadbury Schweppes Inc. (now Cadbury BeveragesDelaware, Inc.) dated August 25, 1988, is incorporated by reference from Exhibit 2(a)to the Company’s Current Report on Form 8-K dated September 8, 1988. Thisagreement was assigned by the Company to its wholly-owned subsidiary, HersheyChocolate & Confectionery Corporation.
c. Cadbury Trademark & Technology License Agreement between Hershey FoodsCorporation and Cadbury Limited dated August 25, 1988, is incorporated byreference from Exhibit 2(a) to the Company’s Current Report on Form 8-K datedSeptember 8, 1988. This agreement was assigned by the Company to its wholly-owned subsidiary, Hershey Chocolate & Confectionery Corporation.
d. Trademark and Technology License Agreement between Huhtamaki and HersheyFoods Corporation dated December 30, 1996, is incorporated by reference fromExhibit 10 to the Company’s Current Report on Form 8-K dated February 26, 1997.This agreement was assigned by the Company to its wholly-owned subsidiary,Hershey Chocolate & Confectionery Corporation. The agreement was amended andrestated in 1999 and the Amended and Restated Trademark and Technology LicenseAgreement is incorporated by reference from Exhibit 10.2 to the Company’s AnnualReport on Form 10-K for the fiscal year ended December 31, 1999.
e. Stock Purchase Agreement between Hershey Trust Company, as Trustee of theMilton Hershey School Trust, and Hershey Foods Corporation, dated July 27, 2004,is incorporated by reference from Exhibit 10.1 to the Company’s Quarterly Reporton Form 10-Q for the quarter ended October 3, 2004.
f. Five Year Credit Agreement dated as of November 12, 2004 among Hershey FoodsCorporation and the banks, financial institutions and other institutional lenderslisted on the respective signature pages thereof (“Lenders”), Citibank, N.A., asadministrative agent for the Lenders (as defined therein), Bank of America, N.A., assyndication agent, UBS Loan Finance LLC, as documentation agent, and CitigroupGlobal Markets, Inc. and Banc of America Securities LLC, as joint lead arrangersand joint book managers is incorporated by reference from Exhibit 10.1 to theCompany’s Current Report on Form 8-K, filed November 16, 2004.
Executive Compensation Plans and Management Contracts
g. Hershey Foods Corporation’s Amended and Restated Key Employee Incentive Planis incorporated by reference from Exhibit 10.1 to the Company’s Quarterly Reporton Form 10-Q for the quarter ended September 29, 2002.
81
h. Terms and Conditions of Nonqualified Stock Option Grants under the Key EmployeeIncentive Plan is incorporated by reference from Exhibit 10.1 to the Company’s CurrentReport on Form 8-K filed February 18, 2005.
i. The Long-Term Incentive Program Participation Agreement is incorporated by reference fromExhibit 10.2 to the Company’s Current Report on Form 8-K filed February 18, 2005.
j. Hershey Foods Corporation’s Amended and Restated Deferred Compensation Plan isincorporated by reference from Exhibit 10.2 to the Company’s Quarterly Report on Form10-Q for the quarter ended September 29, 2002.
k. Hershey Foods Corporation’s Amended and Restated Supplemental ExecutiveRetirement Plan is incorporated by reference from Exhibit 10.2 to the Company’sAnnual Report on Form 10-K for the year ended December 31, 2003.
l. Hershey Foods Corporation’s Amended and Restated Directors’ Compensation Plan isincorporated by reference from Exhibit 10.2 to the Company’s Annual Report on Form10-K for the year ended December 31, 2002.
m. Hershey Foods Corporation’s Executive Benefits Protection Plan (Group 3A), asamended, covering certain of its executive officers, is incorporated by reference fromExhibit 10 to the Company’s Quarterly Report on Form 10-Q for the quarter endedJune 29, 2003.
n. The Separation Agreement and General Release entered into effective December 6,2002 between Hershey Foods Corporation and Wynn A. Willard is incorporated byreference from Exhibit 10.3 to the Company’s Annual Report on Form 10-K for the fiscalyear ended December 31, 2002.
o. The Executive Employment Agreement between Hershey Foods Corporation andRichard H. Lenny, dated March 12, 2001, is incorporated by reference from Exhibit 10.2to the Company’s Quarterly Report on Form 10-Q for the quarter ended April 1, 2001.
p. The Retirement Agreement and General Release between Hershey Foods Corporationand Frank Cerminara, dated October 21, 2004, is attached hereto and filed as Exhibit10.1.
q. A summary of certain compensation matters previously contained in the Company’sCurrent Report on Form 8-K filed February 18, 2005, is attached hereto and filed asExhibit 10.2.
Broad Based Equity Compensation Plans
r. Hershey Foods Corporation’s Broad Based Stock Option Plan, as amended, isincorporated by reference from Exhibit 10.4 to the Company’s Annual Report on Form10-K for the fiscal year ended December 31, 2002.
(12) Computation of ratio of earnings to fixed charges statement
A computation of ratio of earnings to fixed charges for the fiscal years ended December 31,2004, 2003, 2002, 2001 and 2000 is attached hereto and filed as Exhibit 12.
(21) Subsidiaries of the Registrant
A list setting forth subsidiaries of the Company is attached hereto and filed as Exhibit 21.
(23) Independent Auditors’ Consent
The consent dated March 7, 2005 to the incorporation of reports of the Company’sIndependent Auditors is attached hereto and filed as Exhibit 23.
(31.1) Certification of Richard H. Lenny, Chief Executive Officer, pursuant to Section 302 of theSarbanes-Oxley Act of 2002, is attached hereto and filed as Exhibit 31.1.
82

(31.2) Certification of David J. West, Chief Financial Officer, pursuant to Section 302 of theSarbanes-Oxley Act of 2002, is attached hereto and filed as Exhibit 31.2.
The following item is furnished with this report:
(32) Certification of Richard H. Lenny, Chief Executive Officer, and David J. West, ChiefFinancial Officer, pursuant to Section 906 of the Sarbanes-Oxley Act of 2002 is attachedhereto and furnished as Exhibit 32.
83
SIGNATURES
Pursuant to the requirements of Section 13 or 15(d) of the Securities ExchangeAct of 1934,the Company has duly caused this report to be signed on its behalf by the undersigned,thereunto duly authorized, this 7th day of March, 2005.
HERSHEY FOODS CORPORATION(Registrant)
By: /s/ D. J. WESTD. J. West
Senior Vice President, Chief Financial Officer
Pursuant to the requirements of the Securities Exchange Act of 1934, this report has beensigned below by the following persons on behalf of the Company and in the capacities and on thedate indicated.
Signature Title Date
/s/ R. H. LENNY Chief Executive Officer and Director March 7, 2005
(R. H. Lenny)
/s/ D. J. WEST Chief Financial Officer March 7, 2005
(D. J. West)
/s/ D. W. TACKA Chief Accounting Officer March 7, 2005
(D. W. Tacka)
/s/ J. A. BOSCIA Director March 7, 2005
(J. A. Boscia)
/s/ R. H. CAMPBELL Director March 7, 2005
(R. H. Campbell)
/s/ R. F. CAVANAUGH Director March 7, 2005
(R. F. Cavanaugh)
/s/ G. P. COUGHLAN Director March 7, 2005
(G. P. Coughlan)
/s/ H. EDELMAN Director March 7, 2005
(H. Edelman)
/s/ B. G. HILL Director March 7, 2005
(B. G. Hill)
/s/ M. J. MCDONALD Director March 7, 2005
(M. J. McDonald)
/s/ M. J. TOULANTIS Director March 7, 2005
(M. J. Toulantis)
84
REPORT OF INDEPENDENT REGISTERED PUBLIC ACCOUNTING FIRM
The Board of Directors and StockholdersHershey Foods Corporation:
Under date of March 3, 2005, we reported on the consolidated balance sheets of Hershey FoodsCorporation and subsidiaries as of December 31, 2004 and 2003, and the related consolidatedstatements of income, cash flows and stockholders’ equity for each of the years in the three-yearperiod ended December 31, 2004, which are included in Hershey Foods Corporation’s Annual Reporton Form 10-K. In connection with our audits of the aforementioned consolidated financial statements,we also audited the related financial statement schedule. This financial statement schedule is theresponsibility of the Company’s management. Our responsibility is to express an opinion on thisfinancial statement schedule based on our audit.
In our opinion, such financial statement schedule, when considered in relation to the basicconsolidated financial statements taken as a whole, presents fairly, in all material respects, theinformation set forth therein.
As discussed in Note 2 to the consolidated financial statements, the Corporation adopted FinancialAccounting Standards Board Interpretation No. 46, Consolidation of Variable Interest Entities, aninterpretation of ARB No. 51, on June 30, 2003.
/s/KPMG LLP
New York, New YorkMarch 3, 2005
85
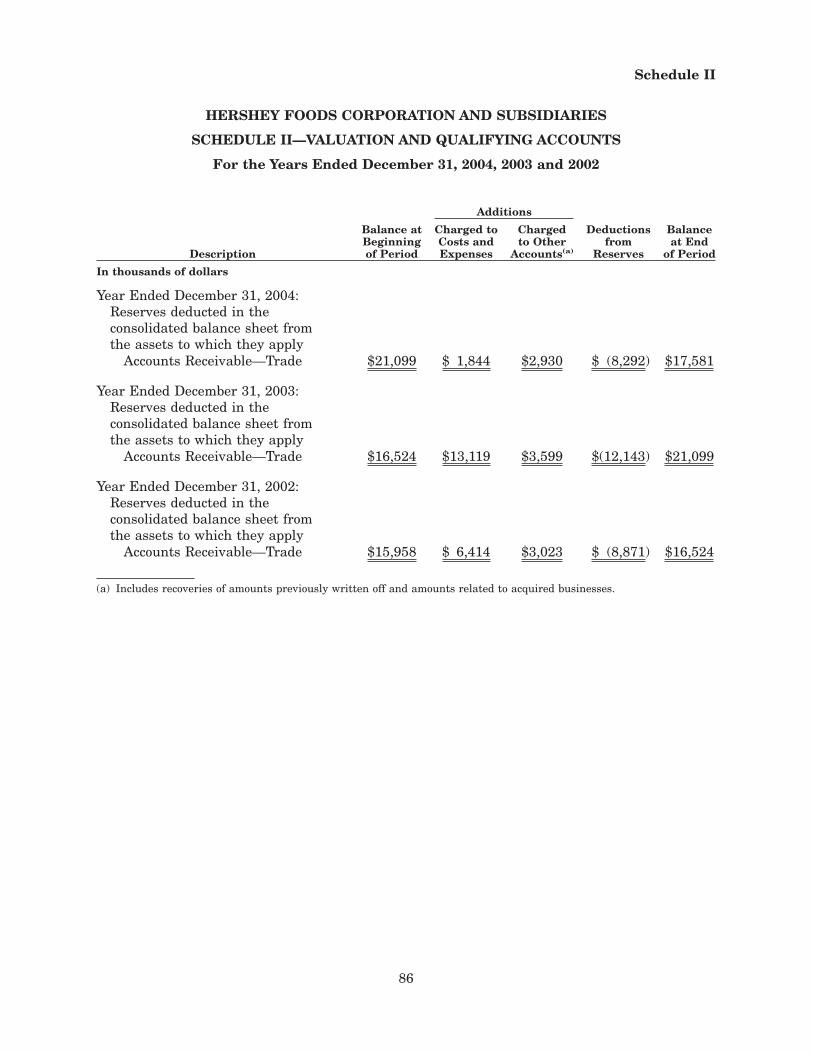
Schedule II
HERSHEY FOODS CORPORATION AND SUBSIDIARIES
SCHEDULE II—VALUATION AND QUALIFYING ACCOUNTS
For the Years Ended December 31, 2004, 2003 and 2002
Additions
Description
Balance atBeginningof Period
Charged toCosts andExpenses
Chargedto Other
Accounts(a)
Deductionsfrom
Reserves
Balanceat End
of Period
In thousands of dollars
Year Ended December 31, 2004:Reserves deducted in theconsolidated balance sheet fromthe assets to which they apply
Accounts Receivable—Trade $21,099 $ 1,844 $2,930 $ (8,292) $17,581
Year Ended December 31, 2003:Reserves deducted in theconsolidated balance sheet fromthe assets to which they apply
Accounts Receivable—Trade $16,524 $13,119 $3,599 $(12,143) $21,099
Year Ended December 31, 2002:Reserves deducted in theconsolidated balance sheet fromthe assets to which they apply
Accounts Receivable—Trade $15,958 $ 6,414 $3,023 $ (8,871) $16,524
(a) Includes recoveries of amounts previously written off and amounts related to acquired businesses.
86
CERTIFICATION
I, Richard H. Lenny, certify that:
1. I have reviewed this Annual Report on Form 10-K of Hershey Foods Corporation;
2. Based on my knowledge, this report does not contain any untrue statement of a material factor omit to state a material fact necessary to make the statements made, in light of thecircumstances under which such statements were made, not misleading with respect to theperiod covered by this report;
3. Based on my knowledge, the financial statements, and other financial information included inthis report, fairly present in all material respects the financial condition, results of operationsand cash flows of the registrant as of, and for, the periods presented in this report;
4. The registrant’s other certifying officer and I are responsible for establishing and maintainingdisclosure controls and procedures (as defined in Exchange Act Rules 13a-15(e) and 15d-15(e))and internal control over financial reporting (as defined in Exchange Act Rules 15(f) and 15d-15(f)) for the registrant and have:
(a) Designed such disclosure controls and procedures, or caused such disclosure controls andprocedures to be designed under our supervision, to ensure that material informationrelating to the registrant, including its consolidated subsidiaries, is made known to usby others within those entities, particularly during the period in which this report isbeing prepared;
(b) Designed such internal control over financial reporting, or caused such internal control overfinancial reporting to be designed under our supervision, to provide reasonable assuranceregarding the reliability of financial reporting and the preparation of financial statementsfor external purposes in accordance with generally accepted accounting principles;
(c) Evaluated the effectiveness of the registrant’s disclosure controls and procedures andpresented in this report our conclusions about the effectiveness of the disclosure controls andprocedures, as of the end of the period covered by this report based on such evaluation; and
(d) Disclosed in this report any change in the registrant’s internal control over financialreporting that occurred during the registrant’s most recent fiscal quarter that has materiallyaffected, or is reasonably likely to materially affect, the registrant’s internal control overfinancial reporting; and
5. The registrant’s other certifying officer and I have disclosed, based on our most recent evaluationof internal control over financial reporting, to the registrant’s auditors and the audit committeeof the registrant’s board of directors:
(a) All significant deficiencies and material weaknesses in the design or operation of internalcontrol over financial reporting which are reasonably likely to adversely affect theregistrant’s ability to record, process, summarize and report financial information; and
(b) Any fraud, whether or not material, that involves management or other employees who havea significant role in the registrant’s internal control over financial reporting.
Richard H. LennyChief Executive Officer
March 7, 2005
87
CERTIFICATION
I, David J. West, certify that:
1. I have reviewed this Annual Report on Form 10-K of Hershey Foods Corporation;
2. Based on my knowledge, this report does not contain any untrue statement of a material factor omit to state a material fact necessary to make the statements made, in light of thecircumstances under which such statements were made, not misleading with respect to theperiod covered by this report;
3. Based on my knowledge, the financial statements, and other financial information included inthis report, fairly present in all material respects the financial condition, results of operationsand cash flows of the registrant as of, and for, the periods presented in this report;
4. The registrant’s other certifying officer and I are responsible for establishing and maintainingdisclosure controls and procedures (as defined in Exchange Act Rules 13a-15(e) and 15d-15(e))and internal control over financial reporting (as defined in Exchange Act Rules 15(f) and 15d-15(f)) for the registrant and have:
(a) Designed such disclosure controls and procedures, or caused such disclosure controls andprocedures to be designed under our supervision, to ensure that material informationrelating to the registrant, including its consolidated subsidiaries, is made known to usby others within those entities, particularly during the period in which this report isbeing prepared;
(b) Designed such internal control over financial reporting, or caused such internal control overfinancial reporting to be designed under our supervision, to provide reasonable assuranceregarding the reliability of financial reporting and the preparation of financial statementsfor external purposes in accordance with generally accepted accounting principles;
(c) Evaluated the effectiveness of the registrant’s disclosure controls and procedures andpresented in this report our conclusions about the effectiveness of the disclosure controls andprocedures, as of the end of the period covered by this report based on such evaluation; and
(d) Disclosed in this report any change in the registrant’s internal control over financialreporting that occurred during the registrant’s most recent fiscal quarter that has materiallyaffected, or is reasonably likely to materially affect, the registrant’s internal control overfinancial reporting; and
5. The registrant’s other certifying officer and I have disclosed, based on our most recent evaluationof internal control over financial reporting, to the registrant’s auditors and the audit committeeof the registrant’s board of directors:
(a) All significant deficiencies and material weaknesses in the design or operation of internalcontrol over financial reporting which are reasonably likely to adversely affect theregistrant’s ability to record, process, summarize and report financial information; and
(b) Any fraud, whether or not material, that involves management or other employees who havea significant role in the registrant’s internal control over financial reporting.
David J. WestChief Financial Officer
March 7, 2005
88