hersha hersha hospitality trust financial … hospitality trust consolidated financial ... selected...
TRANSCRIPT

H E R S H A
Financial Statements 2006h e r s h a h o s p i t a l i t y t r u s t

HERSHA HOSPITALITY TRUST CONSOLIDATED FINANCIAL STATEMENTS
INDEX
Section Page
PART I Item 1. Business 2Item 2. Properties 10 Item 3. Legal Proceedings 13 Item 4. Submission of Matters to a Vote of Security Holders 13 PART IIItem 5. Market for Registrant’s Common Equity, Related Stockholder Matters and Issuer Purchases of Equity Securities 14 Item 6. Selected Financial Data 16 Item 7. Management’s Discussion and Analysis of Financial Condition and Results of Operations 18Item 7A. Quantitative and Qualitative Disclosures About Market Risk 27Item 8. Financial Statements and Supplementary Data 28 Item 9. Changes in and Disagreements with Accountants on Accounting and Financial Disclosure 76 Item 9A. Controls and Procedures 76
This Annual Report contains excerpts from our Annual Report on Form 10-K for the fiscal year ended December 31, 2006, and substantially conforms with the version filed with the Securities and Exchange Commission (“SEC”). However, the Form 10-K also contains additional information. For a free copy of our Form 10-K, please contact:
Investor Relations Hersha Hospitality Trust 44 Hersha Drive Harrisburg, PA 17102
Our Form 10-K and other filings with the SEC are also available on our website, www.hersha.com. The most recent certifications by our chief executive officer and chief financial officer pursuant to the Sarbanes-Oxley Act of 2002 are filed as exhibits to our Form 10-K.
1 HERSHA 2006 ANNUAL REPORT

2 HERSHA 2006 ANNUAL REPORT
CAUTIONARY FACTORS THAT MAY AFFECT FUTURE RESULTS
This report contains forward-looking statements within the meaning of Section 27A of the Securities Act of 1933, as
amended, and Section 21E of the Securities Exchange Act of 1934, as amended, including, without limitation, statements containing the words, “believes,” “anticipates,” “expects” and words of similar import. Such forward-looking statements relate to future events, our future financial performance, and involve known and unknown risks, uncertainties and other factors which may cause our actual results, performance or achievements or industry results to be materially different from any future results, performance or achievements expressed or implied by such forward-looking statements. Readers should specifically consider the various factors identified in this report including, but not limited to those discussed in the sections entitled “Risk Factors,” “Growth Strategy” and “Management’s Discussion and Analysis of Financial Conditions and Results of Operations” that could cause actual results to differ. We disclaim any obligation to update any such factors or to publicly announce the result of any revisions to any of the forward-looking statements contained herein to reflect future events or developments, except as required by law. Item 1. Business OVERVIEW
Hersha Hospitality Trust is a self-advised Maryland real estate investment trust, or REIT, that was organized in 1998 and completed its initial public offering in January of 1999. Our common shares are traded on the American Stock Exchange under the symbol “HT”. We invest primarily in institutional grade hotels in central business districts, primary suburban office markets and stable destination and secondary markets in the Northeastern United States and select markets on the West Coast. Our primary strategy is to continue to acquire high quality, upscale, mid-scale and extended-stay hotels in metropolitan markets with high barriers to entry in the Northeastern United States and other markets with similar characteristics.
As of December 31, 2006, our portfolio consisted of 48 wholly owned limited and full service properties and 18 limited and full service properties in which we have joint venture investments. Of the 18 limited and full service properties in which we have our joint ventures investments, four are consolidated. These 66 properties, with a total of 8,641 rooms, are located in Arizona, California, Connecticut, Delaware, Maryland, Massachusetts, New Jersey, New York, North Carolina, Pennsylvania, Rhode Island and Virginia and operate under leading brands, such as Marriott ®, Courtyard by Marriott ® , Residence Inn ®, Fairfield Inn ®, Hilton ®, Hilton Garden Inn ®, Springhill Suites ®, Hampton Inn ® , Holiday Inn ® , Holiday Inn Express ® , Comfort Inn ® , Mainstay Suites ® , Sleep Inn ®, Hawthorne Suites®, Homewood Suites®, Four Points by Sheraton ® and Hyatt Summerfield Suites®.
We are structured as an umbrella partnership REIT, or UPREIT, and we own our hotels and our investments in joint ventures through our operating partnership, Hersha Hospitality Limited Partnership, or HHLP, for which we serve as general partner. Our hotels are managed by qualified independent management companies, including Hersha Hospitality Management, L.P., or HHMLP. HHMLP is a private management company owned by certain of our trustees, officers and other third party investors. All of our wholly owned hotels are leased to 44 New England Management Company, or 44 New England, our wholly-owned taxable REIT subsidiary, or TRS. In addition, all of the hotels we own through investments in joint ventures are leased to TRSs owned by the respective venture or to corporations owned in part by our wholly owned TRS. AVAILABLE INFORMATION
Our address is 44 Hersha Drive, Harrisburg, PA 17102. Our telephone number is (717) 236-4400. Our Internet website address is: www.hersha.com. We make available free of charge through our website our annual report on Form 10-K, quarterly reports on Form 10-Q, current reports on Form 8-K and amendments to those reports filed or furnished pursuant to Section 13(a) or 15(d) of the Securities Exchange Act of 1934, as amended, as soon as reasonably practicable after such documents are electronically filed with, or furnished to, the SEC. The information available on our website is not, and shall not be deemed to be, a part of this report or incorporated into any other filings we make with the SEC.

3 HERSHA 2006 ANNUAL REPORT
INVESTMENT IN HOTEL PROPERTIES
Our operating strategy focuses on increasing hotel performance for our portfolio. The key elements of this strategy are:
working together with our hotel management companies to increase occupancy levels and revenue per available room, or "RevPAR", through active property-level management, including intensive marketing efforts to tour groups, corporate and government extended stay customers and other wholesale customers and expanded yield management programs, which are calculated to better match room rates to room demand; and
positioning our hotels to capitalize on increased demand in the high quality, upper-upscale, upscale, mid-scale and
extended-stay lodging segment, which we believe can be expected to follow from improving economic conditions, by managing costs and thereby maximizing earnings.
As of December 31, 2006, we owned interests in the following 66 hotels:
Name
Rooms
Ownership % Consolidated/
Unconsolidated Marriott Mystic, CT 285 66.7% Unconsolidated JV Hartford, CT 409 15.0% Unconsolidated JV Hilton Hartford, CT 393 8.8% Unconsolidated JV Courtyard Alexandria, VA 203 100.0% Consolidated Scranton, PA 120 100.0% Consolidated Langhorne, PA 118 100.0% Consolidated Brookline/Boston, MA 188 100.0% Consolidated Norwich, CT 144 66.7% Unconsolidated JV South Boston, MA 164 50.0% Unconsolidated JV Wilmington, DE 78 100.0% Consolidated Warwick, RI 92 66.7% Unconsolidated JV Ewing/Princeton, NJ 130 50.0% Unconsolidated JV Hampton Inn Brookhaven, NY 161 100.0% Consolidated Philadelphia, PA 250 80.0% Consolidated JV Chelsea/Manhattan, NY 144 100.0% Consolidated Linden, NJ 149 100.0% Consolidated Hershey, PA 110 100.0% Consolidated Carlisle, PA 95 100.0% Consolidated Danville, PA 72 100.0% Consolidated Selinsgrove, PA 75 100.0% Consolidated Herald Square, Manhattan, NY 136 100.0% Consolidated Residence Inn North Dartmouth, MA 96 100.0% Consolidated Tysons Corner, VA 96 100.0% Consolidated Danbury, CT 78 66.7% Unconsolidated JV Framingham, MA 125 100.0% Consolidated Greenbelt, MD 120 100.0% Consolidated Mystic, CT 133 66.7% Unconsolidated JV Southington, CT 94 44.7% Unconsolidated JV Williamsburg, VA 108 75.0% Consolidated JV Norwood, MA 96 100.0% Consolidated

4 HERSHA 2006 ANNUAL REPORT
Name Rooms Ownership % Consolidated/ Unconsolidated
Summerfield Suites White Plains, NY 159 100.0% Consolidated Bridgewater, NJ 128 100.0% Consolidated Gaithersburg, MD 140 100.0% Consolidated Pleasant Hill, CA 142 100.0% Consolidated Pleasanton, CA 128 100.0% Consolidated Scottsdale, AZ 164 100.0% Consolidated Charlotte, NC 144 100.0% Consolidated
Homewood Suites Glastonbury, CT 136 40.0% Unconsolidated JV
Holiday Inn Express Hauppauge, NY 133 100.0% Consolidated Cambridge, MA 112 100.0% Consolidated Hershey, PA 85 100.0% Consolidated New Columbia, PA 81 100.0% Consolidated Malvern, PA 88 100.0% Consolidated Oxford Valley, PA 88 100.0% Consolidated South Boston, MA 118 50.0% Unconsolidated JV
Hilton Garden Inn JFK Airport, NY 188 100.0% Consolidated Edison, NJ 132 100.0% Consolidated Glastonbury, CT 150 40.0% Unconsolidated JV Gettysburg, PA 88 100.0% Consolidated
Springhill Suites Waterford, CT 80 66.7% Unconsolidated JV Williamsburg, VA 120 75.0% Consolidated JV
Holiday Inn Express & Suites Harrisburg, PA 77 100.0% Consolidated King of Prussia, PA 155 100.0% Consolidated
Four Points - Sheraton Revere/Boston, MA 180 55.0% Consolidated JV
Mainstay Valley Forge, PA 69 100.0% Consolidated Frederick, MD 72 100.0% Consolidated
Holiday Inn Harrisburg, PA 196 100.0% Consolidated (1)
Comfort Inn North Dartmouth, MA 84 100.0% Consolidated Harrisburg, PA 81 100.0% Consolidated Frederick, MD 73 100.0% Consolidated
Fairfield Inn Mt. Laurel, NJ 118 100.0% Consolidated Bethlehem, PA 103 100.0% Consolidated Laurel, MD 109 100.0% Consolidated Hawthorne Suites Franklin, MA 100 100.0% Consolidated
Independent Wilmington, DE 71 100.0% Consolidated
Sleep Inn Valley Forge, PA 87 100.0% Consolidated
TOTAL 8,641
(1) As of July 1, 2006, the Holiday Inn, Harrisburg, PA was leased to an unrelated party under a fixed lease agreement. Prior to July 1, 2006, operating results were included in our consolidated hotel operating results.
5 HERSHA 2006 ANNUAL REPORT
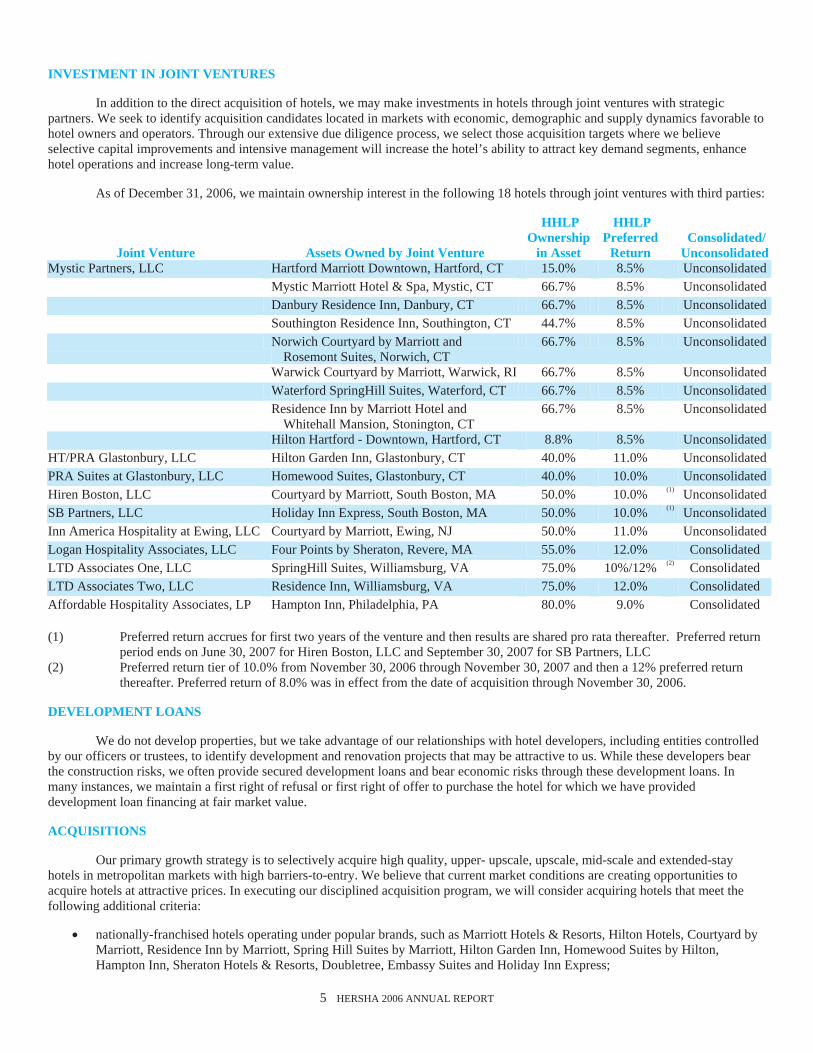
INVESTMENT IN JOINT VENTURES
In addition to the direct acquisition of hotels, we may make investments in hotels through joint ventures with strategic partners. We seek to identify acquisition candidates located in markets with economic, demographic and supply dynamics favorable to hotel owners and operators. Through our extensive due diligence process, we select those acquisition targets where we believe selective capital improvements and intensive management will increase the hotel’s ability to attract key demand segments, enhance hotel operations and increase long-term value.
As of December 31, 2006, we maintain ownership interest in the following 18 hotels through joint ventures with third parties:
Joint Venture
Assets Owned by Joint Venture
HHLP Ownership
in Asset
HHLP Preferred
Return
Consolidated/Unconsolidated
Mystic Partners, LLC Hartford Marriott Downtown, Hartford, CT 15.0% 8.5% Unconsolidated
Mystic Marriott Hotel & Spa, Mystic, CT 66.7% 8.5% Unconsolidated
Danbury Residence Inn, Danbury, CT 66.7% 8.5% Unconsolidated
Southington Residence Inn, Southington, CT 44.7% 8.5% Unconsolidated
Norwich Courtyard by Marriott and Rosemont Suites, Norwich, CT
66.7% 8.5% Unconsolidated
Warwick Courtyard by Marriott, Warwick, RI 66.7% 8.5% Unconsolidated
Waterford SpringHill Suites, Waterford, CT 66.7% 8.5% Unconsolidated
Residence Inn by Marriott Hotel and Whitehall Mansion, Stonington, CT
66.7% 8.5% Unconsolidated
Hilton Hartford - Downtown, Hartford, CT 8.8% 8.5% UnconsolidatedHT/PRA Glastonbury, LLC Hilton Garden Inn, Glastonbury, CT 40.0% 11.0% UnconsolidatedPRA Suites at Glastonbury, LLC Homewood Suites, Glastonbury, CT 40.0% 10.0% UnconsolidatedHiren Boston, LLC Courtyard by Marriott, South Boston, MA 50.0% 10.0% (1) UnconsolidatedSB Partners, LLC Holiday Inn Express, South Boston, MA 50.0% 10.0% (1) UnconsolidatedInn America Hospitality at Ewing, LLC Courtyard by Marriott, Ewing, NJ 50.0% 11.0% UnconsolidatedLogan Hospitality Associates, LLC Four Points by Sheraton, Revere, MA 55.0% 12.0% Consolidated LTD Associates One, LLC SpringHill Suites, Williamsburg, VA 75.0% 10%/12% (2) Consolidated LTD Associates Two, LLC Residence Inn, Williamsburg, VA 75.0% 12.0% Consolidated Affordable Hospitality Associates, LP Hampton Inn, Philadelphia, PA 80.0% 9.0% Consolidated (1) Preferred return accrues for first two years of the venture and then results are shared pro rata thereafter. Preferred return
period ends on June 30, 2007 for Hiren Boston, LLC and September 30, 2007 for SB Partners, LLC (2) Preferred return tier of 10.0% from November 30, 2006 through November 30, 2007 and then a 12% preferred return
thereafter. Preferred return of 8.0% was in effect from the date of acquisition through November 30, 2006. DEVELOPMENT LOANS
We do not develop properties, but we take advantage of our relationships with hotel developers, including entities controlled by our officers or trustees, to identify development and renovation projects that may be attractive to us. While these developers bear the construction risks, we often provide secured development loans and bear economic risks through these development loans. In many instances, we maintain a first right of refusal or first right of offer to purchase the hotel for which we have provided development loan financing at fair market value. ACQUISITIONS
Our primary growth strategy is to selectively acquire high quality, upper- upscale, upscale, mid-scale and extended-stay hotels in metropolitan markets with high barriers-to-entry. We believe that current market conditions are creating opportunities to acquire hotels at attractive prices. In executing our disciplined acquisition program, we will consider acquiring hotels that meet the following additional criteria:
nationally-franchised hotels operating under popular brands, such as Marriott Hotels & Resorts, Hilton Hotels, Courtyard by Marriott, Residence Inn by Marriott, Spring Hill Suites by Marriott, Hilton Garden Inn, Homewood Suites by Hilton, Hampton Inn, Sheraton Hotels & Resorts, Doubletree, Embassy Suites and Holiday Inn Express;

6 HERSHA 2006 ANNUAL REPORT
hotels in locations with significant barriers-to-entry, such as high development costs, limited availability of land and lengthy entitlement processes; and
hotels in our target markets where we can realize operating efficiencies and economies of scale.
In the ordinary course of our business, we are actively considering hotel acquisition opportunities. Since our initial public offering in 1999, we have acquired, wholly or through joint ventures, a total of 71 hotels, including 19 hotels acquired from entities controlled by our officers or trustees. Of the 19 acquisitions from these entities, 16 were newly-constructed or newly-renovated by these entities prior to our acquisition. Since December, 31, 2006, we have acquired interests in the following hotels:
Brand Location Ownership Interest Acquisition Date Purchase Price Residence Inn Langhorne, PA Wholly Owned 1/8/2007 $ 15,330 Residence Inn Carlisle, PA Wholly Owned 1/10/2007 $ 9,945 Holiday Inn Express Chester, NY Wholly Owned 1/25/2007 $ 9,200 Hampton Inn New York (Seaport), NY Wholly Owned 2/1/2007 $ 27,600 Holiday Inn Express New York (Chelsea), NY 50% 2/1/2007 $ 7,750 DISPOSITIONS
We will evaluate our hotels on a periodic basis to determine if these hotels continue to satisfy our investment criteria. We may sell hotels opportunistically based upon management’s forecast and review of the cash flow potential for the hotel and re-deploy the proceeds into debt reduction or acquisitions of hotels. We utilize several criteria to determine the long-term potential of our hotels. Hotels are identified for sale based upon management’s forecast of the strength of the hotel’s cash flows and its ability to remain accretive to our portfolio. Our decision to sell an asset is often predicated upon the size of the hotel, strength of the franchise, property condition and related costs to renovate the property, strength of market demand generators, projected supply of hotel rooms in the market, probability of increased valuation and geographic profile of the hotel. All asset sales are reviewed by our Board of Trustees, including our independent trustees. A majority of the independent trustees must approve the terms of all asset sales. Since our initial public offering in 1999, we have sold a total of 17 hotels. FINANCING
The relative stability of the mid-scale and upscale segment of the limited service lodging industry allows us to increase returns to our shareholders through the prudent application of leverage. Our debt policy is to limit consolidated indebtedness to less than 67% of the fair market values for the hotels in which we invest. We may employ a higher amount of leverage at a specific hotel to achieve a desired return when warranted by that hotel's historical operating performance and may use modestly greater leverage across our portfolio if and when warranted by prevailing market conditions. PROPERTY MANAGEMENT
We work closely with our hotel management companies to operate our hotels and increase same hotel performance for our portfolio. Through our TRS and our investment in joint ventures, we have retained the following management companies to operate our hotels, as of December 31, 2006: Wholly Owned Joint Ventures Total
Manager Hotels Rooms Hotels Rooms Hotels Rooms HHMLP 40 4,369 5 846 45 5,215 Waterford Hotel Group - - 9 1,708 9 1,708 LodgeWorks 7 1,005 - - 7 1,005 Jiten Management - - 2 282 2 282 LTD Management - - 2 228 2 228 Marriott 1 203 - - 1 203
Total 48 5,577 18 3,064 66 8,641

7 HERSHA 2006 ANNUAL REPORT
Each management agreement provides for a set term and is subject to early termination upon the occurrence of defaults and certain other events described therein. As required under the REIT qualification rules, all managers, including HHMLP, must qualify as an “eligible independent contractor” during the term of the management agreements.
Under the management agreements, the manager generally pays the operating expenses of our hotels. All operating expenses or other expenses incurred by the manager in performing its authorized duties are reimbursed or borne by our TRS to the extent the operating expenses or other expenses are incurred within the limits of the applicable approved hotel operating budget. Our managers are not obligated to advance any of their own funds for operating expenses of a hotel or to incur any liability in connection with operating a hotel.
For their services, the managers receive a base management fee, and if a hotel meets and exceeds certain thresholds, an additional incentive management fee. The base management fee for a hotel is due monthly and is generally equal to 3% of the gross revenues associated with that hotel for the related month. CAPITAL IMPROVEMENTS, RENOVATION AND REFURBISHMENT
We have established capital reserves for our hotels to maintain the hotels in a condition that complies with their respective franchise licenses among other requirements. In addition, we may upgrade the hotels in order to capitalize on opportunities to increase revenue, and as deemed necessary by our management to seek to meet competitive conditions and preserve asset quality. We will also renovate hotels when we believe the investment in renovations will provide an attractive return to us through increased revenues and profitability and is in the best interests of our shareholders. We maintain a capital expenditures policy by which replacements and renovations are monitored to determine whether they qualify as capital improvements. All items that are deemed to be repairs and maintenance costs are expensed and recorded in Hotel Operating Expenses. OPERATING PRACTICES
Our managers utilize centralized accounting and data processing systems, which facilitate financial statement and budget preparation, payroll management, quality control and other support functions for the on-site hotel management team. Our managers also provide centralized control over purchasing and project management (which can create economies of scale in purchasing) while emphasizing local discretion within specific guidelines. DISTRIBUTIONS
We have made thirty two consecutive quarterly distributions to the holders of our common shares since our initial public offering in January 1999 and intend to continue to make regular quarterly distributions to our shareholders.
Quarter to which Distribution Relates
Class A Common Per
Share Distribution
Amount Record Date Payment Date
Series A Preferred Per Share
Distribution Amount Record Date Payment Date
2006 First Quarter $ 0.18 03/31/2006 04/21/2006 $ 0.50 04/01/2006 04/17/2006 Second Quarter $ 0.18 06/30/2006 07/17/2006 $ 0.50 07/01/2006 07/17/2006 Third Quarter $ 0.18 09/29/2006 10/17/2006 $ 0.50 10/01/2006 10/16/2006 Fourth Quarter $ 0.18 12/29/2006 1/16/2007 $ 0.50 01/01/2007 1/16/2007
2005 First Quarter $ 0.18 03/31/2005 04/15/2005 $ - - - Second Quarter $ 0.18 06/20/2005 07/15/2005 $ - - - Third Quarter $ 0.18 09/15/2005 10/14/2005 $ 0.39 10/01/2005 10/17/2005 Fourth Quarter $ 0.18 12/30/2005 01/16/2006 $ 0.50 01/01/2006 01/16/2006

8 HERSHA 2006 ANNUAL REPORT
Our Board of Trustees will determine the amount of our future distributions and its decision will depend on a number of factors, including the amount of adjusted funds from operations, our partnership’s financial condition, debt service requirements, capital expenditure requirements for our hotels, the annual distribution requirements under the REIT provisions of the Code and such other factors as the trustees deem relevant. Our ability to make distributions will depend on the profitability and cash flow available from our hotels. SEASONALITY
Our hotels’ operations historically have been seasonal in nature, reflecting higher occupancy rates during the second and third quarters. This seasonality can be expected to cause fluctuations in our quarterly operating revenues and profitability. Hotel revenue is generally greater in the second and third quarters than in the first and fourth quarters. To the extent that cash flow from operating activities is insufficient to provide all of the estimated quarterly distributions, we anticipate that we will be able to fund any such deficit from future working capital. We expect to use excess cash flow from the second and third quarters to fund distribution shortfalls in the first and fourth quarters. There are no assurances we will be able to continue to make quarterly distributions at the current rate. COMPETITION
The upscale and mid-scale, limited service segment of the hotel business is highly competitive. Among many other factors, our hotels compete on the basis of location, room rates, quality, service levels, reputation, and reservation systems. There are many competitors in our market segments and new hotels are always being constructed. Additions to supply create new competitors, in some cases without corresponding increases in demand for hotel rooms.
We also compete for hotel acquisitions with entities that have investment objectives similar to ours. This competition could limit the number of suitable investment opportunities offered to us. It may also increase the bargaining power of property owners seeking to sell to us, making it more difficult for us to acquire new properties on attractive terms. EMPLOYEES
As of December 31, 2006, we had 21 employees who were principally engaged in managing the affairs of the company unrelated to property management. Our relations with our employees are satisfactory. FRANCHISE AGREEMENTS
We believe that the public’s perception of quality associated with a franchisor is an important feature in the operation of a hotel. Franchisors provide a variety of benefits for franchisees, which include national advertising, publicity and other marketing programs designed to increase brand awareness, training of personnel, continuous review of quality standards and centralized reservation systems. Our hotels operate under franchise licenses from national hotel franchisors, including:
Franchisor Franchise Marriott International Marriott, Residence Inn, Springhill Suites, Courtyard by Marriott, Fairfield Inn Hilton Hotels Corporation Hilton, Hilton Garden Inn, Hampton Inn, Homewood Suites Intercontinental Hotel Group Holiday Inn, Holiday Inn Express, Holiday Inn Express & Suites Global Hyatt Corporation Hyatt Summerfield Suites, Hawthorn Suites Starwood Hotels Four Points by Sheraton Choice Hotels International Comfort Inn, Comfort Suites, Sleep Inn, Mainstay Suites
We anticipate that most of the hotels in which we invest will be operated pursuant to franchise licenses.
The franchise licenses generally specify certain management, operational, record-keeping, accounting, reporting and marketing standards and procedures with which the franchisee must comply. The franchise licenses obligate our lessees to comply with the franchisors’ standards and requirements with respect to training of operational personnel, safety, maintaining specified insurance, the types of services and products ancillary to guest room services that may be provided by our lessees, display of signage, and the type, quality and age of furniture, fixtures and equipment included in guest rooms, lobbies and other common areas.

9 HERSHA 2006 ANNUAL REPORT
TAX STATUS
We have elected to be taxed as a REIT under Sections 856 through 860 of the Internal Revenue Code, commencing with our taxable year ending December 31, 1999. As long as we qualify for taxation as a REIT, we generally will not be subject to Federal income tax on the portion of our income that is currently distributed to shareholders. If we fail to qualify as a REIT in any taxable year and do not qualify for certain statutory relief provisions, we will be subject to Federal income tax (including any applicable alternative minimum tax) on our taxable income at regular corporate tax rates. Even if we qualify for taxation as a REIT, we may be subject to certain state and local taxes on our income and property and to Federal income and excise taxes on our undistributed income.
We may own up to 100% of one or more taxable REIT subsidiaries (“TRS”). A TRS is a taxable corporation that may lease
hotels under certain circumstances, provide services to us, and perform activities such as third party management, development, and other independent business activities. Overall, no more than 20% of the value of our assets may consist of securities of one or more TRS. In addition, no more than 25% of our taxable income for any year, excluding all TRS revenues, may consist of dividends from one or more TRSs and other income from non-real estate related sources.
A TRS is permitted to lease hotels from us as long as the hotels are operated on behalf of the TRS by a third party manager who satisfies the following requirements: 1. such manager is, or is related to a person who is, actively engaged in the trade or business of operating “qualified lodging facilities” for any person unrelated to us and the TRS; 2. such manager does not own, directly or indirectly, more than 35% of our common shares; 3. no more than 35% of such manager is owned, directly or indirectly, by one or more persons owning 35% or more of our common shares; and 4. we do not directly or indirectly derive any income from such manager.
The Internal Revenue Code limits the deductibility of interest paid or accrued by a TRS to us to assure that the TRS is subject to an appropriate level of corporate taxation. The Internal Revenue Code also imposes a 100% excise tax on transactions between a TRS and us or our tenants that are not on an arm’s length basis.
Earnings and profits, which will determine the taxability of dividends to shareholders, will differ from net income reported for financial reporting purposes due to the differences for federal tax purposes in the estimated useful lives and methods used to compute depreciation. The following table sets forth certain per share information regarding the Company’s common and preferred share distributions for the years ended December 31, 2006, 2005 and 2004. 2006 2005 2004 Common Shares
Ordinary income 28.27% 60.83% 66.60%Return of Capital 65.85% 29.24% 33.40%Capital Gain Distribution 5.88% 9.93% -
Preferred Shares Ordinary income 83.05% 85.96% - Capital Gain Distribution 16.95% 14.04% -
FINANCIAL INFORMATION ABOUT SEGMENTS
We are in the business of acquiring equity interests in hotels, and we manage our business in one reportable segment. See Item 8 of this Annual Report on Form 10-K for segment financial information.

10 HERSHA 2006 ANNUAL REPORT
Item 2. Properties
The following table sets forth certain information with respect to the hotels we wholly owned as of December 31, 2006. Twelve Months Ended December 31, 2006
Name Year
Opened Number of Rooms
Room Revenue
Other Revenue (1) Occupancy
Average Daily Rate RevPAR (2)
Comfort Inn North Dartmouth, MA (3) 1986 84 $ 1,200,881 $ 12,532 68.84% $ 84.77 $ 58.35 Harrisburg, PA 1998 81 $ 1,665,431 $ 45,581 66.27% $ 86.06 $ 57.04 Frederick, MD 2004 73 $ 1,438,261 $ 26,172 63.21% $ 85.41 $ 53.98
Courtyard Alexandria, VA (4) 2006 203 $ 1,144,480 $ 157,015 51.46% $ 119.09 $ 61.28 Scranton, PA (5) 1996 120 $ 2,345,890 $ 196,886 68.46% $ 85.50 $ 58.53 Langhorne, PA (6) 2002 118 $ 3,830,847 $ 481,195 75.02% $ 119.21 $ 89.43 Brookline/Boston, MA 2003 188 $ 8,906,184 $ 759,116 81.57% $ 159.11 $ 129.79 Wilmington, DE 1999 78 $ 2,506,225 $ 102,623 73.45% $ 119.85 $ 88.03 Fairfield Inn Mt. Laurel, NJ (6) 1999 118 $ 2,729,983 $ 29,676 73.83% $ 86.33 $ 63.73 Bethlehem, PA (6) 1997 103 $ 2,442,439 $ 47,009 69.16% $ 94.46 $ 65.33 Laurel, MD 1999 109 $ 2,504,938 $ 37,639 60.90% $ 103.38 $ 62.96
Hampton Inn Brookhaven, NY (7) 2002 161 $ 1,541,991 $ 116,253 68.68% $ 119.18 $ 81.86 Chelsea/Manhattan, NY 2003 144 $ 8,971,762 $ 49,019 86.33% $ 197.72 $ 170.70 Linden, NJ 2003 149 $ 4,046,871 $ 121,625 78.18% $ 95.44 $ 74.62 Hershey, PA 1999 110 $ 3,601,578 $ 82,380 66.25% $ 135.40 $ 89.70 Carlisle, PA 1997 95 $ 2,621,094 $ 13,611 75.08% $ 98.60 $ 74.03 Danville, PA 1998 72 $ 1,803,689 $ 15,385 74.05% $ 94.00 $ 69.60 Selinsgrove, PA (8) 1996 75 $ 2,062,336 $ 24,485 68.43% $ 110.09 $ 75.34 Herald Square, Manhattan, NY 2005 136 $ 8,270,752 $ 44,524 84.49% $ 197.20 $ 166.61
Hawthorne Suites Franklin, MA (9) 1999 100 $ 1,785,326 $ 91,193 81.29% $ 87.50 $ 71.13
Hilton Garden Inn JFK Airport, NY (10) 2005 188 $ 7,126,221 $ 756,506 91.75% $ 130.23 $ 119.49 Edison, NJ 2003 132 $ 3,602,479 $ 1,092,315 71.28% $ 104.89 $ 74.77 Gettysburg, PA 2004 88 $ 2,081,986 $ 329,979 70.28% $ 92.24 $ 64.83
Holiday Inn (HICC) Harrisburg, PA (11) 1970 196 $ 1,592,421 $ 1,328,008 59.76% $ 76.82 $ 45.91
Holiday Inn Express Hauppauge, NY (12) 2001 133 $ 1,471,571 $ 108,206 71.88% $ 126.17 $ 90.69 Cambridge, MA (13) 1997 112 $ 2,881,893 $ 67,801 79.85% $ 132.62 $ 105.89 Hershey, PA 1997 85 $ 2,044,728 $ 27,790 67.65% $ 106.16 $ 71.82 New Columbia, PA 1997 81 $ 1,331,965 $ 14,387 49.47% $ 92.20 $ 45.62 Malvern, PA 2004 88 $ 1,894,246 $ 10,347 62.43% $ 94.46 $ 58.97 Oxford Valley, PA 2004 88 $ 2,279,016 $ 20,527 68.37% $ 103.75 $ 70.95
Holiday Inn Express & Suites Harrisburg, PA 1997 77 $ 1,953,176 $ 25,016 76.71% $ 91.79 $ 70.41 King of Prussia, PA 2004 155 $ 3,843,114 $ 96,344 69.39% $ 97.89 $ 67.93
Independent
Wilmington, DE 1999 71 $ 1,583,922 $ 20,516 71.46% $ 85.53 $ 61.12

11 HERSHA 2006 ANNUAL REPORT
Twelve Months Ended December 31, 2006
Name Year
Opened Number of Rooms
Room Revenue
Other Revenue (1) Occupancy
Average Daily Rate RevPAR (2)
Mainstay Valley Forge, PA 2000 69 $ 1,654,492 $ 84,042 76.62% $ 85.73 $ 65.69 Frederick, MD 2000 72 $ 1,594,676 $ 16,617 75.17% $ 79.61 $ 59.84 Residence Inn North Dartmouth, MA (3) 2002 96 $ 2,321,895 $ 64,300 82.60% $ 119.51 $ 98.72 Tysons Corner, VA (14) 1984 96 $ 4,060,555 $ 31,568 78.72% $ 161.36 $ 127.02 Framingham, MA 2000 125 $ 4,398,572 $ 141,403 80.32% $ 120.03 $ 96.41 Greenbelt, MD 2002 120 $ 4,716,308 $ 89,334 69.67% $ 154.56 $ 107.68 Norwood, MA (15) 2006 96 $ 1,070,025 $ 18,131 62.12% $ 113.57 $ 70.54 Sleep Inn Valley Forge, PA 2000 87 $ 1,659,635 $ 17,401 72.40% $ 80.52 $ 58.29 Summerfield Suites White Plains, NY (16) 2000 159 * * * * * Bridgewater, NJ (16) 1998 128 * * * * * Gaithersburg, MD (16) 1998 140 * * * * * Pleasant Hill, CA (16) 2003 142 * * * * * Pleasanton, CA (16) 1998 128 * * * * * Scottsdale, AZ (16) 1999 164 * * * * * Charlotte, NC (16) 1989 144 * * * * * TOTAL 5,577 $ 120,583,854 $ 6,814,457 WEIGHTED AVERAGE 73.93% $ 123.70 $ 95.37 (1) Represents restaurant revenue, telephone revenue and other revenue (2) Revenue per Available Room, or RevPAR, is determined by dividing room revenue by available rooms for the applicable
period (3) We assumed operations of this hotel in May 2006 (4) We assumed operations of this hotel in September 2006 (5) We assumed operations of this hotel in February 2006 (6) We assumed operations of this hotel in January 2006 (7) We assumed operations of this hotel in September 2006 (8) A portion of the land adjacent to this hotel, which is not currently used for hotel operations, is leased to an affiliate for $1 per
year for 99 years (9) We assumed operations of this hotel in April 2006 (10) We assumed operations of this hotel in February 2006 (11) We entered into a fixed lease with a third party as of July 1, 2006 and ceased operating the hotel. Room Revenue, Other
Revenue and other operating statistics presented are for the period we operated the hotel. (12) We assumed operations of this hotel in September 2006 (13) We assumed operations of this hotel in May 2006 (14) We assumed operations of this hotel in February 2006 (15) We assumed operations of this hotel in July 2006 (16) We acquired this hotel on December 27, 2006. Revenue, Other Revenue and operating statics for the period the hotel was
owned in 2006 are insignificant to the overall operating results of the Company

12 HERSHA 2006 ANNUAL REPORT
The following table sets forth certain information with respect to the hotels we owned through joint ventures with third
parties as of December 31, 2006. Twelve Months Ended December 31, 2006
Name Year
Opened Number of
Rooms Room
Revenue Other
Revenue (1) Occupancy Average
Daily Rate RevPAR (2) Courtyard Norwich, CT 1997 144 $ 4,048,230 $ 411,870 75.06% $ 102.61 $ 77.02 South Boston, MA 2005 164 $ 5,284,544 $ 442,505 63.75% $ 138.48 $ 88.28 Warwick, RI 2003 92 $ 2,993,438 $ 284,255 78.17% $ 114.04 $ 89.14 Ewing/Princeton, NJ 2004 130 $ 4,709,348 $ 563,040 76.48% $ 129.76 $ 99.25 Four Points - Sheraton Revere/Boston, MA 2001 180 $ 5,373,577 $ 2,575,763 86.26% $ 94.82 $ 81.79 Hampton Inn Philadelphia, PA (3) 2001 250 $ 7,325,400 $ 473,467 77.24% $ 118.92 $ 91.89 Hilton Hartford, CT 2005 393 $ 11,020,610 $ 5,625,785 56.17% $ 136.90 $ 76.89 Homewood Suites Glastonbury, CT (4) 2006 136 $ 1,323,952 $ 33,991 40.96% $ 119.43 $ 48.92 Marriott Mystic, CT 2001 285 $ 11,883,756 $ 13,075,869 76.41% $ 149.52 $ 114.24 Hartford, CT (5) 2005 409 $ 12,718,214 $ 8,024,981 62.23% $ 152.82 $ 95.09 Residence Inn Danbury, CT 1999 78 $ 2,864,888 $ 78,771 86.90% $ 115.80 $ 100.63 Mystic, CT 1996 133 $ 4,247,119 $ 129,976 76.98% $ 113.64 $ 87.49 Southington, CT 2002 94 $ 3,219,903 $ 247,018 88.43% $ 106.12 $ 93.85 Williamsburg, VA 2002 108 $ 3,098,427 $ 44,184 72.19% $ 108.88 $ 78.60 Holiday Inn Express South Boston, MA 1998 118 $ 4,086,338 $ 69,531 78.10% $ 121.48 $ 94.88 Hilton Garden Inn Glastonbury, CT 2003 150 $ 4,182,453 $ 936,622 66.63% $ 114.66 $ 76.39 Springhill Suites Waterford, CT 1998 80 $ 2,304,952 $ 53,198 79.41% $ 99.40 $ 78.94 Williamsburg, VA 2002 120 $ 2,289,818 $ 41,473 56.65% $ 92.29 $ 52.28 TOTAL 3,064 $ 92,974,967 $ 33,112,299 WEIGHTED AVERAGE 70.96% $ 130.25 $ 91.58 (1) Represents restaurant revenue, telephone revenue and other revenue (2) Revenue per Available Room, or RevPAR, is determined by dividing room revenue by available rooms for the applicable
period (3) We assumed operations of this hotel in February 2006. We own 80% of the joint venture (4) We assumed operations of this hotel in September 2006. We own 40% of this joint venture (5) We assumed operations of this hotel in February 2006. We own 15% of this joint venture
13 HERSHA 2006 ANNUAL REPORT
Item 3.
Legal Proceedings
We are not presently subject to any material litigation nor, to our knowledge, is any other litigation threatened against us, other than routine actions for negligence or other claims and administrative proceedings arising in the ordinary course of business, some of which are expected to be covered by liability insurance and all of which collectively are not expected to have a material adverse effect on our liquidity, results of operations or business or financial condition. Item 4.
Submission of Matters to a Vote of Security Holders
No matter was submitted to a vote of our security holders during the fourth quarter of 2006, through the solicitation of proxies or otherwise.

14 HERSHA 2006 ANNUAL REPORT
PART II
Item 5.
Market for Registrant’s Common Equity, Related Stockholder Matters and Issuer Purchases of Equity Securities MARKET INFORMATION
Our common shares began trading on the American Stock Exchange on January 20, 1999 under the symbol “HT.” As of March 15, 2007, the last reported closing price per common share on the American Stock Exchange was $11.51. The following table sets forth the high and low sales price per common share reported on the American Stock Exchange as traded and the dividends paid on the common shares for each of the quarters indicated.
Price Range
Year Ended December 31, 2006 High
Low
Cash Dividend Per Share
Fourth Quarter $ 11.99 $ 9.47 $ 0.18 Third Quarter $ 10.17 $ 8.83 $ 0.18 Second Quarter $ 9.80 $ 8.76 $ 0.18 First Quarter $ 10.00 $ 8.89 $ 0.18
Year Ended December 31, 2005 High Low Cash Dividend
Per Share Fourth Quarter $ 11.63 $ 8.00 $ 0.18 Third Quarter $ 10.49 $ 9.51 $ 0.18 Second Quarter $ 10.49 $ 9.50 $ 0.18 First Quarter $ 12.11 $ 9.21 $ 0.18
SHARE PERFORMANCE GRAPH
The following graph compares the yearly change in our cumulative total shareholder return on our common shares for the period beginning January 1, 2002 and ending December 31, 2006, with the yearly changes in the Standard & Poor’s 500 Stock Index (the S&P 500 Index), the Russell 2000 Index, and the SNL Hotel REITs Index (“Hotel REIT Index”) for the same period, assuming a base share price of $100.00 for our common shares, the S&P 500 Index, the Russell 2000 Index and the Hotel REIT Index for comparative purposes. The Hotel REIT Index is comprised of nineteen publicly traded REITs which focus on investments in hotel properties. Total shareholder return equals appreciation in stock price plus dividends paid and assumes that all dividends are reinvested. The performance graph is not indicative of future investment performance. We do not make or endorse any predictions as to future share price performance:

Period Ending December 31,
Index 2001 2002 2003 2004 2005 2006
Hersha Hospitality Trust $ 100.00 $ 124.60 $ 216.00 $ 262.70 $ 222.70 $ 301.30Russell 2000 100.00 79.52 117.09 138.55 144.86 171.47SNL Hotel REITs Index 100.00 98.65 128.73 170.76 187.50 241.15S&P 500 100.00 77.90 100.24 111.14 116.59 135.00
The foregoing graph and chart shall not be deemed incorporated by reference by any general statement incorporating by referencethis Annual Report on Form 10-K into any filing under the Securities Act of 1933 or under the Securities Exchange Act of 1934, except to the extent we specifically incorporate this information by reference, and shall not otherwise be deemed filed under those acts.
15 HERSHA 2006 ANNUAL REPORT

16 HERSHA 2006 ANNUAL REPORT
Item 6.
Selected Financial Data The following sets forth selected financial and operating data on a historical consolidated basis. The following data should be read in conjunction with the financial statements and notes thereto and Management’s Discussion and Analysis of Financial Condition and Results of Operations included elsewhere in this Form 10-K.
HERSHA HOSPITALITY TRUST SELECTED FINANCIAL DATA
(In thousands, except per share data)
2006 2005 2004 2003 2002 Revenue: Hotel Operating Revenues $ 142,180 $ 75,203 $ 42,470 $ 1,631 $ - Interest Income From Development Loans 2,487 3,940 2,191 715 207 Land Lease Revenue 2,071 - - - - Hotel Lease Revenue 391 - 1,192 10,144 9,846 Other Revenues 759 529 176 8 -
Total Revenue 147,888 79,672 46,029 12,498 10,053 Operating Expenses: Hotel Operating Expenses 83,474 46,082 26,890 1,242 - Hotel Ground Rent 804 433 504 50 - Land Lease Expense 1,189 - - - - Real Estate and Personal Property Taxes and Property Insurance
6,670 4,067 2,851 1,021 748
General and Administrative 6,238 4,972 3,150 631 514 Compensation Expense related to Option Redemption - - - 1,307 - Depreciation and Amortization 20,011 9,548 5,964 3,315 2,862 Total Operating Expenses 118,386 65,102 39,359 7,566 4,124 Operating Income 29,502 14,570 6,670 4,932 5,929 Interest Income 1,182 602 241 86 7 Interest expense 26,532 13,137 5,213 3,354 3,436 Loss on Debt Extinguishment 1,485 - - 116 - Income before income (loss) from Unconsolidated Joint Venture Investments, Distributions to Preferred Unitholders, Minority Interests and Discontinued Operations 2,667 2,035 1,698 1,548 2,500 Income (Loss) from Unconsolidated Joint Venture Investments
1,799 457 481 (24) -
Income Before Distribution to Preferred Unitholders, Minority Interest and Discontinued Operations 4,466 2,492 2,179 1,524 2,500 Distributions to Preferred Unitholders - - 499 1,195 -
Income Allocated to Minority Interest in Continuing Operations
551 38 210 148 2,211 Income from Continuing Operations 3,915 2,454 1,470 181 289 Discontinued Operations, net of minority interest: Gain on Disposition of Hotel Properties 693 1,161 - - 449 Income (Loss) from Discontinued Operations 490 (318) 579 604 554 Net Income 5,098 3,297 2,049 785 1,292 Preferred Distributions 4,800 1,920 - - -
Net Income applicable to Common Shareholders $ 298 $ 1,377 $ 2,049 $ 785 $ 1,292
Basic Earnings Per Common Share $ 0.01 $ 0.07 $ 0.13 $ 0.17 $ 0.51 Diluted Earnings Per Common Share (1) $ 0.01 $ 0.07 $ 0.13 $ 0.17 $ 0.51 Dividends declared per Common Share $ 0.72 $ 0.72 $ 0.72 $ 0.72 $ 0.72

17 HERSHA 2006 ANNUAL REPORT
2006 2005 2004 2003 2002 Balance Sheet Data
Net investment in hotel properties $ 807,784 $ 317,980 $ 163,923 $ 121,076 $ 93,814 Assets Held for Sale $ - $ 3,407 $ 18,758 $ - $ - Minority interest in Partnership $ 25,933 $ 15,147 $ 16,779 $ 38,971 $ 20,258 Shareholder's equity $ 331,619 $ 164,703 $ 119,792 $ 71,460 $ 11,378 Total assets $ 968,208 $ 455,355 $ 261,021 $ 196,568 $ 101,516 Total debt $ 580,542 $ 256,146 $ 97,761 $ 71,837 $ 65,341 Debt related to Assets Held for Sale $ - $ 375 $ 13,058 $ - $ -
Other Data Funds from Operations (2) $ 25,919 $ 14,445 $ 10,539 $ 6,533 $ 8,293 Net cash provided by operating activities $ 27,217 $ 15,002 $ 12,148 $ 5,193 $ 8,177 Net cash used in investing activities $ (413,881) $ (190,825 ) $ (78,378) $ (58,370 ) $ (345)Net cash provided by (used in) financing
activities $ 388,200 $ 163,989 $ 46,137 $ 93,744 $ (7,859)Weighted average shares outstanding
Basic 27,118,264 20,293,554 16,391,805 4,614,316 2,519,820 Diluted (1) 27,118,264 20,335,181 16,391,805 4,614,316 2,519,820
(1) Income allocated to minority interest in the Partnership has been excluded from the numerator and Partnership units have been omitted from the denominator for the purpose of computing diluted earnings per share since the effect of including these amounts in the numerator and denominator would have no impact. (2) See “Management’s Discussion and Analysis of Financial Condition and Results of Operations—Funds From Operations” for an explanation of FFO, why we believe FFO is a meaningful measure of our operating performance and a reconciliation of FFO to net income calculated in accordance with GAAP.

18 HERSHA 2006 ANNUAL REPORT
Item 7. Management’s Discussion and Analysis of Financial Condition and Results of Operations
All statements contained in this section that are not historical facts are based on current expectations. Words such as “believes”, “expects”, “anticipate”, “intends”, “plans” and “estimates” and variations of such words and similar words also identify forward-looking statements. Our actual results may differ materially. We caution you not to place undue reliance on any such forward-looking statements. We assume no obligation to update any forward-looking statements as a result of new information, subsequent events or any other circumstances. GENERAL
As of December 31, 2006, we owned interests in 66 hotels in the eastern United States including 18 hotels owned through joint ventures. For purposes of the REIT qualification rules, we cannot directly operate any of our hotels. Instead, we must lease our hotels. In 2001, the REIT rules were modified, allowing a hotel REIT to lease its hotels to a taxable REIT subsidiary, or TRS, provided that the TRS engages an eligible independent contractor to manage the hotels. Accordingly, as of December 31, 2006, we have leased all 48 of our hotels to a wholly-owned TRS, a joint venture owned TRS, or a corporate entity owned by our wholly-owned TRS. Each of these TRS entities will pay qualifying rent, and the TRS entities have entered into management contracts with qualified independent managers, including HHMLP, with respect to our hotels. We intend to lease all newly acquired hotels to a TRS. As of December 31, 2006, all of our hotels owned through interests in joint ventures are leased to TRSs that are wholly owned by those joint ventures or entities that are owned in part by our wholly owned TRS. The hotels owned by the joint ventures are managed by various management companies pursuant to the terms of certain management agreements.
The TRS structure enables us to participate more directly in the operating performance of our hotels. The TRS directly receives all revenue from, and funds all expenses relating to hotel operations. The TRS is also subject to income tax on its earnings.
The following table outlines operating results for the Company’s portfolio of wholly owned hotels and those owned through
joint venture interests that are consolidated in our financial statements for the three years ended December 31, 2006, 2005 and 2004:
CONSOLIDATED HOTELS:
Year Ended
2006 Year Ended
2005
2006 vs. 2005
% Variance
Year Ended 2004
2005 vs. 2004
% Variance
Rooms Available 1,604,276 934,699 71.6% 640,547 45.9%Rooms Occupied 1,171,359 657,980 78.0% 422,058 55.9%Occupancy 73.01 % 70.39% 3.7% 65.89% 6.8 %Average Daily Rate (ADR) $ 112.92 $ 102.94 9.7% $ 88.65 16.1%Revenue Per Available Room (RevPAR) $ 82.45 $ 72.46 13.8% $ 58.41 24.1% Room Revenues $ 132,273,077 $ 67,731,075 95.3% $ 37,414,040 81.0 %Total Revenues $ 142,179,749 $ 75,202,778 89.1% $ 42,470,258 77.1%Hotel Operating Revenues from Discontinued Operations $ 5,998,835 $ 9,794,370 -38.8% $ 11,790,000 -16.9%

19 HERSHA 2006 ANNUAL REPORT
The following table outlines operating results for the three years ended December 31, 2006, 2005 and 2004 for hotels we own
through an unconsolidated joint venture interest. These operating results reflect 100% of the operating results of the property including our interest and the interests of our joint venture partners and other minority interest holders.
UNCONSOLIDATED JOINT VENTURES:
Year Ended
2006 Year Ended
2005
2006 vs. 2005
% Variance
Year Ended 2004
2005 vs. 2004
% Variance
Rooms Available 879,271 355,551 147.3 % 127,364 179.2 %Rooms Occupied 614,339 263,030 133.6 % 96,452 172.7 %Occupancy 69.87% 73.98% -5.6 % 75.73 % -2.3%Average Daily Rate (ADR) $ 132.21 $ 127.34 3.8 % $ 134.43 -5.3%Revenue Per Available Room (RevPAR) $ 92.45 $ 94.20 -1.9 % $ 101.80 -7.5% Room Revenues $ 81,285,744 $ 33,492,953 142.7 % $ 12,965,947 158.3 %Total Revenues $ 111,305,828 $ 42,171,809 163.9 % $ 14,086,397 199.4 %
The following table outlines operating results for the three years ended December 31, 2006, 2005 and 2004 for our entire
portfolio of hotels, which includes wholly owned hotels, hotels we own through joint venture interests that are consolidated in our financial statements, and hotels we own through an unconsolidated joint venture interest. These operating results reflect 100% of the operating results of the property including our interest and the interests of our joint venture partners and minority interests.
ALL HOTELS (INCLUDES CONSOLIDATED HOTELS AND UNCONSOLIDATED JOINT VENTURE ASSETS):
Year Ended
2006 Year Ended
2005
2006vs. 2005
% Variance
Year Ended 2004
2005vs. 2004
% Variance
Rooms Available 2,483,547 1,290,250 92.5% 767,911 68.0% Rooms Occupied 1,785,698 921,010 93.9% 518,510 77.6% Occupancy 71.90 % 71.38 % 0.7% 67.52% 5.7% Average Daily Rate (ADR) $ 119.59 $ 109.91 8.8% $ 97.16 13.1% Revenue Per Available Room (RevPAR) $ 85.99 $ 78.45 9.6% $ 65.61 19.6% Room Revenues $ 213,558,821 $ 101,224,028 111.0% $ 50,379,987 100.9%Total Revenues $ 253,485,577 $ 117,374,587 116.0% $ 56,556,655 107.5%Hotel Operating Revenues from Discontinued Operations $ 5,998,835 $ 9,794,370 -38.8% $ 11,790,000 -16.9%
The increase in revenue per available room (“RevPAR”) during the years ended December 31, 2006 and 2005, was due
primarily to a rebounding economy; the Company’s broadened strategic portfolio focus on stronger central business districts and primary suburban office parks; the size of the recent acquisitions as a percentage of the portfolio; franchise affiliations with stronger brands, such as Hilton Garden Inn, Residence Inn and Courtyard by Marriott; and a focus on improving the average daily rate (“ADR”). The increase in both rooms and total revenue can be attributed primarily to the hotels acquired during the respective periods.

20 HERSHA 2006 ANNUAL REPORT
RESULTS OF OPERATIONS Comparison of the Year Ended December 31, 2006 to December 31, 2005
(dollars in thousands, except per share data)
Revenue
Our total revenues for the year ended December 31, 2006 consisted of hotel operating revenues, interest income from our development loan program, land lease revenue, hotel lease revenue and other revenue. Hotel operating revenue is recorded for wholly owned hotels that are leased to our wholly owned TRS and hotels owned through joint venture interests that are consolidated in our financial statements. Hotel operating revenue increased $66,977, or 89.1%, from $75,203 for the twelve months ended December 31, 2005 to $142,180 for the same period in 2006. The increase in revenues is primarily attributable to the acquisitions consummated in 2006 and improved RevPAR and occupancy at certain of our hotels. We acquired interests in the following 22 consolidated hotels since December 31, 2005:
Brand Location Acquisition Date Rooms 2006
Total Revenue
Courtyard Langhorne, PA 1/3/2006 118 $ 4,312 Fairfield Inn Mt. Laurel, NJ 1/3/2006 118 2,760 Fairfield Inn Bethlehem, PA 1/3/2006 103 2,489 Courtyard Scranton, PA 2/1/2006 120 2,543 Residence Inn Tysons Corner, VA 2/2/2006 96 4,092 Hampton Inn Philadelphia, PA 2/15/2006 250 7,799 Hilton Garden Inn JFK Airport, NY 2/16/2006 188 7,883 Hawthorne Suites Franklin, MA 4/25/2006 100 1,877 Residence Inn North Dartmouth, MA 5/1/2006 96 2,386 Comfort Inn North Dartmouth, MA 5/1/2006 84 1,213 Holiday Inn Express Cambridge, MA 5/3/2006 112 2,950 Residence Inn Norwood, MA 7/27/2006 96 1,088 Holiday Inn Express Hauppauge, NY 9/1/2006 133 1,580 Hampton Inn Brookhaven, NY 9/6/2006 161 1,658 Courtyard Alexandria, VA 9/29/2006 203 1,301 Summerfield Suites White Plains, NY 12/27/2006 159 * Summerfield Suites Bridgewater, NJ 12/27/2006 128 * Summerfield Suites Gaithersburg, MD 12/27/2006 140 * Summerfield Suites Pleasant Hill, CA 12/27/2006 142 * Summerfield Suites Pleasanton, CA 12/27/2006 128 * Summerfield Suites Scottsdale, AZ 12/27/2006 164 * Summerfield Suites Charlotte, NC 12/27/2006 144 *
2,983 $ 45,931 * Total Revenues for 2006 insignificant
Revenues for all 22 hotels were recorded from the date of acquisition as hotel operating revenues. Further, hotel operating
revenues for the year ended December 31, 2006 included revenues for a full year related to the following 10 hotels that were purchased during the twelve months ended December 31, 2005:
Brand Location Acquisition Date Rooms 2006
Total Revenue 2005
Total Revenue Residence Inn Williamsburg, VA 11/22/2005 108 $ 3,143 $ 231 Springhill Suites Williamsburg, VA 11/22/2005 120 2,331 141 Courtyard Wilmington, DE 6/17/2005 78 2,609 1,357 Independent Wilmington, DE 6/17/2005 71 1,604 833 Courtyard Brookline/Boston, MA 6/16/2005 188 9,665 5,086 Holiday Inn Express Oxford Valley, PA 5/26/2005 88 2,300 1,280 Holiday Inn Express Malvern, PA 5/24/2005 88 1,905 1,036 Holiday Inn Express King of Prussia, PA 5/23/2005 155 3,939 2,206 Hampton Inn Herald Square, 4/1/2005 136 8,315 6,019 Fairfield Inn Laurel, MD 1/31/2005 109 2,543 2,184
1,141 $ 38,354 $ 20,373

21 HERSHA 2006 ANNUAL REPORT
We invest in hotel development projects by providing secured first mortgage or mezzanine financing to hotel developers and
through the acquisition of land that is then leased to hotel developers. Interest income is earned on our development loans at rates ranging between 8% and 12%. Interest income from development loans receivable was $2,487 for the twelve months ended December 31, 2006 compared to $3,940 for the same period in 2005. The average balance of development loans receivable outstanding in 2006 was lower then the average balance outstanding in 2005 resulting in a $1,453, or 36.9%, decrease in interest income. The lower average balance outstanding in 2006 was partially due to an increase in our investment in land leased to developers for the construction of hotel properties. In June and July of 2006 we acquired two parcels of land which are being leased to hotel developers. Our net investment in these parcels is approximately $18,946. The land is leased to hotel developers at a minimum rental rate of 10% of our net investment in the land. Additional rents are paid by the lessee for the principal and interest on the mortgage, real estate taxes and insurance. During the year ended December 31, 2006, we recorded $2,071 in land lease revenue from these parcels. We incurred $1,189 in expense related to these land leases resulting in a contribution of $882 to our operating income during the twelve months ended December 31, 2006.
Total revenues for the year ended December 31, 2006 also included hotel lease revenue for the lease of the Holiday Inn Conference Center, New Cumberland, Pennsylvania which has a fixed rent over the five year term. Beginning on July 1, 2006 this hotel was leased to an unrelated party. Prior to July 1, 2006, this hotel was leased to our wholly owned TRS and operating revenues and expenses of the hotel were recorded in hotel operating revenue and hotel operating expenses. Hotel lease revenue of $391 was recorded in the twelve months ended December 31, 2006 related to the lease of this property.
Other revenue consists primarily of fees earned for asset management services provided to properties owned by two of our unconsolidated joint ventures. Other revenues increased $230, or 43.5%, from $529 during the twelve months ended December 31, 2005 to $759 during the twelve months ended December 31, 2006. We provided asset management services for the hotels owned by the Mystic Partners joint venture for the entire year in 2006. In 2005 we provided asset management services for this portfolio for a partial year.
Income from unconsolidated joint venture investments increased $1,342 from $457 for the year ended December 31, 2005 to $1,799 for the year ended December 31, 2006. Since December 31, 2005, we have acquired unconsolidated joint venture interests in the following two properties:
Joint Venture Brand Name Acquisition
Date Rooms Ownership
% Hersha Preferred
Equity Return PRA Suites at Glastonbury, LLC
Homewood Suites
Glastonbury, CT 6/15/2006 136 40.0% 10.0%
Mystic Partners, LLC Marriott Hartford, CT 2/8/2006 409 15.0% 8.5% In addition, we acquired joint venture interests in the following 10 properties during the twelve months ended December 31,
2005:
Joint Venture Brand Name Acquisition
Date Rooms Ownership %
Hersha Preferred Equity
Return
SB Partners, LLC Holiday Inn Express
South Boston, MA 10/7/2005 118 50.0% 10.0%
Mystic Partners, LLC Hilton Hartford, CT 10/6/2005 393 8.8% 8.5% Mystic Partners, LLC Residence Inn Mystic, CT 9/15/2005 133 66.7% 8.5% Mystic Partners, LLC Marriott Mystic, CT 8/9/2005 285 66.7% 8.5% Mystic Partners, LLC Courtyard Norwich, CT 8/9/2005 144 66.7% 8.5% Mystic Partners, LLC Courtyard Warwick, RI 8/9/2005 92 66.7% 8.5% Mystic Partners, LLC Residence Inn Danbury, CT 8/9/2005 78 66.7% 8.5%
Mystic Partners, LLC Residence Inn Southington, CT 8/9/2005 94 44.7% 8.5%
Mystic Partners, LLC Springhill Suites Waterford, CT 8/9/2005 80 66.7% 8.5%
Hiren Boston, LLC Courtyard South Boston, MA 7/1/2005 164 50.0% 10.0%
Income from unconsolidated joint venture investments was favorably impacted by the inclusion of these investments for a
full twelve months in 2006.

22 HERSHA 2006 ANNUAL REPORT
For the year ended December 31, 2006, interest income increased $580 compared to the same period in 2005. This increase
was the result of an increase in interest bearing deposits related to the acquisition of hotel properties, interest earned on proceeds from the offering of our common stock during 2006, and an increase in interest income on our escrow deposits.
Expenses
Total hotel operating expenses increased 81.1% to approximately $83,474 for the year ended December 31, 2006 from $46,082 for the year ended December 31, 2005. Consistent with the increase in hotel operating revenues, hotel operating expenses increased primarily due to the acquisitions consummated since the comparable period in 2005, as mentioned above. The acquisitions also resulted in an increase in depreciation and amortization from $9,548 for the year ended December 31, 2005 to $20,011 for the year ended December 31, 2006. Similarly, real estate and personal property tax and property insurance increased $2,603, or 64.0%, in the year ended December 31, 2006 when compared to the same period in 2005.
General and administrative expense increased by approximately $1,266 from $4,972 in 2005 to $6,238 in 2006. General and administrative expenses increased primarily due to higher compensation expense related to our increase in asset management and accounting staff. Also included in general administrative costs are approximately $316 of terminated deal costs written off in 2006 compared to $41 in 2005. This increase in cost has been partially offset by the reduction in costs related to enhancing our process to evaluate internal controls that were incurred during the year ended December 31, 2005.
Net Income
Net income applicable to common shareholders for year ended December 31, 2006 was approximately $298 compared to net income applicable to common shareholders of $1,377 for the same period in 2005.
Operating income for the year ended December 31, 2006 was $29,502 compared to operating income of $14,570 during the same period in 2005. The $14,932, or 102.5%, increase in operating income resulted from improved performance of our portfolio and acquisitions that have increased the scale of our operations enabling us to leverage the absorption of administrative costs.

23 HERSHA 2006 ANNUAL REPORT
The increase in our operating income was partially offset by increases in interest expense, which increased $13,395 from
$13,137 for the year ended December 31, 2005 to $26,532 for the year ended December 31, 2006. The increase in interest expense is the result of our issuance of $51,548 of notes payable in the second quarter of 2005 and mortgages placed on newly acquired properties. Also in the year ended December 31, 2006, we refinanced $56,125 in variable rate debt, replacing it with $62,800 fixed rate debt, and paid down $12,907 on another mortgage. We also replaced our line of credit with an increased credit facility. As a result of terminating the variable rate debt and line of credit, we incurred $1,485 in debt extinguishment expense due to early termination fees and to write-off deferred loan costs associated with the retired debt and credit facility.
Included in net income applicable to common shareholders for the year ended December 31, 2006 is $490 in income from discontinued operations compared to a $318 loss during the same period in 2005. Discontinued operations results from the operations of two properties that were sold in June of 2005, one property sold in April 2006, two properties sold in November 2006 and two properties sold in December 2006. Also included in net income applicable to common shareholders for the year ended December 31, 2006 is a gain of $693 resulting from the sale of the Holiday Inn Express in Hartford, CT, the Hampton Inn in Peachtree, GA, the Hampton Inn in Newnan, GA, the Comfort Suites in Duluth, GA, and the Holiday Inn Express, Duluth, GA which had been held for sale. Included in net income applicable to common shareholders for the year ended December 31, 2005 is a gain of $1,161 resulting from the sale of Doubletree Club, Jamaica, NY and the Holiday Inn Express, Hunters Point, NY.
Net income applicable to common shareholders was also negatively impacted by $4,800 in preferred dividends declared in 2006, compared to $1,920 in preferred dividends declared during 2005 on our outstanding 2,400,000 shares of 8.0% Series A cumulative redeemable preferred stock issued in August of 2005. LIQUIDITY, CAPITAL RESOURCES, AND EQUITY OFFERINGS
(dollars in thousands, except per share data)
We expect to meet our short-term liquidity requirements generally through net cash provided by operations, existing cash balances and, if necessary, short-term borrowings under our lines of credit. We believe that the net cash provided by operations will be adequate to fund the Company’s operating requirements, debt service and the payment of dividends in accordance with REIT requirements of the federal income tax laws. We expect to meet our long-term liquidity requirements, such as scheduled debt maturities and property acquisitions, through long-term secured and unsecured borrowings, the issuance of additional equity securities or, in connection with acquisitions of hotel properties, the issuance of units of operating partnership interest in our operating partnership subsidiary.
We have a debt policy that limits our consolidated indebtedness to less than 67% of the fair market value for the hotels in which we have invested. However, our organizational documents do not limit the amount of indebtedness that we may incur and our Board of Trustees may modify our debt policy at any time without shareholder approval. We intend to repay indebtedness incurred under the line of credit from time to time, for acquisitions or otherwise, out of cash flow and from the proceeds of issuances of additional common shares and other securities.
We intend to invest in additional hotels only as suitable opportunities arise and adequate sources of financing are available. We expect that future investments in hotels will depend on and will be financed by, in whole or in part, our existing cash, the proceeds from additional issuances of common shares, issuances of operating partnership units or other securities or borrowings.
We make available to the TRS of our hotels 4% (6% for full service properties) of gross revenues per quarter, on a cumulative basis, for periodic replacement or refurbishment of furniture, fixtures and equipment at each of our hotels. We believe that a 4% (6% for full service hotels) reserve is a prudent estimate for future capital expenditure requirements. We intend to spend amounts in excess of the obligated amounts if necessary to comply with the reasonable requirements of any franchise license under which any of our hotels operate and otherwise to the extent we deem such expenditures to be in our best interests. We are also obligated to fund the cost of certain capital improvements to our hotels. We may use undistributed cash or borrowings under credit facilities to pay for the cost of capital improvements and any furniture, fixture and equipment requirements in excess of the set aside referenced above. Cash and Cash Equivalents
Our cash and cash equivalents balance of $10,316 at December 31, 2006, was primarily due to net cash provided by operations and by the stock offering we completed in December 2006.
24 HERSHA 2006 ANNUAL REPORT
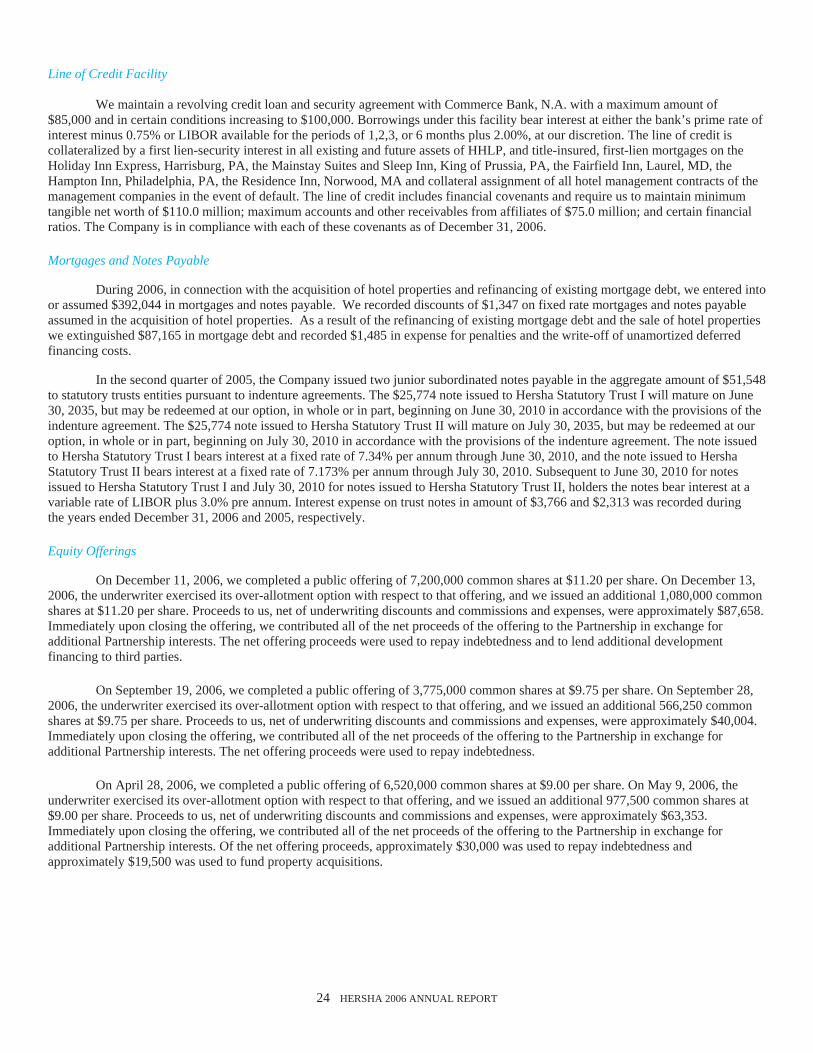
Line of Credit Facility
We maintain a revolving credit loan and security agreement with Commerce Bank, N.A. with a maximum amount of $85,000 and in certain conditions increasing to $100,000. Borrowings under this facility bear interest at either the bank’s prime rate of interest minus 0.75% or LIBOR available for the periods of 1,2,3, or 6 months plus 2.00%, at our discretion. The line of credit is collateralized by a first lien-security interest in all existing and future assets of HHLP, and title-insured, first-lien mortgages on the Holiday Inn Express, Harrisburg, PA, the Mainstay Suites and Sleep Inn, King of Prussia, PA, the Fairfield Inn, Laurel, MD, the Hampton Inn, Philadelphia, PA, the Residence Inn, Norwood, MA and collateral assignment of all hotel management contracts of the management companies in the event of default. The line of credit includes financial covenants and require us to maintain minimum tangible net worth of $110.0 million; maximum accounts and other receivables from affiliates of $75.0 million; and certain financial ratios. The Company is in compliance with each of these covenants as of December 31, 2006. Mortgages and Notes Payable
During 2006, in connection with the acquisition of hotel properties and refinancing of existing mortgage debt, we entered into or assumed $392,044 in mortgages and notes payable. We recorded discounts of $1,347 on fixed rate mortgages and notes payable assumed in the acquisition of hotel properties. As a result of the refinancing of existing mortgage debt and the sale of hotel properties we extinguished $87,165 in mortgage debt and recorded $1,485 in expense for penalties and the write-off of unamortized deferred financing costs.
In the second quarter of 2005, the Company issued two junior subordinated notes payable in the aggregate amount of $51,548 to statutory trusts entities pursuant to indenture agreements. The $25,774 note issued to Hersha Statutory Trust I will mature on June 30, 2035, but may be redeemed at our option, in whole or in part, beginning on June 30, 2010 in accordance with the provisions of the indenture agreement. The $25,774 note issued to Hersha Statutory Trust II will mature on July 30, 2035, but may be redeemed at our option, in whole or in part, beginning on July 30, 2010 in accordance with the provisions of the indenture agreement. The note issued to Hersha Statutory Trust I bears interest at a fixed rate of 7.34% per annum through June 30, 2010, and the note issued to Hersha Statutory Trust II bears interest at a fixed rate of 7.173% per annum through July 30, 2010. Subsequent to June 30, 2010 for notes issued to Hersha Statutory Trust I and July 30, 2010 for notes issued to Hersha Statutory Trust II, holders the notes bear interest at a variable rate of LIBOR plus 3.0% pre annum. Interest expense on trust notes in amount of $3,766 and $2,313 was recorded during the years ended December 31, 2006 and 2005, respectively. Equity Offerings
On December 11, 2006, we completed a public offering of 7,200,000 common shares at $11.20 per share. On December 13, 2006, the underwriter exercised its over-allotment option with respect to that offering, and we issued an additional 1,080,000 common shares at $11.20 per share. Proceeds to us, net of underwriting discounts and commissions and expenses, were approximately $87,658. Immediately upon closing the offering, we contributed all of the net proceeds of the offering to the Partnership in exchange for additional Partnership interests. The net offering proceeds were used to repay indebtedness and to lend additional development financing to third parties.
On September 19, 2006, we completed a public offering of 3,775,000 common shares at $9.75 per share. On September 28, 2006, the underwriter exercised its over-allotment option with respect to that offering, and we issued an additional 566,250 common shares at $9.75 per share. Proceeds to us, net of underwriting discounts and commissions and expenses, were approximately $40,004. Immediately upon closing the offering, we contributed all of the net proceeds of the offering to the Partnership in exchange for additional Partnership interests. The net offering proceeds were used to repay indebtedness.
On April 28, 2006, we completed a public offering of 6,520,000 common shares at $9.00 per share. On May 9, 2006, the underwriter exercised its over-allotment option with respect to that offering, and we issued an additional 977,500 common shares at $9.00 per share. Proceeds to us, net of underwriting discounts and commissions and expenses, were approximately $63,353. Immediately upon closing the offering, we contributed all of the net proceeds of the offering to the Partnership in exchange for additional Partnership interests. Of the net offering proceeds, approximately $30,000 was used to repay indebtedness and approximately $19,500 was used to fund property acquisitions.

25 HERSHA 2006 ANNUAL REPORT
On August 5, 2005, the Company completed a public offering of 2,400,000 of its 8.00% Series A Cumulative Redeemable
Preferred Shares of Beneficial Interest, liquidation preference $25.00 per share. Net proceeds of the offering, less expenses and underwriters commissions, were approximately $57,720. Proceeds from the offering were used to finance the acquisition of the Company’s interests in Mystic Partners, LLC and SB Partners, LLC. The remaining net proceeds have been principally allocated to fund secured development loans and for general corporate purposes.
On September 24, 2004, we completed a public offering of 3,500,000 common shares at $9.37 per share. On September 30, 2004, the underwriter exercised its over-allotment option on these shares, and we issued an additional 400,000 common shares at $9.37 per share. Proceeds to the Company, net of underwriting discounts and commissions and expenses, were approximately $36,219. Immediately upon closing the offering, the Company contributed all of the net proceeds of the offering to the Partnership in exchange for additional Partnership interests. Of the net offering proceeds, approximately $5,000 was used to repay indebtedness. The remaining net proceeds have been principally allocated to fund secured development loans, acquisitions and for general corporate purposes. FUNDS FROM OPERATIONS
(dollars in thousands, except per share data)
The National Association of Real Estate Investment Trusts (“NAREIT”) developed Funds from Operations (“FFO”) as a non-GAAP financial measure of performance of an equity REIT in order to recognize that income-producing real estate historically has not depreciated on the basis determined under GAAP. We calculate FFO applicable to common shares and Partnership units in accordance with the April 2002 National Policy Bulletin of NAREIT, which we refer to as the White Paper. The White Paper defines FFO as net income (loss) (computed in accordance with GAAP) excluding extraordinary items as defined under GAAP and gains or losses from sales of previously depreciated assets, plus certain non-cash items, such as depreciation and amortization, and after adjustments for unconsolidated partnerships and joint ventures. Our interpretation of the NAREIT definition is that minority interest in net income (loss) should be added back to (deducted from) net income (loss) as part of reconciling net income (loss) to FFO. Our FFO computation may not be comparable to FFO reported by other REITs that do not compute FFO in accordance with the NAREIT definition, or that interpret the NAREIT definition differently than we do.
The GAAP measure that we believe to be most directly comparable to FFO, net income (loss) applicable to common shares, includes depreciation and amortization expenses, gains or losses on property sales, minority interest and preferred dividends. In computing FFO, we eliminate these items because, in our view, they are not indicative of the results from our property operations.
FFO does not represent cash flows from operating activities in accordance with GAAP and should not be considered an alternative to net income as an indication of Hersha’s performance or to cash flow as a measure of liquidity or ability to make distributions. We consider FFO to be a meaningful, additional measure of operating performance because it excludes the effects of the assumption that the value of real estate assets diminishes predictably over time, and because it is widely used by industry analysts as a performance measure. We show both FFO from consolidated hotel operations and FFO from unconsolidated joint ventures because we believe it is meaningful for the investor to understand the relative contributions from our consolidated and unconsolidated hotels. The display of both FFO from consolidated hotels and FFO from unconsolidated joint ventures allows for a detailed analysis of the operating performance of our hotel portfolio by management and investors. We present FFO applicable to common shares and Partnership units because our Partnership units are redeemable for common shares. We believe it is meaningful for the investor to understand FFO applicable to all common shares and Partnership units.

26 HERSHA 2006 ANNUAL REPORT
The following table reconciles FFO for the periods presented to the most directly comparable GAAP measure, net income, for the same periods.
Twelve Months Ending
December 31,
2006 December 31,
2005 December 31,
2004 Net income applicable to common shares $ 298 $ 1,377 $ 2,049
Income allocated to minority interest 551 38 210
Income (loss) of discontinued operations allocated to minority interest 64 (45) 138
Income from unconsolidated joint ventures (1,799) (457) (481)
Gain on sale of assets (693) (1,161) - Depreciation and amortization 20,011 9,548 5,964 Depreciation and amortization from discontinued operations 260 1,206 1,565
FFO related to the minority interests in consolidated joint ventures (1) (714) (199) (284)Funds from consolidated hotel operations applicable to common shares
and Partnership units 17,978 10,307 9,161
Income from Unconsolidated Joint Ventures 1,799 457 481 Add:
Depreciation and amortization of purchase price in excess of historical cost (2) 1,817 653 - Interest in depreciation and amortization of unconsolidated joint venture (3) 4,325 3,028 835
Funds from unconsolidated joint ventures operations applicable to common shares and Partnership units 7,941 4,138 1,316
Funds from Operations applicable to common shares and Partnership units $ 25,919 $ 14,445 $ 10,477
Weighted Average Common Shares and Units Outstanding Basic 27,118,264 20,293,554 16,391,805 Diluted 30,785,693 23,177,239 19,401,636 (1) Adjustment made to deduct FFO related to the minority interest in our consolidated joint ventures. Represents the
portion of net income and depreciation allocated to our joint venture partners. (2) Adjustment made to add depreciation of purchase price in excess of historical cost of the assets in the unconsolidated
joint venture at the time of our investment. (3) Adjustment made to add our interest in real estate related depreciation and amortization of our unconsolidated joint
ventures.
FFO was $25,919 for the year ended December 31, 2006, which was an increase of $11,474, or 79.4%, over FFO in the comparable period in 2005, which was $14,445. The increase in FFO was primarily a result of a continued strengthened economy; the benefits of acquiring assets and interests in joint ventures since December 31, 2005; continued stabilization and maturation of the existing portfolio; an increase in business travel and continued attention to the average daily rate.
FFO was negatively impacted by increases in our interest expense and dividends paid to our preferred shareholders and debt extinguishment charges incurred during the year ended December 31, 2006.
For the year ended December 31, 2005, FFO increased $3,906, or 37.1% over the same period in 2004. The increase in FFO was primarily a result of a strengthened economy; the benefits of acquiring assets and interests in joint ventures since December 31, 2004; continued stabilization and maturation of the existing portfolio; an increase in business travel and continued attention to the average daily rate.
FFO was negatively impacted by increases in our interest expense and dividends paid to our preferred shareholders during the year ended December 31, 2006.

27 HERSHA 2006 ANNUAL REPORT
Item 7A. Quantitative and Qualitative Disclosures About Market Risk (in thousands, except per share data)
Our primary market risk exposure is to changes in interest rates on our variable rate Line of Credit and other floating rate debt. At December 31, 2006, we maintained a balance of $24,000 under our Line of Credit. The total fixed rate mortgages payable of $532,680 had a current weighted average interest rate of 6.23%. The total floating rate mortgages payable of $25,174 had a current weighted average interest rate of 8.36%.
Our interest rate risk objectives are to limit the impact of interest rate fluctuations on earnings and cash flows and to lower our overall borrowing costs. To achieve these objectives, we manage our exposure to fluctuations in market interest rates for a portion of our borrowings through the use of fixed rate debt instruments to the extent that reasonably favorable rates are obtainable with such arrangements. We may enter into derivative financial instruments such as interest rate swaps or caps and treasury options or locks to mitigate our interest rate risk on a related financial instrument or to effectively lock the interest rate on a portion of our variable rate debt. Currently, we have one interest rate swap related to debt on the Four Points by Sheraton, Revere. We do not intend to enter into derivative or interest rate transactions for speculative purposes.
Approximately 95.5% of our outstanding mortgages payable are subject to fixed rates, including the debt whose rate is fixed through a derivative instrument, while approximately 4.5% of our outstanding mortgages payable are subject to floating rates. The total weighted average interest rate on our debt and Line of Credit as of December 31, 2006 was approximately 6.37%. If the interest rate for our Line of Credit and other variable rate debt was 100 basis points higher or lower during the period ended December 31, 2006, our interest expense for the year ended December 31, 2006 would have been increased or decreased by approximately $504.
Changes in market interest rates on our fixed-rate debt impact the fair value of the debt, but it has no impact on interest incurred for cash flow. If interest rates rise 100 basis points and our fixed rate debt balance remains constant, we expect the fair value of our debt to decrease. The sensitivity analysis related to our fixed-rate debt assumes an immediate 100 basis point move in interest rates from their December 31, 2006 levels, with all other variables held constant. A 100 basis point increase in market interest rates would result in the fair value of our fixed-rate debt approximating $482 million, and a 100 basis point decrease in market interest rates would result in the fair value of our fixed-rate debt approximating $585 million.
We regularly review interest rate exposure on our outstanding borrowings in an effort to minimize the risk of interest rate fluctuations. For debt obligations outstanding at December 31, 2006, the following table presents expected principal repayments and related weighted average interest rates by expected maturity dates (in thousands): 2007 2008 2009 2010 2011 Thereafter Total Fixed Rate Debt 3,145 21,578 29,683 24,286 6,159 447,829 532,680
Average Interest Rate 6.23 % 6.23% 6.20% 6.09% 6.09% 6.07% 6.15%
Floating Rate Debt 379 395 21,603 182 182 2,433 25,174
Average Interest Rate 8.37 % 8.38% 8.00% 8.00% 8.00% 8.00% 8.12%
$ 3,524 $ 21,973 $ 51,286 $ 24,468 $ 6,341 $ 450,262 $ 557,854
The table incorporates only those exposures that existed as of December 31, 2006 and does not consider exposure or positions that could arise after that date. As a result, our ultimate realized gain or loss with respect to interest rate fluctuations will depend on the exposures that arise during the future period, prevailing interest rates, and our hedging strategies at that time. The fair value of the mortgages payable and the line of credit exceeded the carrying value by approximately $34,000 at December 31, 2006.
At December 31, 2006 and 2005, the fair value of our interest rate swap was $47 and $0, respectively and is included in other assets on the face of the consolidated balance sheets. At December 31, 2005, the fair value of the interest rate cap was $23 and is included in other assets. On June 12, 2006, we terminated the interest rate cap due to the refinancing of the associated interest rate debt instrument to a fixed rate. We received $79 in cash and reclassified $58 in reduction to interest expense as a result of the termination of this cap. The change in net unrealized gains/losses was a loss of $94 and a gain of $294 for the years ended December 31, 2006 and 2005, respectively, for derivatives designated as cash flow hedges. Hedge ineffectiveness of $14 and $13 on cash flow hedges was recognized in unrealized gain/loss on derivatives during the years ended December 31, 2006 and 2005, respectively. Hedge ineffectiveness is included in interest expense on the face of the consolidated statements of operations.

28 HERSHA 2006 ANNUAL REPORT
Item 8. Financial Statements and Supplementary Data
Hersha Hospitality Trust
Page Reports of Independent Auditors 29 Consolidated Balance Sheets as of December 31, 2006 and 2005 30 Consolidated Statements of Operations for the years ended December 31, 2006, 2005 and 2004 31 Consolidated Statements of Shareholders’ Equity and Comprehensive Income for the years ended December 31, 2006, 2005 and 2004
33 Consolidated Statements of Cash Flows for the years ended December 31, 2006, 2005 and 2004 34 Notes to Consolidated Financial Statements 36 Schedule III - Real Estate and Accumulated Depreciation for the year ended December 31, 2006 72

29 HERSHA 2006 ANNUAL REPORT
Report of Independent Registered Public Accounting Firm
The Board of Trustees and Shareholders of Hersha Hospitality Trust: We have audited the accompanying consolidated balance sheets of Hersha Hospitality Trust and subsidiaries as of December 31, 2006 and 2005, and the related consolidated statements of operations, shareholders’ equity and comprehensive income, and cash flows for each of the years in the three-year period ended December 31, 2006. In connection with our audits of the consolidated financial statements, we also have audited the financial statement schedule as listed in the accompanying index. These consolidated financial statements and financial statement schedule are the responsibility of the Company’s management. Our responsibility is to express an opinion on these consolidated financial statements and financial statement schedule based on our audits. We did not audit the financial statements of Mystic Partners, LLC an equity method investee company (See note 3). The Company's investment in Mystic Partners, LLC at December 31, 2006 and 2005, was $39,180,000 and $40,393,000, respectively, and its equity in earnings of Mystic Partners, LLC was $1,691,000 and $61,000 for the years ended December 31, 2006 and 2005, respectively. The financial statements of Mystic Partners, LLC were audited by other auditors whose report has been furnished to us, and our opinion, insofar as it relates to the amounts included for Mystic Partners, is based on the report of the other auditors. We conducted our audits in accordance with the standards of the Public Company Accounting Oversight Board (United States). Those standards require that we plan and perform the audit to obtain reasonable assurance about whether the financial statements are free of material misstatement. An audit includes examining, on a test basis, evidence supporting the amounts and disclosures in the financial statements. An audit also includes assessing the accounting principles used and significant estimates made by management, as well as evaluating the overall financial statement presentation. We believe that our audits provide a reasonable basis for our opinion. In our opinion, based on our audits and the reports of the other auditors, the consolidated financial statements referred to above present fairly, in all material respects, the financial position of Hersha Hospitality Trust and subsidiaries as of December 31, 2006 and 2005, and the results of their operations and their cash flows for each of the years in the three-year period ended December 31, 2006, in conformity with U.S. generally accepted accounting principles. Also in our opinion, the related financial statement schedule, when considered in relation to the basic consolidated financial statements taken as a whole, presents fairly, in all material respects, the information set forth therein. We also have audited, in accordance with the standards of the Public Company Accounting Oversight Board (United States), the effectiveness of Hersha Hospitality Trust’s internal control over financial reporting as of December 31, 2006, based on criteria established in Internal Control—Integrated Framework issued by the Committee of Sponsoring Organizations of the Treadway Commission (COSO), and our report dated March 15, 2006, expressed an unqualified opinion on management’s assessment of, and the effective operation of, internal control over financial reporting. /s/ KPMG LLP Philadelphia, Pennsylvania March 15, 2007

30 HERSHA 2006 ANNUAL REPORT
___________________________________________________________________________________ HERSHA HOSPITALITY TRUST AND SUBSIDIARIES CONSOLIDATED BALANCE SHEETS AS OF DECEMBER 31, 2006 AND 2005 [IN THOUSANDS, EXCEPT SHARE AMOUNTS] ___________________________________________________________________________________
December 31,
2006 December 31,
2005Assets:
Investment in Hotel Properties, net of Accumulated Depreciation $ 807,784 $ 317,980 Investment in Joint Ventures 50,234 55,981 Development Loans Receivable 47,016 32,450 Cash and Cash Equivalents 10,316 8,780 Escrow Deposits 14,927 7,329 Hotel Accounts Receivable, net of allowance for doubtful accounts of $30 and $372 4,608 2,211 Deferred Costs, net of Accumulated Amortization of $1,543 and $1,437 7,525 4,131 Due from Related Parties 4,930 2,799 Intangible Assets, net of Accumulated Amortization of $618 and $478 5,594 4,681 Other Assets 15,274 15,606 Hotel Assets Held for Sale - 3,407
Total Assets $ 968,208 $ 455,355
Liabilities and Shareholders’ Equity:
Line of Credit $ 24,000 $ - Mortgages and Notes Payable, net of unamortized discount of $1,312 and $0 556,542 256,146 Accounts Payable, Accrued Expenses and Other Liabilities 14,740 7,099 Dividends and Distributions Payable 8,985 5,151 Due to Related Parties 3,297 4,655 Liabilities Related to Hotel Assets Held for Sale - 375
Total Liabilities 607,564 273,426
Minority Interests: Common Units $ 25,933 $ 15,147 Interest in Consolidated Joint Ventures 3,092 2,079
Total Minority Interests 29,025 17,226
Shareholders' Equity: Preferred Shares - 8% Series A, $.01 Par Value, 10,000,000 Shares Authorized, 2,400,000 Shares Issued
and Outstanding at December 31, 2006 and 2005 (Aggregate Liquidation Preference $60,000 at December 30, 2006 and 2005) 24 24
Common Shares - Class A, $.01 Par Value, 50,000,000 Shares Authorized, 40,671,950 and 20,373,752 Shares Issued and Outstanding at December 31, 2006 and 2005 405 203
Common Shares - Class B, $.01 Par Value, 50,000,000 Shares Authorized, None Issued and Outstanding - -
Accumulated Other Comprehensive Income 233 327 Additional Paid-in Capital 381,592 193,228 Distributions in Excess of Net Income (50,635) (29,079)
Total Shareholders' Equity 331,619 164,703
Total Liabilities and Shareholders’ Equity $ 968,208 $ 455,355
The Accompanying Notes Are an Integral Part of These Consolidated Financial Statements.

31 HERSHA 2006 ANNUAL REPORT
___________________________________________________________________________________ HERSHA HOSPITALITY TRUST AND SUBSIDIARIES CONSOLIDATED STATEMENTS OF OPERATIONS FOR THE YEARS ENDED DECEMBER 31, 2006, 2005 AND 2004 [IN THOUSANDS, EXCEPT SHARE AND PER SHARE AMOUNTS] ___________________________________________________________________________________
2006 2005 2004 Revenue: Hotel Operating Revenues $ 142,180 $ 75,203 $ 42,470 Interest Income From Development Loans 2,487 3,940 2,191 Land Lease Revenue 2,071 - - Hotel Lease Revenue 391 - 1,192 Other Revenues 759 529 176 Total Revenue 147,888 79,672 46,029 Operating Expenses: Hotel Operating Expenses 83,474 46,082 26,890 Hotel Ground Rent 804 433 504 Land Lease Expense 1,189 - - Real Estate and Personal Property Taxes and Property Insurance 6,670 4,067 2,851 General and Administrative 6,238 4,972 3,150 Depreciation and Amortization 20,011 9,548 5,964 Total Operating Expenses 118,386 65,102 39,359 Operating Income 29,502 14,570 6,670 Interest Income 1,182 602 241 Interest expense 26,532 13,137 5,213 Loss on Debt Extinguishment 1,485 - -
Income before income from Unconsolidated Joint Venture Investments, Minority Interests and Discontinued Operations 2,667 2,035 1,698 Income from Unconsolidated Joint Venture Investments
1,799 457 481
Income Before Minority Interest and Discontinued Operations 4,466 2,492 2,179 Distributions to Preferred Unitholders - - 499
Income Allocated to Minority Interest in Continuing Operations 551 38 210 Income from Continuing Operations 3,915 2,454 1,470 Discontinued Operations, net of minority interest (note 12): Gain on Disposition of Hotel Properties 693 1,161 - Income (Loss) from Discontinued Operations 490 (318) 579 Income from Discontinued Operations 1,183 843 579 Net Income 5,098 3,297 2,049 Preferred Distributions 4,800 1,920 -
Net Income applicable to Common Shareholders $ 298 $ 1,377 $ 2,049
The Accompanying Notes Are an Integral Part of These Consolidated Financial Statements.

32 HERSHA 2006 ANNUAL REPORT
___________________________________________________________________________________ HERSHA HOSPITALITY TRUST AND SUBSIDIARIES CONSOLIDATED STATEMENTS OF OPERATIONS FOR THE YEARS ENDED DECEMBER 31, 2006, 2005 AND 2004 [IN THOUSANDS, EXCEPT SHARE AND PER SHARE AMOUNTS] ___________________________________________________________________________________ 2006 2005 2004 Earnings Per Share:
BASIC (Loss) income from continuing operations applicable to common
shareholders $ (0.03) $ 0.03 $ 0.09 Income from Discontinued Operations $ 0.04 $ 0.04 $ 0.04
Net Income applicable to common shareholders $ 0.01 $ 0.07 $ 0.13
DILUTED
(Loss) income from continuing operations applicable to commonshareholders $ (0.03)* $ 0.03 * $ 0.09 *
Income from Discontinued Operations $ 0.04* $ 0.04 * $ 0.04 *
Net Income applicable to common shareholders $ 0.01* $ 0.07 * $ 0.13 *
Weighted Average Common Shares Outstanding:
Basic 27,118,264 20,293,554 16,391,805 Diluted 27,118,264 * 20,335,181 * 16,391,805*
* Income allocated to minority interest in the Partnership has been excluded from the numerator and Partnership units have
been omitted from the denominator for the purpose of computing diluted earnings per share for the years ended December 31, 2006, 2005 and 2004 since the effect of including these amounts in the numerator and denominator would have no impact. Unvested stock awards have been omitted from the denominator for the purpose of computing diluted earnings per share for the year ended December 31, 2006 since the effect of including this amount in the denominator would be anti-dilutive to loss for continuing operations applicable to common shareholders.
The Accompanying Notes Are an Integral Part of These Consolidated Financial Statements.

33 HERSHA 2006 ANNUAL REPORT
___________________________________________________________________________________ HERSHA HOSPITALITY TRUST AND SUBSIDIARIES CONSOLIDATED STATEMENTS OF SHAREHOLDERS’ EQUITY AND COMPREHENSIVE INCOME FOR THE YEARS ENDED DECEMBER 31, 2006, 2005 AND 2004 [IN THOUSANDS, EXCEPT SHARE AND PER SHARE AMOUNTS] ___________________________________________________________________________________
Class A
Common Shares Class B
Common Shares Class A
Preferred Shares Additional
Paid-In
Other Compre-hensive
Distribu-tions
in Excessof Net
Shares Dollars Shares Dollars Shares Dollars Capital Income Earnings TotalBalance at December 31, 2003 12,355,075 $ 124 - $ - - $ - $ 76,496 $ - $ (5,160 ) $ 71,460 Common Stock Issuance 3,900,000 39 - - - - 36,504 - - 36,543 Issuance Costs - - - - - - (324) (324)Unit Conversion 4,032,460 40 - - - - 24,820 - - 24,860 Reallocation of Minority Interest due to Equity Issuance - - - - - - (2,155) - - (2,155)Dividends Declared:
Common Stock ($0.72 per share) - - - - - - - - (12,696) (12,696)
Dividend Reinvestment Plan 2,448 - 22 - - 22 Comprehensive Income:
Other Comprehensive Income - - - - - - - 33 - 33 Net Income - - - - - - - - 2,049 2,049
Total Comprehensive Income 2,082
Balance at December 31, 2004 20,289,983 203 - - - - 135,363 33 (15,807) 119,792 Preferred Stock Issuance - - - - 2,400,000 24 58,086 - - 58,110 Issuance Costs - - - - - - (390) - - (390 )Unit Conversion 8,155 - - - - - 46 - - 46 Dividends declared:
Common Stock ($0.72 per share) - - - - - - - - (14,649) (14,649)Preferred Stock ($0.89 per share) - - - - - - - - (1,920) (1,920)
Dividend Reinvestment Plan 2,519 - - - - - 24 - - 24 Stock Based Compensation
Restricted Share Award Grants 71,000 - - - - - - - - - Restricted Share Award Vesting - - - - - - 99 - - 99 Share Grants to Trustees 2,095 - - - - - - - - -
Comprehensive Income: Other Comprehensive Income - - - - - - - 294 - 294 Net Income - - - - - - - - 3,297 3,297
Total Comprehensive Income 3,591
Balance at December 31, 2005 20,373,752 203 - - 2,400,000 24 193,228 327 (29,079) 164,703 Common Stock Issuance 20,118,750 201 - - - - 191,875 - - 192,076 Issuance Costs - - - - - - (1,061) (1,061)Unit Conversion 82,077 1 - - - - 649 - - 650 Reallocation of Minority Interest due to Equity Issuance - - - - - - (3,467) - - (3,467)Dividends declared:
Common Stock ($0.72 per share) - - - - - - - -
(21,854 ) (21,854)
Preferred Stock ($2.00 per share) - - - - - - - - (4,800) (4,800)
Dividend Reinvestment Plan 2,871 - - - - - 29 - - 29 Stock Based Compensation
Restricted Share Award Grants 89,500 - - - - - - - - - Restricted Share Award Vesting - - - - - - 293 293 Share Grants to Trustees 5,000 - - - - - 46 - - 46
Comprehensive Income: Other Comprehensive Income - - - - - - - (94) - (94)Net Income - - - - - - - - 5,098 5,098
Total Comprehensive Income 5,004
Balance at December 31, 2006 40,671,950 $ 405 - $ - 2,400,000 $ 24 $ 381,592 $ 233 $ (50,635) $ 331,619
The Accompanying Notes Are an Integral Part of These Consolidated Financial Statements.

34 HERSHA 2006 ANNUAL REPORT
___________________________________________________________________________________ HERSHA HOSPITALITY TRUST AND SUBSIDIARIES CONSOLIDATED STATEMENTS OF CASH FLOWS FOR THE YEARS ENDED DECEMBER 31, 2006, 2005, AND 2004 [IN THOUSANDS, EXCEPT SHARE AND PER SHARE AMOUNTS] ___________________________________________________________________________________
2006 2005 2004 Operating activities:
Net Income $ 5,098 $ 3,297 $ 2,049 Adjustments to reconcile net income to net cash provided by operating activities:
Gain on disposition of hotel assets held for sale (784) (1,323 ) - Depreciation 20,131 10,696 6,959 Amortization 1,118 672 241 Debt extinguishment 1,485 - - Income allocated to minority interests 706 154 348 Equity in income of unconsolidated joint ventures (1,799) (457 ) (481)Distributions from unconsolidated joint ventures 4,578 838 - Gain recognized on change in fair value of derivative instrument (197) (13 ) - Stock based compensation expense 339 99 -
Change in assets and liabilities: (Increase) in:
Hotel accounts receivable (1,731) (435 ) (1,553)Escrows (87) (1,074 ) 113 Other assets (2,781) (1,923 ) (894)Due from related party (2,131) (1,431 ) 1,779
Increase (decrease) in: Due to related party (1,448) 4,419 (290)Accounts payable and accrued expenses 4,720 1,483 3,877
Net cash provided by operating activities 27,217 15,002 12,148
Investing activities: Purchase of hotel property assets (395,359) (135,059 ) (51,516)Capital expenditures (11,020) (2,958 ) (2,494)Proceeds from disposition of hotel assets held for sale 9,800 6,288 - Deposits on hotel acquisitions (2,100) (8,250 ) - Cash paid for franchise fee intangible (46 ) (302 ) - Investment in common stock of Trust entities - (1,548 ) - Investments in notes receivable (1,057) (1,166 ) (13,939)Repayment of notes receivable 1,909 83 15,133 Investment in development loans receivable (51,616) (31,345 ) (20,550)Repayment of development loans receivable 37,050 30,725 - Distributions from unconsolidated joint ventures 2,767 411 - Advances and capital contributions to unconsolidated joint ventures (4,209) (47,704 ) (5,012)
Net cash used in investing activities (413,881) (190,825 ) (78,378)
The Accompanying Notes Are an Integral Part of These Consolidated Financial Statements.

35 HERSHA 2006 ANNUAL REPORT
___________________________________________________________________________________ HERSHA HOSPITALITY TRUST AND SUBSIDIARIES CONSOLIDATED STATEMENTS OF CASH FLOWS FOR THE YEARS ENDED DECEMBER 31, 2006, 2005, AND 2004 [IN THOUSANDS, EXCEPT SHARE AND PER SHARE AMOUNTS] ___________________________________________________________________________________
2006 2005 2004 Financing activities:
Proceeds from (repayments of) borrowings under line of credit, net 24,000 (1,027 ) 1,027 Principal repayment of mortgages and notes payable (80,222 ) (6,189 ) (7,283)Proceeds from mortgages and notes payable 280,205 133,692 37,375 Settlement (acquisition) of interest rate derivative 79 (23 ) - Cash paid for deferred financing costs (1,224 ) (2,460 ) (325)Proceeds from issuance of common stock, net 191,015 - 38,279 Proceeds from issuance of preferred stock, net - 57,720 - Redemption of common partnership units - - (8,951)Preferred distributions paid on Series A Preferred Units - - (499)Contributions from partners in consolidated joint ventures - 198 - Distributions to partners in consolidated joint ventures (221 ) (317 ) - Dividends paid on common shares (18,174 ) (14,599 ) (11,267)Dividends paid on preferred shares (4,800 ) (947 ) - Distributions paid on common partnership units (2,458 ) (2,059 ) (2,219)
Net cash provided by financing activities 388,200 163,989 46,137
Net increase (decrease) in cash and cash equivalents 1,536 (11,834 ) (20,093)Cash and cash equivalents - beginning of year 8,780 20,614 40,707
Cash and cash equivalents - end of year $ 10,316 $ 8,780 $ 20,614
The Accompanying Notes Are an Integral Part of These Consolidated Financial Statements.
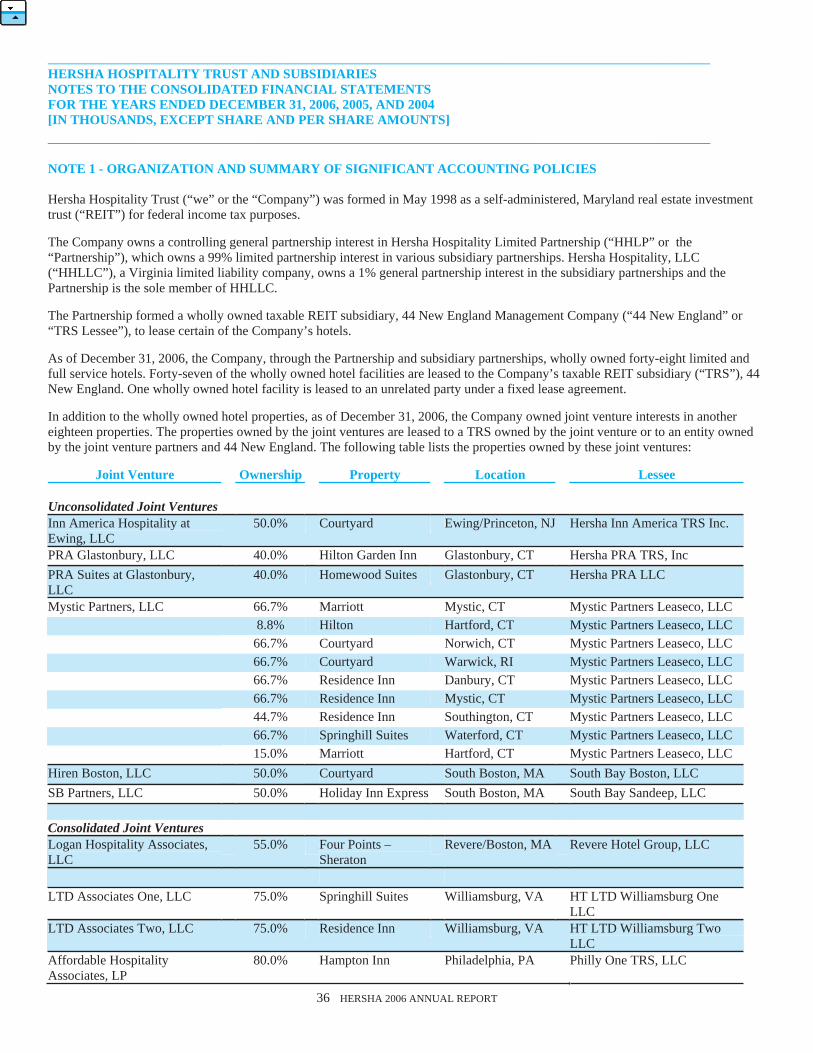
36 HERSHA 2006 ANNUAL REPORT
___________________________________________________________________________________ HERSHA HOSPITALITY TRUST AND SUBSIDIARIES NOTES TO THE CONSOLIDATED FINANCIAL STATEMENTS FOR THE YEARS ENDED DECEMBER 31, 2006, 2005, AND 2004 [IN THOUSANDS, EXCEPT SHARE AND PER SHARE AMOUNTS] ___________________________________________________________________________________ NOTE 1 - ORGANIZATION AND SUMMARY OF SIGNIFICANT ACCOUNTING POLICIES Hersha Hospitality Trust (“we” or the “Company”) was formed in May 1998 as a self-administered, Maryland real estate investment trust (“REIT”) for federal income tax purposes. The Company owns a controlling general partnership interest in Hersha Hospitality Limited Partnership (“HHLP” or the “Partnership”), which owns a 99% limited partnership interest in various subsidiary partnerships. Hersha Hospitality, LLC (“HHLLC”), a Virginia limited liability company, owns a 1% general partnership interest in the subsidiary partnerships and the Partnership is the sole member of HHLLC. The Partnership formed a wholly owned taxable REIT subsidiary, 44 New England Management Company (“44 New England” or “TRS Lessee”), to lease certain of the Company’s hotels. As of December 31, 2006, the Company, through the Partnership and subsidiary partnerships, wholly owned forty-eight limited and full service hotels. Forty-seven of the wholly owned hotel facilities are leased to the Company’s taxable REIT subsidiary (“TRS”), 44 New England. One wholly owned hotel facility is leased to an unrelated party under a fixed lease agreement. In addition to the wholly owned hotel properties, as of December 31, 2006, the Company owned joint venture interests in another eighteen properties. The properties owned by the joint ventures are leased to a TRS owned by the joint venture or to an entity owned by the joint venture partners and 44 New England. The following table lists the properties owned by these joint ventures:
Joint Venture Ownership Property Location Lessee Unconsolidated Joint Ventures Inn America Hospitality at Ewing, LLC
50.0% Courtyard Ewing/Princeton, NJ Hersha Inn America TRS Inc.
PRA Glastonbury, LLC 40.0% Hilton Garden Inn Glastonbury, CT Hersha PRA TRS, Inc PRA Suites at Glastonbury, LLC
40.0% Homewood Suites Glastonbury, CT Hersha PRA LLC
Mystic Partners, LLC 66.7% Marriott Mystic, CT Mystic Partners Leaseco, LLC 8.8% Hilton Hartford, CT Mystic Partners Leaseco, LLC 66.7% Courtyard Norwich, CT Mystic Partners Leaseco, LLC 66.7% Courtyard Warwick, RI Mystic Partners Leaseco, LLC 66.7% Residence Inn Danbury, CT Mystic Partners Leaseco, LLC 66.7% Residence Inn Mystic, CT Mystic Partners Leaseco, LLC 44.7% Residence Inn Southington, CT Mystic Partners Leaseco, LLC 66.7% Springhill Suites Waterford, CT Mystic Partners Leaseco, LLC 15.0% Marriott Hartford, CT Mystic Partners Leaseco, LLC Hiren Boston, LLC 50.0% Courtyard South Boston, MA South Bay Boston, LLC SB Partners, LLC 50.0% Holiday Inn Express South Boston, MA South Bay Sandeep, LLC Consolidated Joint Ventures Logan Hospitality Associates, LLC
55.0% Four Points – Sheraton
Revere/Boston, MA Revere Hotel Group, LLC
LTD Associates One, LLC 75.0% Springhill Suites Williamsburg, VA HT LTD Williamsburg One LLC
LTD Associates Two, LLC 75.0% Residence Inn Williamsburg, VA HT LTD Williamsburg Two LLC
Affordable Hospitality Associates, LP
80.0% Hampton Inn Philadelphia, PA Philly One TRS, LLC

37 HERSHA 2006 ANNUAL REPORT
___________________________________________________________________________________ HERSHA HOSPITALITY TRUST AND SUBSIDIARIES NOTES TO THE CONSOLIDATED FINANCIAL STATEMENTS FOR THE YEARS ENDED DECEMBER 31, 2006, 2005, AND 2004 [IN THOUSANDS, EXCEPT SHARE AND PER SHARE AMOUNTS] ___________________________________________________________________________________ NOTE 1 - ORGANIZATION AND SUMMARY OF SIGNIFICANT ACCOUNTING POLICIES (CONTINUED) Mystic Partners, LLC owns an interest in nine hotel properties. Our interest in Mystic Partners, LLC is relative to our interest in each of the nine properties owned by the joint venture as defined in the joint venture’s governing documents. Each of the nine properties owned by Mystic Partners, LLC is leased to a separate entity that is consolidated in Mystic Partners Leaseco, LLC which is owned by 44 New England and our joint venture partner in Mystic Partners, LLC. New England and the joint venture TRS lessees lease the hotel properties pursuant to separate percentage lease agreements (the “Percentage Leases”) that provide for percentage rents based on the revenues of the hotels. The properties are managed by eligible independent management companies, including Hersha Hospitality Management, LP (“HHMLP”), HHMLP is owned in part by four of the Company’s executive officers, two of its trustees and other third party investors. Principles of Consolidation and Presentation The accompanying consolidated financial statements have been prepared in accordance with generally accepted accounting principles and include all of our accounts as well as accounts of the Partnership, subsidiary partnerships and our wholly owned TRS Lessee. All significant inter-company amounts have been eliminated. Consolidated properties are either wholly owned or owned less than 100% by the Partnership and are controlled by the Company as general partner of the Partnership. Properties owned in joint ventures are also consolidated if the determination is made that we are the primary beneficiary in a variable interest entity (VIE) or we maintain control of the asset through our voting interest in the entity. Control can be demonstrated by the ability of the general partner to manage day-to-day operations, refinance debt and sell the assets of the partnerships without the consent of the limited partners and the inability of the limited partners to replace the general partner. Control can be demonstrated by the limited partners if the limited partners have the right to dissolve or liquidate the partnership or otherwise remove the general partner without cause or have rights to participate in the significant decisions made in the ordinary course of the partnership’s business. We evaluate each of our investments and contractual relationships to determine whether they meet the guidelines of consolidation. Our examination consists of reviewing the sufficiency of equity at risk, controlling financial interests, voting rights, and the obligation to absorb expected losses and expected gains, including residual returns. Based on our examination, the following entities were determined to be VIE’s: Mystic Partners, LLC; Mystic Partners Leaseco, LLC; Hersha PRA LLC; South Bay Boston, LLC; HT LTD Williamsburg One LLC; HT LTD Williamsburg Two LLC; Philly One TRS, LLC; Hersha Statutory Trust I; and Hersha Statutory Trust II. Mystic Partners, LLC is a VIE entity, however because we are not the primary beneficiary it is not consolidated by the Company. Also, Mystic Partners Leaseco, LLC; Hersha PRA LLC; South Bay Boston, LLC; HT LTD Williamsburg One LLC; HT LTD Williamsburg Two LLC; and Philly One TRS, LLC lease hotel properties from our joint venture interests and are variable interest entities. These entities are consolidated by the lessors, the primary beneficiaries of each entity. Hersha Statutory Trust I and Hersha Statutory Trust II are VIEs but HHLP is not the primary beneficiary in these entities. The accounts of Hersha Statutory Trust I and Hersha Statutory Trust II are not consolidated with and into HHLP. We have consolidated the operations of the Logan Hospitality Associates, LLC; LTD Associates One, LLC; LTD Associates Two, LLC; and Affordable Hospitality Associates, LP joint ventures because each entity is a voting interest entity and the Company owns a majority voting interest in the venture. Use of Estimates The preparation of financial statements in conformity with accounting principles generally accepted in the United States (GAAP) requires management to make estimates and assumptions that affect the reported amount of assets and liabilities and disclosure of contingent assets and liabilities at the date of the financial statements and the reported amounts of revenue and expenses during the reporting period. Actual results could differ from those estimates.

38 HERSHA 2006 ANNUAL REPORT
___________________________________________________________________________________ HERSHA HOSPITALITY TRUST AND SUBSIDIARIES NOTES TO THE CONSOLIDATED FINANCIAL STATEMENTS FOR THE YEARS ENDED DECEMBER 31, 2006, 2005, AND 2004 [IN THOUSANDS, EXCEPT SHARE AND PER SHARE AMOUNTS] ___________________________________________________________________________________ NOTE 1 - ORGANIZATION AND SUMMARY OF SIGNIFICANT ACCOUNTING POLICIES (CONTINUED) Investment in Hotel Properties The Company allocates the purchase price of hotel properties acquired based on the fair value of the acquired real estate, furniture, fixtures and equipment, and intangible assets and the fair value of liabilities assumed, including debt. The Company’s investments in hotel properties are carried at cost and are depreciated using the straight-line method over the following estimated useful lives:
Building and Improvements 15 to 40 years Furniture, Fuxtures and Equipment 5 to 7 years
The Company periodically reviews the carrying value of each hotel to determine if circumstances exist indicating impairment to the carrying value of the investment in the hotel or that depreciation periods should be modified. If facts or circumstances support the possibility of impairment, the Company will prepare an estimate of the undiscounted future cash flows, without interest charges, of the specific hotel and determine if the investment in such hotel is recoverable based on the undiscounted future cash flows. If impairment is indicated, an adjustment will be made to the carrying value of the hotel to reflect the hotel at fair value. The Company does not believe that there are any facts or circumstances indicating impairment in the carrying value of any of its hotels. In accordance with the provisions of Financial Accounting Standards Board Statement No. 144, “Accounting for the Impairment or Disposal of Long-Lived Assets,” a hotel is considered held for sale when management and our independent trustees commit to a plan to sell the property, the property is available for sale, management engages in active program to locate a buyer for the property and it is probable the sale will be completed within a year of the initiation of the plan to sell. Investment in Unconsolidated Joint Ventures If it is determined that we do not have a controlling interest in a joint venture, either through our financial interest in a VIE or our voting interest in a voting interest entity, the equity method of accounting is used. Under this method, the investment, originally recorded at cost, is adjusted to recognize our share of net earnings or losses of the affiliates as they occur rather then as dividends or other distributions are received, limited to the extent of our investment in, advances to and commitments for the investee. Pursuant to our joint venture agreements, allocations of profits and losses of some of our investments in unconsolidated joint ventures may be allocated disproportionately as compared to the ownership percentages due to specified preferred return rate thresholds. The Company periodically reviews the carrying value of its investment in unconsolidated joint ventures to determine if circumstances exist indicating impairment to the carrying value of the investment. If impairment is indicated, an adjustment will be made to the carrying value of or investment in the unconsolidated joint venture. The Company does not believe that there are any facts or circumstances indicating impairment in the carrying value of any of its investments in unconsolidated joint ventures. Development Loans Receivable The Company provides secured first-mortgage and mezzanine financing to hotel developers. Development loans receivable are recorded at cost and are reviewed for potential impairment at each balance sheet date. A development loan receivable is considered impaired when it becomes probable, based on current information, that the Company will be unable to collect all amounts due according to the loan’s contractual terms. The amount of impairment, if any, is measured by comparing the recorded amount of the loan to the present value of the expected cash flows or the fair value of the collateral. If a loan was deemed to be impaired, the Company would record a reserve for loan losses through a charge to income for any shortfall. To date, no such impairment charges have been recognized. The Company’s development loans receivable are each secured by various hotel or hotel development properties or partnership interests in hotel or hotel development properties. We evaluate each of our development loans to determine whether they meet the guidelines of consolidation. Our evaluation consists of reviewing the sufficiency of the borrower’s equity at risk, controlling financial interests in the borrower, voting rights of the borrower, and the borrower’s obligation to absorb expected losses and expected gains, including residual returns. We have determined that development loans receivable do not constitute a financial interest in a VIE and do not consolidate the operating results of the borrower in our consolidated financial statements. The analysis utilized by the Company in evaluating the development loans receivable involves considerable management judgment and assumptions.

39 HERSHA 2006 ANNUAL REPORT
___________________________________________________________________________________ HERSHA HOSPITALITY TRUST AND SUBSIDIARIES NOTES TO THE CONSOLIDATED FINANCIAL STATEMENTS FOR THE YEARS ENDED DECEMBER 31, 2006, 2005, AND 2004 [IN THOUSANDS, EXCEPT SHARE AND PER SHARE AMOUNTS] ___________________________________________________________________________________ NOTE 1 - ORGANIZATION AND SUMMARY OF SIGNIFICANT ACCOUNTING POLICIES (CONTINUED) Cash and Cash Equivalents Cash and cash equivalents represent cash on hand and in banks plus short-term investments with an initial maturity of three months or less when purchased. Escrow Deposits
Escrow deposits include reserves for debt service, real estate taxes, and insurance and reserves for furniture, fixtures, and equipment replacements, as required by certain mortgage debt agreement restrictions and provisions. Hotel Accounts Receivable Hotel accounts receivable consists primarily of meeting and banquet room rental and hotel guest receivables. The Company generally does not require collateral. Ongoing credit evaluations are performed and an allowance for potential losses from uncollectible accounts is provided against the portion of accounts receivable that is estimated to be uncollectible. Deferred Costs Deferred loan costs are recorded at cost and amortized over the terms of the related indebtedness using a method which approximates the effective interest method. Due from/to Related Parties Due from/to Related Parties represents current receivables and payables resulting from transactions related to hotel management and project management with affiliated entities. Due from related parties results primarily from advances of shared costs incurred. Due to affiliates results primarily from hotel management and project management fees incurred. Both due to and due from related parties are generally settled within a period not to exceed one year. Intangible Assets Intangible assets consist of goodwill, leasehold intangibles for above-market and below-market value of in-place leases, and deferred franchise fees. Goodwill is evaluated annually for impairment in accordance with Statement of Financial Accounting Standards No. 142, “Goodwill and Other Intangibles.” The leasehold intangibles are amortized over the remaining lease term. Deferred franchise fees are amortized using the straight-line method over the life of the franchise agreement. Minority Interest Minority Interest in the Partnership represents the limited partner’s proportionate share of the equity of the Partnership. Income (Loss) is allocated to minority interest in accordance with the weighted average percentage ownership of the Partnership during the period. At the end of each reporting period the appropriate adjustments to the income (loss) are made based upon the weighted average percentage ownership of the Partnership during the period. Our ownership interest in the Partnership as of December 31, 2006, 2005 and 2004 was 91.4%, 87.8% and 87.7%, respectively. We also maintain minority interests for the equity interest owned by third parties in Logan Hospitality Associates, LLC; LTD Associates One, LLC; LTD Associates Two, LLC; and Affordable Hospitality, LP. Third parties own a 45% interest in Logan Hospitality Associates, LLC; a 25% interest in each of LTD Associates One LLC and LTD Associates Two, LLC; and a 20% interest in Affordable Hospitality Associates, LP. We allocate the income (loss) of these joint ventures to the minority interest in consolidated joint ventures based upon the ownership of the entities, preferences in distributions of cash available and the terms of each venture agreement.

40 HERSHA 2006 ANNUAL REPORT
___________________________________________________________________________________ HERSHA HOSPITALITY TRUST AND SUBSIDIARIES NOTES TO THE CONSOLIDATED FINANCIAL STATEMENTS FOR THE YEARS ENDED DECEMBER 31, 2006, 2005, AND 2004 [IN THOUSANDS, EXCEPT SHARE AND PER SHARE AMOUNTS] ___________________________________________________________________________________ NOTE 1 - ORGANIZATION AND SUMMARY OF SIGNIFICANT ACCOUNTING POLICIES (CONTINUED) Shareholders’ Equity On December 11, 2006, we completed a public offering of 7,200,000 common shares at $11.20 per share. On December 13, 2006, the underwriter exercised its over-allotment option with respect to that offering, and we issued an additional 1,080,000 common shares at $11.20 per share. Proceeds to us, net of underwriting discounts and commissions and expenses, were approximately $87,658. Immediately upon closing the offering, we contributed all of the net proceeds of the offering to the Partnership in exchange for additional Partnership interests. The net offering proceeds were used to repay indebtedness and to lend additional development financing to third parties. On September 19, 2006, we completed a public offering of 3,775,000 common shares at $9.75 per share. On September 28, 2006, the underwriter exercised its over-allotment option with respect to that offering, and we issued an additional 566,250 common shares at $9.75 per share. Proceeds to us, net of underwriting discounts and commissions and expenses, were approximately $40,004. Immediately upon closing the offering, we contributed all of the net proceeds of the offering to the Partnership in exchange for additional Partnership interests. The net offering proceeds were used to repay indebtedness. On April 28, 2006, we completed a public offering of 6,520,000 common shares at $9.00 per share. On May 9, 2006, the underwriter exercised its over-allotment option with respect to that offering, and we issued an additional 977,500 common shares at $9.00 per share. Proceeds to us, net of underwriting discounts and commissions and expenses, were approximately $63,353. Immediately upon closing the offering, we contributed all of the net proceeds of the offering to the Partnership in exchange for additional Partnership interests. Of the net offering proceeds, approximately $30,000 was used to repay indebtedness and approximately $19,500 was used to fund property acquisitions. On August 5, 2005, we completed a public offering of 2,400,000 of 8.00% Series A Cumulative Redeemable Preferred Shares of Beneficial Interest, liquidation preference $25.00 per share. Net proceeds of the offering, less expenses and underwriters commissions, were approximately $57,720. Proceeds from the offering were used to finance the acquisition of the Company’s interests in Mystic Partners, LLC and SB Partners, LLC. The remaining net proceeds have been principally allocated to fund secured development loans and for general corporate purposes. Stock Based Compensation We apply Statement of Financial Accounting Standards No. 123(R), “Share-Based Payment” (SFAS 123R) whereby we measure the cost of employee service received in exchange for an award of equity instruments based on the grant-date fair value of the award. The cost is recognized over the period during which an employee is required to provide service in exchange for the award. Derivatives and Hedging The Company’s objective in using derivatives is to add stability to interest expense and to manage its exposure to interest rate movements or other identified risks. To accomplish this objective, the Company primarily uses interest rate swaps and interest rate caps as part of its cash flow hedging strategy. Interest rate swaps designated as cash flow hedges involve the receipt of variable-rate amounts in exchange for fixed-rate payments over the life of the agreements without exchange of the underlying principal amount. Interest rate caps designated as cash flow hedges limit the Company’s exposure to increased cash payments due to increases in variable interest rates. Revenue Recognition We directly recognize revenue and expense for all consolidated hotels as hotel operating revenue and hotel operating expense when earned and incurred. These revenues are recorded net of any sales or occupancy taxes collected from our guests. All revenues are recorded on an accrual basis, as earned. We participate in frequent guest programs sponsored by the brand owners of our hotels and we expense the charges associated with those programs, as incurred.

41 HERSHA 2006 ANNUAL REPORT
___________________________________________________________________________________ HERSHA HOSPITALITY TRUST AND SUBSIDIARIES NOTES TO THE CONSOLIDATED FINANCIAL STATEMENTS FOR THE YEARS ENDED DECEMBER 31, 2006, 2005, AND 2004 [IN THOUSANDS, EXCEPT SHARE AND PER SHARE AMOUNTS] ___________________________________________________________________________________ NOTE 1 - ORGANIZATION AND SUMMARY OF SIGNIFICANT ACCOUNTING POLICIES (CONTINUED) Revenue for interest on development loan financing is recorded in the period earned based on the interest rate of the loan and outstanding balance during the period. Development loans receivable and accrued interest on the development loans receivable are evaluated to determine if outstanding balances are collectible. Interest is recorded only if it is determined the outstanding loan balance and accrued interest balance are collectible. We lease land to hotel developers under fixed lease agreements. The lease agreements do not provide for increases in minimum rent. In addition to base rents, these lease agreements contain provisions that require the lessee to reimburse real estate taxes, debt service and other impositions. Base rents and reimbursements for real estate taxes, debt service and other impositions are recorded in land lease revenue on an accrual basis, when the related expenses are incurred. We lease a hotel to a third party under a fixed lease agreement. The lease agreement does not provide for increases in minimum rent over its term. In addition to base rents, the lease agreement contains provisions that require the lessee to reimburse us for real estate taxes, capital expenditures and other impositions. Base rents and reimbursements for real estate taxes, capital expenditures and other impositions are recorded in hotel lease revenue on an accrual basis, when the related expenses are incurred. Other revenues consist primarily of fees earned for asset management services provided to hotels we own through unconsolidated joint ventures. Fees are earned as a percentage of the hotels revenue and are recorded in the period earned. Income Taxes The Company qualifies as a REIT under applicable provisions of the Internal Revenue Code, as amended, and intends to continue to qualify as a REIT. In general, under such provisions, a trust which has made the required election and, in the taxable year, meets certain requirements and distributes to its shareholders at least 90% of its REIT taxable income will not be subject to Federal income tax to the extent of the income which it distributes. Earnings and profits, which determine the taxability of dividends to shareholders, differ from net income reported for financial reporting purposes due primarily to differences in depreciation of hotel properties for Federal income tax purposes. Deferred income taxes relate primarily to the TRS Lessee and are accounted for using the asset and liability method. Under this method, deferred income taxes are recognized for temporary differences between the financial reporting bases of assets and liabilities of the TRS Lessee and their respective tax bases and for their operating loss and tax credit carry forwards based on enacted tax rates expected to be in effect when such amounts are realized or settled. However, deferred tax assets are recognized only to the extent that it is more likely than not that they will be realized based on consideration of available evidence, including tax planning strategies and other factors. Although the TRS Lessee is expected to operate at a profit for Federal income tax purposes in future periods, the value of the deferred tax asset is not able to be quantified with certainty. Therefore, any deferred tax assets have been reserved as we have not concluded that it is more likely than not that these deferred tax assets will be realizable. Reclassification Certain amounts in the prior year financial statements have been reclassified to conform to the current year presentation.

42 HERSHA 2006 ANNUAL REPORT
___________________________________________________________________________________ HERSHA HOSPITALITY TRUST AND SUBSIDIARIES NOTES TO THE CONSOLIDATED FINANCIAL STATEMENTS FOR THE YEARS ENDED DECEMBER 31, 2006, 2005, AND 2004 [IN THOUSANDS, EXCEPT SHARE AND PER SHARE AMOUNTS] ___________________________________________________________________________________ NOTE 1 - ORGANIZATION AND SUMMARY OF SIGNIFICANT ACCOUNTING POLICIES (CONTINUED) Recent Accounting Pronouncements SFAS No. 157 In September 2006, the FASB issued Statement of Financial Accounting Standards No. 157, “Fair Value Measurements” (“SFAS No. 157”). SFAS No. 157 establishes a new definition of fair value, provides guidance on how to measure fair value and establishes new disclosure requirements of assets and liabilities at their fair value measurements. SFAS No. 157 is effective for fiscal years beginning after November 15, 2007. The Company has not determined whether the adoption of SFAS No. 157 will have a material effect on the Company’s financial statements. SAB 108 In September 2006, the SEC’s staff issued Staff Accounting Bulletin (“SAB”) No. 108, “Considering the Effects of Prior Year Misstatements when Quantifying Misstatements in Current Year Financial Statements.” This Bulletin provides guidance on the consideration of the effects of prior year misstatements in quantifying current year misstatements for the purpose of a materiality assessment. The guidance in SAB No. 108 must be applied to financial reports covering the first fiscal year ending after November 15, 2006. The adoption of SAB No. 108 had no impact on the Company’s financial statements. FIN 48 In June 2006, the FASB issued FASB Interpretation No. 48, “Accounting for Uncertainty in Income Taxes” (“FIN 48”). FIN 48 addresses the recognition and measurement of tax-based benefits based on the probability that they will be realized. FIN 48 is effective for fiscal years beginning after December 15, 2006. It is expected that the adoption of FIN 48 will not have any material effect on the Company’s financial statements.

43 HERSHA 2006 ANNUAL REPORT
___________________________________________________________________________________ HERSHA HOSPITALITY TRUST AND SUBSIDIARIES NOTES TO THE CONSOLIDATED FINANCIAL STATEMENTS FOR THE YEARS ENDED DECEMBER 31, 2006, 2005, AND 2004 [IN THOUSANDS, EXCEPT SHARE AND PER SHARE AMOUNTS] ___________________________________________________________________________________ NOTE 2 - INVESTMENT IN HOTEL PROPERTIES
Investment in hotel properties consist of the following at December 31, 2006 and 2005:
December 31, 2006 December 31, 2005
Land $ 135,943 $ 32,430 Buildings and Improvements 640,666 283,791 Furniture, Fixtures and Equipment 88,179 43,528 Construction in Progress 4,359 -
869,147 359,749
Less Accumulated Depreciation (61,363) (41,769)
Total Investment in Hotel Properties $ 807,784 $ 317,980
Depreciation expense was $20,120, $10,693 and $7,356 for the years ended December 31, 2006, 2005 and 2004, respectively.

44 HERSHA 2006 ANNUAL REPORT
___________________________________________________________________________________ HERSHA HOSPITALITY TRUST AND SUBSIDIARIES NOTES TO THE CONSOLIDATED FINANCIAL STATEMENTS FOR THE YEARS ENDED DECEMBER 31, 2006, 2005, AND 2004 [IN THOUSANDS, EXCEPT SHARE AND PER SHARE AMOUNTS] ___________________________________________________________________________________ NOTE 2 - INVESTMENT IN HOTEL PROPERTIES (CONTINUED) During the years ended December 31, 2006, 2005 and 2004, we acquired the following wholly owned hotel properties: 2006 Acquisitions
Hotel Acquisi-tion Date Land
Buildings and
Improve-ments
Furniture Fixtures
and Equip-ment
Franchise Fees and
Loan Costs Leasehold Intangible
Total Purchase
Price
Fair Value of
Assumed Debt and Capital Lease
NJ and PA Portfolio 1/3/2006 $ 6,207 $ 30,988 $ 3,978 $ 125 - $ 41,298 - Courtyard by Marriott,
Scranton, PA 2/1/2006 761 7,192 831 57 - 8,841 - Residence Inn, Tyson's
Corner, VA 2/2/2006 4,283 14,476 1,240 201 - 20,200 9,596 Hilton Garden Inn, JFK
Airport, NY 2/16/2006 N/A 25,019 3,621 317 226 29,183 13,000 KW Portfolio, MA
April and May 2006 4,708 22,926 3,918 198 - 31,750 9,023
Holiday Inn Express, Cambridge, MA 5/3/2006 1,956 9,793 444 - - 12,193 -
Land, 39th and 8th Avenue, New York, NY 6/28/2006 21,774 - - - - 21,774
Residence Inn, Norwood, MA 7/27/2006 1,970 11,760 1,403 53 - 15,186 8,000*
Land and Building, 41st Street, New York, NY 7/28/2006 10,735 11,051 - - - 21,786
Hampton Inn, Brookhaven, NY 9/6/2006 3,131 17,343 980 242 - 21,696 15,455
Holiday Inn Express, Hauppauge, NY 9/1/2006 2,737 14,080 658 173 - 17,648 10,152
Courtyard by Marriott, Alexandria, VA 9/29/2006 6,376 26,089 2,578 - - 35,043
Hampton Inn - Chelsea, New York, NY 9/29/2006 8,905 33,499 2,930 843 - 46,177 36,202
Hyatt Summerfield Suites Portfolio 12/27/2006 29,053 123,030 16,576 - - 168,659 472
Total 2006 Wholly Owned Acquisitions $ 102,596 $ 347,246 $ 39,157 $ 2,209 $ 226 $ 491,434 $ 101,900
In connection with the 2006 acquisitions we acquired $3,356 in working capital. In addition to cash, consideration included $9,940 in units in our operating partnership and $5,250 in deposits made in 2005. On August 29, 2003, HT/CNL Metro Hotels, LP purchased the Hampton Inn, (Manhattan) Chelsea, NY. We owned a one-third equity interest in this joint venture partnership while CNL Hospitality Partners LP (“CNL”) owned the remaining equity interests. On September 29, 2006, we acquired CNL’s remaining equity interest in the venture. Prior to the acquisition of the CNL’s remaining interest, our investment in joint venture was $4,409 and was recorded in investments in joint ventures. Our share of the operating results of the venture through September 29, 2006 is included in Income from Unconsolidated Joint Ventures on the statement of operations. *The $8,000 assumed mortgage for Residence Inn, Norwood was repaid in full in September 2006.

45 HERSHA 2006 ANNUAL REPORT
___________________________________________________________________________________ HERSHA HOSPITALITY TRUST AND SUBSIDIARIES NOTES TO THE CONSOLIDATED FINANCIAL STATEMENTS FOR THE YEARS ENDED DECEMBER 31, 2006, 2005, AND 2004 [IN THOUSANDS, EXCEPT SHARE AND PER SHARE AMOUNTS] ___________________________________________________________________________________ NOTE 2 - INVESTMENT IN HOTEL PROPERTIES (CONTINUED) 2005 Acquisitions
Hotel
Acqui-sition Date Land
Buildings and
Improve-ments
Furniture Fixtures
and Equipment
Franchise Fees and
Loan Costs Leasehold Intangible
Total Purchase
Price
Fair Value of Assumed
Debt and Capital Lease
Fairfield Inn, Laurel, MD 1/31/2005 $ 927 $ 6,120 $ 344 $ 44
$ - $ 7,435 $ -
Hampton Inn, New York, NY 4/1/2005 5,472 23,497 2,364 547 - 31,880 16,500
McIntosh Portfolio, PA and DE
May and June, 2005 8,171 40,046 1,572 776 - 50,565 -
Courtyard by Marriot, Brookline, MA 6/16/2005 N/A 47,414 3,760 259 3,570 55,003 -
Total 2005 Wholly Owned Acquisitions $ 14,570 $ 117,077 $ 8,040 $ 1,626 $ 3,570 $ 144,883 $ 16,500 All of the newly acquired wholly owned hotels are leased to the TRS Lessee, and all are managed by HHMLP, except for the Courtyard by Marriott, Alexandria and the Hyatt Summerfield Suites Portfolio which are managed by unrelated third parties. The Hampton Inn located in Philadelphia, Pennsylvania is leased to an entity that is owned by the TRS Lessee and our joint venture partner. Included in the acquisition of the Hilton Garden Inn at the JFK Airport, New York, was a land lease for the underlying land with a remaining term of approximately 93 years. The remaining lease payments were determined to be below market value and as a result, $226 of the purchase price was allocated to an intangible asset. Included in the acquisition of the Courtyard by Marriott in Brookline, Massachusetts in 2005, was a prepaid land lease for the underlying land with a remaining term of approximately 90 years. This prepaid land lease is classified as an intangible asset with a value of $3,570. Both lease intangibles are recorded in intangible assets on the consolidated balance sheet and are being amortized over the remaining lives of the leases.

46 HERSHA 2006 ANNUAL REPORT
___________________________________________________________________________________ HERSHA HOSPITALITY TRUST AND SUBSIDIARIES NOTES TO THE CONSOLIDATED FINANCIAL STATEMENTS FOR THE YEARS ENDED DECEMBER 31, 2006, 2005, AND 2004 [IN THOUSANDS, EXCEPT SHARE AND PER SHARE AMOUNTS] ___________________________________________________________________________________ NOTE 2 - INVESTMENT IN HOTEL PROPERTIES (CONTINUED) As part of the acquisition of the Hyatt Summerfield Suites Portfolio, HHLP entered into a management agreement with Lodgeworks, L.P. (Lodgeworks) to manage all seven properties in the portfolio. Lodgeworks extended a $996 interest-free loan to HHLP for working capital contributions that is due at either the termination or expiration of the agreement. Since the interest rate on the note payable is below the market rate of interest at the date of the acquisition, a discount of $525 was recorded on the note payable. The discount reduces the principal balances recorded in the mortgages and notes payable and is being amortized over the remaining life of the loan and is recorded as interest expense.
During the years ended December 31, 2006, 2005 and 2004, we acquired the following consolidated joint venture hotel properties:
Hotel
Acqui-sition Date Land
Buildings and
Improve-ments
Furniture Fixtures
and Equipment
Franchise Fees
and Loan Costs
Leasehold Intangible
Total Purchase
Price
Fair Value of
Assumed Debt and Capital Lease
Hampton Inn (Affordable Hospitality), Philadelphia
2/15/2006 $ 2,928 $ 21,062 $ 3,029 $ 117 $ - $ 27,136 $ 873 Total 2006 Consolidated Joint Venture Acquisitions
$ 2,928 $ 21,062 $ 3,029 $ 117 $ - $ 27,136 $ 873
Hotel
Acquisi-tion Date Land
Buildings and
Improve-ments
Furniture Fixtures
and Equipment
Franchise Fees and
Loan Costs Leasehold Intangible
Total Purchase
Price
Fair Value of
Assumed Debt and Capital Lease
Springhill Suites (LTD One), Williamsburg, VA
11/22/2005 $ 1,430 $ 10,293 $ 2,676 $ 182 $ - $ 14,581 $ 5,797
Residence Inn (LTD Two), Williamsburg, VA
11/22/2005 $ 1,911 $ 11,624 $ 2,200 $ 239 $ - $ 15,974 $ 8,514
Total 2005 Consolidated Joint Venture Acquisitions
$ 3,341 $ 21,917 $ 4,876 $ 421 $ - $ 30,555 $ 14,311 Beginning on July 1, 2006, the Holiday Inn Conference Center, New Cumberland, Pennsylvania was leased to an unrelated party under a five-year fixed rent lease agreement. Prior to July 1, 2006, this hotel was leased to our wholly owned TRS and operating revenues and expenses of the hotel were recorded in hotel operating revenue and hotel operating expenses. Hotel lease revenue of $391 was recorded in the twelve months ended December 31, 2006 related to the lease of this property.

47 HERSHA 2006 ANNUAL REPORT
___________________________________________________________________________________ HERSHA HOSPITALITY TRUST AND SUBSIDIARIES NOTES TO THE CONSOLIDATED FINANCIAL STATEMENTS FOR THE YEARS ENDED DECEMBER 31, 2006, 2005, AND 2004 [IN THOUSANDS, EXCEPT SHARE AND PER SHARE AMOUNTS] ___________________________________________________________________________________ NOTE 2 - INVESTMENT IN HOTEL PROPERTIES (CONTINUED) Pro Forma Operating Results The following condensed pro forma financial is presented as if all 2006 and 2005 acquisitions had been consummated as of January 1, 2005. Properties acquired without any operating history are excluded from the condensed pro forma operating results. The condensed pro forma information is not necessarily indicative of what actual results of operations of the Company would have been assuming the acquisitions had been consummated at the beginning of the years presented, nor does it purport to represent the results of operations for future periods.
For the Year Ended December 31, 2006 2005 Pro Forma Total Revenues $ 206,477 $ 187,650 Pro Forma Income from Continuing Operations $ 4,627 $ (596)
Income from Discontinued Operations 1,183 843 Pro Forma Net Income 5,810 247
Preferred Distributions 4,800 1,920 Pro Forma Net Income (Loss) applicable to Common Shareholders $ 1,010 $ (1,673)
Pro Forma Income (Loss) applicable to Common Shareholders per Common Share
Basic $ 0.04 $ (0.08)Diluted $ 0.04 $ (0.08)
Weighted Average Common Shares Outstanding
Basic 27,118,264 20,293,554 Diluted 27,118,264 20,293,554

48 HERSHA 2006 ANNUAL REPORT
___________________________________________________________________________________ HERSHA HOSPITALITY TRUST AND SUBSIDIARIES NOTES TO THE CONSOLIDATED FINANCIAL STATEMENTS FOR THE YEARS ENDED DECEMBER 31, 2006, 2005, AND 2004 [IN THOUSANDS, EXCEPT SHARE AND PER SHARE AMOUNTS] ___________________________________________________________________________________ NOTE 3 - INVESTMENT IN UNCONSOLIDATED JOINT VENTURES During the years ended December 31, 2006 and 2005 we acquired interests in the following unconsolidated joint ventures:
Joint Venture Assets Owned by Joint Venture Date
Acquired
The Partnership's
Ownership in Asset
The Partnership's
Preferred Return
PRA Suites at Glastonbury, LLC Homewood Suites, Glastonbury, CT 6/15/2006 40.0% 10.0%
Mystic Partners, LLC Hartford Marriott Downtown, Hartford, CT 2/8/2006 15.0% 8.5%
Mystic Marriott Hotel & Spa, Mystic, CT 8/9/2005 66.7% 8.5%
Danbury Residence Inn, Danbury, CT 8/9/2005 66.7% 8.5%
Southington Residence Inn, Southington, CT 8/9/2005 44.7% 8.5%
Norwich Courtyard by Marriott and
Rosemont Suites, Norwich, CT 8/9/2005 66.7% 8.5%
Warwick Courtyard by Marriott, Warwick, RI 8/9/2005 66.7% 8.5%
Waterford SpringHill Suites, Waterford, CT 8/9/2005 66.7% 8.5%
Residence Inn by Marriott Hotel and
Whitehall Mansion, Stonington, CT 9/15/2005 66.7% 8.5%
Hilton Hartford - Downtown, Hartford, CT 10/6/2005 8.8% 8.5%
SB Partners, LLC Holiday Inn Express, South Boston, MA 10/7/2005 50.0% 10.0% (1)
Hiren Boston, LLC Courtyard by Marriott, South Boston, MA 7/1/2005 50.0% 10.0% (1)
(1) Preferred return accrues for first two years of the venture and then results are shared pro rata thereafter. Preferred return
period ends on June 30, 2007 for Hiren Boston, LLC and September 30, 2007 for SB Partners, LLC The PRA Suites at Glastonbury, LLC (“PRA Suites”) joint venture agreement provides for a 10% preferred return based on our contributed equity interest in PRA Suites. Cash distributions will be made from cash available for distribution, first, to us to provide a 10% annual non-compounded return on our capital contributions and then to our joint venture partner to provide a 10% annual non-compounded return of their contributions. The 10% returns are not cumulative. Any remaining cash available for distribution will be distributed 40% to us. PRA Suites allocates income to us and our joint venture partner consistent with the allocation of cash distributions and liquidating distributions.

49 HERSHA 2006 ANNUAL REPORT
___________________________________________________________________________________ HERSHA HOSPITALITY TRUST AND SUBSIDIARIES NOTES TO THE CONSOLIDATED FINANCIAL STATEMENTS FOR THE YEARS ENDED DECEMBER 31, 2006, 2005, AND 2004 [IN THOUSANDS, EXCEPT SHARE AND PER SHARE AMOUNTS] ___________________________________________________________________________________ NOTE 3 - INVESTMENT IN UNCONSOLIDATED JOINT VENTURES (CONTINUED) In June 2005, we entered into a joint venture with Waterford Hospitality and Mystic Hotel Investors, LLC (“MHI,” and together with Waterford, the “MHI Parties”), and established Mystic Partners, LLC (“Mystic Partners”). The MHI Parties contributed to Mystic Partners its membership interests in a portfolio of nine entities that own nine Marriott- or Hilton-branded hotels in Connecticut and Rhode Island. Aggregate fair value of the contributed properties was approximately $250,000. We contributed approximately $40,000 in cash to Mystic Partners in exchange for a 66.7% preferred equity interest in the seven stabilized hotel properties in the portfolio and a 50% preferred equity interest in the two newly-developed hotel properties in the portfolio, subject to minority interest participations in certain hotels. In conjunction with the acquisition of the investment in the Hartford Marriott Downtown, Hartford, CT, (“Hartford Marriott”), our equity ownership interest in the two development properties, the Hilton Hartford Downtown, Hartford, CT (“Hartford Hilton”) and the Hartford Marriott, was decreased from 50% to the following:
Hersha MHI Parties Hartford Hilton 8.8% 79.2% Hartford Marriott 15.0% 81.0%
The Hartford Hilton, Hartford Marriott and the Southington Residence Inn, Southington, CT properties maintain minority interest ownership from unrelated third party investors for approximately 12.0%, 4.0% and 33.0%, respectively. We have the option to purchase up to a 50.0% equity ownership interest in Mystic Partners’ equity interest in the Hartford Hilton and the Hartford Marriott at a price determined in the agreement. The Company and the MHI Parties jointly and severally guarantee the performance of the terms of a loan to Adriaen’s Landing Hotel, LLC, owner of the Hartford Marriott, in the amount of $50,000, and 315 Trumbull Street Associates, LLC, in the amount of $27,000, if at any time during the term of the note and during such time as the net worth of Mystic Partners falls below the amount of the guarantee. The Mystic Partners joint venture agreement provides for an 8.5% preferred return based on our preferred equity interest in the stabilized and newly-developed hotel properties. Cash distributions will be made from cash available for distribution, first, to us to provide an 8.5% annual non-compounded return on our unreturned capital contributions and then to the MHI Parties to provide an 8.5% annual non-compounded return of their unreturned contributions. The 8.5% returns are not cumulative. Any remaining cash available for distribution will be distributed to us 56.7%, with respect to the net cash flow from the stabilized properties, 10.5% with respect to the net cash flow from the Hartford Marriott, and 7.0% with respect to the Hartford Hilton. Mystic Partners will allocate income to us and the MHI Parties consistent with the allocation of cash distributions in accordance with the joint venture agreements. Each of the Mystic Partners hotel properties, except the Hartford Hilton, is under an Asset Management Agreement with 44 New England to provide asset management services. Fees for these services are paid monthly to 44 New England and recognized as income in the amount 1% of operating revenues, except for the Hartford Marriott which is 0.25% of operating revenues. Our interest in SB Partners, LLC (“SB Partners”) was acquired for approximately $2,250. Our interest in Hiren Boston. LLC (“Hiren”), was acquired for approximately $5,031. The SB Partners and Hiren joint venture agreements provide for a 10% preferred return during the first two years of the ventures based on our equity interest in the ventures. Cash distributions will be made from cash available for distribution, first, to us to provide a 10% annual non-compounded return on our capital contributions and then to our joint venture partner to provide a 10% annual non-compounded return of their contributions. The 10% returns are cumulative through the first two years of the venture. Any remaining cash available for distribution will be distributed 50% to each party. Subsequent to this initial two year period, cash distributions will be made 50% to us and 50% to our joint venture partners in the ventures. SB Partners and Hiren allocate income to us and our joint venture partner consistent with the allocation of cash distributions in accordance with the joint venture agreements.

50 HERSHA 2006 ANNUAL REPORT
___________________________________________________________________________________ HERSHA HOSPITALITY TRUST AND SUBSIDIARIES NOTES TO THE CONSOLIDATED FINANCIAL STATEMENTS FOR THE YEARS ENDED DECEMBER 31, 2006, 2005, AND 2004 [IN THOUSANDS, EXCEPT SHARE AND PER SHARE AMOUNTS] ___________________________________________________________________________________ NOTE 3 - INVESTMENT IN UNCONSOLIDATED JOINT VENTURES (CONTINUED) As of December 31, 2006 and December 31, 2005 our investment in unconsolidated joint ventures consisted of the following:
Percent Owned December 31, 2006 December 31, 2005 HT/CNL Metro Hotels, LP 33.3% $ - $ 4,487 PRA Glastonbury, LLC 40.0% 463 2,379 Inn American Hospitality at Ewing, LLC 50.0% 1,414 1,456 Hiren Boston, LLC 50.0% 4,871 5,034 SB Partners, LLC 50.0% 2,213 2,232 Mystic Partners, LLC 8.8%-66.7% 39,180 40,393 PRA Suites at Glastonbury, LLC 40.0% 2,093 - $ 50,234 $ 55,981 The following tables set forth the total assets, liabilities, equity and components of net income, including the Company’s share, related to the unconsolidated joint ventures discussed above as of December 31, 2006 and December 31, 2005 and for the years ended December 31, 2006, 2005, and 2004.
Balance Sheets December 31, December 31, 2006 2005
Investment in hotel properties, net $ 244,113 $ 182,708
Other Assets 24,496 22,708
Assets $ 268,609 $ 205,416
Liabilities and Equity
Mortgages and notes payable $ 211,576 $ 166,564
Other liabilities 11,687 8,326
Equity:
Hersha Hospitality Trust 50,234 56,194
Other (4,888) (25,668)
Total Liabilities and Equity $ 268,609 $ 205,416
Statements of Operations Twelve Months Ended 12/31/2006 12/31/2005 12/31/2004
Room Revenue $ 81,285 $ 33,493 $ 12,966 Other Revenue 30,020 8,679 1,120 Operating Expenses (74,370) (26,401) (7,752)Interest Expense (15,69) (5,521) (1,733)Land Lease Expense (393) (159) - Property Taxes and Insurance (5,537) (2,781) (930)Federal and State Income Taxes (224) 71 (181)Depreciation, Amortization, and Other (24,774) (7,773) (2,164)
Net (loss) income $ (9,684) $ (392) $ 1,326

51 HERSHA 2006 ANNUAL REPORT
___________________________________________________________________________________ HERSHA HOSPITALITY TRUST AND SUBSIDIARIES NOTES TO THE CONSOLIDATED FINANCIAL STATEMENTS FOR THE YEARS ENDED DECEMBER 31, 2006, 2005, AND 2004 [IN THOUSANDS, EXCEPT SHARE AND PER SHARE AMOUNTS] ___________________________________________________________________________________ NOTE 3 - INVESTMENT IN UNCONSOLIDATED JOINT VENTURES (CONTINUED)
Equity income (loss) recognized during the years ended December 31, 2006, 2005, and 2004 for our Equity Investments in Unconsolidated Joint Ventures is as follows:
Twelve Months Ended 12/31/2006 12/31/2005 12/31/2004HT/CNL Metro Hotels, LP $ 398 $ 506 $ 309 PRA Glastonbury, LLC (257) 75 112 Inn American Hospitality at Ewing, LLC 160 (79 ) 60 Hiren Boston, LLC (167) (80 ) - SB Partners, LLC (24 ) (26 ) - Mystic Partners, LLC 1,691 61 - PRA Suites at Glastonbury, LLC (2 ) - -
Total equity in income $ 1,799 $ 457 $ 481

52 HERSHA 2006 ANNUAL REPORT
___________________________________________________________________________________ HERSHA HOSPITALITY TRUST AND SUBSIDIARIES NOTES TO THE CONSOLIDATED FINANCIAL STATEMENTS FOR THE YEARS ENDED DECEMBER 31, 2006, 2005, AND 2004 [IN THOUSANDS, EXCEPT SHARE AND PER SHARE AMOUNTS] ___________________________________________________________________________________ NOTE 4 - DEVELOPMENT LOANS RECEIVABLE AND LAND LEASES We have approved first mortgage and mezzanine lending to hotel developers, including entities in which our executive officers and affiliated trustees own an interest, to enable such entities to construct hotels and conduct related improvements on specific hotel projects at interest rates ranging from 9% to 10% (“Development Line Funding”) at December 31, 2006 and 2005. As of December 31, 2006 and December 31, 2005, we had Development Loans Receivable of $47,016 and $32,450, respectively. Interest income from development loans was $2,487, $3,940, and $2,191 for the years ended December 31, 2006, 2005, and 2004, respectively. Accrued interest on our development loans receivable was $883 as of December 31, 2006 and $1,623 as of December 31, 2005 and is included in other assets on our consolidated balance sheets. As of December 31, 2006, our development loans receivable consisted of the following:
Hotel Property
Borrower
Principal Outstanding 12/31/2006
Interest Rate Maturity Date
Sheraton - JFK Airport, NY Risingsam Hospitality, LLC $ 9,016 10 % March 30, 2007 Hilton Garden Inn - Union Square, NY Risingsam Union Square, LLC 10,000 10 % May 31, 2007 Holiday Inn Express - 29th Street, NY Brisam Management, LLC 15,000 10 % May 31, 2007 Boutique Hotel - Manhattan, NY Brisam East 52, LLC 3,000 10 % December 6, 2007 Boutique Hotel - Manhattan, NY Brisam Greenwich, LLC 10,000 10 % September 12, 2007 $ 47,016
As of December 31, 2005 our development loans receivable consisted of the following:
Hotel Property
Borrower
Principal Outstanding 12/31/2005
Interest Rate Maturity Date
Boutique Hotel - 35th Street, New York, NY
44 Fifth Avenue, LLC
$ 9,100 9 % August 31, 2006
Hampton Inn - Seaport, New York, NY
HPS Seaport, LLC and BCM, LLC
13,000 10 % March 31, 2006
Boutique Hotel - Tribeca, New York, NY
5444 Associates, LP
9,500 10 % August 31, 2006
Hilton Garden Inn - JFK Airport, NY
Metro Ten Hotels, LLC
850 10 % December 31, 2005
$ 32,450
All outstanding loans as of December 31, 2005 were repaid during the first and second quarters of 2006.

53 HERSHA 2006 ANNUAL REPORT
___________________________________________________________________________________ HERSHA HOSPITALITY TRUST AND SUBSIDIARIES NOTES TO THE CONSOLIDATED FINANCIAL STATEMENTS FOR THE YEARS ENDED DECEMBER 31, 2006, 2005, AND 2004 [IN THOUSANDS, EXCEPT SHARE AND PER SHARE AMOUNTS] ___________________________________________________________________________________ NOTE 4 - DEVELOPMENT LOANS RECEIVABLE AND LAND LEASES (CONTINUED) Advances and repayments on our development loans receivable consisted of the following for the years ended December 31, 2006 and 2005:
2006 2005 2004 Balance at January 1, $ 32,450 $ 36,550 $ 16,000
New Advances 51,616 31,325 20,550 Repayments (37,050) (30,725) - Applied to Acquisition of Hotel Property - (4,700) -
Balance at December 31, $ 47,016 $ 32,450 $ 36,550 On July 28, 2006, we purchased land at 440 West 41st Street, New York City, for $21,982, including closing costs. We paid $9,882 in cash and entered into a $12,100 fixed rate interest only mortgage. The land was immediately leased to an unrelated hotel developer, Metro Forty First Street, LLC, under a fixed lease. On June 28, 2006, we purchased land at 39th and 8th Avenue, New York City, for $21,774, including closing costs. We paid $9,064 in cash and entered into a $13,250 variable rate interest only mortgage. The land was immediately leased to an unrelated hotel developer, Metro 39th Street Associates, LLC, under a fixed lease. Both lease agreements earn rents at a minimum rental rate of 10% of our net investment in the land. Additional rents are paid by the lessee for the interest on the mortgage, real estate taxes and insurance. Revenues from our land leases are recorded in land lease revenue on our consolidated statement of operations. All expenses related to the land leases are recorded in operating expenses as land lease expense.

54 HERSHA 2006 ANNUAL REPORT
___________________________________________________________________________________ HERSHA HOSPITALITY TRUST AND SUBSIDIARIES NOTES TO THE CONSOLIDATED FINANCIAL STATEMENTS FOR THE YEARS ENDED DECEMBER 31, 2006, 2005, AND 2004 [IN THOUSANDS, EXCEPT SHARE AND PER SHARE AMOUNTS] ___________________________________________________________________________________ NOTE 5 - OTHER ASSETS Other Assets consisted of the following at December 31, 2006 and 2005:
2006 2005 Transaction Costs $ 252 $ 1,863 Deposits on Hotel Acquisitions 2,144 8,250 Investment in Statutory Trusts 1,548 1,548 Notes Receivable 2,438 1,886 Due from Lessees 2,318 - Prepaid Expenses 3,533 1,098 Deposits on Property Improvement Plans 1,405 - Other 1,636 961 $ 15,274 $ 15,606
Transaction Costs - Transaction costs include legal fees and other third party transaction costs incurred relative to entering into debt facilities, issuances of equity securities or acquiring interests in hotel properties are recorded in other assets prior to the closing of the respective transactions. Deposits on Hotel Acquisitions - Deposits paid in connection with the acquisition of hotels, including accrued interest, are recorded in other assets. As of December 31, 2006, we had $2,000 in interest bearing deposits and $100 in non-interest bearing deposits related to the acquisition of hotel properties. The interest bearing deposit as of December 31, 2006 accrued interest at 10%. As of December 31, 2005, we had $8,000 in deposits bearing interest at 8.0% and $250 in non-interest bearing deposits. Investment in Statutory Trusts - We have an investment in the common stock of Hersha Statutory Trust I and Hersha Statutory Trust II. Our investment is accounted for under the equity method. Notes Receivable - Notes receivable as of December 31, 2006 include notes receivable of $1,350 extended in November and December 2006 to the purchaser of the Holiday Inn Express, Duluth, GA; Comfort Suites, Duluth, GA; Hampton Inn, Newnan, GA; and the Hampton Inn Peachtree City, GA (collectively the “Atlanta Portfolio”). Each of these notes bear interest at 8% and have maturity dates of December 31, 2007 or January 1, 2008. Also included in notes receivable is a loan made to one of our unconsolidated joint venture partners in the amount of $1,000 bearing interest at 12% with a maturity date of December 27, 2007. The notes receivable as of December 31, 2005 primarily related to a loan extended to the purchaser of the Doubletree Club, Jamaica, NY in May 2005. This note was repaid in April 2006. Due from Lessees - Due from lessees represent rents due under our land lease and hotel lease agreements. Prepaid Expense - Prepaid expenses include amounts paid for property tax, insurance and other expenditures that will be expensed in the next twelve months. Deposits on Property Improvement Plans - Deposits on property improvement plans consists of amounts advanced to HHMLP that is to be used to fund capital expenditures as part of our property improvement programs at certain properties.
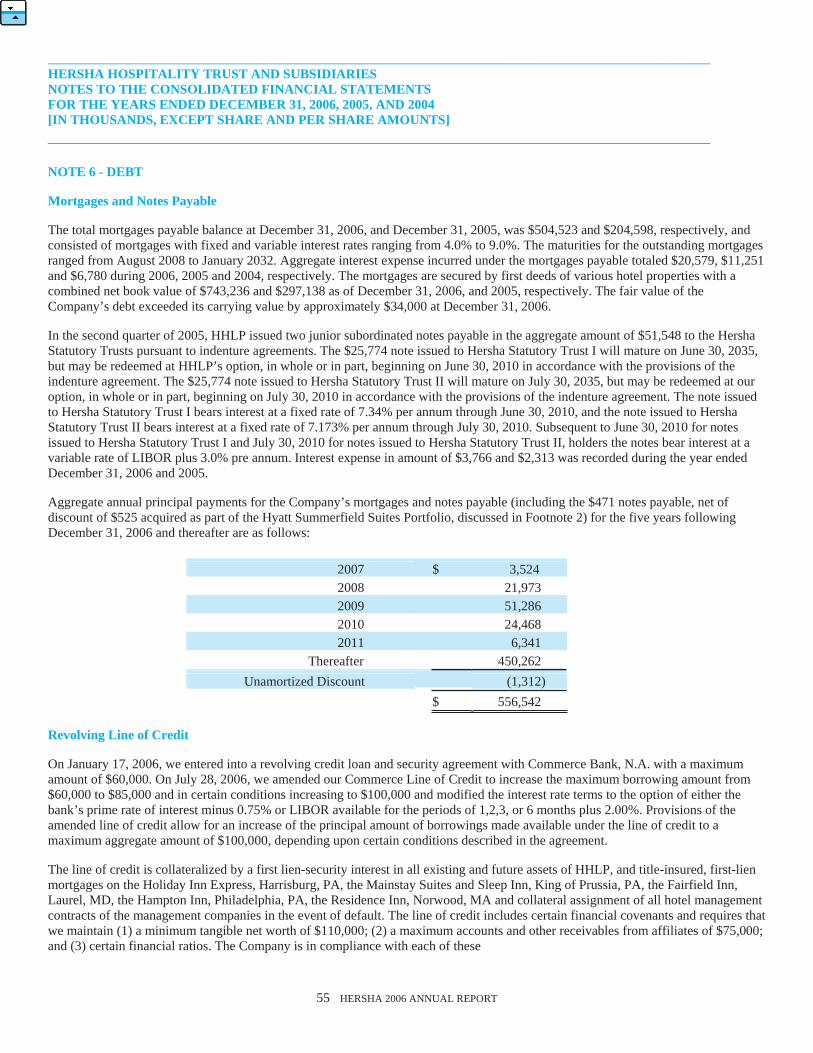
55 HERSHA 2006 ANNUAL REPORT
___________________________________________________________________________________ HERSHA HOSPITALITY TRUST AND SUBSIDIARIES NOTES TO THE CONSOLIDATED FINANCIAL STATEMENTS FOR THE YEARS ENDED DECEMBER 31, 2006, 2005, AND 2004 [IN THOUSANDS, EXCEPT SHARE AND PER SHARE AMOUNTS] ___________________________________________________________________________________ NOTE 6 - DEBT Mortgages and Notes Payable The total mortgages payable balance at December 31, 2006, and December 31, 2005, was $504,523 and $204,598, respectively, and consisted of mortgages with fixed and variable interest rates ranging from 4.0% to 9.0%. The maturities for the outstanding mortgages ranged from August 2008 to January 2032. Aggregate interest expense incurred under the mortgages payable totaled $20,579, $11,251 and $6,780 during 2006, 2005 and 2004, respectively. The mortgages are secured by first deeds of various hotel properties with a combined net book value of $743,236 and $297,138 as of December 31, 2006, and 2005, respectively. The fair value of the Company’s debt exceeded its carrying value by approximately $34,000 at December 31, 2006. In the second quarter of 2005, HHLP issued two junior subordinated notes payable in the aggregate amount of $51,548 to the Hersha Statutory Trusts pursuant to indenture agreements. The $25,774 note issued to Hersha Statutory Trust I will mature on June 30, 2035, but may be redeemed at HHLP’s option, in whole or in part, beginning on June 30, 2010 in accordance with the provisions of the indenture agreement. The $25,774 note issued to Hersha Statutory Trust II will mature on July 30, 2035, but may be redeemed at our option, in whole or in part, beginning on July 30, 2010 in accordance with the provisions of the indenture agreement. The note issued to Hersha Statutory Trust I bears interest at a fixed rate of 7.34% per annum through June 30, 2010, and the note issued to Hersha Statutory Trust II bears interest at a fixed rate of 7.173% per annum through July 30, 2010. Subsequent to June 30, 2010 for notes issued to Hersha Statutory Trust I and July 30, 2010 for notes issued to Hersha Statutory Trust II, holders the notes bear interest at a variable rate of LIBOR plus 3.0% pre annum. Interest expense in amount of $3,766 and $2,313 was recorded during the year ended December 31, 2006 and 2005. Aggregate annual principal payments for the Company’s mortgages and notes payable (including the $471 notes payable, net of discount of $525 acquired as part of the Hyatt Summerfield Suites Portfolio, discussed in Footnote 2) for the five years following December 31, 2006 and thereafter are as follows:
2007 $ 3,524 2008 21,973 2009 51,286 2010 24,468 2011 6,341 Thereafter 450,262 Unamortized Discount (1,312)
$ 556,542 Revolving Line of Credit On January 17, 2006, we entered into a revolving credit loan and security agreement with Commerce Bank, N.A. with a maximum amount of $60,000. On July 28, 2006, we amended our Commerce Line of Credit to increase the maximum borrowing amount from $60,000 to $85,000 and in certain conditions increasing to $100,000 and modified the interest rate terms to the option of either the bank’s prime rate of interest minus 0.75% or LIBOR available for the periods of 1,2,3, or 6 months plus 2.00%. Provisions of the amended line of credit allow for an increase of the principal amount of borrowings made available under the line of credit to a maximum aggregate amount of $100,000, depending upon certain conditions described in the agreement. The line of credit is collateralized by a first lien-security interest in all existing and future assets of HHLP, and title-insured, first-lien mortgages on the Holiday Inn Express, Harrisburg, PA, the Mainstay Suites and Sleep Inn, King of Prussia, PA, the Fairfield Inn, Laurel, MD, the Hampton Inn, Philadelphia, PA, the Residence Inn, Norwood, MA and collateral assignment of all hotel management contracts of the management companies in the event of default. The line of credit includes certain financial covenants and requires that we maintain (1) a minimum tangible net worth of $110,000; (2) a maximum accounts and other receivables from affiliates of $75,000; and (3) certain financial ratios. The Company is in compliance with each of these

56 HERSHA 2006 ANNUAL REPORT
___________________________________________________________________________________ HERSHA HOSPITALITY TRUST AND SUBSIDIARIES NOTES TO THE CONSOLIDATED FINANCIAL STATEMENTS FOR THE YEARS ENDED DECEMBER 31, 2006, 2005, AND 2004 [IN THOUSANDS, EXCEPT SHARE AND PER SHARE AMOUNTS] ___________________________________________________________________________________ NOTE 6 - DEBT (CONTINUED) covenants as of December 31, 2006. The line of credit replaced a line of credit with Sovereign Bank and expires on December 31, 2008. This revolving credit loan replaced both the secured and unsecured lines of credit that we previously maintained. As a result of the termination of the Sovereign Bank Line of Credit, we expensed $255 in unamortized deferred costs related to the origination of the Sovereign Bank Line of Credit. The Company maintained a line of credit balance of $24,000 at December 31, 2006 and $-0- at December 31, 2005. The Company recorded interest expense of $2,134, $186 and $163 related to the line of credit borrowings, for the years ended December 31, 2006, 2005, and 2004, respectively. The weighted average interest rate on our Line of Credit during the years ended December 31, 2006, 2005, and 2004 was 7.33%, 6.10%, and 4.30%, respectively. Deferred Costs Costs associated with entering into mortgages and notes payable and our revolving line of credit are deferred and amortized over the life of the debt instruments. Amortization of deferred costs is recorded in interest expense. As of December 31, 2006, deferred costs were $7,525, net of accumulated amortization of $1,543. Deferred costs were $4,131, net of accumulated amortization of $1,437, as of December 31, 2005. Amortization of deferred costs for the years ended December 31, 2006, 2005, and 2004 was $944, $558 and $193, respectively. Debt Extinguishment As noted above, the Sovereign Bank Line of Credit was replaced by the Commerce Line of Credit in January 2006. As a result of this termination, we expensed $255 in unamortized deferred costs related to the origination of the Sovereign Bank Line of Credit, which are included in the Loss on Debt Extinguishment caption on the face of the consolidated statement of operations for the year ended December 31, 2006. On April 7, 2006, we repaid $21,900 on our mortgage with Merrill Lynch for the Hampton Inn Herald Square property as a result of a debt refinancing. The new debt of $26,500 has a fixed interest rate of 6.085% and a maturity date of May 1, 2016. As a result of this extinguishment, we expensed $534 in unamortized deferred costs and prepayment penalties, which are included in the Loss on Debt Extinguishment caption on the face of the consolidated statement of operations for the year ended December 31, 2006. On June 9, 2006, we repaid $34,200 on our mortgage with UBS for the McIntosh Portfolio, as a result of a debt refinancing. The new debt of $36,300 has a fixed interest rate of 6.33% and maturity date of June 11, 2016 for each of the loans associated with the McIntosh Portfolio. As a result of this extinguishment, we expensed $374 in unamortized deferred costs, which are included in the Loss on Debt Extinguishment caption on the face of the consolidated statement of operations for the year ended December 31, 2006. On September 9, 2006, we repaid $8,287 on our mortgage with South New Hampshire Bank for the Residence Inn, Norwood, using proceeds from a draw on our line of credit with Commerce Bank. In connection with the mortgage assumption, the seller agreed to reimburse all pre-payment related fees associated with this payoff, On December 27, 2006, we repaid $12,907 on our mortgage with GE Capital for the Hilton Garden Inn, JFK, NY property as a result of a debt payoff. The new debt of $21,000 was acquired on March 7, 2007 and has a fixed interest rate of 5.82% and a maturity date of March 1, 2017. As a result of this extinguishment, we expensed $322 in prepayment penalties, which are included in the Loss on Debt Extinguishment caption on the face of the consolidated statements of operations for the year ended December 31, 2006.

57 HERSHA 2006 ANNUAL REPORT
___________________________________________________________________________________ HERSHA HOSPITALITY TRUST AND SUBSIDIARIES NOTES TO THE CONSOLIDATED FINANCIAL STATEMENTS FOR THE YEARS ENDED DECEMBER 31, 2006, 2005, AND 2004 [IN THOUSANDS, EXCEPT SHARE AND PER SHARE AMOUNTS] ___________________________________________________________________________________ NOTE 7 - COMMITMENTS AND CONTINGENCIES AND RELATED PARTY TRANSACTIONS We are the sole general partner in the Partnership, which is indirectly the sole general partner of the subsidiary partnerships. The Company does not anticipate any losses as a result of our obligations as general partner. Management Agreements Our wholly owned TRS, 44 New England, engages eligible independent contractors, including HHMLP, as the property managers for hotels it leases from us pursuant to management agreements. Our management agreements with HHMLP provide for five-year terms and are subject to early termination upon the occurrence of defaults and certain other events described therein. As required under the REIT qualification rules, HHMLP must qualify as an “eligible independent contractor” during the term of the management agreements. Under the management agreements, HHMLP generally pays the operating expenses of our hotels. All operating expenses or other expenses incurred by HHMLP in performing its authorized duties are reimbursed or borne by our TRS to the extent the operating expenses or other expenses are incurred within the limits of the applicable approved hotel operating budget. HHMLP is not obligated to advance any of its own funds for operating expenses of a hotel or to incur any liability in connection with operating a hotel. Management agreements with other unaffiliated hotel management companies have similar terms. As of December 31, 2006, HHMLP managed 40 of the properties leased to our TRS. HHMLP also managed two consolidated joint venture hotel properties and three unconsolidated joint venture hotel properties in which we maintain an investment. For its services, HHMLP receives a base management fee, and if a hotel exceeds certain thresholds, an incentive management fee. The base management fee for a hotel is due monthly and is equal to 3% of gross revenues associated with each hotel managed for the related month. The incentive management fee, if any, for a hotel is due annually in arrears on the ninetieth day following the end of each fiscal year and is based upon the financial performance of the hotel. There were no incentive management fees for the years ended December 31, 2006, 2005 and 2004. For the years ended December 31, 2006, 2005 and 2004, management fees incurred totaled $4,361, $2,887, and $1,454, respectively, and are recorded as Hotel Operating Expenses. In addition, the Company incurred $104 for the early termination of management contracts related to the sale of two hotels in the second quarter in 2005, $30 related to the sale of one hotel in the second quarter of 2006, and $89 related to the sale of four hotels in the fourth quarter of 2006. These fees are included in discontinued operations. Administrative Services Agreement Prior to July 1, 2005, under the terms of an administrative service agreement, HHMLP provided accounting and securities reporting services for the Company. The terms of the agreement provided for us to pay HHMLP an annual fee of $10 per property (prorated from the time of acquisition) for each hotel in our portfolio. On July 1, 2005, the administrative service fee was replaced by monthly accounting and information technology fees for each of our wholly owned hotels. Monthly fees for accounting services are $2 per property and monthly information technology fees are $0.5 per property. For the years ended December 31, 2006, 2005 and 2004, the Company incurred administrative services fees of $0, $140, and $253, respectively. For the year ended December 31, 2006, the Company incurred accounting fees of $1,053 and information technology fees of $251. For the year ended December 31, 2005, the Company incurred accounting fees of $386 and information technology fees of $95. Administrative services fees, accounting fees, and information technology fees are included in General and Administrative expenses. Franchise Agreements The hotel properties are operated under franchise agreements assumed by the hotel property lessee. The franchise agreements have 10 to 20 year terms but may be terminated by either the franchisee or franchisor on certain anniversary dates specified in the agreements. The franchise agreements require annual payments for franchise royalties, reservation, and advertising services, and such payments are based upon percentages of gross room revenue. These payments are paid by the hotels and charged to expense as incurred. Franchise fee expense for the years ended December 31, 2006, 2005, and 2004 was $9,773, $5,818 and $3,845 respectively. The initial fees incurred to enter into the franchise agreements are amortized over the life of the franchise agreements.

58 HERSHA 2006 ANNUAL REPORT
___________________________________________________________________________________ HERSHA HOSPITALITY TRUST AND SUBSIDIARIES NOTES TO THE CONSOLIDATED FINANCIAL STATEMENTS FOR THE YEARS ENDED DECEMBER 31, 2006, 2005, AND 2004 [IN THOUSANDS, EXCEPT SHARE AND PER SHARE AMOUNTS] ___________________________________________________________________________________ NOTE 7 - COMMITMENTS AND CONTINGENCIES AND RELATED PARTY TRANSACTIONS (CONTINUED) Acquisitions from Affiliates We have entered into an option agreement with each of our officers and trustees such that we obtain a first right of refusal to purchase any hotel owned or developed in the future by these individuals or entities controlled by them at fair market value. This right of first refusal would apply to each party until one year after such party ceases to be an officer or trustee of our Company. Since our initial public offering in 1999, we have acquired, wholly or through joint ventures, a total of 71 hotels, including 19 hotels acquired from entities controlled by our officers or trustees. Of the 19 acquisitions from these entities, 16 were newly-constructed or newly-renovated by these entities prior to our acquisition. Our Acquisition Committee of the Board of Trustees is comprised solely of independent trustees, and the purchase prices and all material terms of the purchase of hotels from related parties are negotiated with the Acquisition Committee. In addition, we have hired an independent accounting firm to provide our Board of Trustees with an “Agreed Upon Procedures” report for all acquisitions and dispositions to related parties. Hotel Supplies For the years ended December 31, 2006, 2005 and 2004, we incurred expenses of $1,686, $969, and $804, respectively, for hotel supplies from Hersha Hotel Supply, an unconsolidated related party, which are expenses included in Hotel Operating Expenses. Approximately $66 and $52 is included in accounts payable at December 31, 2006 and 2005. Capital Expenditure Fees Beginning April 1, 2006, HHMLP began to charge a 5% fee on all capitalized expenditures and pending renovation projects at the properties as compensation for procurement services related to capital expenditures and for project management of renovation projects. For the year ended December 31, 2006, we incurred fees of $155 which were capitalized in with the cost of fixed asset additions. Due From Related Parties The Due from Related Party balance as of December 31, 2006 and December 31, 2005 was approximately $4,930 and $2,779, respectively. The majority of the balance as of December 31, 2006 was accrued interest due on our development loans, and the remaining due from related party balance are receivables owed from our unconsolidated joint ventures. Due to Related Parties The Due to Related Parties balance as of December 31, 2006 and December 31, 2005 was approximately $3,297 and $4,655, respectively. The balances as of December 31, 2006 and December 31, 2005 consisted of amounts payable to HHMLP for administrative, management, and benefit related fees. Hotel Ground Rent During 2003, in conjunction with the acquisition of the Hilton Garden Inn, Edison, NJ, we assumed a land lease from a third party with an original term of 75 years. Monthly payments as determined by the lease agreement are due through the expiration in August 2074. On February 16, 2006, in conjunction with the acquisition of the Hilton Garden Inn, JFK Airport, we assumed a land lease with an original term of 99 years. Monthly payments are determined by the lease agreement and are due through the expiration in July 2100. Both land leases provide rent increases at scheduled intervals. We record rent expense on a straight-line basis over the life of the lease from the beginning of the lease term. For the years ended December 31, 2006, 2005 and 2004, we incurred $804, $433, and $504 respectively, in hotel ground rent from continuing operations under the agreement.
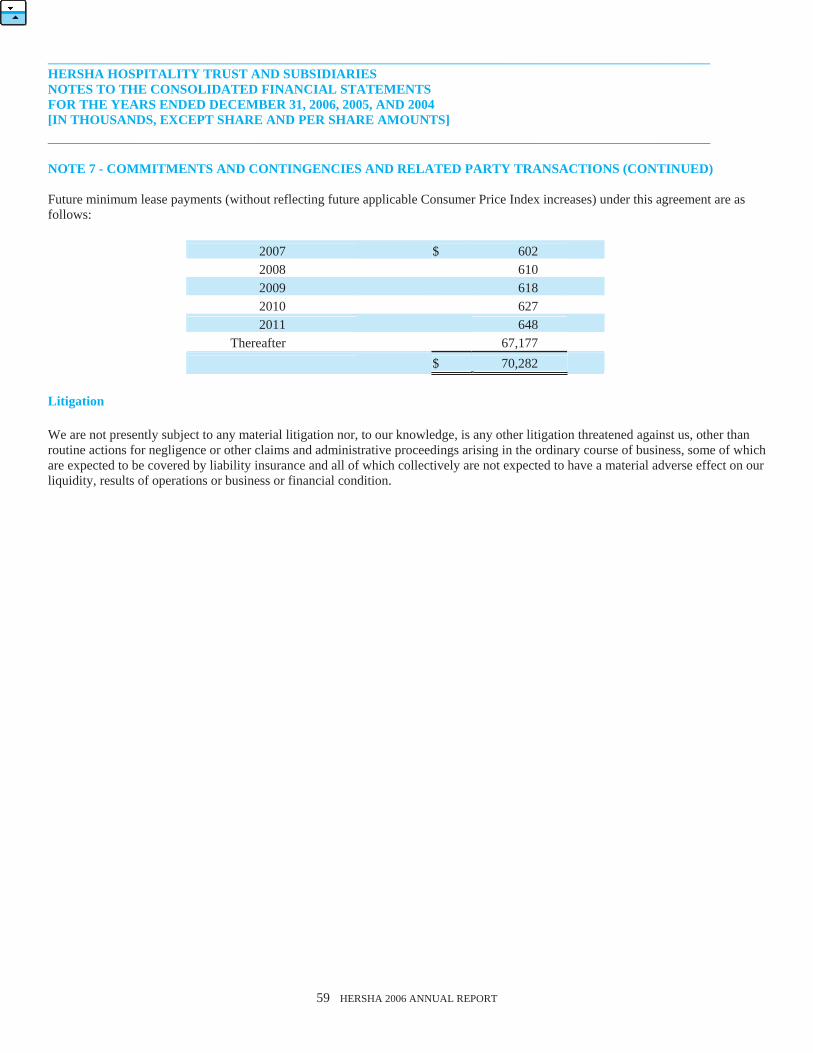
59 HERSHA 2006 ANNUAL REPORT
___________________________________________________________________________________ HERSHA HOSPITALITY TRUST AND SUBSIDIARIES NOTES TO THE CONSOLIDATED FINANCIAL STATEMENTS FOR THE YEARS ENDED DECEMBER 31, 2006, 2005, AND 2004 [IN THOUSANDS, EXCEPT SHARE AND PER SHARE AMOUNTS] ___________________________________________________________________________________ NOTE 7 - COMMITMENTS AND CONTINGENCIES AND RELATED PARTY TRANSACTIONS (CONTINUED) Future minimum lease payments (without reflecting future applicable Consumer Price Index increases) under this agreement are as follows:
2007 $ 602 2008 610 2009 618 2010 627 2011 648
Thereafter 67,177 $ 70,282
Litigation We are not presently subject to any material litigation nor, to our knowledge, is any other litigation threatened against us, other than routine actions for negligence or other claims and administrative proceedings arising in the ordinary course of business, some of which are expected to be covered by liability insurance and all of which collectively are not expected to have a material adverse effect on our liquidity, results of operations or business or financial condition.

60 HERSHA 2006 ANNUAL REPORT
___________________________________________________________________________________ HERSHA HOSPITALITY TRUST AND SUBSIDIARIES NOTES TO THE CONSOLIDATED FINANCIAL STATEMENTS FOR THE YEARS ENDED DECEMBER 31, 2005, 2004, AND 2003 [IN THOUSANDS, EXCEPT SHARE AND PER SHARE AMOUNTS] ___________________________________________________________________________________ NOTE 8 - DERIVATIVE INSTRUMENTS
On June 12, 2006, we terminated an interest rate cap with a notional amount of $34,230 that served as a hedge against the variability in cash flows on a variable interest rate debt instrument due to the refinancing of the debt instrument to a fixed rate. We received $79 in cash and reclassified $58 in reduction to interest expense as a result of the termination of this cap. We maintain an interest rate swap that fixes our interest rate on variable rate mortgage. Under the terms of this interest rate swap, we pay fixed rate interest of 4.73% of the notional amount and we receive floating rate equal to the one month U.S. dollar LIBOR. The notional amount amortizes in tandem with the amortization of the underlying hedged debt and is $7,940 as of December 31, 2006. At December 31, 2006 and 2005, the fair value of the interest rate swap was $47 and $0, respectively, and is included in other assets on the face of the consolidated balance sheets. At December 31, 2005, the fair value of the interest rate cap was $23 and is included in other assets. The change in net unrealized gains/losses was a loss of $94, a gain of $294, and a gain of $33 for the years ended December 31, 2006, 2005 and 2004, respectively, for derivatives designated as cash flow hedges which were reflected on our Balance Sheet in Accumulated Other Comprehensive Income. Hedge ineffectiveness of $14, $13 and $62 on cash flow hedges was recognized in unrealized gain/loss on derivatives during 2006, 2005 and 2004, respectively. Amounts reported in accumulated other comprehensive income related to derivatives will be reclassified to interest expense as interest payments are made on the Company’s variable-rate debt. The change in net unrealized gains/losses on cash flow hedges reflects a reclassification of $90 of net unrealized gains/losses from accumulated other comprehensive income as a reduction to interest expense during 2006. During 2007, the Company estimates that an additional $36 will be reclassified as a reduction to interest expense.

61 HERSHA 2006 ANNUAL REPORT
___________________________________________________________________________________ HERSHA HOSPITALITY TRUST AND SUBSIDIARIES NOTES TO THE CONSOLIDATED FINANCIAL STATEMENTS FOR THE FOR THE YEARS ENDED DECEMBER 31, 2006, 2005, AND 2004 [IN THOUSANDS, EXCEPT SHARE AND PER SHARE AMOUNTS] ___________________________________________________________________________________ NOTE 9 - SHARE-BASED PAYMENTS In 2004, we established the Hersha Hospitality Trust 2004 Equity Incentive Plan which provides for the grant of stock options, stock appreciation rights, stock awards, performance shares and incentive awards. The maximum number of shares of common stock that can be issued under this plan is 1.5 million shares. No share-based payments were granted under this plan during the year ended December 31, 2004. On June 1, 2005, the Compensation Committee of the Board of Trustees granted 71,000 restricted share awards to executives. The restricted share awards vest 25% each year over four years and compensation expense is recognized ratably over the four year vesting period based on the fair value of the shares on the date of grant. The fair value of the restricted share awards on the grant date was $9.60 per share. As of December 31, 2006, 25% of these restricted share awards were vested. On June 1, 2006, the Compensation Committee of the Board of Trustees granted 89,500 restricted share awards to executives. The restricted share awards vest 25% each year over four years and compensation expense is recognized ratably over the four year vesting period based on the fair value of the shares on the date of grant. The fair value of the restricted share awards on the grant date was $9.40 per share. As of December 31, 2006, none of these restricted share awards was vested. A summary of the stock awards issued to executives of the Company under the 2004 Equity Incentive Plan are as follows: Shares Vested Unearned Compensation
Date of Award Issuance Shares Issued 12/31/2006 12/31/2005 12/31/2006 12/31/2005
Period until Full Vesting
June 1, 2005 71,000 17,750 - $ 412 $ 582 2.50 years June 1, 2006 89,500 - - 719 - 3.50 years
160,500 17,750 - $ 1,131 $ 582 Compensation expense related to stock awards issued to executives of the Company of $293 and $99 was incurred during the years ended December 31, 2006 and 2005, respectively, related to the restricted share awards and is recorded in general and administrative expense on the statement of operations. Unearned compensation as of December 31, 2006 and 2005 was $1,131 and $582, respectively. On March 2, 2005, we awarded 419 common shares to each of our five independent trustees. The fair value of each of the shares on the grant date was $11.97 per share. On January 3, 2006, we awarded 1,000 common shares to each of our five independent trustees. The fair value of each of the shares on the grant date was $9.12 per share. On January 2, 2007, we awarded 1,000 common shares to each of our four independent trustees. The fair value of each of the shares on the grant date was $11.44 per share. Compensation expense related to stock awards issued to the Board of Trustees of $45, $46, and $25 was incurred during the years ended December 31, 2006, 2005 and 2004.

62 HERSHA 2006 ANNUAL REPORT
___________________________________________________________________________________ HERSHA HOSPITALITY TRUST AND SUBSIDIARIES NOTES TO THE CONSOLIDATED FINANCIAL STATEMENTS FOR THE YEARS ENDED DECEMBER 31, 2006, 2005, AND 2004 [IN THOUSANDS, EXCEPT SHARE AND PER SHARE AMOUNTS] ___________________________________________________________________________________ NOTE 10 - EARNINGS PER SHARE The following table is a reconciliation of the income (numerator) and weighted average shares (denominator) used in the calculation of basic earnings per common share and diluted earnings per common share in accordance with SFAS No. 128, Earnings Per Share. The computation of basic and diluted earnings per share is presented below. Year Ended 2006 2005 2004 Numerator:
BASIC Income from Continuing Operations $ 3,915 $ 2,454 $ 1,470
Distributions to 8.0% Series A Preferred Shareholders (4,800) (1,920) - (Loss) income from continuing operations applicable to common
shareholders (885) 534 1,470Income from Discontinued Operations 1,183 843 579
Net Income applicable to common shareholders $ 298 $ 1,377 $ 2,049
DILUTED*
Income from Continuing Operations $ 3,915 $ 2,454 $ 1,470
Distributions to 8.0% Series A Preferred Shareholders (4,800) (1,920) - (Loss) income from continuing operations applicable to common
shareholders (885) 534 1,470Income from Discontinued Operations 1,183 843 579
Net Income applicable to common shareholders $ 298 $ 1,377 $ 2,049
Denominator: Weighted average number of common shares - basic 27,118,264 20,293,554 16,391,805Effect of dilutive securities:
Unvested stock awards - * 41,627 - Weighted average number of common shares - diluted* 27,118,264 20,335,181 16,391,805

63 HERSHA 2006 ANNUAL REPORT
___________________________________________________________________________________ HERSHA HOSPITALITY TRUST AND SUBSIDIARIES NOTES TO THE CONSOLIDATED FINANCIAL STATEMENTS FOR THE YEARS ENDED DECEMBER 31, 2006, 2005, AND 2004 [IN THOUSANDS, EXCEPT SHARE AND PER SHARE AMOUNTS] ___________________________________________________________________________________ NOTE 10 - EARNINGS PER SHARE (CONTINUED) Year Ended 2006 2005 2004 Earnings Per Share: BASIC
(Loss) income from continuing operations applicable to common shareholders $ (0.03) $ 0.03 $ 0.09 Income from Discontinued Operations $ 0.04 $ 0.04 $ 0.04
Net Income applicable to common shareholders $ 0.01 $ 0.07 $ 0.13
DILUTED
(Loss) income from continuing operations applicable to common shareholders $ (0.03)* $ 0.03* $ 0.09 Income from Discontinued Operations $ 0.04* $ 0.04* $ 0.04 Net Income applicable to common shareholders $ 0.01* $ 0.07* $ 0.13
* Income allocated to minority interest in the Partnership has been excluded from the numerator and Partnership units have been
omitted from the denominator for the purpose of computing diluted earnings per share for the years ended December 31, 2006, 2005 and 2004 since the effect of including these amounts in the numerator and denominator would have no impact. Unvested stock awards have been omitted from the denominator for the purpose of computing diluted earnings per share for the year ended December 31, 2006 since the effect of including this amount in the denominator would be anti-dilutive to loss for continuing operations applicable to common shareholders.
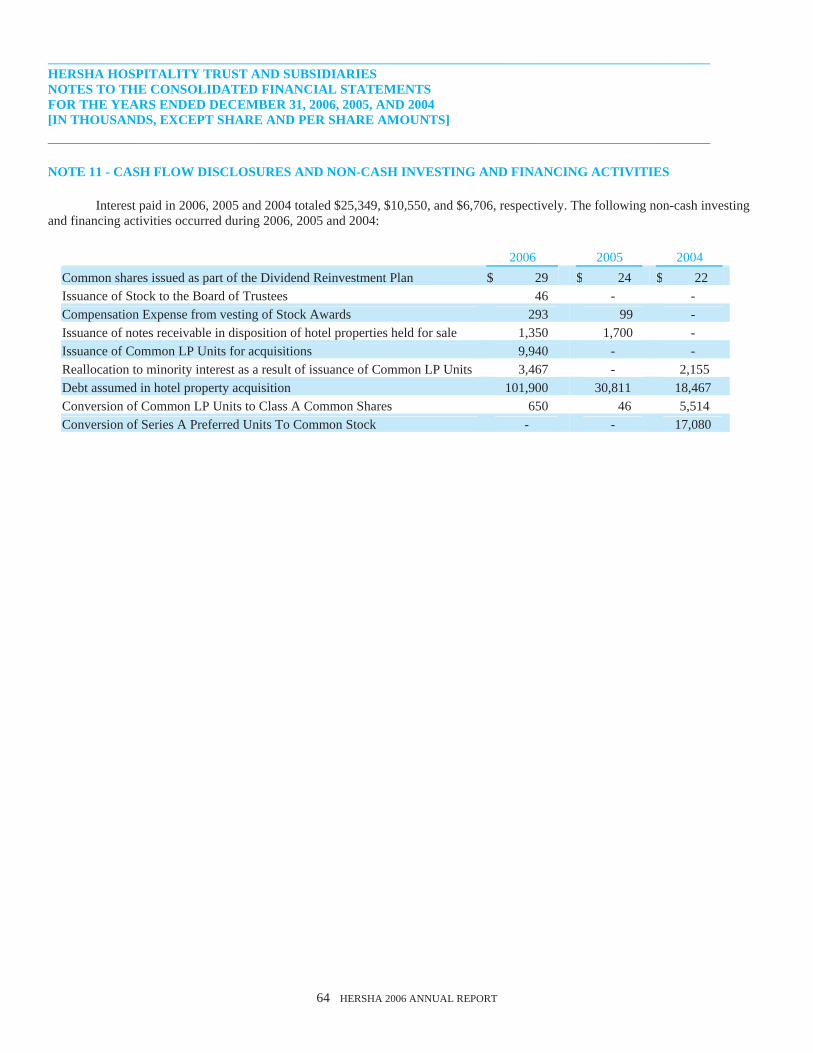
64 HERSHA 2006 ANNUAL REPORT
___________________________________________________________________________________ HERSHA HOSPITALITY TRUST AND SUBSIDIARIES NOTES TO THE CONSOLIDATED FINANCIAL STATEMENTS FOR THE YEARS ENDED DECEMBER 31, 2006, 2005, AND 2004 [IN THOUSANDS, EXCEPT SHARE AND PER SHARE AMOUNTS] ___________________________________________________________________________________ NOTE 11 - CASH FLOW DISCLOSURES AND NON-CASH INVESTING AND FINANCING ACTIVITIES
Interest paid in 2006, 2005 and 2004 totaled $25,349, $10,550, and $6,706, respectively. The following non-cash investing and financing activities occurred during 2006, 2005 and 2004:
2006 2005 2004 Common shares issued as part of the Dividend Reinvestment Plan $ 29 $ 24 $ 22 Issuance of Stock to the Board of Trustees 46 - - Compensation Expense from vesting of Stock Awards 293 99 - Issuance of notes receivable in disposition of hotel properties held for sale 1,350 1,700 - Issuance of Common LP Units for acquisitions 9,940 - - Reallocation to minority interest as a result of issuance of Common LP Units 3,467 - 2,155 Debt assumed in hotel property acquisition 101,900 30,811 18,467 Conversion of Common LP Units to Class A Common Shares 650 46 5,514 Conversion of Series A Preferred Units To Common Stock - - 17,080

65 HERSHA 2006 ANNUAL REPORT
___________________________________________________________________________________ HERSHA HOSPITALITY TRUST AND SUBSIDIARIES NOTES TO THE CONSOLIDATED FINANCIAL STATEMENTS FOR THE YEARS ENDED DECEMBER 31, 2006, 2005, AND 2004 [IN THOUSANDS, EXCEPT SHARE AND PER SHARE AMOUNTS] ___________________________________________________________________________________ NOTE 12 - DISCONTINUED OPERATIONS We follow the provisions of SFAS No. 144, “Accounting for the Impairment or Disposal of Long-Lived Assets,” which requires, among other things, that the operating results of certain real estate assets which have been sold, or otherwise qualify as held for disposition (as defined by SFAS No. 144), be included in discontinued operations in the statements of operations for all periods presented.
On May 13, 2005, we completed the disposition of the Doubletree Club, Jamaica, NY and the Holiday Inn Express, Long Island City, NY in a sale of the land, improvements and certain personal property to unaffiliated buyers for $20,500, plus transaction costs. Assets sold had a net book value of $18,806 and debt related to assets held for sale of $12,952 was assumed by the buyers. A note receivable for $1,700 was received as part of the proceeds from the sale of the Doubletree Club and was repaid as of June 30, 2006. Interest payments were due quarterly with repayment of the principal due upon maturity. Gain on the sale of the two properties was $1,323, of which $162 was allocated to minority interest in HHLP.
In September of 2005, our Board of Trustees authorized management of the Company to sell the Holiday Inn Express, Hartford, CT and this asset is classified as “held for sale” on the Company’s Consolidated Balance Sheet as of December 31, 2005. As of December 31, 2005, Liabilities Related to Hotel Assets Held for Sale was $375 and related to the Holiday Inn Express, Hartford, CT, capital lease which was extinguished with the sale of the property in April 2006. The operating results for this hotel were reclassified to discontinued operations in the statements of operations in September 2005. The hotel was acquired by the Company in January 2004 and was sold on April 12, 2006. Proceeds from the sale were $3,600, and the gain on the sale was $497, of which $61 was allocated to minority interest in HHLP. During 2004, in conjunction with the acquisition of the Holiday Inn Express, Hartford, CT, we assumed a land lease from a third party with an original term of 99 years. Monthly payments as determined by the lease agreement were due through the expiration in September 2101. Subsequent to the sale of this property in the second quarter of 2006, we did not incur further lease expense. For the years ended December 31, 2006, 2005, and 2004, we incurred $85, $300, and $275 in hotel ground rent under this agreement, which have been reclassified to discontinued operations in the statement of operations. The lease was assumed by the purchaser of this property. In March of 2006, our Board of Trustees authorized management of the Company to sell four properties located in metropolitan Atlanta, Georgia. These four properties are the Holiday Inn Express, Duluth, Comfort Suites, Duluth, Hampton Inn, Newnan and the Hampton Inn Peachtree City. The operating results for these hotels were reclassified to discontinued operations in the statements of operations for the years ended December 31, 2006, 2005, and 2004. These hotels were acquired by the Company in April and May 2000 and were sold during November and December 2006. Proceeds from the sales were $18,100, and the gain on the sale was $290, of which $33 was allocated to minority interest in HHLP. Notes receivable in the aggregate amount of $1,350 was received as part of the proceeds of the sale of the Atlanta Portfolio. Interest payments are due quarterly with repayment of the principal due upon maturity on December 31, 2007 or January 1, 2008. We allocate interest and capital lease expense to discontinued operations for debt that is to be assumed or that is required to be repaid as a result of the disposal transaction. We allocated $806, $1,267 and $1,692 of interest and capital lease expense to discontinued operations for the years ended December 31, 2006, 2005, and 2004, respectively.
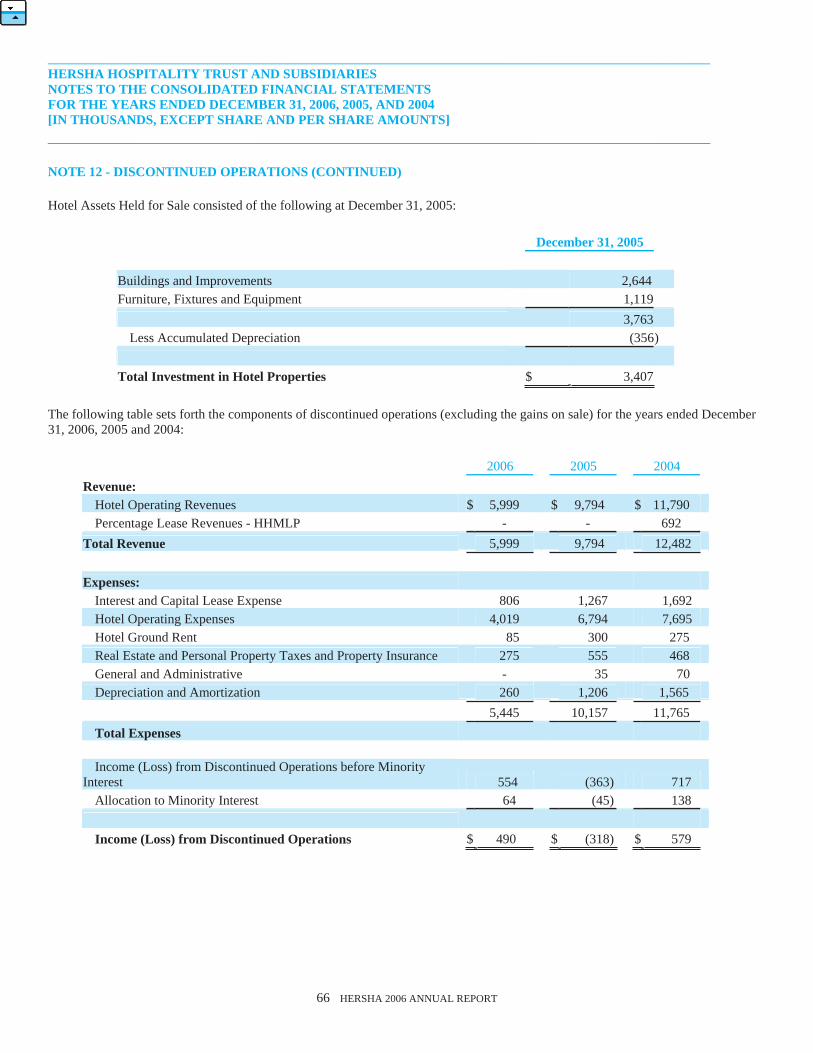
66 HERSHA 2006 ANNUAL REPORT
___________________________________________________________________________________ HERSHA HOSPITALITY TRUST AND SUBSIDIARIES NOTES TO THE CONSOLIDATED FINANCIAL STATEMENTS FOR THE YEARS ENDED DECEMBER 31, 2006, 2005, AND 2004 [IN THOUSANDS, EXCEPT SHARE AND PER SHARE AMOUNTS] ___________________________________________________________________________________ NOTE 12 - DISCONTINUED OPERATIONS (CONTINUED) Hotel Assets Held for Sale consisted of the following at December 31, 2005:
December 31, 2005 Buildings and Improvements 2,644 Furniture, Fixtures and Equipment 1,119 3,763
Less Accumulated Depreciation (356) Total Investment in Hotel Properties $ 3,407
The following table sets forth the components of discontinued operations (excluding the gains on sale) for the years ended December 31, 2006, 2005 and 2004:
2006 2005 2004 Revenue:
Hotel Operating Revenues $ 5,999 $ 9,794 $ 11,790 Percentage Lease Revenues - HHMLP - - 692
Total Revenue 5,999 9,794 12,482 Expenses:
Interest and Capital Lease Expense 806 1,267 1,692 Hotel Operating Expenses 4,019 6,794 7,695 Hotel Ground Rent 85 300 275 Real Estate and Personal Property Taxes and Property Insurance 275 555 468 General and Administrative - 35 70 Depreciation and Amortization 260 1,206 1,565
5,445 10,157 11,765 Total Expenses
Income (Loss) from Discontinued Operations before Minority
Interest 554 (363) 717 Allocation to Minority Interest 64 (45) 138
Income (Loss) from Discontinued Operations $ 490 $ (318) $ 579

67 HERSHA 2006 ANNUAL REPORT
___________________________________________________________________________________ HERSHA HOSPITALITY TRUST AND SUBSIDIARIES NOTES TO THE CONSOLIDATED FINANCIAL STATEMENTS FOR THE YEARS ENDED DECEMBER 31, 2006, 2005, AND 2004 [IN THOUSANDS, EXCEPT SHARE AND PER SHARE AMOUNTS] ___________________________________________________________________________________ NOTE 13 - SHAREHOLDERS’ EQUITY AND MINORITY INTEREST IN PARTNERSHIP Common Shares The Company’s common shares are duly authorized, fully paid and non-assessable. Common shareholders are entitled to receive dividends if and when authorized and declared by the Board of Trustees of the Company out of assets legally available and to share ratably in the assets of the Company legally available for distribution to its shareholders in the event of its liquidation, dissolution or winding up after payment of, or adequate provision for, all known debts and liabilities of the Company.
Preferred Shares On August 5, 2005, the Company completed a public offering of 2,400,000 of its 8.00% Series A Cumulative Redeemable Preferred Shares of Beneficial Interest, liquidation preference $25.00 per share. Net proceeds of the offering, less expenses and underwriters commissions, were approximately $57,720. Proceeds from the offering were used to finance the acquisition of the Company’s interests in Mystic Partners, LLC and SB Partners, LLC. The remaining net proceeds have been principally allocated to fund secured development loans and for general corporate purposes. The Declaration of Trust authorizes our Board of Trustees to classify any unissued preferred shares and to reclassify any previously classified but unissued preferred shares of any series from time to time in one or more series, as authorized by the Board of Trustees. Prior to issuance of shares of each series, the Board of Trustees is required by Maryland REIT Law and our Declaration of Trust to set for each such series, subject to the provisions of our Declaration of Trust regarding the restriction on transfer of shares of beneficial interest, the terms, the preferences, conversion or other rights, voting powers, restrictions, limitations as to dividends or other distributions, qualifications and terms or conditions of redemption for each such series. Thus, our Board of Trustees could authorize the issuance of additional preferred shares with terms and conditions which could have the effect of delaying, deferring or preventing a transaction or a change in control in us that might involve a premium price for holders of common shares or otherwise be in their best interest. Common Partnership Units Since the completion of the initial public offering we have issued 10,190,094 units of limited partnership interest in connection with the acquisitions of the Residence Inn, Norwood; Hilton Garden Inn, JFK Airport; Hampton Inn, Danville; and Holiday Inn Express, Long Island City. We have also issued an additional 1,275,663 units of limited partnership interest in connection with final settlement of the purchase prices of several hotels and have redeemed 458,465 units of limited partnership interest in connection with the sale of certain hotels. During 2006 and 2005, 82,077 and 8,155 common units were converted to Class A Common Shares, respectively. The total number of units of limited partnership interest outstanding as of December 31, 2006, 2005 and 2004 was 3,835,586; 2,834,282; and 2,842,437, respectively. These units can be converted to common shares which are issuable to the limited partners upon exercise of their redemption rights. The number of shares issuable upon exercise of the redemption rights will be adjusted upon the occurrence of stock splits, mergers, consolidation or similar pro rata share transactions, that otherwise would have the effect of diluting the ownership interest of the limited partners or our shareholders.

68 HERSHA 2006 ANNUAL REPORT
___________________________________________________________________________________ HERSHA HOSPITALITY TRUST AND SUBSIDIARIES NOTES TO THE CONSOLIDATED FINANCIAL STATEMENTS FOR THE YEARS ENDED DECEMBER 31, 2006, 2005, AND 2004 [IN THOUSANDS, EXCEPT SHARE AND PER SHARE AMOUNTS] ___________________________________________________________________________________ NOTE 14 - INCOME TAXES The Company has elected to be taxed as a REIT under Sections 856 through 860 of the Code commencing with its taxable year ended December 31, 1999. To qualify as a REIT, the Company must meet a number of organizational and operational requirements, including a requirement that it currently distribute at least 90% of its adjusted taxable income to its shareholders. It is the Company’s current intention to adhere to these requirements and maintain the Company’s qualification for taxation as a REIT. As a REIT, the Company generally will not be subject to federal corporate income tax on that portion of its net income that is currently distributed to shareholders. If the Company fails to qualify for taxation as a REIT in any taxable year, it will be subject to federal income taxes at regular corporate rates (including any applicable alternative minimum tax) and may not be able to qualify as a REIT for four subsequent taxable years. Even if the Company qualifies for taxation as a REIT, the Company may be subject to certain state and local taxes on its income and property, and to federal income and excise taxes on its undistributed taxable income. Taxable income from non-REIT activities managed through taxable REIT subsidiaries is subject to federal, state and local income taxes. 44 New England Company, a 100% owned taxable REIT subsidiary, and Revere Hotel Group LLC, a 55% owned taxable REIT subsidiary, (collectively “Consolidated TRS”) are both entities subject to income taxes at the applicable federal, state and local tax rates. In 2006 44 New England Management Company had net operating income of $420. In 2005 and 2004, 44 New England Management Company generated net operating losses of $20 and $1,279, respectively. In 2006, 2005 and 2004, Revere Hotel Group LLC generated net operating losses of $521, $670, $201, respectively. The Company did not record an income tax expense (benefit) for the net operating losses generated in 2006, 2005 or 2004. The provision for income taxes differs from the amount of income tax determined by applying the applicable U.S. statutory federal income tax rate to pretax income as a result of the following differences: For the year ended December 31, 2006 2005 2004Computed "Expected" federal tax expense (benefit) of TRS, at 35% $ (451) $ (242 ) $ (518)State income taxes, net of federal income tax effect (6) (44 ) (74)Changes in valuation allowance 457 286 592
Total income tax expense $ - $ - $ -
The components of consolidated TRS’s deferred tax assets as of December 31, 2006 and 2005 were as follows: as of December 31, 2006 2005Deferred tax assets:
Net operating loss carryforward $ 1,476 $ 1,048 Depreciation - (30)
Net deferred tax assets 1,476 1,018 Valuation allowance (1,476 ) (1,018)
Deferred tax assets $ - $ -
In assessing the realizability of deferred tax assets, management considers whether it is more likely than not that some portion or all of the deferred tax assets will not be realized. Based on the level of historical taxable income and projections for future taxable income over the periods in which the deferred tax assets are deductible, management believes it is more likely than not that the Consolidated TRS will not realize the benefits of these deferred tax assets at December 31, 2006.

69 HERSHA 2006 ANNUAL REPORT
___________________________________________________________________________________ HERSHA HOSPITALITY TRUST AND SUBSIDIARIES NOTES TO THE CONSOLIDATED FINANCIAL STATEMENTS FOR THE YEARS ENDED DECEMBER 31, 2006, 2005, AND 2004 [IN THOUSANDS, EXCEPT SHARE AND PER SHARE AMOUNTS] ___________________________________________________________________________________ NOTE 15 - SELECTED QUARTERLY FINANCIAL DATA (UNAUDITED) Year Ended December 31, 2006
First Quarter Second Quarter
Third Quarter
Fourth Quarter
Revenues $ 24,681 $ 39,030 $ 42,788 $ 42,571 Expenses 28,440 36,320 38,092 43,551 Income (Loss) from Unconsolidated Joint Ventures (1,110) 769 1,773 367Income (Loss) before Minority Interests and Discontinued Operations (4,869) 3,479 6,469 (613)Income (Loss) Allocated to Minority Holders in Continuing Operations (1,015) 690 868 8 Income (Loss) from Continuing Operations (3,854) 2,789 5,601 (621)Income (Loss) from Discontinued Operations (including Gain on Disposition of Hotel Properties) (30) 587 179 447 Net Income (Loss) (3,884) 3,376 5,780 (174)Preferred Distributions 1,200 1,200 1,200 1,200
Net Income (Loss) applicable to Common Shareholders $ (5,084) $ 2,176 $ 4,580 $ (1,374)
Basic and diluted earnings per share: Income (Loss) from continuing operations applicable to
common shareholders $ (0.25) $ 0.06 $ 0.15 $ (0.05)Discontinued Operations $ - $ 0.03 $ 0.01 $ 0.01Net Income (Loss) applicable to Common Shareholders $ (0.25) $ 0.09 $ 0.16 $ (0.04)
Weighted Average Common Shares Outstanding Basic 20,308,225 25,469,708 28,413,553 34,115,606 Diluted 20,308,225 29,056,539 28,556,303 34,115,606

70 HERSHA 2006 ANNUAL REPORT
___________________________________________________________________________________ HERSHA HOSPITALITY TRUST AND SUBSIDIARIES NOTES TO THE CONSOLIDATED FINANCIAL STATEMENTS FOR THE YEARS ENDED DECEMBER 31, 2006, 2005, AND 2004 [IN THOUSANDS, EXCEPT SHARE AND PER SHARE AMOUNTS] ___________________________________________________________________________________ NOTE 15 - SELECTED QUARTERLY FINANCIAL DATA (UNAUDITED) (CONTINUED) Year Ended December 31, 2005
First Quarter Second Quarter
Third Quarter
Fourth Quarter
Revenues $ 12,085 $ 20,256 $ 26,013 $ 21,920 Expenses 13,233 17,667 23,528 23,811 Income (Loss) from Unconsolidated Joint Ventures 49 279 522 (393)Income before Minority Interests and Discontinued Operations (1,099) 2,868 3,007 (2,284)Income (Loss) Allocated to Minority Holders in Continuing Operations (242) 399 370 (489)Income (Loss) from Continuing Operations (857) 2,469 2,637 (1,795)Income (Loss) from Discontinued Operations (including Gain on Disposition of Hotel Properties) (117) 1,286 (176 ) (150)Net Income (Loss) (974 ) 3,755 2,461 (1,945)Preferred Distributions - - 720 1,200Net Income (Loss) applicable to Common Shareholders $ (974) $ 3,755 $ 1,741 $ (3,145)
Basic and diluted earnings per share: Income from continuing operations applicable to common
shareholders $ (0.04) $ 0.12 $ 0.10 $ (0.14 )Discontinued Operations $ (0.01) $ 0.06 $ (0.01 ) $ (0.01 )Net Income (Loss) applicable to Common Shareholders $ (0.05) $ 0.18 $ 0.09 $ (0.15 )
Weighted Average Common Shares Outstanding Basic 20,291,234 20,293,169 20,293,827 20,296,009 Diluted 20,291,234 23,159,013 20,364,827 20,296,009

71 HERSHA 2006 ANNUAL REPORT
___________________________________________________________________________________ HERSHA HOSPITALITY TRUST AND SUBSIDIARIES NOTES TO THE CONSOLIDATED FINANCIAL STATEMENTS FOR THE YEARS ENDED DECEMBER 31, 2006, 2005, AND 2004 [IN THOUSANDS, EXCEPT SHARE AND PER SHARE AMOUNTS] ___________________________________________________________________________________ NOTE 16 - SUBSEQUENT EVENTS
Subsequent to December 31, 2006, we acquired interests in the following hotel properties:
Brand Location
Ownership Interest Acquisition Date
Purchase Price
Residence Inn Langhorne, PA Wholly Owned 1/8/2007 $ 15,330 Residence Inn Carlisle, PA Wholly Owned 1/10/2007 $ 9,945 Holiday Inn Express Chester, NY Wholly Owned 1/25/2007 $ 9,200 Hampton Inn New York (Seaport), NY Wholly Owned 2/1/2007 $ 27,600 Holiday Inn Express New York (Chelsea), NY 50% 2/1/2007 $ 7,750

72 HERSHA 2006 ANNUAL REPORT
___________________________________________________________________________________ HERSHA HOSPITALITY TRUST AND SUBSIDIARIES SCHEDULE III - REAL ESTATE AND ACCUMULATED DEPRECIATION AS OF DECEMBER 31, 2006 [IN THOUSANDS] ___________________________________________________________________________________ Gross Amounts Costs Capitalized at which Net Book Upon Subsequent to Carried at Accumulated Value Which Initial Costs Acquisition Close of Period Depreciation Land Latest
Buildings
and Buildings
and Buildings
and Buildings and Buildings
and Income
Statement
Description Encumbr-ances Land
Improve-ments Land
Improve-ments Land
Improve-ments Total
Improve-ments
Improve-ments
Date of Acquisition
Is Computed
Holiday Inn,
Harrisburg, PA $ 3,134 $ 412 $ 1,234 $ - $ 2,933 $ 412 $ 4,167 $ 4,579 $ 1,835 $ 2,744 12/15/94 15 to 40 Holiday Inn Express,
New Columbia, PA
1,659 94 2,510 66 702 160 3,212 3,372 728 2,644 12/01/97 15 to 40
Holiday Inn Express,
Hershey, PA 4,332 426 2,645 410 3,125 836 5,770 6,606 1,311 5,295 10/01/97 15 to 40 HIEXP & Suites,
Harrisburg, PA - 213 1,934 81 1,025 294 2,959 3,253 604 2,649 03/06/98 15 to 40 Comfort Inn,
Harrisburg, PA 2,212 - 2,720 214 1,108 214 3,828 4,042 824 3,218 05/15/98 15 to 40 Hampton Inn,
Selinsgrove, PA
3,042 157 2,511 93 2,285 250 4,796 5,046 1,267 3,779 09/12/96 15 to 40
Hampton Inn, Carlisle, PA 3,641 300 3,109 200 2,120 500 5,229 5,729 1,207 4,522 06/01/97 15 to 40
Hampton Inn, Danville, PA 2,304 300 2,787 99 1,157 399 3,944 4,343 807 3,536 08/28/97 15 to 40
Hampton Inn, Hershey, PA 3,346 807 5,714 4 236 811 5,950 6,761 1,112 5,649 01/01/00 15 to 40
Mainstay Suites Frederick, MD 2,707 262 1,049 171 2,917 433 3,966 4,399 496 3,903 01/01/02 15 to 40
Sleep/Mainstay KOP, PA - 1,133 7,294 - 88 1,133 7,382 8,515 1,029 7,486 06/01/01 15 to 40
Hampton Inn, Linden, NJ 9,811 1,211 11,961 - 45 1,211 12,006 13,217 981 12,236 10/01/04 15 to 40
Hilton Garden Inn,
Edison, NJ 7,849 - 12,159 - 10 - 12,169 12,169 989 11,180 10/01/04 15 to 40
Residence Inn Framingham, MA
9,215 1,325 12,737 - 85 1,325 12,822 14,147 903 13,244 03/26/04 15 to 40
Comfort Inn, Fredrick, MD 3,505 450 4,342 - 38 450 4,380 4,830 291 4,539 05/27/04 15 to 40
Residence Inn Greenbelt, MD 12,543 2,615 14,815 - 55 2,615 14,870 17,485 917 16,568 07/16/04 15 to 40
Hilton Garden Inn,
Gettysburg, PA 5,234 745 6,116 - 14 745 6,130 6,875 379 6,496 07/23/04 15 to 40
Fairfield Inn Laurel, MD - 927 6,120 - 451 927 6,571 7,498 314 7,184 01/31/05 15 to 40
Hampton Inn, MSGA
NYC, NY 26,500 5,472 23,280 - 1 5,472 23,281 28,753 1,057 27,696 04/01/05 15 to 40 Holiday Inn Express,
Langhorne, PA 6,550 1,088 6,573 - 23 1,088 6,596 7,684 268 7,416 05/26/05 15 to 40 Holiday Inn Express,
Malvern, PA 4,070 2,639 5,324 654 - 3,293 5,324 8,617 216 8,401 05/24/05 15 to 40

73 HERSHA 2006 ANNUAL REPORT
___________________________________________________________________________________ HERSHA HOSPITALITY TRUST AND SUBSIDIARIES SCHEDULE III - REAL ESTATE AND ACCUMULATED DEPRECIATION AS OF DECEMBER 31, 2006 (CONTINUED) [IN THOUSANDS] ___________________________________________________________________________________ Gross Amounts Costs Capitalized at which Net Book Upon Subsequent to Carried at Accumulated Value Which Initial Costs Acquisition Close of Period Depreciation Land Latest
Buildings
and Buildings
and Buildings
and Buildings and Buildings
and Income
Statement
Description Encumbr-ances Land
Improve-ments Land
Improve-ments Land
Improve-ments Total
Improve-ments
Improve-ments
Date of Acquisition
Is Computed
Holiday Inn Express,
King of Prussia, PA
12,950 2,557 13,339 - 90 2,557 13,429 15,986 543 15,443 05/23/05 15 to 40
Courtyard Inn Wilmington, DE
12,730 988 10,295 - 28 988 10,323 11,311 398 10,913 06/17/05 15 to 40
McIntosh Inn Wilmington, DE
- 898 4,515 - 7 898 4,522 5,420 174 5,246 06/17/05 15 to 40
Courtyard Inn Brookline, MA 38,913 - 47,414 - 27 - 47,441 47,441 1,829 45,612 06/15/05 15 to 40
Courtyard Inn Scranton, PA 6,300 761 7,193 - 90 761 7,283 8,044 160 7,884 02/01/06 15 to 40
Courtyard Inn Langhorne, PA 15,575 3,064 16,068 - - 3,064 16,068 19,132 385 18,747 01/03/06 15 to 40
Fairfield Inn Mt Laurel, NJ 7,400 1,744 8,140 - 20 1,744 8,160 9,904 196 9,708 01/03/06 15 to 40
Fairfield Inn Bethlehem, PA 6,225 1,399 6,778 - - 1,399 6,778 8,177 162 8,015 01/03/06 15 to 40
Residence Inn Tyson's Corner, VA
9,443 4,283 14,475 - 7 4,283 14,482 18,765 316 18,449 02/02/06 15 to 40
Hilton Garden Inn,
JFK Airport, NY
- - 25,018 - 178 - 25,196 25,196 554 24,642 02/16/06 15 to 40
Hawthorn Suites Franklin, MA 8,500 1,872 8,968 - - 1,872 8,968 10,840 159 10,681 04/25/06 15 to 40
Comfort Inn, Dartmouth, MA
3,197 902 3,525 - 2 902 3,527 4,429 55 4,374 05/01/06 15 to 40
Residence Inn Dartmouth, MA
8,927 1,933 10,434 - 2 1,933 10,436 12,369 163 12,206 05/01/06 15 to 40
Holiday Inn Express,
Cambridge, MA
8,580 1,956 9,793 - - 1,956 9,793 11,749 153 11,596 05/03/06 15 to 40
Residence Inn Norwood, MA - 1,970 11,761 - - 1,970 11,761 13,731 134 13,597 07/27/06 15 to 40
Hampton Inn, Brookhaven, NY
15,361 3,130 17,345 - - 3,130 17,345 20,475 127 20,348 09/06/06 15 to 40
Holiday Inn Express,
Hauppauge, NY
10,115 2,737 14,080 - - 2,737 14,080 16,817 103 16,714 09/01/06 15 to 40

74 HERSHA 2006 ANNUAL REPORT
___________________________________________________________________________________ HERSHA HOSPITALITY TRUST AND SUBSIDIARIES SCHEDULE III - REAL ESTATE AND ACCUMULATED DEPRECIATION AS OF DECEMBER 31, 2006 (CONTINUED) [IN THOUSANDS] ___________________________________________________________________________________ Gross Amounts Costs Capitalized at which Net Book Upon Subsequent to Carried at Accumulated Value Which Initial Costs Acquisition Close of Period Depreciation Land Latest
Buildings
and Buildings
and Buildings
and Buildings
and Buildings
and Income
Statement
Description Encumbr-ances Land
Improve-ments Land
Improve-ments Land
Improve-ments Total
Improve-ments
Improve-ments
Date of Acquisition
Is Computed
Courtyard Inn Alexandria, VA 25,000 6,376 26,089 - - 6,376 26,089 32,465 190 32,275 09/29/06 15 to 40
Hampton Inn, Chelsea
NYC, NY 36,000 8,905 33,500 - - 8,905 33,500 42,405 284 42,121 09/29/06 15 to 40 Hyatt Summerfield Suites
Bridgewater, NJ 14,492 3,369 19,685 - - 3,369 19,685 23,054 - 23,054 12/28/06 15 to 40 Hyatt Summerfield Suites
Charlotte, NC 7,330 767 7,315 - - 767 7,315 8,082 - 8,082 12/28/06 15 to 40 Hyatt Summerfield Suites
Gaithersburg, MD
13,720 2,907 16,001 - - 2,907 16,001 18,908 - 18,908 12/28/06 15 to 40
Hyatt Summerfield Suites
Pleasant Hills, CA
20,160 6,207 17,229 - - 6,207 17,229 23,436 - 23,436 12/28/06 15 to 40
Hyatt Summerfield Suites
Pleasanton, CA 14,490 3,934 12,560 - - 3,934 12,560 16,494 - 16,494 12/28/06 15 to 40 Hyatt Summerfield Suites
Scottsdale, AZ 16,778 3,055 19,968 - - 3,055 19,968 23,023 - 23,023 12/28/06 15 to 40 Hyatt Summerfield Suites
White Plains, NY
33,030 8,814 30,273 - - 8,814 30,273 39,087 - 39,087 12/28/06 15 to 40
8th Ave Land NYC, NY 13,250 21,773 - - - 21,773 - 21,773 2 21,771 06/28/06 15 to 40
41st Street Facility NYC, NY 12,100 10,735 11,051 - - 10,735 11,051 21,786 127 21,659 07/28/06 15 to 40
Sheraton Four Points
Revere, MA 8,496 70 14,996 - - 70 14,996 15,066 2,942 12,124 02/23/04 15 to 40
Springhill Suites Williamsburg, VA
5,594 1,430 10,293 - 2 1,430 10,295 11,725 1,253 10,472 11/22/05 15 to 40
Residence Inn Williamsburg, VA
8,215 1,911 11,625 - 606 1,911 12,231 14,142 1,567 12,575 11/22/05 15 to 40
Hampton Inn Philadelphia, PA
-
2,928
24,382
-
147
2,928
24,529
27,457
3,862
23,595
02/15/06
15 to 40
Total Investment in
Real Estate $ 504,525 $ 133,951 $ 621,042 $ 1,992 $ 19,624 $ 135,943 $ 640,666 $ 776,609 $ 33,373 $ 743,236

75 HERSHA 2006 ANNUAL REPORT
___________________________________________________________________________________ HERSHA HOSPITALITY TRUST AND SUBSIDIARIES SCHEDULE III - REAL ESTATE AND ACCUMULATED DEPRECIATION AS OF DECEMBER 31, 2006 (CONTINUED) [IN THOUSANDS] ___________________________________________________________________________________
2006 Reconciliation of Real Estate Balance at beginning of year $ 318,865 Additions during the year 479,028 Dispositions During the year (21,284 ) Assets held for sale - Investments in real estate 776,609 Assets held for sale - Total Real Estate $ 776,609
Reconciliation of Accumulated Depreciation Balance at beginning of year $ 21,727 Depreciation for year 14,390 Accumulated Depreciation on Assets Sold (2,744 ) Balance at the end of year $ 33,373
The aggregate cost of land, buildings and improvements for Federal income tax purposes is approximately $676,415.
2005 Reconciliation of Real Estate Balance at beginning of year $ 178,935 Additions during the year 158,095 Change in assets held for sale (20,809 ) Investment in Real Estate 316,221 Assets Held for Sale 2,644
Balance at end of year $ 318,865
Reconciliation of Accumulated Depreciation Balance at beginning of year $ 14,418 Depreciation for year 8,152 Accumulated Depreciation on Assets Sold (843) Balance at the end of year $ 21,727
The aggregate cost of land, buildings and improvements for Federal income tax purposes is approximately $252,444 Depreciation is computed based upon the following useful lives: Buildings and Improvements 15 to 40 years

76 HERSHA 2006 ANNUAL REPORT
Item 9. Changes in and Disagreements with Accountants on Accounting and Financial Disclosure None. Item 9A. Controls and Procedures (a) Evaluation of Disclosure Controls and Procedures Under the supervision and with the participation of our management, including our Chief Executive Officer and Chief Financial Officer, we conducted an evaluation of our disclosure controls and procedures, as such term is defined under Rule 13a-15(e) promulgated under the Securities Exchange Act of 1934, as amended (the Exchange Act), as of the end of the period covered by this report. Based on that evaluation, the Chief Executive Officer and Chief Financial Officer concluded that our disclosure controls and procedures as of the end of the period covered by this report are functioning effectively to provide reasonable assurance that the information required to be disclosed by us in reports filed under the Securities Exchange Act of 1934 is (i) recorded, processed, summarized and reported within the time periods specified in the SEC’s rules and forms and (ii) accumulated and communicated to our management, including the Chief Executive Officer and Chief Financial Officer, as appropriate to allow timely decisions regarding disclosure. A control system cannot provide absolute assurance, however, that the objectives of the controls system are met, and no evaluation of controls can provide absolute assurance that all control issues and instances of fraud, if any, within a company have been detected. (b) Management’s Report on Internal Control Over Financial Reporting The Company’s management is responsible for establishing and maintaining adequate internal control over financial reporting, as defined within Exchange Act Rules 13a-15(f) and 15d-15(f). Internal control over financial reporting refers to the processes designed to provide reasonable assurance regarding the reliability of financial reporting and the preparation of financial statements for external purposes in accordance with generally accepted accounting principles, and includes policies and procedures that: pertain to the maintenance of records that, in reasonable detail, accurately and fairly reflect the transactions and dispositions of the
assets of the Company; provide reasonable assurance that transactions are recorded as necessary to permit preparation of financial statements in
accordance with generally accepted accounting principles, and that receipts and expenditures of the Company are being made only in accordance with authorizations of management and directors of the Company; and
provide reasonable assurance regarding prevention or timely detection of unauthorized acquisition, use, or disposition of the Company’s assets that could have a material effect on the financial statements.
Because of its inherent limitations, internal control over financial reporting may not prevent or detect misstatements. Also, projections of any evaluation of effectiveness to future periods are subject to the risk that controls may become inadequate because of changes in conditions, or that the degree of compliance with the policies or procedures may deteriorate. A material weakness in internal control over financial reporting is a significant deficiency, or a combination of significant deficiencies, that results in more than a remote likelihood that a material misstatement of the annual or interim financial statements will not be prevented or detected. Management conducted an evaluation of the effectiveness of the Company’s internal control over financial reporting based on the criteria contained in Internal Control — Integrated Framework issued by the Committee of Sponsoring Organizations (COSO) of the Treadway Commission as of December 31, 2006. Based on that evaluation, management has concluded that, as of December 31, 2006, the Company maintained effective internal control over financial reporting . We acquired the Courtyard by Marriott, Alexandria, VA (the Acquisition) during the year ended December 31, 2006 and management excluded from its assessment of the effectiveness of the Company’s internal control over financial reporting as of December 31, 2006, the Acquisition’s internal control over financial reporting associated with total assets of $0.2 million and total revenues of $1.3 million included in the consolidated financial statements for the year ended December 31, 2006.

77 HERSHA 2006 ANNUAL REPORT
Management’s assessment of the effectiveness of our internal control over financial reporting as of December 31, 2006 has been audited by KPMG LLP, an independent registered public accounting firm, as stated in their report which is included herein. (c) Changes in Internal Control Over Financial Reporting None.

78 HERSHA 2006 ANNUAL REPORT
Report of Independent Registered Public Accounting Firm
The Board of Directors and Shareholders of Hersha Hospitality Trust: We have audited management's assessment, included in the accompanying Management’s Report on Internal Control Over Financial Reporting (Item 9 A (b)), that Hersha Hospitality Trust (the Company) maintained effective internal control over financial reporting as of December 31, 2006, based on criteria established in Internal Control—Integrated Framework issued by the Committee of Sponsoring Organizations of the Treadway Commission (COSO). The Company's management is responsible for maintaining effective internal control over financial reporting and for its assessment of the effectiveness of internal control over financial reporting. Our responsibility is to express an opinion on management's assessment and an opinion on the effectiveness of the Company’s internal control over financial reporting based on our audit. We conducted our audit in accordance with the standards of the Public Company Accounting Oversight Board (United States). Those standards require that we plan and perform the audit to obtain reasonable assurance about whether effective internal control over financial reporting was maintained in all material respects. Our audit included obtaining an understanding of internal control over financial reporting, evaluating management's assessment, testing and evaluating the design and operating effectiveness of internal control, and performing such other procedures as we considered necessary in the circumstances. We believe that our audit provides a reasonable basis for our opinion. A company's internal control over financial reporting is a process designed to provide reasonable assurance regarding the reliability of financial reporting and the preparation of financial statements for external purposes in accordance with generally accepted accounting principles. A company's internal control over financial reporting includes those policies and procedures that (1) pertain to the maintenance of records that, in reasonable detail, accurately and fairly reflect the transactions and dispositions of the assets of the company; (2) provide reasonable assurance that transactions are recorded as necessary to permit preparation of financial statements in accordance with generally accepted accounting principles, and that receipts and expenditures of the company are being made only in accordance with authorizations of management and directors of the company; and (3) provide reasonable assurance regarding prevention or timely detection of unauthorized acquisition, use, or disposition of the company’s assets that could have a material effect on the financial statements. Because of its inherent limitations, internal control over financial reporting may not prevent or detect misstatements. Also, projections of any evaluation of effectiveness to future periods are subject to the risk that controls may become inadequate because of changes in conditions, or that the degree of compliance with the policies or procedures may deteriorate. In our opinion, management's assessment that The Company maintained effective internal control over financial reporting as of December 31, 2006, is fairly stated, in all material respects, based on criteria established in Internal Control—Integrated Framework issued by the Committee of Sponsoring Organizations of the Treadway Commission (COSO). Also, in our opinion, The Company maintained, in all material respects, effective internal control over financial reporting as of December 31, 2006, based on criteria established in Internal Control—Integrated Framework issued by the Committee of Sponsoring Organizations of the Treadway Commission (COSO). The Company acquired The Courtyard by Marriott, Alexandria, VA (the Acquisition) during the year December 31, 2006, and management excluded from its assessment of the effectiveness of the Company’s internal control over financial reporting as of December 31, 2006, the Acquisition’s internal control over financial reporting associated with total assets of $245,000 and total revenues of $1.3 million included in the consolidated financial statements of the Company as of and for the year ended December 31, 2006. Our audit of internal control over financial reporting of the Company also excluded an evaluation of the internal control over financial reporting of the Acquisition. We also have audited, in accordance with the standards of the Public Company Accounting Oversight Board (United States), the consolidated balance sheets of the Company and its subsidiaries’ as of December 31, 2006 and 2005, and the related consolidated statements of operations, shareholders’ equity and comprehensive income, and cash flows for each of the years in the three-year period ended December 31, 2006, and our report dated March 15, 2007, expressed an unqualified opinion on those consolidated financial statements. /s/ KPMG LLP Philadelphia, Pennsylvania March 15, 2007

79 HERSHA 2006 ANNUAL REPORT