herring and beef meals lead to differences in plasma 2
TRANSCRIPT
Herring and beef meals lead to differences in plasma2-aminoaidipic acid, ß-alanine, 4-hydroxyproline, cetoleic acidand docosahexaenoic acid concentrations in overweight men
Downloaded from: https://research.chalmers.se, 2022-01-30 19:14 UTC
Citation for the original published paper (version of record):Ross, A., Svelander, C., Undeland, I. et al (2015)Herring and beef meals lead to differences in plasma 2-aminoaidipic acid, ß-alanine,4-hydroxyproline, cetoleic acid and docosahexaenoic acid concentrations in overweight menJournal of Nutrition, 145(11): 2456-2463http://dx.doi.org/10.3945/jn.115.214262
N.B. When citing this work, cite the original published paper.
research.chalmers.se offers the possibility of retrieving research publications produced at Chalmers University of Technology.It covers all kind of research output: articles, dissertations, conference papers, reports etc. since 2004.research.chalmers.se is administrated and maintained by Chalmers Library
(article starts on next page)
The Journal of Nutrition
Genomics, Proteomics, and Metabolomics
Herring and Beef Meals Lead to Differences inPlasma 2-Aminoadipic Acid, b-Alanine,4-Hydroxyproline, Cetoleic Acid, andDocosahexaenoic Acid Concentrations inOverweight Men1–3
Alastair B Ross,4* Cecilia Svelander,4 Ingrid Undeland,4 Rui Pinto,5,6 and Ann-Sofie Sandberg4
4Food and Nutrition Science, Department of Biology and Biological Engineering, Chalmers University of Technology, Gothenburg,
Sweden; 5Bioinformatics Infrastructure for Life Sciences, Linkoping, Sweden; and 6Computational Life Science Cluster, Department of
Chemistry, Umea University, Umea, Sweden
Abstract
Background: Dietary guidelines generally recommend increasing fish intake and reducing red meat intake for better long-
term health. Few studies have compared the metabolic differences between eating meat and fish.
Objective: The objective of this study was to determine whether there are differences in the postprandial plasma
metabolic response to meals containing baked beef, baked herring, and pickled herring.
Methods: Seventeen overweight men (BMI 25–30 kg/m2, 41–67 y of age) were included in a randomized crossover
intervention study. Subjects ate baked herring–, pickled herring–, and baked beef–based meals in a randomized order and
postprandial blood plasma samples were taken over 7 h. Plasma metabolomics were measured with the use of gas
chromatography–mass spectrometry and areas under the curve for detectedmetabolites were compared betweenmeals.
Results: The plasma postprandial response of 2-aminoadipic acid, a suggested marker of diabetes risk, was 1.6 times
higher after the beef meal than after the baked herring meal (P < 0.001). Plasma b-alanine and 4-hydroxyproline both were
markedly greater after beef intake than after herring intake (16 and 3.4 times the response of baked herring, respectively;
P < 0.001). Herring intake led to a greater plasma postprandial response from docosahexaenoic acid (DHA) and cetoleic
acid compared with beef (17.6 and 150 times greater, respectively; P < 0.001), whereas hippuric acid and benzoic acid
were elevated after pickled herring compared with baked herring (5.4 and 43 times higher; P < 0.001).
Conclusions: These results in overweight men confirm that DHA and cetoleic acid reflect herring intake, whereas b-alanine
and 4-hydroxyproline are potential biomarkers for beef intake. The greater postprandial rise in 2-aminoadipic acid after the beef
meal, coupled to its proposed role in stimulating insulin secretion, may have importance in the context of red meat intake and
increased diabetes risk. This trial was registered at clinicaltrials.gov as NCT02381613. J Nutr 2015;145:2456–63.
Keywords: metabolomics, herring, beef, plasma biomarker, diabetes, 2-aminoadipic acid, beta alanine,
4-hydroxyproline
Introduction
Current dietary guidelines advise increased intake of fish andother seafood in place of meat (1). Greater intake of fish isassociated with a decreased risk of lung and colorectal cancer (2,3) and childhood allergy (4, 5), as well as a reduction in coronary
heart disease and stroke risk (6), whereas a high intake of redmeat is generally associated with negative health outcomes,including an increased risk of cardiovascular disease and cancer(6–9). In spite of the fact that red meat and fish are importantdietary protein sources, relatively few intervention studies havecompared meat and fish intakes. Among the findings in studiescomparing meat and fish intakes, short- to medium-term fish
3 Supplemental Figure 1 and Supplemental Tables 1–3 are available from the
‘‘Online Supporting Material’’ link in the online posting of the article and from the
same link in the online table of contents at http://jn.nutrition.org.
*To whom correspondence should be addressed. E-mail: Alastair.Ross@
chalmers.se.
1 Supported by the Swedish Board of Agriculture (formerly National Board of
Fisheries; project no. 031-0267-08, European Fisheries Fund Investing in Sustainable
Fisheries); the Region of Vastra Gotaland (project RUN 612-11-02-08); and the
Swedish Research Council for Environmental Science, Agricultural Science and
Spatial Planning (project no. 222-2011-1322).2 Author disclosures: AB Ross, C Svelander, I Undeland, R Pinto, and A-S
Sandberg, no conflicts of interest.
ã 2015 American Society for Nutrition.
2456 Manuscript received March 24, 2015. Initial review completed April 29, 2015. Revision accepted August 20, 2015.
First published online September 23, 2015; doi:10.3945/jn.115.214262.
by Alastair R
oss on Novem
ber 3, 2015jn.nutrition.org
Dow
nloaded from
2.DCSupplemental.html http://jn.nutrition.org/content/suppl/2015/09/23/jn.115.21426Supplemental Material can be found at:
intake increased HDL cholesterol (10, 11), reduced bloodpressure (12), and increased insulin sensitivity (13). Theseresults imply that eating more fish is beneficial to health, yetbeyond the well-researched area of v-3 FAs and high concen-trations of selenium and vitamin D, little is known about thewider metabolic effects of eating fish compared with red meat.
Rodent studies have indicated that long-term fish intake canhave a wide impact on gene expression (14). Because metabolitesare the end product of gene expression and reflect the interactionbetween environment and genotype, using global metaboliteprofiling (metabolomics) could be a way of better understandingthe different ways that fish and meat interact with and affecthuman endogenous metabolism. Metabolomics is now widelyused in human nutrition research (15), and fasting blood plasmasamples are often used to search for effects on metabolic homeo-stasis. This is attractive, because it represents metabolism at arelatively steady state. However, humans are most frequently ina postprandial state, and metabolite concentrations are highlydynamic in response to the intake of food, so measuring onlyfasting plasma samples may mean that we are missing many ofthe metabolic changes occurring after a meal (16).
In order to probe the differences in metabolic responsebetween fish and meat beyond n–3 FAs, we performed a ran-domized crossover study with meals based on herring (Claupeaharengus), a commonly consumed fish in Northern Europe, andbeef. Herring can be prepared in several ways, including bakingand pickling. In this study, we compared the postprandialmetabolic response of baked herring and pickled herring withbaked ground beef in overweight male subjects with the aim of
finding metabolites that could be biomarkers of fish and meatintakes, and possibly explaining the difference in intrinsic phys-iologic response to these 2 sources of dietary protein.
Methods
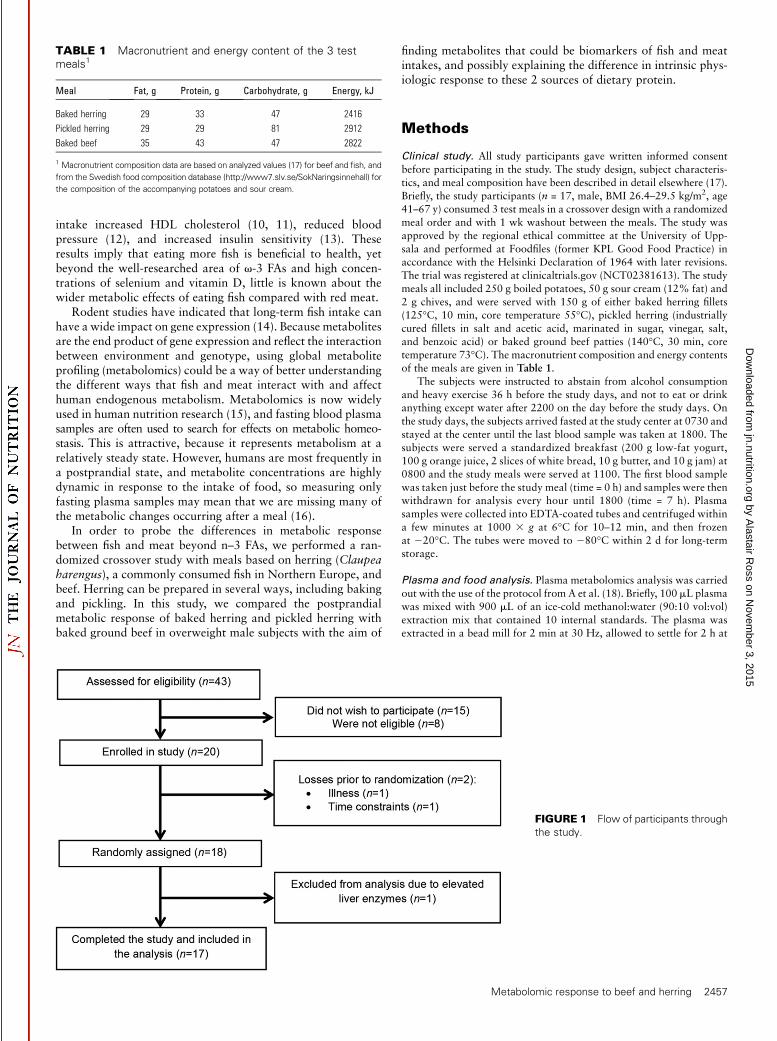
Clinical study. All study participants gave written informed consent
before participating in the study. The study design, subject characteris-
tics, and meal composition have been described in detail elsewhere (17).
Briefly, the study participants (n = 17, male, BMI 26.4–29.5 kg/m2, age41–67 y) consumed 3 test meals in a crossover design with a randomized
meal order and with 1 wk washout between the meals. The study was
approved by the regional ethical committee at the University of Upp-
sala and performed at Foodfiles (former KPL Good Food Practice) inaccordance with the Helsinki Declaration of 1964 with later revisions.
The trial was registered at clinicaltrials.gov (NCT02381613). The study
meals all included 250 g boiled potatoes, 50 g sour cream (12% fat) and
2 g chives, and were served with 150 g of either baked herring fillets(125�C, 10 min, core temperature 55�C), pickled herring (industrially
cured fillets in salt and acetic acid, marinated in sugar, vinegar, salt,
and benzoic acid) or baked ground beef patties (140�C, 30 min, coretemperature 73�C). The macronutrient composition and energy contents
of the meals are given in Table 1.
The subjects were instructed to abstain from alcohol consumption
and heavy exercise 36 h before the study days, and not to eat or drinkanything except water after 2200 on the day before the study days. On
the study days, the subjects arrived fasted at the study center at 0730 and
stayed at the center until the last blood sample was taken at 1800. The
subjects were served a standardized breakfast (200 g low-fat yogurt,100 g orange juice, 2 slices of white bread, 10 g butter, and 10 g jam) at
0800 and the study meals were served at 1100. The first blood sample
was taken just before the study meal (time = 0 h) and samples were thenwithdrawn for analysis every hour until 1800 (time = 7 h). Plasma
samples were collected into EDTA-coated tubes and centrifuged within
a few minutes at 1000 3 g at 6�C for 10–12 min, and then frozen
at 220�C. The tubes were moved to 280�C within 2 d for long-termstorage.
Plasma and food analysis. Plasma metabolomics analysis was carried
out with the use of the protocol from A et al. (18). Briefly, 100 mL plasmawas mixed with 900 mL of an ice-cold methanol:water (90:10 vol:vol)
extraction mix that contained 10 internal standards. The plasma was
extracted in a bead mill for 2 min at 30 Hz, allowed to settle for 2 h at
TABLE 1 Macronutrient and energy content of the 3 testmeals1
Meal Fat, g Protein, g Carbohydrate, g Energy, kJ
Baked herring 29 33 47 2416
Pickled herring 29 29 81 2912
Baked beef 35 43 47 2822
1 Macronutrient composition data are based on analyzed values (17) for beef and fish, and
from the Swedish food composition database (http://www7.slv.se/SokNaringsinnehall) for
the composition of the accompanying potatoes and sour cream.
FIGURE 1 Flow of participants through
the study.
Metabolomic response to beef and herring 2457
by Alastair R
oss on Novem
ber 3, 2015jn.nutrition.org
Dow
nloaded from
4�C, and centrifuged at 15,0003 g for 10 min. A total of 200 mL of the
supernatant was transferred to chromatography vials and completely
evaporated under vacuum. Samples were then derivatized with the use ofmethoxymation and N-methyl-N-trimethylsilyltrifluoroacetamide + 1%
trimethylchlorosilane before injection on a Leco Pegasus III gas
chromatograph coupled to a time-of-flight mass spectrometer (Leco).The 3 protein sources fed to the subjects in the trial were analyzed
with the use of a procedure similar to that used for the plasma with some
slight modifications. Approximately 150 mg frozen fish or beef was
weighed into a microcentrifuge tube, and 900 mL extraction mix (asabove) and 200 mL chloroform were added. Metal beads were added to
the tubes and the samples extracted in a bead mill for 5 min at 30 Hz. All
other procedures were the same as for the plasma samples.
Data analysis. Gas chromatography–mass spectrometry data were
exported from ChromaTOF software and all data processing was carried
out with the use of MATLAB scripts. Peaks were aligned based on the
internal standards and peak deconvolution and picking were performedwith the use of 2 different scripts, ‘‘targeted’’ and ‘‘untargeted,’’ the first
identifying peaks from an in-house library (SwedishMetabolomics Centre)
based on matching retention index and mass spectra, and the second withthe use of hierarchical multivariate curve resolution (19) to deconvolute all
peaks within the chromatogram. Peak areas were normalized to the
internal standard responses (a-ketoglutarate, glutamic acid, myristic acid,
salicylic acid, and succinic acid) with the use of principal componentanalysis (PCA) before statistical analyses (17). Initial data analysis by PCA
found 3 clear outliers, which were the result of bad chromatography (poor
overall peak shape, including internal standards). Data from these samples
were removed from the dataset and replaced by the mean of the 2 adjacenttime points during further data analysis.
Food data were handled in the same manner as plasma samples,
except that food data were further corrected for sample weight.Data from both the targeted and untargeted peak picking were analyzed
with the use of a mixed model to determine differences in overall plasma
response between 0 and 7 h. Meal type and time were included as fixed
factors, withmeal typemodeled for unequal variances. Data were manuallycorrected for baseline (T1.7h – T0) before analysis. Peaks from the
untargeted analysis in which diet-related differences were identified (P <
0.05) were further investigated for identificationwith the use of internal and
National Institute of Standards and Technology mass spectral libraries.Differences from diet at 7 h postmeal were tested with the use of the
General Linear Model, with subject included as a covariate. Tukey�s posthoc test was used to determine differences between groups. Data werenot corrected for baseline values in order to simulate a nonrepeated
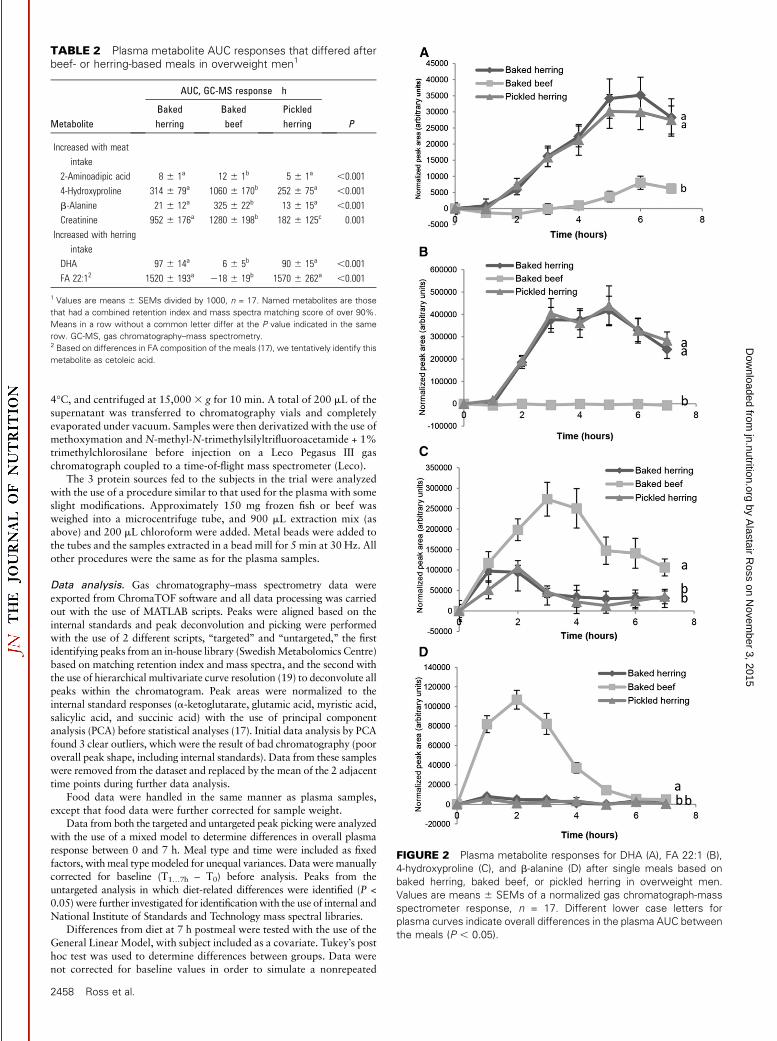
TABLE 2 Plasma metabolite AUC responses that differed afterbeef- or herring-based meals in overweight men1
Metabolite
AUC, GC-MS response � hBakedherring
Bakedbeef
Pickledherring P
Increased with meat
intake
2-Aminoadipic acid 8 6 1a 12 6 1b 5 6 1a ,0.001
4-Hydroxyproline 314 6 79a 1060 6 170b 252 6 75a ,0.001
b-Alanine 21 6 12a 325 6 22b 13 6 15a ,0.001
Creatinine 952 6 176a 1280 6 198b 182 6 125c 0.001
Increased with herring
intake
DHA 97 6 14a 6 6 5b 90 6 15a ,0.001
FA 22:12 1520 6 193a 218 6 19b 1570 6 262a ,0.001
1 Values are means 6 SEMs divided by 1000, n = 17. Named metabolites are those
that had a combined retention index and mass spectra matching score of over 90%.
Means in a row without a common letter differ at the P value indicated in the same
row. GC-MS, gas chromatography–mass spectrometry.2 Based on differences in FA composition of the meals (17), we tentatively identify this
metabolite as cetoleic acid.
FIGURE 2 Plasma metabolite responses for DHA (A), FA 22:1 (B),
4-hydroxyproline (C), and b-alanine (D) after single meals based on
baked herring, baked beef, or pickled herring in overweight men.
Values are means 6 SEMs of a normalized gas chromatograph-mass
spectrometer response, n = 17. Different lower case letters for
plasma curves indicate overall differences in the plasma AUC between
the meals (P , 0.05).
2458 Ross et al.
by Alastair R
oss on Novem
ber 3, 2015jn.nutrition.org
Dow
nloaded from
measures situation that would likely be encountered when using bio-markers to determine dietary intake.
NCSS for Windows 9.0.5 was used for all mixed-model and
univariate data analyses. Uncorrected P values < 0.05 are reported asof interest in line with the exploratory nature of this work. Biologically
meaningful differences of P < 0.1 are also reported.
Differences in plasma response between the meals were investi-
gated with PCA and orthogonal partial least squares discriminantanalysis (OPLS-DA) (20) with the use of SIMCA software (Umetrics).
After normalization based on internal standard response, data were
centered per person by subtracting the average area of all time points
for one subject from each time point for that subject, and data weresubjected to unit variance scaling and mean centering. The plasma
responses to the baked herring meal were compared with the pickled
herring and baked ground beef, respectively, in 2 separate OPLS-DAanalyses, and in both cases the difference between the meals was
explained by the first predictive component. The OPLS-DA models
were made from all time points in the dataset, i.e., 0–7 h, as well as for
only time points 2 and 3 h, or 6 and 7 h. Crossvalidation wasperformed by leaving out all samples from one subject for each
crossvalidation test. Crossvalidation was used to estimate model
complexity (number of OPLS-DA loadings) and loadings CIs through
jackknifing. Model validation was based on crossvalidation scoresand permutations tests with 500 permutations and the same number
of components as the models to be tested.
Discriminating variables detected with the use of OPLS-DA werefurther analyzed for differences between diets with the use of t tests,with Benjamini-Hochberg–corrected P values used to determine
significance.
Foodomics data analysis. As single samples of each food were
analyzed, a factor of 625% was added to each value to account for
possible variation based on both differences in the raw materials andanalytical variation. Data after normalization based on sample weight
and internal standard response was then analyzed with the use of OPLS-
DA to find those variables that varied the most between the different
protein sources.
Selection of metabolites of interest. The results from the multivariate
data analysis by OPLS-DA, the mixed-model analysis, and the t test werecompared, and metabolites that were significant in at least one of the
OPLS-DA models and one of the mixed-model or t tests were considered
to be likely discriminatory biomarkers related to one or more of the diets.
Results
Clinical trial. Plasma TG, total, LDL, and HDL cholesterol, andserum insulin results have been previously reported for this study(17). Of the 20 subjects that started the study, 17 completed it,
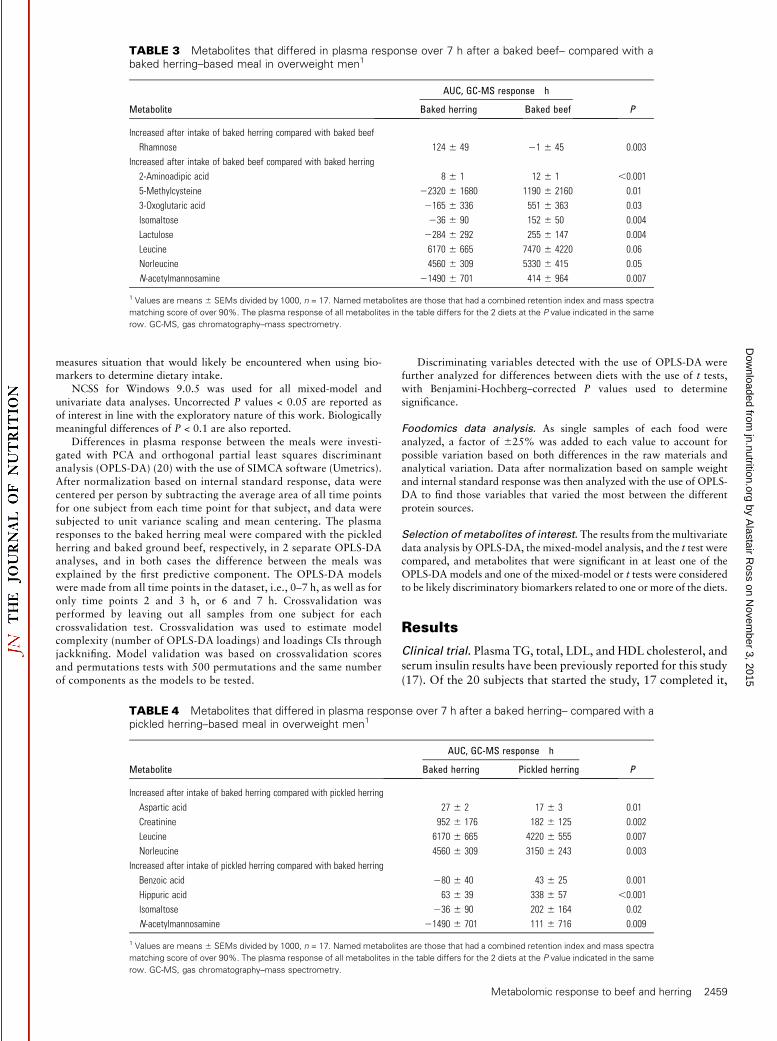
TABLE 3 Metabolites that differed in plasma response over 7 h after a baked beef– compared with abaked herring–based meal in overweight men1
Metabolite
AUC, GC-MS response � hBaked herring Baked beef P
Increased after intake of baked herring compared with baked beef
Rhamnose 124 6 49 21 6 45 0.003
Increased after intake of baked beef compared with baked herring
2-Aminoadipic acid 8 6 1 12 6 1 ,0.001
5-Methylcysteine 22320 6 1680 1190 6 2160 0.01
3-Oxoglutaric acid 2165 6 336 551 6 363 0.03
Isomaltose 236 6 90 152 6 50 0.004
Lactulose 2284 6 292 255 6 147 0.004
Leucine 6170 6 665 7470 6 4220 0.06
Norleucine 4560 6 309 5330 6 415 0.05
N-acetylmannosamine 21490 6 701 414 6 964 0.007
1 Values are means 6 SEMs divided by 1000, n = 17. Named metabolites are those that had a combined retention index and mass spectra
matching score of over 90%. The plasma response of all metabolites in the table differs for the 2 diets at the P value indicated in the same
row. GC-MS, gas chromatography–mass spectrometry.
TABLE 4 Metabolites that differed in plasma response over 7 h after a baked herring– compared with apickled herring–based meal in overweight men1
Metabolite
AUC, GC-MS response � hBaked herring Pickled herring P
Increased after intake of baked herring compared with pickled herring
Aspartic acid 27 6 2 17 6 3 0.01
Creatinine 952 6 176 182 6 125 0.002
Leucine 6170 6 665 4220 6 555 0.007
Norleucine 4560 6 309 3150 6 243 0.003
Increased after intake of pickled herring compared with baked herring
Benzoic acid 280 6 40 43 6 25 0.001
Hippuric acid 63 6 39 338 6 57 ,0.001
Isomaltose 236 6 90 202 6 164 0.02
N-acetylmannosamine 21490 6 701 111 6 716 0.009
1 Values are means 6 SEMs divided by 1000, n = 17. Named metabolites are those that had a combined retention index and mass spectra
matching score of over 90%. The plasma response of all metabolites in the table differs for the 2 diets at the P value indicated in the same
row. GC-MS, gas chromatography–mass spectrometry.
Metabolomic response to beef and herring 2459
by Alastair R
oss on Novem
ber 3, 2015jn.nutrition.org
Dow
nloaded from
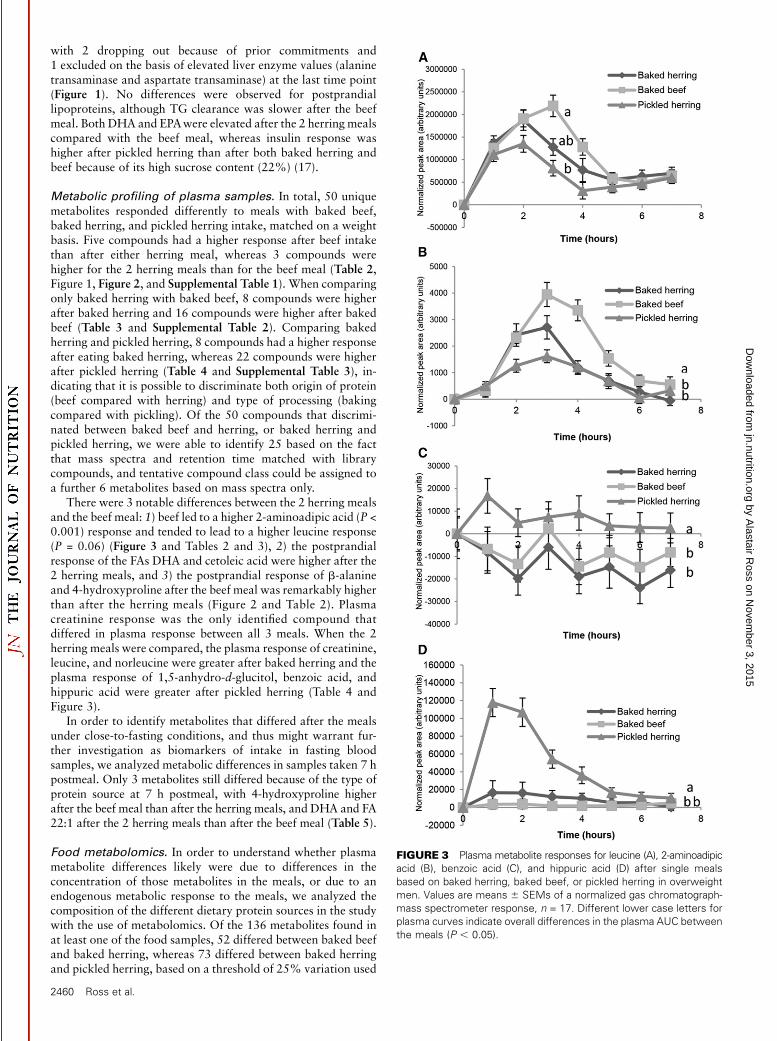
with 2 dropping out because of prior commitments and1 excluded on the basis of elevated liver enzyme values (alaninetransaminase and aspartate transaminase) at the last time point(Figure 1). No differences were observed for postprandiallipoproteins, although TG clearance was slower after the beefmeal. Both DHA and EPAwere elevated after the 2 herring mealscompared with the beef meal, whereas insulin response washigher after pickled herring than after both baked herring andbeef because of its high sucrose content (22%) (17).
Metabolic profiling of plasma samples. In total, 50 uniquemetabolites responded differently to meals with baked beef,baked herring, and pickled herring intake, matched on a weightbasis. Five compounds had a higher response after beef intakethan after either herring meal, whereas 3 compounds werehigher for the 2 herring meals than for the beef meal (Table 2,Figure 1, Figure 2, and Supplemental Table 1). When comparingonly baked herring with baked beef, 8 compounds were higherafter baked herring and 16 compounds were higher after bakedbeef (Table 3 and Supplemental Table 2). Comparing bakedherring and pickled herring, 8 compounds had a higher responseafter eating baked herring, whereas 22 compounds were higherafter pickled herring (Table 4 and Supplemental Table 3), in-dicating that it is possible to discriminate both origin of protein(beef compared with herring) and type of processing (bakingcompared with pickling). Of the 50 compounds that discrimi-nated between baked beef and herring, or baked herring andpickled herring, we were able to identify 25 based on the factthat mass spectra and retention time matched with librarycompounds, and tentative compound class could be assigned toa further 6 metabolites based on mass spectra only.
There were 3 notable differences between the 2 herring mealsand the beef meal: 1) beef led to a higher 2-aminoadipic acid (P <0.001) response and tended to lead to a higher leucine response(P = 0.06) (Figure 3 and Tables 2 and 3), 2) the postprandialresponse of the FAs DHA and cetoleic acid were higher after the2 herring meals, and 3) the postprandial response of b-alanineand 4-hydroxyproline after the beef meal was remarkably higherthan after the herring meals (Figure 2 and Table 2). Plasmacreatinine response was the only identified compound thatdiffered in plasma response between all 3 meals. When the 2herring meals were compared, the plasma response of creatinine,leucine, and norleucine were greater after baked herring and theplasma response of 1,5-anhydro-d-glucitol, benzoic acid, andhippuric acid were greater after pickled herring (Table 4 andFigure 3).
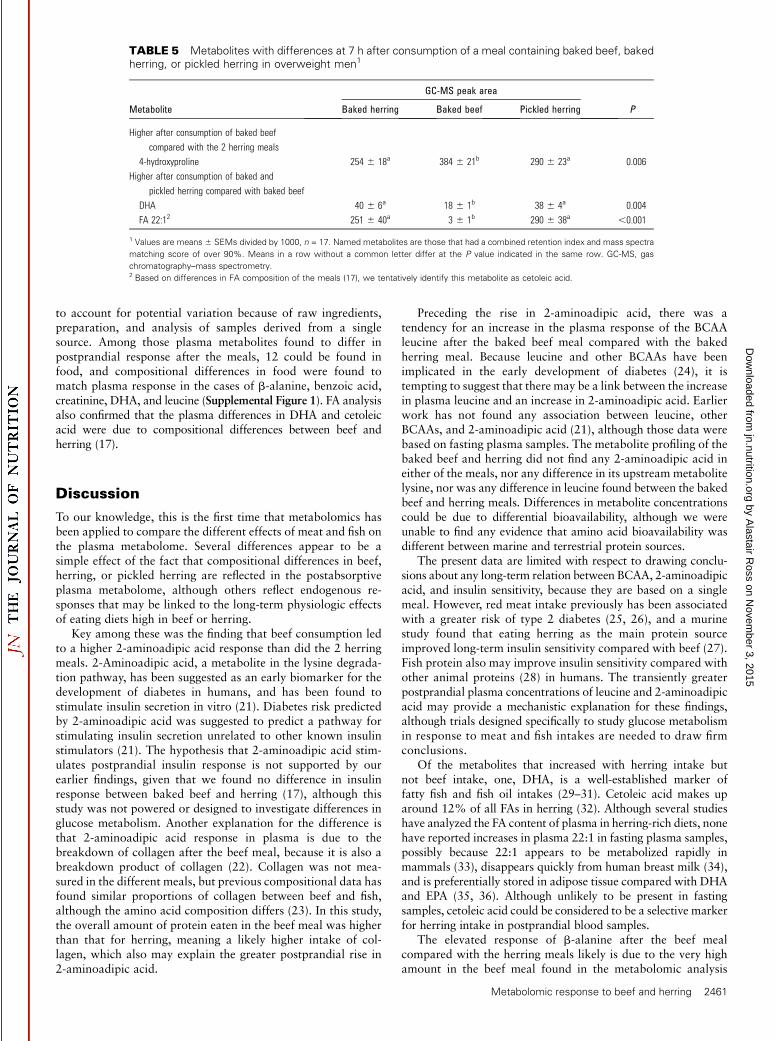
In order to identify metabolites that differed after the mealsunder close-to-fasting conditions, and thus might warrant fur-ther investigation as biomarkers of intake in fasting bloodsamples, we analyzed metabolic differences in samples taken 7 hpostmeal. Only 3 metabolites still differed because of the type ofprotein source at 7 h postmeal, with 4-hydroxyproline higherafter the beef meal than after the herring meals, and DHA and FA22:1 after the 2 herring meals than after the beef meal (Table 5).
Food metabolomics. In order to understand whether plasmametabolite differences likely were due to differences in theconcentration of those metabolites in the meals, or due to anendogenous metabolic response to the meals, we analyzed thecomposition of the different dietary protein sources in the studywith the use of metabolomics. Of the 136 metabolites found inat least one of the food samples, 52 differed between baked beefand baked herring, whereas 73 differed between baked herringand pickled herring, based on a threshold of 25% variation used
FIGURE 3 Plasma metabolite responses for leucine (A), 2-aminoadipic
acid (B), benzoic acid (C), and hippuric acid (D) after single meals
based on baked herring, baked beef, or pickled herring in overweight
men. Values are means 6 SEMs of a normalized gas chromatograph-
mass spectrometer response, n = 17. Different lower case letters for
plasma curves indicate overall differences in the plasma AUC between
the meals (P , 0.05).
2460 Ross et al.
by Alastair R
oss on Novem
ber 3, 2015jn.nutrition.org
Dow
nloaded from
to account for potential variation because of raw ingredients,preparation, and analysis of samples derived from a singlesource. Among those plasma metabolites found to differ inpostprandial response after the meals, 12 could be found infood, and compositional differences in food were found tomatch plasma response in the cases of b-alanine, benzoic acid,creatinine, DHA, and leucine (Supplemental Figure 1). FA analysisalso confirmed that the plasma differences in DHA and cetoleicacid were due to compositional differences between beef andherring (17).
Discussion
To our knowledge, this is the first time that metabolomics hasbeen applied to compare the different effects of meat and fish onthe plasma metabolome. Several differences appear to be asimple effect of the fact that compositional differences in beef,herring, or pickled herring are reflected in the postabsorptiveplasma metabolome, although others reflect endogenous re-sponses that may be linked to the long-term physiologic effectsof eating diets high in beef or herring.
Key among these was the finding that beef consumption ledto a higher 2-aminoadipic acid response than did the 2 herringmeals. 2-Aminoadipic acid, a metabolite in the lysine degrada-tion pathway, has been suggested as an early biomarker for thedevelopment of diabetes in humans, and has been found tostimulate insulin secretion in vitro (21). Diabetes risk predictedby 2-aminoadipic acid was suggested to predict a pathway forstimulating insulin secretion unrelated to other known insulinstimulators (21). The hypothesis that 2-aminoadipic acid stim-ulates postprandial insulin response is not supported by ourearlier findings, given that we found no difference in insulinresponse between baked beef and herring (17), although thisstudy was not powered or designed to investigate differences inglucose metabolism. Another explanation for the difference isthat 2-aminoadipic acid response in plasma is due to thebreakdown of collagen after the beef meal, because it is also abreakdown product of collagen (22). Collagen was not mea-sured in the different meals, but previous compositional data hasfound similar proportions of collagen between beef and fish,although the amino acid composition differs (23). In this study,the overall amount of protein eaten in the beef meal was higherthan that for herring, meaning a likely higher intake of col-lagen, which also may explain the greater postprandial rise in2-aminoadipic acid.
Preceding the rise in 2-aminoadipic acid, there was atendency for an increase in the plasma response of the BCAAleucine after the baked beef meal compared with the bakedherring meal. Because leucine and other BCAAs have beenimplicated in the early development of diabetes (24), it istempting to suggest that there may be a link between the increasein plasma leucine and an increase in 2-aminoadipic acid. Earlierwork has not found any association between leucine, otherBCAAs, and 2-aminoadipic acid (21), although those data werebased on fasting plasma samples. The metabolite profiling of thebaked beef and herring did not find any 2-aminoadipic acid ineither of the meals, nor any difference in its upstream metabolitelysine, nor was any difference in leucine found between the bakedbeef and herring meals. Differences in metabolite concentrationscould be due to differential bioavailability, although we wereunable to find any evidence that amino acid bioavailability wasdifferent between marine and terrestrial protein sources.
The present data are limited with respect to drawing conclu-sions about any long-term relation between BCAA, 2-aminoadipicacid, and insulin sensitivity, because they are based on a singlemeal. However, red meat intake previously has been associatedwith a greater risk of type 2 diabetes (25, 26), and a murinestudy found that eating herring as the main protein sourceimproved long-term insulin sensitivity compared with beef (27).Fish protein also may improve insulin sensitivity compared withother animal proteins (28) in humans. The transiently greaterpostprandial plasma concentrations of leucine and 2-aminoadipicacid may provide a mechanistic explanation for these findings,although trials designed specifically to study glucose metabolismin response to meat and fish intakes are needed to draw firmconclusions.
Of the metabolites that increased with herring intake butnot beef intake, one, DHA, is a well-established marker offatty fish and fish oil intakes (29–31). Cetoleic acid makes uparound 12% of all FAs in herring (32). Although several studieshave analyzed the FA content of plasma in herring-rich diets, nonehave reported increases in plasma 22:1 in fasting plasma samples,possibly because 22:1 appears to be metabolized rapidly inmammals (33), disappears quickly from human breast milk (34),and is preferentially stored in adipose tissue compared with DHAand EPA (35, 36). Although unlikely to be present in fastingsamples, cetoleic acid could be considered to be a selective markerfor herring intake in postprandial blood samples.
The elevated response of b-alanine after the beef mealcompared with the herring meals likely is due to the very highamount in the beef meal found in the metabolomic analysis
TABLE 5 Metabolites with differences at 7 h after consumption of a meal containing baked beef, bakedherring, or pickled herring in overweight men1
Metabolite
GC-MS peak area
Baked herring Baked beef Pickled herring P
Higher after consumption of baked beef
compared with the 2 herring meals
4-hydroxyproline 254 6 18a 384 6 21b 290 6 23a 0.006
Higher after consumption of baked and
pickled herring compared with baked beef
DHA 40 6 6a 18 6 1b 38 6 4a 0.004
FA 22:12 251 6 40a 3 6 1b 290 6 38a ,0.001
1 Values are means 6 SEMs divided by 1000, n = 17. Named metabolites are those that had a combined retention index and mass spectra
matching score of over 90%. Means in a row without a common letter differ at the P value indicated in the same row. GC-MS, gas
chromatography–mass spectrometry.2 Based on differences in FA composition of the meals (17), we tentatively identify this metabolite as cetoleic acid.
Metabolomic response to beef and herring 2461
by Alastair R
oss on Novem
ber 3, 2015jn.nutrition.org
Dow
nloaded from
of the different protein sources studied. Similar to b-alanine,the plasma response of 4-hydroxyproline was much higherfor beef than for herring. However, in this case, the amountof free-4-hydroxyproline in the baked beef and herring mealswas not markedly different. Pickled herring was low in free-hydroxyproline compared with both baked beef and herring,although the plasma response of 4-hydroxyproline to bothherring meals was similar. Plasma 4-hydroxyproline concentra-tions were still different between the beef and fish meals at 7 hpostmeal, suggesting that 4-hydroxyproline could have thepotential to be a marker of beef intake in fasting plasma samples.Plasma 4-hydroxyproline is also proposed as a marker of col-lagen turnover in tissue, being elevated in elderly and bedriddensubjects (37), so high intake of beef should be considered to be aconfounding factor when using 4-hydroxyproline as a marker ofcollagen turnover. Although several potential biomarkers formeat and fish intakes have been found in urine (38), there is alack of validated plasma biomarkers for meat and fish intakebeyond n–3 FAs for fish.
The secondary aim of this work was to find out whether acommon method of processing herring—pickling—had anydifferential effect on metabolic response compared with bakedherring. The pickling process includes the soaking of herringfillets in brine, vinegar, sugar, and benzoic acid, so it is unsur-prising that benzoic acid appears in plasma after the intakeof pickled herring, but not after eating baked herring. This is alsothe likely explanation for the high hippuric acid response.Hippuric acid is commonly found in nutritional metabolomicsstudies and is ascribed to various sources, including microbialfermentation of phenolic compounds and breakdown of aro-matic amino acids (39). The rapid rise in hippuric acid likely isdue to conjugation of benzoic acid and glycine for the rapidremoval of benzoic acid from circulation.
In this work, we were able to identify several metabolites thatdiffered in their postprandial plasma response between the differentdiets, but which would have been unlikely to differ had we onlystudied fasting plasma samples. This strength of measuring meta-bolomics in postprandial samples has been proposed before (16),but not regularly reported in the nutritional metabolomics literature.Similarly, metabolic profiling of food samples as a complementto plasma profiling helped to explain whether differences observedin plasma likely were due to the composition of the food or aninteraction between the food and endogenous metabolism. Theapproach usedwas simple, and could be improved in futurework bypredigesting food samples in a gastrointestinal model (40) to betterreflect the food metabolome after digestion and what would beavailable for uptake in the intestine.
In conclusion, these data suggest that 4-hydroxyproline andb-alanine may serve as biomarkers of beef intake, and confirm thatDHA is a biomarker of fatty fish intake, likely along with cetoleicacid in nonfasting plasma samples. Further studies are needed toconfirm whether 4-hydroxyproline and b-alanine could act asbiomarkers of beef intake, given the lack of plasma biomarkersavailable. Our results also suggest that eating beef rather than fishmay increase concentrations of 2-aminoadipic acid and leucine,both stimulators of insulin secretion. Although wewere not able toconfirm this effect based on postprandial insulin concentrations(17), the previous associations between red meat intake anddiabetes warrant that the effects of chronic beef intake onnonglucose-stimulated insulin secretion be further investigated.
AcknowledgmentsWe thank Inga-Britt Carlsson for assistance with sampleanalysis, Jonas Gullberg and Thomas Moritz for help with
and access to the Swedish Metabolomics Centre, and HansStenlund for providing and updating the Matlab scripts used inthis study. A-SS planned and initiated the study; IU and A-SSdesigned the study and meals; ABR and CS conducted thelaboratory work; ABR, CS, and RP contributed to the dataanalysis; and ABR wrote the manuscript. All authors read andapproved the final manuscript.
References
1. United States Department of Agriculture. Dietary guidelines forAmericans 2010 [Internet]. [cited 2014 Oct 22.] Available from:http://health.gov/dietaryguidelines/dga2010/dietaryguidelines2010.pdf.
2. Song J, Su H, Wang BL, Zhou YY, Guo LL. Fish consumption and lungcancer risk: systematic review and meta-analysis. Nutr Cancer2014;66:539–49.
3. Norat T, Bingham S, Ferrari P, Slimani N, Jenab M, Mazuir M, OvervadK, Olsen A, Tjonneland A, Clavel F, et al. Meat, fish, and colorectalcancer risk: the European Prospective Investigation into Cancer andNutrition. J Natl Cancer Inst 2005;97:906–16.
4. Yang H, Xun P, He K. Fish and fish oil intake in relation to risk of asthma:a systematic review and meta-analysis. PLoS One 2013;8:e80048.
5. Hesselmar B, Saalman R, Rudin A, Adlerberth I, Wold A. Early fishintroduction is associated with less eczema, but not sensitization, ininfants. Acta paediatr 2010;99:1861–7.
6. Chan DS, Lau R, Aune D, Vieira R, Greenwood DC, Kampman E,Norat T. Red and processed meat and colorectal cancer incidence: meta-analysis of prospective studies. PLoS One 2011;6:e20456.
7. Bastide NM, Pierre FHF, Corpet DE. Heme iron from meat and risk ofcolorectal cancer: A meta-analysis and a review of the mechanismsinvolved. Cancer Prev Res (Phila) 2011;4:177–84.
8. Pan A, Sun Q, Bernstein AM, Schulze MB, Manson JE, Stampfer MJ,Willett WC, Hu FB. Red meat consumption and mortality: Results from2 prospective cohort studies. Arch Intern Med 2012;172:555–63.
9. Koeth RA, Wang Z, Levison BS, Buffa JA, Org E, Sheehy BT, Britt EB,Fu X, Wu Y, Li L, et al. Intestinal microbiota metabolism of l–carnitine,a nutrient in red meat, promotes atherosclerosis. Nat Med 2013;19:576–85.
10. Lindqvist H, Langkilde AM, Undeland I, Radendal T, Sandberg AS.Herring (Clupea harengus) supplemented diet influences risk factors forCVD in overweight subjects. Eur J Clin Nutr 2007;61:1106–13.
11. Lindqvist HM, Langkilde AM, Undeland I, Sandberg AS. Herring(Clupea harengus) intake influences lipoproteins but not inflammatoryand oxidation markers in overweight men. Br J Nutr 2009;101:383–90.
12. Erkkila AT, Schwab US, de Mello VD, Lappalainen T, Mussalo H,Lehto S, Kemi V, Lamberg-Allardt C, Uusitupa MI. Effects of fatty andlean fish intake on blood pressure in subjects with coronary heartdisease using multiple medications. Eur J Nutr 2008;47:319–28.
13. Navas-Carretero S, Perez-Granados AM, Schoppen S, Vaquero MP. Anoily fish diet increases insulin sensitivity compared to a red meat diet inyoung iron-deficient women. Br J Nutr 2009;102:546–53.
14. Nookaew I, Gabrielsson BG, Holmang A, Sandberg AS, Nielsen J.Identifying molecular effects of diet through systems biology: influenceof herring diet on sterol metabolism and protein turnover in mice. PLoSOne 2010;5:e12361.
15. Jones DP, Park Y, Ziegler TR. Nutritional metabolomics: Progress inaddressing complexity in diet and health. Ann Rev Nutr 2012;32:183–202.
16. van Ommen B, Keijer J, Heil SG, Kaput J. Challenging homeostasis todefine biomarkers for nutrition related health. Mol Nutr Food Res2009;53:795–804.
17. Svelander C, Gabrielsson BG, Almgren A, Gottfries J, Olsson J, UndelandI, Sandberg AS. Postprandial lipid and insulin responses among healthy,overweight men to mixed meals served with baked herring, pickledherring or baked, minced beef. Eur J Nutr 2015;54:945–58.
18. A J, Trygg J, Gullberg J, Johansson AI, Jonsson P, Antti H, MarklundSL, Moritz T. Extraction and GC/MS analysis of the human bloodplasma metabolome. Anal Chem 2005;77:8086–94.
19. Jonsson P, Johansson AI, Gullberg J, Trygg JAJ, Grung B, Marklund S,Sjostrom M, Antti H, Moritz T. High-throughput data analysis fordetecting and identifying differences between samples in GC/MS-basedmetabolomic analyses. Anal Chem 2005;77:5635–42.
2462 Ross et al.
by Alastair R
oss on Novem
ber 3, 2015jn.nutrition.org
Dow
nloaded from
20. Bylesjo M, Rantalainen M, Cloarec O, Nicholson JK, Holmes E, TryggJ. OPLS discriminant analysis: combining the strengths of PLS-DA andSIMCA classification. J Chem 2006;20:341–51.
21. Wang TJ, Ngo D, Psychogios N, Dejam A, Larson MG, Vasan RS,Ghorbani A, O�Sullivan J, Cheng S, Rhee EP, et al. 2-Aminoadipic acidis a biomarker for diabetes risk. J Clin Invest 2013;123:4309–17.
22. Sell DR, Strauch CM, Shen W, Monnier VM. Aging, diabetes, and renalfailure catalyze the oxidation of lysyl residues to 2-aminoadipic acid inhuman skin collagen: evidence for metal-catalyzed oxidation mediatedby alpha-dicarbonyls. Ann N Y Acad Sci 2008;1126:205–9.
23. Yamada S, Yamamoto K, Ikeda T, Yanagiguchi K, Hayashi Y. Potencyof fish collagen as a scaffold for regenerative medicine. BioMed Res Int2014;2014:302932.
24. Newgard CB. Interplay between lipids and branched-chain amino acidsin development of insulin resistance. Cell Metab 2012;15:606–14.
25. Schulze MB, Manson JE, Willett WC, Hu FB. Processed meat intakeand incidence of Type 2 diabetes in younger and middle-aged women.Diabetologia 2003;46:1465–73.
26. Aune D, Ursin G, Veierod MB. Meat consumption and the risk of type 2diabetes: a systematic review and meta-analysis of cohort studies.Diabetologia 2009;52:2277–87.
27. Hussain A, Nookaew I, Khoomrung S, Andersson L, Larsson I, Hulthen L,Jansson N, Jakubowicz R, Nilsson S, Sandberg AS, et al. A maternal diet offatty fish reduces body fat of offspring compared with a maternal diet ofbeef and a post-weaning diet of fish improves insulin sensitivity and lipidprofile in adult C57BL/6 male mice. Acta Physiol (Oxf) 2013;209:220–34.
28. Ouellet V, Marois J, Weisnagel SJ, Jacques H. Dietary cod proteinimproves insulin sensitivity in insulin-resistant men and women: arandomized controlled trial. Diabetes Care 2007;30:2816–21.
29. Brantsaeter AL, Haugen M, Thomassen Y, Ellingsen DG, Ydersbond TA,Hagve TA, Alexander J,Meltzer HM. Exploration of biomarkers for total fishintake in pregnant Norwegian women. Public Health Nutr 2010;13:54–62.
30. Chung H, Nettleton JA, Lemaitre RN, Barr RG, Tsai MY, Tracy RP,Siscovick DS. Frequency and type of seafood consumed influenceplasma (n-3) fatty acid concentrations. J Nutr 2008;138:2422–7.
31. Vandevijvere S, Geelen A, Gonzalez-Gross M, van’t Veer P, DallongevilleJ, Mouratidou T, Dekkers A, Bornhorst C, Breidenassel C, Crispim SP,et al. Evaluation of food and nutrient intake assessment using concen-tration biomarkers in European adolescents from the Healthy Lifestyle inEurope by Nutrition in Adolescence study. Br J Nutr 2013;109:736–47.
32. Aro TL, Larmo PS, Backman CH, Kallio HP, Tahvonen RL. Fatty acidsand fat-soluble vitamins in salted herring (Clupea harengus) products. JAgric Food Chem 2005;53:1482–8.
33. Cooper MH, Iverson SJ, Rouvinen-Watt K. Metabolism of dietarycetoleic acid (22:1n-11) in mink (Mustela vison) and gray seals(Halichoerus grypus) studied using radiolabeled fatty acids. PhysiolBiochem Zool 2006;79:820–9.
34. Francois CA, Connor SL, Wander RC, Connor WE. Acute effects ofdietary fatty acids on the fatty acids of human milk. Am J Clin Nutr1998;67:301–8.
35. Lindqvist H, Sandberg AS, Undeland I, Stener-Victorin E, Larsson BM,Sannaveerappa T, Lonn M, Holmang A. Influence of herring (Clupeaharengus) and herring fractions on metabolic status in rats fed a highenergy diet. Acta Physiol (Oxf) 2009;196:303–14.
36. Lin DS, Conner WE. Are the n-3 fatty acids from dietary fish oildeposited in the triglyceride stores of adipose tissue? Am J Clin Nutr1990;51:535–9.
37. Koike K, Li Y, Seo M, Sakurada I, Tezuka K, Uchikura K. Free4-hydroxyproline content in serum of bedridden aged people is elevateddue to fracture. Biol Pharm Bull 2000;23:101–3.
38. O�Gorman A, Gibbons H, Brennan L. Metabolomics in the identifica-tion of biomarkers of dietary intake. Comput Struct Biotechnol J2013;4:e201301004.
39. Lees HJ, Swann JR, Wilson ID, Nicholson JK, Holmes E. Hippurate:The natural history of a mammalian-microbial cometabolite. J ProteomeRes 2013;12:1527–46.
40. Minekus M, Alminger M, Alvito P, Ballance S, Bohn T, Bourlieu C,Carriere F, Boutrou R, Corredig M, Dupont D, et al. A standardisedstatic in vitro digestion method suitable for food - an internationalconsensus. Food Funct 2014;5:1113–24.
Metabolomic response to beef and herring 2463
by Alastair R
oss on Novem
ber 3, 2015jn.nutrition.org
Dow
nloaded from