heritage foods · pdf fileheritage foods ltd trinity of high growth, consistent dividend and...
TRANSCRIPT
Heritage Foods Ltd Trinity of High Growth, consistent dividend and attractive valuation
In
itia
tin
g C
ove
rag
e
Heritage Foods Ltd is an emerging national level Dairy Company with operations in 10 states spread across all the four corners of India. Heritage Brand is the second largest selling milk brand in states of Andhra Pradesh and Telangana.
Proxy play on high growth organized Dairy in India: Industry estimates suggest India’s Organized Dairy sector turnover should grow at CAGR of 19.5% between CY15 –CY20 to reach value of ₹2.4 Tn by CY20E.Heritage Foods Ltd, an emerging national level Dairy company in organized space offers good investment opportunity to benefit from high growth potential of organized dairy segment in India.
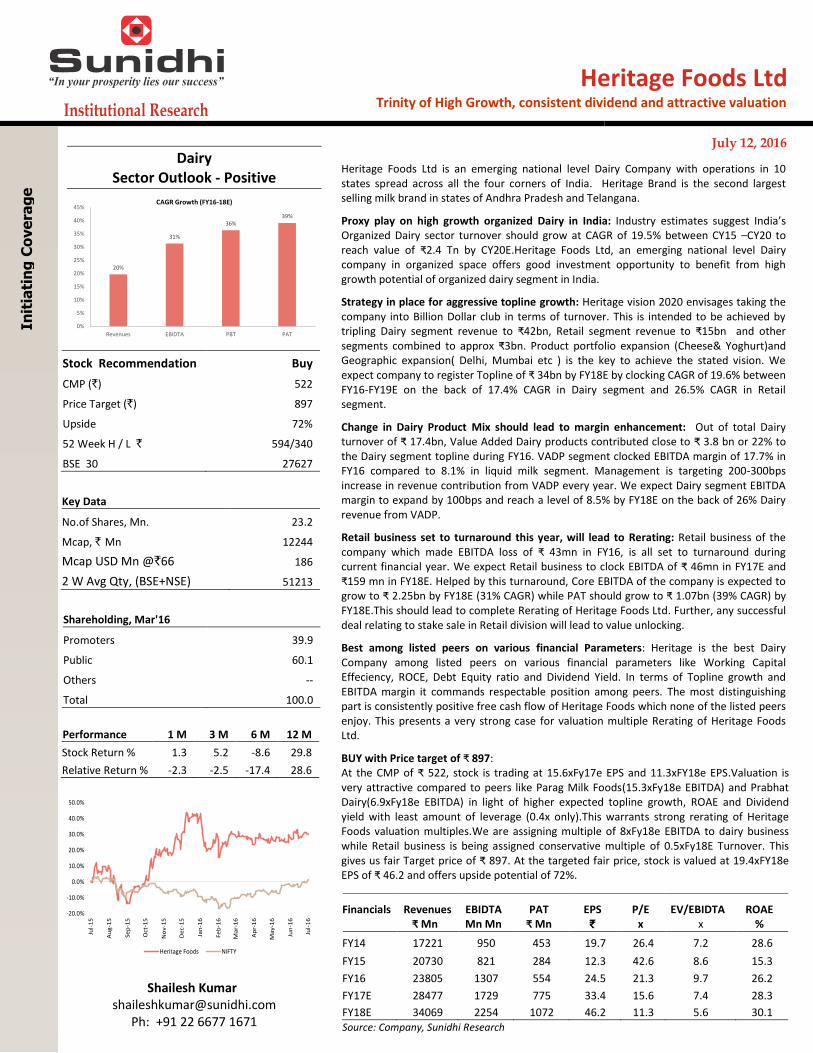
Strategy in place for aggressive topline growth: Heritage vision 2020 envisages taking the company into Billion Dollar club in terms of turnover. This is intended to be achieved by tripling Dairy segment revenue to ₹42bn, Retail segment revenue to ₹15bn and other segments combined to approx ₹3bn. Product portfolio expansion (Cheese& Yoghurt)and Geographic expansion( Delhi, Mumbai etc ) is the key to achieve the stated vision. We expect company to register Topline of ₹ 34bn by FY18E by clocking CAGR of 19.6% between FY16-FY19E on the back of 17.4% CAGR in Dairy segment and 26.5% CAGR in Retail segment.
Change in Dairy Product Mix should lead to margin enhancement: Out of total Dairy turnover of ₹ 17.4bn, Value Added Dairy products contributed close to ₹ 3.8 bn or 22% to the Dairy segment topline during FY16. VADP segment clocked EBITDA margin of 17.7% in FY16 compared to 8.1% in liquid milk segment. Management is targeting 200-300bps increase in revenue contribution from VADP every year. We expect Dairy segment EBITDA margin to expand by 100bps and reach a level of 8.5% by FY18E on the back of 26% Dairy revenue from VADP.
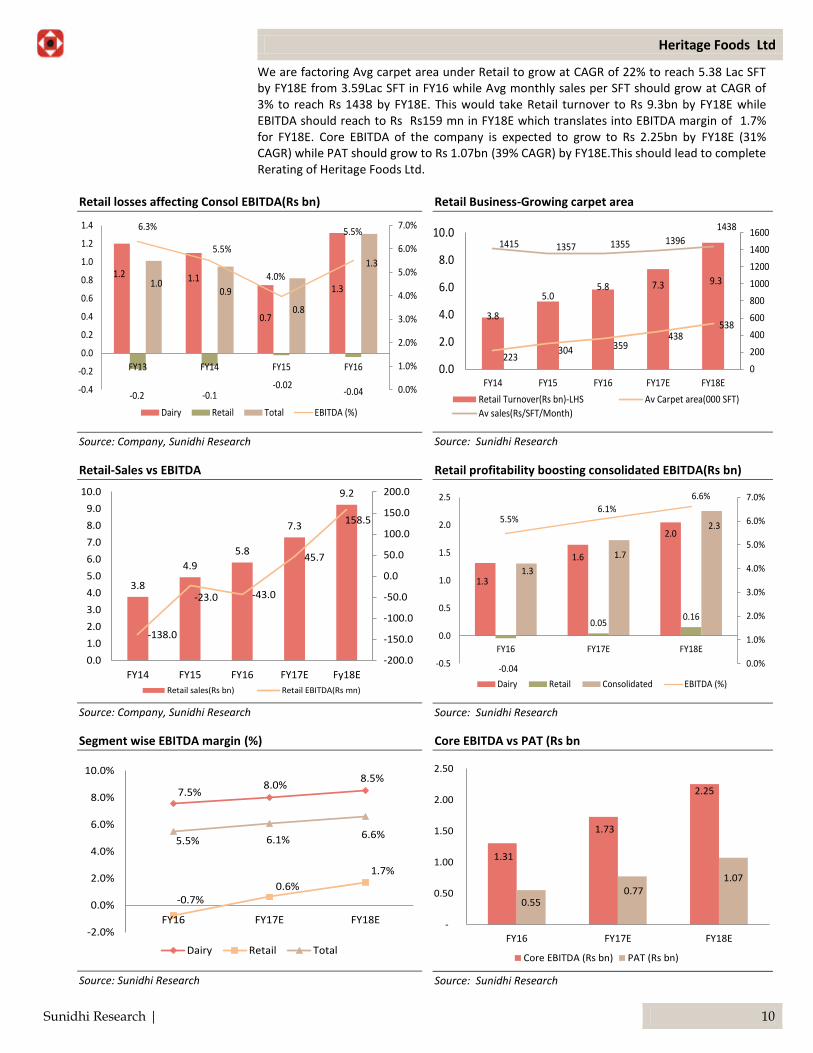
Retail business set to turnaround this year, will lead to Rerating: Retail business of the company which made EBITDA loss of ₹ 43mn in FY16, is all set to turnaround during current financial year. We expect Retail business to clock EBITDA of ₹ 46mn in FY17E and ₹159 mn in FY18E. Helped by this turnaround, Core EBITDA of the company is expected to grow to ₹ 2.25bn by FY18E (31% CAGR) while PAT should grow to ₹ 1.07bn (39% CAGR) by FY18E.This should lead to complete Rerating of Heritage Foods Ltd. Further, any successful deal relating to stake sale in Retail division will lead to value unlocking.
Best among listed peers on various financial Parameters: Heritage is the best Dairy Company among listed peers on various financial parameters like Working Capital Effeciency, ROCE, Debt Equity ratio and Dividend Yield. In terms of Topline growth and EBITDA margin it commands respectable position among peers. The most distinguishing part is consistently positive free cash flow of Heritage Foods which none of the listed peers enjoy. This presents a very strong case for valuation multiple Rerating of Heritage Foods Ltd.
BUY with Price target of ₹ 897: At the CMP of ₹ 522, stock is trading at 15.6xFy17e EPS and 11.3xFY18e EPS.Valuation is very attractive compared to peers like Parag Milk Foods(15.3xFy18e EBITDA) and Prabhat Dairy(6.9xFy18e EBITDA) in light of higher expected topline growth, ROAE and Dividend yield with least amount of leverage (0.4x only).This warrants strong rerating of Heritage Foods valuation multiples.We are assigning multiple of 8xFy18e EBITDA to dairy business while Retail business is being assigned conservative multiple of 0.5xFy18E Turnover. This gives us fair Target price of ₹ 897. At the targeted fair price, stock is valued at 19.4xFY18e EPS of ₹ 46.2 and offers upside potential of 72%.
Dairy Sector Outlook - Positive
20%
31%
36%39%
0%
5%
10%
15%
20%
25%
30%
35%
40%
45%
Revenues EBIDTA PBT PAT
CAGR Growth (FY16-18E)
Stock Recommendation Buy
CMP (`) 522
Price Target (`) 897
Upside 72%
52 Week H / L ` 594/340
BSE 30 27627
Key Data
No.of Shares, Mn. 23.2
Mcap, ` Mn 12244
Mcap USD Mn @`66 186
2 W Avg Qty, (BSE+NSE) 51213
Shareholding, Mar'16
Promoters 39.9
Public 60.1
Others --
Total 100.0
Performance 1 M 3 M 6 M 12 M
Stock Return % 1.3 5.2 -8.6 29.8
Relative Return % -2.3 -2.5 -17.4 28.6
-20.0%
-10.0%
0.0%
10.0%
20.0%
30.0%
40.0%
50.0%
Jul-
15
Au
g-1
5
Se
p-1
5
Oct
-15
No
v-1
5
De
c-1
5
Jan
-16
Fe
b-1
6
Ma
r-1
6
Ap
r-1
6
Ma
y-1
6
Jun
-16
Jul-
16
Heritage Foods NIFTY
Shailesh Kumar [email protected]
Ph: +91 22 6677 1671
July 12, 2016
Financials Revenues EBIDTA PAT EPS P/E EV/EBIDTA ROAE
₹ Mn Mn Mn ₹ Mn ₹ x x %
FY14 17221 950 453 19.7 26.4 7.2 28.6
FY15 20730 821 284 12.3 42.6 8.6 15.3
FY16 23805 1307 554 24.5 21.3 9.7 26.2
FY17E 28477 1729 775 33.4 15.6 7.4 28.3
FY18E 34069 2254 1072 46.2 11.3 5.6 30.1 Source: Company, Sunidhi Research
Heritage Foods Ltd
Sunidhi Research | 2
Table of Contents
1. Investment Summary …………………………………………………………………………………………………………1 2. Key Investment Rationale …………………………………………………………………………………………………………3 3. SWOT Analysis …………………………………………………………………………………………………………13 4. Sector View ………………………………………………………………………………………………………..14 5. Financial Performance Analysis …………………………………………………………………………………………………………18 6. Peer Comparison …………………………………………………………………………………………………………20 7. Valuation and Recommendation ………………………………………………………………………………………………….…....20 8. Risk to Call …………………………………………………………………………………………………………21 9. Company Background …………………………………………………………………………………………………………21 10. Business Model …………………………………………………………………………………………………………24 11. Management Profile …………………………………………………………………………………………………………25 12. Financials …………………………………………………………………………………………………………27 13. Annexure …………………………………………………………………………………………………………28 14. Disclaimer …………………………………………………………………………………………………………30
Heritage Foods Ltd
Sunidhi Research | 3
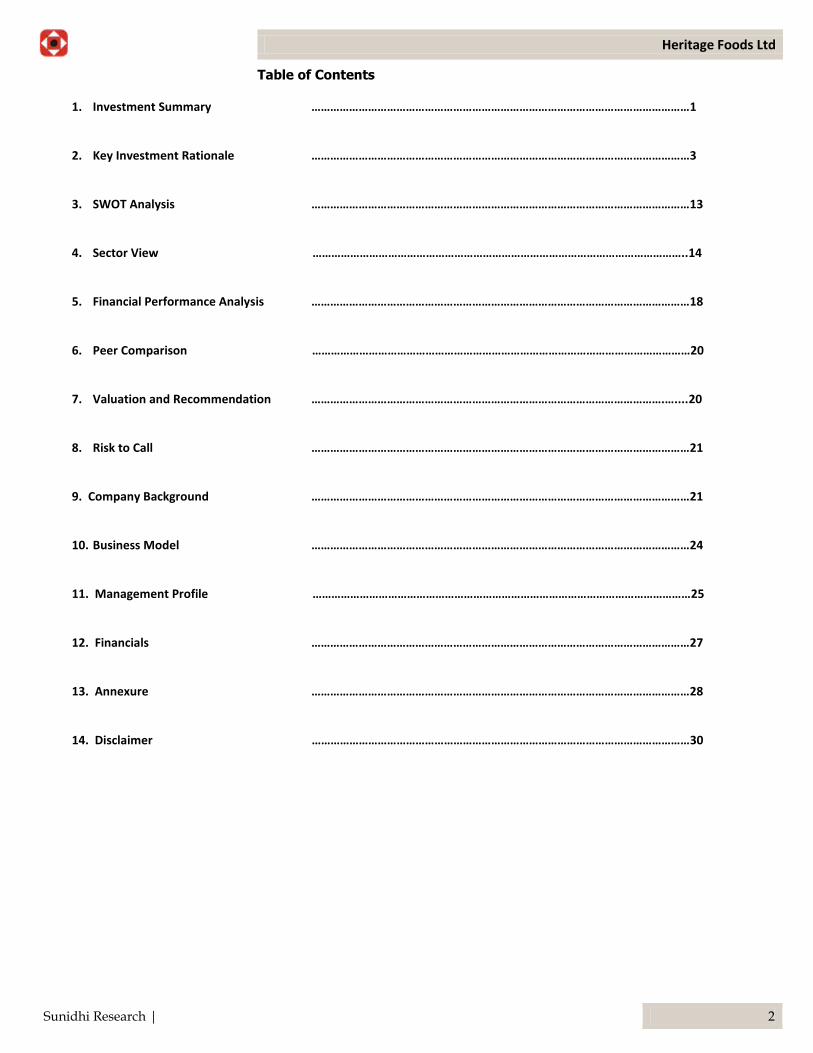
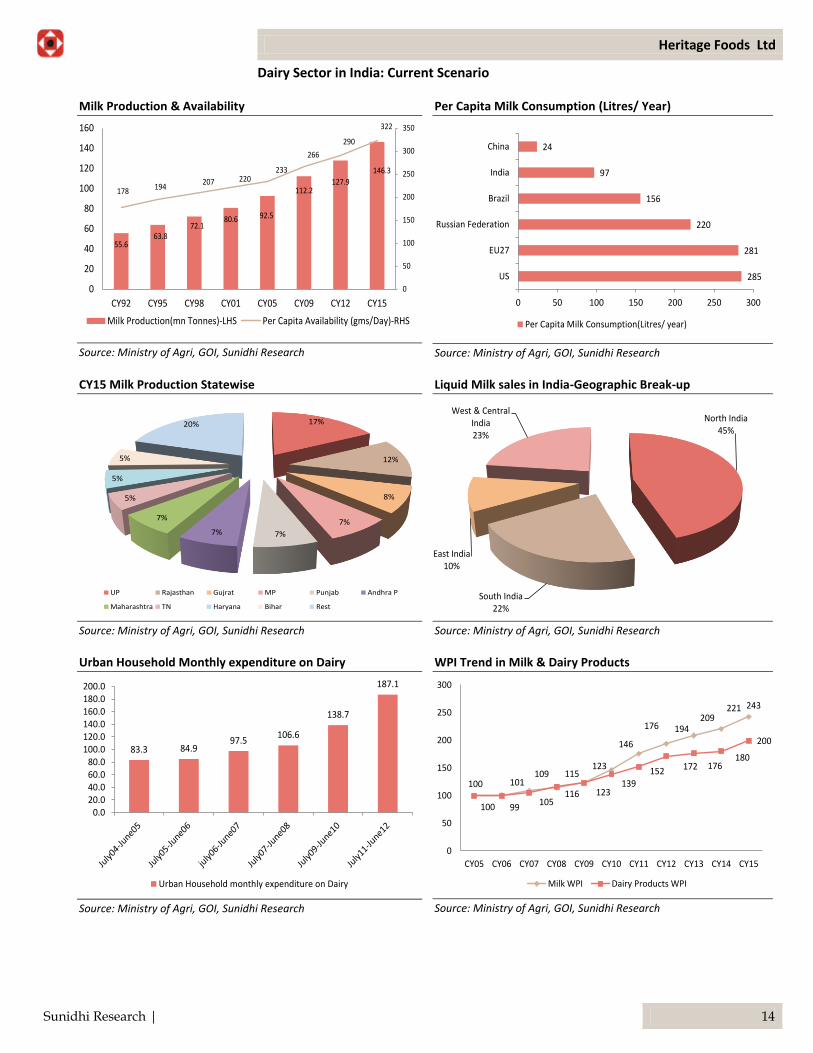
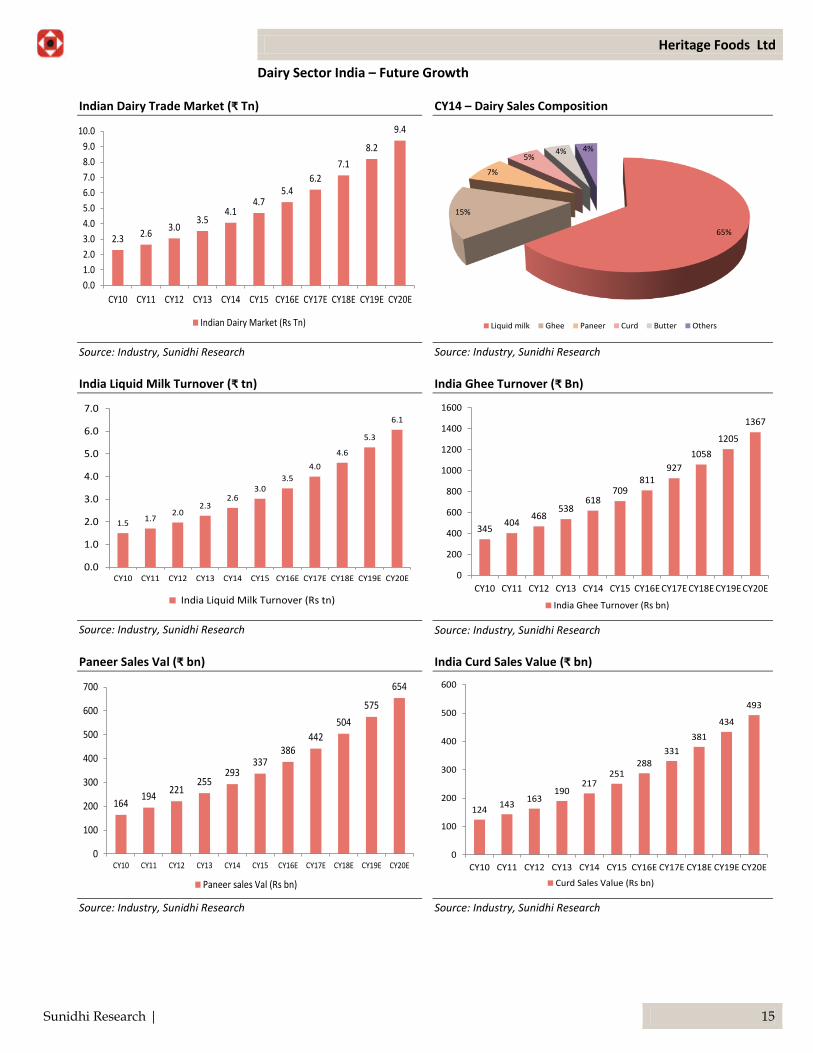
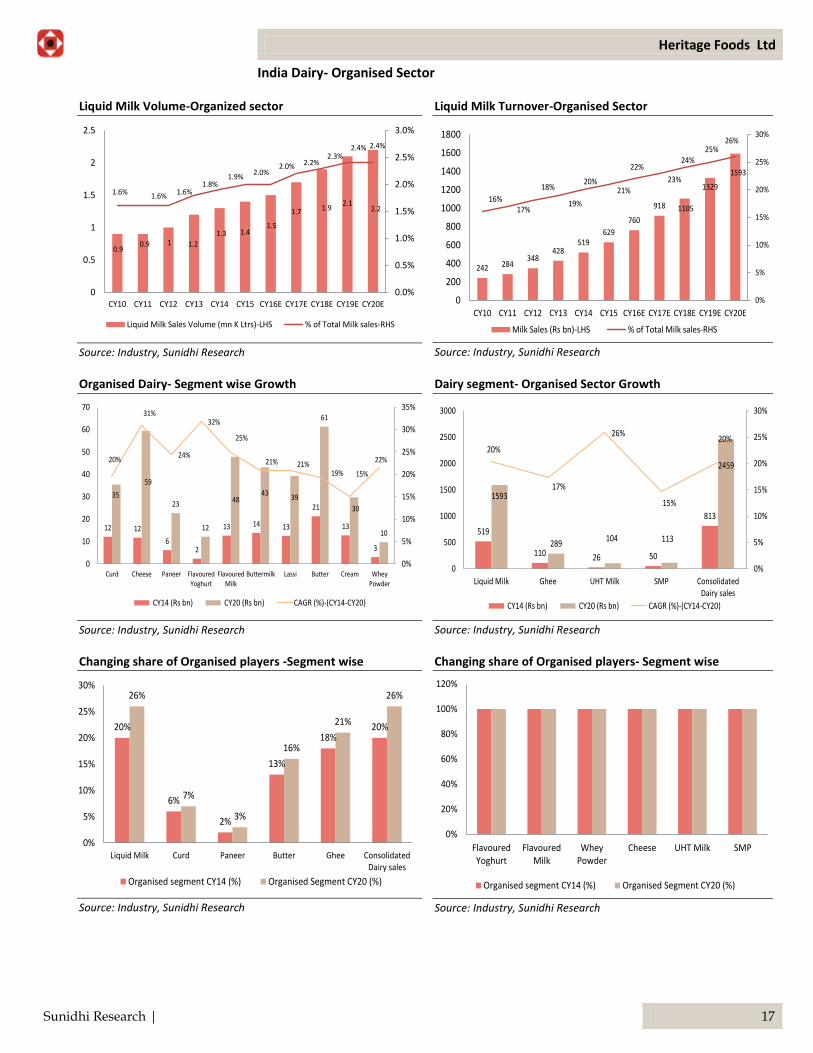
Proxy play on high growth organized Dairy in India: Per capita milk consumption in India is 97 litres which is much lower than corresponding figure in countries like US (285 liters), EU (281 liters), Russian federation (220 liters) and Brazil (156 liters). This is in spite of the fact that India is the world’s largest milk producer (147 MMT in FY15). Steadily growing population with rising per capita income is expected to lead to sustainable demand for milk and milk based products in India. India’s milk consumption is expected to grow to 192MMT in CY2021 from 138MMT in CY2015. India’s Dairy Industry which was valued at INR 4.7tn in CY15 is expected to grow at a CAGR of 14.9% between CY 15 and CY20 to reach a value of INR 9.4tn. Organized segment which is 20.7% of Indian Dairy Industry and valued at Rs 629bn in CY 15is expected to grow faster at CAGR of 19.5% during the same period to reach value of INR 2.4trn (25.5% of Indian Dairy Industry). Increasing income level, growing hygiene consciousness, width of product portfolio & Convenience element are some of the factors creating consumer shift towards branded Dairy products .Heritage Foods Ltd, an emerging national level Dairy Company in organized space offers good investment opportunity to benefit from high growth potential of organized dairy segment in India.
Per Capita Milk Consumption (Litres/ Year)
285
281
220
156
97
24
0 50 100 150 200 250 300
US
EU27
Russian Federation
Brazil
India
China
Per Capita Milk Consumption(Litres/ year)
Source: Industry, Sunidhi Research
India’s Working age population (15-64 years)
826836
846856
866877
887898
909920
931
760
780
800
820
840
860
880
900
920
940
CY15 CY16 CY17 CY18 CY19 CY20 CY21 CY22 CY23 CY24 CY25
India's working age population
Source: IMF, Sunidhi Research
India GDP (USD Bn)
21972364
25442737
29453169
0
500
1000
1500
2000
2500
3000
3500
CY15 CY16 CY17 CY18 CY19 CY20
India GDP (USD bn)
Source: IMF, Sunidhi Research
India Dairy Market Value (Rs Trn)
2.3 2.63.0
3.54.1
4.75.4
6.2
7.1
8.2
9.4
0.0
1.0
2.0
3.0
4.0
5.0
6.0
7.0
8.0
9.0
10.0
CY10 CY11 CY12 CY13 CY14 CY15 CY16E CY17E CY18E CY19E CY20E
Indian Dairy Market (Rs Tn)
Source: Industry, Sunidhi Research
Heritage Foods Ltd
Sunidhi Research | 4
Liquid Milk Volume-Organized sector
0.90.9 1 1.2
1.3 1.41.5
1.7 1.92.1
2.2
1.6% 1.6% 1.6%1.8%
1.9%2.0%
2.0% 2.2%2.3%
2.4% 2.4%
0.0%
0.5%
1.0%
1.5%
2.0%
2.5%
3.0%
0
0.5
1
1.5
2
2.5
CY10 CY11 CY12 CY13 CY14 CY15 CY16E CY17E CY18E CY19E CY20E
Liquid Milk Sales Volume (mn K Ltrs)-LHS % of Total Milk sales-RHS
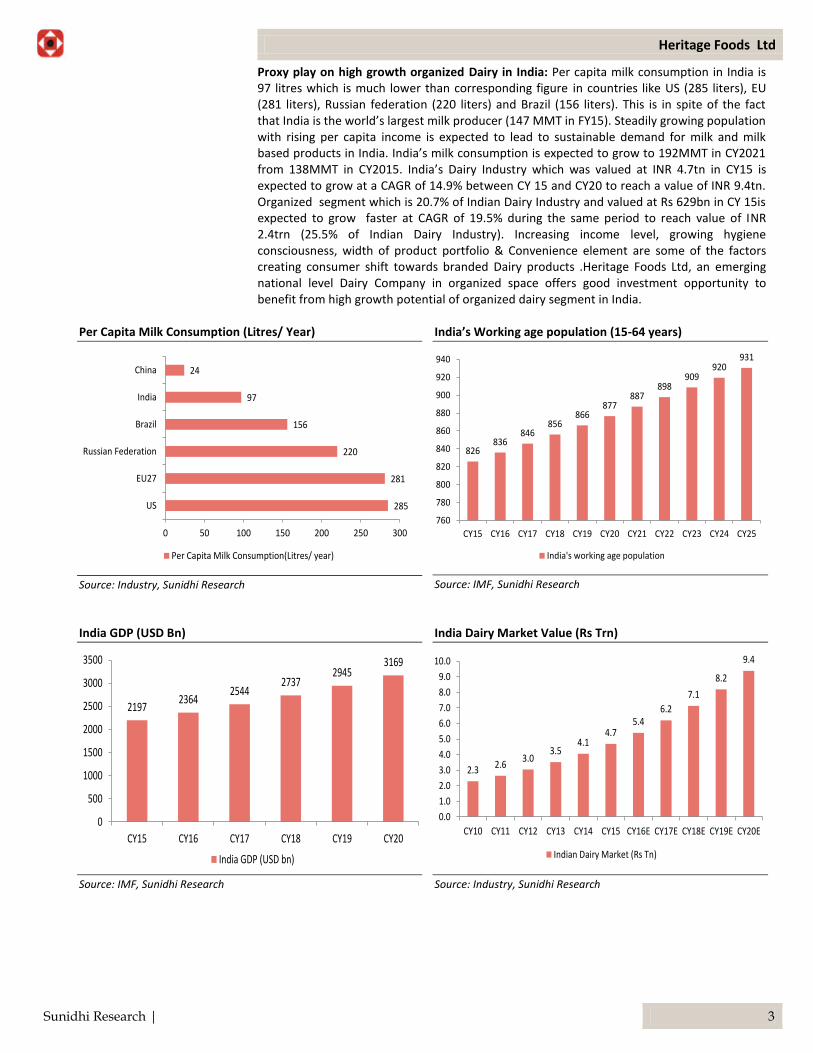
Source: Industry, Sunidhi Research Strategy in place for aggressive topline growth: Heritage topline has grown at a CAGR of 14% in the last 3 years and reached INR23.8bn in FY16. In order to capture the anticipated Dairy demand, management has decide to shed its moderation and wear aggression. With the help of KPMG, they have charted out vision 2020 which is an aggressive plan to triple the turnover of the company to Rs 60bn by CY20. Vision envisages taking Dairy segment revenue to Rs 42bn, Retail segment revenue to Rs 15bn and other segments combined to approx INR 3 bn. Product portfolio expansion in Value Added Dairy product space (in JV with International Dairy company )and Geographic expansion( Delhi, Mumbai etc ) is the key to achieve the stated vision. Company expects to spend close to Rs 5 bn in capex in order to achieve the stated turnover.
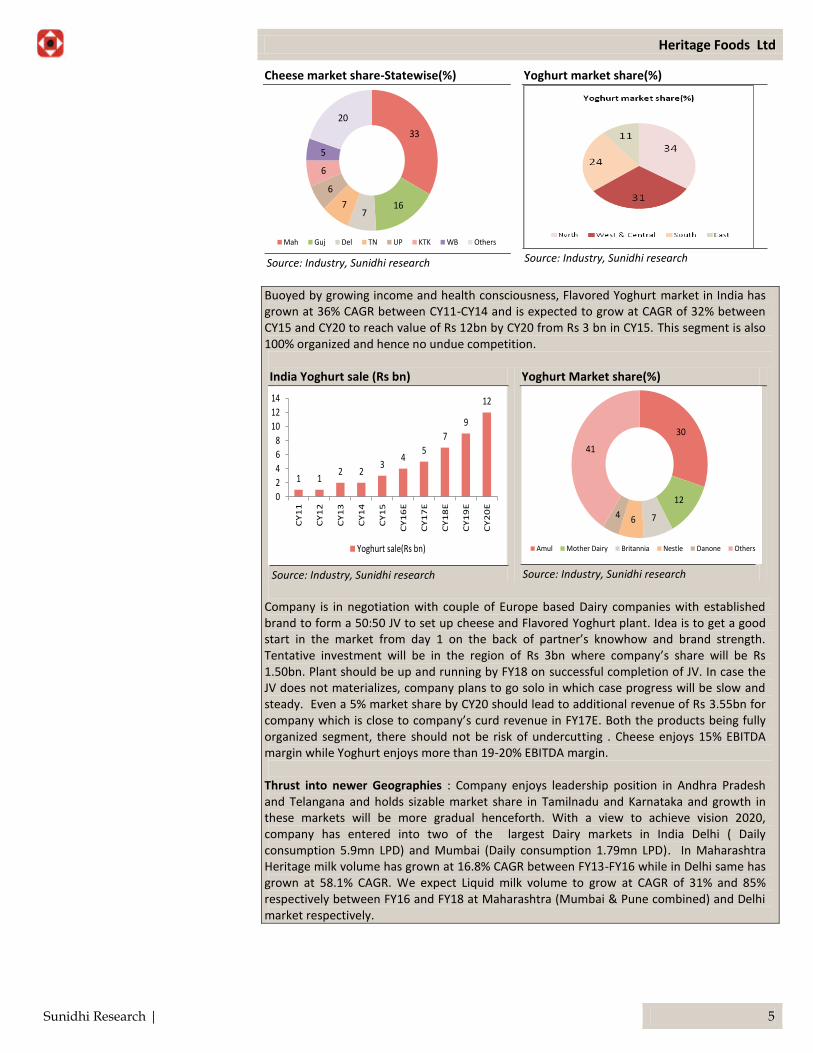
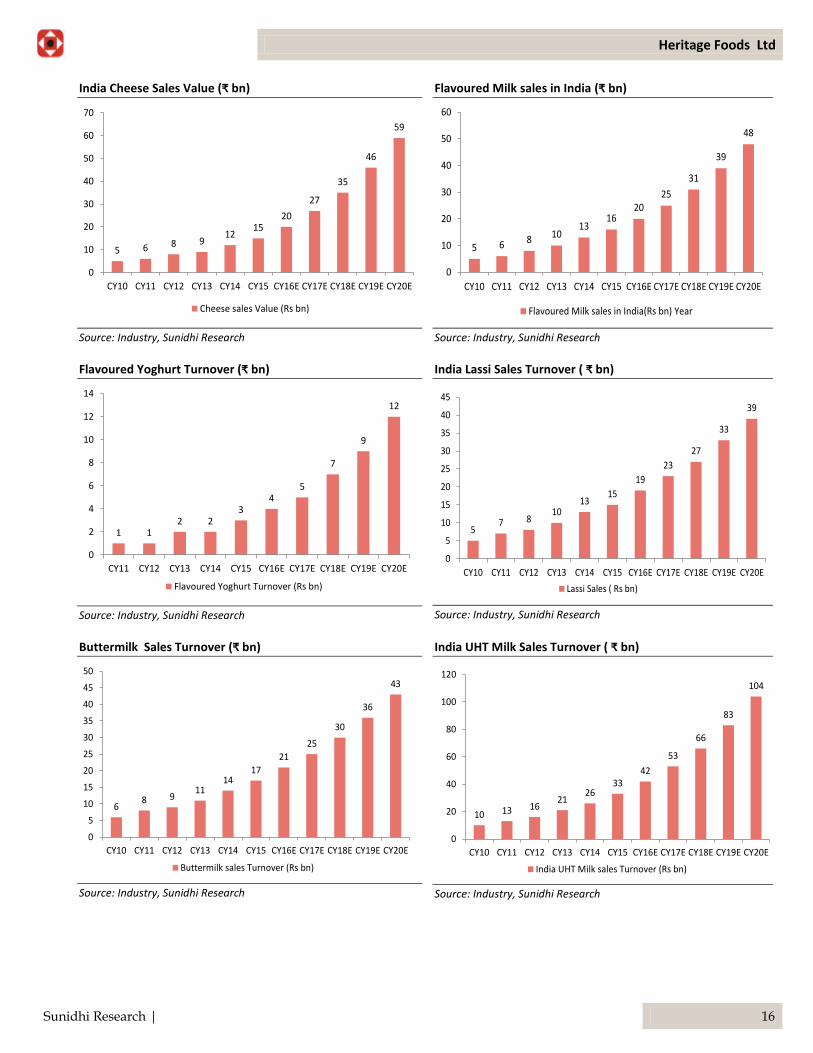
Product Portfolio Expansion: Having established market leadership position in Curd segment, company is now looking to expand its product basket by entering into the fastest growing products like Cheese and Yoghurt. Growth in Fast Food service outlets and changing food habits has triggered demand for cheese in India. Cheese market is 100% organized market and is the second fastest growing segment of VADP with 31.3% projected CAGR between CY15 & CY20 and reach value of Rs 59bn by CY20 from Rs 15bn in CY15. Top 4 players command 89% of India cheese market and there is scope for more players. India Cheese sale (Rs bn)
9 12 1520
2735
46
59
0
10
20
30
40
50
60
70
CY13 CY14 CY15 CY16E CY17E CY18E CY19E CY20E
Cheese sale (Rs bn)
Source: Industry, Sunidhi research
India Cheese Market share(%)
42
32
9
7
11
Amul Parag Milk Britannia Dynamix Others
Source: Industry, Sunidhi research
Heritage Foods Ltd
Sunidhi Research | 5
Cheese market share-Statewise(%)
33
167
7
6
6
5
20
Mah Guj Del TN UP KTK WB Others
Source: Industry, Sunidhi research
Yoghurt market share(%)
Source: Industry, Sunidhi research
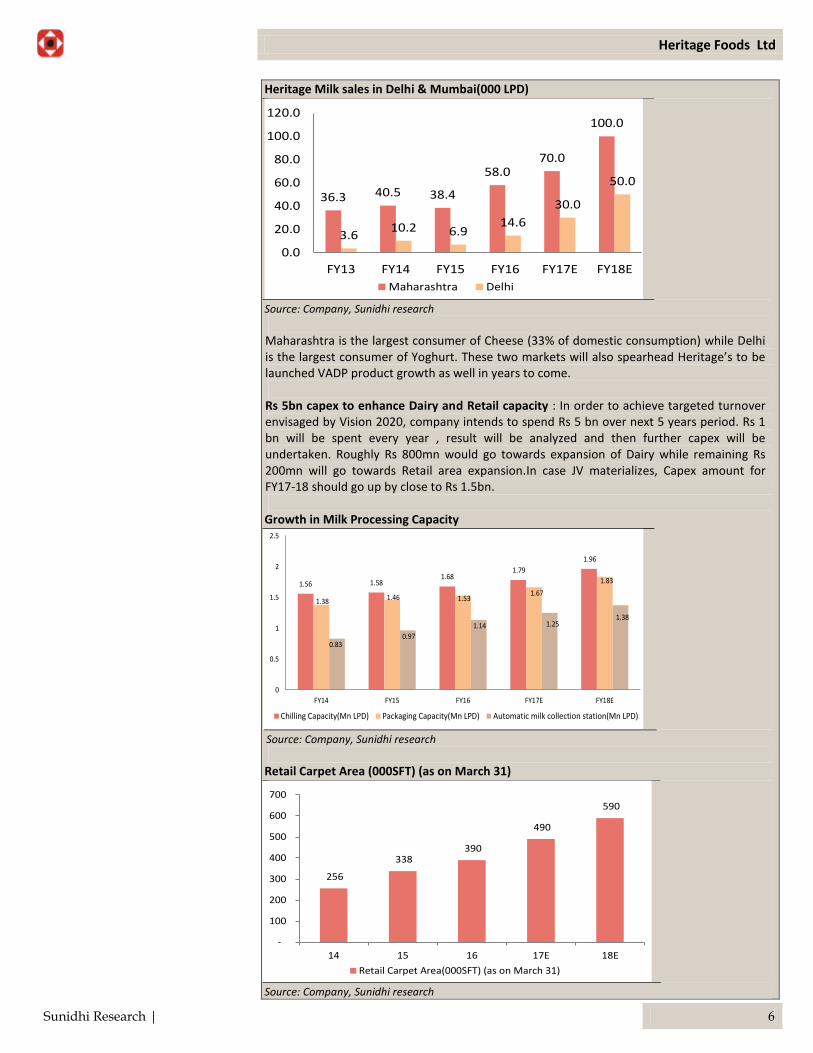
Buoyed by growing income and health consciousness, Flavored Yoghurt market in India has grown at 36% CAGR between CY11-CY14 and is expected to grow at CAGR of 32% between CY15 and CY20 to reach value of Rs 12bn by CY20 from Rs 3 bn in CY15. This segment is also 100% organized and hence no undue competition. India Yoghurt sale (Rs bn)
1 12 2
34
5
7
9
12
0
2
4
6
8
10
12
14
CY
11
CY
12
CY
13
CY
14
CY
15
CY
16
E
CY
17
E
CY
18
E
CY
19
E
CY
20
E
Yoghurt sale(Rs bn)
Source: Industry, Sunidhi research
Yoghurt Market share(%)
30
12
764
41
Amul Mother Dairy Britannia Nestle Danone Others
Source: Industry, Sunidhi research
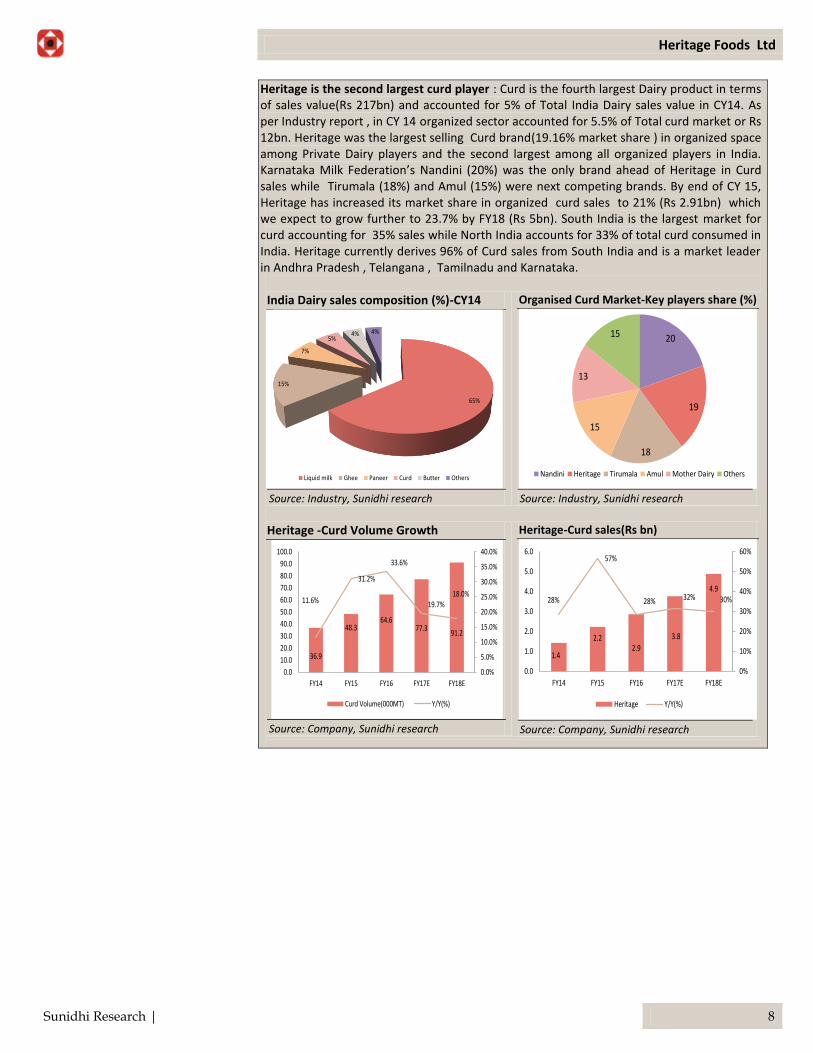
Company is in negotiation with couple of Europe based Dairy companies with established brand to form a 50:50 JV to set up cheese and Flavored Yoghurt plant. Idea is to get a good start in the market from day 1 on the back of partner’s knowhow and brand strength. Tentative investment will be in the region of Rs 3bn where company’s share will be Rs 1.50bn. Plant should be up and running by FY18 on successful completion of JV. In case the JV does not materializes, company plans to go solo in which case progress will be slow and steady. Even a 5% market share by CY20 should lead to additional revenue of Rs 3.55bn for company which is close to company’s curd revenue in FY17E. Both the products being fully organized segment, there should not be risk of undercutting . Cheese enjoys 15% EBITDA margin while Yoghurt enjoys more than 19-20% EBITDA margin. Thrust into newer Geographies : Company enjoys leadership position in Andhra Pradesh and Telangana and holds sizable market share in Tamilnadu and Karnataka and growth in these markets will be more gradual henceforth. With a view to achieve vision 2020, company has entered into two of the largest Dairy markets in India Delhi ( Daily consumption 5.9mn LPD) and Mumbai (Daily consumption 1.79mn LPD). In Maharashtra Heritage milk volume has grown at 16.8% CAGR between FY13-FY16 while in Delhi same has grown at 58.1% CAGR. We expect Liquid milk volume to grow at CAGR of 31% and 85% respectively between FY16 and FY18 at Maharashtra (Mumbai & Pune combined) and Delhi market respectively.
Heritage Foods Ltd
Sunidhi Research | 6
Heritage Milk sales in Delhi & Mumbai(000 LPD)
36.3 40.5 38.4
58.070.0
100.0
3.610.2 6.9
14.6
30.0
50.0
0.0
20.0
40.0
60.0
80.0
100.0
120.0
FY13 FY14 FY15 FY16 FY17E FY18E
Maharashtra Delhi
Source: Company, Sunidhi research Maharashtra is the largest consumer of Cheese (33% of domestic consumption) while Delhi is the largest consumer of Yoghurt. These two markets will also spearhead Heritage’s to be launched VADP product growth as well in years to come.
Rs 5bn capex to enhance Dairy and Retail capacity : In order to achieve targeted turnover envisaged by Vision 2020, company intends to spend Rs 5 bn over next 5 years period. Rs 1 bn will be spent every year , result will be analyzed and then further capex will be undertaken. Roughly Rs 800mn would go towards expansion of Dairy while remaining Rs 200mn will go towards Retail area expansion.In case JV materializes, Capex amount for FY17-18 should go up by close to Rs 1.5bn.
Growth in Milk Processing Capacity
1.56 1.581.68
1.79
1.96
1.38 1.46 1.531.67
1.83
0.83 0.97
1.14 1.25 1.38
0
0.5
1
1.5
2
2.5
FY14 FY15 FY16 FY17E FY18E
Chilling Capacity(Mn LPD) Packaging Capacity(Mn LPD) Automatic milk collection station(Mn LPD)
Source: Company, Sunidhi research Retail Carpet Area (000SFT) (as on March 31)
256
338 390
490
590
-
100
200
300
400
500
600
700
14 15 16 17E 18E
Retail Carpet Area(000SFT) (as on March 31)
Source: Company, Sunidhi research

Heritage Foods Ltd
Sunidhi Research | 7
Source: Company, Sunidhi research
Source: Sunidhi research
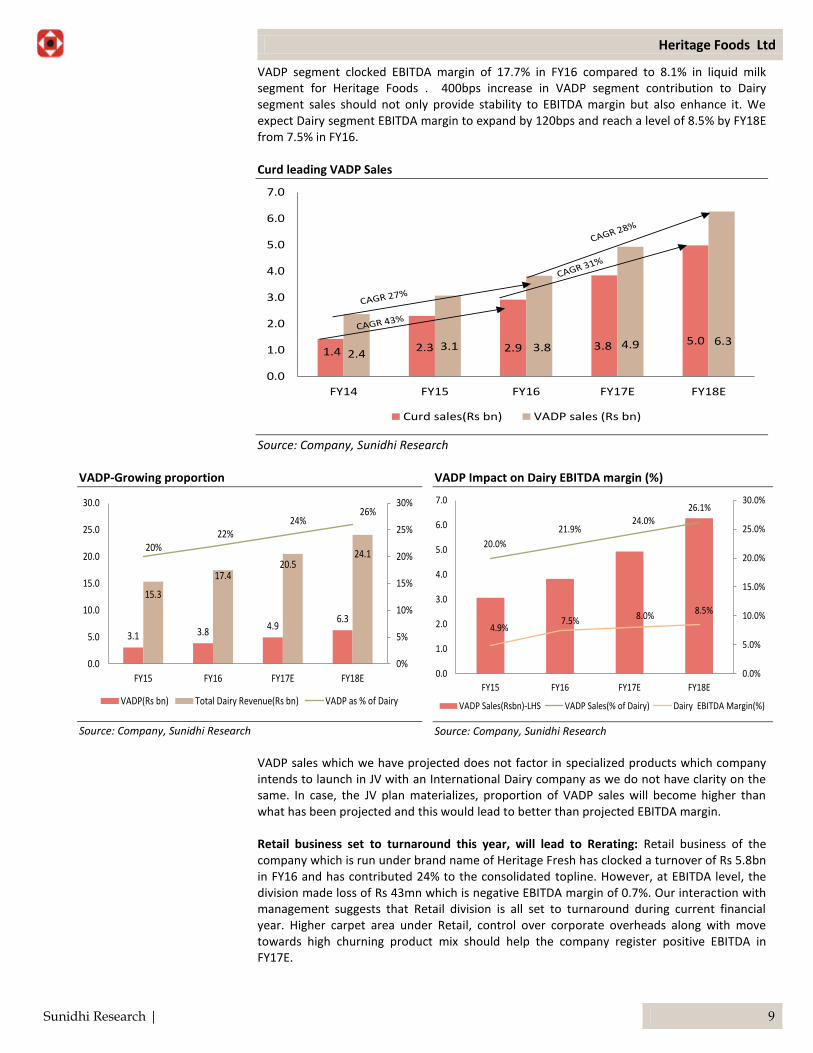
We expect company to register Topline of Rs 34bn by FY18E by clocking CAGR of 19.6% between FY16-FY18E on the back of 17.4% CAGR in Dairy segment and 26.5% CAGR in Retail segment. We have not factored in any revenue from new VADP plant which might come in JV with an International Dairy player with which negotiations are currently underway. If that materializes, company should be able to report higher topline than what we have projected. Change in Dairy Product Mix should lead to margin enhancement: Dairy business of the company comprises of liquid milk as well as milk based products, also known as Value Added Dairy Products (VADP). In FY16, out of total Dairy turnover of Rs 17.4bn, Value Added Dairy products contributed close to Rs 3.8 bn or 22%. Curd is the largest component of VADP (76% of VADP) and has grown at 43% CAGR between FY14 and FY16. Management is targeting 200-300bps increase in revenue contribution from VADP every year with the aim to ultimately take it to 40% of Dairy segment turnover. We expect VADP sales to grow at CAGR of 28% between FY16-FY18E to reach Rs 6.3bn by FY18E led by 31% CAGR in Curd sales (Rs 5 bn) . This would result in VADP contribution to Dairy sales growing by 400bps between FY16 and FY18E to reach 26%.
Heritage Foods Ltd
Sunidhi Research | 8
Heritage is the second largest curd player : Curd is the fourth largest Dairy product in terms of sales value(Rs 217bn) and accounted for 5% of Total India Dairy sales value in CY14. As per Industry report , in CY 14 organized sector accounted for 5.5% of Total curd market or Rs 12bn. Heritage was the largest selling Curd brand(19.16% market share ) in organized space among Private Dairy players and the second largest among all organized players in India. Karnataka Milk Federation’s Nandini (20%) was the only brand ahead of Heritage in Curd sales while Tirumala (18%) and Amul (15%) were next competing brands. By end of CY 15, Heritage has increased its market share in organized curd sales to 21% (Rs 2.91bn) which we expect to grow further to 23.7% by FY18 (Rs 5bn). South India is the largest market for curd accounting for 35% sales while North India accounts for 33% of total curd consumed in India. Heritage currently derives 96% of Curd sales from South India and is a market leader in Andhra Pradesh , Telangana , Tamilnadu and Karnataka.
India Dairy sales composition (%)-CY14
65%
15%
7%
5%4% 4%
Liquid milk Ghee Paneer Curd Butter Others
Source: Industry, Sunidhi research
Organised Curd Market-Key players share (%)
20
19
18
15
13
15
Nandini Heritage Tirumala Amul Mother Dairy Others
Source: Industry, Sunidhi research
Heritage -Curd Volume Growth
36.9
48.364.6
77.391.2
11.6%
31.2%
33.6%
19.7%18.0%
0.0%
5.0%
10.0%
15.0%
20.0%
25.0%
30.0%
35.0%
40.0%
0.0
10.0
20.0
30.0
40.0
50.0
60.0
70.0
80.0
90.0
100.0
FY14 FY15 FY16 FY17E FY18E
Curd Volume(000MT) Y/Y(%)
Source: Company, Sunidhi research
Heritage-Curd sales(Rs bn)
1.4
2.22.9
3.8
4.928%
57%
28% 32% 30%
0%
10%
20%
30%
40%
50%
60%
0.0
1.0
2.0
3.0
4.0
5.0
6.0
FY14 FY15 FY16 FY17E FY18E
Heritage Y/Y(%)
Source: Company, Sunidhi research
Heritage Foods Ltd
Sunidhi Research | 9
VADP segment clocked EBITDA margin of 17.7% in FY16 compared to 8.1% in liquid milk segment for Heritage Foods . 400bps increase in VADP segment contribution to Dairy segment sales should not only provide stability to EBITDA margin but also enhance it. We expect Dairy segment EBITDA margin to expand by 120bps and reach a level of 8.5% by FY18E from 7.5% in FY16. Curd leading VADP Sales
1.4 2.3 2.9 3.8 5.02.4
3.1 3.8 4.9 6.3
0.0
1.0
2.0
3.0
4.0
5.0
6.0
7.0
FY14 FY15 FY16 FY17E FY18E
Curd sales(Rs bn) VADP sales (Rs bn)
Source: Company, Sunidhi Research
VADP-Growing proportion
3.1 3.84.9
6.3
15.3
17.420.5
24.120%
22%24%
26%
0%
5%
10%
15%
20%
25%
30%
0.0
5.0
10.0
15.0
20.0
25.0
30.0
FY15 FY16 FY17E FY18E
VADP(Rs bn) Total Dairy Revenue(Rs bn) VADP as % of Dairy
Source: Company, Sunidhi Research
VADP Impact on Dairy EBITDA margin (%)
20.0%
21.9%24.0%
26.1%
4.9%7.5% 8.0%
8.5%
0.0%
5.0%
10.0%
15.0%
20.0%
25.0%
30.0%
0.0
1.0
2.0
3.0
4.0
5.0
6.0
7.0
FY15 FY16 FY17E FY18E
VADP Sales(Rsbn)-LHS VADP Sales(% of Dairy) Dairy EBITDA Margin(%)
Source: Company, Sunidhi Research VADP sales which we have projected does not factor in specialized products which company intends to launch in JV with an International Dairy company as we do not have clarity on the same. In case, the JV plan materializes, proportion of VADP sales will become higher than what has been projected and this would lead to better than projected EBITDA margin. Retail business set to turnaround this year, will lead to Rerating: Retail business of the company which is run under brand name of Heritage Fresh has clocked a turnover of Rs 5.8bn in FY16 and has contributed 24% to the consolidated topline. However, at EBITDA level, the division made loss of Rs 43mn which is negative EBITDA margin of 0.7%. Our interaction with management suggests that Retail division is all set to turnaround during current financial year. Higher carpet area under Retail, control over corporate overheads along with move towards high churning product mix should help the company register positive EBITDA in FY17E.
Heritage Foods Ltd
Sunidhi Research | 10
We are factoring Avg carpet area under Retail to grow at CAGR of 22% to reach 5.38 Lac SFT by FY18E from 3.59Lac SFT in FY16 while Avg monthly sales per SFT should grow at CAGR of 3% to reach Rs 1438 by FY18E. This would take Retail turnover to Rs 9.3bn by FY18E while EBITDA should reach to Rs Rs159 mn in FY18E which translates into EBITDA margin of 1.7% for FY18E. Core EBITDA of the company is expected to grow to Rs 2.25bn by FY18E (31% CAGR) while PAT should grow to Rs 1.07bn (39% CAGR) by FY18E.This should lead to complete Rerating of Heritage Foods Ltd.
Retail losses affecting Consol EBITDA(Rs bn)
1.2 1.1
0.7
1.3
-0.2 -0.1-0.02
-0.04
1.00.9
0.8
1.3
6.3%
5.5%
4.0%
5.5%
0.0%
1.0%
2.0%
3.0%
4.0%
5.0%
6.0%
7.0%
-0.4
-0.2
0.0
0.2
0.4
0.6
0.8
1.0
1.2
1.4
FY13 FY14 FY15 FY16
Dairy Retail Total EBITDA (%)
Source: Company, Sunidhi Research
Retail Business-Growing carpet area
3.8
5.05.8 7.3 9.3
223304 359
438538
1415 1357 1355 1396
1438
0
200
400
600
800
1000
1200
1400
1600
0.0
2.0
4.0
6.0
8.0
10.0
FY14 FY15 FY16 FY17E FY18E
Retail Turnover(Rs bn)-LHS Av Carpet area(000 SFT)
Av sales(Rs/SFT/Month)
Source: Sunidhi Research
Retail-Sales vs EBITDA
3.8
4.9
5.8
7.3
9.2
-138.0
-23.0 -43.0
45.7
158.5
-200.0
-150.0
-100.0
-50.0
0.0
50.0
100.0
150.0
200.0
0.0
1.0
2.0
3.0
4.0
5.0
6.0
7.0
8.0
9.0
10.0
FY14 FY15 FY16 FY17E Fy18E
Retail sales(Rs bn) Retail EBITDA(Rs mn)
Source: Company, Sunidhi Research
Retail profitability boosting consolidated EBITDA(Rs bn)
1.3
1.6
2.0
-0.04
0.050.16
1.3
1.7
2.3 5.5%
6.1%
6.6%
0.0%
1.0%
2.0%
3.0%
4.0%
5.0%
6.0%
7.0%
-0.5
0.0
0.5
1.0
1.5
2.0
2.5
FY16 FY17E FY18E
Dairy Retail Consolidated EBITDA (%)
Source: Sunidhi Research
Segment wise EBITDA margin (%)
7.5%8.0%
8.5%
-0.7%0.6%
1.7%
5.5% 6.1% 6.6%
-2.0%
0.0%
2.0%
4.0%
6.0%
8.0%
10.0%
FY16 FY17E FY18E
Dairy Retail Total
Source: Sunidhi Research
Core EBITDA vs PAT (Rs bn
1.31
1.73
2.25
0.55 0.77
1.07
-
0.50
1.00
1.50
2.00
2.50
FY16 FY17E FY18E
Core EBITDA (Rs bn) PAT (Rs bn)
Source: Sunidhi Research
Heritage Foods Ltd
Sunidhi Research | 11
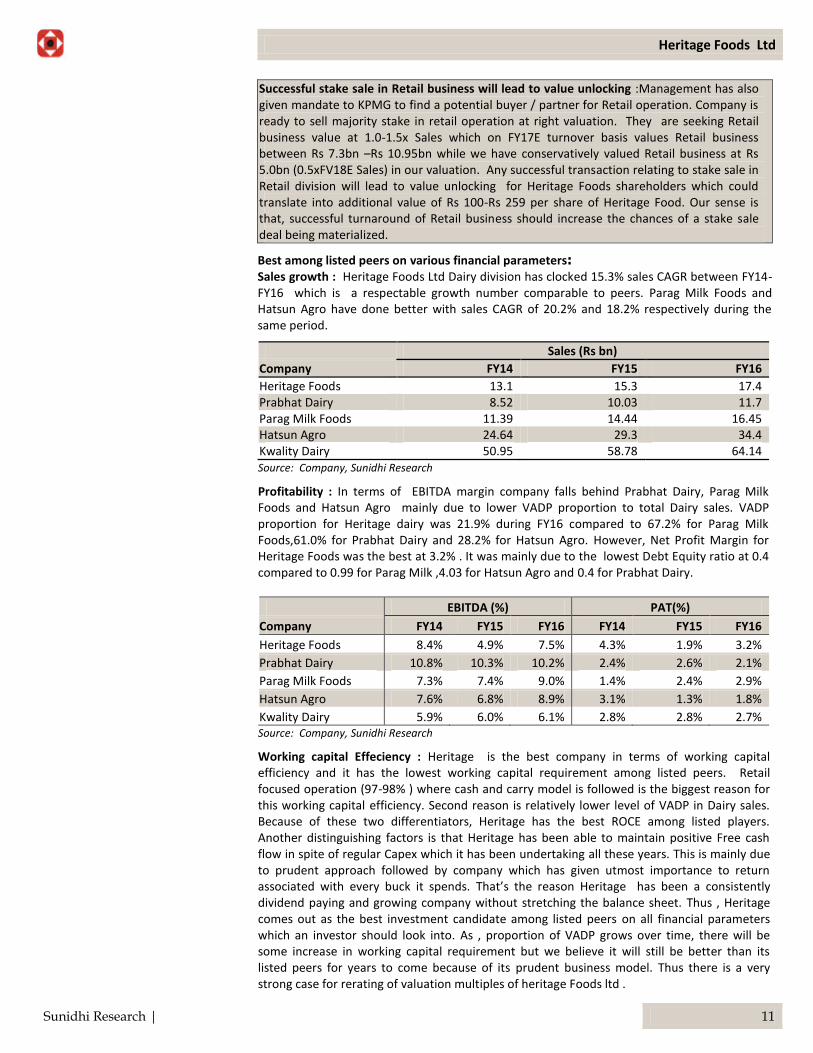
Successful stake sale in Retail business will lead to value unlocking :Management has also given mandate to KPMG to find a potential buyer / partner for Retail operation. Company is ready to sell majority stake in retail operation at right valuation. They are seeking Retail business value at 1.0-1.5x Sales which on FY17E turnover basis values Retail business between Rs 7.3bn –Rs 10.95bn while we have conservatively valued Retail business at Rs 5.0bn (0.5xFV18E Sales) in our valuation. Any successful transaction relating to stake sale in Retail division will lead to value unlocking for Heritage Foods shareholders which could translate into additional value of Rs 100-Rs 259 per share of Heritage Food. Our sense is that, successful turnaround of Retail business should increase the chances of a stake sale deal being materialized.
Best among listed peers on various financial parameters: Sales growth : Heritage Foods Ltd Dairy division has clocked 15.3% sales CAGR between FY14-FY16 which is a respectable growth number comparable to peers. Parag Milk Foods and Hatsun Agro have done better with sales CAGR of 20.2% and 18.2% respectively during the same period.
Sales (Rs bn)
Company FY14 FY15 FY16
Heritage Foods 13.1 15.3 17.4 Prabhat Dairy 8.52 10.03 11.7 Parag Milk Foods 11.39 14.44 16.45 Hatsun Agro 24.64 29.3 34.4 Kwality Dairy 50.95 58.78 64.14 Source: Company, Sunidhi Research
Profitability : In terms of EBITDA margin company falls behind Prabhat Dairy, Parag Milk Foods and Hatsun Agro mainly due to lower VADP proportion to total Dairy sales. VADP proportion for Heritage dairy was 21.9% during FY16 compared to 67.2% for Parag Milk Foods,61.0% for Prabhat Dairy and 28.2% for Hatsun Agro. However, Net Profit Margin for Heritage Foods was the best at 3.2% . It was mainly due to the lowest Debt Equity ratio at 0.4 compared to 0.99 for Parag Milk ,4.03 for Hatsun Agro and 0.4 for Prabhat Dairy.
EBITDA (%) PAT(%)
Company FY14 FY15 FY16 FY14 FY15 FY16
Heritage Foods 8.4% 4.9% 7.5% 4.3% 1.9% 3.2%
Prabhat Dairy 10.8% 10.3% 10.2% 2.4% 2.6% 2.1%
Parag Milk Foods 7.3% 7.4% 9.0% 1.4% 2.4% 2.9%
Hatsun Agro 7.6% 6.8% 8.9% 3.1% 1.3% 1.8%
Kwality Dairy 5.9% 6.0% 6.1% 2.8% 2.8% 2.7% Source: Company, Sunidhi Research
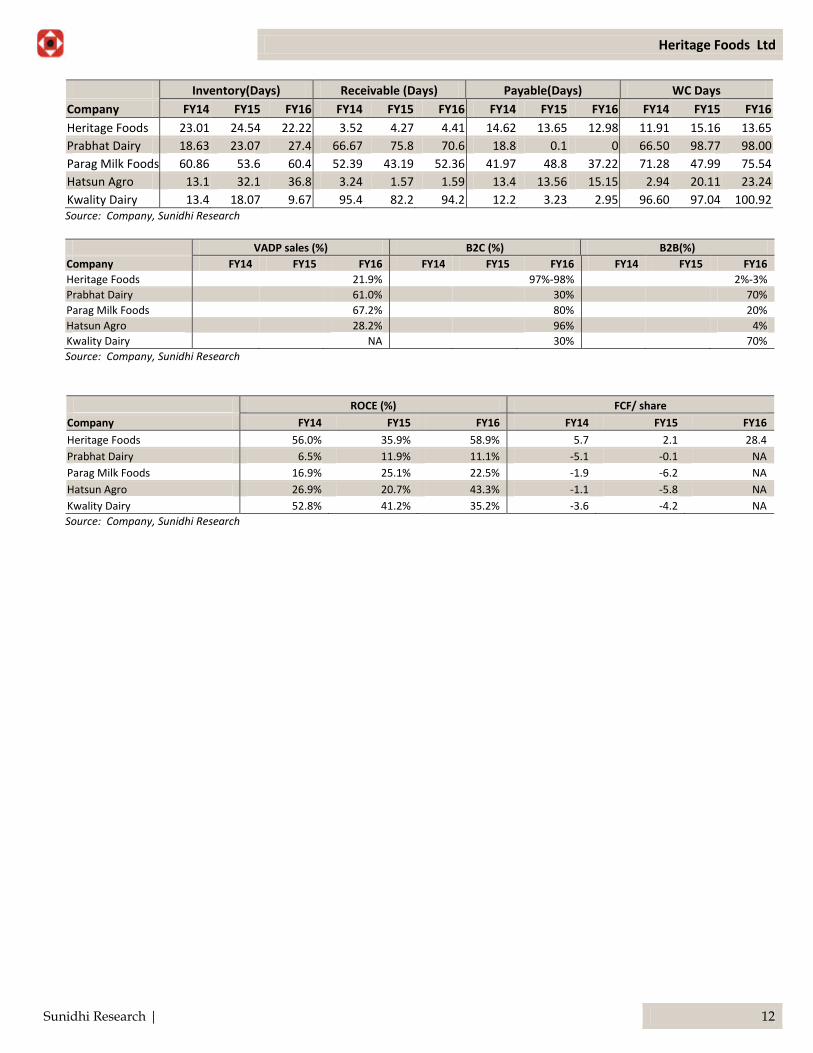
Working capital Effeciency : Heritage is the best company in terms of working capital efficiency and it has the lowest working capital requirement among listed peers. Retail focused operation (97-98% ) where cash and carry model is followed is the biggest reason for this working capital efficiency. Second reason is relatively lower level of VADP in Dairy sales. Because of these two differentiators, Heritage has the best ROCE among listed players. Another distinguishing factors is that Heritage has been able to maintain positive Free cash flow in spite of regular Capex which it has been undertaking all these years. This is mainly due to prudent approach followed by company which has given utmost importance to return associated with every buck it spends. That’s the reason Heritage has been a consistently dividend paying and growing company without stretching the balance sheet. Thus , Heritage comes out as the best investment candidate among listed peers on all financial parameters which an investor should look into. As , proportion of VADP grows over time, there will be some increase in working capital requirement but we believe it will still be better than its listed peers for years to come because of its prudent business model. Thus there is a very strong case for rerating of valuation multiples of heritage Foods ltd .
Heritage Foods Ltd
Sunidhi Research | 12
Inventory(Days) Receivable (Days) Payable(Days) WC Days
Company FY14 FY15 FY16 FY14 FY15 FY16 FY14 FY15 FY16 FY14 FY15 FY16
Heritage Foods 23.01 24.54 22.22 3.52 4.27 4.41 14.62 13.65 12.98 11.91 15.16 13.65
Prabhat Dairy 18.63 23.07 27.4 66.67 75.8 70.6 18.8 0.1 0 66.50 98.77 98.00
Parag Milk Foods 60.86 53.6 60.4 52.39 43.19 52.36 41.97 48.8 37.22 71.28 47.99 75.54
Hatsun Agro 13.1 32.1 36.8 3.24 1.57 1.59 13.4 13.56 15.15 2.94 20.11 23.24
Kwality Dairy 13.4 18.07 9.67 95.4 82.2 94.2 12.2 3.23 2.95 96.60 97.04 100.92 Source: Company, Sunidhi Research
VADP sales (%) B2C (%) B2B(%)
Company FY14 FY15 FY16 FY14 FY15 FY16 FY14 FY15 FY16
Heritage Foods 21.9% 97%-98% 2%-3%
Prabhat Dairy
61.0%
30%
70%
Parag Milk Foods 67.2% 80% 20%
Hatsun Agro
28.2%
96%
4%
Kwality Dairy NA 30% 70%
Source: Company, Sunidhi Research
ROCE (%) FCF/ share
Company FY14 FY15 FY16 FY14 FY15 FY16
Heritage Foods 56.0% 35.9% 58.9% 5.7 2.1 28.4
Prabhat Dairy 6.5% 11.9% 11.1% -5.1 -0.1 NA
Parag Milk Foods 16.9% 25.1% 22.5% -1.9 -6.2 NA
Hatsun Agro 26.9% 20.7% 43.3% -1.1 -5.8 NA
Kwality Dairy 52.8% 41.2% 35.2% -3.6 -4.2 NA
Source: Company, Sunidhi Research
Heritage Foods Ltd
Sunidhi Research | 13
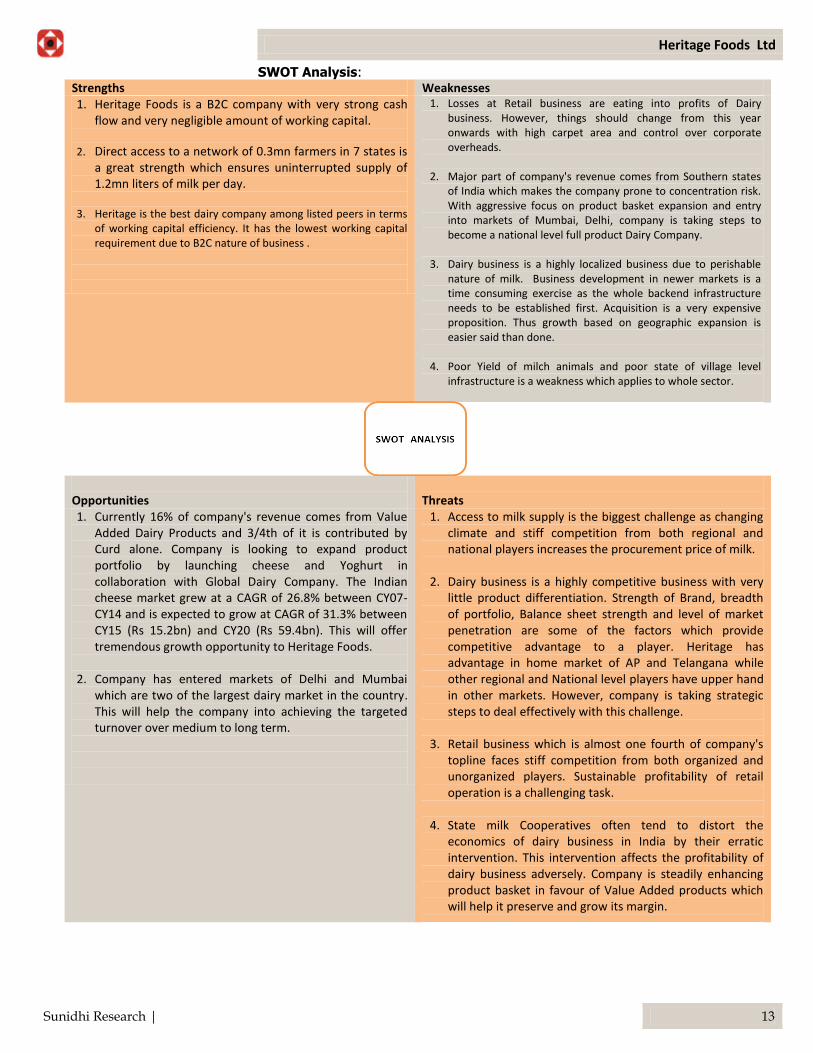
SWOT Analysis: Strengths Weaknesses 1. Heritage Foods is a B2C company with very strong cash
flow and very negligible amount of working capital.
2. Direct access to a network of 0.3mn farmers in 7 states is a great strength which ensures uninterrupted supply of 1.2mn liters of milk per day.
3. Heritage is the best dairy company among listed peers in terms
of working capital efficiency. It has the lowest working capital requirement due to B2C nature of business .
1. Losses at Retail business are eating into profits of Dairy business. However, things should change from this year onwards with high carpet area and control over corporate overheads.
2. Major part of company's revenue comes from Southern states of India which makes the company prone to concentration risk. With aggressive focus on product basket expansion and entry into markets of Mumbai, Delhi, company is taking steps to become a national level full product Dairy Company.
3. Dairy business is a highly localized business due to perishable nature of milk. Business development in newer markets is a time consuming exercise as the whole backend infrastructure needs to be established first. Acquisition is a very expensive proposition. Thus growth based on geographic expansion is easier said than done.
4. Poor Yield of milch animals and poor state of village level infrastructure is a weakness which applies to whole sector.
Opportunities
Threats
1. Currently 16% of company's revenue comes from Value Added Dairy Products and 3/4th of it is contributed by Curd alone. Company is looking to expand product portfolio by launching cheese and Yoghurt in collaboration with Global Dairy Company. The Indian cheese market grew at a CAGR of 26.8% between CY07-CY14 and is expected to grow at CAGR of 31.3% between CY15 (Rs 15.2bn) and CY20 (Rs 59.4bn). This will offer tremendous growth opportunity to Heritage Foods.
2. Company has entered markets of Delhi and Mumbai
which are two of the largest dairy market in the country. This will help the company into achieving the targeted turnover over medium to long term.
1. Access to milk supply is the biggest challenge as changing climate and stiff competition from both regional and national players increases the procurement price of milk.
2. Dairy business is a highly competitive business with very little product differentiation. Strength of Brand, breadth of portfolio, Balance sheet strength and level of market penetration are some of the factors which provide competitive advantage to a player. Heritage has advantage in home market of AP and Telangana while other regional and National level players have upper hand in other markets. However, company is taking strategic steps to deal effectively with this challenge.
3. Retail business which is almost one fourth of company's topline faces stiff competition from both organized and unorganized players. Sustainable profitability of retail operation is a challenging task.
4. State milk Cooperatives often tend to distort the economics of dairy business in India by their erratic intervention. This intervention affects the profitability of dairy business adversely. Company is steadily enhancing product basket in favour of Value Added products which will help it preserve and grow its margin.
Heritage Foods Ltd
Sunidhi Research | 14
Dairy Sector in India: Current Scenario
Milk Production & Availability
55.663.8
72.180.6 92.5
112.2127.9
146.3
178 194207 220
233
266
290
322
0
50
100
150
200
250
300
350
0
20
40
60
80
100
120
140
160
CY92 CY95 CY98 CY01 CY05 CY09 CY12 CY15
Milk Production(mn Tonnes)-LHS Per Capita Availability (gms/Day)-RHS
Source: Ministry of Agri, GOI, Sunidhi Research
Per Capita Milk Consumption (Litres/ Year)
285
281
220
156
97
24
0 50 100 150 200 250 300
US
EU27
Russian Federation
Brazil
India
China
Per Capita Milk Consumption(Litres/ year)
Source: Ministry of Agri, GOI, Sunidhi Research
CY15 Milk Production Statewise
17%
12%
8%
7%
7%7%
7%
5%
5%
5%
20%
UP Rajasthan Gujrat MP Punjab Andhra P
Maharashtra TN Haryana Bihar Rest
Source: Ministry of Agri, GOI, Sunidhi Research
Liquid Milk sales in India-Geographic Break-up
North India45%
South India22%
East India10%
West & Central India23%
Source: Ministry of Agri, GOI, Sunidhi Research
Urban Household Monthly expenditure on Dairy
83.3 84.997.5
106.6
138.7
187.1
0.020.040.060.080.0
100.0120.0140.0160.0180.0200.0
Urban Household monthly expenditure on Dairy
Source: Ministry of Agri, GOI, Sunidhi Research
WPI Trend in Milk & Dairy Products
100 101109 115
123
146
176 194209
221 243
100 99105
116 123139
152 172 176180
200
0
50
100
150
200
250
300
CY05 CY06 CY07 CY08 CY09 CY10 CY11 CY12 CY13 CY14 CY15
Milk WPI Dairy Products WPI
Source: Ministry of Agri, GOI, Sunidhi Research
Heritage Foods Ltd
Sunidhi Research | 15
Dairy Sector India – Future Growth
Indian Dairy Trade Market (₹ Tn)
2.3 2.63.0
3.54.1
4.75.4
6.2
7.1
8.2
9.4
0.0
1.0
2.0
3.0
4.0
5.0
6.0
7.0
8.0
9.0
10.0
CY10 CY11 CY12 CY13 CY14 CY15 CY16E CY17E CY18E CY19E CY20E
Indian Dairy Market (Rs Tn)
Source: Industry, Sunidhi Research
CY14 – Dairy Sales Composition
65%
15%
7%
5%4% 4%
Liquid milk Ghee Paneer Curd Butter Others
Source: Industry, Sunidhi Research
India Liquid Milk Turnover (₹ tn)
1.51.7
2.02.3
2.63.0
3.5
4.0
4.6
5.3
6.1
0.0
1.0
2.0
3.0
4.0
5.0
6.0
7.0
CY10 CY11 CY12 CY13 CY14 CY15 CY16E CY17E CY18E CY19E CY20E
India Liquid Milk Turnover (Rs tn)
Source: Industry, Sunidhi Research
India Ghee Turnover (₹ Bn)
345404
468538
618709
811927
1058
1205
1367
0
200
400
600
800
1000
1200
1400
1600
CY10 CY11 CY12 CY13 CY14 CY15 CY16E CY17E CY18E CY19E CY20E
India Ghee Turnover (Rs bn)
Source: Industry, Sunidhi Research
Paneer Sales Val (₹ bn)
164194
221255
293337
386442
504
575
654
0
100
200
300
400
500
600
700
CY10 CY11 CY12 CY13 CY14 CY15 CY16E CY17E CY18E CY19E CY20E
Paneer sales Val (Rs bn)
Source: Industry, Sunidhi Research
India Curd Sales Value (₹ bn)
124143
163190
217251
288
331
381
434
493
0
100
200
300
400
500
600
CY10 CY11 CY12 CY13 CY14 CY15 CY16E CY17E CY18E CY19E CY20E
Curd Sales Value (Rs bn)
Source: Industry, Sunidhi Research
Heritage Foods Ltd
Sunidhi Research | 16
India Cheese Sales Value (₹ bn)
5 6 8 912
1520
27
35
46
59
0
10
20
30
40
50
60
70
CY10 CY11 CY12 CY13 CY14 CY15 CY16E CY17E CY18E CY19E CY20E
Cheese sales Value (Rs bn)
Source: Industry, Sunidhi Research
Flavoured Milk sales in India (₹ bn)
5 6 8 1013
1620
25
31
39
48
0
10
20
30
40
50
60
CY10 CY11 CY12 CY13 CY14 CY15 CY16E CY17E CY18E CY19E CY20E
Flavoured Milk sales in India(Rs bn) Year
Source: Industry, Sunidhi Research
Flavoured Yoghurt Turnover (₹ bn)
1 12 2
34
5
7
9
12
0
2
4
6
8
10
12
14
CY11 CY12 CY13 CY14 CY15 CY16E CY17E CY18E CY19E CY20E
Flavoured Yoghurt Turnover (Rs bn)
Source: Industry, Sunidhi Research
India Lassi Sales Turnover ( ₹ bn)
57 8
1013
15
19
23
27
33
39
0
5
10
15
20
25
30
35
40
45
CY10 CY11 CY12 CY13 CY14 CY15 CY16E CY17E CY18E CY19E CY20E
Lassi Sales ( Rs bn)
Source: Industry, Sunidhi Research
Buttermilk Sales Turnover (₹ bn)
68 9
1114
17
21
25
30
36
43
0
5
10
15
20
25
30
35
40
45
50
CY10 CY11 CY12 CY13 CY14 CY15 CY16E CY17E CY18E CY19E CY20E
Buttermilk sales Turnover (Rs bn)
Source: Industry, Sunidhi Research
India UHT Milk Sales Turnover ( ₹ bn)
10 13 1621
2633
42
53
66
83
104
0
20
40
60
80
100
120
CY10 CY11 CY12 CY13 CY14 CY15 CY16E CY17E CY18E CY19E CY20E
India UHT Milk sales Turnover (Rs bn)
Source: Industry, Sunidhi Research
Heritage Foods Ltd
Sunidhi Research | 17
India Dairy- Organised Sector
Liquid Milk Volume-Organized sector
0.90.9 1 1.2
1.3 1.41.5
1.7 1.92.1
2.2
1.6% 1.6% 1.6%1.8%
1.9%2.0%
2.0% 2.2%2.3%
2.4% 2.4%
0.0%
0.5%
1.0%
1.5%
2.0%
2.5%
3.0%
0
0.5
1
1.5
2
2.5
CY10 CY11 CY12 CY13 CY14 CY15 CY16E CY17E CY18E CY19E CY20E
Liquid Milk Sales Volume (mn K Ltrs)-LHS % of Total Milk sales-RHS
Source: Industry, Sunidhi Research
Liquid Milk Turnover-Organised Sector
242 284348
428519
629
760
918 1105
1329
1593
16%17%
18%
19%
20%21%
22%
23%
24%25%
26%
0%
5%
10%
15%
20%
25%
30%
0
200
400
600
800
1000
1200
1400
1600
1800
CY10 CY11 CY12 CY13 CY14 CY15 CY16E CY17E CY18E CY19E CY20E
Milk Sales (Rs bn)-LHS % of Total Milk sales-RHS
Source: Industry, Sunidhi Research
Organised Dairy- Segment wise Growth
12 12
62
13 14 13
21
13
3
35
59
23
12
4843
39
61
30
10
20%
31%
24%
32%
25%
21% 21%19% 15%
22%
0%
5%
10%
15%
20%
25%
30%
35%
0
10
20
30
40
50
60
70
Curd Cheese Paneer FlavouredYoghurt
FlavouredMilk
Buttermilk Lassi Butter Cream WheyPowder
CY14 (Rs bn) CY20 (Rs bn) CAGR (%)-(CY14-CY20)
Source: Industry, Sunidhi Research
Dairy segment- Organised Sector Growth
519
110 26 50
813
1593
289104 113
2459
20%
17%
26%
15%
20%
0%
5%
10%
15%
20%
25%
30%
0
500
1000
1500
2000
2500
3000
Liquid Milk Ghee UHT Milk SMP ConsolidatedDairy sales
CY14 (Rs bn) CY20 (Rs bn) CAGR (%)-(CY14-CY20)
Source: Industry, Sunidhi Research
Changing share of Organised players -Segment wise
20%
6%
2%
13%
18%20%
26%
7%
3%
16%
21%
26%
0%
5%
10%
15%
20%
25%
30%
Liquid Milk Curd Paneer Butter Ghee ConsolidatedDairy sales
Organised segment CY14 (%) Organised Segment CY20 (%)
Source: Industry, Sunidhi Research
Changing share of Organised players- Segment wise
0%
20%
40%
60%
80%
100%
120%
FlavouredYoghurt
FlavouredMilk
WheyPowder
Cheese UHT Milk SMP
Organised segment CY14 (%) Organised Segment CY20 (%)
Source: Industry, Sunidhi Research
Heritage Foods Ltd
Sunidhi Research | 18
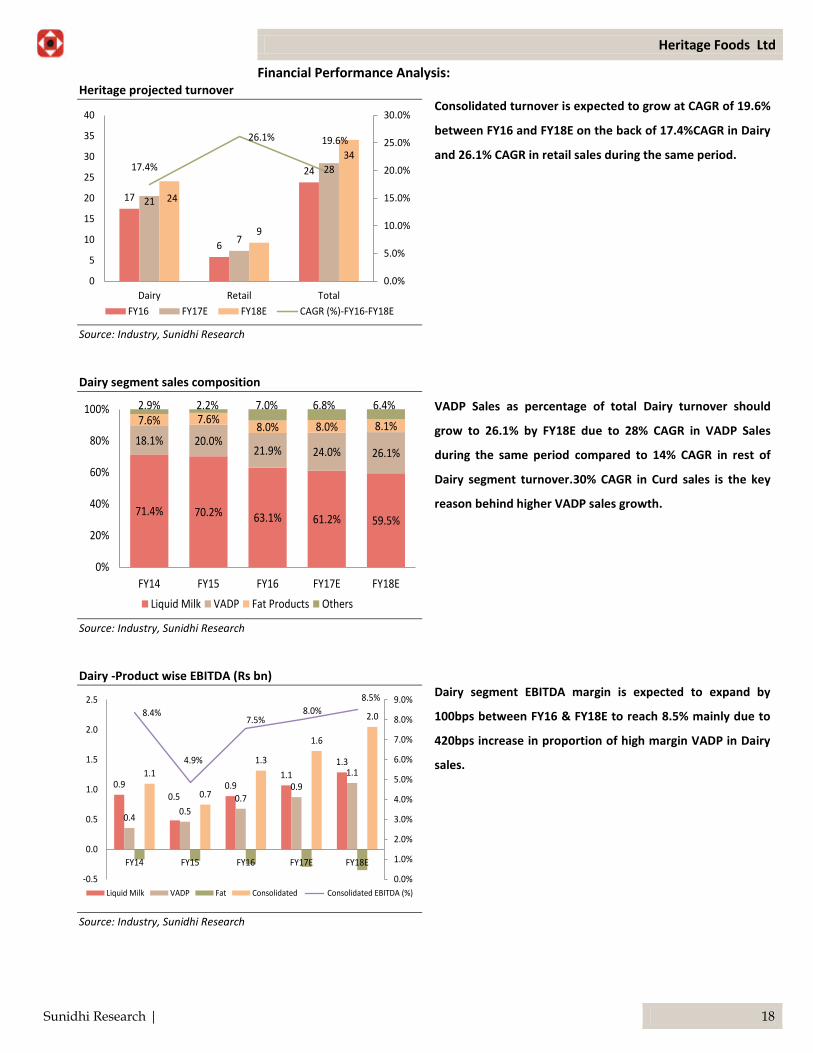
Financial Performance Analysis: Heritage projected turnover
17
6
24
21
7
28
24
9
3417.4%
26.1% 19.6%
0.0%
5.0%
10.0%
15.0%
20.0%
25.0%
30.0%
0
5
10
15
20
25
30
35
40
Dairy Retail Total
FY16 FY17E FY18E CAGR (%)-FY16-FY18E
Source: Industry, Sunidhi Research
Consolidated turnover is expected to grow at CAGR of 19.6%
between FY16 and FY18E on the back of 17.4%CAGR in Dairy
and 26.1% CAGR in retail sales during the same period.
Dairy segment sales composition
71.4% 70.2% 63.1% 61.2% 59.5%
18.1% 20.0%21.9% 24.0% 26.1%
7.6% 7.6%8.0% 8.0% 8.1%
2.9% 2.2% 7.0% 6.8% 6.4%
0%
20%
40%
60%
80%
100%
FY14 FY15 FY16 FY17E FY18E
Liquid Milk VADP Fat Products Others
Source: Industry, Sunidhi Research
VADP Sales as percentage of total Dairy turnover should
grow to 26.1% by FY18E due to 28% CAGR in VADP Sales
during the same period compared to 14% CAGR in rest of
Dairy segment turnover.30% CAGR in Curd sales is the key
reason behind higher VADP sales growth.
Dairy -Product wise EBITDA (Rs bn)
0.90.5
0.91.1
1.3
0.40.5
0.70.9
1.11.1
0.7
1.3
1.6
2.08.4%
4.9%
7.5%8.0%
8.5%
0.0%
1.0%
2.0%
3.0%
4.0%
5.0%
6.0%
7.0%
8.0%
9.0%
-0.5
0.0
0.5
1.0
1.5
2.0
2.5
FY14 FY15 FY16 FY17E FY18E
Liquid Milk VADP Fat Consolidated Consolidated EBITDA (%)
Source: Industry, Sunidhi Research
Dairy segment EBITDA margin is expected to expand by
100bps between FY16 & FY18E to reach 8.5% mainly due to
420bps increase in proportion of high margin VADP in Dairy
sales.
Heritage Foods Ltd
Sunidhi Research | 19
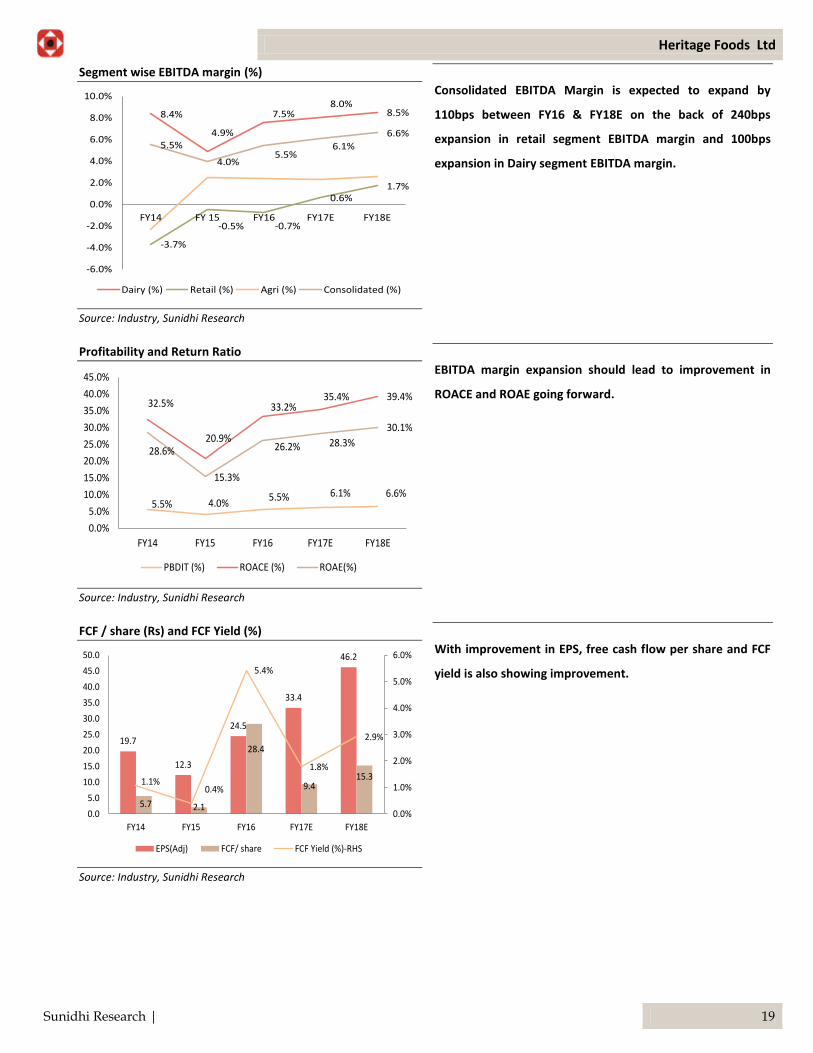
Segment wise EBITDA margin (%)
8.4%
4.9%
7.5%8.0%
8.5%
-3.7%
-0.5% -0.7%
0.6%1.7%
5.5%
4.0%5.5%
6.1%
6.6%
-6.0%
-4.0%
-2.0%
0.0%
2.0%
4.0%
6.0%
8.0%
10.0%
FY14 FY 15 FY16 FY17E FY18E
Dairy (%) Retail (%) Agri (%) Consolidated (%)
Source: Industry, Sunidhi Research
Consolidated EBITDA Margin is expected to expand by
110bps between FY16 & FY18E on the back of 240bps
expansion in retail segment EBITDA margin and 100bps
expansion in Dairy segment EBITDA margin.
Profitability and Return Ratio
5.5% 4.0%5.5% 6.1% 6.6%
32.5%
20.9%
33.2%35.4% 39.4%
28.6%
15.3%
26.2% 28.3%
30.1%
0.0%
5.0%
10.0%
15.0%
20.0%
25.0%
30.0%
35.0%
40.0%
45.0%
FY14 FY15 FY16 FY17E FY18E
PBDIT (%) ROACE (%) ROAE(%)
Source: Industry, Sunidhi Research
EBITDA margin expansion should lead to improvement in
ROACE and ROAE going forward.
FCF / share (Rs) and FCF Yield (%)
19.7
12.3
24.5
33.4
46.2
5.7 2.1
28.4
9.415.31.1%
0.4%
5.4%
1.8%
2.9%
0.0%
1.0%
2.0%
3.0%
4.0%
5.0%
6.0%
0.0
5.0
10.0
15.0
20.0
25.0
30.0
35.0
40.0
45.0
50.0
FY14 FY15 FY16 FY17E FY18E
EPS(Adj) FCF/ share FCF Yield (%)-RHS
Source: Industry, Sunidhi Research
With improvement in EPS, free cash flow per share and FCF
yield is also showing improvement.
Heritage Foods Ltd
Sunidhi Research | 20
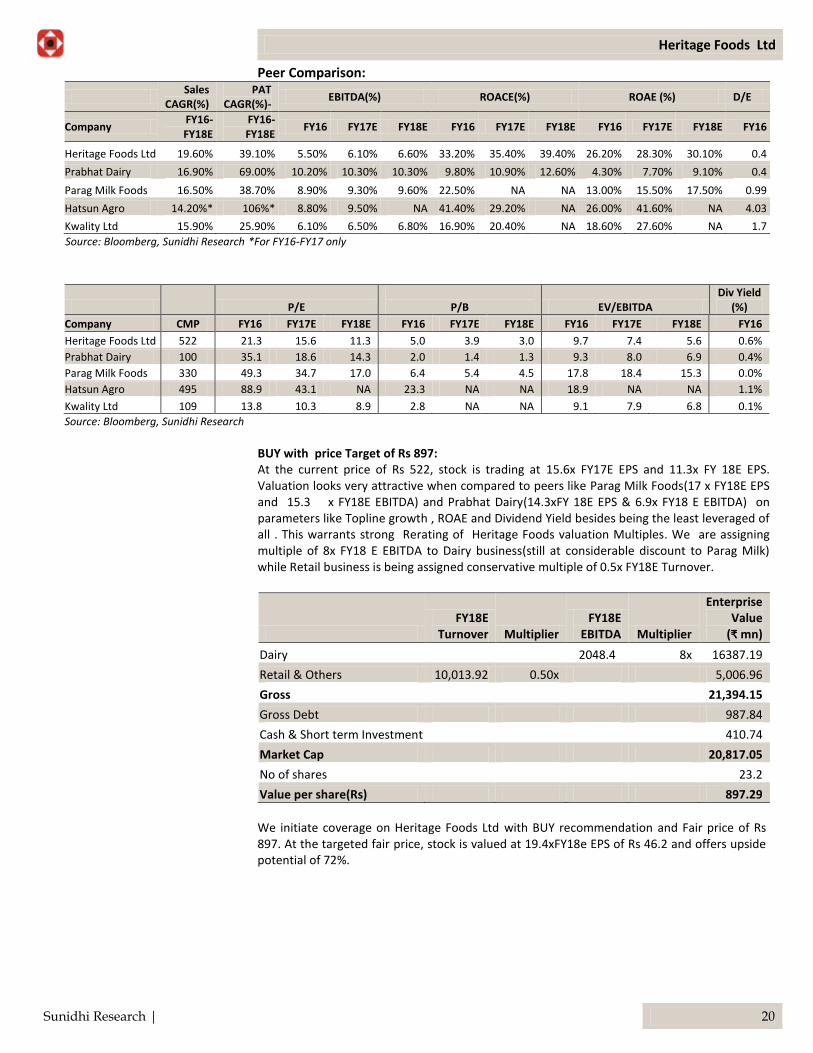
Peer Comparison:
Sales
CAGR(%) PAT
CAGR(%)- EBITDA(%) ROACE(%) ROAE (%) D/E
Company FY16-FY18E
FY16-FY18E
FY16 FY17E FY18E FY16 FY17E FY18E FY16 FY17E FY18E FY16
Heritage Foods Ltd 19.60% 39.10% 5.50% 6.10% 6.60% 33.20% 35.40% 39.40% 26.20% 28.30% 30.10% 0.4
Prabhat Dairy 16.90% 69.00% 10.20% 10.30% 10.30% 9.80% 10.90% 12.60% 4.30% 7.70% 9.10% 0.4
Parag Milk Foods 16.50% 38.70% 8.90% 9.30% 9.60% 22.50% NA NA 13.00% 15.50% 17.50% 0.99
Hatsun Agro 14.20%* 106%* 8.80% 9.50% NA 41.40% 29.20% NA 26.00% 41.60% NA 4.03
Kwality Ltd 15.90% 25.90% 6.10% 6.50% 6.80% 16.90% 20.40% NA 18.60% 27.60% NA 1.7
Source: Bloomberg, Sunidhi Research *For FY16-FY17 only
P/E
P/B EV/EBITDA Div Yield
(%)
Company CMP FY16 FY17E FY18E FY16 FY17E FY18E FY16 FY17E FY18E FY16
Heritage Foods Ltd 522 21.3 15.6 11.3 5.0 3.9 3.0 9.7 7.4 5.6 0.6%
Prabhat Dairy 100 35.1 18.6 14.3 2.0 1.4 1.3 9.3 8.0 6.9 0.4%
Parag Milk Foods 330 49.3 34.7 17.0 6.4 5.4 4.5 17.8 18.4 15.3 0.0%
Hatsun Agro 495 88.9 43.1 NA 23.3 NA NA 18.9 NA NA 1.1%
Kwality Ltd 109 13.8 10.3 8.9 2.8 NA NA 9.1 7.9 6.8 0.1%
Source: Bloomberg, Sunidhi Research BUY with price Target of Rs 897: At the current price of Rs 522, stock is trading at 15.6x FY17E EPS and 11.3x FY 18E EPS. Valuation looks very attractive when compared to peers like Parag Milk Foods(17 x FY18E EPS and 15.3 x FY18E EBITDA) and Prabhat Dairy(14.3xFY 18E EPS & 6.9x FY18 E EBITDA) on parameters like Topline growth , ROAE and Dividend Yield besides being the least leveraged of all . This warrants strong Rerating of Heritage Foods valuation Multiples. We are assigning multiple of 8x FY18 E EBITDA to Dairy business(still at considerable discount to Parag Milk) while Retail business is being assigned conservative multiple of 0.5x FY18E Turnover.
FY18E
Turnover Multiplier FY18E
EBITDA Multiplier
Enterprise Value
(₹ mn)
Dairy 2048.4 8x 16387.19
Retail & Others 10,013.92 0.50x 5,006.96
Gross 21,394.15
Gross Debt 987.84
Cash & Short term Investment 410.74
Market Cap 20,817.05
No of shares 23.2
Value per share(Rs) 897.29
We initiate coverage on Heritage Foods Ltd with BUY recommendation and Fair price of Rs 897. At the targeted fair price, stock is valued at 19.4xFY18e EPS of Rs 46.2 and offers upside potential of 72%.
Heritage Foods Ltd
Sunidhi Research | 21
Risk to Call: In spite of prudence and due care taken while making assumptions, there are chances of deviation in both the direections as far as topline and bottomline is concerned. This may pose risk to target price in direction of deviation. Some of the key risks are outlined below. Downside:
We have incorporated certain level of volume growth in our financial projection based on our interaction with management. In case, company is not able to achieve targeted volume growth in coming year/s, Topline growth may be lower than forecasted, which could adversely impact the profitability and hence valuation.
Retail operation of the company is expected to turn profitable at EBITDA level during current financial year on sustainable basis. Any disappointment on that front may have adverse impact on company’s profitability.
Upside:
Upside surprises on volume or Av realization front can create upside risk to our topline and bottomline projection.
Successful stake sale in Retail business could lead to rerating of company’s valuation.
Any news of JV with any global player could offer enhanced business prospects for the company in medium to long term. We have not factored in this development in our financial projections.
Company Background:
Headquartered in Hyderabad, Heritage Foods ltd (Incorporated in 1992) is a leading Private Sector Dairy Companies in India with operations spread across 10 states namely Andhra Pradesh, Telangana, Karnataka, Kerala, Tamilnadu, Maharashtra, Odisha & Delhi NCR (Including Haryana & Rajasthan). Company’s Dairy products are sold under brand name of “Heritage”.
Heritage is the second largest selling milk brand in the states of Andhra Pradesh and Telangana .
Besides Dairy, company operates in three other segments namely Retail, Agri & Bakery. Retail stores are operated under brand name of “Heritage Fresh”.
Company procures 1.18mn Litres of raw milk daily from approx 0.3mn farmers across 6 states which are chilled in 142 chilling plants (installed capacity 1.67mn Liters per day) and further processed and packaged in 14 packaging plants (installed capacity 1.53mn liters per day). After processing around 0.84mn Litres of Milk and 0.18mn Kg of Curd is sold daily across 8 states while 6317 Litres of Ice Cream is sold on daily basis across 6 states.
As on March 31, 2016 company has 0.38mn sq Ft of carpet area under Retail operations which are divided among 110 heritage Fresh stores spread across Telangana ( 47 stores Hyderabad, 9 stores Secunderabad & 9 in Ranga Reddy districts), Bangalore (16 stores )and Chennai (32 stores).
Heritage Foods Ltd
Sunidhi Research | 22
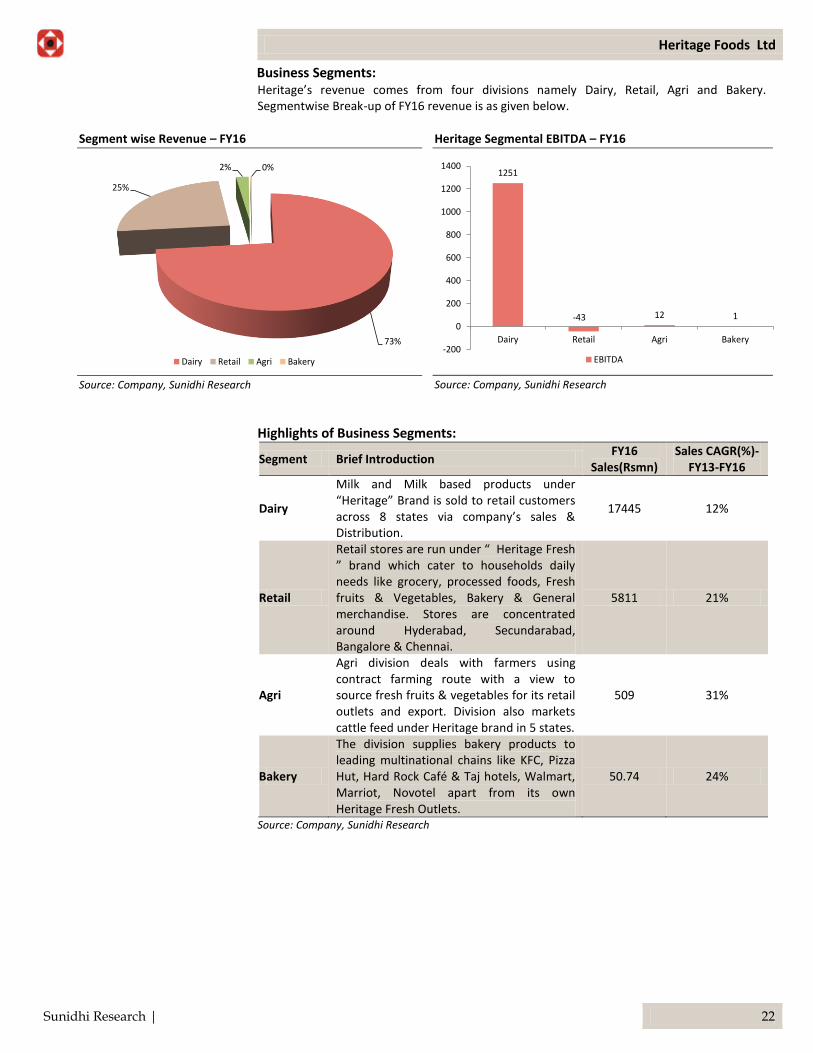
Business Segments: Heritage’s revenue comes from four divisions namely Dairy, Retail, Agri and Bakery. Segmentwise Break-up of FY16 revenue is as given below.
Segment wise Revenue – FY16
73%
25%
2% 0%
Dairy Retail Agri Bakery
Source: Company, Sunidhi Research
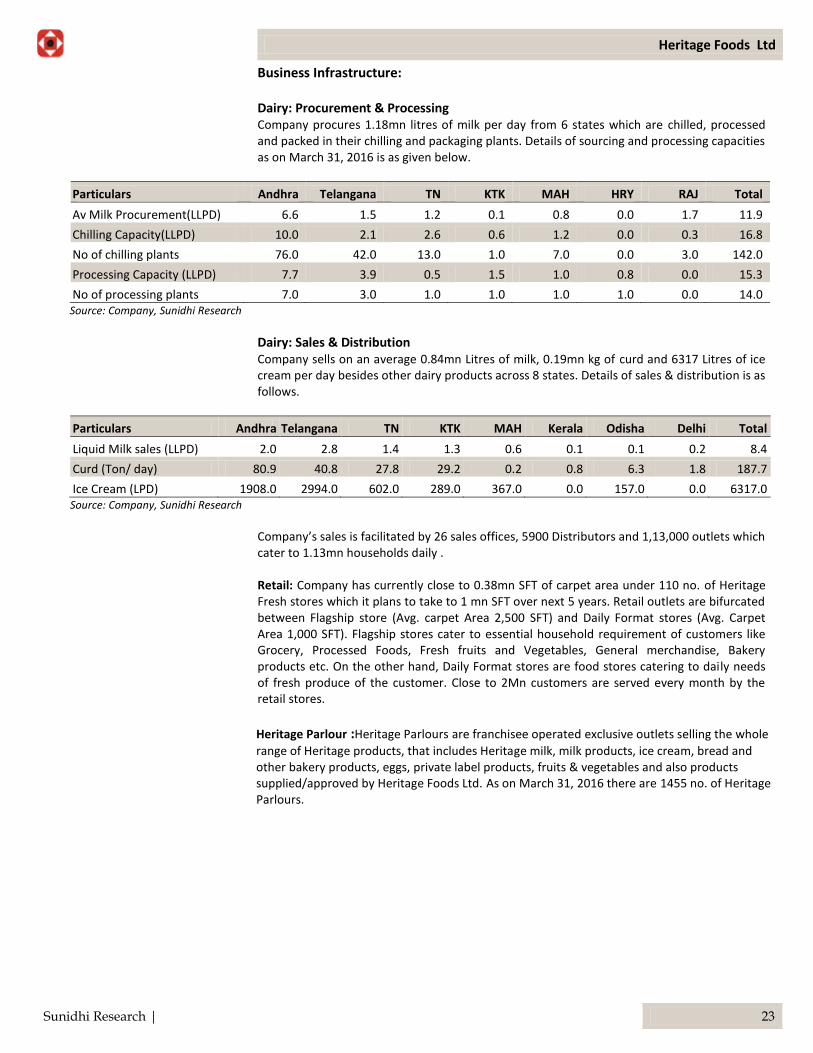
Heritage Segmental EBITDA – FY16
1251
-43 12 1
-200
0
200
400
600
800
1000
1200
1400
Dairy Retail Agri Bakery
EBITDA
Source: Company, Sunidhi Research
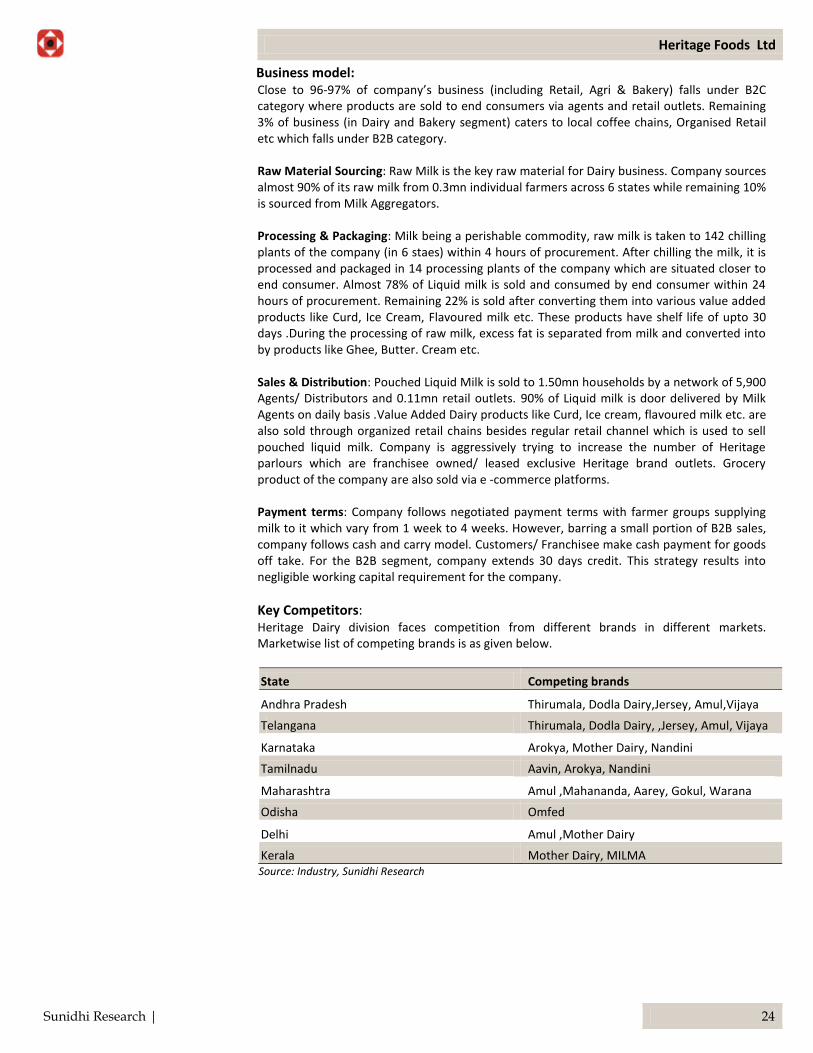
Highlights of Business Segments:
Segment Brief Introduction FY16
Sales(Rsmn) Sales CAGR(%)-
FY13-FY16
Dairy
Milk and Milk based products under “Heritage” Brand is sold to retail customers across 8 states via company’s sales & Distribution.
17445 12%
Retail
Retail stores are run under “ Heritage Fresh ” brand which cater to households daily needs like grocery, processed foods, Fresh fruits & Vegetables, Bakery & General merchandise. Stores are concentrated around Hyderabad, Secundarabad, Bangalore & Chennai.
5811 21%
Agri
Agri division deals with farmers using contract farming route with a view to source fresh fruits & vegetables for its retail outlets and export. Division also markets cattle feed under Heritage brand in 5 states.
509 31%
Bakery
The division supplies bakery products to leading multinational chains like KFC, Pizza Hut, Hard Rock Café & Taj hotels, Walmart, Marriot, Novotel apart from its own Heritage Fresh Outlets.
50.74 24%
Source: Company, Sunidhi Research
Heritage Foods Ltd
Sunidhi Research | 23
Business Infrastructure: Dairy: Procurement & Processing Company procures 1.18mn litres of milk per day from 6 states which are chilled, processed and packed in their chilling and packaging plants. Details of sourcing and processing capacities as on March 31, 2016 is as given below.
Particulars Andhra Telangana TN KTK MAH HRY RAJ Total
Av Milk Procurement(LLPD) 6.6 1.5 1.2 0.1 0.8 0.0 1.7 11.9
Chilling Capacity(LLPD) 10.0 2.1 2.6 0.6 1.2 0.0 0.3 16.8
No of chilling plants 76.0 42.0 13.0 1.0 7.0 0.0 3.0 142.0
Processing Capacity (LLPD) 7.7 3.9 0.5 1.5 1.0 0.8 0.0 15.3
No of processing plants 7.0 3.0 1.0 1.0 1.0 1.0 0.0 14.0 Source: Company, Sunidhi Research
Dairy: Sales & Distribution Company sells on an average 0.84mn Litres of milk, 0.19mn kg of curd and 6317 Litres of ice cream per day besides other dairy products across 8 states. Details of sales & distribution is as follows.
Particulars Andhra Telangana TN KTK MAH Kerala Odisha Delhi Total
Liquid Milk sales (LLPD) 2.0 2.8 1.4 1.3 0.6 0.1 0.1 0.2 8.4
Curd (Ton/ day) 80.9 40.8 27.8 29.2 0.2 0.8 6.3 1.8 187.7
Ice Cream (LPD) 1908.0 2994.0 602.0 289.0 367.0 0.0 157.0 0.0 6317.0 Source: Company, Sunidhi Research
Company’s sales is facilitated by 26 sales offices, 5900 Distributors and 1,13,000 outlets which cater to 1.13mn households daily . Retail: Company has currently close to 0.38mn SFT of carpet area under 110 no. of Heritage Fresh stores which it plans to take to 1 mn SFT over next 5 years. Retail outlets are bifurcated between Flagship store (Avg. carpet Area 2,500 SFT) and Daily Format stores (Avg. Carpet Area 1,000 SFT). Flagship stores cater to essential household requirement of customers like Grocery, Processed Foods, Fresh fruits and Vegetables, General merchandise, Bakery products etc. On the other hand, Daily Format stores are food stores catering to daily needs of fresh produce of the customer. Close to 2Mn customers are served every month by the retail stores.
Heritage Parlour :Heritage Parlours are franchisee operated exclusive outlets selling the whole
range of Heritage products, that includes Heritage milk, milk products, ice cream, bread and other bakery products, eggs, private label products, fruits & vegetables and also products supplied/approved by Heritage Foods Ltd. As on March 31, 2016 there are 1455 no. of Heritage Parlours.
Heritage Foods Ltd
Sunidhi Research | 24
Business model: Close to 96-97% of company’s business (including Retail, Agri & Bakery) falls under B2C category where products are sold to end consumers via agents and retail outlets. Remaining 3% of business (in Dairy and Bakery segment) caters to local coffee chains, Organised Retail etc which falls under B2B category. Raw Material Sourcing: Raw Milk is the key raw material for Dairy business. Company sources almost 90% of its raw milk from 0.3mn individual farmers across 6 states while remaining 10% is sourced from Milk Aggregators. Processing & Packaging: Milk being a perishable commodity, raw milk is taken to 142 chilling plants of the company (in 6 staes) within 4 hours of procurement. After chilling the milk, it is processed and packaged in 14 processing plants of the company which are situated closer to end consumer. Almost 78% of Liquid milk is sold and consumed by end consumer within 24 hours of procurement. Remaining 22% is sold after converting them into various value added products like Curd, Ice Cream, Flavoured milk etc. These products have shelf life of upto 30 days .During the processing of raw milk, excess fat is separated from milk and converted into by products like Ghee, Butter. Cream etc. Sales & Distribution: Pouched Liquid Milk is sold to 1.50mn households by a network of 5,900 Agents/ Distributors and 0.11mn retail outlets. 90% of Liquid milk is door delivered by Milk Agents on daily basis .Value Added Dairy products like Curd, Ice cream, flavoured milk etc. are also sold through organized retail chains besides regular retail channel which is used to sell pouched liquid milk. Company is aggressively trying to increase the number of Heritage parlours which are franchisee owned/ leased exclusive Heritage brand outlets. Grocery product of the company are also sold via e -commerce platforms. Payment terms: Company follows negotiated payment terms with farmer groups supplying milk to it which vary from 1 week to 4 weeks. However, barring a small portion of B2B sales, company follows cash and carry model. Customers/ Franchisee make cash payment for goods off take. For the B2B segment, company extends 30 days credit. This strategy results into negligible working capital requirement for the company.
Key Competitors: Heritage Dairy division faces competition from different brands in different markets. Marketwise list of competing brands is as given below.
State Competing brands
Andhra Pradesh Thirumala, Dodla Dairy,Jersey, Amul,Vijaya
Telangana Thirumala, Dodla Dairy, ,Jersey, Amul, Vijaya
Karnataka Arokya, Mother Dairy, Nandini
Tamilnadu Aavin, Arokya, Nandini
Maharashtra Amul ,Mahananda, Aarey, Gokul, Warana
Odisha Omfed
Delhi Amul ,Mother Dairy
Kerala Mother Dairy, MILMA Source: Industry, Sunidhi Research
Heritage Foods Ltd
Sunidhi Research | 25
Management Profile: Board of Directors Heritage Foods Ltd has a professional Board of Directors and it is a healthy mix of Family and Independent Directors, Young and experienced.
Name Profile
Mr Seetharamaiah D, Non-Executive Independent Chairperson, 90
B.Com, FCA, Senior Partner Brahmayya & Co. With over 5 decades of experience, he has held important positions including member of Southern Regional board of Reserve Bank of India. He holds board position on several other companies. Best suited to give direction to the company.
Mrs. Bhuvaneshwari. N Vice Chairperson & MD,54
BA, With extensive experience in Dairy business, she is responsible for converting vision into strategy and action. She is Director in several other companies and has been managing company’s affairs with prudence all these years.
Mrs Brahmani N Executive Director,29
BE, MBA (Stanford), With prior experience in Venture capital and Business Development, she represents second generation of promoter family and is highly exposed to global business. Under her leadership, company is aggressively looking for business alliance with globally renowned players with a firm view to establish heritage as a National Level Dairy player.
Mr N Lokesh Non-Executive Director, 33
BS, MBA (Stanford), Before joining Heritage as Vice President of Retail Division, He had a stint with World Bank as project Associate. As a Non-Executive Director, he represents the second generation of promoter family and company is benefitting from his knowledge and global exposure.
Mr Sri Vishnu Raju N Non-Executive Independent Director, 43
B.E (Chemical), Founder Chairman, EXCIGA group consisting of 5 NBFCs. Past President CII, Young Indians Hyderabad Chapter, Ex Member State council CII.
Dr V Nagaraja Naidu Non-Executive Director, 69
M Com, PhD (Finance). Started Career from Administrative Staff College of India, Hyderabad and has held positions in reputed universities. Has been associated with company since inception and helped in strengthening milk procurement of the company.
Mr Rajesh Thakur Ahuja Non-Executive Independent Director
BE (Production), He has been an entrepreneur and currently Managing Director in Sleek International Pvt Ltd, a subsidiary of Asian Paints Ltd. His experience will come handy for brand building of Heritage Foods.
Heritage Foods Ltd
Sunidhi Research | 26
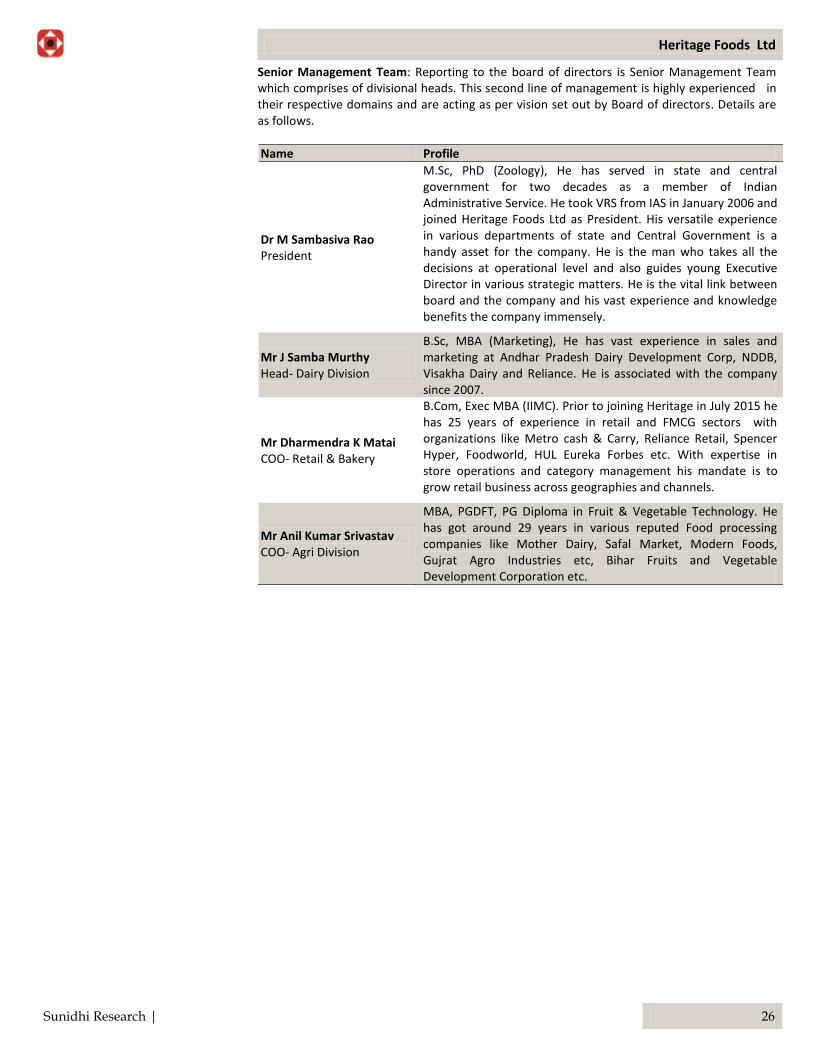
Senior Management Team: Reporting to the board of directors is Senior Management Team which comprises of divisional heads. This second line of management is highly experienced in their respective domains and are acting as per vision set out by Board of directors. Details are as follows.
Name Profile
Dr M Sambasiva Rao President
M.Sc, PhD (Zoology), He has served in state and central government for two decades as a member of Indian Administrative Service. He took VRS from IAS in January 2006 and joined Heritage Foods Ltd as President. His versatile experience in various departments of state and Central Government is a handy asset for the company. He is the man who takes all the decisions at operational level and also guides young Executive Director in various strategic matters. He is the vital link between board and the company and his vast experience and knowledge benefits the company immensely.
Mr J Samba Murthy Head- Dairy Division
B.Sc, MBA (Marketing), He has vast experience in sales and marketing at Andhar Pradesh Dairy Development Corp, NDDB, Visakha Dairy and Reliance. He is associated with the company since 2007.
Mr Dharmendra K Matai COO- Retail & Bakery
B.Com, Exec MBA (IIMC). Prior to joining Heritage in July 2015 he has 25 years of experience in retail and FMCG sectors with organizations like Metro cash & Carry, Reliance Retail, Spencer Hyper, Foodworld, HUL Eureka Forbes etc. With expertise in store operations and category management his mandate is to grow retail business across geographies and channels.
Mr Anil Kumar Srivastav COO- Agri Division
MBA, PGDFT, PG Diploma in Fruit & Vegetable Technology. He has got around 29 years in various reputed Food processing companies like Mother Dairy, Safal Market, Modern Foods, Gujrat Agro Industries etc, Bihar Fruits and Vegetable Development Corporation etc.
Heritage Foods Ltd
Sunidhi Research | 27
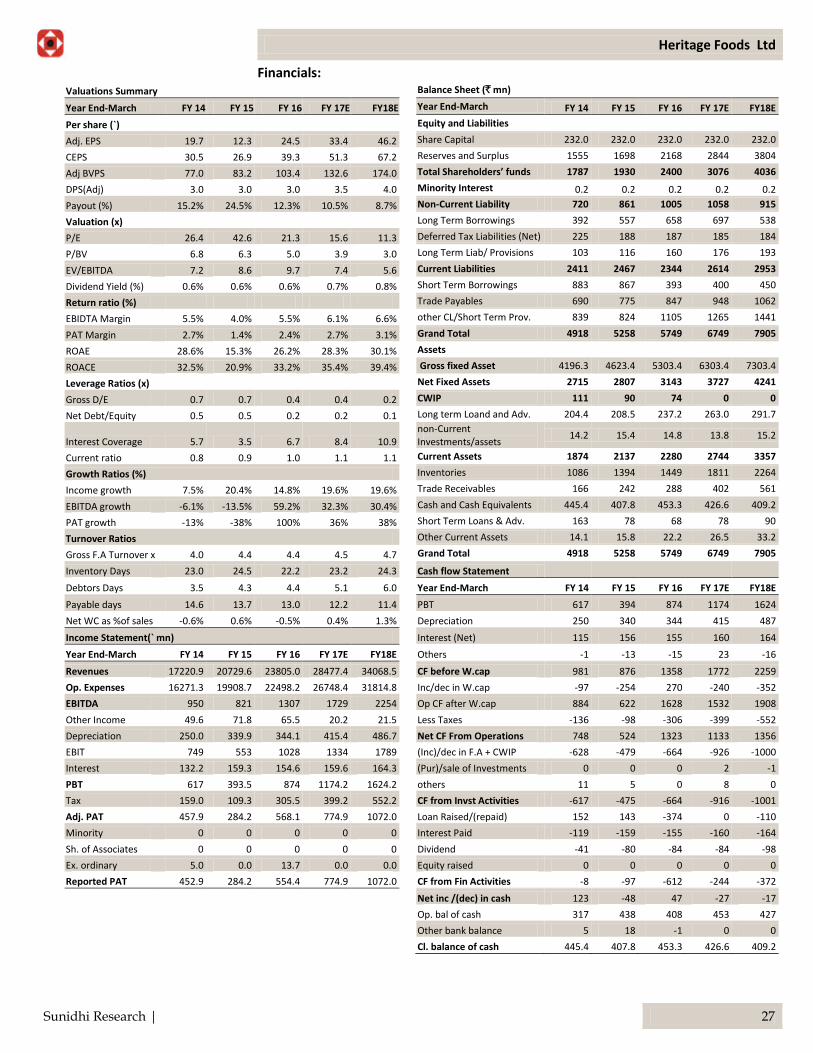
Financials: Valuations Summary Balance Sheet (` mn)
Year End-March FY 14 FY 15 FY 16 FY 17E FY18E
Year End-March FY 14 FY 15 FY 16 FY 17E FY18E
Per share (`)
Equity and Liabilities Adj. EPS 19.7 12.3 24.5 33.4 46.2
Share Capital 232.0 232.0 232.0 232.0 232.0
CEPS 30.5 26.9 39.3 51.3 67.2
Reserves and Surplus 1555 1698 2168 2844 3804
Adj BVPS 77.0 83.2 103.4 132.6 174.0
Total Shareholders’ funds 1787 1930 2400 3076 4036
DPS(Adj) 3.0 3.0 3.0 3.5 4.0
Minority Interest 0.2 0.2 0.2 0.2 0.2
Payout (%) 15.2% 24.5% 12.3% 10.5% 8.7%
Non-Current Liability 720 861 1005 1058 915
Valuation (x)
Long Term Borrowings 392 557 658 697 538
P/E 26.4 42.6 21.3 15.6 11.3
Deferred Tax Liabilities (Net) 225 188 187 185 184
P/BV 6.8 6.3 5.0 3.9 3.0
Long Term Liab/ Provisions 103 116 160 176 193
EV/EBITDA 7.2 8.6 9.7 7.4 5.6
Current Liabilities 2411 2467 2344 2614 2953
Dividend Yield (%) 0.6% 0.6% 0.6% 0.7% 0.8%
Short Term Borrowings 883 867 393 400 450
Return ratio (%)
Trade Payables 690 775 847 948 1062
EBIDTA Margin 5.5% 4.0% 5.5% 6.1% 6.6%
other CL/Short Term Prov. 839 824 1105 1265 1441
PAT Margin 2.7% 1.4% 2.4% 2.7% 3.1%
Grand Total 4918 5258 5749 6749 7905
ROAE 28.6% 15.3% 26.2% 28.3% 30.1%
Assets
ROACE 32.5% 20.9% 33.2% 35.4% 39.4%
Gross fixed Asset 4196.3 4623.4 5303.4 6303.4 7303.4
Leverage Ratios (x)
Net Fixed Assets 2715 2807 3143 3727 4241
Gross D/E 0.7 0.7 0.4 0.4 0.2
CWIP 111 90 74 0 0
Net Debt/Equity 0.5 0.5 0.2 0.2 0.1
Long term Loand and Adv. 204.4 208.5 237.2 263.0 291.7
Interest Coverage 5.7 3.5 6.7 8.4 10.9
non-Current Investments/assets
14.2 15.4 14.8 13.8 15.2
Current ratio 0.8 0.9 1.0 1.1 1.1
Current Assets 1874 2137 2280 2744 3357
Growth Ratios (%)
Inventories 1086 1394 1449 1811 2264
Income growth 7.5% 20.4% 14.8% 19.6% 19.6%
Trade Receivables 166 242 288 402 561
EBITDA growth -6.1% -13.5% 59.2% 32.3% 30.4%
Cash and Cash Equivalents 445.4 407.8 453.3 426.6 409.2
PAT growth -13% -38% 100% 36% 38%
Short Term Loans & Adv. 163 78 68 78 90
Turnover Ratios
Other Current Assets 14.1 15.8 22.2 26.5 33.2
Gross F.A Turnover x 4.0 4.4 4.4 4.5 4.7
Grand Total 4918 5258 5749 6749 7905
Inventory Days 23.0 24.5 22.2 23.2 24.3
Cash flow Statement Debtors Days 3.5 4.3 4.4 5.1 6.0
Year End-March FY 14 FY 15 FY 16 FY 17E FY18E
Payable days 14.6 13.7 13.0 12.2 11.4
PBT 617 394 874 1174 1624
Net WC as %of sales -0.6% 0.6% -0.5% 0.4% 1.3%
Depreciation 250 340 344 415 487
Income Statement(` mn)
Interest (Net) 115 156 155 160 164
Year End-March FY 14 FY 15 FY 16 FY 17E FY18E
Others -1 -13 -15 23 -16
Revenues 17220.9 20729.6 23805.0 28477.4 34068.5
CF before W.cap 981 876 1358 1772 2259
Op. Expenses 16271.3 19908.7 22498.2 26748.4 31814.8
Inc/dec in W.cap -97 -254 270 -240 -352
EBITDA 950 821 1307 1729 2254
Op CF after W.cap 884 622 1628 1532 1908
Other Income 49.6 71.8 65.5 20.2 21.5
Less Taxes -136 -98 -306 -399 -552
Depreciation 250.0 339.9 344.1 415.4 486.7
Net CF From Operations 748 524 1323 1133 1356
EBIT 749 553 1028 1334 1789
(Inc)/dec in F.A + CWIP -628 -479 -664 -926 -1000
Interest 132.2 159.3 154.6 159.6 164.3
(Pur)/sale of Investments 0 0 0 2 -1
PBT 617 393.5 874 1174.2 1624.2
others 11 5 0 8 0
Tax 159.0 109.3 305.5 399.2 552.2
CF from Invst Activities -617 -475 -664 -916 -1001
Adj. PAT 457.9 284.2 568.1 774.9 1072.0
Loan Raised/(repaid) 152 143 -374 0 -110
Minority 0 0 0 0 0
Interest Paid -119 -159 -155 -160 -164
Sh. of Associates 0 0 0 0 0
Dividend -41 -80 -84 -84 -98
Ex. ordinary 5.0 0.0 13.7 0.0 0.0
Equity raised 0 0 0 0 0
Reported PAT 452.9 284.2 554.4 774.9 1072.0
CF from Fin Activities -8 -97 -612 -244 -372
Net inc /(dec) in cash 123 -48 47 -27 -17
Op. bal of cash 317 438 408 453 427
Other bank balance 5 18 -1 0 0
Cl. balance of cash 445.4 407.8 453.3 426.6 409.2
Heritage Foods Ltd
Sunidhi Research | 28
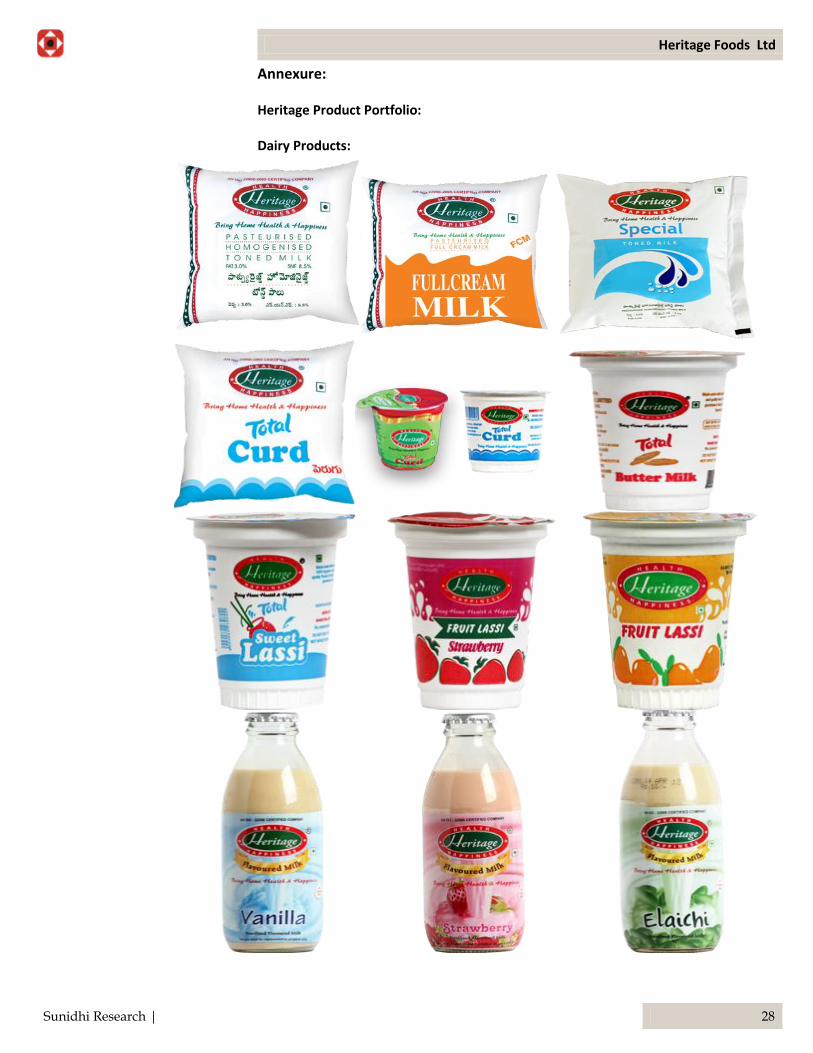
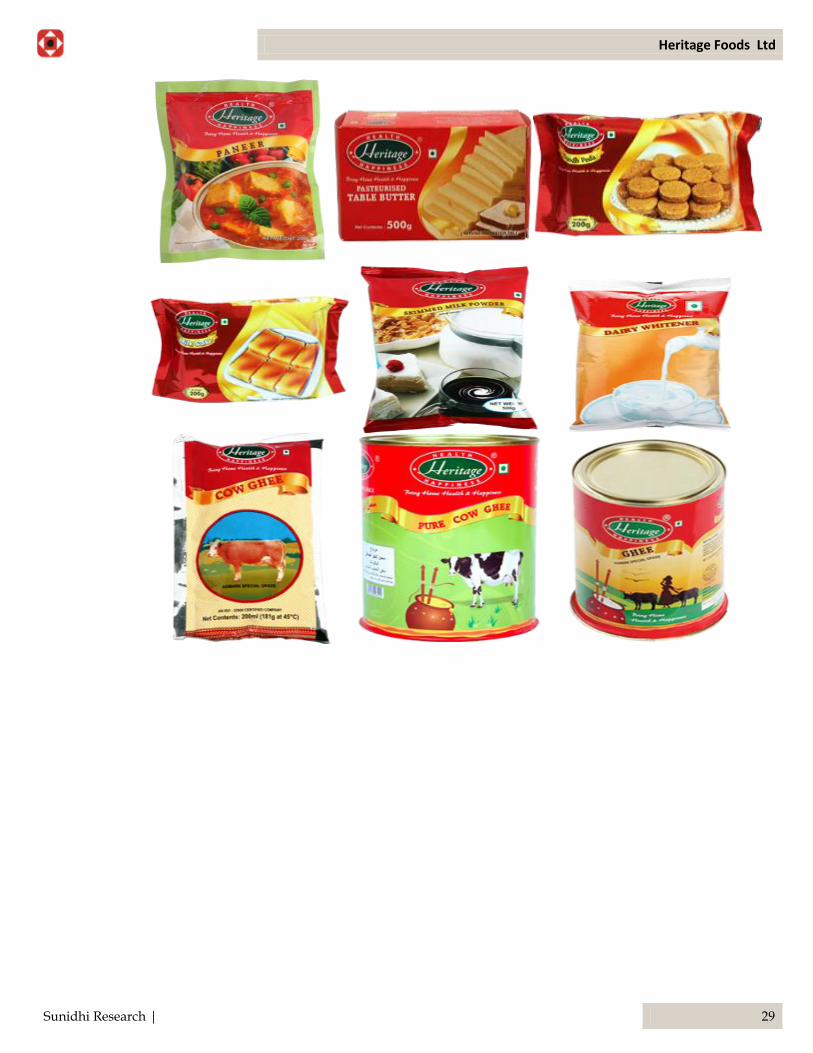
Annexure: Heritage Product Portfolio: Dairy Products:
Heritage Foods Ltd
Sunidhi Research | 29
Heritage Foods Ltd
Sunidhi Research | 30
Disclaimer
This Report is published by Sunidhi Securities & Finance Limited (hereinafter referred to as “Sunidhi”) for private circulation. Sunidhi is a registered Stock Broker with National Stock Exchange of India Limited, BSE Limited and Metropolitan Stock Exchange of India Limited in cash, derivatives and currency derivatives segments. It is also having registration as a Depository Participant with CDSL. Sunidhi has applied for registration as Research Analyst under SEBI (Research Analyst) Regulations, 2014. Sunidhi has other business divisions with independent research teams separated by Chinese walls, and therefore may, at times, have different or contrary views on stocks and markets. Sunidhi or its associates has not been debarred / suspended by SEBI or any other regulatory authority for accessing / dealing in securities Market. Sunidhi or analyst or his relatives do not hold any financial interest in the subject company. Associates may have such interest in its ordinary course of business as a distinct and independent body. Sunidhi or its associates or Analyst do not have any conflict or material conflict of interest at the time of publication of the research report with the company covered by Analyst. Sunidhi or its associates / analyst has not received any compensation / managed or co-managed public offering of securities of the company covered by Analyst during the past twelve months. Sunidhi or its associates has not received any compensation or other benefits from the company covered by Analyst or third party in connection with the research report. Analyst has not served as an officer, director or employee of Subject Company and Sunidhi / analyst has not been engaged in market making activity of the subject company. Analyst or his relatives do not hold beneficial ownership of 1% or more in the subject company at the end of the month immediately preceding the date of publication of this research report. Sunidhi or its associates may have investment positions in the stocks recommended in this report, which may have beneficial ownership of 1% or more in the subject company at the end of the month immediately preceding the date of publication of this research report. However, Sunidhi is maintaining Chinese wall between other business divisions or activities. Analyst has exercised due diligence in checking correctness of details and opinion expressed herein is unbiased. This report is meant for personal informational purposes and is not be construed as a solicitation or financial advice or an offer to buy or sell any securities or related financial instruments. While utmost care has been taken in preparing this report, we claim no responsibility for its accuracy. Recipients should not regard the report as a substitute for the exercise of their own judgment. Any opinions expressed in this report are subject to change without any notice and this report is not under any obligation to update or keep current the information contained herein. Past performance is not necessarily indicative of future results. This report accepts no liability whatsoever for any loss or damage of any kind arising out of the use of all or any part of this report. Each recipient of this document should make such investigations as they deem necessary to arrive at an independent evaluation of an investment in the securities of the companies referred to in this document (including the merits and risks involved), and should consult their own advisors to determine the merits and risks of such an investment. The information in this document has been printed on the basis of publicly available information, internal data and other reliable sources believed to be true, but we do not represent that it is accurate or complete and it should not be relied on as such, as this document is for general guidance only. Sunidhi or any of its affiliates/ group companies shall not be in any way responsible for any loss or damage that may arise to any person from any inadvertent error in the information contained in this report. Sunidhi has not independently verified all the information contained within this document. Accordingly, we cannot testify, nor make any representation or warranty, express or implied, to the accuracy, contents or data contained within this document. While Sunidhi endeavours to update on a reasonable basis the information discussed in this material, there may be regulatory, compliance, or other reasons that prevent us from doing so. Neither Sunidhi nor its directors, employees or affiliates shall be liable for any loss or damage that may arise from or in connection with the use of this information.
Heritage Foods Ltd
Sunidhi Research | 31
Sunidhi’s Rating Rationale The price target for a large capstock represents the value the analyst expects the stock to reach over next 12 months. For a stock to be classified as Outperform, the expected return must exceed the local risk free return by at least 5% over the next 12 months. For a stock to be classified as Underperform, the stock return must be below the local risk free return by at least 5% over the next 12 months. Stocks between these bands are classified as Neutral.
(For Mid & Small cap stocks from 12 months perspective)
BUY Absolute Return >20%
HOLD Absolute Return Between 0-20%
SELL Absolute Return Negative
Apart from Absolute returns our rating for a stock would also include subjective factors like macro environment, outlook of the industry in which the company is operating, growth expectations from the company vis a vis its peers, scope for P/E re-rating/de-rating for the broader market and the company in specific.
SUNIDHI SECURITIES & FINANCE LTD
Member: National Stock Exchange (Capital, F&O & Debt Market) & The Stock Exchange, Mumbai
SEBI Registration Numbers: NSE: INB 230676436 BSE: INB 010676436
Kalpataru Inspire, Unit 1, 8th Floor, Opp. Grand Hyatt Hotel, Santacruz (East), Mumbai 400 055
Tel: (+91-22) 6677 1777 Web-site: http://www.sunidhi.com