heritage and the value of place - historic england
TRANSCRIPT

Heritage and the value of place
13 January 2021

Heritage and the value of place
Document Title: Heritage and the value of place
Date: 13 January 2021
Client Name: Historic England
Author: Lawton, R., Fujiwara, D., Szydlowska, A., Lagarde, A., Radosevic, D., Arber, M., van Emmerik, I.
The authors would like to thank Hasan Bakhshi and John Davies at Nesta and Professor Susana Mourato at LSE for their advice on this project. Simetrica-Jacobs Limited Shepherds Building Charecroft Way Hammersmith London W14 0EE United Kingdom T +44 (0) 0203 883 9249 www.simetrica.co.uk
© Copyright 2020 Simetrica-Jacobs Limited. The concepts and information contained in this document are the property of Simetrica-Jacobs.
Use or copying of this document in whole or in part without the written permission of Jacobs constitutes an infringement of copyright.
Limitation: This document has been prepared on behalf of, and for the exclusive use of Simetrica-Jacobs’ client, and is subject to, and issued
in accordance with, the provisions of the contract between Simetrica-Jacobs and the client. Simetrica-Jacobs accepts no liability or
responsibility whatsoever for, or in respect of, any use of, or reliance upon, this document by any third party.
Heritage and the value of place
3
Table of Contents
1. Executive Summary ........................................................................................................... 5
2. Introduction ..................................................................................................................... 19
3. Review of existing literature .......................................................................................... 24
4. Data and methodology ................................................................................................... 31
4.1 Sampling ....................................................................................................................................... 31
4.1.1 Online sample ............................................................................................................... 31
4.1.2 Face to face sample ..................................................................................................... 32
4.2 Site scoping ................................................................................................................................... 32
4.3 Survey design ............................................................................................................................... 36
4.4 Respondent pre-screening and exclusions .............................................................................. 37
4.5 Valuation scenario 1: Willingness to pay for 'local heritage' .................................................. 39
4.6 Valuation scenario 2: Willingness to pay for 'local heritage' of civic building in a town or city
39
4.7 Analysis: WTP results ................................................................................................................... 40
4.8 Analysis: Benefit transfer ............................................................................................................ 41
5. Results .............................................................................................................................. 44
5.1 Pilot Survey ................................................................................................................................... 45
5.2 Main Results ................................................................................................................................. 46
5.2.1 Socio-demographics .................................................................................................... 46
5.2.2 General pro-heritage attitudes................................................................................... 47
5.2.3 Visits to and conditions of high streets/civic
buildings ........................................................................................................................................ 48
5.2.4 Willingness to Pay values ............................................................................................ 53
5.2.5 Summary ....................................................................................................................... 61
5.3 Benefit Transfer (BT) ................................................................................................................... 64
5.3.1 High Street WTP values ............................................................................................... 66
5.3.2 Civic Building WTP values ............................................................................................ 72
6. Local Heritage Value Bank .............................................................................................. 78
6.1 Worked example .......................................................................................................................... 82
6.1.1 Initial scoping ................................................................................................................ 83

Heritage and the value of place
4
6.1.2 Business case calculation ............................................................................................ 83
6.1.3 Other scenarios where you may want to apply
the Local Heritage Value Bank ................................................................................................... 86
6.2 Methodological considerations ................................................................................................. 87
6.3 Benefit transfer summary recommendations ......................................................................... 89
7. Literature cited ................................................................................................................ 94
8. Appendix A. Summary statistics and statistical WTP analysis ................................... 98
9. Appendix B. Benefit transfer methodology ................................................................ 116
9.1 Value Function Transfer: Transfer adjusted WTP from pooled data .................................. 117
9.2 Transfer error testing ................................................................................................................ 118
Heritage and the value of place
5
1. Executive Summary
• This study develops a set of monetary values for the ‘everyday heritage’ sites that
people use and experience in their local area, such as libraries and high streets. It
does so using metrics and methods consistent with UK Government Treasury Green
Book evaluation guidance (2018).
• Passers-by can get enjoyment from the aesthetic and historic qualities of historic
buildings. This is an important element of the value of heritage to local place-making.
This positive benefit from heritage has not been valued previously in England and is
evidenced for the first time here.
• Surveys were designed to reveal local heritage values for historic high streets and
historic civic buildings from local residents in eight English cities: Bolton,
Huddersfield, Hull, Bristol, Exeter, Lincoln, Norwich, and York.
• Valuations represent the local residents’ Willingness To Pay (WTP) to keep the
heritage site in its current good condition. Four different places across England were
surveyed in each category of:
o Pre-industrial historic high street
o Industrial-era historic high street
o Historic library
o Historic town hall
• WTP values from each of the four places in each heritage category are ‘pooled’ into a
combined sample. This pooled sample can then be transferred to another site via
Benefit Transfer.
• Benefit transfer is the process of taking average WTP values for a category of local
heritage from one research study and transferring it to another high street or civic
building to evidence the value of that place in an economic business case within
acceptable degrees of confidence that this estimate is representative of the historic
place being valued.
• Surveying multiple sites reflects a more robust average value of the historic place and
enables the values to be ‘transfer tested’ to estimate the amount of ‘error’ that is
introduced when transferring to another historic high street or civic building in a
different place.
• Benefit transfer testing of the heritage places surveyed in this study finds that the
Pre-industrial high streets and historic libraries WTP values can be transferred to
historic sites with similar characteristics across the country with confidence (i.e.
acceptably low risk of introducing transfer error). Town hall WTP values should be
adjusted to demographic (socioeconomic) characteristics of the local population.
WTP values for Industrial-era high streets are not robust for benefit transfer as
transfer testing showed that transfer errors are in excess of recommended levels.

Heritage and the value of place
6
• The values contribute to a Local Heritage Bank of Values that can be used by a range
of stakeholders to contribute to the business case in support of England’s local
heritage. Smaller projects can also use the Local Heritage Bank of Values to
understand the value of their historic place without the need of funding a dedicated
data collection and research.
Background
Protecting and preserving heritage is a concern for the public across England and the UK. Recent
research has found that ninety-five percent of adults in England think it is important to look after
historic buildings, seventy-three percent had visited a heritage site over twelve months, over
315,000 people were heritage volunteers, and eighty percent of people thought that local heritage
makes their area a better place to live. 1 Previous research by Historic England has also
demonstrated that people who state they live in historic areas have a stronger sense of place to
their local area than those who do not, corroborating Historic England’s wider place-making
strategy.2 Place-making is a process that shapes our public spaces and buildings, bringing together
communities to improve a place’s cultural, economic, social and environmental situation. This is
assisted through a clear understanding of the historic significance of local areas.
At the same time, a large amount of research in the field of public health and inequalities has been
conducted on how urban environments affect various aspects of wellbeing. This includes, for
example, evidence on the links between greenspace and health,3 and the role of built environment
interventions in addressing fear of crime and mental wellbeing.4
Despite the prominence of heritage in the physical, social, economic and cultural landscapes of
the UK, there remain gaps and limitations in our understanding of how historic places benefit
those who live around them, and what these benefits mean in monetary terms. On a practical
level, there is a need for the value that local heritage sites provide to the public to be quantified in
economic terms in a way that is consistent with HM Treasury Green Book 2018 best practice
guidelines5 to avoid sub-optimal decisions around investments and preservation.
1 Pennington et al. 2019
2 Place-making relates to built heritage and its role in the wider the built environment, with strong linkages to planning and extensions
into ‘place-branding’, whereby local communities use heritage assets to promote a place.
3 Astell-Burt et al. 2014; van den Berg et al. 2015; Nieuwenhuijsen and Khreis 2017
4 Lorenc et al. 2013; Foster et al. 2013; Mappiness research: MacKerron and Mourato 2013
5 H. M. Treasury 2018
Heritage and the value of place
7
Historic England is moving away from a purely assets-based approach towards a mixed asset-
and area-based approach, where the latter focuses on the role of heritage assets in creating
place. Evidence on the value of heritage in local place-making, place-branding, and the
attractiveness of a place to businesses and citizens6 can contribute to the development of Local
Economic Partnerships (LEP) and Local Industrial Strategies. The importance of place and of the
heritage sites within it are part of the competitive advantage of local areas. Evidence on the value
of historic places can be the differentiator for LEPs, and a unique selling point for local people
when describing what is special about their local place. Underlying this argument is the
acknowledgement that monetary values are a very important – although not the only –
consideration in the business case evaluations of government, planning departments, and funders.
By better understanding the value that local people place in different types of heritage building in
their area, it is possible to map heritage’s contribution to place-making, to prioritise investment in
maintenance of those key heritage sites that provide greatest value, and to better communicate
to stakeholders, decision-makers and business case the value of heritage in the place-making
process. In this study the term ‘value’ will refer to local residents’ willingness to pay (WTP) values.
This research fits into the Department for Digital, Culture, Media and Sport (DCMS) Culture and
Heritage Capital Programme (CHC). Culture and heritage capital sits alongside other forms of
capital, as financial, human, social and natural capital to “recognize the distinctive features of
artworks and other cultural goods as capital assets, and to capture the ways in which such assets
contribute, in combination with other inputs, to the production of further cultural goods and
services”.7 Historic places provide both a stock of heritage assets which can be preserved for future
generations, and a flow of benefits to the people and places around them. We explore these
different elements of value further below.
Our approach
This study develops a set of monetary values for the ‘everyday heritage’ sites that people use and
experience around them in their local area using metrics and methods which are consistent with
HM Treasury Green Book evaluation guidance, as required by central/local Government. This is in
line with future Historic England strategies for prioritising HM Treasury Green Book compliant
social and economic research and Historic England’s move to a more area -based approach
treatment of historic places.
A survey of residents (defined as current residents or those who have been resident in the past 3
years) in eight selected cities was designed to collect Willingness to Pay (WTP) for their local
heritage places. The data for this study was collected using a combination of online questionnaires
6 E.g. ‘Heritage Counts 2018 – Heritage in Commercial Use’ 2018
7 Throsby 1999

Heritage and the value of place
8
and face to face (F2F) interviews. The aim of the survey is to produce a set of estimates of WTP
values for different categories of heritage. This will provide an evidence base in the form of a Value
Bank which can be applied to other historic places to understand their economic value, without
the need of funding a dedicated data collection and research.
Throsby8 outlines how the economic value of heritage can be divided into three identifiable ways
in which individuals experience heritage - use, non-use, or as a beneficial externality. The Total
Economic Value of a heritage site is made up of all three: a combination of use value (benefits
derived from either direct or indirect use of the good being valued, usually including option value
associated with the possibility of using the good in future) and non-use value (existence or bequest
value associated with knowing that others may benefit from the good). The third type of value that
people can experience from heritage derives from the fact that heritage may generate positive
spillovers, or externalities. Heritage buildings generate a beneficial externality if passers-by enjoy
their aesthetic or historic qualities. This beneficial externality is an important element of the value
of heritage to local place-making. The positive spillovers from heritage are an identifiable and
potentially significant value of heritage that accrues to individuals. Although in principle the
economic value of such a benefit could be estimated, in practice it seldom is. This is an important
new contribution of this report, and one that can arguably only be captured through asking
residents to state their preferred WTP value (i.e. Stated Preference (SP) methods).
This study elicited local heritage values for eight English cities: Bolton, Huddersfield, Hull, Bristol,
Exeter, Lincoln, Norwich, and York. The study provides estimated values for the following types of
heritage places within these cities:
High streets
Not all historic high streets are the same. To capture the difference between the heritage value of
high streets of different historical character, we elicit separate values for high streets in cities that
are broadly classified as Pre-industrial (towns/cities which contain some architecture dated before
the nineteenth century) or Industrial-era (those containing no or few buildings aged before 1800,
and predominantly constructed in the industrial era of the nineteenth century).
8 Throsby 2019
Heritage and the value of place
9
• Historic high streets in Industrial-era cities, based on four survey sites:
Bolton Churchgate / Deansgate; Huddersfield King Street; Hull Whitefriargate;
Bristol Corn Street/ Clare Street
• Historic high streets in Pre-industrial cities, based on four survey sites:
Exeter High Street; Lincoln High Street; Norwich Pottergate / Bedford Street;
York Stonegate
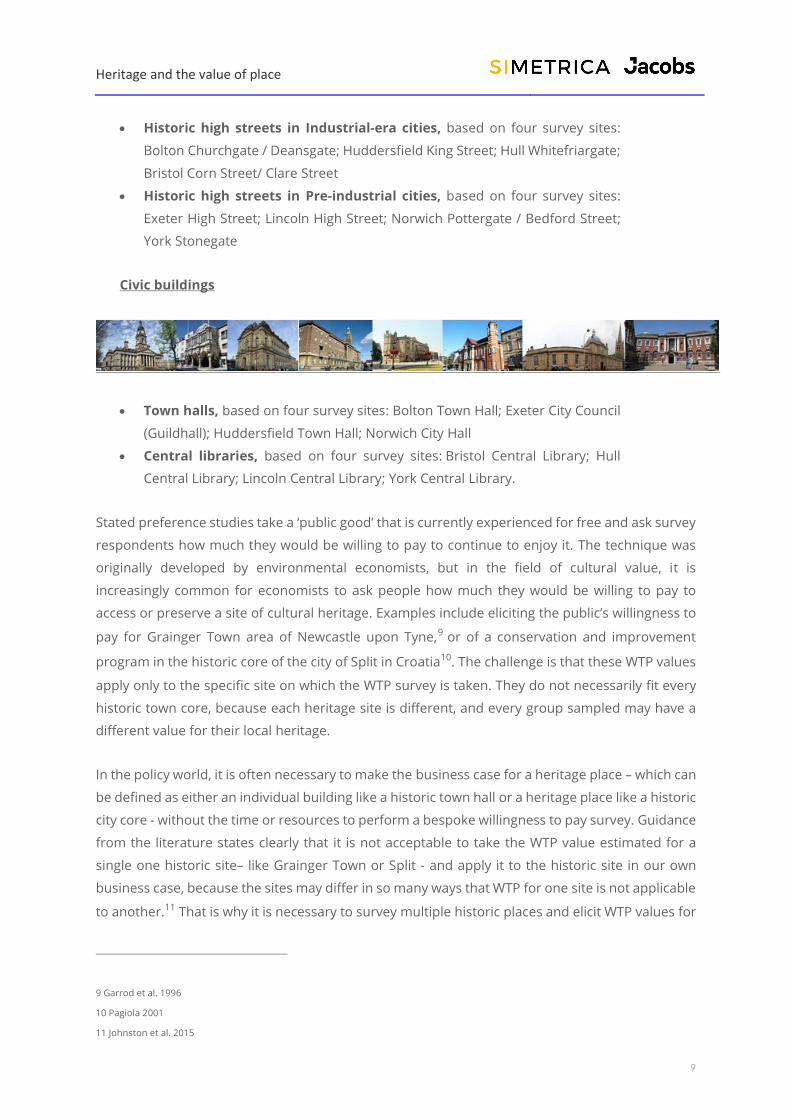
Civic buildings
• Town halls, based on four survey sites: Bolton Town Hall; Exeter City Council
(Guildhall); Huddersfield Town Hall; Norwich City Hall
• Central libraries, based on four survey sites: Bristol Central Library; Hull
Central Library; Lincoln Central Library; York Central Library.
Stated preference studies take a ‘public good’ that is currently experienced for free and ask survey
respondents how much they would be willing to pay to continue to enjoy it. The technique was
originally developed by environmental economists, but in the field of cultural value, it is
increasingly common for economists to ask people how much they would be willing to pay to
access or preserve a site of cultural heritage. Examples include eliciting the public’s willingness to
pay for Grainger Town area of Newcastle upon Tyne,9 or of a conservation and improvement
program in the historic core of the city of Split in Croatia10. The challenge is that these WTP values
apply only to the specific site on which the WTP survey is taken. They do not necessarily fit every
historic town core, because each heritage site is different, and every group sampled may have a
different value for their local heritage.
In the policy world, it is often necessary to make the business case for a heritage place – which can
be defined as either an individual building like a historic town hall or a heritage place like a historic
city core - without the time or resources to perform a bespoke willingness to pay survey. Guidance
from the literature states clearly that it is not acceptable to take the WTP value estimated for a
single one historic site– like Grainger Town or Split - and apply it to the historic site in our own
business case, because the sites may differ in so many ways that WTP for one site is not applicable
to another.11 That is why it is necessary to survey multiple historic places and elicit WTP values for
9 Garrod et al. 1996
10 Pagiola 2001
11 Johnston et al. 2015

Heritage and the value of place
10
each of them. This approach has been previously adopted by the European Union12, and the
DCMS13, as it provides WTP values which can be transferred in a more statistically robust way,
since valuing multiple sites will reduce the likelihood of one site drastically influencing the
averaged value of all the sites. That is, no single site can bias the results by being substantially
different to the historic place to be valued in the business case.
When multiple sites have been surveyed, the average WTP values for each site can be ‘pooled’ into
a combined sample. This ‘pooled WTP’ for a particular type of heritage site or place can then be
transferred to another site or place with greater confidence that it is representative of the type of
historic site or place being valued in the business case.
The objective of this study is to survey four heritage sites within each category of high street and
civic building, in order to combine the average WTP values for each site into a ‘pooled WTP’ value,
which can then be reliably transferred to comparable high streets or civic buildings in England.
This has applications for developing business cases for government and local councils,
constructing funding calls, and responding to planning consultations.
Valuations for the local heritage sites obtained in the survey represent the local residents’
willingness to pay to keep the heritage site in its current good condition.14 The survey presents
respondents with a hypothetical scenario where a local trust would be set up to maintain the
historic sites, due to a shortfall in public funding. The survey collects two kinds of WTP values for
each city: one on the value of the historic high street and another for specific historic civic buildings
within the city.
A number of statistical tests must be run on the WTP values to ensure that the WTP values can be
robustly ‘transferred’ to other sites. This process is called ‘benefit transfer’ and the statistical
analysis tests for ‘transfer error’. This process is explained in more detail below.
Willingness to pay results
This study produces WTP values for two types of high streets: Those originating from the Pre-
industrial revolution era (pre 1800) cities (Pre-industrial), and those from post 1800 (Industrial-era)
cities. Note that in all cases we take a more conservative estimate of WTP based on the lower
bound 95% confidence interval. This lower bound provides a representation of the lowest value
that average WTP could reasonably have based on distribution of values within the sample. For
the purposes of realism when transferring to external business cases, it is recommended to take
12 Mourato et al. 2014
13 Lawton et al. 2018
14 This is on the basis of evidence from the survey that a high proportion of residents considered the sites to be in this state.

Heritage and the value of place
11
this lower bound to correct for the features of the hypothetical survey (explained in more detail in
Methodological Considerations below):
• The WTP estimate is £7.80 to maintain the historic character of Pre-
industrial high streets in good condition per household per year. This is
based on a pooled dataset of WTP values for four Pre-industrial high streets.
The average WTP value for the four pooled Pre-industrial high streets is £9.28,
with a range of average WTP values from £8.61 to £13.07 for each high
street.15
• The WTP estimate is £6.31 to maintain the historic character of
Industrial-era high streets in good condition per household per year. This
is based on a pooled dataset of WTP values for four Industrial-era high streets.
The average WTP value for Industrial-era high streets is £8.51, with a range of
average WTP values from £3.34 to £11.63 for each high street. The wider range
for Industrial-era compared to Pre-industrial high streets indicates that there
is more variation between Industrial-era high streets in our sample than Pre-
industrial high streets. We explore the effect this has on transferability of the
values to other high streets later in this report.
This study also produces WTP values for two types of historic civic buildings: town halls and public
libraries. Historic civic building WTP values combine users and non-users in the sample, with
controls for any difference in the values obtained, but exclude those who have never heard of the
building. We must also account for the fact that some respondents may have direct use benefits
if they have previously accessed the building and made use of its services. We designed the survey
instrument to ask respondents to think only of the heritage value of the building itself. The
estimated WTP values were:
• The WTP estimate is £5.73 to maintain the historic character of town
halls in good condition per household per year. This is based on a pooled
dataset of WTP values for four historic town halls. The average WTP value for
four pooled town halls is £7.29, with a range of average WTP values from £4.47
to £9.04 for each town hall.
• The WTP estimate is £7.67 to maintain the historic character of libraries
in good condition per household per year. This is based on a pooled dataset
of WTP values for four historic libraries. The average WTP value for the four
15 In all cases the possible WTP responses include both positive values and non-positive (zero) values, in line with best practice, ensuring
that those who have no actual value for the site are also represented in the study.

Heritage and the value of place
12
pooled libraries is £9.79, with a range of average WTP values from £7.76 to
£13.49 for each library.
This higher WTP for libraries in comparison to town halls may be related to peoples’ being more
likely to visit libraries (21% do so more than once a month) compared to town halls (12% visit more
than once a month). Additional analysis in this report shows that WTP for historic libraries is
positively associated with regular library usage. These results indicate that more regular users
hold higher values for the historic library, which aligns with theoretical expectations.
Benefit transfer: A bank of values for local heritage
Benefit transfer is the process of taking average WTP values for a category of local heritage (for
instance, high streets or civic buildings) from one research study (such as this report) and
transferring it to another high street or civic building. A set of tests are conducted to help ensure
that this transfer will provide robust values when applied to a new site enabling the values to be
used in business cases.
In statistics as a sample size grows, the average gets closer to the ‘true’ average of the whole
population. Surveying multiple similar heritage sites in each category of high street and civic
building, rather than one, gives greater confidence that the WTP values are representative of ‘an
average historic site of that type’.
Some error will always be introduced through benefit transfer because no two heritage sites are
the same in characteristics. It is recommended to statistically test how much error is created when
transferring from the ‘study sites’ (the historic high streets and civic buildings surveyed as part of
this study) to a hypothetical ‘policy site’, which would be the historic high street or civic building
that needs to be valued for a business case (or other purpose) but for which WTP values have not
previously been estimated. To do this - and following best practice in European Union and UK
Government studies16 - a set of transfer tests are run that sequentially places one of the study
sites in the role of an unknown ‘policy’ site and predicts the WTP for this site, based on the pooled
WTP values from the other remaining ‘study sites’. Transfer tests tell us the amount of ‘error’ that
is introduced via the transfer. A certain amount of error is expected, but WTP values should only
be transferred to other sites if they are within acceptable levels of error, which is recommended
at 40% in the literature.17
The procedure as described above is known as ‘simple’ unit transfer. In addition to ‘simple’ benefit
transfer, which takes an average WTP from the average WTP of all of the four sites surveyed, there
16 Lawton et al. 2018; D. Fujiwara et al. 2018; S. Mourato et al. 2014
17 Ready and Navrud 2006

Heritage and the value of place
13
are also more sophisticated transfers which allow the analyst – the person calculating the business
case for the heritage site – to adjust the WTP values to the characteristics of that site, such as
income or other demographic or geographic data. This has the potential to adjust the WTP value
to make it more tailored to the specific characteristics and local population of the historic place.
However, adjusted or function transfers also introduce more statistical complexity, and this can
increase the risk of transfer errors. It is therefore necessary to test for the amount of error
introduced using each of the three types of benefit transfer: simple, adjusted, and function
transfer.
1. Simple unit value transfer, where average WTP is taken from this study and applied
directly to a business case for another historic place without any adjustments for the
specific context of that historic place.
2. Adjusted unit value transfer, where the transfer accounts for differences in
characteristics between the heritage sites used in the Local Heritage Value Bank and
another historic place.
3. Benefit function, where WTP from the Local Heritage Value Bank is
adapted to fit multiple characteristics of the historic place in a business
case, such as sociodemographic characteristics of visitors and the
surrounding population and other measurable characteristics.
Transfer testing in this report enables evidence-based conclusions about the most appropriate
transfer method for each category of local heritage in the Local Heritage Value Bank. The Local
Heritage Value Bank table summarises the key findings of this study and provides guidance for
people who want to use the values in their business case assessments.
Benefit transfer testing of the heritage sites surveyed in this study finds that the Pre-industrial high
streets and historic libraries WTP values can be transferred to comparable historic sites across the
country with acceptably low risk of introducing transfer error. Historic town hall WTP values can
be transferred only with adjustment to population demographics (socioeconomic) of the local
population in business cases. As is always the case with benefit transfer methods, it is necessary
to acknowledge that some error will be introduced when transferring values. This is labelled clearly
in the reporting: The overall findings were:
• For Pre-industrial high streets transfer errors (TE) are safely below the
acceptable level of transfer error using any of the three transfer methods.
Conclusion: WTP values for Pre-industrial cities can be transferred to
comparable sites with relatively low risk of transfer error.
• Historic libraries: Transfer errors are at or below the acceptable levels of
transfer error for simple and adjusted transfer methods. Conclusion: WTP
Heritage and the value of place
14
values for historic libraries can be transferred to comparable sites with
acceptable risk of transfer error using these two methods, but not
recommended for function transfer method.
• In some cases, such as town halls, acceptable levels of transfer error are
achieved only with adjustment to the income differentials between towns
(adjusted transfer method). Conclusion: Caution should be applied when
transferring these values, and only with consideration of the income
differences between the study town halls and the business case site.
• Even more caution should be applied to Industrial-era high streets, where
transfer errors were outside of the acceptable level with all transfer methods.
Industrial-era high street WTP should not be transferred to other sites,
because the WTP values varied too much between the four sites surveyed to
provide a robust average WTP value that can be considered representative of
other Industrial-era high streets in the country. Conclusion: WTP values be
seen only as indicative of the values that people hold for these four particular
Industrial-era high streets, and not for Industrial-era high streets as a whole.
Detailed reporting of transfer errors can be found in Section 5.3 of the report.
Methodological considerations and application to business cases
The final Local Heritage Bank of Values table presents pooled WTP values for local heritage sites –
Pre-industrial and Industrial-era high streets, historic libraries and historic town halls. The
summary table below shows which WTP values for local heritage values are robust for benefit
transfer and under which methods. The table includes the key findings from transfer testing to
enable practitioners to apply the heritage values more widely in their value for money and
business case calculations.
The Local Heritage Value Bank can be used by a range of stakeholders and contribute to
business cases in support of England’s local heritage:
• Local residents: WTP value estimates for local heritage sites that can be used
in public consultations and planning decisions, to demonstrate the value of
local heritage in monetary terms to be included in business case benefit cost
analysis.
• Local and National Government: The values produced can be applied to
Government business cases to quantify the benefits associated with the
preservation and maintenance of historic places at the local level. WTP values
can be aggregated to the national level to provide estimates of the overall
social welfare generated by local heritage. This evidence can be used when
presenting evidence in the planning process for large national infrastructure
projects impacting on heritage sites. This research will be of relevance to

Heritage and the value of place
15
audiences in central government; as well as Local Authorities and Local
Economic Partnerships.
• Historic England: The Local Heritage Value Bank provides an evidence base
demonstrate the benefits of local heritage places and their role in place
making and community and social values. This will provide an off-the-shelf set
of values for application in future heritage case studies as well as future
cultural heritage capital accounts. By better understanding the value that local
people place in different types of heritage building in their area, it is possible
to map their contribution to place-making, to prioritise investment in
maintenance of those key heritage sites that provide greatest value, and to
better communicate to stakeholders, decision-makers and business case the
value of heritage in the place-making process.
The final section of the report provides a worked example of how to apply values from the Local
Heritage Value Bank to your own business case for the value of historic places to local populations.
We outline the considerations that should be taken when applying these values into business
cases for local heritage.
• It is important that business cases be evidenced in a realistic way, to prevent
over-attribution of value to the historic place in your business case.
• Business cases should base their calculations on a realistic catchment of the
local population. An unrealistically large catchment area will lead to over-
estimation of value, which will reduce the robustness of the results. WTP
values should be aggregated to the number of households in the local area.
The appropriate local catchment area is to some extent subjective. In the
survey, it is defined as the geographical area within which residents are likely
to have heard of or walked past the heritage site. We therefore urge business
cases to err on the side of caution and limit the local area catchment area to
households within the direct Local Authority district.
As outlined above, some transfer error will always be introduced when taking WTP values from
study sites (the Local Heritage Value Bank) to a business case site. This can partly be addressed by
selecting only those transfer methods which have been tested and produce acceptable levels of
error. Other considerations relate to the statistical robustness of the WTP results, which we
summarise below.
• It is standard practice to test the ‘internal validity’ of WTP data by testing that
WTP is driven by theoretically consistent factors such as income and indicators
of engagement with heritage. In the pooled high street and civic building
samples (where sites within each of the four categories are combined) there
is a statistically significant association between WTP and these factors, giving

Heritage and the value of place
16
good confidence in the robustness of the pooled WTP values for benefit
transfer.
• There is also some evidence of respondents interpreting the valuation
scenario in a different way to intended in these surveys. These kind of
information effects and biases are common in stated preference (SP) surveys
and the survey attempted to minimise their effects through careful survey
design. Despite these design considerations, statistical tests show that those
who regularly visit libraries and use their services report a higher WTP to
maintain the historic library building in good condition. This aligns with
theoretical expectations, that greater familiarity with a heritage place would
lead to greater values for its maintenance. However, it is not possible to
discount the possibility that people’s stated value is at least partially
influenced by the use of those services, which, if true, would lead to an
inflation of WTP values (since the services themselves provide direct benefits
to those users). The same is true of town halls, although a smaller proportion
of the sample group had used their services. While the design of the survey
instructed respondents to ignore the services provided when stating their
maximum WTP, it is impossible to test that some conflation has not occurred.
This is always a challenge when valuing ‘quasi-market’ goods that have both
direct user services and indirect spillover benefits to the local place.
• Finally, an important factor that can affect the robustness of CV surveys occurs
if respondents are insensitive to the scope of the good being valued. In other
words, if someone is presented with a scenario for preserving a single heritage
site or one for preserving 100 heritage sites, the amount they are willing to
pay would be reasonably expected to differ in magnitude in each case. This
would be detected if respondents state a similar WTP in both situations,
suggesting that their responses are insensitive to the number of sites being
valued. In this study there is some evidence of possible insensitivity to scope,
due to the fact that WTP values for the historic character of a high street (which
contains many historic buildings) is not significantly higher than WTP values
for individual civic buildings. However, it is not 100% clear that this is an
insensitivity to scope issue, as it could be that people consider their civic
buildings more valuable in isolation – perhaps due to their iconic role within
the place-making of the city – than many of the historic buildings in a high
street. Follow-up questions may provide supporting evidence, albeit with the
familiar lack of certainty about a respondents’ complex motivations for being
willing to pay. A third of respondents stated that their WTP value is an
expression of their pro-heritage beliefs and their broader interest in
preserving all heritage in the city, which could lead to some inflation of the
WTP estimates. In extreme cases, such respondents could be excluded from
the sample. However, given that follow-up questions do not fully explain the

Heritage and the value of place
17
motivations behind WTP, it is not advisable to reduce the sample in this way,
as it reduces the predictive power of the benefit transfer tests.
• For the purpose of benefit transfer, it is recommended that business
cases use the more conservative lower bound WTP values. Lower bound
WTP is estimated as the lower limit 95% confidence interval around the
mean WTP. This is to account for the fact that mean WTP is likely to be
inflated by the inclusion of direct use values for those who use the sites
for services and possible insensitivity to scope. This means that average
WTP may not be the most accurate estimate for external use, so we
recommend taking the lower bound WTP for benefit transfer.
The use of geographical data like the Historic England PointX Asset Register and Ordnance Survey
Open Map enables the researcher to incorporate external data on the characteristics of each of
the sites surveyed that could potentially explain variation in WTP and therefore affect transfer
testing. This analysis provides a major contribution to the benefit transfer literature and with its
use of the ever-growing body of geographical open data, will provide much greater transferability
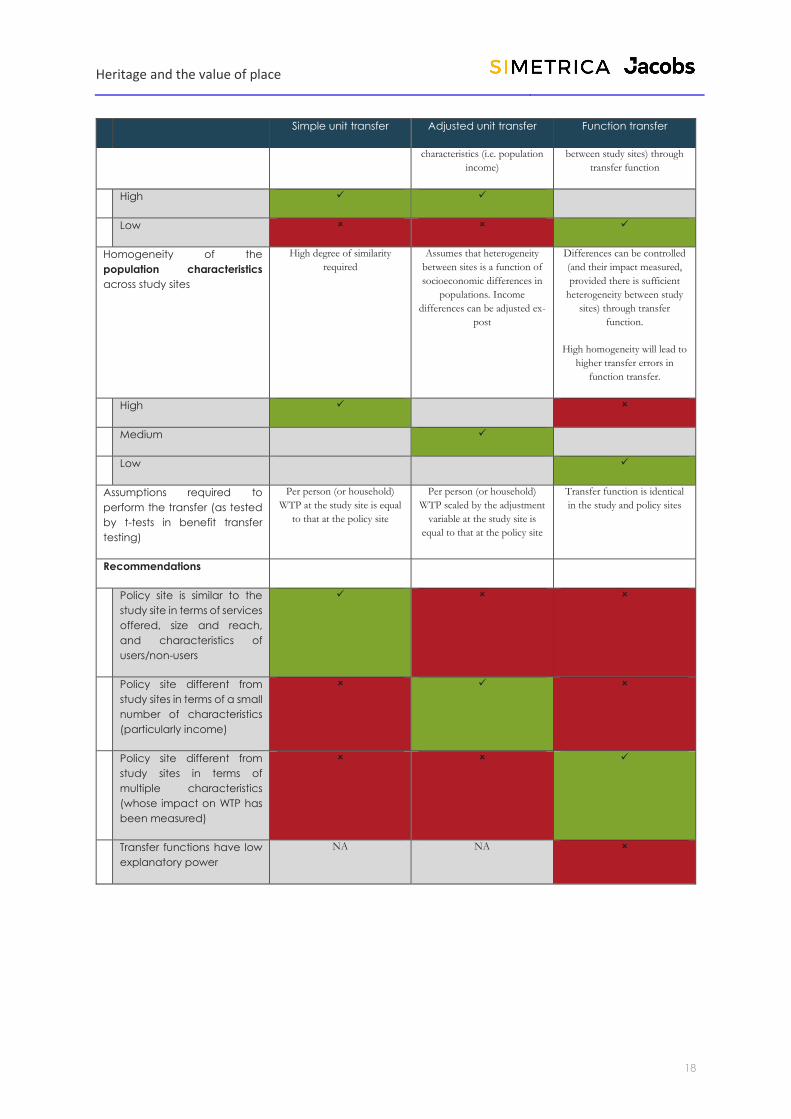
of values using function transfer. Table 1-1 summarises the main advantages and disadvantages
of the three benefit transfer methods below, outlining our recommendation as to the contexts in
which these benefit transfer methods work best.
Table 1-1 Benefit transfer summary and recommendation
Simple unit transfer Adjusted unit transfer Function transfer
Data availability /
requirements
No additional data required Only aggregate data on the
adjusted characteristic at policy
and study sites required
Transfer function needs to be
estimated at study sites;
Corresponding data for policy
site required to make
prediction
Low ✓
Medium ✓
High ✓
Similarity between policy and
study sites
High degree of similarity
required
Difference in a single
characteristic (usually income
levels) may be adjusted
Differences in multiple
characteristics may be adjusted
to produce more context-
sensitive benefit transfers
High ✓
Medium ✓
Low ✓
Homogeneity of the good
valued across study sites
High degree of similarity
required
High degree of similarity
required;
Adjustment usually based on
population not site
Differences can be controlled
(and their impact measured,
provided that site-specific data
exists and that there is
sufficient heterogeneity
Heritage and the value of place
18
Simple unit transfer Adjusted unit transfer Function transfer
characteristics (i.e. population
income)
between study sites) through
transfer function
High ✓ ✓
Low ✓
Homogeneity of the
population characteristics
across study sites
High degree of similarity
required
Assumes that heterogeneity
between sites is a function of
socioeconomic differences in
populations. Income
differences can be adjusted ex-
post
Differences can be controlled
(and their impact measured,
provided there is sufficient
heterogeneity between study
sites) through transfer
function.
High homogeneity will lead to
higher transfer errors in
function transfer.
High ✓
Medium ✓
Low ✓
Assumptions required to
perform the transfer (as tested
by t-tests in benefit transfer
testing)
Per person (or household)
WTP at the study site is equal
to that at the policy site
Per person (or household)
WTP scaled by the adjustment
variable at the study site is
equal to that at the policy site
Transfer function is identical
in the study and policy sites
Recommendations
Policy site is similar to the
study site in terms of services
offered, size and reach,
and characteristics of
users/non-users
✓
Policy site different from
study sites in terms of a small
number of characteristics
(particularly income)
✓
Policy site different from
study sites in terms of
multiple characteristics
(whose impact on WTP has
been measured)
✓
Transfer functions have low
explanatory power
NA NA

Heritage and the value of place
19
2. Introduction
Overview
• This study develops a set of monetary values (Local Heritage Value Bank) for
the ‘everyday heritage’ sites that people use and experience around them in
their local area.
• It applies metrics and methods which are consistent with UK Government
evaluation guidance, in line with Historic England’s strategies for prioritising
HM Treasury Green Book (2018) compliant social and economic research.
• Evidence of the value of local heritage places to the local population
corresponds to a wider shift in the heritage sector from a purely assets-based
approach to a mixed asset- and area-based approach, where the latter focuses
on the role of heritage sites in creating place.
• Willingness to pay (WTP) values elicited in a hypothetical Stated Preference
survey represent local residents’ valuation of keeping the heritage site in its
current good condition for historic high street and civic buildings.
• The Local Heritage Value Bank developed in this study will contribute to the
growing evidence base in Government and the wider sector, providing a set of
values that can be transferred to comparable heritage sites throughout the
country.
Protecting and preserving heritage is a vital concern for the public across England and the UK.
Recent reviews have found that ninety-five percent of adults in England thought it is important to
look after historic buildings, seventy-three percent had visited a heritage site over twelve months,
over 315,000 people were heritage volunteers, and eighty percent of people thought that local
heritage makes their area a better place to live.18 At the same time, a large amount of research in
the field of public health and inequalities has been conducted on urban determinants of various
aspects of wellbeing. This includes, for example, reviews of theory and evidence on associations
between greenspace and health,19 and the role of built environment interventions in addressing
fear of crime and mental wellbeing. 20 Previous research by Historic England has also
demonstrated that people who state they live in historic areas have a stronger sense of place to
18 Pennington et al. 2019
19 Nieuwenhuijsen and Khreis 2017
20 Lorenc et al. 2013; Foster et al. 2013

Heritage and the value of place
20
their local area than those who do not, corroborating Historic England’s wider place-making
strategy.21
Despite the prominence of heritage in the physical, social, economic and cultural landscapes of
the UK, there remain gaps and limitations in our understanding of how historic places and sites
benefit those who live around them, and what these benefits mean in monetary terms. On a
practical level, there is a need for evidence of the value that local heritage sites provide to the
public which may, when quantified in economic terms following HM Treasury Green Book best
practice guidelines,22 be used to:
• support bringing the value of local heritage places into consideration in
business cases, which is of particular importance where business cases are
required for heritage sites, but monetary values (e.g. entry fees) do not
currently exist;
• mitigate against growing development pressures that may involve risks to
local heritage places;
• inform funding decisions regarding maintenance of heritage sites, especially
in light of the continued constraints on local authority budgets;
• promote recognition of the value of heritage in place-making among local
individuals and economic partnerships.
This study develops a set of monetary values (Local Heritage Value Bank) for the ‘everyday heritage’
sites that people use and experience around them in their local area using metrics and methods
which are consistent with HM Treasury Green Book evaluation guidance, as required by
central/local Government. This is in line with Historic England’s strategies for prioritising HM
Treasury Green Book compliant social and economic research. It also accords with a wider
direction of travel in the heritage sector from an assets-based approach to an area-based
approach, which shifts from a purely assets-based approach to a mixed asset- and area-based
approach, where the latter focuses on the role of heritage assets in creating place. This links
with central government policy, such as the BEIS Local Industrial Strategy and the What Works
Centres for Local Economic Growth. Evidence on the value of heritage in local place-making, place-
branding, and the attractiveness of a place to businesses and citizens23 can contribute to the
development of Local Economic Partnerships (LEP) and Local Industrial Strategies. The importance
of place, and of the heritage sites with it are part of the competitive advantage of local areas.
21 Place-making relates to built heritage and its role in the wider the built environment, with strong linkages to planning and extensions
into ‘place-branding’, whereby local communities use heritage assets to promote a place.
22 H. M. Treasury 2018
23 E.g. ‘Heritage Counts 2018 – Heritage in Commercial Use’ 2018

Heritage and the value of place
21
Evidence on the value of heritage sites can be the differentiator for LEPs, and a unique selling point
for local people when describing what is important and valuable about their local place.
This study focuses on three types of local heritage place: 1. The high street, 2. The town library, 3.
The town hall.
Historically high streets have formed the cultural centre of towns and cities. They also often
contain a high concentration of historic listed buildings, which provide a distinct character and
sense of place. Despite being so rooted in our history, high streets in England are facing new
challenges and many are struggling to thrive. Many towns and cities across England are
experiencing a decline of their traditional high streets, exacerbated by competition from shopping
centres and online retailers.24 The Local Data Company found that 11% of retail premises in the
UK were vacant in the second half of 2017.25 Without a tenant in occupation, there is higher risk
of a building falling into disrepair.
Historic civic buildings such as libraries and town/city/guild halls are often the oldest and most
iconic buildings in a town centre, designed by renowned local or national architects of the day, and
representing sites of important cultural history for the area. However, these buildings can be
expensive to maintain, and this is forcing some councils to close them down, moving the public
services they provided to cheaper buildings. These new challenges mean that, despite their
importance, many historic civic buildings in England fall into disrepair. This can raise particular
concerns for communities where the historic civic building has been emblematic of the local area
and accessible to the public for a long time.
Willingness to pay (WTP) values elicited in the survey represent local residents’ valuation of keeping
the heritage site in its current good condition. The survey presents a hypothetical scenario where
a local trust would be set up to maintain the historic sites, due to a shortfall in public funding. It
collects two WTP values in each survey: one on the value of the historic high street and another
about the individual historic civic building within the city.
This research fits into the Department for Digital, Culture, Media and Sport (DCMS) Culture and
Heritage Capital Programme (CHC). Culture and heritage sits alongside other forms of capital, as
financial, human, social and natural capital, to “recognize the distinctive features of artworks and
other cultural goods as capital assets, and to capture the ways in which such assets contribute, in
combination with other inputs, to the production of further cultural goods and services”.26 Historic
24 Other factors identified in public debate as contributing to the high street decline include: slow wage growth in comparison to inflation,
rising overhead costs and debt burden, past over-expansion and changing customer preferences (see e.g. Thomas 2018).
25 https://researchbriefings.files.parliament.uk/documents/SN06186/SN06186.pdf
26 Throsby 1999
Heritage and the value of place
22
places provide both a stock of heritage assets which can be preserved for future generations, and
a flow of benefits to the people and places around them.
• Throsby27 outlines how the economic value of heritage can be divided into
three identifiable ways in which individuals experience heritage - use, non-use,
or as a beneficial externality. The Total Economic Value of a heritage site is
made up of all three: a combination of use value (benefits derived from either
direct or indirect use of the good being valued, usually including option value
associated with the possibility of using the good in future) and non-use value
(existence or bequest value associated with knowing that others may benefit
from the good). The third type of value that people can experience from
heritage derives from the fact that heritage may generate positive spillovers,
or externalities. Heritage buildings give rise to a beneficial externality if
passers-by gain from observing their aesthetic or historic qualities. This
beneficial externality is an important element of the value of heritage to local
place-making. Although in principle the economic value of such a benefit could
be estimated, in practice it seldom is. This is an important new contribution of
this report, and one that can arguably only be captured through asking
residents to state their preferred WTP value (i.e. Stated Preference methods).
Historic high street and civic building WTP values represent a combined ‘use,
non-use, and positive spillover values held by local residents’ who are familiar
with the site (we exclude pure ‘non-users’ who have not heard of the high
street or civic building).28
• Historic civic building WTP values combine those who have directly used the
library/town hall services, with controls for any difference in the values
obtained, but exclude those who have never heard of the building.
This study employs Benefit Transfer (BT) methods which produce WTP values that can be applied
to comparable heritage sites without the need for additional new and costly primary data
collection, survey design, and analysis. Benefit transfer is the process of taking average WTP values
for a category of local heritage (for instance, Pre-industrial high streets or civic buildings) from one
research study (such as this one) and transferring it to another high street or civic building, with
confidence that it will be a robust representation of the value that people would state for that
heritage site if they were asked. It offers a means to provide policy-useful values in a fast and cost-
effective way, by taking the estimated average WTP values from sites (study sites) and applying
27 Throsby 2019
28 Familiarity was ascertained using the name of the site.

Heritage and the value of place
23
them to another site (policy site) or transferring the information from the study site to the policy
site regarding the relationship between WTP and a number of explanatory variables.
There have been previous attempts to assess the scope of BT techniques in the heritage sector.29
Simetrica and Nesta’s research for the Department for DCMS and the Arts and Humanities
Research Council (AHRC) has produced WTP estimates for regional museums, historic townscapes,
and cathedrals,30 with ongoing research looking at cultural festivals, local museums, regional
galleries, and theatres. There is also a clear policy demand and sectoral need for robust value
estimates for heritage sites and the role they play in place-making.31
The Local Heritage Value Bank developed in this study will contribute to the growing
evidence base in Government and the wider sector, providing a set of values that can be
transferred to comparable sites throughout the country. Underlying this argument is the
acknowledgement that monetary values are a very important – though not the only –
consideration in the business case evaluations of government, planning departments, and funders.
The research also contributes to the broader debate about the value of local heritage to
society. While there is growing interest in the role of heritage sites in place-making and local
economic growth, these are not always pursued in a cohesive way. We hope that the valuation
work outlined in this report can provide an evidence base to catalyse more joined-up
thinking about the role of heritage in place-making within national and local Government
policy-making.
29 Eftec 2005
30 D. Fujiwara et al. 2018; Lawton et al. 2018
31 Crossick and Kaszynska 2016

Heritage and the value of place
24
3. Review of existing literature
Overview
• Review of existing valuation studies of historic high streets, town halls and
libraries to:
o Inform the design of the Stated Preference survey;
o Provide comparison data to assess the realism of the results.
• The majority of previous studies in the literature have focused on the cultural
engagement services provided by historic sites, rather than the value of
maintaining those sites in good condition.
• No previous studies have assessed the beneficial externalities, or positive
spillovers that heritage buildings give rise to passers-by in the local area.
Empirical research eliciting economic values or benefits associated with access, preservation or
restoration of heritage sites dates back to the 1980s when the first contingent valuation (CV)
studies in the field were conducted.32 Since then, many studies in the heritage sector have been
conducted worldwide investigating a variety of benefits, both tangible and intangible. However,
the estimates from these studies are often not easily transferable to the local heritage sites in the
UK.
For example, there are many studies in the literature about the value of large or unique heritage
sites, such as Stonehenge33, entire historic cities34 or iconic cathedrals.35 These sites would not be
comparable to the smaller-scale sites covered in this study.
Different CV studies can also vary in terms of how comprehensively they capture the heritage sites’
economic value. This can be analysed within a framework known as Total Economic Value (TEV),
which originated in the field of environmental economics. TEV distinguishes between use value
(benefits derived from either direct or indirect use of the good being valued, usually including
option value associated with the possibility of using the good in future) and non-use value
(existence or bequest value associated with knowing that others may benefit from the good).
32 For review, see Noonan 2003; Pearce and O’zdemiroglu 2002
33 Maddison and Mourato 2001
34 Lawton et al. 2018
35 Pollicino and Maddison 2001; Lawton et al. 2018

Heritage and the value of place
25
Surveys where the WTP is framed as an entry fee to the heritage site capture only the direct use
value component of TEV, e.g. Willis’s valuation of Durham cathedral. 36 Other studies, while
capturing the full extent of TEV, may restrict attention to a narrowly defined valuation scenario,
such as avoiding damage (soiling) from air pollution, e.g. Grosclaude and Soguel’s valuation of
historical buildings in Neuchatel, Switzerland37 and Pollicino and Maddison’s valuation of Lincoln
Cathedral.38 This is in contrast with our study which provides a comprehensive set of economic
values including both the use and non-use components of TEV.
In the case of valuation studies motivated by the need to inform policy decisions regarding specific
heritage restoration and/or preservation programmes, the underlying primary data collection is –
understandably – focused on the location of the policy intervention. For example, Garrod et al
investigate the public acceptability of a revitalisation strategy of the Grainger Town area of
Newcastle upon Tyne,39 whereas Pagiola measures the benefits for residents and tourists of a
conservation and improvement program in the historic core of the city of Split in Croatia as part
of a World Bank-financed Kastela Bay Cultural Heritage Project.40 However, as testing for the size
of potential error when transferring value estimates to other sites is usually not in scope of these
studies, they provide only limited evidence on the suitability of their results for benefit transfer.
While primary research focused on the heritage site where a policy intervention is planned
typically constitutes the first-best method of obtaining policy relevant evidence, it is also a costly
approach that may not be viable in smaller-scale projects. A suitable evidence base in the form of
a Value Bank to draw values from would therefore provide an opportunity for such smaller
projects to still benefit from rigorous evidence without the need of funding a dedicated data
collection and research.
There have been previous attempts to assess the scope of BT techniques in the heritage sector.
For example, Eftec undertook CV studies of a number of built heritage sites in the UK41 for the
purposes of BT, aiming to build a bank of values that could be applied to similar heritage sites in
the UK.42 However, this study was limited in that it only provided one site for each cultural category,
which restricts the ability to perform transfer error testing within cultural categories. More recent
research work of DCMS and AHRC has also demonstrated the appetite within Government for
36 Willis 1994
37 Grosclaude and Soguel 1994
38 Pollicino and Maddison 2001
39 Garrod et al. 1996
40 Pagiola 2001
41 Denbigh Townscape, Kennet & Avon Canal, Battersea Park, Lincoln Cathedral, Sandal Castle
42 Eftec 2005

Heritage and the value of place
26
cultural valuation work43 and for benefit transfer research to build a bank of values for cultural
sites and institutions.
Historic high streets
A number of existing studies have estimated the WTP for complex heritage goods such as
landscapes, townscapes and high streets. In terms of CV studies focused on urban environments,
Grosclaude and Soguel44 find a WTP between $77 and $86 per person per year among residents
of Neuchatel, Switzerland, in order to prevent damage to local historic buildings from traffic-
caused air pollution (this estimate captures use and non-use value among local residents).
Pagiola45 estimates the WTP for preservation and improvement of the historic core of the city of
Split in Croatia. The use and non-use value among local residents found in that study is $168 per
person per year. In the UK, Garrod et al46 asked Newcastle upon Tyne residents how much they
would be willing to pay, in extra council taxes, towards the renovation and restoration of buildings
in the Grainger Town area, and how they would wish this money to be allocated across different
areas of the town. The results of this study demonstrated a WTP of £11.68 per household, with
evidence of a strong preference for renewing historic areas and a preference to contribute
towards the improvement of the most degraded areas. This is in line with our findings which
suggest that WTP for historic buildings tends to decrease with their perceived condition. Previous
Simetrica study of historic cities47 found similar WTP values to preserve the historic buildings from
damage associated with climate change in the city (use value of £9.63 per household among city
visitors/residents, and non-use value of £6.14 per household among non-visitors/non-residents).48
Historic libraries
43 Crossick and Kaszynska 2016
44 Grosclaude and Soguel 1994
45 Pagiola 2001
46 Garrod et al. 1996
47 Lawton et al. 2018
48 CV studies have also been applied to rural landscapes. A meta-analysis conducted by Ciaian and Paloma 2011 shows that the European
Union (EU) society’s WTP for agricultural landscape varies between €134-201 per hectare, with an average value of €149/ha in 2009. The
authors estimate a benefit transfer function based on a selection of stated preference studies (either contingent valuation, or choice
experiment) and controlling for a number of study and site characteristics in order to calculate landscape values for different land types,
for individual EU member states and for the whole EU. In the UK, Johns et al 2006 use a choice experiment survey to estimate valuations
for a number of landscape attributes, including the cultural heritage value of landscape (which captures factors such as visual presence of
traditional farm buildings in the landscape, presence of animals, traditional breeds, or traditional farming practices, e.g. shepherding with
sheep dogs), across seven severely disadvantaged areas in England. The WTP for a large change in the cultural heritage attribute (from
‘rapid decline’ to ‘much better conservation’) found in this study ranges from £0 (statistically not significant) to £22.51 per household per
year.

Heritage and the value of place
27
Previous studies of the value of libraries have focused on the reading services provided rather
than the historic buildings they are housed in. The British Library (BL) study49 valued WTP for the
library’s reading rooms and remote services using a sample of 2,030 users and general public non-
users, alongside willingness to accept (WTA) an annual payment in compensation for a scenario
where the BL ceased issuing readers’ passes but allowed existing readers to sell their pass, and a
non-use question using a payment mechanism of raised taxes for the maintenance of reading
rooms and other services. The study found a mean direct use WTP for reading room users of £116
a per annum and a higher WTA value of £273 per annum. The general public non-use WTP was
much lower at £6.30 per annum year. Direct value amounted to £59 million and indirect value
amounted to £304 million. This amounted to Total Economic Value (TEV) of use and non-use at
£363 million per annum (£373million 2016 UK prices).50 Note that the values for the British Library
included all reading services as well as the historic building itself. The British Library is also an
iconic site of national and international significance. We would therefore expect WTP values to be
considerably higher for the British Library than for the local libraries surveyed in this study.
A similar CV approach was applied to Bolton’s museum, library and archive services.51 The survey
presented a scenario where funding from the local council would cease, and asked respondents’
WTP a donation to support the continuation of the library, archives and museum services. The
study captured use and non-use value through a sample of 325 face-to-face and telephone
respondents, and WTA monthly compensation to give up the library/archive/museum pass,
following the approach in Pung et al.’s British Library study.52 Mean annual WTP was estimated at
£39.96 for library users, and at £21.96 for archive users. Total average use value was calculated as
£95.16. For non-users, total WTP was £33.84. The authors estimated that aggregated WTP was
£10.4 million, divided between direct value to library users of £4.4 million, archive users as £0.2
million, museum users of £2.8 million, and indirect value of £3 million (£3.1 million 2016 UK prices).
Again, these WTP values included all reading services and we would expect WTP values to be
considerably higher in the Bolton Library study than for the local libraries surveyed in this study.
A number of large-scale meta-reviews of library valuation studies have been undertaken including
Aabø’s meta-analysis of 38 cost-benefit studies of public libraries, of which 24 adopted CV
approaches.53 The review aggregated median and mean return on investment at national, state,
49 Pung et al. 2004
50 We convert foreign currency to GBP at the time the study was published using the relevant Consumer Price Index (CPI), and then
convert this amount to present-day prices using annual Retail Price Index inflation (figures based on the RPI as of May 2016. Source: Office
for National Statistics).
51 Jura Consultants 2005
52 Pung et al. 2004
53 Aabø 2005

Heritage and the value of place
28
county and individual level. The majority were performed on state level in the USA.54 Regression
analysis on the studies found that CV methods tended to produce lower valuations than market
substitute approaches. Kim’s meta-review of library CV studies found widely ranging benefit-cost
estimates, from $0.84 to $10.33 of benefit per $1 invested.55 The median result across six CV
studies was $3.79 of benefit per $1 invested, compared with a median result across the revealed
preference studies of $4.46 of benefit per $1 invested (across nine studies).
In the study mentioned above,56 Aabø also valued the continuation of the public library system in
Norway through a hypothetical scenario of reallocation of public services funding. Half of the 999
sample were asked to state maximum WTP to continue their local public library at present activity
and service levels; the other half stated their minimum WTA compensation for library closure.
Aggregate social value is estimated within the range of 400-2,000 NOK/household. Elsewhere,
Hájek and Stejskal surveyed 2,200 Municipal Library of Prague users (although the results of the
survey were undermined by having an unrepresentative sample).57 They found an average WTP
of 642CZK, but higher WTA the loss of the library (4,000CZK). Morris et al. valued WTP for individual
book loans of 550 library users across four UK libraries using a hypothetical scenario book lending
services would no longer be available.58 Mean WTP was around £0.62 per fiction book. Aggregate
WTP calculations showed that library book borrowers valued the lending service at £814 million
(£836 million UK prices).
Finally, Fujiwara et al. estimated the value of engagement in library services through a large
contingent valuation study of around 2,000 library users and non-users.59 Average willingness to
pay (WTP) to maintain current library services (above the core book-lending and
computer/internet services) among library users in England is £19.51 per annum and £10.31 per
annum for non-users. This provides a combined annual WTP for these local library services of
£723.4million. This is the first study to disaggregate WTP values by the services that respondents
report having used. Those using health services, attending lectures and using library space for
socialising are willing to pay more on average to maintain all services at their local library. Library
use is also positively associated with subjective wellbeing, suggesting that libraries have an
important role in users’ quality of life, which provides supporting evidence that the values for
public libraries can be interpreted as reflecting primary benefits stemming from welfare changes
associated with library engagement.
54 e.g., Griffiths et al., 2004; Griffiths et al., 2006; McClure et al. 2001
55 Kim 2011
56 Aabø 2005
57 Hájek and Stejskal 2014
58 Morris et al. 2002
59 Daniel Fujiwara et al. 2017

Heritage and the value of place
29
It is important to note that public buildings like libraries and town halls, which provide public
services like reading and civic registrations are multi-faceted in the values they provide. People
may hold one set of values for the public services provided by libraries (or other civic building) and
another set of values for the historic character of that site and its ongoing maintenance. Both sets
of values would require the design of different valuation scenarios to elicit WTP for each aspect.
The focus of the current study is on the value of heritage. However, it is impossible to avoid some
interactions between the services that people use and the historic character of the building from
which they are delivered. In the present study we will seek to capture some of these interactions
through follow up questions. However, even with the best survey design, there will always be some
uncertainty around what factors are most motivating respondents’ WTP. Future research may aim
to explore these motivations further by designing a Discrete Choice Experiment survey which
defines each of these attributes and asks respondents to trade-off the different and interacting
benefits of services provided and the characteristics of the building in which they are provided. To
date this has not been attempted in the literature, and it was outside of the scope of the present
study, which aimed to elicit WTP values for maintaining local heritage sites in good condition and
testing the robustness of these values for transfer to other comparable heritage sites across the
country.
Historic town halls
Our review found few examples of CV studies on historic town/village halls, but there are a number
of studies on other civic buildings like museums or theatres. However, these do not relate to
maintenance of the historic character of the sites, but rather the services they offer for cultural
engagement. For example, Santagata and Signorello find a WTP for maintaining the cultural
programme offered by Napoli Musei Aperti of $11 per household per year among museum users,
and $4 among non-users.60 Choi et al. use a choice modelling approach to value marginal changes
in several attributes of the Old Parliament House in Canberra, Australia, which houses the
Museum of Australian Democracy.61 The attributes they find to have a positive value include
‘extending the period of temporary exhibitions’ and ‘hosting events.’ This means that the present
study is the first to elicit the local population’s WTP to maintain their local historic town halls in
good condition.
In sum, the majority of previous studies in the literature have focused on the cultural engagement
services that are provided by historic sites, rather than the value of maintaining those sites in good
condition. Furthermore, no previous studies have assessed the beneficial externalities, or positive
60 Santagata and Signorello 2000
61 Choi et al. 2010

Heritage and the value of place
30
spillovers that heritage buildings provide for passers-by in the local area. This research will address
these two elements of the value of heritage to local place-making.

Heritage and the value of place
31
4. Data and methodology
• The objective of this study was to survey four heritage sites from each
category, and then combine the average WTP values for each site into a
‘pooled WTP’ value which can then be reliably transferred to comparable high
streets or civic buildings in England.
• A survey of residents (current residents or those who has been resident in the
past 3 years) in eight selected cities was designed to collect Willingness to Pay
(WTP) for their local heritage places.
• Data for this study was collected using a combination of online questionnaires
and face to face (F2F) interviews.
• The aim of the survey was to produce a Local Heritage Value Bank of estimates
of WTP values for different categories of heritage, with four sites in each.
o Historic high streets in four Industrial-era cities: Bolton;
Huddersfield; Hull; Bristol
o Historic high streets in Pre-industrial cities: Exeter; Lincoln; Norwich;
York
o Town halls: Bolton Town Hall; Exeter City Council (Guildhall);
Huddersfield Town Hall; Norwich City Hall
o Central libraries: Bristol Central Library; Hull Central Library; Lincoln
Central Library; York Central Library.
• Average WTP values for each site are ‘pooled’ into a combined sample which
can then be transferred with greater confidence that it is representative of a
historic place of the type that is being valued in a business case.
• Statistical tests are run on the WTP values to conclude with confidence that
the WTP values can be reliably ‘transferred’ to other sites. This process is called
‘benefit transfer’ and the statistical analysis tests for ‘transfer error’.
4.1 Sampling
The data for this study was collected using a combination of online questionnaires and face to face
(F2F) interviews. Online data was collected between 10th July – 26th August 2019. Face to face
interviews took place over the period 5th August – 12th September 2019. In total, a sample of
n=1641 responses were collected across the online (n=661) and F2F (n=980) survey modes.
4.1.1 Online sample
Online survey sampling was performed via a panel of pre-registered survey respondents,
maintained by the survey company Toluna.62 Within the panel respondents are randomly selected
62 https://www.toluna-group.com/en-gb
Heritage and the value of place
32
for surveys to help ensure that they are representative of a random sample of the relevant
population (residents of England, aged 16+). Moreover, in order to mitigate category overuse and
other forms of awareness bias, Toluna can exclude any panellist from a client’s survey by topic of
survey recently taken and frequency of participation.
Online surveys are common in large scale surveys in many areas of research, due to their speed,
cost-effectiveness and the fact that the large majority of the population is now online in countries
like the UK. Also, online surveys reduce social desirability bias and yea-saying (where respondents
acquiesce to survey questions in a way that does not represent their true preferences or
experiences), can be easily tailored to individual respondents and make it easier to present visual
information. However, despite these sampling measures, additional selection biases may arise
when sampling respondents from online panels. For example, people can choose first whether or
not to be part of a (pre-recruited) Internet panel and second whether they wish to participate in a
particular survey, thereby introducing two elements of potential selection bias: non-response,
where some groups are less likely to respond, and representation, where some groups are more
likely to be over/under represented in the sample.63 If non-response/representation-related bias
exists, this makes it more problematic to extrapolate value estimates and make valid inferences
directly from the sample to the wider population, since the sample selection issues could lead to
downward biased WTP estimates. 64 Existing research on the reliability of responses from
professional survey-takers is mixed.65 Currently, most stated preference surveys are conducted
online, and it is widely thought that on balance the pros outweigh the cons.
4.1.2 Face to face sample
Face to face survey sampling was performed by the interview company Watermelon.66 In each of
the eight cities in scope of this study, the interviewers were located on the street where the civic
building of interest was sited. Interviewer protocols ensured that respondents were chosen
randomly (1 in every 3 passers-by were approached).
4.2 Site scoping
Key characteristics for consideration in site scoping were developed through exploration of the
Historic England PointX Asset Register GIS database on the following characteristics:
63 Bonnichsen and Ladenburg 2009
64 Bonnichsen and Ladenburg show that males, older respondents and those without children are more likely to answer, while those
households in the highest income group are less likely to answer. The consequence is that WTP is underestimated if selection is not taken
into account.
65 Callegaro et al. 2014
66 www.watermelonresearch.com/
Heritage and the value of place
33
• Overall age and character (pre-industrial/industrial-era): Allowing buildings to
be separated into those built before and after 1800
• Size of city
• Listed buildings: Number and proportional coverage
while ensuring that a sufficient sample size was available through online and face to face data
collection.
Pre-industrial and industrial-era towns and cities
A primary consideration was to ensure we had separate values for high streets in cities which are
broadly classified as Pre-industrial (towns/cities which contain some architecture dated before the
nineteenth century) or Industrial-era (those containing no or few buildings aged before 1800, and
predominantly constructed in the industrial era of the nineteenth century). We acknowledge that
this is a non-exclusive classification, given that ‘Pre-industrial’ cities also contain a large number of
sites dated post-1800, and that many older buildings will have been added to over different ages.
However, for the purposes of benefit transfer, we hypothesize that the age of the heritage
contained within the city will be an important aspect of the character of the high street, and that
this is one factor that drives local values.
Size
In order to ensure the size of the city and high street was kept consistent, we aimed to restrict the
selection to medium sized cities, defined as having a population of more than 100,000 and less
than 4,00067 as larger cities tend to have a smaller proportion of historic high streets and a larger
proportion of modern high streets. Regional mix – to ensure that towns/cities from different parts
of the country, with their distinct socioeconomic composition and architectural character – was
also considered in the scoping stage. However, in practice, it was necessary to sample more
northern towns to obtain the necessary number of Industrial-era high streets. This should be taken
into account and caution applied if attempting to transfer Industrial-era high street WTP to
Industrial-era towns in the south of England.
67 Note that Bristol has a population of 460,000 but was included because of its industrial-era architecture and to include some
representation of southern towns in the sample.

Heritage and the value of place
34
Exeter (South of England) Norwich (East of England)
Lincoln (Midlands)
Mid-size city, Pre-industrial era
York (North of England)
Bolton (North of England) Huddersfield (North of England)
Hull (North of England) Bristol (South of England)
Mid-size city, Industrial era
Heritage and the value of place
35
Listed buildings
The survey was designed to ask two WTP questions; first for the high street and second for a civic
building (library or town hall). Each city therefore needed to have at least one listed town hall or
library building. In order ensure the value for each type of civic building could be used for benefit
transfer, we needed a minimum of four cities with each type of listed civic building.68
Analysis of the Historic England PointX Asset Register data enabled more rigorous classification
and screening of appropriate sites to inform survey design. The data enabled analysis of the
concentration of listed buildings on each street as part of site scoping. Additionally, the
classifications of the listed buildings (e.g. pub, café, shop, library etc) allowed us to ensure the high
streets across cities were similar in terms of the types of services offered from the historic
buildings.
Sample size
Power calculations are statistical tests which inform the researcher of the minimum sample size
required to test their hypothesis. These tests showed that a sample of n=170 for each site would
fulfil sample size requirements to perform full benefit transfer testing on two different types of
high street / civic building WTP, to ensure robust sample size requirements69 which are eligible for
benefit transfer testing.70 The survey strategy included contingency plans for collecting additional
data via face to face data collection on site, to mitigate the risk that data collection would end with
insufficient sample for benefit transfer testing. Table 4-1 shows that in the majority of cases the
high street WTP sample was obtained through on-site data collection by interviewers located in
the cities (40% for Pre-industrial cities and 42% for Industrial-era cities). In the case of two cities
(as detailed in Appendix Figure 8-1, left panel) a higher proportion were obtained online. This was
likely due to the larger populations of these cities, which increased the number of their residents
present in the online panel (Norwich 59% and Bristol 61% online). This tended to carry over into
the civic building samples (see Appendix Figure 8-1, right panel). Nevertheless, testing for survey
mode effects, we found no significant difference in mean WTP between online and F2F samples
(see Appendix Table 8-19), so it was not deemed necessary to adjust results for weighting of online
to F2F responses.
68 The larger the set of study sites, the lower the risk of measurement error related to the possible selection of a single inaccurate or
inappropriate source study, with a general ‘rule of three’ minimum. For detailed discussion of the advantages and disadvantages of the
unit value and function transfer approaches see Johnston et al. 2015.
69 Pearce and O’zdemiroglu 2002
70 Lawton et al. 2018; Johnston et al. 2015; Eftec 2009
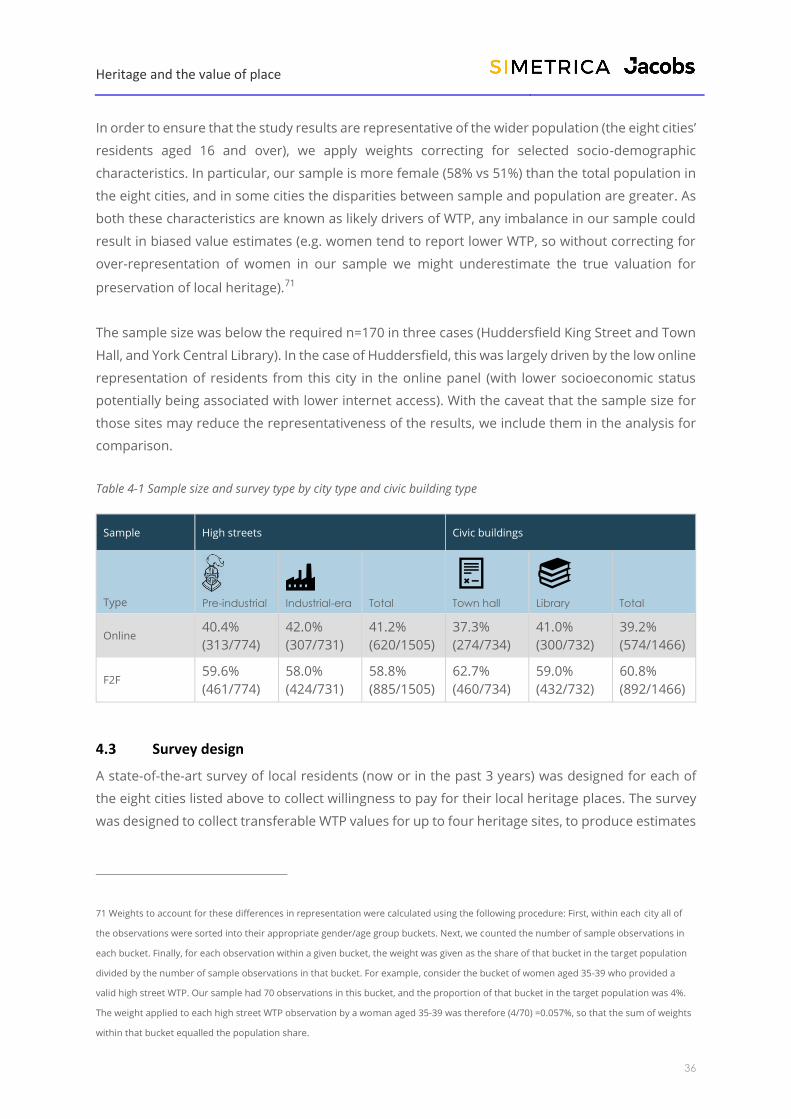
Heritage and the value of place
36
In order to ensure that the study results are representative of the wider population (the eight cities’
residents aged 16 and over), we apply weights correcting for selected socio-demographic
characteristics. In particular, our sample is more female (58% vs 51%) than the total population in
the eight cities, and in some cities the disparities between sample and population are greater. As
both these characteristics are known as likely drivers of WTP, any imbalance in our sample could
result in biased value estimates (e.g. women tend to report lower WTP, so without correcting for
over-representation of women in our sample we might underestimate the true valuation for
preservation of local heritage).71
The sample size was below the required n=170 in three cases (Huddersfield King Street and Town
Hall, and York Central Library). In the case of Huddersfield, this was largely driven by the low online
representation of residents from this city in the online panel (with lower socioeconomic status
potentially being associated with lower internet access). With the caveat that the sample size for
those sites may reduce the representativeness of the results, we include them in the analysis for
comparison.
Table 4-1 Sample size and survey type by city type and civic building type
Sample High streets Civic buildings
Type
Pre-industrial
Industrial-era Total
Town hall
Library Total
Online 40.4%
(313/774)
42.0%
(307/731)
41.2%
(620/1505)
37.3%
(274/734)
41.0%
(300/732)
39.2%
(574/1466)
F2F 59.6%
(461/774)
58.0%
(424/731)
58.8%
(885/1505)
62.7%
(460/734)
59.0%
(432/732)
60.8%
(892/1466)
4.3 Survey design
A state-of-the-art survey of local residents (now or in the past 3 years) was designed for each of
the eight cities listed above to collect willingness to pay for their local heritage places. The survey
was designed to collect transferable WTP values for up to four heritage sites, to produce estimates
71 Weights to account for these differences in representation were calculated using the following procedure: First, within each city all of
the observations were sorted into their appropriate gender/age group buckets. Next, we counted the number of sample observations in
each bucket. Finally, for each observation within a given bucket, the weight was given as the share of that bucket in the target population
divided by the number of sample observations in that bucket. For example, consider the bucket of women aged 35-39 who provided a
valid high street WTP. Our sample had 70 observations in this bucket, and the proportion of that bucket in the target population was 4%.
The weight applied to each high street WTP observation by a woman aged 35-39 was therefore (4/70) =0.057%, so that the sum of weights
within that bucket equalled the population share.

Heritage and the value of place
37
of WTP values for different categories of heritage. The study provides a bank or database of values
for:
1. Historic high streets in Pre-industrial cities
2. Historic high streets in Industrial-era cities
3. Town halls
4. Central libraries
The survey asked two WTP questions, one on the value of the historic high street and another
about an individual historic civic building within the city.
• High street WTP values represent a combined ‘use, non-use, and spillover
values held by local people’, in that we only survey those who have lived in the
high street in the past 3 years and who are familiar with the site, as presented
to them through the name of the site.
• This is also true in the case of town halls, where WTP values represent
combined ‘use, non-use and spillover values held by local people’, since all can
passively experience the sites from the outside (i.e. they value their place in
the townscape), while some may also have used the town hall directly (e.g. for
weddings or work).
• In the case of libraries, some respondents had directly used the library in the
past 12 months, while others experienced it only indirectly within their local
place. We distinguish between those who regularly use the library, i.e. more
than once a month (21%) and those who do not. We would expect regular
library users to have significantly higher WTP, which is confirmed by the
sensitivity analysis reported in Appendix Table 8-17. The approach we adopt
in the remaining analysis to account for the effects of library use frequency is
to combine library users and non-users in the sample and control for any
difference in the values obtained.
The survey design enabled collection of WTP values for two sites (one historic high street and one
historic civic building) in the same survey. This provided at least two valuation estimates per survey,
maximising the policy usefulness of the sample. Each time the respondents were reminded that
their payment was completely independent to any previous amounts they might have paid. To
avoid potential biases introduced through order effects, the order in which the high street or civic
building question is asked was randomised.
4.4 Respondent pre-screening and exclusions
Online surveys included filtering at the start of the survey that asked the respondent for the region
where they live and then presented the cities in that region, asking if they had lived there in the
past three years. This set up was designed to avoid respondents replying to survey questions in
Heritage and the value of place
38
an unconsidered way that does not represent their true preferences or experiences. If the
respondent selected any of the eight cities of interest to our study, they proceed into the survey.
Face to face surveys were specific to the city in which the interviewer was based. Respondents
were excluded if they had not lived in the city for the past three years.
Respondents were screened out of the local high street WTP question if they were not familiar
with the high street (n=46) or have not visited the high street in the past three years (n=20). They
were screened out of the civic building WTP question if they have never heard of the building
(Town hall n=141; Library n=155). This helps to ensure that the sample is composed of only those
classed as ‘local users’ because they are aware of the presence of the historic site in their local
area and can have benefited from its positive spillover effects.
The final sample size excludes a number of responses for which key information necessary for
further analysis was missing, e.g. those that provided no valid WTP answers (either missing or non-
monetary responses) for either of the historic high street and the civic building (n=100) or those
with missing age and/or gender characteristics required for weighting (n=12). In addition to that –
as explained in detail in the Appendix – for quality assurance purposes we also exclude
respondents who provided logically inconsistent or unrealistic answers, such as:
• Those who completed the survey in an unrealistically fast time (n=14). Removal of so-called
‘speedsters’ is recommended practice in CV analysis. A threshold time of 3.5 minutes was
set as the minimum period in which all of the information provided in the survey could
realistically be read and used to make informed preference decisions.72
• Those who provided a postcode that did not match the city of which they claimed to be
residents (n=86).
• Those who stated that they would not pay the sum of declared WTP in reality
(n=15), as this is an indicator that the valuation scenarios were not answered
in a realistic way.
While the exclusions above lead to some sample loss, it is considered preferable to have a more
robust set of responses that provides greater confidence that WTP values are produced in a way
that most accurately mirrors welfare-consistent decisions. We must also acknowledge that the
exclusion of these respondents could introduce some bias into the results if they result in the
systematic exclusion of certain types of respondents from the sample. We perform ex-post
72 Average survey completion time in online mode was approximately 22 minutes, with the median of around 12 minutes. In face to face
mode, the average was much higher (89 minutes), but the median was comparable (16 minutes) to the online mode. This indicates that
the majority of respondents completed the survey within the expected timeframe, while the average completion times were likely driven
upwards by a small number of outlier observations where either the respondents were completing the survey over multiple online
sessions or the face to face interviews’ completion times was recorded with a delay, possibly due to technical/connectivity issues.

Heritage and the value of place
39
analysis (logistic regression) which finds no significant selection effects within the samples of
exclusions.
4.5 Valuation scenario 1: Willingness to pay for 'local heritage'
Good valued: Maintenance and preservation of historic core of high street in good condition.
Exclusion scenario: High streets form the cultural centre of towns and cities. They often contain
a high concentration of historic listed buildings, which provide a distinct character and sense of
place. The challenge of maintaining historic high streets in good condition is increasingly difficult,
and cannot be solved by councils, private owners, or government agencies by themselves. In the
hypothetical scenario, continued enjoyment of the current condition of the historic high street is
dependent on the survey respondent being willing to pay to maintain it in good condition.
Contingent scenario: Respondents are asked to imagine a situation where due to the current
financial conditions, there is a shortfall in public funding to conserve and preserve the historic
character of the high street in good condition. If additional funding cannot be secured, then the
historic character of the high street would be at risk of deterioration, with a greater risk of damage
and emergency repairs. To protect the historic character of the high street from degradation and
permanent damage, a fund is proposed, set up by a local trust to maintain the historic character
of the high street in good condition, supported by voluntary donations. The use of an independent
fund in the scenario is designed to overcome potential strategic biases against paying additional
taxes to local or central Government.
To avoid protest responses, respondents are reminded that all of the funds raised would be
used for maintaining and preserving the historic character of the high street on a continuous
basis (i.e. if payments stopped at any point in the future, the historic character of the high street
would no longer be maintained in good condition), and that the money would work to preserve
the historic character of the high street only, and not of the rest of the city centre
4.6 Valuation scenario 2: Willingness to pay for 'local heritage' of civic building in a town or city
Good valued: Maintenance and preservation of historic civic building in good condition.
Exclusion scenario: Historic town hall buildings can be expensive to maintain, and the current
financial situation means that some historic buildings can no longer be maintained within current
local authority or conservation area budgets. If continued funding for historic civic
buildings cannot be secured, then the buildings would deteriorate, and the exterior of the building
would be at risk of major damage. In the hypothetical scenario, continued enjoyment of the
current condition of the historic high street is dependent on their being willing to pay to maintain
it in good condition.
Heritage and the value of place
40
Contingent scenario: The same valuation scenario is presented for high streets and civic
buildings (WTP to a local trust to maintain the historic building in good condition, supported by
voluntary donations).
4.7 Analysis: WTP results
The valuation question asked what was the “maximum you and your household would be willing
to pay as an annual donation to a local trust to maintain the historic site in good condition”.73 All
WTP values were elicited through a payment card elicitation mechanism. This means that
respondents’ stated values were a lower bound of their actual willingness to pay because the
actual amount they were willing to pay would lie somewhere between the amount they chose and
the next amount on the payment card. To take into account these intervals we therefore used the
mid-point between the amount chosen on the card and the next amount up, as is standard in the
CV literature.74 Following standard practice, all those who responded that they were not willing to
pay in principle were coded as £0 bids.
We calculate mean and median WTP values, as well as a lower bound WTP is estimated as the
lower limit 95% confidence interval around the mean WTP. We conducted theoretical validity tests
using multivariate regressions to assess whether the main drivers of WTP matched what is already
known about the determinants of economic value 75 and prior expectations around cultural
engagement and past usage. Regression analysis tests the statistical association between our
dependent variable (WTP) and a set of explanatory variables (factors that may make people more
or less likely to state a higher WTP value). It helps us to understand if WTP is driven by those factors
which have been found to drive WTP in previous studies. For example, individuals with higher
income and those with an interest in culture would be expected to have on average higher WTP.
Full technical results of regression analysis are provided in Appendix Table 8-8 and Table 8-9.
73 The survey also included follow up questions to verify whether their stated WTP was for their household or for them as an individual.
This allowed us to confirm that respondents were interpreting the valuation scenario correctly. If we consider only those who report
household size of two or more, responses to this follow-up question show that 34% were thinking of themselves as an individual, rather
than their household, when stating the WTP. It may be that their WTP would have been higher if they were stating it for their household.
However, without further understanding of how they are calculating their stated WTP, we recommend aggregating these values to the
household level, i.e. their value as an individual would count as a household value, rather than being grossed up by household size. This
makes the aggregation to households in the local area slightly more conservative, which we consider appropriate given that this would
counteract the upward biases that are known to act on CV surveys, such as hypothetical bias, which we are only able to minimise in this
survey, as well as the exclusion of ‘pure non-users’ who may hold lower values for the site on average.
74 Bateman et al. 2002
75 Including the wide literature, e.g. Bateman et al. 2002

Heritage and the value of place
41
4.8 Analysis: Benefit transfer
Benefit transfer (BT) is the exercise of transposing ‘primary’ research findings on WTP values from
one study site to another. It offers a means to provide policy-useful values in a fast and cost-
effective way, by taking the estimated average WTP values from surveyed sites (study sites) and
applying them to another site (policy or business case site) in their simple form, or by transferring
the information from the study site to the policy site as a function between WTP and a number of
explanatory variables (function transfer).76
Desvousges et al.77 developed the first set of tests for analysis of the validity of benefit transfer.
Eftec78 provides a useful checklist for the design of a primary study with the aim of undertaking
value transfer in the future including consideration of:
i. Similarity of the policy good and study good;
ii. Similarity of the change in provision of the policy good and study good;
iii. Similarity of the sites where the policy good and study good are found;
iv. Similarity of the policy good and study good affected populations;
v. Similarity of the policy good and study good market constructs; and
vi. Similarity of the number and quality of substitutes for the policy good and
study good.
vii. Primary valuation study tests and presents robust results.
There are three broad approaches to benefit transfer in the literature.79 The first is based on a
transfer of a known benefit (or another aggregate of benefits) from a study site(s) to a policy site.
The second is based on the transfer of a valuation function, which calibrates the value being
transferred using the physical and demographics characteristics of the policy site. This can be done
through an adjustment of the unit value by income or through a more advanced model using a
set of predictors. Finally, a third approach known as meta-analytic value function transfer uses a
value function estimated from multiple study results, together with information on parameter
values for the policy site, to estimate policy site values. The value function therefore does not come
from a single study but from a collection of studies. This allows the value function to include
greater variation in both site characteristics (e.g. socio-economic and physical attributes) and study
characteristics (e.g. valuation method) that cannot be generated from a single primary valuation
76 Brouwer 2000; Eftec 2009
77 W. H. Desvousges et al. 1998
78 Eftec 2009
79 Brouwer 2000

Heritage and the value of place
42
study.80 However, this approach requires more extensive data and more pre-existing studies. We
do not expand on the meta-analytic method further as it is not applied in this paper.
Function transfer allows us to explore:
• Effects of the underlying differences between sites (e.g. condition of listed
buildings, historic character of the area) on WTP values.
• Influence of population demographics on WTP values. The purpose of these
adjustments is to tailor the WTP values to the specifics of the local population
(e.g. gender, age, income, education level, etc.).
• Influence of visit frequency/usage of the site.
• External data on location characteristics, e.g. number of listed buildings
(Grade I and II*) in the high street / city, income inequality within the city (as
measured by the Gini coefficient), etc. However, we note that because of the
small number of cities included in the sample and the fact that the external
location characteristics remain constant across all observations within the
same city, the variation of these characteristics within the sample is not likely
to be sufficient to allow for precise estimation of their effect (if any) on WTP.
A full technical explanation of transfer tests used in this report is provided in the DCMS Value of
Culture benefit transfer report.81 For ease of reference, the relevant sections from that report are
included in Appendix B. Benefit transfer methodology and an excerpt from that report outlining
the rationale behind our choice of acceptable levels of benefit transfer errors is provided below.
Any transfer of WTP values between different sites will incur some degree of transfer error. What
is an acceptable transfer error and whether the transfer is still informative depends on the
intended policy use of the transferred estimates, and the corresponding accuracy required.82 Here,
we compare estimates of transfer error to established ranges within the literature.83 Ready and
Navrud84 reviewed intra and cross-country benefit transfer studies and found that the average
transfer error was in the range of 20% to 40%, while individual transfers had errors as high as 100-
200%, particularly when involving complex goods. For the purpose of testing, we apply a threshold
of maximum 40% transfer error to all individual transfer errors.
80 Johnston et al. 2015
81 D. Fujiwara et al. 2018, secs 2.5.2; 2.5.3
82 Brookshire and Neill 1992a; Desvouges et al. 1992a
83 Susana Mourato et al. 2014; Navrud and Ready 2007
84 Ready and Navrud 2006

Heritage and the value of place
43
The use of geographical data like the Historic England PointX Asset Register and Ordnance Survey
Open Map allows us to incorporate further external data on the characteristics of each of the sites
surveyed that could potentially explain variation in WTP and therefore affect transfer testing.
These data include the number and density of listed buildings within the high street / city, types of
businesses represented on the high street, listing grade of the analysed civic building (town hall
or library), etc. Demographic differences may explain some of the variation in WTP, however, they
omit key information about the condition of the sites valued. This analysis will provide a major
contribution to the benefit transfer literature and with its use of the ever-growing body of
geographical open data, will provide much greater transferability of values using function transfer.
Again, however, we note that the number of area-specific variables that could be incorporated in
a function transfer is limited by the number of study sites included in the regression, because the
effect of any given characteristic on WTP can only be identified if there is sufficient variation of the
characteristic within the sample.
Heritage and the value of place
44
5. Results
Willingness to pay results
• This study estimates average WTP values for two types of high streets: Those
based in Pre-industrial revolution era (pre 1800) cities (Pre-industrial), and
post 1800 (Industrial-era) cities. These were:
o The WTP estimate is £7.80 to maintain the historic character of
Pre-industrial high streets in good condition per household per
year. This is based on a pooled dataset of WTP values for four Pre-
industrial high streets. The average WTP value for Pre-industrial high
streets is £9.28.
o The WTP estimate is £6.31 to maintain the historic character of
Industrial-era high streets in good condition per household per
year. This is based on a pooled dataset of WTP values for four
Industrial-era high streets. The average WTP value for Industrial-era
high streets is £8.51.
• This study also estimates average WTP values for two types of historic civic
buildings: town halls and public libraries:
o The WTP estimate is £5.73 to maintain the historic character of
town halls in good condition per household per year. This is based
on a pooled dataset of WTP values for four historic town halls. The
average WTP value for the four pooled town halls is £7.29.
o The WTP estimate is £7.67 to maintain the historic character of
libraries in good condition per household per year. This is based on
a pooled dataset of WTP values for four historic libraries. The average
WTP value for the four pooled libraries is £9.79.
In all cases we take a more conservative estimate of WTP based on the lower bound 95%
confidence interval. This lower bound provides a representation of the lowest value that average
WTP could reasonably have based on distribution of values within the sample. For the purposes
of realism when transferring to external business cases, it is recommended to take this lower
bound to correct for the features of the hypothetical survey.
Benefit transfer testing of the heritage sites surveyed in this study finds that:
• Pre-industrial high streets and historic libraries WTP values can be
transferred to comparable historic sites across the country with acceptably
low risk of introducing transfer error.

Heritage and the value of place
45
• For town halls, acceptable levels of transfer error are achieved only with
adjustment to the income differentials between towns (adjusted transfer
method). These values should be transferred only with consideration of the
income differences between the study town hall sites and the business case
site.
• Even more caution should be applied to Industrial-era high streets, where
transfer errors were outside of the acceptable level with all transfer methods.
We recommend that Industrial-era high street WTP should not be transferred
to other sites, as the WTP values varied too much between the four sites
surveyed to provide a robust average WTP value that can be considered
representative of other Industrial-era high streets in the country. We
recommend that these WTP values be seen only as indicative of the values that
people hold for these four particular Industrial-era high streets, and not for
Industrial-era high streets as a whole.
5.1 Pilot Survey
We conducted a pilot survey on 20th June 2019 using a quota-based sample of 51 online panel
respondents who were current or recent (within the past 3 years) residents of the cities. Debrief
questions were included to calibrate payment card amounts and identify potential problem areas
in survey understanding, design, and flow prior to the final survey going into the field. The pilot
was also designed to establish the current condition of the sites which informed the design of the
valuation scenario to either elicit peoples’ WTP to maintain their local heritage in good condition,
or WTP to improve sites which are currently in poor condition. The majority of respondents
indicated that the heritage sites were currently in a fair or good condition, confirming that the
appropriate heritage good to value was that of maintaining a site in a good/fair condition.
The majority of respondents (78%) found the pilot survey to be an acceptable length and low in
difficulty (98% found it okay, a little easy, or very easy) and 84% thought the survey provided
sufficient information on the survey purpose and aims. From the pilot survey results, no changes
to payment cards or questions were deemed necessary. The pilot was thereby performed under
identical conditions to the final survey; however, a face-to-face version of the survey was created
to increase the final sample size through interviews in the field.

Heritage and the value of place
46
5.2 Main Results
• This study estimates average WTP values for two types of high streets: Those
based in Pre-industrial revolution era (pre 1800) cities (Pre-industrial), and post
1800 (Industrial-era) cities. These were:
o The WTP estimate is £7.80 to maintain the historic character of
Pre-industrial high streets in good condition per household per
year. This is based on a pooled dataset of WTP values for four Pre-
industrial high streets. The average WTP value for Pre-industrial high
streets is £9.28.
o The WTP estimate is £6.31 to maintain the historic character of
Industrial-era high streets in good condition per household per
year. This is based on a pooled dataset of WTP values for four
Industrial-era high streets. The average WTP value for Industrial-era
high streets is £8.51.
• This study also estimates average WTP values for two types of historic civic
buildings: town halls and public libraries:
o The WTP estimate is £5.73 to maintain the historic character of
town halls in good condition per household per year. This is based
on a pooled dataset of WTP values for four historic town halls. The
average WTP value for the four pooled town halls is £7.29.
o The WTP estimate is £7.67 to maintain the historic character of
libraries in good condition per household per year. This is based on
a pooled dataset of WTP values for four historic libraries. The average
WTP value for the four pooled libraries is £9.79.
5.2.1 Socio-demographics
Survey sampling was designed to elicit the views of local residents (those who had lived in the city
in the past three years) about their local heritage. This assumes that the survey samples were
representative of the population of the cities. Table 5-1 shows that the 8 city samples differ in
terms of key demographics like gender and average age. To ensure representativeness of the
actual populations of these cities, throughout the subsequent analysis we weight the samples
based on adult city resident data from the 2011 census.
The city samples also differ by socioeconomic characteristics, with average annual household
income higher in Bristol (£37,156) and Norwich (£34,970) and lowest in Hull (£22,750), Huddersfield
(£23,341) and Bolton (£24,759). Huddersfield also has the lowest levels of University (degree or
above) level education (18%), followed by Bolton (19%), with Bristol having the highest (49%).
Bolton and Hull have the lowest levels of employment (42% and 44% respectively). These results
suggest that the historic sites selected sit in populations that differ considerably in socioeconomic

Heritage and the value of place
47
status. This may be expected to drive WTP values, since income is a strong theoretical driver of
WTP.85 This will be explored in the benefit transfer tests in Section 5.3.
Table 5-1 Socio-demographic characteristics - unweighted
Bolton Bristol Exeter Hudders-
field
Hull Lincoln Norwich York
Female: % (n/N) 50.5%
(103/204)
61.7%
(137/222)
64.5%
(138/214)
53.1%
(93/175)
56.2%
(118/210)
60.7%
(139/229)
57.8%
(118/204)
54.6%
(100/183)
Age: mean (se) 48 (1.28) 43 (1.04) 50 (1.25) 47 (1.29) 48 (1.14) 46 (1.11) 46 (1.19) 47 (1.29)
Household annual
income (£): mean (se)
£24,759
(1182.24)
£37,156
(2062.04)
£28,119
(2227.83)
£23,341
(1411.29)
£22,750
(1210.50)
£30,181
(1637.20)
£34,970
(1780.43)
£31,846
(2021.53)
Has dependent
children under 16
years: % (n/N)
28.6%
(58/203)
30.5%
(67/220)
19.6%
(42/214)
34.9%
(61/175)
25.5%
(53/208)
27.1%
(62/229)
25.1%
(51/203)
31.7%
(58/183)
Married/ with
partner: % (n/N)
32.0%
(65/203)
34.1%
(74/217)
38.3%
(79/206)
45.3%
(78/172)
33.8%
(70/207)
48.7%
(111/228)
44.3%
(89/201)
43.4%
(79/182)
University
education % (n/N)
19.2%
(39/203)
48.6%
(107/220)
39.6%
(84/212)
18.2%
(31/170)
28.0%
(58/207)
32.7%
(74/226)
37.4%
(76/203)
43.7%
(80/183)
In employment (full-
time, part-time, self-
employed): % (n/N)
42.2%
(86/204)
67.9%
(150/221)
48.6%
(101/208)
59.5%
(103/173)
43.8%
(91/208)
61.4%
(140/228)
63.5%
(129/203)
58.2%
(106/182)
Current resident of
city: % (n/N)
99.0%
(202/204)
98.2%
(218/222)
93.0%
(199/214)
97.7%
(171/175)
96.2%
(202/210)
93.9%
(215/229)
95.1%
(194/204)
96.7%
(177/183)
Notes: Sample sizes are larger than either the high street sample or the civic building sample in isolation, because
they include all respondents who provided at least one valid WTP response (either for the high street or for the civil
building, or both). “Current resident of city” refers to people who currently live in the respective city as opposed to
people who have lived in the respective city in the past but no longer live there. Weighted demographics reported in
Appendix Table 8-2 and Table 8-3.
In all subsequent tables in Section 5, we report only weighted figures (using either high street
weights or civic building weights, as appropriate for the analysed sample).
5.2.2 General pro-heritage attitudes
Just under half of the analysed survey respondents expressed preferences for visiting and
supporting historic buildings and areas which are perceived or identified as ‘heritage’, in terms of
indicators of engagement and pro-heritage attitudes.
Across seven of the eight cities, around 40% of the population had visited a historic building (non-
religious) in the last 12 months, with a slightly lower number in the case of Hull (33%). Just over a
third of the population would prioritise public spending on arts or heritage as one of their top five
areas where they think public finding should be directed. A very high proportion (around 90%)
85 Bateman et al. 2002

Heritage and the value of place
48
agreed or strongly agreed that historic buildings should be preserved for future generations, that
it is important to preserve the historic character of our cities, and that they were personally
concerned about damage to historic buildings, with the exception of Huddersfield, where only
around 80% agreed to the first two statements.
Table 5-2 User attitudes towards culture and historical buildings
City Exeter Lincoln Norwich York
Total:
Pre-
industrial
Bolton Bristol Hudders-
field Hull
Total:
Industrial-
era
Visited any historic
building (non-
religious) open to
the public in the
last 12 months (%)
39.6% 55.5% 45.6% 53.4% 47.2% 40.3% 53.4% 39.4% 32.7% 42.6%
Arts or heritage
amongst the top 5
priorities for public
spending (%)
34.7% 43.2% 37.9% 41.4% 38.7% 32.8% 41.0% 31.1% 33.0% 34.9%
Figure 5-3 User attitudes towards culture and historical buildings
5.2.3 Visits to and conditions of high streets/civic buildings
Comparing data on visit frequency shows that Exeter is the most visited (with 89% visiting the high
street more frequently than once a month), and that the other cities have around two-thirds of
respondents having visited their local high-street in the past three years, with the exception of
Pottergate / Bedford Street in Norwich at 48%.
Figure 5-4 Frequency of visits to heritage site (once a month or more)

Heritage and the value of place
49
Figure 5-5 Frequency of visits to heritage site (less than once a year)
Figure 5-6 Frequency of visits to heritage site: Pooled average within each heritage category

Heritage and the value of place
50
In the case of civic buildings, visits were less frequent, as one would expect given the more specific
set of services offered by each. 21% of the surveyed population had visited their local library
regularly (more than once per month), with the lowest regular visitor rate at Lincoln Central Library
(13%). Regular visits to Town Halls were less frequent (12%).
The data suggests that the setting of the valuation scenario – willingness to pay to maintain the
historic site in good condition – was set appropriately for the 16 sites surveyed. A large majority
(at least 74%) of the residents surveyed considered their high street to be in good or fair condition
in both Pre-industrial and Industrial-era samples, with at least one in four considering the
condition good across all high streets except Whitefriargate in Hull, where the share was slightly
lower at 20%. An alternative design would have asked WTP to improve the condition of the sites
but given that the majority were in fair or good condition, this would not have been appropriate
to the sites surveyed.
A similarly large majority considered their civic building to be in good or fair condition (73% or
more), with at least 30% considering the condition good (again, with the exception of Hull Central
Library, where the share was slightly lower at 25%).
Overall, the high proportion of respondents who report their historic sites as being in fair or good
condition adds weight to the idea that the valuation scenario is correctly designed to elicit peoples’
WTP to maintain their local heritage in good condition, although as a caveat, we cannot be certain
that survey respondents are making an accurate assessment about the condition of the historic
sites. We explore the relationship between perceived condition of the civic building and WTP
valuation estimates in the benefit transfer function calculation Section 5.3.
Table 5-7 Condition of historic sites (self-reported by survey respondents)
City Bolton Bristol Exeter Hudders
-field Hull Lincoln Norwich York Total
Site (high
street)
Church-
gate /
Deans-
gate
Corn
Street/
Clare
Street
The High
Street
King
Street
White-
friargat
e
The High
Street
Potter-
gate /
Bedford
Street
Stone-
gate
Pre-
industrial
Industrial
-era
Thinks high
street is in
good or
fair
condition
74.6% 85.5% 91.8% 89.3% 74.4% 80.6% 79.6% 81.5% 83.7% 82.3%
Thinks high
street is in
good
condition
33.0% 26.7% 39.5% 45.5% 19.8% 21.5% 29.4% 23.7% 29.7% 32.2%
Site (civic
building)
Bolton
Town
Hall
Bristol
Central
Library
Exeter
City
Council
(Guild-
hall)
Hudders
-field
Town
Hall
Hull
Central
Library
Lincoln
Central
Library
Norwich
City Hall
York
Central
Library
Town hall
Library

Heritage and the value of place
51
Thinks
building is
in good or
fair
condition
85.6% 82.2% 82.8% 89.5% 72.6% 68.4% 83.3% 74.1% 84.4% 73.3%
Thinks
building is
in good
condition
60.1% 43.6% 32.2% 49.2% 24.7% 36.4% 37.7% 30.4% 40.4% 35.6%
Table 5-8 brings together external data on the coverage of heritage, leisure, and other local area
conditions at the eight high streets. As would be expected, Pre-industrial high streets have a higher
number of listed buildings compared to Industrial-era high streets. This is true of all listed
buildings and for specifically Grade I and II* listed buildings. This suggests that the distinction
made between Industrial-era and Pre-industrial high streets is valid in terms of the relative
historical character of the sites. Vacant shops and betting shops were included as indicators of the
economic character of the high street. There was low variation across most high streets and no
clear difference between Industrial-era and Pre-industrial, with either one or two or no vacant
shops or betting shops for most high streets. The exception was Churchgate / Deansgate in Bolton,
with a remarkably high number of 18 vacant shops the highest as a proportion of the total km2 of
any high street. We note that data is extracted from Open Street Maps which is user-driven, and
therefore dependent on the energy of users to record and update the number of vacant shops.
The leisure offer of each high street varied, with a higher proportion of Cafes, restaurants, pubs,
bars in Corn Street/ Clare Street Bristol and the lowest in Whitefriargate Hull.
Table 5-8 Geographical data on heritage, leisure and other local area conditions at the eight high streets
Area
(sq.
km)
All listed
buildings
Listed
buildings
(I and
II*)
Vacant
shops
Betting
shops
Cafes,
restaurants,
pubs, bars
Vacant
shops
by sq
km
Cafes,
restaurants,
pubs, bars
by sq km
City
population
(2018)
Households
in Local
Authority
area (2011
census)
Bolton Churchgate / Deansgate 83.5 10 1 18 2 26 0.22 0.31 286,000 116,371
Huddersfield King Street 15.9 25 0 1 0 9 0.06 0.57 270,000 173,525
Hull Whitefriargate 14.4 18 1 1 0 1 0.07 0.07 320,000 112,596
Bristol Corn Street/ Clare Street 15.1 35 9 0 1 19 0.00 1.26 460,000 182,747
Norwich Pottergate / Bedford Street 43.5 69 10 1 0 19 0.02 0.44 143,000 60,319
Exeter High Street 35.7 31 8 0 0 8 0.00 0.22 129,000 49,242
York Stonegate 6.6 43 19 2 0 6 0.30 0.91 210,000 83,552
Lincoln High Street 178.2 46 10 5 3 38 0.03 0.21 103,000 39,825
Sources: Open Street Map (shops data), Heritage England (listed buildings data) calculated within high street
boundary.
Table 5-9 presents selected city-level characteristics assembled from external sources. We note
that – aside from the total number of listed building in the city – the remaining three characteristics

Heritage and the value of place
52
are co-varying to a large extent, as indicated by the high correlation coefficients between the
number of listed buildings of category I and II* and the university qualifications (0.9) as well as the
Gini coefficient (0.8). The Gini coefficient provides a measure of income inequality in a
geographical area. All of the cities had a Gini coefficient around 0.4. The highest Gini coefficient
(indicating that incomes are distributed less equally) was found for York (0.42) with the lowest for
Exeter (0.37) but the difference range between the eight cities was not notable, with high
correlation between the cities. Therefore, it is likely that the impact of these characteristics on WTP
(if any) would be difficult to disentangle using statistical analysis due to insufficient variation within
the analysed dataset and they are not included in the function models.
Table 5-9 City characteristics
All listed
buildings
Listed buildings
(category I and
II*)
% population
with
university
(level 4)
qualifications
Gini
coefficient
Index of
multiple
deprivation:
Income rank
(worst to best
out of 317
Local
Authorities in
England)
Average
household
income (self-
reported in
survey)
Bolton 355 20 22.20% - 24/317 £24,759
Huddersfield 3023 80 23.90% 0.39 13/317 £23,341
Hull 1031 186 27.70% 0.40 14/317 £22,750
Bristol 985 107 28.60% 0.40 12/317 £37,156
Norwich 2140 265 32.80% 0.40 106/317 £34,970
Exeter 466 24 15.20% 0.37 182/317 £28,119
York 1611 244 32.40% 0.42 147/317 £31,846
Lincoln 418 82 21.30% - 146/317 £30,181
Sources: Heritage England (listed buildings data), Census 2011 (educational qualifications data), Cities Outlook
201786
– based on ONS data (Gini coefficient). Note: Gini coefficient values for Bolton and Lincoln were not available.
Gini coefficient characteristic is included to illustrate the level of income inequality within each of the analysed cities,
as a potentially relevant differentiating factor related to city-specific circumstances such as preferences, spending
patterns and attitudes towards heritages shaping average WTP for heritage among the local population.
86 https://www.centreforcities.org/reader/cities-outlook-2017/city-monitor-latest-data/13-gini-coefficient/

Heritage and the value of place
53
5.2.4 Willingness to Pay values
5.2.4.1 Historic high streets
To understand the value that local residents place in their local heritage, the survey put forward a
hypothetical scenario where a fund would be set up by a local trust to maintain the historic
character of the high street in good condition, supported by voluntary donations. When asked if
they would be willing to support such a fund in principle, local residents were more likely to be
willing to pay in principle for a Pre-industrial high street than an Industrial-era one. The proportion
of ‘no’ responses was higher for Industrial-era high streets (nearly two thirds, or 62%, not willing
to pay in principle) than for Pre-industrial high streets (under a half, at 46%). The highest
proportion of ‘no’ in principle responses came from Huddersfield at 78% of the sample. This may
link to the lower levels of pro-heritage attitudes found in this city, the socioeconomic differences
between cities identified in Sections 5.2.1 and 5.2.2, or other local circumstances. Following from
the findings in Section 5.2.3, t-tests found no statistical significance in the association between
those who consider their high street in good or fair condition and likelihood to pay in principle.
We explore the factors that drive WTP in regression analysis in Appendix Table 8-8 and Table 8-9.
The most common reasons given for not being willing to pay for a historic high street were
personal budget constraints (33%), or the notion that contributing to the upkeep of the high street
should come from local taxes (23%) (details on the reasons behind reported willingness to pay can
be found in Appendix Table 8-10). This suggests that the WTP could have been higher if the
valuation scenario had been different (i.e., based around local taxes). However, we do not know
how many other respondents may have protested the taxes scenario. We treat people who are
not willing to pay as £0 bids in the calculation of mean WTP.
Table 5-10 Heritage conservation of high streets: Willingness-to-pay in principle
City Exeter Lincoln Norwich York
Total:
Pre-
industria
l
Bolton Bristol Huddersf
ield Hull
Total:
Industria
l-era
Site The High
Street
The High
Street
Potter-
gate /
Bedford
Street
Stone-
gate
Church-
gate /
Deans-
gate
Corn
Street/
Clare
Street
King
Street
White-
friargate
Yes 19.2% 10.1% 18.9% 19.7% 16.5% 15.6% 12.5% 3.8% 18.0% 11.6%
Maybe 34.7% 41.0% 38.5% 37.7% 38.0% 25.5% 36.0% 18.7% 25.8% 26.8%
No 46.2% 48.9% 42.6% 42.6% 45.5% 58.9% 51.5% 77.6% 56.2% 61.6%

Heritage and the value of place
54
Based on the responses described in Table 5-10, respondents are either presented with a choice
of payment amounts (if yes or maybe willing to pay in principle), or assigned a £0 bid (if not willing
to pay in principle). All of these responses are used to estimate mean willingness to pay for high
streets.
• Willingness to pay in the form of a donation to a local trust to maintain the
historic character of Pre-industrial high streets in good condition is £9.29 per
household per year on average, ranging from a low of £8.61 for the High Street
in Lincoln, and a high of £13.07 for Stonegate in York. The distribution of WTP
across cities is not wide, which provides greater confidence in the
homogeneity of the Pre-industrial high streets surveyed (and is reflected in
the confidence intervals in the Total Pre-industrial column).
• WTP to maintain the historic character of Industrial-era high streets in good
condition is lower at £8.51 per household per year on average. The
distribution of WTP across cities is wider (as reflected in the confidence
intervals in the Total Industrial-era column), ranging from a low of £3.34 for
King Street in Huddersfield, and a high of £11.63 for Corn Street/ Clare Street
in Bristol. This may suggest greater heterogeneity of the Industrial-era high
streets surveyed, which can be explored further through function transfer
testing.
Recall that in all cases, and as standard in CV surveys, WTP values include both positive values and
non-positive (zero) values, ensuring that the values are representative of the preferences of all
local people.
Table 5-11 High Street household WTP values
City Exeter Lincoln Norwich York
Total:
Pre-
industrial
Bolton Bristol Hudders-
field Hull
Total:
Industrial-
era
Site The High
Street
The High
Street
Potter-
gate /
Bedford
Street
Stone-
gate
Church-
gate /
Deans-
gate
Corn
Street/
Clare
Street
King
Street
White-
friargate
Mean (std.
err.)
£9.60
(£1.40)
£8.61
(£1.36)
£8.74
(£1.28)
£13.07
(£2.77)
£9.29
(£0.76)
£10.56
(£2.65)
£11.63
(£2.34)
£3.34*
(£1.25)
£9.28*
(£2.81)
£8.51*
(£1.12)
Lower
confidence
interval
(CI) (95%)
£6.84 £5.92 £6.20 £7.59 £7.80 £5.32 £7.02 £0.88 £3.73 £6.31
Median £2.25 £0.38 £2.75 £3.50 £2.25 £0.00 £0.00 £0.00 £0.00 £0.00
Sample
size 203 225 175 171 774 180 203 148 200 731
Note: Star (*) indicates that the difference in WTP value within a given city and outside of that city is significant at
95% confidence level in two-sample t-test.

Heritage and the value of place
55
The motivations behind this payment are split, with 36% of the sample being willing to donate for
the preservation of the high street’s buildings because of their historical and architectural interest
and a further 19% because the high street itself is an important site of historical value that should
be protected. However, over a third (35%) claimed to be motivated to pay not just for the high
street, but also as an expression of support for all heritage in city (for further details, see Table
8-10). This suggests that some respondents may have been insensitive to the scope87 of the site
being valued, giving a WTP value that is representative of heritage in the city more broadly. This
would suggest that people’s WTP is in part an ethical ‘pro-heritage’ statement. Such motivations
have also been found in valuation studies in the environment and elsewhere, drawing into
question whether the preferences elicited through WTP studies are truly reflective of the good or
service described in the survey.88 To some extent, it will never be possible to exclude the ethical
position of a person from their WTP from surveys of this kind. It may also be that respondents
have difficulty separating the historic character of the high street from the wider character of the
city in which it is based. One option would be to exclude individuals who indicate that they were
valuing a larger good than intended. However, we also have to account for the possibility that
respondents are not responding to the follow-up motivation question in a fully considered way.
Therefore, without additional evidence, we do not recommend excluding such a large portion of
the sample based on their responses to this single question, when interpretation of their actual
motivations for their valuation are unclear. However, we do urge caution that the WTP values may
be partially driven by the values the local people hold for the wider historic core in which a high
street is located.
As stated previously statistical validity tests use multivariate regressions to understand if WTP is
driven by those factors which have been found to drive WTP in previous studies, thus increasing
the confidence in the results. (Appendix Table 8-8) Regression analysis shows that in the high
street pooled regressions (pooling all Pre-industrial high streets into one regression and Industrial-
era high streets into another), that the factors that are theoretically expected to be associated with
WTP values are statistically significant and in the correct direction. Specifically, survey respondents
on higher household incomes on average have higher WTP values, as well as those who are older,
those who are members of a heritage, conservation or environmental organisations (an indicator
of engagement with heritage), and those who would rank public spending on heritage among their
top five priority areas.
87 Sensitivity to scope occurs, for example, if someone is presented with a scenario of preserving a single heritage site and preserving 100
heritage sites, the amount they state should differ in magnitude in each case. If they state a similar WTP in both situations, their responses
are unreliable and insensitive to the number of sites being valued.
88 Bandara and Tisdell 2005

Heritage and the value of place
56
Higher education (education level as reported by survey respondents) was significantly associated
with higher WTP for Industrial-era high streets only, and not significant for any of the individual
Pre-industrial high streets. Following a similar pattern, frequency of visits to the high street was
significantly associated with higher WTP for Industrial-era high streets, but not Pre-industrial high
streets. Agreement/strong agreement with the statement that 'it is important to preserve the
historic character of our cities' was significantly associated with higher WTP for Industrial-era high
streets only in the pooled models, although individual Pre-Industrial high streets did have a
positive and significant association between WTP and agreement with this statement (Pottergate
/ Bedford Street in Norwich and Stonegate in York). Conversely, the subjective perception that the
high street is in good condition was significantly negatively associated with WTP for Pre-industrial
high streets only, and not significant in case of the pooled Industrial-era high streets.
The only city-specific characteristic included in the pooled high streets regressions is an indicator
of the overall character of the city (Pre-industrial/Industrial-era). This choice of variables was
motivated by two reasons: First, we found few statistically significant differences in WTP between
cities after the main demographic and attitudinal factors as well as site usage characteristics were
controlled for. Second, due to the high correlation between many of the city-level characteristics
summarised in Table 5-9, their effects would be difficult to disentangle using regression analysis.
Therefore, we decided to focus on Pre-industrial/Industrial-era character of the city as a
characteristic that captures the multidimensional differences between the eight cities in a
summary way.89 In the pooled regression including all eight of the high streets, pre-industrial
character of the city was significantly positively associated with WTP values.
Given the importance of income as a theoretical driver of WTP in statistical validity testing, it is
worth noting that four of the individual high street regressions showed no significant association
89 Overall, the most comprehensive way to capture unique location-specific factors which may affect WTP in the context of this study would
require including city indicator variables in regression analysis. However, this approach has two major drawbacks: First, it provides little
understanding of what the location-specific WTP drivers may be, because none of these potential drivers are included in the analysis (for
example, if average WTP in city A is found to be lower than in city B, this would be interpreted simply as an idiosyncrasy of city A instead of
being attributed to some measurable characteristic that differentiates city A from B). Second, it is not suitable for benefit transfer
applications, as the estimated location-specific impact cannot be transferred outside of the set of locations included in the sample dataset.
Therefore, in the function transfer regressions we focus on broader city-level characteristics, such as those summarised in Table 5-9.
However, as these variables stay constant across all observations in the same city, they are effectively equivalent to a weighted average of
city indicators – and therefore the number of these variables that can be included in a single pooled regression is limited by the total number
of cities in our sample as well as by the amount of variation in WTP between cities. In order to balance between the need to account for city-
specific characteristics that might affect willingness to pay, the need for sufficient variation in the sample to allow for estimating the effect
of these characteristic on WTP, and the applicability of results outside of the collected sample we selected pre-industrial character of the
city as the only city-level characteristic included in benefit transfer regressions.

Heritage and the value of place
57
between household income and WTP: Exeter High Street, Lincoln High Street, Churchgate /
Deansgate in Bolton and King Street in Huddersfield. Note that in two of these cases (Exeter and
Huddersfield) sample sizes are lower due in part to missing observations for the household
income question. This may be a result of sensitivities around these questions and potential
interviewer bias introduced in face to face interviews (the majority of missing income observations
occurred in face to face surveys). This also affects model fit, with adjusted R2 values varying from
25% in Potter-gate / Bedford Street Norwich and 21% in Church-gate / Deans-gate Bolton to only
2% in Exeter High Street, where sample loss due to missing income data was greatest.
Overall, the statistical testing of the association between WTP and theoretical drivers of heritage
value through regression models when pooled for Pre-industrial and Industrial-era high streets
provides moderate confidence in the robustness of the results. While statistical validity tests are
less strong in some individual high street regressions, in some cases this is driven by regression
sample size issues due to missing data on household income. While this does not affect the mean
WTP values obtained, it will impact on the data and information available for adjusted and function
transfer testing.
5.2.4.2 Historic civic buildings
The proportion of respondents not willing to pay in principle for historic civic buildings was close
to one half (53% in the case of town halls, 51% in the case of libraries). The highest proportion of
‘no’ in principle responses for town halls came from Bolton at 65%, and for libraries from Hull at
62% of the sample. This may reflect the character of the town hall, or the lower socioeconomic
status of the local residents or other local circumstances. Following from the findings in Section
5.2.3, t-tests found no statistical significance in the association between those who consider their
civic building in good or fair condition and likelihood to pay in principle.
The most common reasons given for not being willing to pay for a historic civic building were
again personal budget constraints (31% for town halls and 39% for libraries), or a protest that
contributing to the upkeep of the high street should come from local taxes (33% for town halls
and 28% for libraries, meaning that this reason is higher for civic buildings than for high streets,
which may be linked to the council services that are delivered from many civic buildings)
(Appendix Table 8-11; Table 8-12).
Table 5-12 Heritage conservation of historic buildings: Willingness-to-pay in principle
City Bolton Exeter Hudders-
field Norwich
Total:
Town
hall
Bristol Hull Lincoln York Total:
Library

Heritage and the value of place
58
Site Bolton
Town
Hall
Exeter
City
Council
(Guildhall)
Huddersfield
Town Hall
Norwich
City Hall
Bristol
Central
Library
Hull
Central
Library
Lincoln
Central
Library
York
Central
Library
Yes 12.6% 22.1% 7.6% 10.1% 14.0% 16.5% 16.0% 12.9% 14.1% 14.5%
Maybe 22.8% 31.7% 34.7% 37.9% 33.5% 42.7% 21.9% 34.2% 38.4% 34.9%
No 64.5% 46.2% 57.7% 52.1% 52.5% 40.8% 62.1% 52.9% 47.4% 50.6%
Based on the responses described in Table 5-12, respondents are either presented with a choice
of payment amounts (if yes or maybe willing to pay in principle), or assigned a £0 bid (if not willing
to pay in principle). All of these responses are used to estimate mean willingness to pay for civic
buildings.
• Willingness to pay in the form of a donation to a local trust to maintain the
historic character of town halls in good condition is £7.29 per household per
year on average. The distribution of average WTP values across town halls
ranges from a low of £4.47 for Bolton Town Hall to a high of £9.04 for Exeter
City Council (Guildhall).
• WTP to maintain the historic character of libraries in good condition is higher
at £9.79 per household per year on average. This higher WTP may be related
to peoples’ high propensity to visit libraries (37% of the sample) compared to
town halls (21%) (recall Section 5.2.3). The distribution of average WTP across
the four library sites ranges from a low of £7.76 for Hull Central Library to a
high of £13.49 for York Central Library.
Additional analysis shows that WTP for historic libraries is significantly positively associated with
regular library usage (t=6.5, p=0.000, with regular user defined as more than once per month in
the last three years; see also Appendix Table 8-17). These results indicate that more regular users
hold higher values for the historic library. This aligns with theoretical expectations, that greater
familiarity with a heritage site would lead to greater values for its maintenance. However, the
possibility that people’s stated value is at least partially influenced by the use of those services
cannot be completely avoided, which, if it is true, would lead to an inflation of WTP values (since
the services themselves provide direct benefits to those users). While the survey instructed
respondents to ignore the services provided when stating their maximum WTP, it is impossible to
test that some conflation has not occurred. However, this is always a challenge when valuing
‘quasi-market’ goods that have both direct user services and indirect spillover benefits to the local
place. Nonetheless, this methodological consideration is further justification for applying the more
conservative lower bound WTP values when aggregating to local populations, to account for this
uncertainty and to avoid over-attribution of values.
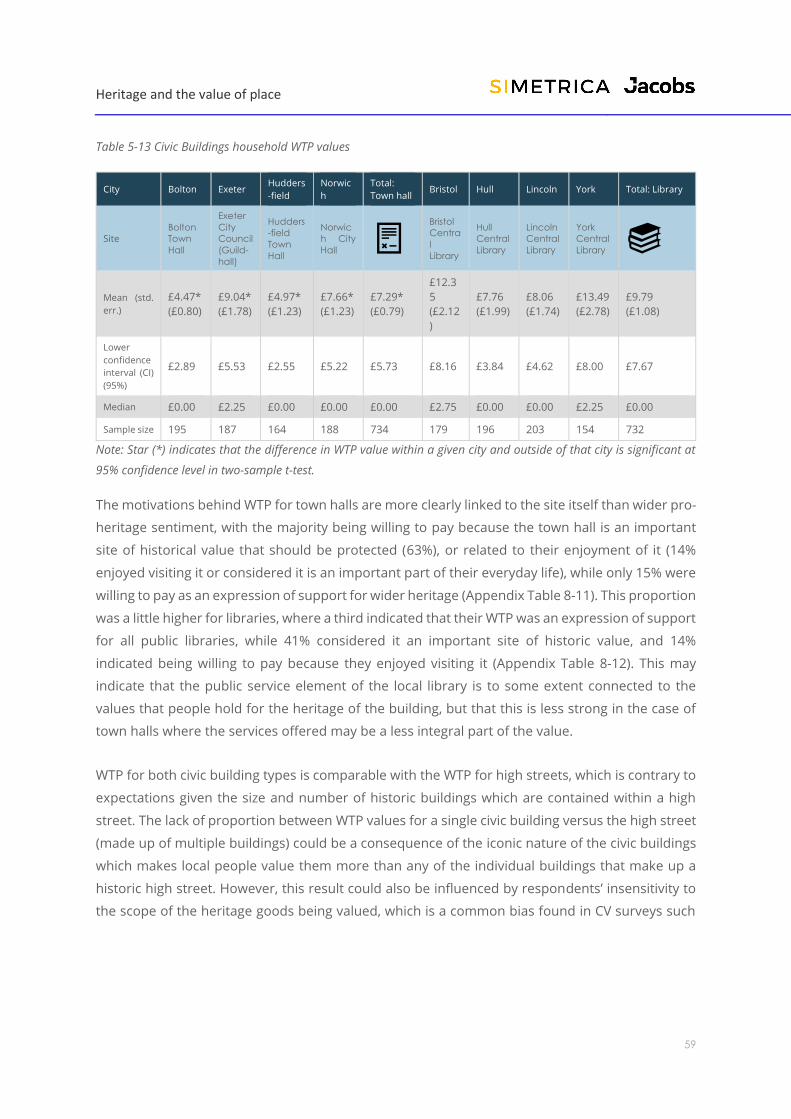
Heritage and the value of place
59
Table 5-13 Civic Buildings household WTP values
City Bolton Exeter Hudders
-field
Norwic
h
Total:
Town hall Bristol Hull Lincoln York Total: Library
Site Bolton
Town
Hall
Exeter
City
Council
(Guild-
hall)
Hudders
-field
Town
Hall
Norwic
h City
Hall
Bristol
Centra
l
Library
Hull
Central
Library
Lincoln
Central
Library
York
Central
Library
Mean (std.
err.)
£4.47*
(£0.80)
£9.04*
(£1.78)
£4.97*
(£1.23)
£7.66*
(£1.23)
£7.29*
(£0.79)
£12.3
5
(£2.12
)
£7.76
(£1.99)
£8.06
(£1.74)
£13.49
(£2.78)
£9.79
(£1.08)
Lower
confidence
interval (CI)
(95%)
£2.89 £5.53 £2.55 £5.22 £5.73 £8.16 £3.84 £4.62 £8.00 £7.67
Median £0.00 £2.25 £0.00 £0.00 £0.00 £2.75 £0.00 £0.00 £2.25 £0.00
Sample size 195 187 164 188 734 179 196 203 154 732
Note: Star (*) indicates that the difference in WTP value within a given city and outside of that city is significant at
95% confidence level in two-sample t-test.
The motivations behind WTP for town halls are more clearly linked to the site itself than wider pro-
heritage sentiment, with the majority being willing to pay because the town hall is an important
site of historical value that should be protected (63%), or related to their enjoyment of it (14%
enjoyed visiting it or considered it is an important part of their everyday life), while only 15% were
willing to pay as an expression of support for wider heritage (Appendix Table 8-11). This proportion
was a little higher for libraries, where a third indicated that their WTP was an expression of support
for all public libraries, while 41% considered it an important site of historic value, and 14%
indicated being willing to pay because they enjoyed visiting it (Appendix Table 8-12). This may
indicate that the public service element of the local library is to some extent connected to the
values that people hold for the heritage of the building, but that this is less strong in the case of
town halls where the services offered may be a less integral part of the value.
WTP for both civic building types is comparable with the WTP for high streets, which is contrary to
expectations given the size and number of historic buildings which are contained within a high
street. The lack of proportion between WTP values for a single civic building versus the high street
(made up of multiple buildings) could be a consequence of the iconic nature of the civic buildings
which makes local people value them more than any of the individual buildings that make up a
historic high street. However, this result could also be influenced by respondents’ insensitivity to
the scope of the heritage goods being valued, which is a common bias found in CV surveys such

Heritage and the value of place
60
as this. 90 Note that none of the town halls were located within the high street valued, and
respondents were asked to consider them as entirely separate payments.
Statistical validity tests show that in the civic building pooled regressions (one for town halls and
one for libraries), that the factors that are theoretically expected to be associated with WTP values
are statistically significant and in the correct direction. Specifically, those on higher household
incomes on average have higher WTP values, and those who would rank public spending on
heritage among their top five priority areas (an indicator of engagement with cultural heritage)
have higher WTP on average for both town halls and public libraries.
The association between frequency of visits to the civic building in the past 12 months was
significant for libraries only (not town halls) which may be related to the more regular day to day
services that libraries provide (e.g. book lending, access to information), compared to the more
one-off services of many town halls.
The subjective perception that the high street is in good condition was not significantly associated
with WTP for in either of the pooled civic building regressions or the individual civic building
models. Similarly, higher education was not significantly associated with WTP for any of the pooled
civic building regressions.
WTP was significantly higher for those who are members of a heritage, conservation or
environmental organisations in the town hall pooled regression only and not for libraries.
Agreement/strong agreement with the statement that 'historic buildings should be preserved for
future generations' was significantly associated with higher WTP in only two of the individual civic
building models (Bolton Town Hall and York Central Library).
The only city-specific characteristic included in the pooled civic building regressions is an indicator
of the overall character of the city (Pre-industrial/Industrial-era). This is motivated – similarly as in
the case of high streets – by two reasons: First, the lack of statistically significant differences in
WTP between cities after the main demographic and attitudinal factors as well as site usage
characteristics were controlled for. And second, the high correlation between many of the city-
level characteristics summarised in Table 5-9 – which means that their effects would be difficult to
disentangle using regression analysis. In the end, city character was not found to be a significant
driver of WTP – either for town halls, or libraries.
90 Carson 1997

Heritage and the value of place
61
Given the importance of income as a theoretical driver of WTP in statistical validity testing, it is
worth noting that four of the individual civic building regressions showed no significant association
between household income and WTP: Lincoln Central Library, Bolton Town Hall, Exeter City Council
(Guildhall), and Huddersfield Town Hall. Note that three of these cases fall in the town hall category,
and that in two of these cases (Exeter and Huddersfield) sample sizes are lower due in part to
missing observations for the household income question. Again, this may be a result of
sensitivities around these questions and potential interviewer bias introduced in face to face
interviews (the majority of missing income observations occurred in face to face surveys). This also
affects model fit, with adjusted R2 values varying from 15-20% in the pooled models to negative
figures in the case of Exeter City Council (Guildhall) (indicating that the inclusion of covariates in
the regression introduce noise to the prediction of WTP).
Overall, the statistical testing of the association between WTP and theoretical drivers of heritage
value through regression models when pooled for civic buildings is weaker, and individual town
hall regressions are weaker still, which provides less confidence in the robustness of the results
for town halls. However, in some cases this is driven by regression sample size issues driven by
missing data on household income, which is improved in the pooled regressions.
5.2.5 Summary
This study produces average WTP values for two types of high streets: Those based in Pre-
industrial cities, and those based in Industrial-era cities. Historic high street and town hall WTP
values represent a combined ‘use and non-use values held by local residents’ who are familiar with
the high street.
• The WTP estimate is £7.80 to maintain the historic character of Pre-
industrial high streets in good condition per household per year. This is
based on a pooled dataset of WTP values for four Pre-industrial high streets.
The average WTP value for Pre-industrial high streets is £9.28, with a range of
average WTP values from £8.61 to £13.07 for each high street.91
• The WTP estimate is £6.31 to maintain the historic character of
Industrial-era high streets in good condition per household per year. This
is based on a pooled dataset of WTP values for four Industrial-era high streets.
The average WTP value for Industrial-era high streets is £8.51, with a range of
average WTP values from 3.34 to £11.63 for each high street. The wider range
for Industrial-era compared to Pre-industrial high streets indicates that there
91 In all cases the possible WTP responses include both positive values and non-positive (zero) values, in line with best practice, ensuring
that those who have no actual value for the site are also represented in the study.

Heritage and the value of place
62
is more variation between Industrial-era high streets in our sample than Pre-
industrial high streets.
• Variation between sites can lead to greater levels of transfer errors (which will
be tested in the subsequent section). Part of this variation is explained by the
heterogeneity of the Industrial-era cities, with some in areas with substantially
lower socioeconomic status of residents and lower concentrations of listed
buildings. In the subsequent section we explore the effect that these
differences have on WTP through benefit transfer testing.
This study produces average WTP values for two types of historic civic building: town halls and
public libraries. Historic civic building WTP values combine users and non-users in the sample, with
controls for any difference in the values obtained, but exclude those who have never heard of the
building.
• The WTP estimate is £5.73 to maintain the historic character of town
halls in good condition per household per year. This is based on a pooled
dataset of WTP values for four historic town halls. The average WTP value for
four pooled town halls is £7.29, with a range of average WTP values from £4.47
to £9.04 for each town hall.
• The WTP estimate is £7.67 to maintain the historic character of libraries
in good condition per household per year. This is based on a pooled dataset
of WTP values for four historic libraries. The average WTP value for the four
pooled libraries is £9.79, with a range of average WTP values from £7.76 to
£13.49 for each library.
• Again, the level of transfer error that such variation introduced is tested in
Section 5.3.
This higher WTP for libraries may be related to peoples’ high propensity to visit libraries (37% of
the sample) compared to town halls (21%) (recall Section 5.2.3). Additional analysis shows that
WTP for historic libraries is significantly positively associated with regular library usage. These
results indicate that more regular users hold higher values for the historic library, which aligns
with theoretical expectations. There is also some evidence of survey respondents interpreting the
valuation scenario in a different way to intended. These kind of information effects and biases are
common in SP surveys and we attempt to minimise their effects through careful survey design.
For instance, statistical tests show that those who regularly visit libraries and use their services
report a higher WTP to maintain the historic library building in good condition. This aligns with
theoretical expectations, that greater familiarity with a heritage place would lead to greater values
for its maintenance. However, it is not possible to avoid the possibility that people’s stated value
is at least partially influenced by the use of those services, which, if it is true, would lead to an
inflation of WTP values (since the services themselves provide direct benefits to those users). The

Heritage and the value of place
63
same is true of town halls, although a smaller proportion of the sample group had used their
services. While the design of the survey instructed respondents to ignore the services provided
when stating their maximum WTP, it is impossible to test that some conflation has not occurred.
However, this is always a challenge when valuing ‘quasi-market’ goods that have both direct user
services and indirect spillover benefits to the local place.
Finally, an important factor that can affect the robustness of CV surveys occurs if respondents are
insensitive to the scope of the good being valued. In other words, if someone is presented with a
scenario for preserving a single heritage site or one for preserving 100 heritage sites, the amount
they are willing to pay would be reasonably expected to differ in magnitude in each case. This
would be detected if respondents state a similar WTP in both situations, suggesting that their
responses are insensitive to the number of sites being valued. 92 In this study there is some
possible evidence that insensitivity to scope may be present, due to the fact that WTP values for
the historic character of a high street (which contains many historic buildings) is not significantly
higher than WTP values for individual civic buildings. However, it is not 100% clear that this is an
insensitivity to scope issue, as it could be that people consider their civic buildings more valuable
in isolation – perhaps due to their iconic role within the place-making of the city – than many of
the historic buildings in a high street. Follow-up questions may provide supporting evidence, albeit
with the familiar lack of certainty about a respondents’ complex motivations for being willing to
pay. A third of respondents stated that their WTP value is an expression of their pro-heritage
beliefs and their broader interest in preserving all heritage in the city, which could lead to some
inflation of the WTP estimates. In extreme cases, such respondents could be excluded from the
sample. However, given that follow-up questions do not fully explain the motivations behind WTP,
it is not advisable to reduce the sample in this way, as it reduces the predictive power of the benefit
transfer tests.
• For the purpose of benefit transfer, it is recommended that business
cases use the more conservative lower bound WTP values. Lower bound
WTP is estimated as the lower limit 95% confidence interval around the
mean WTP. This is to account for the fact that mean WTP is likely to be
inflated by the inclusion of direct use values for those who use the sites
for services and possible insensitivity to scope. This means that average
WTP may not be the most accurate estimate for external use, so we
recommend taking the lower bound WTP for benefit transfer.
92 Carson 1997

Heritage and the value of place
64
5.3 Benefit Transfer (BT)
• Benefit transfer is the process of taking average WTP values for a category of local
heritage (high street or civic building in this case) from one research study and
transferring it to estimate the value of another high street or civic building.
• Surveying multiple sites enables the values to be ‘transfer tested’ to estimate the level
of ‘error’ that is introduced when transferring to another historic high street or civic
building in a different place.
• We perform a set of transfer tests that sequentially places one of the study sites in the
role of an unknown site and predicts the WTP for this site, based on the pooled WTP
values from the other remaining ‘study sites’. This replicates the process that would be
applied if we were able to know the WTP for a site we want to value in a business case.
• A certain amount of transfer error is expected, but WTP values should only be
transferred to other sites if they are within acceptable levels of error, which is
recommended to be less than 40%.
• Transfer testing allows us to make conclusions about the most appropriate transfer
method for each category of local heritage values. We label clearly in the Local Heritage
Value Bank which WTP values for local heritage values are robust for benefit transfer
and under which methods.
• Pre-industrial high streets: Transfer errors are safely below the acceptable level of
transfer error using any of the three transfer methods. Conclusion: WTP values for Pre-
industrial cities can be transferred to comparable sites with relatively low risk of transfer
error.
• Historic libraries: Transfer errors are at or below the acceptable levels of transfer error
for simple and adjusted transfer. Conclusion: WTP values for historic libraries can be
transferred to comparable sites with acceptable risk of transfer error using these two
methods but applying function transfer is not recommended.
• Town halls: Acceptable levels of transfer error are achieved only with adjustment for
the income differentials between towns (adjusted transfer method). Conclusion:
Caution should be applied when transferring these values, and only with consideration
of the income differences between the study town hall sites and the business case site.
• Extra caution should be applied to Industrial-era high streets, where transfer errors
were outside of the acceptable level with all transfer methods, likely because the WTP
values varied too much between the four sites surveyed. Conclusion: Industrial-era high
street WTP values should be seen only as indicative of the values that people hold for
these four particular Industrial-era high streets, and not be used for transfer to
Industrial-era high streets as a whole.

Heritage and the value of place
65
Benefit transfer is the process of taking average WTP values for a category of local heritage (for
instance, Pre-high streets or civic buildings) from one research study (such as this one) and
transferring it to another high street or civic building, with confidence that it will be a robust
representation of the value that people would state for that heritage site if they were asked.
In statistics as a sample size grows, the average gets closer to the ‘true’ average of the whole
population. Surveying multiple similar heritage sites in each category of high street and civic
building, rather than one, gives greater confidence that the WTP values are representative of ‘an
average historic site of that type’.
Some error will always be introduced through benefit transfer because no two heritage sites are
the same in characteristics. It is recommended to statistically test how much error is created when
transferring from the ‘study sites’ (the historic high streets and civic buildings surveyed as part of
this study) to a hypothetical ‘policy site’, which would be the historic high street or civic building
that needs to be valued for a business case (or other purpose) but for which WTP values have not
previously been estimated. To do this - and following best practice in European Union and UK
Government studies93 - a set of transfer tests are run that sequentially places one of the study
sites in the role of an unknown ‘policy’ site and predicts the WTP for this site, based on the pooled
WTP values from the other remaining ‘study sites’. Transfer tests tell us the amount of ‘error’ that
is introduced via the transfer. A certain amount of error is expected, but WTP values should only
be transferred to other sites if they are within acceptable levels of error, as recommended by 40%
in the literature.94
The procedure as described above is known as ‘simple’ unit transfer. In addition to ‘simple’ benefit
transfer, which takes a pooled WTP for all of the four sites surveyed, there are also more
sophisticated transfers which allow the analyst – the person calculating the business case for the
heritage site – to adjust the WTP values to the characteristics of that site, such as income or other
demographic or geographic data. This has the potential to adjust the WTP value to make it more
tailored to the specific characteristics and local population of the historic place. However, adjusted
or function transfers also introduce more statistical complexity, and this can increase the risk of
transfer errors. It is therefore necessary to test for the amount of error introduced using each of
the three types of benefit transfer: simple, adjusted, and function transfer.
93 Lawton et al. 2018; D. Fujiwara et al. 2018; S. Mourato et al. 2014
94 Ready and Navrud 2006
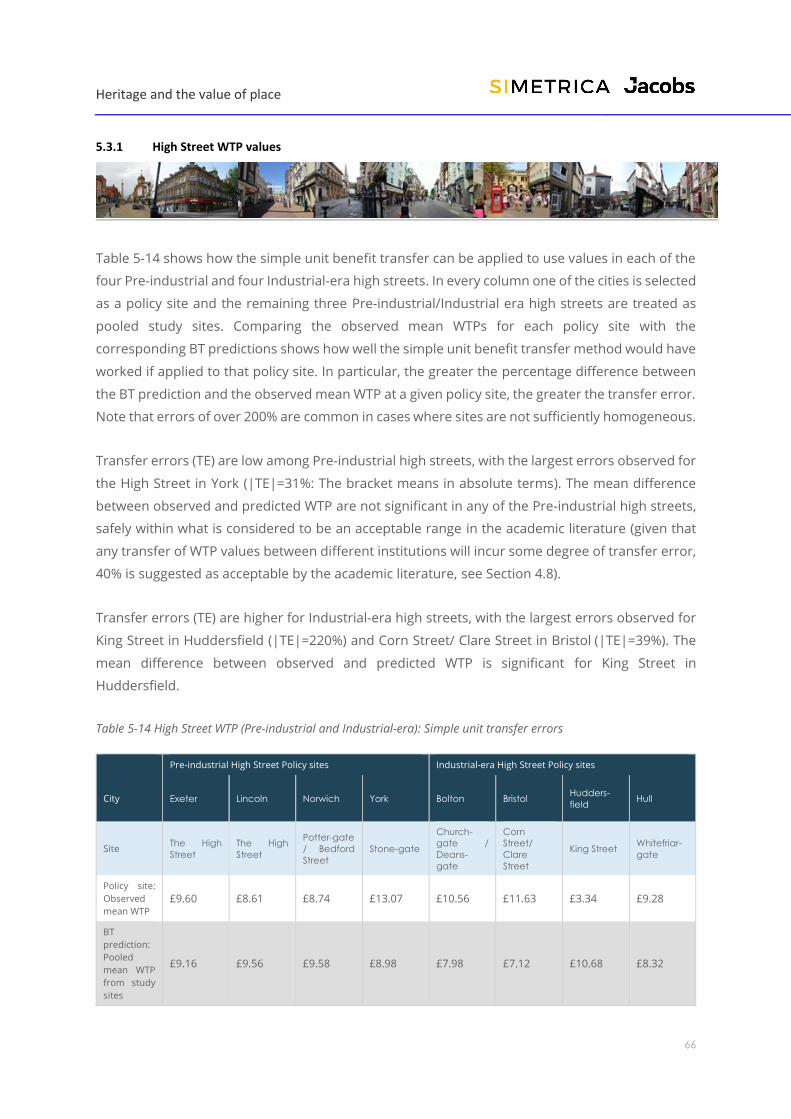
Heritage and the value of place
66
5.3.1 High Street WTP values
Table 5-14 shows how the simple unit benefit transfer can be applied to use values in each of the
four Pre-industrial and four Industrial-era high streets. In every column one of the cities is selected
as a policy site and the remaining three Pre-industrial/Industrial era high streets are treated as
pooled study sites. Comparing the observed mean WTPs for each policy site with the
corresponding BT predictions shows how well the simple unit benefit transfer method would have
worked if applied to that policy site. In particular, the greater the percentage difference between
the BT prediction and the observed mean WTP at a given policy site, the greater the transfer error.
Note that errors of over 200% are common in cases where sites are not sufficiently homogeneous.
Transfer errors (TE) are low among Pre-industrial high streets, with the largest errors observed for
the High Street in York (|TE|=31%: The bracket means in absolute terms). The mean difference
between observed and predicted WTP are not significant in any of the Pre-industrial high streets,
safely within what is considered to be an acceptable range in the academic literature (given that
any transfer of WTP values between different institutions will incur some degree of transfer error,
40% is suggested as acceptable by the academic literature, see Section 4.8).
Transfer errors (TE) are higher for Industrial-era high streets, with the largest errors observed for
King Street in Huddersfield (|TE|=220%) and Corn Street/ Clare Street in Bristol (|TE|=39%). The
mean difference between observed and predicted WTP is significant for King Street in
Huddersfield.
Table 5-14 High Street WTP (Pre-industrial and Industrial-era): Simple unit transfer errors
Pre-industrial High Street Policy sites Industrial-era High Street Policy sites
City Exeter Lincoln Norwich York Bolton Bristol Hudders-
field Hull
Site The High
Street
The High
Street
Potter-gate
/ Bedford
Street
Stone-gate
Church-
gate /
Deans-
gate
Corn
Street/
Clare
Street
King Street Whitefriar-
gate
Policy site:
Observed
mean WTP
£9.60 £8.61 £8.74 £13.07 £10.56 £11.63 £3.34 £9.28
BT
prediction:
Pooled
mean WTP
from study
sites
£9.16 £9.56 £9.58 £8.98 £7.98 £7.12 £10.68 £8.32

Heritage and the value of place
67
Difference
(absolute) £0.44 £0.95 £0.84 £4.09 £2.58 £4.51 £7.34 £0.96
Transfer
error 4.6% 11.0% 9.6% 31.3% 24.4% 38.8% 219.8% 10.3%
t-test:
Difference
significant
at 5% level
No No No No No No Yes No
In sum, the simple unit transfer errors are within an acceptable range as suggested in the literature
for Pre-industrial high streets, but not for Industrial-era high streets. This may suggest a higher
level of homogeneity within the Pre-industrial high street sites. Descriptive statistics presented
earlier may point to differences in the characteristics and physical condition of Industrial-era high
streets (Section 5.2.3), as well as the socioeconomic status of their residents (Section 0). In
particular, Huddersfield has considerably lower average household income levels (£23,341) which
regression analysis shows are significantly associated with its lower WTP of £3.34 (approximately
one third of the other Industrial-era high streets’ WTP). Huddersfield also reported the lowest
levels of pro-heritage attitudes of any city. Conversely, Bristol residents report a higher city mean
household income level (£37,156), which is associated with the higher WTP (£11.63) for this high
street. These factors are explored further in the adjusted and function transfer tests below. We
also caveat that the sample size for Huddersfield is lower, which may affect the representativeness
of these results and the statistical power of transfer testing on this city.
In addition, an important contextual factor for Huddersfield is that around the time of the survey
Kirklees Council unveiled a ten-year £250million masterplan for Huddersfield city centre, with
improvements to the leisure and culture offer on the High Street.95 The prospect of a council-
funded regeneration being in the press at the same time as the survey may have led to more
strategic responses and protest answers from Huddersfield residents, who may have been
inclined to give a lower WTP to influence decisions around local taxes and funding (in other words,
respondents may have lowered their WTP values in the belief that it would influence the setting of
local taxes to pay for such an improvement).
Table 5-15 shows that the adjusted unit transfer approach leads to a slight increase in transfer
errors for the Pre-industrial high streets. Despite this, the range of transfer errors using the
adjusted unit transfer approach falls between 4% in the case of the high street in Lincoln and 31%
in the case of Pottergate / Bedford Street in Norwich, which remains within what is considered an
95 Note that this information was only published after the survey went into the field https://www.yorkshirepost.co.uk/news/people/how-
250m-huddersfield-town-centre-masterplan-aims-to-bring-new-life-to-the-high-street-1-9845493

Heritage and the value of place
68
acceptable range. The mean difference between observed and predicted WTP is again not
significant in any of the Pre-industrial high streets.
For Industrial-era high streets adjusted unit transfer approach leads to a decrease in transfer
errors for the two historic high streets where the simple unit transfer errors were largest (Bristol
and Huddersfield), with a slight increase in the two other high streets, although not above an
acceptable transfer error range. The mean difference between observed and predicted WTP is
again significant only in the case of Huddersfield.
Overall, adjusted unit transfer works better for Industrial-era high streets, with an acceptable
range of transfer errors in three out of the four high streets, and a reduction in transfer error in
the Huddersfield King Street case (although still above acceptable thresholds of error). This may
confirm our suspicion that the difference in average household income between Huddersfield (at
the lower income end) and Bristol (at the higher income end) is contributing to the transfer error
between Industrial-era high streets, and that this is partially corrected by adjusting for differences
in residents’ income levels.
Table 5-15 High Street WTP (Pre-industrial and Industrial-era): Adjusted unit transfer errors
Pre-industrial High Street Policy sites Industrial-era High Street Policy sites
City Exeter Lincoln Norwich York Bolton Bristol Hudders-
field Hull
Site The High
Street
The High
Street
Potter-
gate /
Bedford
Street
Stone-
gate
Church-
gate /
Deans-
gate
Corn
Street/
Clare
Street
King
Street
Whitefriar-
gate
Income
adjustment
Policy site:
Mean
income
£29,646 £28,383 £35,123 £31,985 £24,162 £37,535 £21,979 £21,147
Pooled
study sites:
Mean
income
£31,993 £32,910 £29,347 £31,417 £27,825 £22,436 £28,605 £28,647
Income
ratio
(Policy
income /
Study
income)
0.9 0.9 1.2 1.0 0.9 1.7 0.8 0.7
Benefit
transfer
Policy site:
Observed
mean WTP
£9.60 £8.61 £8.74 £13.07 £10.56 £11.63 £3.34 £9.28

Heritage and the value of place
69
BT
prediction:
Pooled
mean WTP
from study
sites,
adjusted
by income
ratio
£8.49 £8.24 £11.46 £9.14 £6.93 £11.91 £8.20 £6.14
Difference
(absolute) £1.11 £0.36 £2.72 £3.93 £3.63 £0.28 £4.87 £3.14
Transfer
error 11.6% 4.2% 31.2% 30.1% 34.3% 2.4% 145.9% 33.8%
t-test:
Difference
significant
at 5% level
No No No No No No Yes No
Table 5-17 shows the mean predicted WTP for historic high streets with the coefficients estimated
in Table 5-16. Both Pre-industrial and Industrial-era cities are included in the same regression
Table 5-16 with a control for the difference between the two city types. By increasing the available
sample size, this approach yields more precise coefficient estimates. It also allows us to investigate
whether the two city types are significantly different from each other. We note that the coefficient
estimates are fairly stable across Table 5-16, in line with our assumption that that the
characteristics included in the regression model have a uniform effect on WTP across all analysed
sites. The results also indicate that high street WTP tends to be higher for sites considered to be
in worse condition, in Pre-industrial cities compared to Industrial cities. WTP is also higher on
average among regular high street visitors, which fits our prior expectations that those who
experience the historic high street more often in their everyday life would value it more in their
sense of place.
The function transfer errors reported in Table 5-17 for Pre-industrial high streets vary between a
low of 4% in the case of the High Street in Lincoln and a high of 17% in the case of Stonegate in
York. This error range is lower than that obtained through adjusted transfer and simple unit
transfer, and so again falls safely below the threshold proposed in the literature. The mean
difference between observed and predicted WTP is again not significant in any of the Pre-industrial
high streets.
The function transfer errors for Industrial-era high streets reported in Table 5-17 all fall close to or
above the minimum acceptable threshold of 40%, with a low of 39% in the case King Street in
Huddersfield and a high of 45-47% in case of the three remaining high streets. This represents a
considerable decrease in transfer error for Huddersfield compared to the simple and adjusted
transfer methods, but at the expense of increased transfer errors elsewhere. The mean difference

Heritage and the value of place
70
between observed and predicted WTP is not significant in any of the Industrial-era high streets,
which indicates an improvement over the simple and adjusted transfer methods.
In sum, while the error range for Pre-industrial high streets is an improvement to that obtained
through adjusted and simple unit transfer, the comparison is mixed in the case of Industrial-era
high streets.
Overall, these results suggest that the reliability of WTP predictions based on the function transfer
approach should be treated cautiously, something that was found in the 2019 AHRC study of
benefit transfer in historic towns and cathedrals96. The low explanatory power of the reduced WTP
regressions for value transfer, as measured by the low adjusted R squared, means that these
regressions are not successful at predicting the individual WTP values (none of them explains more
than 13% of WTP variation within the relevant study sample).
Table 5-16 High Street WTP (Pre-industrial and Industrial-era): Reduced WTP regressions for value transfer
Pre-industrial High Street Policy sites Industrial-era High Street Policy sites
City Exeter Lincoln Norwich York Bolton Bristol Hudders-
field Hull
Site The High
Street
The High
Street
Potter-
gate /
Bedford
Street
Stone-
gate
Church-
gate /
Deans-
gate
Corn
Street/
Clare
Street
King Street Whitefriar-
gate
Household income 0.522*** 0.470*** 0.442*** 0.427*** 0.443*** 0.414*** 0.441*** 0.446***
Thinks high street is in
good condition -0.485*** -0.491*** -0.352*** -0.447*** -0.515*** -0.463*** -0.426*** -0.501***
Visited high street
more than once a
month in last 3 years
0.285** 0.226** 0.191 0.235** 0.252** 0.266** 0.231** 0.216*
Pre-industrial city vs
Industrial-era city 0.351*** 0.394*** 0.333*** 0.349*** 0.376*** 0.413*** 0.263** 0.394***
Constant -4.247*** -3.691*** -3.428*** -3.285*** -3.454*** -3.214*** -3.327*** -3.473***
Observations 1053 981 1016 1018 994 1001 1061 975
Adjusted R-squared 0.126 0.119 0.090 0.097 0.111 0.105 0.086 0.107
Note * indicates the statistical significance of the regression coefficients at the 99% (***), 95% (**) and 90%(*)
confidence levels respectively.
Table 5-17 High Street WTP (Pre-industrial and Industrial-era): Function transfer errors
Pre-industrial High Street Policy sites Industrial-era High Street Policy sites
96 Lawton et al. 2018

Heritage and the value of place
71
City Exeter Lincoln Norwich York Bolton Bristol Hudders-
field Hull
Site The High
Street
The High
Street
Potter-gate
/ Bedford
Street
Stone-gate
Church-
gate /
Deans-gate
Corn Street/
Clare Street King Street
Whitefriar-
gate
Policy site:
Observed
mean WTP
£8.78 £9.79 £9.49 £11.66 £9.81 £11.74 £4.50 £9.81
BT
prediction:
Applying
value
transfer
function
coefficients
from pooled
study sites
to mean
policy site
characteristi
cs
£10.04 £10.14 £10.16 £9.72 £5.39 £6.26 £6.25 £5.24
Difference
(absolute) £1.26 £0.35 £0.68 £1.94 £4.42 £5.48 £1.75 £4.57
Transfer
error 14.3% 3.6% 7.1% 16.6% 45.1% 46.7% 38.8% 46.6%
t-test:
Difference
significant
at 5% level
No No No No No No No No
Note that mean WTP for each site will differ slightly to values presented earlier due to the reduced set of control
variables and resulting model sample size. Regression model significant at p<0.005.
5.3.1.1 Summary
• Pre-industrial high streets: Transfer errors (TE) are safely below the
acceptable level of transfer error among Pre-industrial high streets using
simple, adjusted, and function transfer. We therefore recommend that WTP
values for Pre-industrial cities can be transferred to comparable sites with
relatively low risk of transfer error. We recommend WTP values can be
transferred to other Pre-industrial high streets with acceptable transfer
error. Both simple and adjusted transfer are possible, but we
recommend simple unit transfer which performs best and has lower
informational demands on the analyst.
• Industrial-era high streets: Transfer errors are higher for Industrial-era high
streets, which is in part driven by the significantly lower WTP observed for
Huddersfield. Descriptive data suggests that Huddersfield King Street is
distinct from the Industrial-era high streets in terms of the lower income levels
of local residents, and lower levels of pro-heritage attitudes found in this city.
We also caveat that the sample size for Huddersfield is lower, which may affect
the representativeness of these results and the statistical power of transfer

Heritage and the value of place
72
testing on this city. Huddersfield’s outlier status means that transfer errors for
Industrial-era high streets are above the acceptable threshold in simple and
adjusted transfer. In addition, a ten-year £250million masterplan for
Huddersfield city centre was announced around the time of the survey which
may have led to strategic bidding behaviour (respondents may have lowered
their WTP values in the belief that it would influence the setting of local taxes
to pay for such an improvement). We do not recommend transfer of
Industrial-era high street WTP to other high streets due to the high
transfer errors. However, the WTP values are still applicable to the four
cities themselves, and represent an important contribution to the
evidence base around heritage and the value of local place to residents
of those cities.
5.3.2 Civic Building WTP values
Table 5-18 shows that simple unit transfer errors (TE) cover a broad range among town halls, with
the largest errors observed for Bolton Town Hall (|TE|=71%) and Huddersfield Town Hall
(|TE|=56%) falling above the acceptable range (see Section 4.8). The mean difference between
observed and predicted WTP is significant in case of Bolton Town Hall.
Transfer errors are less variable among libraries, with the largest errors observed for Lincoln
Central Library (|TE|=40%) falling just within the acceptable range. The mean difference between
observed and predicted WTP is not significant in any of the libraries.
In sum, the simple unit transfer errors are at the threshold of what may be considered acceptable
for libraries (at the 40% level), but not for town halls. Descriptive statistics presented earlier may
point to differences in the characteristics and physical condition of historic civic buildings (Section
5.2.3), as well as the socioeconomic status of residents in the cities they are located (Section 0).
For example, Bolton and Huddersfield have relatively low average household income levels among
the town hall sites (£24,759 and £23,341 respectively), which regression analysis shows to be
associated with their lower WTP values (£4.47 and £4.97, respectively), with Huddersfield
moreover being characterised by a low share of regular library visitors. In a similar vein, Hull and
Lincoln are characterised by relatively low average household income levels among the library
sites (£20,920 and £27,568 respectively), with Lincoln furthermore displaying a low share of regular
library users (13%, compared to at least 25% at the other libraries). These factors are explored
further in the adjusted and function transfer tests below.

Heritage and the value of place
73
Another conjecture we explore below relates to the distinction between Pre-industrial and
Industrial-era cities. We suspect that some of the unobservable factors contributing to higher WTP
for high streets in Pre-industrial cities may have a similar impact on WTP for civic buildings. For
instance, there could be complementarities between different historic buildings that are stronger
for Pre-industrial than Industrial-era areas, meaning that clusters of historic buildings are
perceived as more valuable than the sum of the parts. We also caveat that the sample sizes for
Huddersfield and York are lower, which may affect the representativeness of these results and the
statistical power of transfer testing on these cities.
Table 5-18 Civic Building WTP: Simple unit transfer errors
Town Hall Policy Sites Library Policy Sites
City Bolton Exeter Hudders-
field Norwich Bristol Hull Lincoln York
Site Bolton Town
Hall
Exeter City
Council
(Guildhall)
Hudders-
field Town
Hall
Norwich
City Hall
Bristol
Central
Library
Hull Central
Library
Lincoln
Central
Library
York
Central
Library
Policy site:
Observed
mean WTP
£4.47 £9.04 £4.97 £7.66 £12.35 £7.76 £8.06 £13.49
BT
prediction:
Pooled
mean WTP
from study
sites
£7.66 £6.41 £7.76 £7.06 £8.90 £10.18 £11.25 £9.26
Difference
(absolute) £3.19 £2.63 £2.79 £0.60 £3.45 £2.42 £3.18 £4.23
Transfer
error 71.4% 29.1% 56.1% 7.8% 27.9% 31.2% 39.5% 31.4%
t-test:
Difference
significant
at 5% level
Yes No No No No No No No
Table 5-19 shows that the adjusted unit transfer approach leads to a decrease in transfer errors
for the two historic town halls where the simple unit transfer errors were largest (Bolton and
Huddersfield), with a moderate increase for the two other town halls. As a result, the range of
transfer errors using the adjusted unit transfer approach falls between 8% in the case of
Huddersfield Town Hall and 42% in the case of Bolton Town Hall, bringing it very close to what is
considered an acceptable range. The mean difference between observed and predicted WTP is
not significant for any of the four town halls, which is an improvement relative to the simple unit
transfer approach.

Heritage and the value of place
74
For libraries, the adjusted unit transfer approach leads to a slight decrease in transfer errors
across all sites, thus keeping it within the acceptable transfer error range. The mean difference
between observed and predicted WTP is again not significant for any of the libraries.
Overall, adjusted unit transfer appears to work better than the simple unit transfer for civic
buildings. The resulting transfer errors are within the acceptable range for all libraries and three
out of the four town halls, with the transfer error only slightly above the acceptable range in case
of Bolton Town Hall. This may confirm our hypothesis that the difference in average household
income between Bolton and Huddersfield (at the lower income end) and Exeter and Norwich (at
the higher income end) is contributing to the transfer error between town halls, and that this is
partially corrected by adjusting for differences in residents’ income levels.
Table 5-19 Civic Building WTP: Adjusted unit transfer errors
Town Hall Policy Sites Library Policy Sites
City Bolton Exeter Huddersfiel
d Norwich Bristol Hull Lincoln York
Site Bolton Town
Hall
Exeter City
Council
(Guildhall)
Huddersfiel
d Town Hall
Norwich
City Hall
Bristol
Central
Library
Hull Central
Library
Lincoln
Central
Library
York
Central
Library
Income
adjustment
Policy site:
Mean
income
£25,084 £28,948 £21,427 £34,221 £31,670 £20,920 £27,568 £33,185
Pooled
study sites:
Mean
income
£30,194 £29,552 £30,954 £25,733 £26,895 £29,652 £28,432 £27,298
Income
ratio (Policy
income /
Study
income)
0.8 1.0 0.7 1.3 1.2 0.7 1.0 1.2
Benefit
transfer
Policy site:
Observed
mean WTP
£4.47 £9.04 £4.97 £7.66 £12.35 £7.76 £8.06 £13.49
BT
prediction:
Pooled
mean WTP
from study
sites,
adjusted by
income ratio
£6.37 £6.28 £5.37 £9.39 £10.48 £7.18 £10.91 £11.26
Difference
(absolute) £1.90 £2.76 £0.40 £1.73 £1.87 £0.58 £2.84 £2.23

Heritage and the value of place
75
Transfer
error 42.4% 30.5% 8.1% 22.6% 15.1% 7.4% 35.2% 16.5%
t-test:
Difference
significant
at 5% level
No No No No No No No No
Table 5-20 Civic Building WTP: Reduced WTP regressions for value transfer
Town Hall Policy Sites Library Policy Sites
City Bolton Exeter Hudders-
field Norwich Bristol Hull Lincoln York
Site Bolton
Town Hall
Exeter City
Council
(Guildhall)
Hudders-
field Town
Hall
Norwich
City Hall
Bristol
Central
Library
Hull
Central
Library
Lincoln
Central
Library
York
Central
Library
Household income 0.490*** 0.541*** 0.476*** 0.446*** 0.452*** 0.467*** 0.513*** 0.470***
Visited library more
than once a month in
last 3 years
0.806*** 0.845*** 0.874*** 0.839*** 0.881*** 0.882*** 0.859*** 0.730***
Pre-industrial city (ref.
category Industrial) 0.123 0.165 0.248** 0.178 0.214** 0.151 0.191* 0.169*
Constant -3.862*** -4.425*** -3.854*** -3.493*** -3.584*** -3.670*** -4.159*** -3.713***
Observations 952 1038 1028 978 1000 954 968 1006
Adjusted R-squared 0.097 0.119 0.100 0.098 0.093 0.095 0.106 0.084
Note * indicates the statistical significance of the regression coefficients at the 99% (***), 95% (**) and 90%(*)
confidence levels respectively.
Table 5-21 shows the mean predicted WTP civic buildings based on fitting a regression model with
the coefficients estimated in Table 5-20. Note that for each civic building policy site the regressions
are based both on town hall and library study sites (however, as the difference between the two
building types was not statistically significant, we dropped the corresponding control variable from
the simplified model specification97). By increasing the available sample size, this approach yields
more precise coefficient estimates. We note that the coefficient estimates are fairly stable across
Table 5-20, in line with our assumption that that the characteristics included in the regression
model have a uniform effect on WTP across all analysed sites. The results indicate that WTP for
civic buildings tends to be higher in Pre-industrial cities compared with Industrial cities, and that
the WTP for libraries tends to be higher for regular library visitors.
97 The indicator variable controlling for building type (library vs town hall) was moderately correlated with the indicator of being a
frequent library user, which could have contributed to its lack of statistical significance. However, it remained insignificant even when the
frequent use indicator was excluded from the analysis, which formed the basis for excluding the building type control from the simplified
model specification.
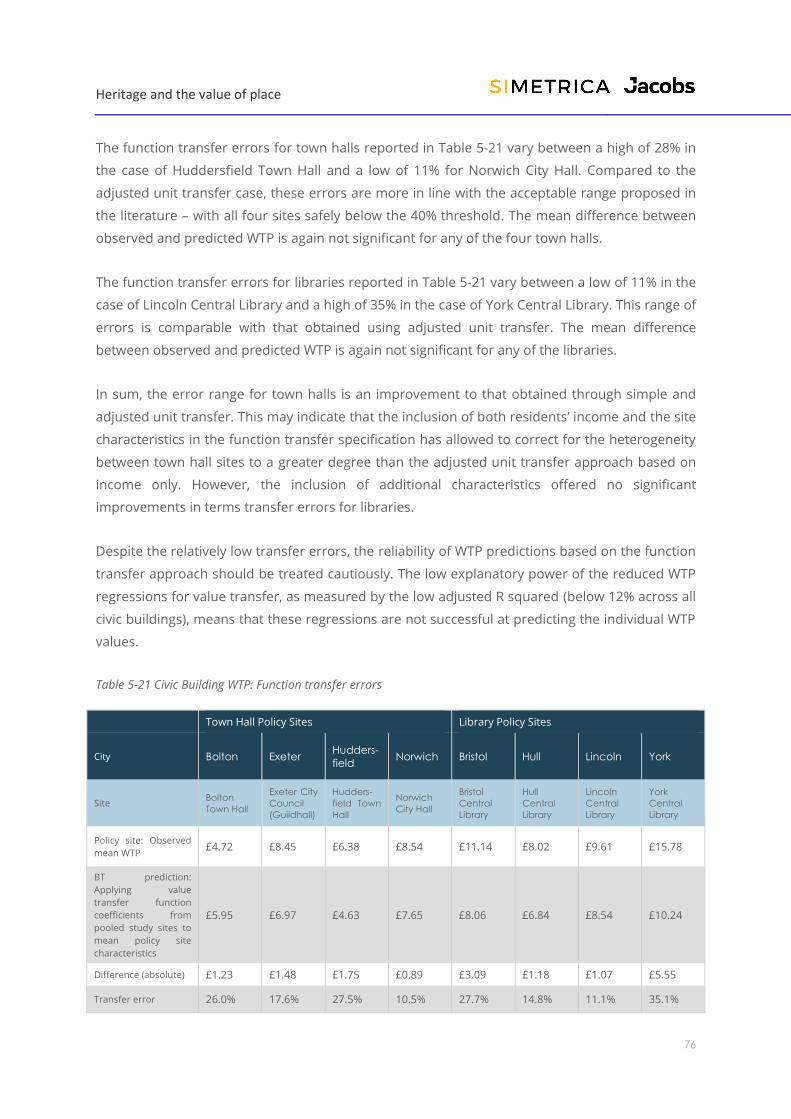
Heritage and the value of place
76
The function transfer errors for town halls reported in Table 5-21 vary between a high of 28% in
the case of Huddersfield Town Hall and a low of 11% for Norwich City Hall. Compared to the
adjusted unit transfer case, these errors are more in line with the acceptable range proposed in
the literature – with all four sites safely below the 40% threshold. The mean difference between
observed and predicted WTP is again not significant for any of the four town halls.
The function transfer errors for libraries reported in Table 5-21 vary between a low of 11% in the
case of Lincoln Central Library and a high of 35% in the case of York Central Library. This range of
errors is comparable with that obtained using adjusted unit transfer. The mean difference
between observed and predicted WTP is again not significant for any of the libraries.
In sum, the error range for town halls is an improvement to that obtained through simple and
adjusted unit transfer. This may indicate that the inclusion of both residents’ income and the site
characteristics in the function transfer specification has allowed to correct for the heterogeneity
between town hall sites to a greater degree than the adjusted unit transfer approach based on
income only. However, the inclusion of additional characteristics offered no significant
improvements in terms transfer errors for libraries.
Despite the relatively low transfer errors, the reliability of WTP predictions based on the function
transfer approach should be treated cautiously. The low explanatory power of the reduced WTP
regressions for value transfer, as measured by the low adjusted R squared (below 12% across all
civic buildings), means that these regressions are not successful at predicting the individual WTP
values.
Table 5-21 Civic Building WTP: Function transfer errors
Town Hall Policy Sites Library Policy Sites
City Bolton Exeter Hudders-
field Norwich Bristol Hull Lincoln York
Site Bolton
Town Hall
Exeter City
Council
(Guildhall)
Hudders-
field Town
Hall
Norwich
City Hall
Bristol
Central
Library
Hull
Central
Library
Lincoln
Central
Library
York
Central
Library
Policy site: Observed
mean WTP £4.72 £8.45 £6.38 £8.54 £11.14 £8.02 £9.61 £15.78
BT prediction:
Applying value
transfer function
coefficients from
pooled study sites to
mean policy site
characteristics
£5.95 £6.97 £4.63 £7.65 £8.06 £6.84 £8.54 £10.24
Difference (absolute) £1.23 £1.48 £1.75 £0.89 £3.09 £1.18 £1.07 £5.55
Transfer error 26.0% 17.6% 27.5% 10.5% 27.7% 14.8% 11.1% 35.1%

Heritage and the value of place
77
t-test: Difference
significant at 5% level No No No No No No No No
Note that mean WTP for each site will differ slightly to values presented earlier due to the reduced model sample
size corresponding to the included set of control variables. Regression model significant at p<0.005.
5.3.2.1 Summary
• Historic libraries: Simple unit transfer errors are at the threshold of what
may be considered acceptable for libraries (at the 40% level), while adjustment
for differences between the cities in terms of income and further site
characteristics leads to a slight decrease in transfer errors across all sites,
bringing it within the acceptable transfer error range. We recommend that
WTP values can be transferred to other historic public libraries with
acceptable transfer error, and recommend the use of adjusted unit
transfer which performs best when adjusted by socioeconomic
information on the policy site of interest.
• Historic town halls: Simple unit transfer errors are above the acceptable
threshold for town halls. This may be driven by heterogeneity in the
characteristics and physical condition of historic town halls, the
socioeconomic status of residents in the cities they are located as well as other
local factors. The inclusion of income data in the adjusted transfer brings the
town hall transfer errors close to an acceptable range. Transfer errors for
town halls improve further in the function transfer, which is able to control for
more factors like visit frequency, and character (age) of the surrounding
buildings. However, function transfer is also subject to low predictive fit and
low sample size issues, which means that we do not recommend it for benefit
transfer without careful consideration of the available data and potential
modelling inaccuracies. We recommend that WTP values for historic town
halls can be used with caution for transfer to comparable sites, and only
with use of income adjustments.

Heritage and the value of place
78
6. Local Heritage Value Bank
• The WTP values collected in this study and tested for transfer error using a
standard suite of transfer tests have been compiled into a Local Heritage Value
Bank.
• The Local Heritage Value Bank presents pooled WTP values for local heritage
sites – Pre-industrial and Industrial-era high streets, historic libraries and
historic town halls - alongside the key findings from transfer testing to enable
practitioners to apply the heritage values more widely in their value for money
and business case calculations.
• Transfer tests show that:
o Simple unit transfer: Works best for transfer of value from a more
homogenous set of sites, such as Pre-industrial cities. WTP values
for Pre-industrial cities can be transferred to comparable sites without
any adjustments with relatively low risk of transfer error. The simple
unit transfer also has lower informational demands on the analyst.
That is, less information is required by the analyst.
o Adjusted transfer: In all cases (excluding Pre-Industrial high streets),
transfer errors improve once values are adjusted by the average
household income of the local residents. It is likely that the adjusted
transfer approach better accounts for the socioeconomic differences
between the cities, and that once these differences are controlled for,
the WTP values are more aligned across the sites, making them more
robust for benefit transfer.
o Function transfer, can improve transfer errors where variation is WTP
is driven by factors like income, condition of the site, and whether it is
Pre-industrial or Industrial-era in age. However, it also introduces
uncertainty in terms of the predictive power of the regressions (all
around 10%, which is probably a consequence of sample size
limitations). We therefore recommend that analysts adopt simple and
adjusted unit transfer when applying these values to other high
streets/civic buildings.
• This section also outlines the methodological considerations to be taken into
account when using the WTP values from this study, with a table summarising
the main advantages and disadvantages of the three benefit transfer methods
and outlining our recommendation as to the contexts in which these benefit
transfer methods work best.

Heritage and the value of place
79
The final Local Heritage Value Bank (Table 6-2) presents pooled WTP values for local heritage sites
– Pre-industrial and Industrial-era high streets, historic libraries and historic town halls – set within
the context of the wider DCMS and Arts Council England Economic Value Database. The table
includes the key findings from transfer testing to enable practitioners to apply the heritage values
more widely in their value for money and business case calculations (Table 6-1).
It is important to recall that statistical validity tests show that while WTP is driven by theoretically
consistent factors such as income and indicators of engagement with heritage in the pooled
models (combining sites within each of the four categories) giving good confidence in the
robustness of the pooled WTP values to be used for benefit transfer, statistical tests were less
robust for individual sites, where sample size limitations and missing data on income reduced the
predictive power of statistical models. For the purpose of benefit transfer, it is recommended
that business cases use the more conservative lower bound WTP values. Lower bound WTP
is estimated as the lower limit 95% confidence interval around the mean WTP. This is to
account for the fact that mean WTP is likely to be inflated by the inclusion of direct use
values for those who use the sites for services and possible insensitivity to scope. This
means that average WTP may not be the most accurate estimate for external use, so we
recommend taking the lower bound WTP for benefit transfer.
Table 6-1 Historic England Local Heritage Value Bank: Key data for benefit transfer
Value of place
Based on WTP values for heritage sites in Bolton, Bristol, Exeter, Huddersfield, Hull, Lincoln, Norwich, York.
1. Simple
(unadjusted)
transfer
2. Adjusted (income)
transfer
3. Function transfer
WTP
value
Confidence
in transfer
(<40%
transfer
error)
Adjustment
factors
Confidence
in transfer
(<40%
transfer
error)
Adjustment factors Confidence
in transfer
(<40%
transfer
error)
Predictive
power of
function
modelling
Historic
High
Streets -
Pre-
industrial
£9.29
(lower
bound
£7.80)
Yes Household
income of
visitors
(average):
£31,469
Yes Income: 0.451
High Street condition
good:
-0.462
Regular high street
visitors: 0.235
Regression constant:
-3.158
Yes Low
predictive
power
Historic
High
Streets –
Industrial-
era
£8.51
(lower
bound
£6.31)
No Household
income of
visitors
(average):
£26,978
No Income: 0.451
High Street condition
good:
-0.462
Regular high street
visitors: 0.235
Regression constant:
-3.516
No Low
predictive
power
Historic
Town
Halls
£7.29 No Household
income of
At threshold
of
acceptability
Income: 0.482
Pre-industrial city:
-0.180
Yes Low
predictive
power

Heritage and the value of place
80
(lower
bound
£5.73)
visitors
(average):
£29,401
Regression constant:
-3.847
Historic
libraries
£9.79
(lower
bound
£7.67)
Yes Household
income of
visitors
(average):
£28,045
Yes Income: 0.482
Regular library visitors:
0.837
Pre-industrial city:
0.180
Regression constant: -
3.847
Yes Low
predictive
power
The final Local Heritage Value Bank Table presents pooled WTP values for local heritage sites –
Pre-industrial and Industrial-era high streets, historic libraries and historic town halls – set within
the context of previous valuation estimates for heritage sites commissioned by the Arts and
Humanities Research Council (AHRC). The table includes the key findings from transfer testing to
enable practitioners to apply the heritage values more widely in their value for money and
business case calculations (Table 6-2).
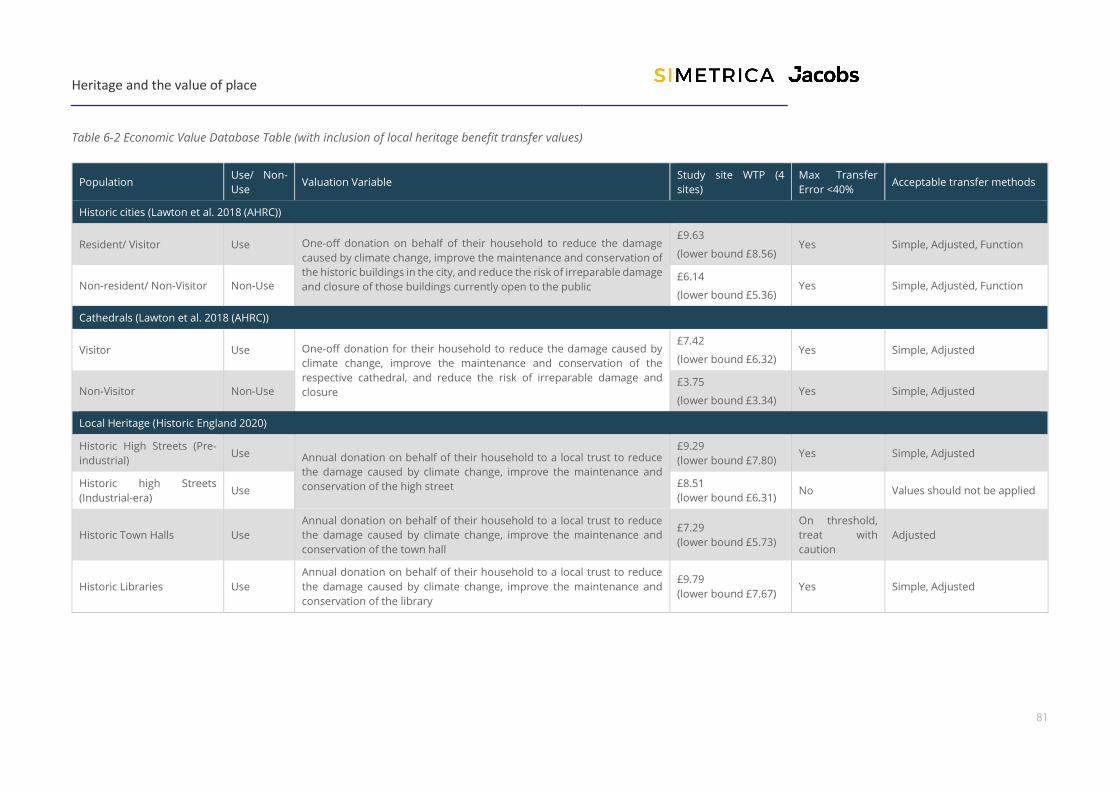
Heritage and the value of place
81
Table 6-2 Economic Value Database Table (with inclusion of local heritage benefit transfer values)
Population Use/ Non-
Use Valuation Variable
Study site WTP (4
sites)
Max Transfer
Error <40% Acceptable transfer methods
Historic cities (Lawton et al. 2018 (AHRC))
Resident/ Visitor Use One-off donation on behalf of their household to reduce the damage
caused by climate change, improve the maintenance and conservation of
the historic buildings in the city, and reduce the risk of irreparable damage
and closure of those buildings currently open to the public
£9.63
(lower bound £8.56) Yes Simple, Adjusted, Function
Non-resident/ Non-Visitor Non-Use £6.14
(lower bound £5.36) Yes Simple, Adjusted, Function
Cathedrals (Lawton et al. 2018 (AHRC))
Visitor Use One-off donation for their household to reduce the damage caused by
climate change, improve the maintenance and conservation of the
respective cathedral, and reduce the risk of irreparable damage and
closure
£7.42
(lower bound £6.32) Yes Simple, Adjusted
Non-Visitor Non-Use £3.75
(lower bound £3.34) Yes Simple, Adjusted
Local Heritage (Historic England 2020)
Historic High Streets (Pre-
industrial) Use Annual donation on behalf of their household to a local trust to reduce
the damage caused by climate change, improve the maintenance and
conservation of the high street
£9.29
(lower bound £7.80) Yes Simple, Adjusted
Historic high Streets
(Industrial-era) Use
£8.51
(lower bound £6.31) No Values should not be applied
Historic Town Halls Use
Annual donation on behalf of their household to a local trust to reduce
the damage caused by climate change, improve the maintenance and
conservation of the town hall
£7.29
(lower bound £5.73)
On threshold,
treat with
caution
Adjusted
Historic Libraries Use
Annual donation on behalf of their household to a local trust to reduce
the damage caused by climate change, improve the maintenance and
conservation of the library
£9.79
(lower bound £7.67) Yes Simple, Adjusted

Heritage and the value of place
82
6.1 Worked example
In this section we provide a worked example to demonstrate how the values provided in the Local
Heritage Value Bank of Table 6-2 could be applied to real-life business cases. We focus on its
application to historic Pre-Industrial-era high streets but provide information for performing the
same calculations with civic buildings in Table 6-3.
This worked example is a first attempt at providing direction on the way to include the social value
of local heritage in a Social Cost Benefit Analysis. The guidance is therefore open to iteration as
the Culture and Heritage Capital account programme develops and improves its methodologies.
Imagine that due to funding cuts, a local council is considering withdrawing financial support for
a struggling town centre. The town centre has a high street which is home to a number of vacant
buildings and the overall condition of the high street is starting to deteriorate due to lack of
investment and vacant buildings. The high street contains several historic listed buildings,
including some Pre-industrial buildings, which contribute to its historic character and sense of
place. However, without investment or funding, these historic buildings will fall into poor condition
and the historic character of the high street will be put at risk.
A stakeholder group, including Historic England and local resident groups, has made a
presentation to the local council asking it to provide funding to maintain the historic buildings in
good condition during this period of high vacancy rates of high street buildings. However, the
council is unwilling to do so, arguing that the cost of maintaining these buildings is too high and
does not produce enough public benefit to justify the investment.
We outline below the steps by which WTP values in the Local Heritage Value Bank can be applied
to your own business case.
What you will need to know:
• Initial scoping: How similar is your historic place (high street) to the high
streets surveyed in the Local Heritage Value Bank: overall age and
character of architecture, size of the city, regional location.
• Business case calculation: Information about number of households within
a reasonable local ‘catchment area’ around the high street.

Heritage and the value of place
83
6.1.1 Initial scoping
• Step 1. Establish the overall age and character of the area: Pre-industrial
areas are those with the presence of some buildings built before 1800.
Industrial-era areas of those with none or few buildings built before 1800. In
the Local Heritage Value Bank, WTP values are only available for transfer for
Pre-industrial high streets. If your high street can be characterised as Pre-
industrial, proceed to Step 2.
• Step 2. Size of city: Values should only be transferred to Pre-industrial high
streets in cities of a certain size: Populations of more than 100,000 and less
than 400,000, to align with the cities surveyed in the Local Heritage Value Bank.
• Step 3. Character of high street: The high street should be one of the main
shopping streets in the town, with a combination of national/regional shop
chains and food and drink establishments.
There are a number of exclusions where institutions should not transfer WTP values for local
heritage from the Local Heritage Value Bank:
• National or regional capitals: High streets in national or regional capitals may have
higher visitor numbers, greater reach, and have architectural features of national or
international significance. Demographic characteristics of regional capitals are often
different to those of smaller towns and cities. These factors make high streets in
national/regional capitals less comparable with the high streets in the Local Heritage Value
Bank. Transfer of local heritage WTP values to these high streets may lead to under-
estimation of economic value in business cases.
• Seaside communities: WTP for historic high streets are not applicable to seaside
communities due to differences in demographic characteristics. Transfer of WTP values to
high streets these towns will lead to mis-estimation of economic value in business cases.
• Not applicable outside of England: WTP values are collected for historic high streets in
England only. Transfer of Local Heritage Value Bank WTP values to these high streets will
lead to mis-estimation of economic value in business cases.
6.1.2 Business case calculation
If your high street passes the initial scoping exercise and can be considered comparable to the
Pre-industrial high streets surveyed in the Local Heritage Value Bank, it is eligible to transfer the
WTP value from the Local Heritage Value Bank to calculate the WTP for all households affected by
the condition of the historic high street being at risk. We outline two approaches to benefit transfer
that can be used in business cases: Simple unit transfer, which takes the WTP estimate from the
Local Heritage Value Bank and applies it to the heritage place in your business case, and adjusted
transfer, which is recommended if resident demographics for your heritage place are dissimilar to
the sites used in the Local Heritage Value Bank, as this method accounts for and controls for
differences in visitor/local population characteristics.

Heritage and the value of place
84
6.1.2.1 Simple unit transfer
To transfer simple WTP values from the Local Heritage Value Bank to your business case high
street it is first necessary to define your affected local population. It is important that you select
an appropriate catchment threshold for your local population. An unrealistically large catchment
area will lead to over-estimation of heritage value in your business case, which will reduce the
robustness of your results. Definition of the local population will differ depending on a case by
case basis. It is to some extent subjective, but through continued engagement with the heritage
sector we aim to improve the guidance for performing this analysis. The suggested approach is
defined below:
• Step 1. Define local area: The appropriate local catchment area is typically defined as
households within the direct Local Authority district where residents have heard of the
high street or visited the high street in past three years. In most cases you will not have
data on the number of residents who have heard of and visited the high street, so we
advise taking the data from within this survey, which shows that 5% of those surveyed had
either not heard of the high street or visited it less than once a year on average over the
past three years. This means that 95% of the sample visited their local high street annually
in the past three years. However, this frequency data is based on a three-year period, so
as an approximation to annual values we recommend an additional cautious reduction of
10%, reducing the figure to 85% of the local population. This annual approximation is
slightly more cautious, but this is appropriate given the difficulty in defining the reach of a
heritage site. It is important to avoid over-extending the local catchment area into the
wider region, since extending the reach of your business case is the most common way in
which value can be over-attributed, making business cases less robust.
• For those calculating values for town halls and libraries, the proportions are different, at 65%
and 75% respectively, as reported in Table 6-3.
• Step 2. Estimate number of households in the local area: Once you have defined your
local area, estimate how many households exist in this area. Public resources exist that
take 2011 census data at the local authority, country and regional level
(https://www.nomisweb.co.uk/query/select/getdatasetbytheme.asp?opt=3&theme=&sub
grp=).
➢ Step 3. Multiply number of households in your local area by the Pre-industrial high
street WTP from the Local Heritage Value Bank.
➢ Pre-industrial high street WTP from the Local Heritage Value Bank is £7.80 (lowerbound).
➢ Step 4. Total (aggregate) non-market value of our high street to its local population
is £379,740 per year (final row Table 6-3). This value can be added to your business case
alongside Gross Value Added (GVA) economic impact evaluations98.Nevertheless, further
work is required in the option analysis section of the business case. In this section different
98 However, if you have included valuations based on travel cost or house price uplift studies, then it is not
recommended to add WTP values to your business case as this could lead to double counting of benefits.

Heritage and the value of place
85
alternatives to the main project are assessed, demanding a marginal analysis of the non-
market value and GVA economic impact.
Table 6-3 Worked example: Simple benefit transfer from Local Heritage Value Bank to worked example case study
(includes Pre-industrial high streets, town halls and libraries for reference)
Local high street
(Pre-industrial)
WTP
Local town hall
WTP
Local library WTP
WTP (lower bound) £7.80 £5.73 £7.67
Households in Local Authority
area
57,276 57,276 57,276
Proportion of local population
who visited in the past year
(based on survey data
85% 65% 75%
Affected population in Local
Authority area (Population x
proportion of annual visitors)
48,685 37,229 42,957
Aggregate Value £379,740 £213,324 £329,480
Note: Numbers presented are unrounded, but in practical terms, given the uncertainty in the
original estimates rounding to the first decimal point is reasonable for total values.
6.1.2.2 Adjusted unit transfer
This benefit transfer technique is recommendable to be used in the particular
circumstance in which there is a significant socioeconomic difference between your
site and the sites in the Local Heritage Value Bank:
➢ Step 1: Compare average socioeconomic characteristics between your site and the
sites in the Local Heritage Value Bank. If your local area population has characteristics
that significantly differ from the Local Heritage Value Bank it is recommended to use an
adjusted benefit transfer. For example, imagine the average household income for your
local area is 21% less (£24,759) than the average household income for the pooled sample
in the Local Heritage Value Bank (£31,469). As the income difference is significant, it is
recommended to adjust WTP. To adjust WTP, divide the average household socio-
economic characteristic (i.e. income) of your local area by the average socioeconomic
characteristic reported in the Local Heritage Value Bank.
➢ Step 2: Multiply the answer by the simple WTP value in the Local Heritage Value Bank
(lower bound: £7.80). This gives an adjusted WTP value for visitors to your historic high
street of £6.14.
➢ Step 3. Multiply number of households in your local area by the adjusted WTP from
the Local Heritage Value Bank: As in Step 3 of the simple unit transfer. Assume in this
example that the size of the population is 48,844.
➢ Step 4. Total (aggregate) non-market value is £299,897 per year. Again, this value can
be added to your business case alongside GVA economic impact
Heritage and the value of place
86
evaluations99.Nonetheless, further work is required in the option analysis section of the
business case. In this section different alternatives to the main project are assessed,
demanding a marginal analysis of the non-market value and GVA economic impact.
6.1.2.3 Overall principles of benefit transfer:
➢ Evidence and assumptions used to define the local population must be clearly
presented. Where supporting empirical evidence is not available, justification should be
provided for the definition of the local population in qualitative terms. See Eftec Valuing
Environmental Impacts (2009) Report.
➢ In all cases it is the responsibility of the business case analyst to ensure that the
catchment area is an accurate reflection of the reach of the high street and does not lead
to over-attribution of values in the business case.
➢ All applications of WTP values from the Local Heritage Value Bank should include
caveats that the robustness of benefit transfer is dependent on adequate scoping of
the comparability between the site of interest and the heritage sites in the Local Heritage
Value Bank, and that the principles of this worked example have been followed in full to
reduce the risk of overestimation of values.
6.1.3 Other scenarios where you may want to apply the Local Heritage Value Bank
This report is primarily focused on the valuation of maintaining the condition of a historic high
street or civic building in good condition. However, you may be faced with other scenarios, such
as the potential loss of a historic civic building to make way for a major infrastructure development
(for instance within the High Speed Rail scheme) or of a new development which drastically
changes the historic character of a high street.
The values developed in this report are specific to the scenario of maintaining heritage sites in
their current good condition, and cannot be automatically transferred to these other scenarios. In
order to value these other types of scenarios, we strongly recommend new primary data collection
to understand the willingness to pay for the specific value desired.
In an informal setting, statistical adjustments to the current Local Heritage Value Bank could be
used to construct an approximation of the public value associated with loss of a heritage site under
these alternative scenarios. However, we stress that this data is likely to lead to distorted values
because of the large differences between a scenario of maintenance and a scenario of complete
loss of the heritage site. We recommend that this kind of work be performed with advice from
experts with an economic and statistical background.
99 However, if you have included valuations based on travel cost or house price uplift studies, then you should
not add WTP values to your business case as this would lead to double counting of benefits.

Heritage and the value of place
87
6.2 Methodological considerations
A critical point for benefit transfer of heritage values relates to the specificity of estimates. Cultural
heritage values have a strong local nature, grounded in specific local context. For instance, the
characteristics that make a historic high street valuable to its local population will be partly driven
by factors that are very specific to that area. This is particularly important among user populations
of residents and visitors. For instance, the cultural heritage value of Stonegate in York may be
shaped both by the historic buildings/structures, and their interaction with local pride, shared
history, and its independence and interdependence with wider national histories and cultural
narratives. Contextual differences may also be based on the role of each city as a site for ongoing
cultural events, and the everyday sense of place that it provides to people going about their daily
activities. The interaction between the historic structures and the cultural place-making role of one
city may be heterogenous to those of another city which on paper has historical structures of
broadly similar age and historical significance. This heterogeneity in the cultural values associated
with each of the local heritage sites surveyed may be difficult or impossible to quantify within a
benefit transfer model, which therefore limits their transferability to other study sites. The same
is true of civic buildings. It may be that our surveyed study sites are similar in age, architecture,
and artefacts, but they may have played very historically-specific and place-specific roles in the
cultural heritage of the people who live around them. This unobserved heterogeneity of place-
specific cultural values will be internalised within the maximum WTP values that respondents give
for each of the sites. However, the variance in WTP values caused by place-specific cultural values
remains unobserved. The challenge going forward, therefore, is in identifying and quantifying
these place-specific cultural values in a way that is meaningful and comparable across multiple
sites and to include the data within a function transfer model.
We exclude respondents who have not heard of the high street or civic building to exclude pure
‘non-users’ with no potential use or spillover value. This is expected to increase the realism of the
WTP values, since pure non-users have been found to struggle in the cognitive task of
distinguishing a good/service they have never heard of or used from the general ‘virtuous’ value
of cultural heritage as a whole.100 However, we note that this does introduce difficulty in the
aggregation process, since the sample excludes those in the local population who have not heard
of the site, and who we would expect to have lower WTP values on average. For this reason, it may
be more appropriate to apply a lower bound WTP value when aggregating to the local population.
Note that respondents were excluded based on whether they had heard of the site by name. It
may be that they would have been familiar with the site if they had been shown an image or it.
Therefore, some of those excluded as ‘pure non-users’ may in fact have recognised the site by
sight, and would then not have had a statistically lower WTP than the current survey sample. We
100 Bandara and Tisdell 2005

Heritage and the value of place
88
recommend that future applications of this method test for familiarity with the site with the use
of both names and photographs.
A relatively high proportion of respondents stated that they were not willing to pay in principle to
maintain their historic high street in good condition (46% for Pre-industrial high streets and 62%
for Industrial-era high streets) and similar results were found for historic civic buildings (53% for
historic town halls and 51% for historic libraries. We note that it is common to have a higher
proportion of respondents not be willing to pay in principle for a public good which they currently
enjoy for free, due to a number of factors, such as household budget constraints, endowment
effects (they are accustomed to receiving it for free) or simply not valuing heritage that highly
among the numerous other public goods and services that they may feel are valuable enough to
pay to preserve. Previous studies on historic regional cities found that around one third of the
sample were not willing to pay in principle to preserve their historic city core, with similar findings
from other CV studies for in the cultural sector (e.g. 20-30% in the Natural History Museum/Tate
Liverpool study performed as part of the AHRC Cultural Value Project).101 The high proportion not
willing to pay in principle in this study could suggest that the public has a lower likelihood of being
willing to pay for smaller local an heritage sites compared to those with more regional reach and
importance. However, further data collection would be required to understand the relationship
between levels of engagement with local heritage sites and the way they are valued by their local
populations, and this may be an important area for future research.
It is important to consider the realism of the values obtained. In terms of how these values
compare, we note, that the values obtained for the historic high streets are only 34p lower than
the WTP values obtained for historic town centres in a previous BT study 102. This is not what we
would expect, given that the high street will only be a partial element of the wider historic core.
Furthermore, the WTP given for the historic city is in the form of a one-off donation, whereas WTP
for the historic high street is a recurring annual donation. We would expect that a one-off donation
would be higher, representing the welfare benefits that a respondent would feel over their lifetime,
compared to a recurring donation which has a higher net present value. Finally, some of these
cities and high streets overlap between the studies (e.g. York historic core and Stonegate high
street in York). This would suggest some insensitivity to the scope of what is being valued, i.e., that
respondents are not distinguishing between the value they hold for the whole city centre versus
one of its parts. This could partly be explained by a non-use ‘warm glow’ motivation behind the
values given, where a respondent’s stated WTP is more an expression of their support for the
heritage of the city than for the specific high street valued. Indeed, follow up question around their
motivations for being willing to pay found that over a third (35%) of those with a positive WTP were
101 https://ahrc.ukri.org/research/fundedthemesandprogrammes/culturalvalueproject/
102 Lawton et al. 2018

Heritage and the value of place
89
paying “not just for the high street, but also an expression of my support for all heritage in the city”
(Appendix Table 8-10).
This is despite repeated statements in the survey that respondents should express their value
only for the high street. The problem of insensitivity to scope within CV surveys is persistent, and
something which future surveys should seek to explore further, to better understand how
respondents can be made to think only of the site being valued, rather than the wider heritage
public good being discussed.
Insensitivity to scope may also be present in the closeness of the WTP values for civic buildings
and high streets. Again, we would expect WTP for a larger site like a high street, which contains
multiple historic buildings, to be higher than WTP for a single historic building. However, the
closeness of the values could be explained by the more iconic character of the town hall compared
to other historic buildings. Note that none of the town halls were located within the high street
valued, and respondents were asked to consider them as entirely separate payments.
Nonetheless, we should acknowledge that this lack of proportionality may also stem from biases
in SP surveys around insensitivity to scope in respondents’ stated WTP. However, it is important
to consider in a balanced way the likely impact that such information effects and biases will have
on the reliability of the benefit transfer to business cases. First, it is very difficult to evidence for
certain that people are valuing heritage as a whole rather than the value of a particular site, and
follow-up questions are an unreliable and inaccurate way to gather this, as they may be subject to
response acquiescence (selecting any response to proceed to the next stage of the survey). To fully
understand the motivations behind WTP requires a much more involved set of questioning and
analysis of the results, which requires a much longer survey which is beyond the scope of this
study. Second, excluding a large portion of the sample based on these uncertain motivational
responses is an extreme approach which would severely impact on the sample size and the
predictive power of the transfer testing models. A more proportionate response in the face of the
motivational uncertainty is to take a lower bound WTP value when applying the values in business
cases, as we do in this study.
6.3 Benefit transfer summary recommendations
To conclude, we summarise the main advantages and disadvantages of the three benefit transfer
methods below, with Table 6-4 outlining our recommendation as to the contexts in which these
benefit transfer methods work best.
A simple unit value transfer is the simplest form of transfer and assumes that the per person
(or household) WTP at the study site is equal to that at the policy site and requires the same or
similar quantity of the good. Any scaling up or down of the benefits to account for quantity
differences requires strong assumptions – for example, that the benefits are linear with respect to
quantity (Johnston et al. 2017). Unit value transfers can also be adjusted according to attributes of

Heritage and the value of place
90
the policy context or by using expert opinion. An adjusted value transfer is different from
a benefit function transfer as the adjustments are done ex-post rather than by using a function
provided by the original study. The key consideration on whether to use a simple or adjusted value
transfer is whether the assumptions needed for adjustments are reasonable.
The advantages of unit value transfer compared to benefit function transfers are ease of
implementation and minimal data requirements. If the study and policy sites are very similar, then
unit value transfers can perform acceptably 103. However, the assumptions implied can lead to
larger errors than those with similar benefits functions transfers (Kaul et al. 2013; Rosenberger
and Stanley 2006), as we found for historic town halls and Industrial-era high streets in this study.
To perform benefit function transfers, it is necessary to have a function which allows the outcome
to be estimated through observed conditions at the policy site and to have good quality
information on the relevant variables. It also requires strong assumptions that the underlying
valuation function is identical in the study and policy sites. Benefit function transfers are helpful
as they can be used to adjust transfer estimates for differences of characteristics between the
policy and study sites such as the quantity or quality of the good valued or characteristics of the
population (Johnston et al. 2017). However, the data requirements are higher than with value
transfers and function-based adjustments, for example adjusting for socioeconomic
characteristics, will not always improve transfer accuracy (Brouwer 2000; Johnston and Duke 2010;
Spash and Vatn 2006). In sum:
• Simple unit value transfers are best suited if initial scoping suggests the policy
site is similar to the study site in terms of services offered, size and reach, and
characteristics of visitors.
• Adjusted unit transfers are recommended when sites are similar but differ in
characteristics or visitors/local populations, particularly in income levels.
• Benefit function transfers are better suited for policy sites that are
heterogenous to their study sites. This approach is more data-intensive and
requires availability of a range of demographic and possibly
attitudinal/behavioural variables that are part of the WTP function, in each
site. It is not recommended to use benefit function transfers when there are
few differences to adjust between the sites and if the value functions have low
explanatory power.
Transfer testing in this report allows us to make conclusions about the most appropriate transfer
method for each category of local heritage values. Benefit transfer testing of the heritage sites
103 Bateman, Mace, et al. 2011

Heritage and the value of place
91
surveyed in this study finds that the Pre-industrial high streets, historic libraries and historic
town/civic hall WTP values can be transferred to comparable historic sites across the country with
low risk of introducing transfer error. As is always the case with benefit transfer methods, it is
necessary to acknowledge that some error will be introduced when transferring values. We have
therefore made efforts to label clearly in the reporting and in the table below which WTP values
for local heritage sites values are robust for benefit transfer and under which methods.
• For Pre-industrial high streets transfer errors are safely below the
acceptable level of transfer error using any of the three transfer methods. We
therefore conclude that WTP values for Pre-industrial cities can be transferred
to comparable sites with relatively low risk of transfer error.
• Historic libraries: Transfer errors are at or below the acceptable levels of
transfer error for simple and adjusted transfer. We therefore conclude that
WTP values for historic libraries can be transferred to comparable sites with
acceptable risk of transfer error using these two methods, but do not
recommend function transfer.
• In some cases, such as town halls, acceptable levels of transfer error are
achieved only with adjustment to the income differentials between towns
(adjusted transfer method). Caution should be applied when transferring
these values, and only with consideration of the income differences between
the study town hall sites and the site you are constructing your business case
for.
• Even more caution should be applied to Industrial-era high streets, where
transfer errors were outside of the acceptable level with all transfer methods.
We recommend that Industrial-era high street WTP should not be transferred
to other sites, as the WTP values varied too much between the four sites
surveyed to provide a robust WTP value that can be considered representative
of other Industrial-era high streets in the country. We therefore recommend
that these WTP values be seen only as indicative of the values that people hold
for these four particular Industrial-era high streets, and not for Industrial-era
high streets as a whole.
The benefit transfer values obtained for Pre-industrial high streets and civic buildings are relevant
within the context of the wider DCMS and Arts Council Economic Value Database. This aims to
bring together recent primary data collection on people’s willingness to pay for cultural institutions
and heritage sites and apply transfer tests to this data, to provide a robust evidence base for arts
and cultural organisations. These values for historic high streets and civic buildings will help to
grow this database, providing a valuable resource of heritage values for the cultural sector.

Heritage and the value of place
92
The challenge for Historic England is to stimulate the take up of valuation techniques and the use
of the values estimated with this approach, particularly among heritage organisations seeking
public investment and funders such as local authorities that may be considering business cases
on a regular basis. This may be achieved through cross-cutting work with other agencies like Arts
Council England, engagement activities in the heritage sectors, and workshops showcasing the
valuation work that Historic England does and how it can be applied to further the heritage sector’s
understanding of how to value their sites and construct business cases that incorporate a fuller
economic value of their cultural contribution to society. This knowledge will provide an advantage
in a competitive funding environment where funders are looking for a clearer and more robust
rationale than ever to invest in the preservation of local heritage.
Table 6-4 Benefit transfer summary and recommendations
Simple unit transfer Adjusted unit transfer Function transfer
Data availability /
requirements
No additional data required Only aggregate data on the
adjusted characteristic at policy
and study sites required
Transfer function needs to be
estimated at study sites;
Corresponding data for policy
site required to make
prediction
Low ✓
Medium ✓
High ✓
Similarity between policy and
study sites
High degree of similarity
required
Difference in a single
characteristic (usually income
levels) may be adjusted
Differences in multiple
characteristics may be adjusted
to produce more context-
sensitive benefit transfers
High ✓
Medium ✓
Low ✓
Homogeneity of the good
valued across study sites
High degree of similarity
required
High degree of similarity
required;
Adjustment usually based on
population not site
characteristics (i.e. population
income)
Differences can be controlled
(and their impact measured,
provided that site-specific data
exists and that there is
sufficient heterogeneity
between study sites) through
transfer function
High ✓ ✓
Low ✓
Homogeneity of the
population characteristics
across study sites
High degree of similarity
required
Assumes that heterogeneity
between sites is a function of
socioeconomic differences in
populations. Income
differences can be adjusted ex-
post
Differences can be controlled
(and their impact measured,
provided there is sufficient
heterogeneity between study
sites) through transfer
function.

Heritage and the value of place
93
Simple unit transfer Adjusted unit transfer Function transfer
High homogeneity will lead to
higher transfer errors in
function transfer.
High ✓
Medium ✓
Low ✓
Assumptions required to
perform the transfer (as tested
by t-tests in benefit transfer
testing)
Per person (or household)
WTP at the study site is equal
to that at the policy site
Per person (or household)
WTP scaled by the adjustment
variable at the study site is
equal to that at the policy site
Transfer function is identical
in the study and policy sites
Recommendations
Policy site is similar to the
study site in terms of services
offered, size and reach,
and characteristics of
users/non-users
✓
Policy site different from
study sites in terms of a small
number of characteristics
(particularly income)
✓
Policy site different from
study sites in terms of
multiple characteristics
(whose impact on WTP has
been measured)
✓
Transfer functions have low
explanatory power
NA NA

Heritage and the value of place
94
7. Literature cited
Aabø, Svanhild. 2005. ‘Are Public Libraries Worth Their Price? A Contingent Valuation Study of
Norwegian Public Libraries’. New Library World 106 (11/12):487–95.
https://doi.org/10.1108/03074800510634973.
Astell-Burt, Thomas, Richard Mitchell, and Terry Hartig. 2014. ‘The Association between Green
Space and Mental Health Varies across the Lifecourse. A Longitudinal Study’. J Epidemiol
Community Health 68 (6):578–83. https://doi.org/10.1136/jech-2013-203767.
Bandara, Ranjith, and Clem Tisdell. 2005. ‘Changing Abundance of Elephants and Willingness to
Pay for Their Conservation’. Journal of Environmental Management 76 (1):47–59.
https://doi.org/10.1016/j.jenvman.2005.01.007.
Bateman, I., R. Brouwer, S. Ferrini, M. Schaafsma, D. N. Barton, A. Dubgaard, B. Hasler, et al. 2011.
‘Making Benefit Transfers Work: Deriving and Testing Principles for Value Transfers for
Similar and Dissimilar Sites Using a Case Study of the Non-Market Benefits of Water Quality
Improvements Across Europe’. Environmental and Resource Economics 50 (3):365–87.
https://doi.org/10.1007/s10640-011-9476-8.
Bateman, I., R. T. Carson, B. Day, M. Hanemann, N. Hanley, T. Hett, M. Jones-Lee, et al. 2002.
Economic Valuation with Stated Preference Techniques: A Manual. Cheltenham, UK: Edward
Elgar.
Bateman, I., Georgina M. Mace, Carlo Fezzi, Giles Atkinson, and Kerry Turner. 2011. ‘Economic
Analysis for Ecosystem Service Assessments’. Environmental and Resource Economics 48
(2):177–218. https://doi.org/10.1007/s10640-010-9418-x.
Berg, Magdalena van den, Wanda Wendel-Vos, Mireille van Poppel, Han Kemper, Willem van
Mechelen, and Jolanda Maas. 2015. ‘Health Benefits of Green Spaces in the Living
Environment: A Systematic Review of Epidemiological Studies’. Urban Forestry & Urban
Greening 14 (4):806–16.
Bonnichsen, Ole, and Jacob Ladenburg. 2009. ‘Using an Ex-Ante Entreaty to Reduce Protest Zero
Bias in Stated Preference Surveys–A Health Economic Case’. Journal of Choice Modelling 2
(2):200–215.
Brookshire, David S., and Helen R. Neill. 1992a. ‘Benefit Transfers: Conceptual and Empirical Issues’.
Water Resources Research 28 (3):651–655.
———. 1992b. ‘Benefit Transfers: Conceptual and Empirical Issues’. Water Resources Research 28
(3):651–655.
Brouwer, Roy. 2000. ‘Environmental Value Transfer: State of the Art and Future Prospects’.
Ecological Economics 32 (1):137–152.
Brouwer, Roy, and Frank A. Spaninks. 1999. ‘The Validity of Environmental Benefits Transfer:
Further Empirical Testing’. Environmental and Resource Economics 14 (1):95–117.
Callegaro, Mario, Ana Villar, David Yeager, and Jon Krosnick. 2014. ‘A Critical Review of Studies
Investigating the Quality of Data Obtained with Online Panels Based on Probability and
Nonprobability Samples’. Online Panel Research: A Data Quality Perspective, April, 23–53.
https://doi.org/10.1002/9781118763520.ch2.
Carson, Richard T. 1997. Contingent Valuation Surveys and Tests of Insensitivity to Scope. London, UK:
Springer. http://link.springer.com/chapter/10.1007/978-94-011-5364-5_6.
Choi, Andy S., Brent W. Ritchie, Franco Papandrea, and Jeff Bennett. 2010. ‘Economic Valuation of
Cultural Heritage Sites: A Choice Modeling Approach’. Tourism Management 31 (2):213–20.
https://doi.org/10.1016/j.tourman.2009.02.014.
Ciaian, Pavel, and Sergio Gomez y Paloma. 2011. ‘Valuation of EU Agricultural Landscape’. In .
Crossick, G, and P Kaszynska. 2016. ‘Understanding the Value of Arts & Culture. The AHRC Cultural
Value Project’. London, UK: AHRC.

Heritage and the value of place
95
Desvouges, William H., Michael C. Naughton, and George R. Parsons. 1992a. ‘Benefits Transfer:
Conceptual Problems in Estimating Water Quality Benefits Using Existing Studies’ 28
(3):675–83.
———. 1992b. ‘Benefits Transfer: Conceptual Problems in Estimating Water Quality Benefits Using
Existing Studies’ 28 (3):675–83.
Desvousges, William H., F. Reed Johnson, H. Spencer Banzhaf, and others. 1998. Environmental
Policy Analysis with Limited Information: Principles and Applications of the Transfer Method.
Edward Elgar Publishing. http://www.cabdirect.org/abstracts/19991801535.html.
Eftec. 2005. ‘Valuation of the Historic Environment The Scope for Using Results of Valuation Studies
in the Appraisal and Assessment of Heritage-Related Projects and Programmes’. London,
UK: Economics for the Environment Consultancy. http://www.english-
heritage.org.uk/publications/valuation-historic-environment/valuation-historic-
environment-final-rep.pdf.
———. 2009. ‘Valuing Environmental Impacts: Practical Guidelines for the Use of Value Transfer in
Policy and Project Appraisal’. London, UK: Department for Environment, Food and Rural
Affairs.
https://www.gov.uk/government/uploads/system/uploads/attachment_data/file/182376/
vt-guidelines.pdf.
Foster, Sarah, Lisa Wood, Hayley Christian, Matthew Knuiman, and Billie Giles-Corti. 2013.
‘Planning Safer Suburbs: Do Changes in the Built Environment Influence Residents’
Perceptions of Crime Risk?’ Social Science & Medicine 97 (November):87–94.
https://doi.org/10.1016/j.socscimed.2013.08.010.
Fujiwara, D., H. Bakhshi, S. Mourato, R. Lawton, U. Hotopp, and J. Davies. 2018. ‘The Economic
Value of Culture: A Benefit Transfer Study’. London, UK: Department for Digital Culture
Media and Sport.
Fujiwara, Daniel, Ricky N. Lawton, and Susana Mourato. 2017. ‘The Health and Wellbeing Benefits
of Public Libraries’. Economia Della Cultura, no. 2/2017. https://doi.org/10.1446/87272.
Garrod, GD, KG Willis, H Bjarnadottir, and P Cockbain. 1996. ‘The Non-Priced Benefits of
Renovating Historic Buildings: A Case Study of Newcastle’s Grainger Town’. Cities, Issues In
Urban Conservation, 13 (6):423–30. https://doi.org/10.1016/0264-2751(96)00029-7.
Griffiths, J.M., D King, J. Harrington, T. Lynch, and C. Tomer. 2004. ‘State of Florida Taxpayer Return
on Investment in Public Libraries’. Chapel Hill, NC: University of North Carolina.
Griffiths, Jose-Marie, Donald W. King, and S. E. Aerni. 2006. ‘Taxpayer Return-on-Investment in
Pennsylvania Public Libraries’. Chapel Hill, NC: University of North Carolina.
Grosclaude, Pascal, and Nils C. Soguel. 1994. ‘Valuing Damage to Historic Buildings Using a
Contingent Market: A Case Study of Road Traffic Externalities’. Journal of Environmental
Planning and Management 37 (3):279–87. https://doi.org/10.1080/09640569408711976.
H. M. Treasury. 2018. ‘Green Book: Appraisal and Evaluation in Central Government’. London, UK:
H. M. Treasury. https://www.gov.uk/government/publications/the-green-book-appraisal-
and-evaluation-in-central-governent.
Hájek, Petr, and Jan Stejskal. 2014. ‘Modelling Public Library Value Using the Contingent Valuation
Method: The Case of the Municipal Library of Prague’. Journal of Librarianship and
Information Science 47 (1):43–55. https://doi.org/10.1177/0961000614525217.
‘Heritage Counts 2018 – Heritage in Commercial Use’. 2018. Historic England.
http://historicengland.org.uk/research/heritage-counts/2018-heritage-in-commercial-
use/.
Johns, Helen, Ece Ozdemiroglu, Nick Hanley, Sergio Colombo, Alistair Hamilton, and Tony Hyde.
2006. ‘Economic Valuation of Environmental Impacts in the Severely Disadvantaged Areas’.
Research Reports or Papers. 2006.

Heritage and the value of place
96
http://webarchive.nationalarchives.gov.uk/20110318142051/http://www.defra.gov.uk/evi
dence/economics/foodfarm/reports/documents/SDA.pdf.
Johnston, R., J. Rolfe, R.S. Rosenberger, and R. Brouwer. 2015. Benefit Transfer of Environmental and
Resource Values - A Guide for Researchers and Practitioners. The Economics of Non-Market
Goods and Resources 14. London, UK: Springer.
http://www.springer.com/gb/book/9789401799294.
Jura Consultants. 2005. ‘Bolton’s Museum, Library and Archive Services; An Economic Valuation’.
London, UK: Museums Libraries and Archives Council.
https://webarchive.nationalarchives.gov.uk/20120215211622/https://research.mla.gov.uk
/evidence//view-publication.php?pubid=423.
Kaul, Sapna, Kevin J. Boyle, Nicolai V. Kuminoff, Christopher F. Parmeter, and Jaren C. Pope. 2013.
‘What Can We Learn from Benefit Transfer Errors? Evidence from 20 Years of Research on
Convergent Validity’. Journal of Environmental Economics and Management 66 (1):90–104.
https://doi.org/10.1016/j.jeem.2013.03.001.
Kim, Giyeong. 2011. ‘A Critical Review of Valuation Studies to Identify Frameworks in Library
Services’. Library & Information Science Research 33 (2):112–19.
https://doi.org/10.1016/j.lisr.2010.09.006.
Lawton, R., D. Fujiwara, S. Mourato, H. Bakhshi, A. Lagarde, and J. Davies. 2018. ‘The Economic
Value of Heritage: A Benefit Transfer Study’. Arts and Humanities Research Council.
Loomis, J. 1992. ‘The Evolution of a More Rigorous Approach to Benefit Transfer: Benefit Function
Transfer’. Water Resources Research 28 (3):701–705.
Lorenc, Theo, Mark Petticrew, Margaret Whitehead, David Neary, Stephen Clayton, Kath Wright,
Hilary Thomson, Steven Cummins, Amanda Sowden, and Adrian Renton. 2013. ‘Fear of
Crime and the Environment: Systematic Review of UK Qualitative Evidence’. BMC Public
Health 13 (1):496.
MacKerron, George, and Susana Mourato. 2013. ‘Happiness Is Greater in Natural Environments’.
Global Environmental Change 23 (5):992–1000.
https://doi.org/10.1016/j.gloenvcha.2013.03.010.
Maddison, David, and Susana Mourato. 2001. ‘Valuing Different Road Options for Stonehenge’.
Conservation and Management of Archaeological Sites 4 (4):203–12.
https://doi.org/10.1179/135050301793138182.
McClure, Charles R., Bruce T. Fraser, Timothy W. Nelson, and Jane B. Robbins. 2001. ‘Economic
Benefits and Impacts from Public Libraries in the State of Florida. Final Report.’, January.
http://eric.ed.gov/?id=ED449805.
Morris, Anne, John Sumsion, and Margaret Hawkins. 2002. ‘Economic Value of Public Libraries in
the UK’. Libri 52 (2):78–87. https://doi.org/10.1515/LIBR.2002.78.
Mourato, S., E. Fimereli, D. Contu, C. Gaskell, and C. Boniatti-Pavese. 2014. ‘The Economic Benefits
of Cultural Built Heritage Interiors Conservation from Climate Change Damages in Europe’.
WP6 Final Report. London, UK: Grantham Research Institute on Climate Change and the
Environment.
https://www.google.co.uk/url?sa=t&rct=j&q=&esrc=s&source=web&cd=1&ved=0ahUKEwj
Ax_WBlOTNAhXmAMAKHX9cAJ8QFggeMAA&url=http%3A%2F%2Fwww.climateforculture.
eu%2Findex.php%3Finhalt%3Ddownload%26file%3Dpages%2Fuser%2Fdownloads%2Fpr
oject_results%2FD_06.1_final_publish.pdf&usg=AFQjCNEmpiNVVbd1Kr66uDCAHhWep4P
YWw&sig2=vfs6IqUMCX-ccnmg1HWP7w.
Mourato, Susana, Eleni Fimereli, Davide Contu, Christopher Gaskell, and Carolina Boniatti-Pavese.
2014. ‘The Economic Benefits of Cultural Built Heritage Interiors Conservation from
Climate Change Damages in Europe’. Grantham Research Institute on Climate Change and
the Environment.

Heritage and the value of place
97
Navrud, Ståle, and R Ready. 2007. Environmental Value Transfer: Issues and Methods. Dordrecht,
Netherlands: Springer. http://www.springer.com/us/book/9781402040818.
Nieuwenhuijsen, Mark, and Haneen Khreis. 2017. ‘Green Space Is Important for Health’. The Lancet
389 (10070):700. https://doi.org/10.1016/S0140-6736(17)30340-9.
Noonan, Douglas S. 2003. ‘Contingent Valuation and Cultural Resources: A Meta-Analytic Review
of the Literature’. Journal of Cultural Economics 27 (3–4):159–76.
https://doi.org/10.1023/A:1026371110799.
Pagiola, S. 2001. ‘Valuing the Benefits of Investments in Cultural Heritage: The Historic Core of Split’.
In . Cagliari.
Pearce, David, and Ece O’zdemiroglu. 2002. ‘Economic Valuation with Stated Preference
Techniques’. London, UK: Department for Transport, Local Government and the Regions.
https://www.gov.uk/government/uploads/system/uploads/attachment_data/file/191522/
Economic_valuation_with_stated_preference_techniques.pdf.
Pennington, A, R Jones, A Bagnall, and J South. 2019. ‘Heritage and Wellbeing: The Impact of Historic
Places and Assets on Community Wellbeing - a Scoping Review’. Technical Report. What
Works Wellbeing.
Pollicino, Marilena, and David Maddison. 2001. ‘Valuing the Benefits of Cleaning Lincoln Cathedral’.
Journal of Cultural Economics 25 (2):131–48. https://doi.org/10.1023/A:1007653432745.
Pung, Caroline, Ann Clarke, and Laurie Patten. 2004. ‘Measuring the Economic Impact of the British
Library’. New Review of Academic Librarianship 10 (1):79–102.
https://doi.org/10.1080/13614530412331296826.
Ready, Richard, and St\a ale Navrud. 2006. ‘International Benefit Transfer: Methods and Validity
Tests’. Ecological Economics 60 (2):429–434.
Rosenberger, Randall S., and John B. Loomis. 2003. ‘Benefit Transfer’. In A Primer on Nonmarket
Valuation, 445–482. Springer. http://link.springer.com/chapter/10.1007/978-94-007-0826-
6_12.
Santagata, Walter, and Giovanni Signorello. 2000. ‘Contingent Valuation of a Cultural Public Good
and Policy Design: The Case of ``Napoli Musei Aperti’’’. Journal of Cultural Economics 24
(3):181–204. https://doi.org/10.1023/A:1007642231963.
Thomas, Daniel. 2018. ‘Six Reasons behind the High Street Crisis’. BBC News, 1 March 2018, sec.
Business. https://www.bbc.com/news/business-43240996.
Throsby, David. 1999. ‘Cultural Capital’. Journal of Cultural Economics 23 (1–2):3–12.
https://doi.org/10.1023/A:1007543313370.
———. 2019. ‘Heritage Economics: Coming to Terms with Value and Valuation’. In Values in Heritage
Management: Emerging Approaches and Research Directions, by Erica Avrami, Susan
MacDonald, Randall Mason, and David Myers, 199–209. Los Angeles, CA: The Getty
Conservation Institute.
Watt, W., R. Lawton, and D. Fujiwara. 2018. ‘Revaluing Parks and Green Spaces Measuring Their
Economic and Wellbeing Value to Individuals’. Field in Trust, UK.
Willis, Kenneth George. 1994. ‘Paying for Heritage: What Price for Durham Cathedral?’ Journal of
Environmental Planning and Management 37 (3):267–78.

Heritage and the value of place
98
8. Appendix A. Summary statistics and statistical WTP analysis Figure 8-1 Sample size and survey type by city (high street, left; civic buildings, right)
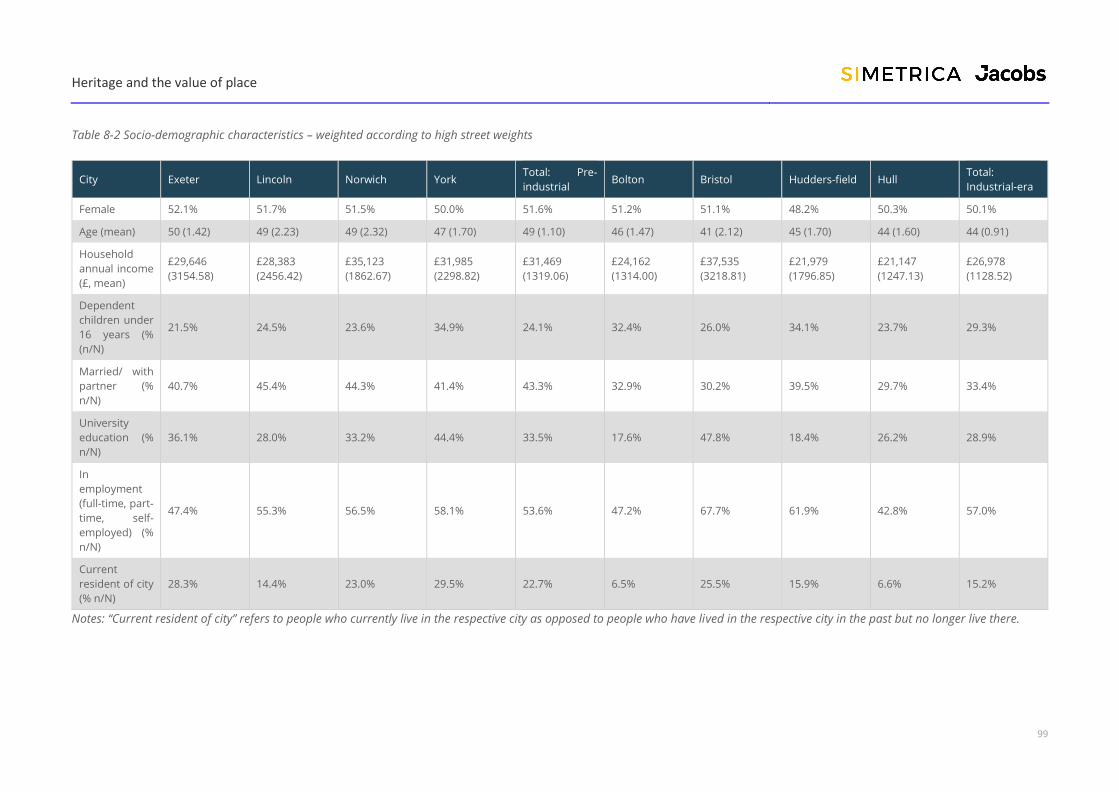
Heritage and the value of place
99
Table 8-2 Socio-demographic characteristics – weighted according to high street weights
City Exeter Lincoln Norwich York Total: Pre-
industrial Bolton Bristol Hudders-field Hull
Total:
Industrial-era
Female 52.1% 51.7% 51.5% 50.0% 51.6% 51.2% 51.1% 48.2% 50.3% 50.1%
Age (mean) 50 (1.42) 49 (2.23) 49 (2.32) 47 (1.70) 49 (1.10) 46 (1.47) 41 (2.12) 45 (1.70) 44 (1.60) 44 (0.91)
Household
annual income
(£, mean)
£29,646
(3154.58)
£28,383
(2456.42)
£35,123
(1862.67)
£31,985
(2298.82)
£31,469
(1319.06)
£24,162
(1314.00)
£37,535
(3218.81)
£21,979
(1796.85)
£21,147
(1247.13)
£26,978
(1128.52)
Dependent
children under
16 years (%
(n/N)
21.5% 24.5% 23.6% 34.9% 24.1% 32.4% 26.0% 34.1% 23.7% 29.3%
Married/ with
partner (%
n/N)
40.7% 45.4% 44.3% 41.4% 43.3% 32.9% 30.2% 39.5% 29.7% 33.4%
University
education (%
n/N)
36.1% 28.0% 33.2% 44.4% 33.5% 17.6% 47.8% 18.4% 26.2% 28.9%
In
employment
(full-time, part-
time, self-
employed) (%
n/N)
47.4% 55.3% 56.5% 58.1% 53.6% 47.2% 67.7% 61.9% 42.8% 57.0%
Current
resident of city
(% n/N)
28.3% 14.4% 23.0% 29.5% 22.7% 6.5% 25.5% 15.9% 6.6% 15.2%
Notes: “Current resident of city” refers to people who currently live in the respective city as opposed to people who have lived in the respective city in the past but no longer live there.

Heritage and the value of place
100
Table 8-3 Socio-demographic characteristics – weighted according to civic building weights
City Bolton Exeter Hudders-field Norwich Total: Town
halls Bristol Hull Lincoln York Total: Libraries
Female 51.2% 52.1% 48.2% 51.5% 51.1% 51.1% 50.3% 51.7% 50.0% 51.1%
Age (mean) 46 (1.34) 50 (1.51) 45 (1.73) 49 (1.89) 49 (0.95) 41 (2.15) 44 (1.55) 49 (2.30) 47 (1.70) 46 (1.30)
Household
annual income
(£, mean)
£25,084
(1273.21)
£28,948
(3696.63)
£21,427
(1754.70)
£34,221
(2199.22)
£29,401
(1365.63)
£31,670
(2763.66)
£20,920
(1250.51)
£27,568
(2374.06)
£33,185
(2311.73)
£28,045
(1312.43)
Dependent
children under
16 years (%
(n/N)
31.7% 20.9% 33.6% 23.0% 25.2% 24.9% 21.9% 22.9% 36.3% 24.9%
Married/ with
partner (%
n/N)
33.4% 38.2% 38.6% 46.1% 40.7% 27.1% 27.8% 45.8% 42.0% 37.6%
University
education (%
n/N)
19.3% 36.5% 17.7% 31.8% 29.6% 50.0% 28.7% 27.1% 43.7% 35.3%
In
employment
(full-time, part-
time, self-
employed) (%
n/N)
46.9% 44.6% 67.0% 56.5% 53.2% 62.3% 42.8% 53.4% 56.5% 54.4%
Current
resident of city
(% n/N)
6.0% 28.2% 16.2% 20.1% 20.5% 23.7% 6.9% 14.3% 27.5% 17.2%
Notes: “Current resident of city” refers to people who currently live in the respective city as opposed to people who have lived in the respective city in the past but no longer live there.

Heritage and the value of place
101
Figure 8-4 High street WTP (£ per household per year) - histograms and kernel density estimates: pre-industrial (left), industrial-era (right) to show distribution of WTP values within sample
Figure 8-5 Civic building WTP (£ per household per year) - histograms and kernel density estimates: town halls (left), libraries (right) to show distribution of WTP values within sample

Heritage and the value of place
102
Table 8-6 Full household WTP table for historic high streets
City Exeter Lincoln Norwich York Total: Pre-
industrial Bolton Bristol Huddersfield Hull
Total:
Industrial-era
Site The High
Street
The High
Street
Pottergate /
Bedford
Street
Stonegate
Churchgate /
Deansgate
Corn Street/
Clare Street King Street
Whitefriar-
gate
Mean (std. err.) £9.60 (£1.40) £8.61 (£1.36) £8.74 (£1.28) £13.07 (£2.77) £9.29 (£0.76) £10.56 (£2.65) £11.63 (£2.34) £3.34* (£1.25) £9.28* (£2.81) £8.51* (£1.12)
Lower confidence
interval (CI) (95%) £6.84 £5.92 £6.20 £7.59 £7.80 £5.32 £7.02 £0.88 £3.73 £6.31
Higher confidence
interval (CI) (95%) £12.35 £11.30 £11.27 £18.54 £10.77 £15.80 £16.24 £5.80 £14.83 £10.71
Median £2.25 £0.38 £2.75 £3.50 £2.25 £0.00 £0.00 £0.00 £0.00 £0.00
Max £125.0 £200.0 £125.0 £125.0 £200.0 £175.0 £175.0 £125.0 £175.0 £175.0
Zeros (total sample) 48.0% 50.0% 44.0% 44.0% 47.0% 60.0% 52.0% 78.0% 60.0% 63.0%
Payment card zeros 3.5% 1.2% 2.5% 2.1% 2.4% 2.6% 1.7% 2.1% 6.1% 2.9%
Sample size 203 225 175 171 774 180 203 148 200 731

Heritage and the value of place
103
Table 8-7 Full household WTP table for historic civic buildings
City Bolton Exeter Huddersfield Norwich Total: Town
halls Bristol Hull Lincoln York Total: Libraries
Site Bolton Town
Hall
Exeter City
Council
(Guildhall)
Huddersfield
Town Hall
Norwich City
Hall
Bristol Central
Library
Hull Central
Library
Lincoln
Central Library
York Central
Library
Mean (std.
err.) £4.47* (£0.80) £9.04* (£1.78) £4.97* (£1.23) £7.66* (£1.23) £7.29* (£0.79) £12.35 (£2.12) £7.76 (£1.99) £8.06 (£1.74) £13.49 (£2.78) £9.79 (£1.08)
Lower
confidence
interval (CI)
(95%)
£2.89 £5.53 £2.55 £5.22 £5.73 £8.16 £3.84 £4.62 £8.00 £7.67
Higher
confidence
interval (CI)
(95%)
£6.05 £12.56 £7.39 £10.09 £8.84 £16.54 £11.67 £11.50 £18.99 £11.91
Median £0.00 £2.25 £0.00 £0.00 £0.00 £2.75 £0.00 £0.00 £2.25 £0.00
Max £125.0 £125.0 £125.0 £125.0 £125.0 £200.0 £125.0 £200.0 £200.0 £200.0
Zeros (total
sample) 66.0% 48.0% 58.0% 54.0% 54.0% 44.0% 63.0% 54.0% 48.0% 52.0%
Payment card
zeros 5.2% 2.4% 0.0% 3.0% 2.6% 2.5% 2.2% 3.5% 0.9% 2.7%
Sample size 195 187 164 188 734 179 196 203 154 732
Note * indicates the statistical significance of the regression coefficients at the 99% (***), 95% (**) and 90%(*) confidence levels respectively.
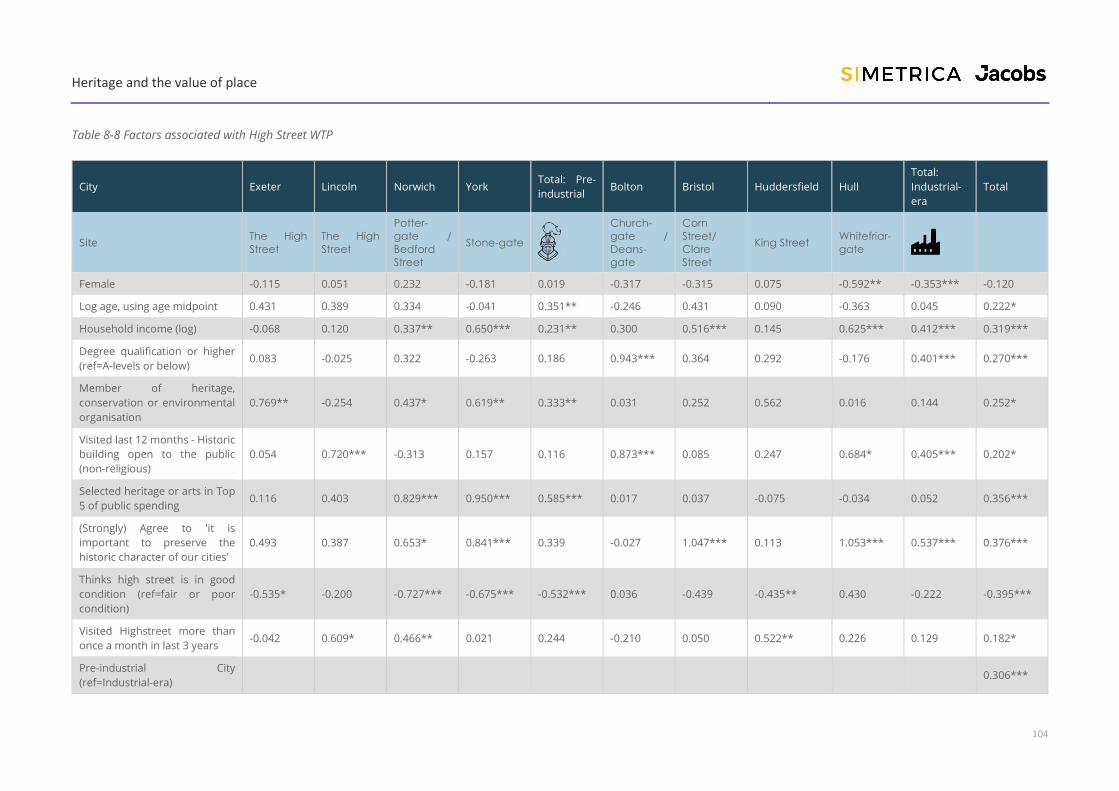
Heritage and the value of place
104
Table 8-8 Factors associated with High Street WTP
City Exeter Lincoln Norwich York Total: Pre-
industrial Bolton Bristol Huddersfield Hull
Total:
Industrial-
era
Total
Site The High
Street
The High
Street
Potter-
gate /
Bedford
Street
Stone-gate
Church-
gate /
Deans-
gate
Corn
Street/
Clare
Street
King Street Whitefriar-
gate
Female -0.115 0.051 0.232 -0.181 0.019 -0.317 -0.315 0.075 -0.592** -0.353*** -0.120
Log age, using age midpoint 0.431 0.389 0.334 -0.041 0.351** -0.246 0.431 0.090 -0.363 0.045 0.222*
Household income (log) -0.068 0.120 0.337** 0.650*** 0.231** 0.300 0.516*** 0.145 0.625*** 0.412*** 0.319***
Degree qualification or higher
(ref=A-levels or below) 0.083 -0.025 0.322 -0.263 0.186 0.943*** 0.364 0.292 -0.176 0.401*** 0.270***
Member of heritage,
conservation or environmental
organisation
0.769** -0.254 0.437* 0.619** 0.333** 0.031 0.252 0.562 0.016 0.144 0.252*
Visited last 12 months - Historic
building open to the public
(non-religious)
0.054 0.720*** -0.313 0.157 0.116 0.873*** 0.085 0.247 0.684* 0.405*** 0.202*
Selected heritage or arts in Top
5 of public spending 0.116 0.403 0.829*** 0.950*** 0.585*** 0.017 0.037 -0.075 -0.034 0.052 0.356***
(Strongly) Agree to 'it is
important to preserve the
historic character of our cities'
0.493 0.387 0.653* 0.841*** 0.339 -0.027 1.047*** 0.113 1.053*** 0.537*** 0.376***
Thinks high street is in good
condition (ref=fair or poor
condition)
-0.535* -0.200 -0.727*** -0.675*** -0.532*** 0.036 -0.439 -0.435** 0.430 -0.222 -0.395***
Visited Highstreet more than
once a month in last 3 years -0.042 0.609* 0.466** 0.021 0.244 -0.210 0.050 0.522** 0.226 0.129 0.182*
Pre-industrial City
(ref=Industrial-era) 0.306***

Heritage and the value of place
105
Survey model: F2F (ref=online) -0.058 -0.259 0.211 -0.063 0.011 0.275 -0.194 -0.730*** -0.287 -0.171 -0.067
Constant -0.055 -2.541* -4.482*** -5.892*** -3.026*** -1.461 -6.664*** -1.363 -4.561*** -3.871*** -3.604***
Observations 103 175 141 139 558 162 155 95 181 593 1151
Adjusted R-squared 0.017 0.101 0.252 0.383 0.146 0.208 0.129 0.281 0.185 0.161 0.156
Note * indicates the statistical significance of the regression coefficients at the 99% (***), 95% (**) and 90%(*) confidence levels respectively.
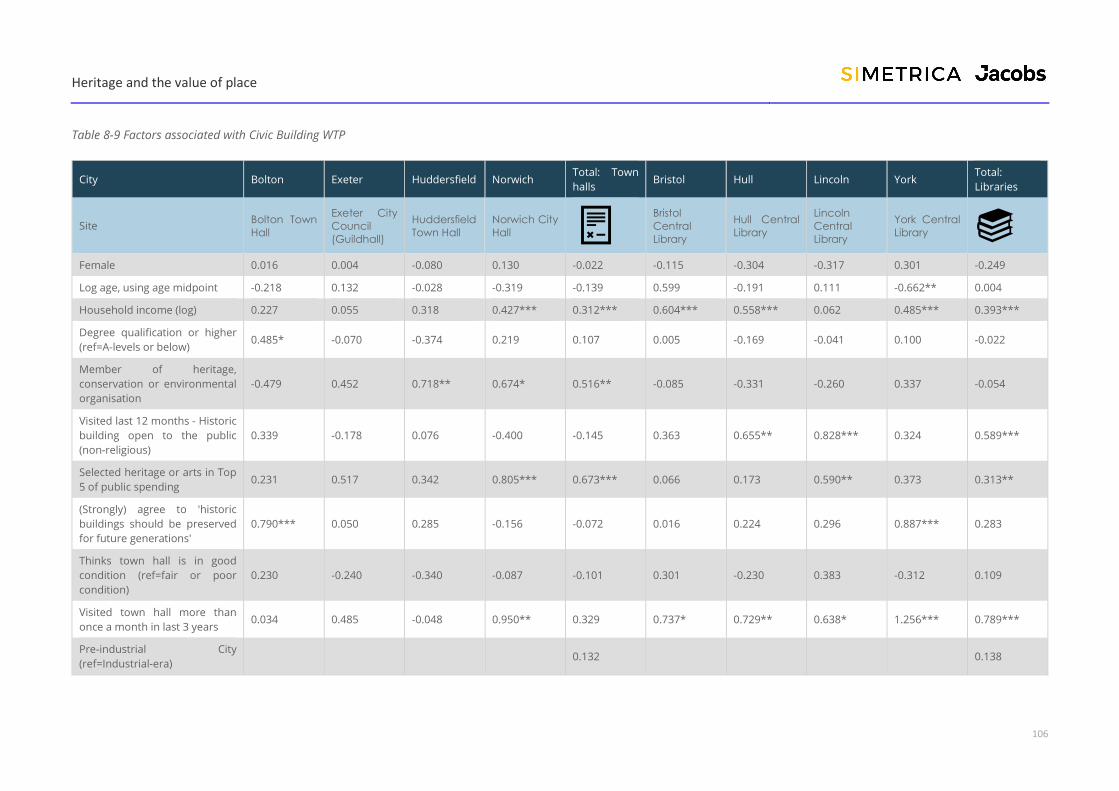
Heritage and the value of place
106
Table 8-9 Factors associated with Civic Building WTP
City Bolton Exeter Huddersfield Norwich Total: Town
halls Bristol Hull Lincoln York
Total:
Libraries
Site Bolton Town
Hall
Exeter City
Council
(Guildhall)
Huddersfield
Town Hall
Norwich City
Hall
Bristol
Central
Library
Hull Central
Library
Lincoln
Central
Library
York Central
Library
Female 0.016 0.004 -0.080 0.130 -0.022 -0.115 -0.304 -0.317 0.301 -0.249
Log age, using age midpoint -0.218 0.132 -0.028 -0.319 -0.139 0.599 -0.191 0.111 -0.662** 0.004
Household income (log) 0.227 0.055 0.318 0.427*** 0.312*** 0.604*** 0.558*** 0.062 0.485*** 0.393***
Degree qualification or higher
(ref=A-levels or below) 0.485* -0.070 -0.374 0.219 0.107 0.005 -0.169 -0.041 0.100 -0.022
Member of heritage,
conservation or environmental
organisation
-0.479 0.452 0.718** 0.674* 0.516** -0.085 -0.331 -0.260 0.337 -0.054
Visited last 12 months - Historic
building open to the public
(non-religious)
0.339 -0.178 0.076 -0.400 -0.145 0.363 0.655** 0.828*** 0.324 0.589***
Selected heritage or arts in Top
5 of public spending 0.231 0.517 0.342 0.805*** 0.673*** 0.066 0.173 0.590** 0.373 0.313**
(Strongly) agree to 'historic
buildings should be preserved
for future generations'
0.790*** 0.050 0.285 -0.156 -0.072 0.016 0.224 0.296 0.887*** 0.283
Thinks town hall is in good
condition (ref=fair or poor
condition)
0.230 -0.240 -0.340 -0.087 -0.101 0.301 -0.230 0.383 -0.312 0.109
Visited town hall more than
once a month in last 3 years 0.034 0.485 -0.048 0.950** 0.329 0.737* 0.729** 0.638* 1.256*** 0.789***
Pre-industrial City
(ref=Industrial-era) 0.132 0.138
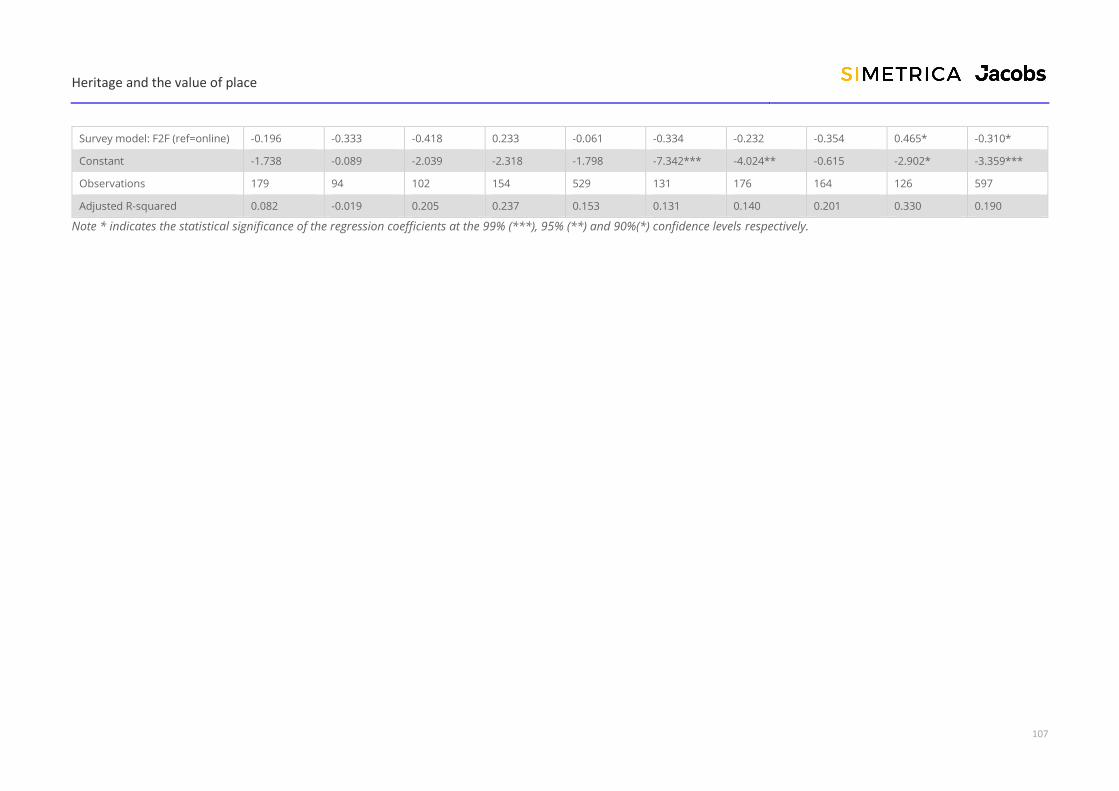
Heritage and the value of place
107
Survey model: F2F (ref=online) -0.196 -0.333 -0.418 0.233 -0.061 -0.334 -0.232 -0.354 0.465* -0.310*
Constant -1.738 -0.089 -2.039 -2.318 -1.798 -7.342*** -4.024** -0.615 -2.902* -3.359***
Observations 179 94 102 154 529 131 176 164 126 597
Adjusted R-squared 0.082 -0.019 0.205 0.237 0.153 0.131 0.140 0.201 0.330 0.190
Note * indicates the statistical significance of the regression coefficients at the 99% (***), 95% (**) and 90%(*) confidence levels respectively.
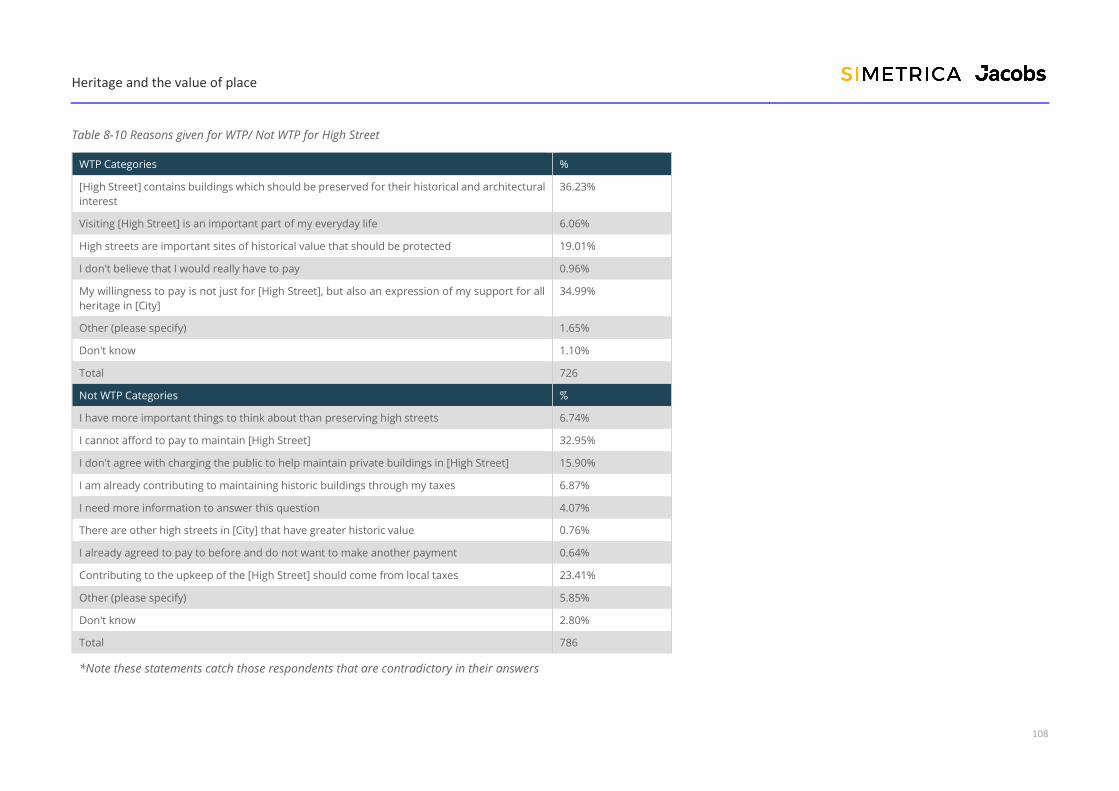
Heritage and the value of place
108
Table 8-10 Reasons given for WTP/ Not WTP for High Street
WTP Categories %
[High Street] contains buildings which should be preserved for their historical and architectural
interest
36.23%
Visiting [High Street] is an important part of my everyday life 6.06%
High streets are important sites of historical value that should be protected 19.01%
I don't believe that I would really have to pay 0.96%
My willingness to pay is not just for [High Street], but also an expression of my support for all
heritage in [City]
34.99%
Other (please specify) 1.65%
Don't know 1.10%
Total 726
Not WTP Categories %
I have more important things to think about than preserving high streets 6.74%
I cannot afford to pay to maintain [High Street] 32.95%
I don't agree with charging the public to help maintain private buildings in [High Street] 15.90%
I am already contributing to maintaining historic buildings through my taxes 6.87%
I need more information to answer this question 4.07%
There are other high streets in [City] that have greater historic value 0.76%
I already agreed to pay to before and do not want to make another payment 0.64%
Contributing to the upkeep of the [High Street] should come from local taxes 23.41%
Other (please specify) 5.85%
Don't know 2.80%
Total 786
*Note these statements catch those respondents that are contradictory in their answers
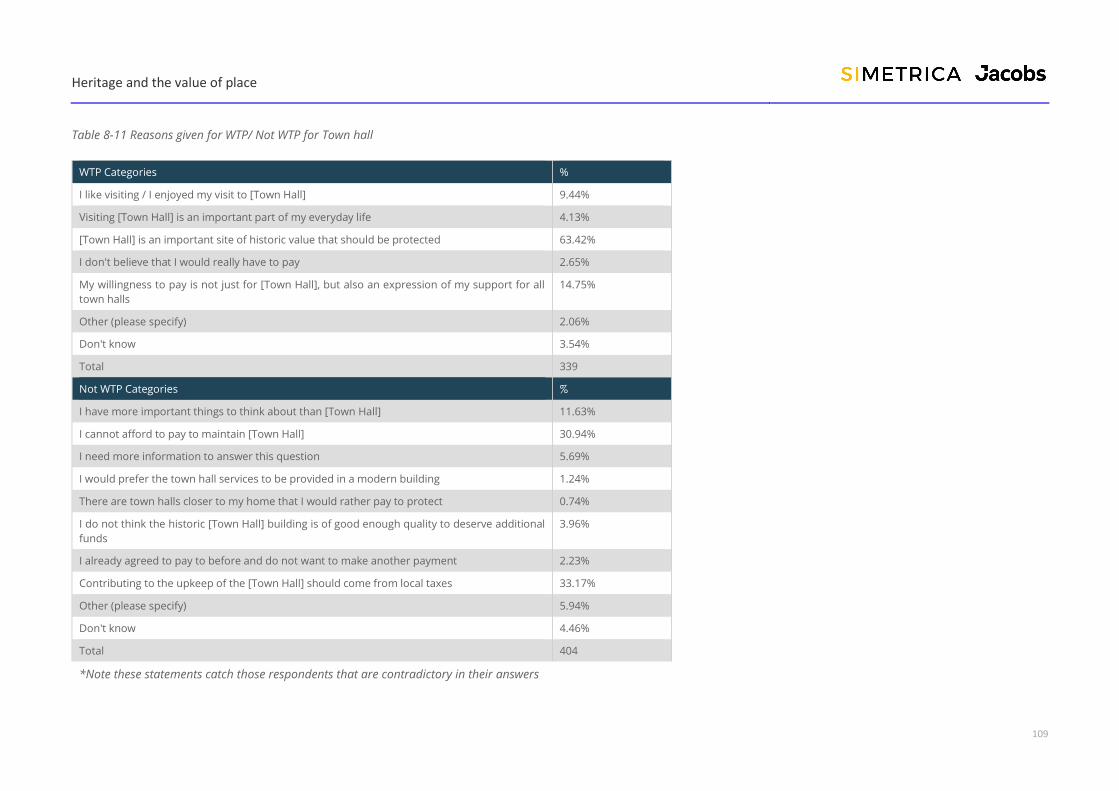
Heritage and the value of place
109
Table 8-11 Reasons given for WTP/ Not WTP for Town hall
WTP Categories %
I like visiting / I enjoyed my visit to [Town Hall] 9.44%
Visiting [Town Hall] is an important part of my everyday life 4.13%
[Town Hall] is an important site of historic value that should be protected 63.42%
I don't believe that I would really have to pay 2.65%
My willingness to pay is not just for [Town Hall], but also an expression of my support for all
town halls
14.75%
Other (please specify) 2.06%
Don't know 3.54%
Total 339
Not WTP Categories %
I have more important things to think about than [Town Hall] 11.63%
I cannot afford to pay to maintain [Town Hall] 30.94%
I need more information to answer this question 5.69%
I would prefer the town hall services to be provided in a modern building 1.24%
There are town halls closer to my home that I would rather pay to protect 0.74%
I do not think the historic [Town Hall] building is of good enough quality to deserve additional
funds
3.96%
I already agreed to pay to before and do not want to make another payment 2.23%
Contributing to the upkeep of the [Town Hall] should come from local taxes 33.17%
Other (please specify) 5.94%
Don't know 4.46%
Total 404
*Note these statements catch those respondents that are contradictory in their answers
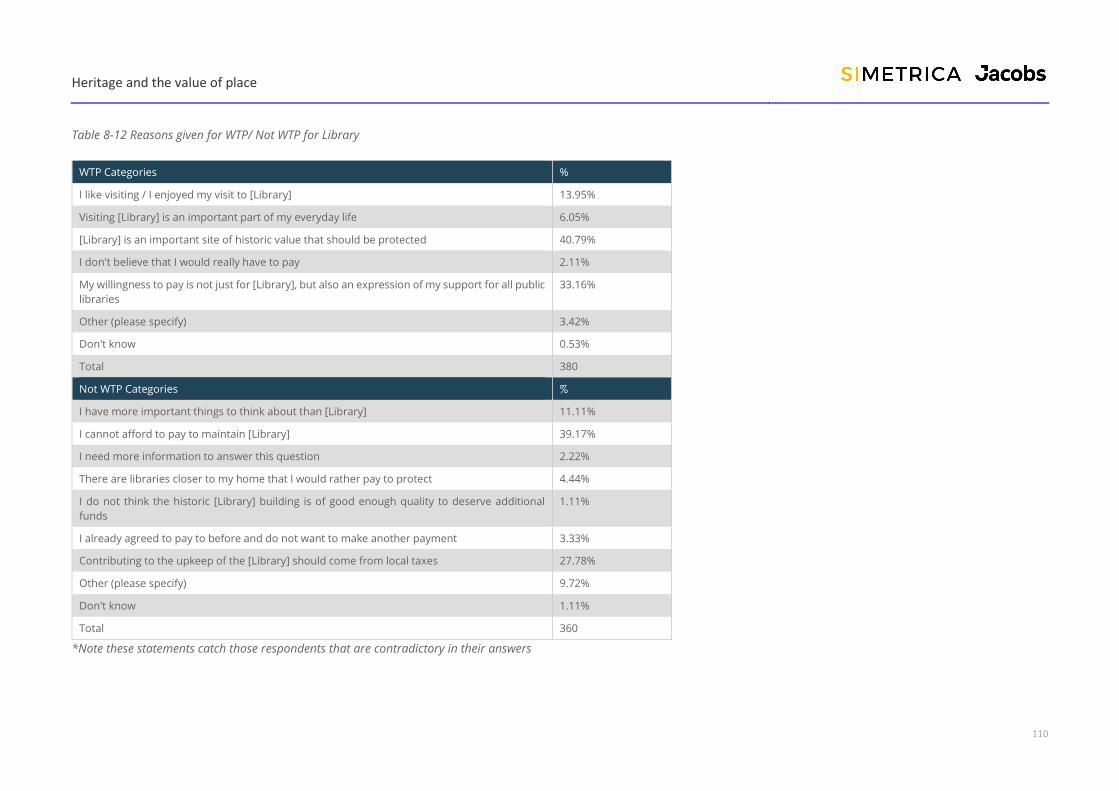
Heritage and the value of place
110
Table 8-12 Reasons given for WTP/ Not WTP for Library
WTP Categories %
I like visiting / I enjoyed my visit to [Library] 13.95%
Visiting [Library] is an important part of my everyday life 6.05%
[Library] is an important site of historic value that should be protected 40.79%
I don't believe that I would really have to pay 2.11%
My willingness to pay is not just for [Library], but also an expression of my support for all public
libraries
33.16%
Other (please specify) 3.42%
Don't know 0.53%
Total 380
Not WTP Categories %
I have more important things to think about than [Library] 11.11%
I cannot afford to pay to maintain [Library] 39.17%
I need more information to answer this question 2.22%
There are libraries closer to my home that I would rather pay to protect 4.44%
I do not think the historic [Library] building is of good enough quality to deserve additional
funds
1.11%
I already agreed to pay to before and do not want to make another payment 3.33%
Contributing to the upkeep of the [Library] should come from local taxes 27.78%
Other (please specify) 9.72%
Don't know 1.11%
Total 360
*Note these statements catch those respondents that are contradictory in their answers

Heritage and the value of place
111
Table 8-13 Reasons for WTP based on condition of high street
City Exeter Lincoln Norwich York Total: Pre-
industrial Bolton Bristol Huddersfield Hull
Total:
Industrial-era
Site The High
Street
The High
Street
Potter-gate /
Bedford Street Stone-gate
Church-gate /
Deans-gate
Corn Street/
Clare Street King Street
Whitefriar-
gate
The historic
buildings are in
bad/poor/fair
condition and
need to be
improved
23.1% (25/108) 22.8% (29/127) 21.7% (23/106) 20.0% (18/90) 28.9%
(210/726) 41.1% (30/73) 29.5% (31/105) 27.8% (10/36) 54.3% (44/81)
28.9%
(210/726)
The historic
buildings are in
good condition
and should be
kept that way
69.4% (75/108) 72.4% (92/127) 66.0% (70/106) 67.8% (61/90) 61.3%
(445/726) 52.1% (38/73) 57.1% (60/105) 52.8% (19/36) 37.0% (30/81)
61.3%
(445/726)
Other 3.7% (4/108) 1.6% (2/127) 1.9% (2/106) 2.2% (2/90) 2.3% (17/726) 2.7% (2/73) 1.0% (1/105) 2.8% (1/36) 3.7% (3/81) 2.3% (17/726)
Don’t
know/rather
not say
3.7% (4/108) 3.1% (4/127) 10.4% (11/106) 10.0% (9/90) 7.4% (54/726) 4.1% (3/73) 12.4% (13/105) 16.7% (6/36) 4.9% (4/81) 7.4% (54/726)

Heritage and the value of place
112
Table 8-14 Reasons for not WTP based on condition of high street
City Exeter Lincoln Norwich York Total: Pre-
industrial Bolton Bristol Huddersfield Hull
Total:
Industrial-era
Site The High
Street
The High
Street
Pottergate /
Bedford
Street
Stonegate
Church-gate
/ Deansgate
Corn Street/
Clare Street King Street
Whitefriar-
gate
The historic buildings are
already in good condition
and do not need to be
improved
38.7%
(41/106)
32.4%
(33/102) 41.3% (31/75) 31.1% (28/90)
39.3%
(326/829)
39.3%
(44/112)
35.3%
(36/102)
76.7%
(92/120)
17.2%
(21/122)
39.3%
(326/829)
The historic buildings are in
bad/poor/fair condition and
I do not want to pay to
improve them
18.9%
(20/106)
21.6%
(22/102) 21.3% (16/75) 25.6% (23/90)
23.9%
(198/829)
23.2%
(26/112)
15.7%
(16/102)
10.0%
(12/120)
51.6%
(63/122)
23.9%
(198/829)
Other 30.2%
(32/106)
18.6%
(19/102) 12.0% (9/75) 23.3% (21/90)
18.7%
(155/829)
20.5%
(23/112)
23.5%
(24/102) 7.5% (9/120)
14.8%
(18/122)
18.7%
(155/829)
Don’t know/rather not say 12.3%
(13/106)
27.5%
(28/102) 25.3% (19/75) 20.0% (18/90)
18.1%
(150/829)
17.0%
(19/112)
25.5%
(26/102) 5.8% (7/120)
16.4%
(20/122)
18.1%
(150/829)

Heritage and the value of place
113
Table 8-15 Reasons for WTP based on condition of civic building
City Bolton Exeter Hudders-field Norwich Total town
halls Bristol Hull Lincoln York Total libraries
Site Bolton Town
Hall
Exeter City
Council
(Guildhall)
Hudders-field
Town Hall
Norwich City
Hall
Bristol
Central
Library
Hull Central
Library
Lincoln
Central
Library
York Central
Library
The historic buildings are in
bad/poor/fair condition and
need to be improved
22.9% (16/70) 31.0%
(31/100) 25.7% (18/70) 11.1% (11/99)
22.4%
(76/339) 31.4% (22/70)
31.9%
(37/116) 34.0% (33/97) 46.5% (33/71)
35.4%
(135/381)
The historic buildings are in
good condition and should
be kept that way
72.9% (51/70) 62.0%
(62/100) 67.1% (47/70) 73.7% (73/99)
68.7%
(233/339) 20.0% (14/70)
37.9%
(44/116) 13.4% (13/97) 22.5% (16/71)
23.4%
(89/381)
Other 1.4% (1/70) 4.0% (4/100) 1.4% (1/70) 3.0% (3/99) 2.7% (9/339) 21.4% (15/70) 13.8%
(16/116) 22.7% (22/97) 11.3% (8/71)
17.8%
(68/381)
Don’t know/rather not say 2.9% (2/70) 3.0% (3/100) 5.7% (4/70) 12.1% (12/99) 6.2% (21/339) 27.1% (19/70) 16.4%
(19/116) 29.9% (29/97) 19.7% (14/71)
23.4%
(89/381)

Heritage and the value of place
114
Table 8-16 Reasons for not WTP based on condition of town hall or library
City Bolton Exeter Hudders-field Norwich Total town
halls Bristol Hull Lincoln York Total libraries
Site Bolton Town
Hall
Exeter City
Council
(Guildhall)
Hudders-field
Town Hall
Norwich City
Hall
Bristol Central
Library
Hull Central
Library
Lincoln
Central
Library
York Central
Library
The historic
buildings are
already in good
condition and do
not need to be
improved
59.1% (75/127) 33.7% (31/92) 79.6% (74/93) 39.5% (34/86) 52.1%
(223/428) 31.4% (22/70) 31.9% (37/116) 34.0% (33/97) 46.5% (33/71)
35.4%
(135/381)
The historic
buildings are in
bad/poor/fair
condition and I
do not want to
pay to improve
them
10.2% (13/127) 25.0% (23/92) 10.8% (10/93) 24.4% (21/86) 16.1% (69/428) 20.0% (14/70) 37.9% (44/116) 13.4% (13/97) 22.5% (16/71) 23.4% (89/381)
Other 22.8% (29/127) 32.6% (30/92) 3.2% (3/93) 14.0% (12/86) 18.7% (80/428) 21.4% (15/70) 13.8% (16/116) 22.7% (22/97) 11.3% (8/71) 17.8% (68/381)
Don’t
know/rather not
say
7.9% (10/127) 8.7% (8/92) 6.5% (6/93) 22.1% (19/86) 13.1% (56/428) 27.1% (19/70) 16.4% (19/116) 29.9% (29/97) 19.7% (14/71) 23.4% (89/381)
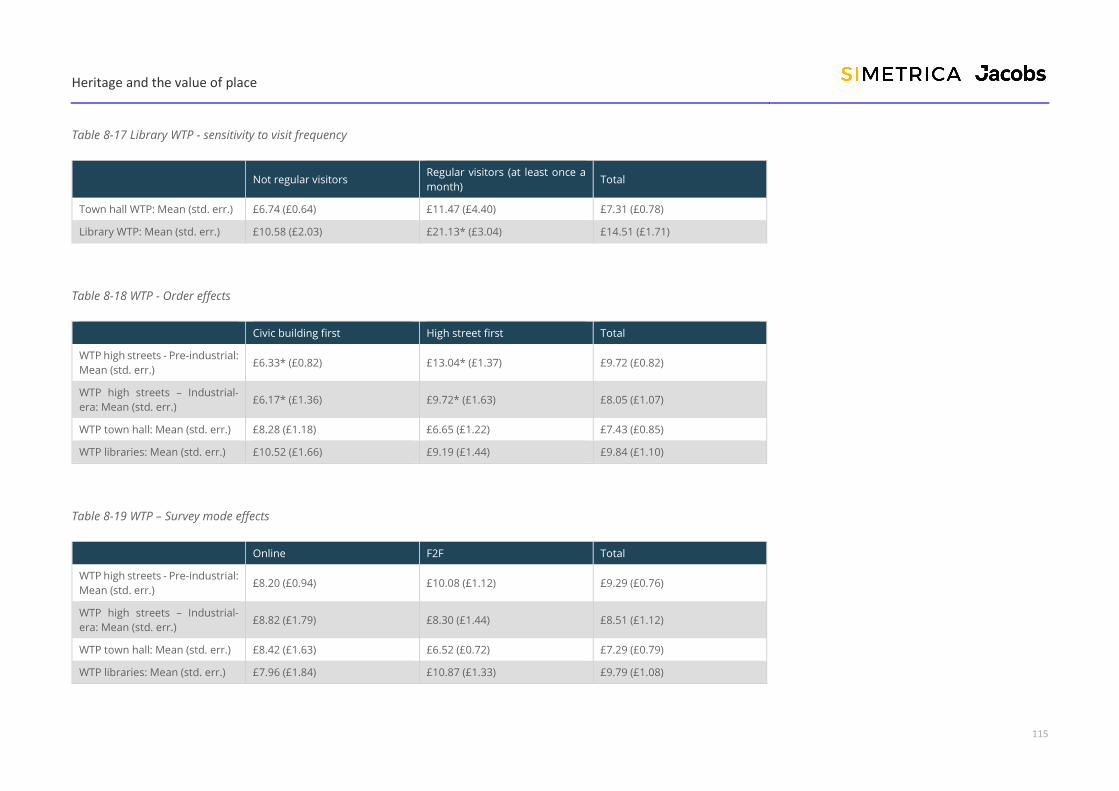
Heritage and the value of place
115
Table 8-17 Library WTP - sensitivity to visit frequency
Not regular visitors Regular visitors (at least once a
month) Total
Town hall WTP: Mean (std. err.) £6.74 (£0.64) £11.47 (£4.40) £7.31 (£0.78)
Library WTP: Mean (std. err.) £10.58 (£2.03) £21.13* (£3.04) £14.51 (£1.71)
Table 8-18 WTP - Order effects
Civic building first High street first Total
WTP high streets - Pre-industrial:
Mean (std. err.) £6.33* (£0.82) £13.04* (£1.37) £9.72 (£0.82)
WTP high streets – Industrial-
era: Mean (std. err.) £6.17* (£1.36) £9.72* (£1.63) £8.05 (£1.07)
WTP town hall: Mean (std. err.) £8.28 (£1.18) £6.65 (£1.22) £7.43 (£0.85)
WTP libraries: Mean (std. err.) £10.52 (£1.66) £9.19 (£1.44) £9.84 (£1.10)
Table 8-19 WTP – Survey mode effects
Online F2F Total
WTP high streets - Pre-industrial:
Mean (std. err.) £8.20 (£0.94) £10.08 (£1.12) £9.29 (£0.76)
WTP high streets – Industrial-
era: Mean (std. err.) £8.82 (£1.79) £8.30 (£1.44) £8.51 (£1.12)
WTP town hall: Mean (std. err.) £8.42 (£1.63) £6.52 (£0.72) £7.29 (£0.79)
WTP libraries: Mean (std. err.) £7.96 (£1.84) £10.87 (£1.33) £9.79 (£1.08)
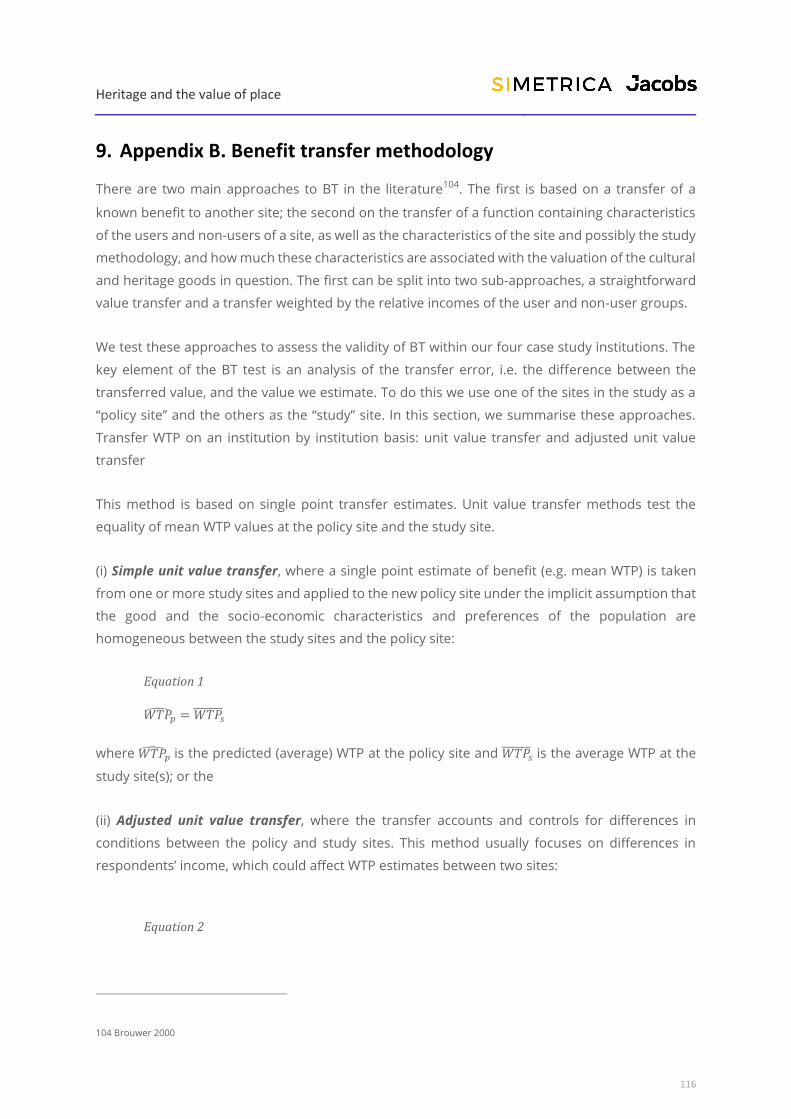
Heritage and the value of place
116
9. Appendix B. Benefit transfer methodology
There are two main approaches to BT in the literature104. The first is based on a transfer of a
known benefit to another site; the second on the transfer of a function containing characteristics
of the users and non-users of a site, as well as the characteristics of the site and possibly the study
methodology, and how much these characteristics are associated with the valuation of the cultural
and heritage goods in question. The first can be split into two sub-approaches, a straightforward
value transfer and a transfer weighted by the relative incomes of the user and non-user groups.
We test these approaches to assess the validity of BT within our four case study institutions. The
key element of the BT test is an analysis of the transfer error, i.e. the difference between the
transferred value, and the value we estimate. To do this we use one of the sites in the study as a
“policy site” and the others as the “study” site. In this section, we summarise these approaches.
Transfer WTP on an institution by institution basis: unit value transfer and adjusted unit value
transfer
This method is based on single point transfer estimates. Unit value transfer methods test the
equality of mean WTP values at the policy site and the study site.
(i) Simple unit value transfer, where a single point estimate of benefit (e.g. mean WTP) is taken
from one or more study sites and applied to the new policy site under the implicit assumption that
the good and the socio-economic characteristics and preferences of the population are
homogeneous between the study sites and the policy site:
Equation 1
𝑊𝑇�̂�𝑝 = 𝑊𝑇𝑃̅̅ ̅̅ ̅̅�̅�
where 𝑊𝑇�̂�𝑝 is the predicted (average) WTP at the policy site and 𝑊𝑇𝑃̅̅ ̅̅ ̅̅�̅� is the average WTP at the
study site(s); or the
(ii) Adjusted unit value transfer, where the transfer accounts and controls for differences in
conditions between the policy and study sites. This method usually focuses on differences in
respondents’ income, which could affect WTP estimates between two sites:
Equation 2
104 Brouwer 2000

Heritage and the value of place
117
𝑊𝑇�̂�𝑝 = (�̅�𝑝
�̅�𝑠
)
𝑒
𝑊𝑇𝑃̅̅ ̅̅ ̅̅�̅�
where �̅�𝑝 , �̅�𝑠 is the average household income at policy and study sites, respectively, and 𝑒 is the
elasticity of the marginal utility of income with respect to WTP. We assume, as per the Green Book,
that this equals 1 (i.e. 𝑒 = 1).105
9.1 Value Function Transfer: Transfer adjusted WTP from pooled data
(iii) Benefit function 106 representing the relationship between WTP and a number of explanatory
variables. The researcher transfers the entire benefit function estimated at the study site(s) to the
policy site, where it is adapted to fit the characteristics of the policy site (such as socio-economic
characteristics and other measurable characteristics that systematically differ between the policy
and study sites). The tailored benefit function is then used to predict the benefits for the policy
site 107:
Equation 3
𝑊𝑇�̂�𝑖𝑝 = 𝑏0 + 𝑏1𝑄𝑝 + 𝑏2𝐶𝑝 + 𝑏3𝐴𝑝 + 𝑏4𝑆𝑖𝑝
where 𝑊𝑇�̂�𝑖𝑝 is the predicted willingness to pay of individual 𝑖 for policy site 𝑝; 𝑄𝑝 is the change in
provision of the cultural good/service at site 𝑝; 𝐶𝑝 is the characteristics of the good at site 𝑝; 𝐴𝑝 is
the availability of substitute sites for site 𝑝 ; and 𝑆𝑖𝑝 are the socio-economic characteristics of
individual 𝑖 at site 𝑝. The coefficients 𝑏0, … , 𝑏4 are obtained from the WTP function estimated at the
study site (Equation 7 is estimated for the study sites whereby the subscripts 𝑝 become subscripts
𝑠). Under this approach, more information about the site and population can be transferred and
so the transfer errors are likely to be lower than the other two methods 108. On the other hand,
this approach is more data-intensive and requires availability of a range of demographic and
possibly attitudinal/behavioural variables that are part of the WTP function, in each site.
Since for policy decisions, we are interested in an average WTP for a site, knowing the WTP per
individual is not required. For this reason, we can average out Equation 3 across individuals:
Equation 4
105 Alternatively, the elasticity of the marginal utility of income could be estimated using data from the study site – this would be more in
the spirit of the function transfer approach discussed below in the text.
106 Desvouges et al. 1992a; Kaul et al. 2013; Loomis 1992
107 Rosenberger and Loomis 2003
108 Brouwer and Spaninks 1999
Heritage and the value of place
118
𝑊𝑇�̂�𝑝 = 𝑏0 + 𝑏1𝑄𝑝 + 𝑏2𝐶𝑝 + 𝑏3𝐴𝑝 + 𝑏4𝑆�̅�
where now 𝑆�̅� is a set of the average socio-economic characteristics of individuals at site 𝑝; and the
remaining notation is the same as in Equation 3. Equation 4 highlights the fact that individual-level
data from the policy site are not necessary in order to predict average WTP. Rather, information
on the average characteristics of the policy site is sufficient and this may be held by the policy site
itself without the need for any further primary data collection.
In our study Equation 4 is obtained iteratively for each site. Out of the four sites in each category
we select a sub-set of three sites (which become the study sites) and estimate a benefit function
on pooled data from these three study sites. The omitted fourth site then becomes the policy site
and characteristics from the omitted sites are plugged into Equation 8 to predict WTP at the policy
site 109. Each of the four sites in each study category has “its turn” as a policy site and so the above
process is conducted four times omitting a different site each time which then becomes the policy
site for that particular iteration of the study. We therefore predict WTP values for each of the four
sites based on pooled benefit functions from the other three sites in each category of historic high
street and civic building.
9.2 Transfer error testing
A number of transfer tests have been proposed to test the predictive power of BT. The statistical
validity of benefit transfer is based on the assumption that value estimates are statistically
identical across study and policy contexts. In other words, the values estimated for the pooled
study sites should not be significantly different from the policy site. This difference, known as
transfer error, is measured in two ways.
First, we calculate the percentage difference between the observed and the predicted WTP value.
What is an acceptable transfer error and whether the transfer is still informative depends on the
intended policy use of the transferred estimates, and the corresponding accuracy required.110
Here, we compare estimates of transfer error to established ranges within the literature.111 Ready
and Navrud 112 reviewed intra and cross-country benefit transfer studies and found that the
average transfer error was in the range of 20% to 40%, while individual transfers had errors as
109 Bateman et al. 2011
110 Brookshire and Neill 1992b; Desvouges et al. 1992b
111 Mourato et al. 2014; Navrud and Ready 2007
112 Ready and Navrud 2006

Heritage and the value of place
119
high as 100-200%, particularly when involving complex goods. For the purpose of testing we apply
a threshold of maximum 40% transfer error to all individual transfer errors.
Second, we test the statistical difference between observed and predicted WTP in each case using
student’s t-tests. The acceptable threshold of statistically significant transfer error is not clearly set
in the benefit transfer literature. For the purposes of transfer testing in this study we deem
transfer errors to be acceptable if differences in observed policy site and pooled study sites WTP
values are statistically insignificant in at least three of the four cases. Given the lack of guidance
from the literature, we place more weight on transfer tests which produce errors below the 40%
transfer error threshold proposed by Ready and Navrud.113
For use values across sites and populations, we test three hypotheses for the three BT methods
outlined in Equation 1-Equation 3 (described in Table 9-1).
Table 9-1 Benefit transfer tests employed
BT APPROACH T-TEST HYPOTHESIS
UNIT TRANSFER
Simple
𝐻1: 𝑊𝑇𝑃𝑝 = 𝑊𝑇𝑃𝑠
Null hypothesis: equivalence of observed mean policy site WTP and
mean pooled study site WTP.
Adjusted
𝐻2: 1
𝑎𝑝
𝑊𝑇𝑃̅̅ ̅̅ ̅̅�̅� =
1
𝑎𝑠
𝑊𝑇𝑃̅̅ ̅̅ ̅̅�̅�
where 𝑎𝑖 = (�̅�𝑖)𝑒 for 𝑖 = 𝑝, 𝑠
Null hypothesis: equivalence of observed mean policy site WTP and
mean pooled study site WTP, adjusted for income difference between
policy and study site.
FUNCTION TRANSFER
Function
𝐻3: 𝑊𝑇𝑃̅̅ ̅̅ ̅̅�̅� = 𝑏 ∙ �̅�𝑝
Null hypothesis: equivalence of observed mean policy site WTP and
mean predicted pooled study site WTP.
113 Ready and Navrud 2006

Heritage and the value of place
120
Notes: 𝑊𝑇𝑃̅̅ ̅̅ ̅̅�̅�, 𝑊𝑇𝑃̅̅ ̅̅ ̅̅
�̅� = average WTP at policy (𝑝) and study (𝑠) sites; �̅�𝑝, �̅�𝑠= average household income
at policy and study side respectively; 𝑒 = 1; 𝑏 = coefficients obtained from WTP function estimated at
study sites; and �̅�𝑝 = average characteristics of the policy site. For simple and adjusted unit transfer
approaches, we use the equivalent of a two-sample unpaired t-test with unequal variances for weighted
data, for the function transfer approach we use a paired t-test.
Hypothesis H1 tests the equality of mean WTP values at the policy site and the study site.
Alternatively, average values from multiple study sites can be used, which is our approach here.
Hypothesis H2 tests the equality of adjusted mean WTP values at the policy site and the study site
(or pool of study sites), adjusting for differences in any relevant characteristics. Accounting for
differences in income is the most common adjustment and is the approach we use here for use
values.
Hypothesis H3 tests the transferability of a pooled benefit function, which is obtained after pooling
the datasets from the study sites (excluding the policy case in each case) and estimating a WTP
function for the pooled dataset. Specifically, H3 tests the equality of the observed mean WTP at
the policy site and the predicted mean WTP for the policy site, using the estimated parameter
coefficients of the pooled WTP function and the values of predictor variables observed at the policy
site.
The accuracy of transfers (either unit or function transfers) is assessed by estimating the
respective transfer errors, as follows:
Equation 5
𝑇𝐸 = (𝑊𝑇�̂�𝑝 − 𝑊𝑇𝑃̅̅ ̅̅ ̅̅
�̅�
𝑊𝑇𝑃̅̅ ̅̅ ̅̅�̅�
) × 100