hemodynamics and shock 3-2012 · – acute cardiogenic shock – hypovolemic shock • decreased...
TRANSCRIPT
CNEA / Key Choice 3/27/2012
www.cardionursing.com 1
2012 CNEA / Key Choice 1
Hemodynamic Principles for
Practice
Cynthia Webner DNP, RN, CCNS, CCRN, CMC
Karen Marzlin DNP, RN, CCNS, CCRN, CMC
2
Paradigm Shift
• Hemodynamics
does not equal
invasive
monitoring
One must be comfortable
with shades of grey!!
CNEA / Key Choice
CNEA / Key Choice 3/27/2012
www.cardionursing.com 2
3
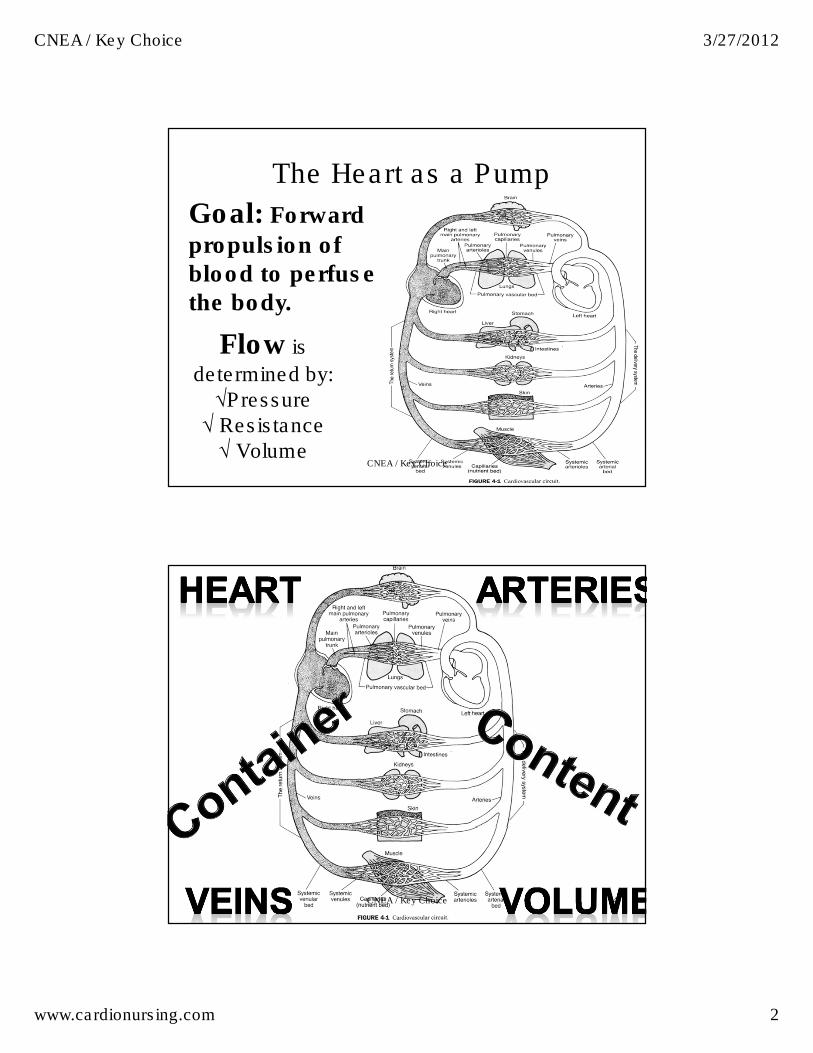
Flow is
determined by: √Pressure √ Resistance √ Volume
The Heart as a Pump
Goal: Forward
propulsion of blood to perfuse the body.
CNEA / Key Choice
CNEA / Key Choice 4
CNEA / Key Choice 3/27/2012
www.cardionursing.com 3
5
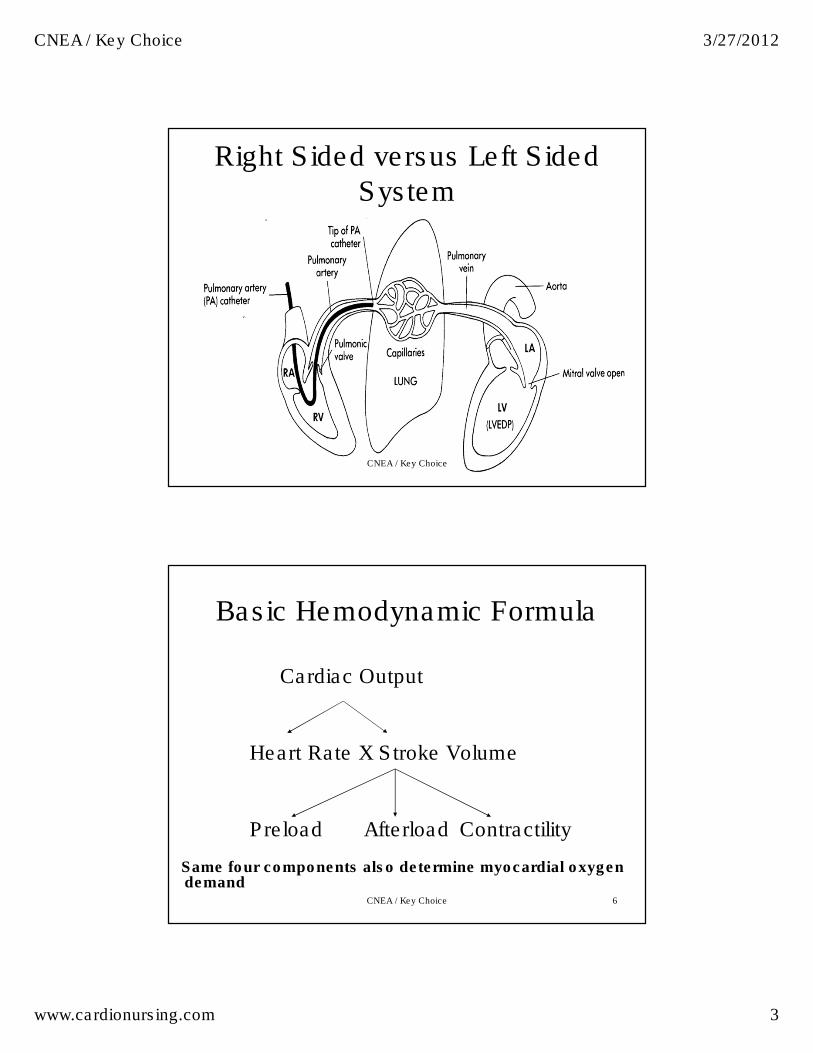
Right Sided versus Left Sided System
CNEA / Key Choice
6
Basic Hemodynamic Formula
Cardiac Output
Heart Rate X Stroke Volume
Preload Afterload Contractility
Same four components also determine myocardial oxygen demand
CNEA / Key Choice
CNEA / Key Choice 3/27/2012
www.cardionursing.com 4
7
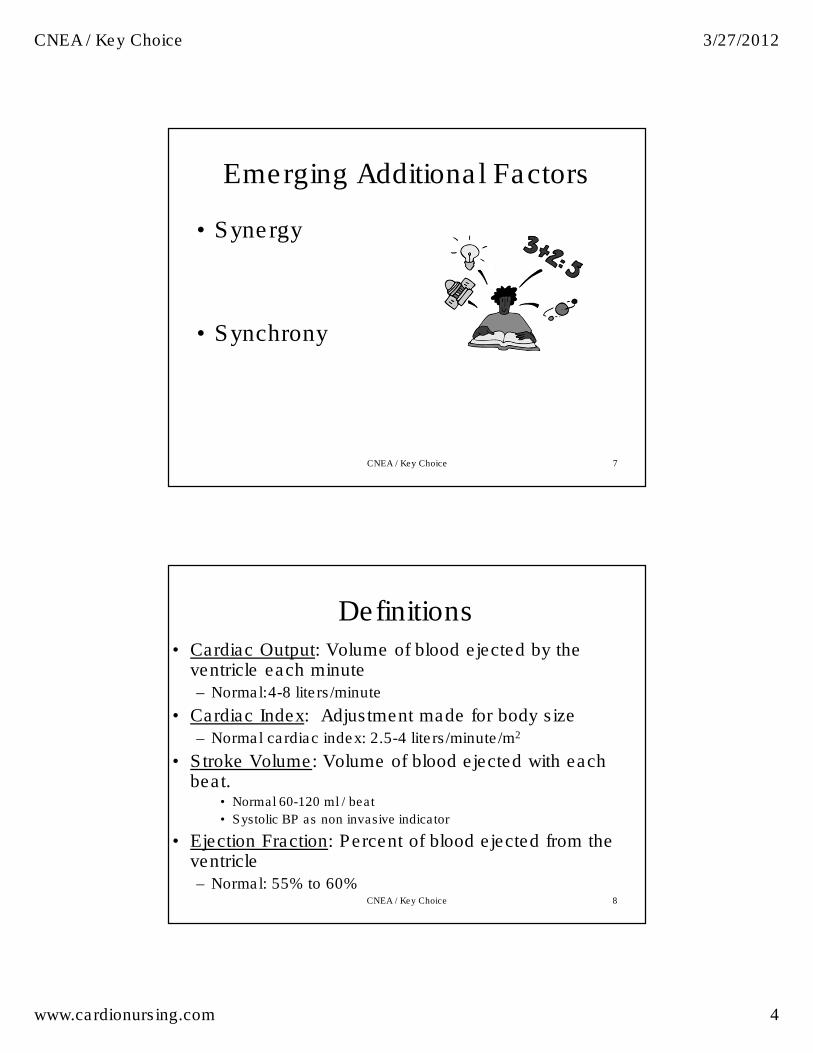
Emerging Additional Factors
• Synergy
• Synchrony
CNEA / Key Choice
8
Definitions • Cardiac Output: Volume of blood ejected by the
ventricle each minute– Normal:4-8 liters/minute
• Cardiac Index: Adjustment made for body size– Normal cardiac index: 2.5-4 liters/minute/m2
• Stroke Volume: Volume of blood ejected with each beat.
• Normal 60-120 ml / beat
• Systolic BP as non invasive indicator
• Ejection Fraction: Percent of blood ejected from the ventricle– Normal: 55% to 60%
CNEA / Key Choice
CNEA / Key Choice 3/27/2012
www.cardionursing.com 5
KEY PHYSIOLOGICAL
PRINCIPALS
More Understanding
CNEA / Key Choice 9
Key Principles in Understanding Hemodynamic Assessment
• Arterial pulse
waveform (and pulse
pressure) are
proportional to SV
• Pulse pressure
inversely related to
arterial compliance
• MAP = Calculated
• SBP: Reflects LV
volume and
contraction
– Very dynamic
• Diastolic BP
– Continuous / less
dynamic pressure
– Drives capillary
opening pressure
CNEA / Key Choice 10
CNEA / Key Choice 3/27/2012
www.cardionursing.com 6
Key Principles in Understanding Hemodynamic Assessment
• Vascular tone is
affected by:
– Large vessel
compliance
– Peripheral vascular
resistance (smaller
vessels)
• Vessel resistance
changes more quickly
than large vessel
compliance
• Increased resistance
= increased DBP
CNEA / Key Choice 11
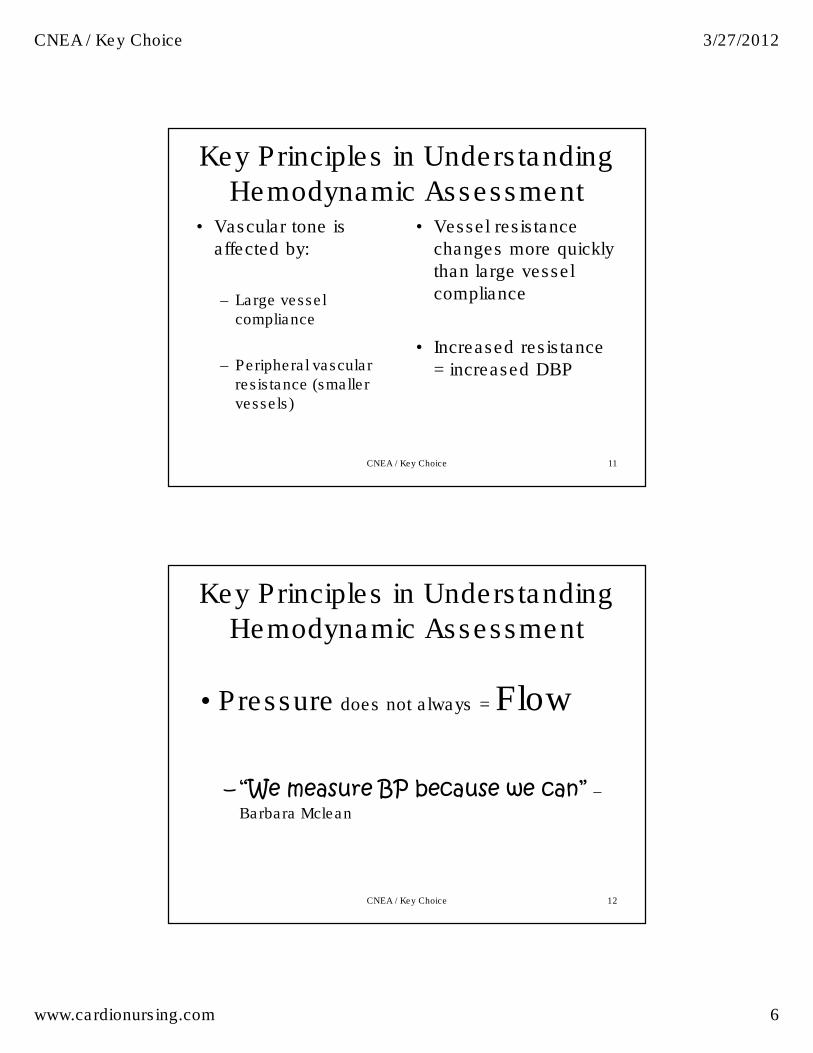
Key Principles in Understanding Hemodynamic Assessment
• Pressure does not always = Flow
– “We measure BP because we can” –Barbara Mclean
CNEA / Key Choice 12
CNEA / Key Choice 3/27/2012
www.cardionursing.com 7
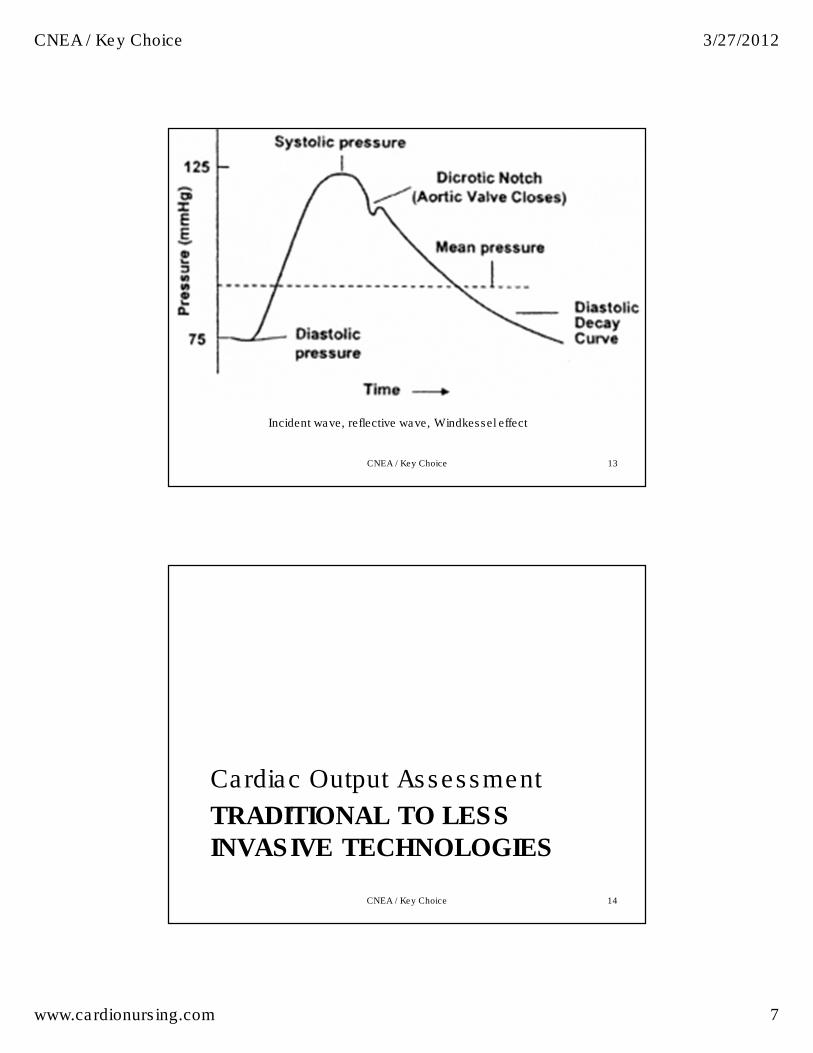
CNEA / Key Choice 13
Incident wave, reflective wave, Windkessel effect
TRADITIONAL TO LESS
INVASIVE TECHNOLOGIES
Cardiac Output Assessment
CNEA / Key Choice 14
CNEA / Key Choice 3/27/2012
www.cardionursing.com 8
15
Cardiac Output Measurements
• Thermodilution method using intermittent bolus injections of fluid
• Continuous measurement using a specialized catheter that emits heat
• Pulse contour analysis (PiCCO)
• Lithium derived continuous cardiac output (LiDCO)
• Transthoracic electrical bioimpedance
CNEA / Key Choice
16
Thermodilution Cardiac Output • Injection of known amount of D5W or NS into the
RA through the proximal port of the PA catheter.
• The injectate fluid is warmed by the blood.
• The temperature of the blood (flowing past the thermistor at the distal end of the catheter) is measured.
• The CO computer calculates CO based on the temperature change between the injectate and the blood at the thermistor.
• The more blood (higher CO), the more the temperature change; the less blood (low CO) the less the temperature change.
CNEA / Key Choice
CNEA / Key Choice 3/27/2012
www.cardionursing.com 9
17
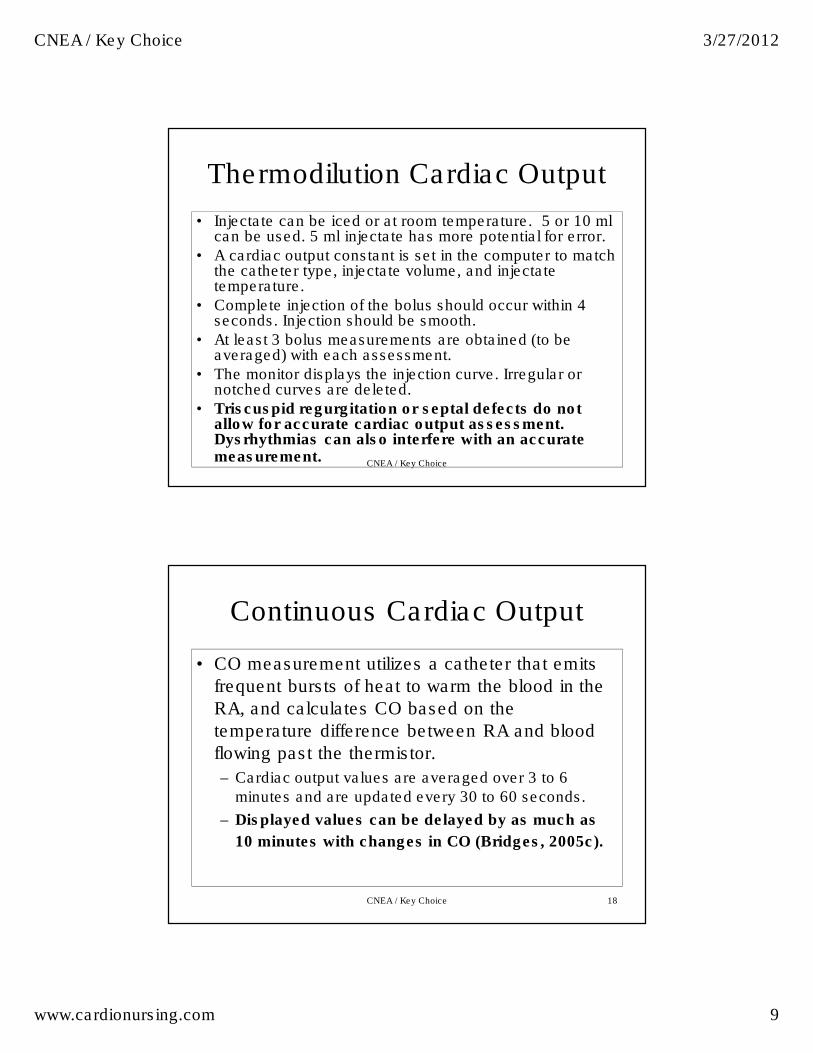
Thermodilution Cardiac Output
• Injectate can be iced or at room temperature. 5 or 10 ml can be used. 5 ml injectate has more potential for error.
• A cardiac output constant is set in the computer to match the catheter type, injectate volume, and injectatetemperature.
• Complete injection of the bolus should occur within 4 seconds. Injection should be smooth.
• At least 3 bolus measurements are obtained (to be averaged) with each assessment.
• The monitor displays the injection curve. Irregular or notched curves are deleted.
• Triscuspid regurgitation or septal defects do not allow for accurate cardiac output assessment. Dysrhythmias can also interfere with an accurate measurement.
CNEA / Key Choice
18
Continuous Cardiac Output
• CO measurement utilizes a catheter that emits
frequent bursts of heat to warm the blood in the
RA, and calculates CO based on the
temperature difference between RA and blood
flowing past the thermistor.
– Cardiac output values are averaged over 3 to 6
minutes and are updated every 30 to 60 seconds.
– Displayed values can be delayed by as much as
10 minutes with changes in CO (Bridges, 2005c).
CNEA / Key Choice
CNEA / Key Choice 3/27/2012
www.cardionursing.com 10
19
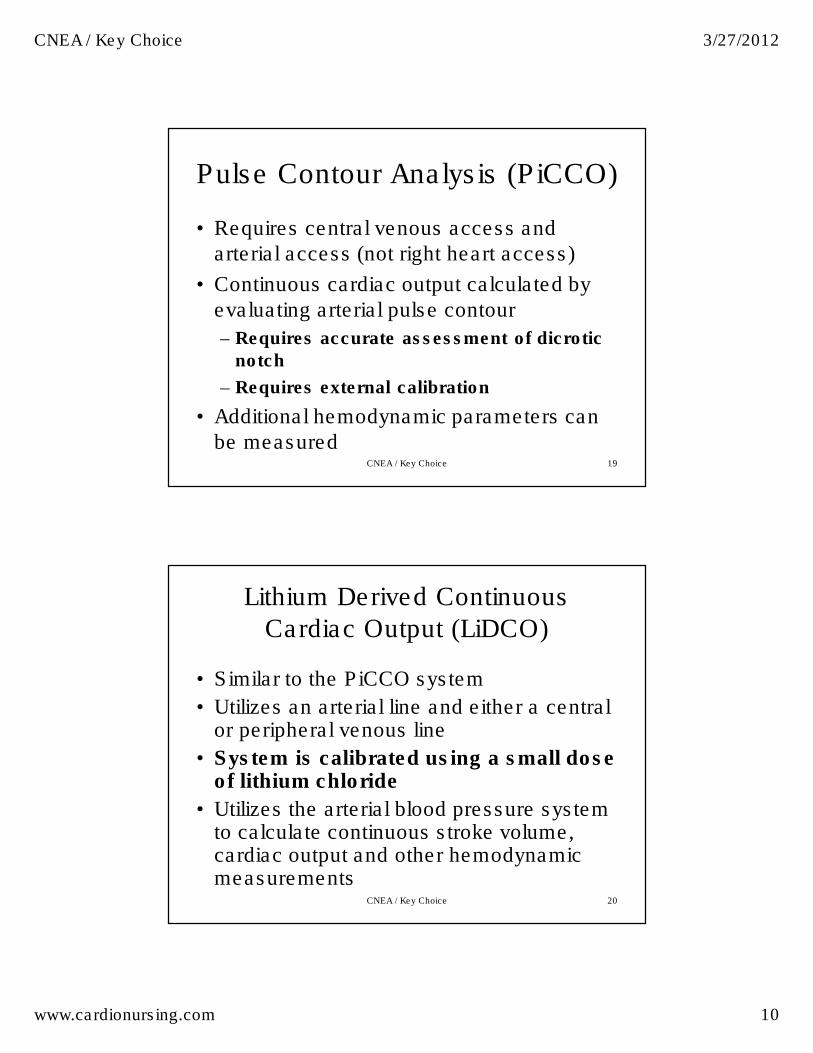
Pulse Contour Analysis (PiCCO)
• Requires central venous access and arterial access (not right heart access)
• Continuous cardiac output calculated by evaluating arterial pulse contour
– Requires accurate assessment of dicrotic
notch
– Requires external calibration
• Additional hemodynamic parameters can be measured
CNEA / Key Choice
20
Lithium Derived Continuous
Cardiac Output (LiDCO)
• Similar to the PiCCO system
• Utilizes an arterial line and either a central or peripheral venous line
• System is calibrated using a small dose of lithium chloride
• Utilizes the arterial blood pressure system to calculate continuous stroke volume, cardiac output and other hemodynamic measurements
CNEA / Key Choice
CNEA / Key Choice 3/27/2012
www.cardionursing.com 11
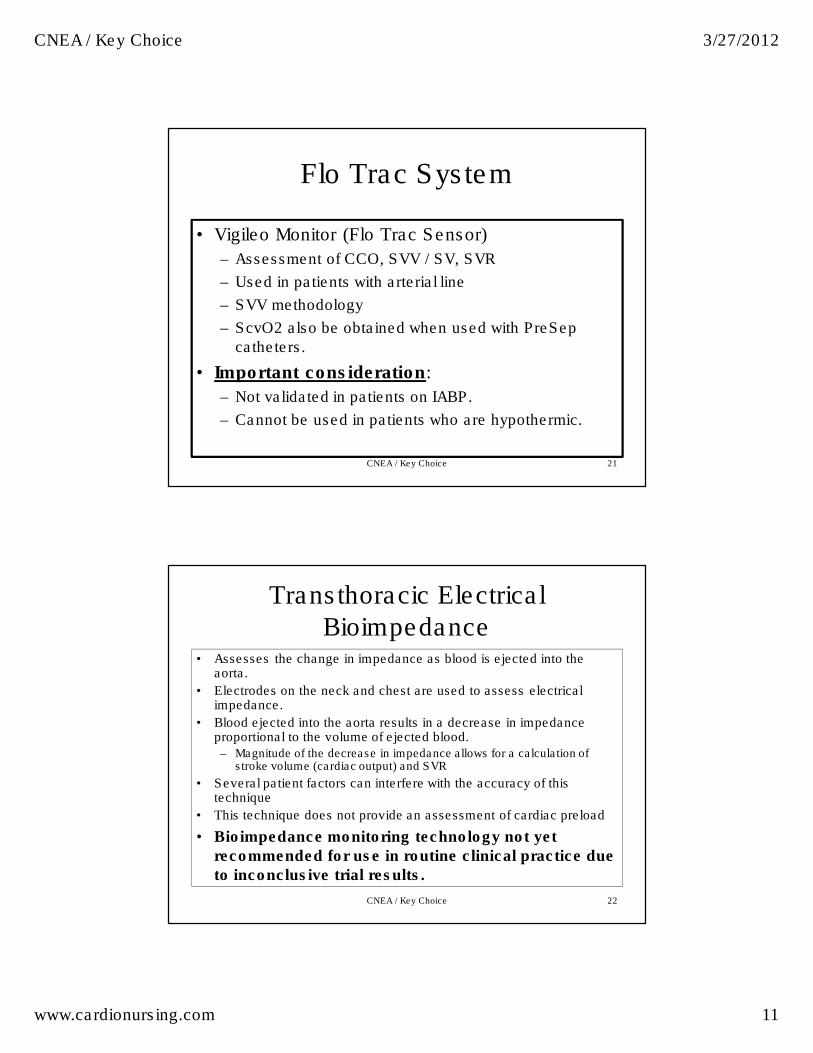
Flo Trac System
• Vigileo Monitor (Flo Trac Sensor)
– Assessment of CCO, SVV / SV, SVR
– Used in patients with arterial line
– SVV methodology
– ScvO2 also be obtained when used with PreSep
catheters.
• Important consideration:
– Not validated in patients on IABP.
– Cannot be used in patients who are hypothermic.
CNEA / Key Choice 21
22
Transthoracic Electrical
Bioimpedance • Assesses the change in impedance as blood is ejected into the
aorta.
• Electrodes on the neck and chest are used to assess electrical impedance.
• Blood ejected into the aorta results in a decrease in impedance proportional to the volume of ejected blood.– Magnitude of the decrease in impedance allows for a calculation of
stroke volume (cardiac output) and SVR
• Several patient factors can interfere with the accuracy of this technique
• This technique does not provide an assessment of cardiac preload
• Bioimpedance monitoring technology not yet
recommended for use in routine clinical practice due
to inconclusive trial results.
CNEA / Key Choice
CNEA / Key Choice 3/27/2012
www.cardionursing.com 12
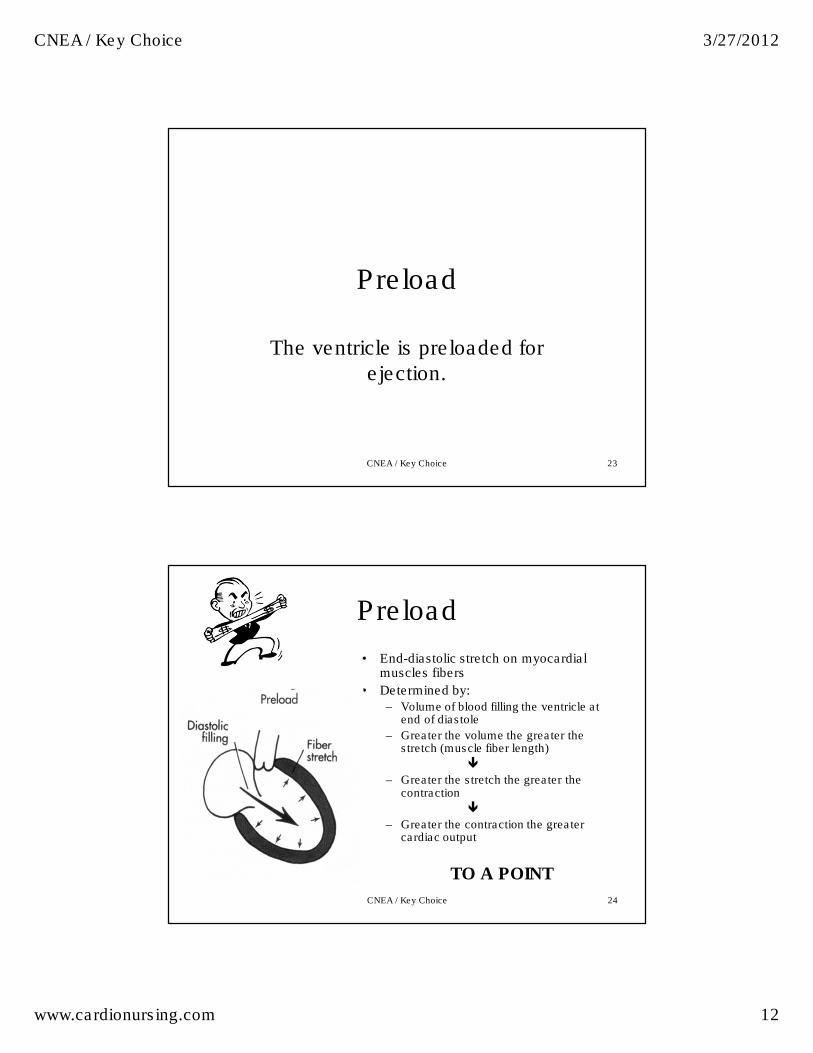
Preload
The ventricle is preloaded for ejection.
CNEA / Key Choice 23
24
Preload
• End-diastolic stretch on myocardial muscles fibers
• Determined by:– Volume of blood filling the ventricle at
end of diastole
– Greater the volume the greater the stretch (muscle fiber length)
�– Greater the stretch the greater the
contraction
�– Greater the contraction the greater
cardiac output
TO A POINT
CNEA / Key Choice
CNEA / Key Choice 3/27/2012
www.cardionursing.com 13
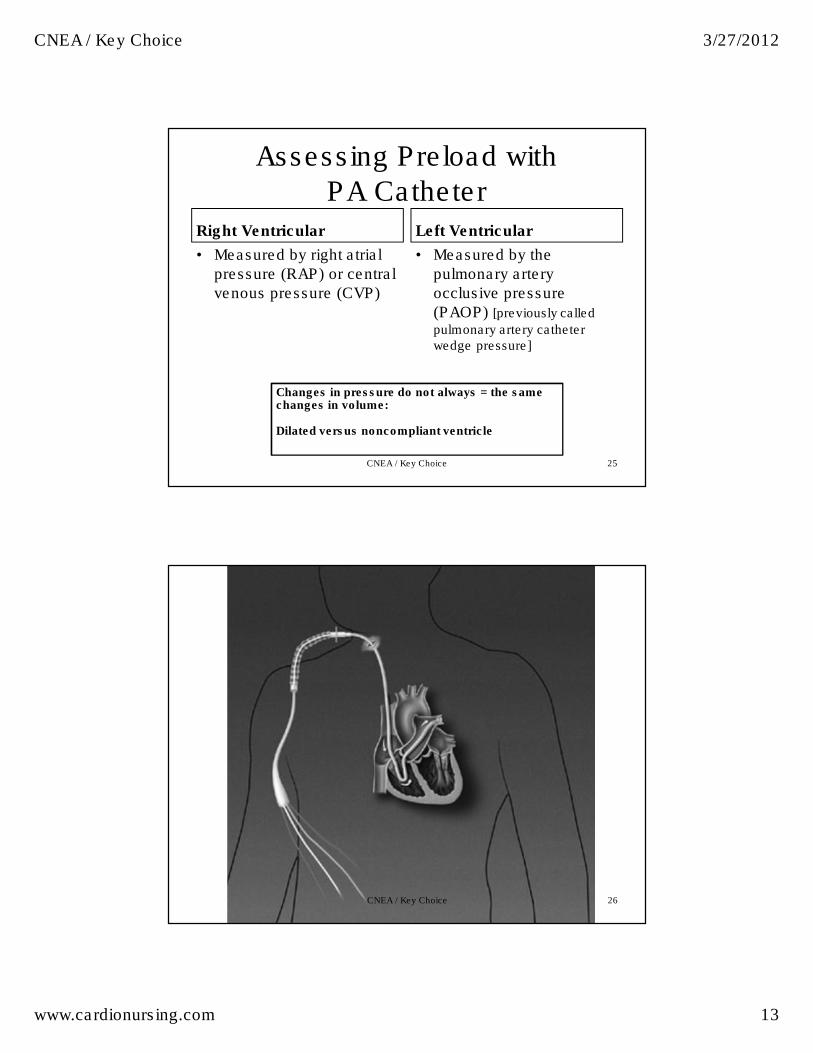
Assessing Preload with PA Catheter
Right Ventricular
• Measured by right atrial
pressure (RAP) or central
venous pressure (CVP)
Left Ventricular
• Measured by the
pulmonary artery
occlusive pressure
(PAOP) [previously called
pulmonary artery catheter wedge pressure]
CNEA / Key Choice 25
Changes in pressure do not always = the same changes in volume:
Dilated versus noncompliant ventricle
26CNEA / Key Choice
CNEA / Key Choice 3/27/2012
www.cardionursing.com 14
27CNEA / Key Choice
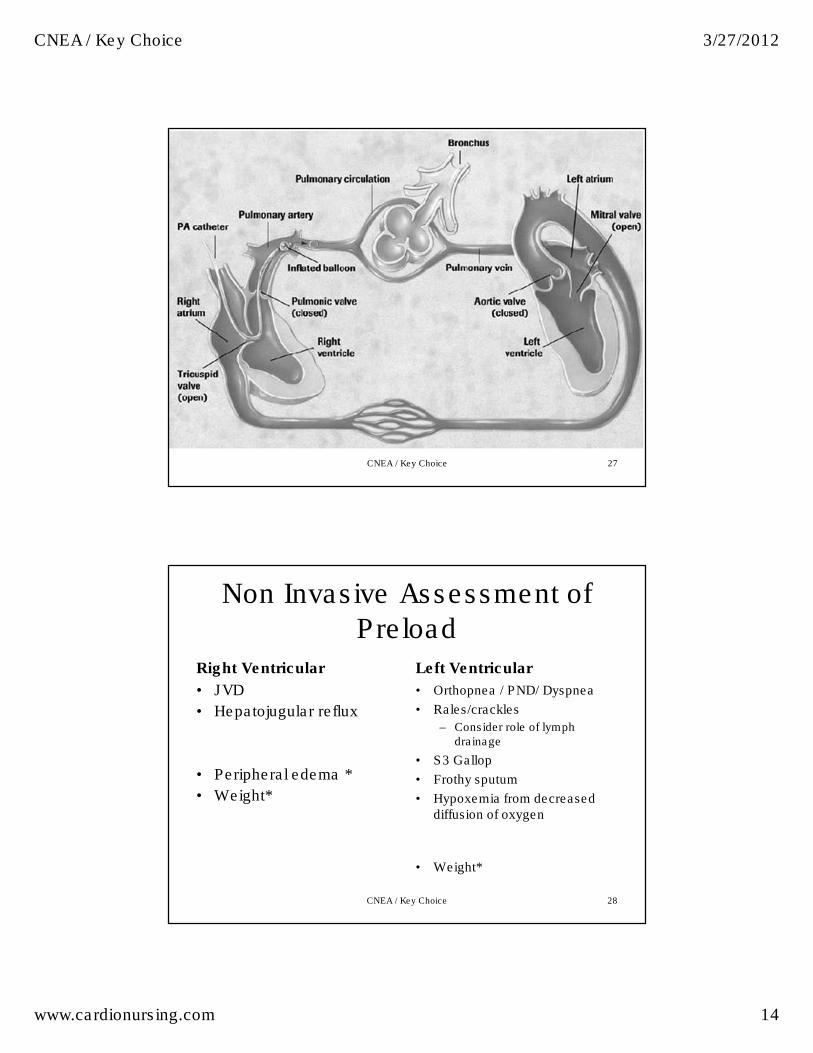
Non Invasive Assessment of Preload
Right Ventricular
• JVD
• Hepatojugular reflux
• Peripheral edema *
• Weight*
Left Ventricular
• Orthopnea / PND/ Dyspnea
• Rales/crackles
– Consider role of lymph drainage
• S3 Gallop
• Frothy sputum
• Hypoxemia from decreased diffusion of oxygen
• Weight*
CNEA / Key Choice 28
CNEA / Key Choice 3/27/2012
www.cardionursing.com 15
29
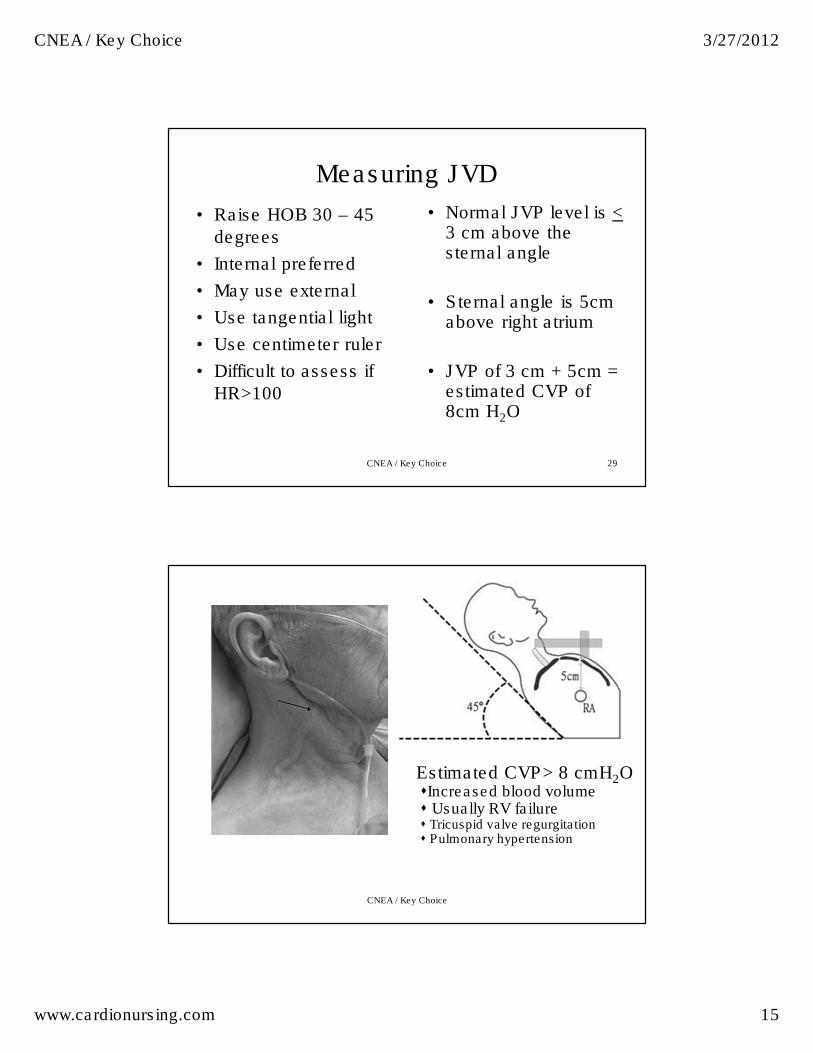
Measuring JVD
• Raise HOB 30 – 45
degrees
• Internal preferred
• May use external
• Use tangential light
• Use centimeter ruler
• Difficult to assess if
HR>100
CNEA / Key Choice
• Normal JVP level is <3 cm above the sternal angle
• Sternal angle is 5cm above right atrium
• JVP of 3 cm + 5cm = estimated CVP of 8cm H2O
Estimated CVP> 8 cmH2O�Increased blood volume� Usually RV failure� Tricuspid valve regurgitation� Pulmonary hypertension
CNEA / Key Choice
CNEA / Key Choice 3/27/2012
www.cardionursing.com 16
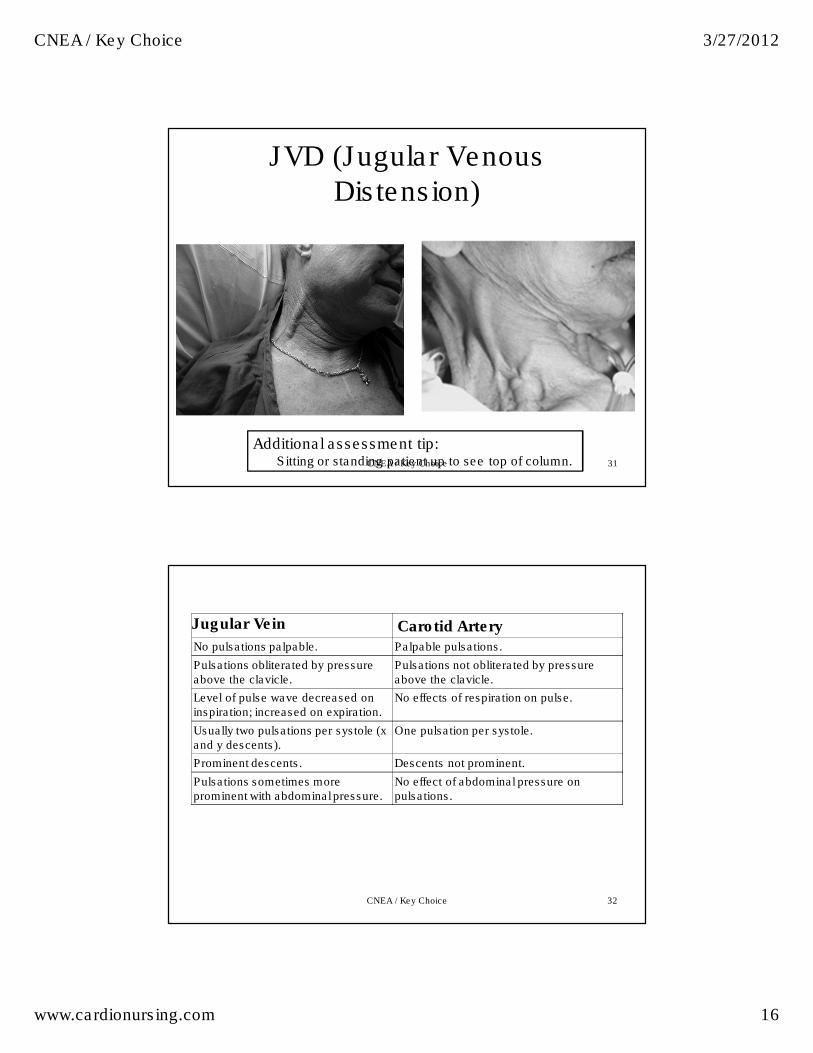
JVD (Jugular Venous Distension)
31
Additional assessment tip: Sitting or standing patient up to see top of column. CNEA / Key Choice
CNEA / Key Choice 32
Jugular Vein Carotid Artery No pulsations palpable. Palpable pulsations.
Pulsations obliterated by pressure above the clavicle.
Pulsations not obliterated by pressure above the clavicle.
Level of pulse wave decreased on inspiration; increased on expiration.
No effects of respiration on pulse.
Usually two pulsations per systole (x and y descents).
One pulsation per systole.
Prominent descents. Descents not prominent.
Pulsations sometimes more prominent with abdominal pressure.
No effect of abdominal pressure on pulsations.
CNEA / Key Choice 3/27/2012
www.cardionursing.com 17
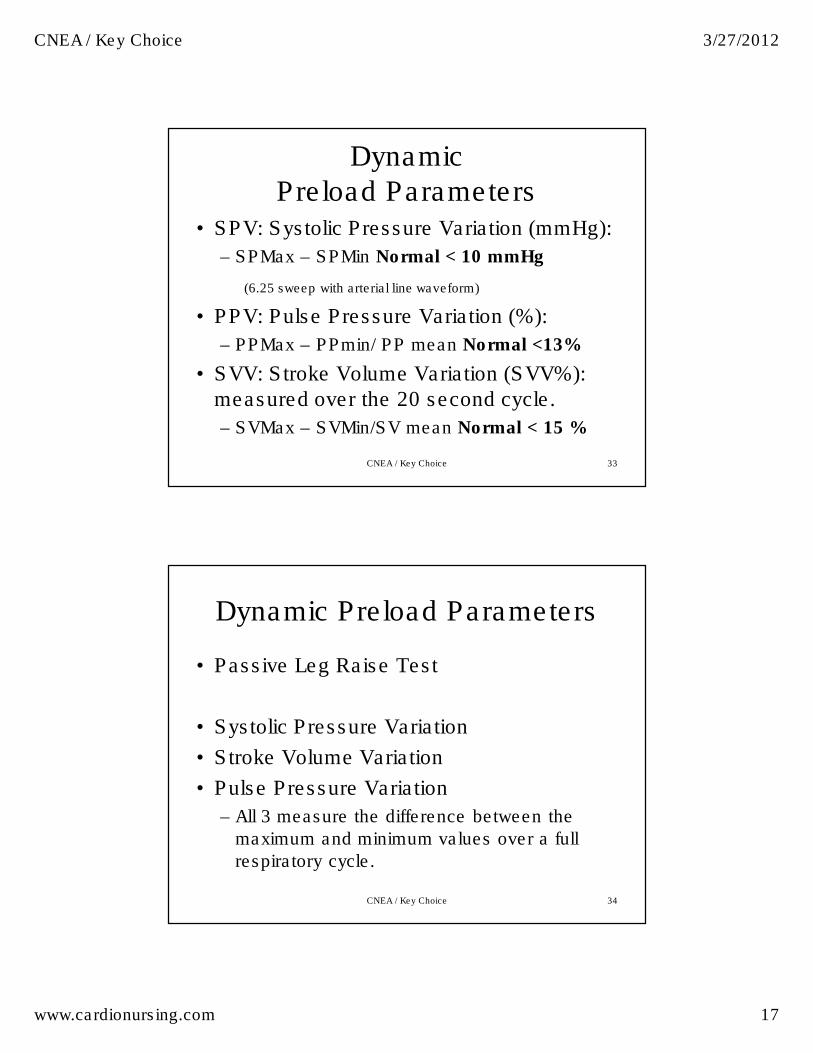
Dynamic Preload Parameters
• SPV: Systolic Pressure Variation (mmHg):
– SPMax – SPMin Normal < 10 mmHg
(6.25 sweep with arterial line waveform)
• PPV: Pulse Pressure Variation (%):
– PPMax – PPmin/ PP mean Normal <13%
• SVV: Stroke Volume Variation (SVV%): measured over the 20 second cycle.
– SVMax – SVMin/SV mean Normal < 15 %
CNEA / Key Choice 33
Dynamic Preload Parameters
• Passive Leg Raise Test
• Systolic Pressure Variation
• Stroke Volume Variation
• Pulse Pressure Variation
– All 3 measure the difference between the
maximum and minimum values over a full
respiratory cycle.
CNEA / Key Choice 34
CNEA / Key Choice 3/27/2012
www.cardionursing.com 18
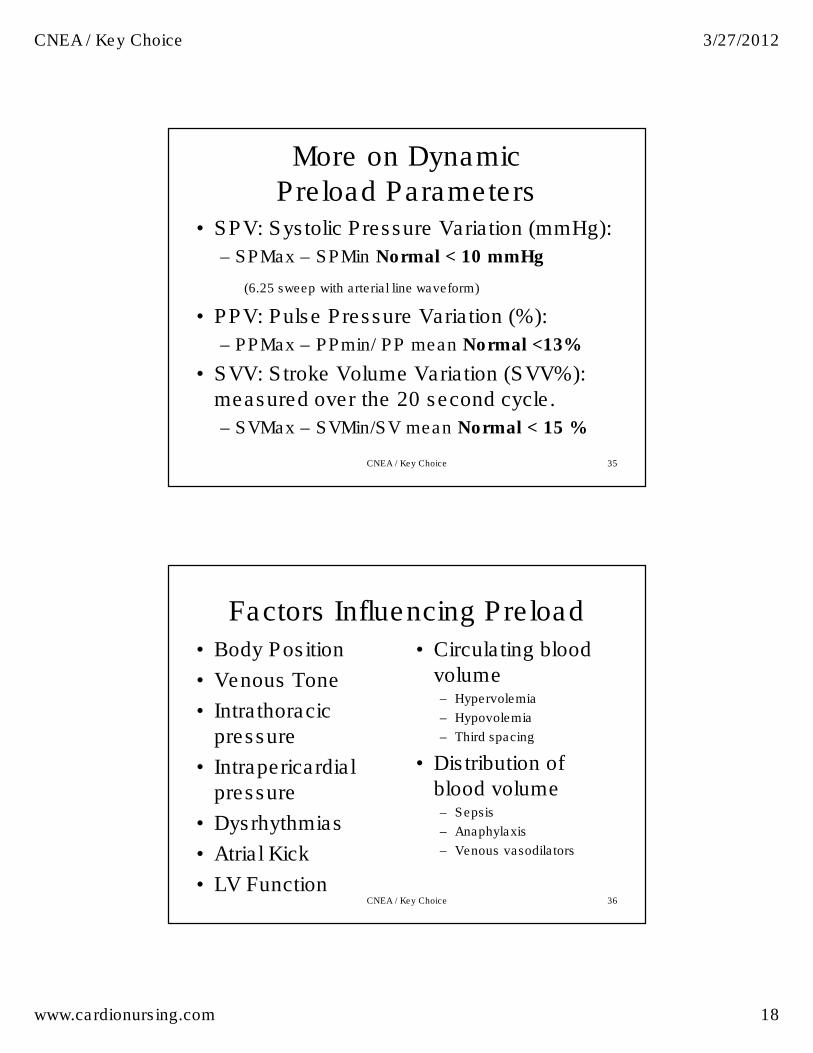
More on Dynamic Preload Parameters
• SPV: Systolic Pressure Variation (mmHg):
– SPMax – SPMin Normal < 10 mmHg
(6.25 sweep with arterial line waveform)
• PPV: Pulse Pressure Variation (%):
– PPMax – PPmin/ PP mean Normal <13%
• SVV: Stroke Volume Variation (SVV%): measured over the 20 second cycle.
– SVMax – SVMin/SV mean Normal < 15 %
CNEA / Key Choice 35
36
Factors Influencing Preload
• Body Position
• Venous Tone
• Intrathoracicpressure
• Intrapericardialpressure
• Dysrhythmias
• Atrial Kick
• LV Function
• Circulating blood volume – Hypervolemia
– Hypovolemia
– Third spacing
• Distribution of blood volume– Sepsis
– Anaphylaxis
– Venous vasodilators
CNEA / Key Choice
CNEA / Key Choice 3/27/2012
www.cardionursing.com 19
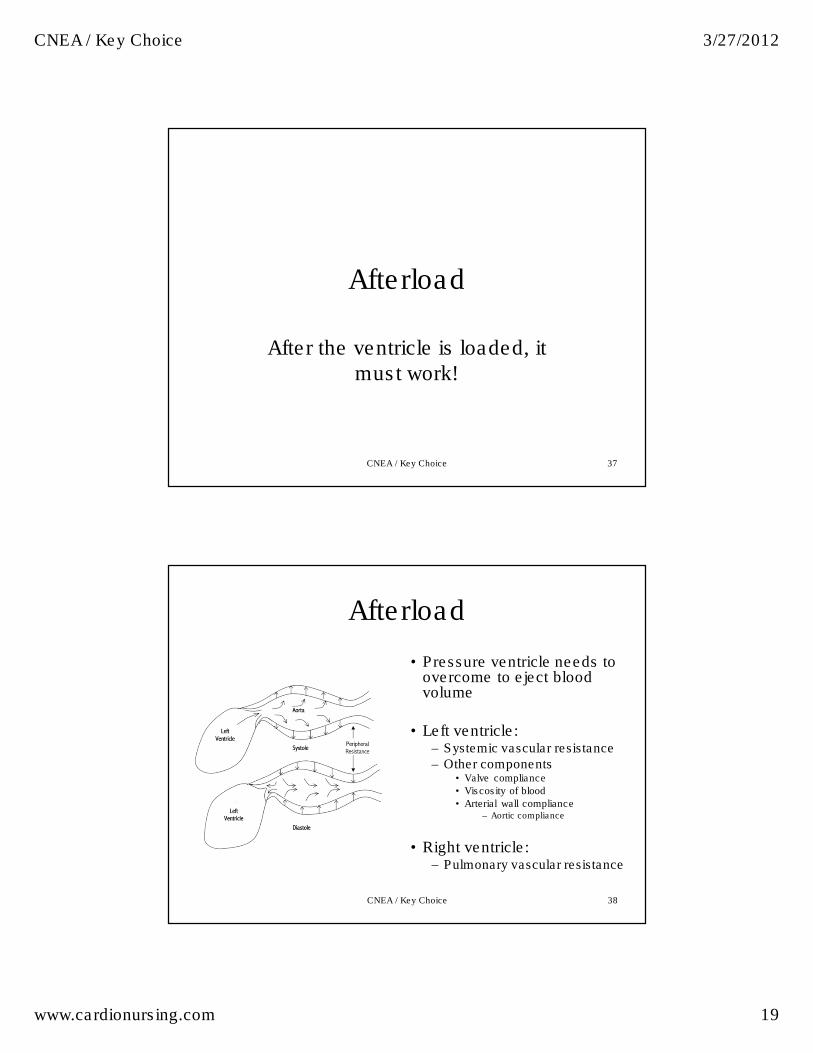
Afterload
After the ventricle is loaded, it must work!
CNEA / Key Choice 37
38
Afterload
• Pressure ventricle needs to overcome to eject blood volume
• Left ventricle: – Systemic vascular resistance – Other components
• Valve compliance
• Viscosity of blood
• Arterial wall compliance – Aortic compliance
• Right ventricle: – Pulmonary vascular resistance
CNEA / Key Choice
CNEA / Key Choice 3/27/2012
www.cardionursing.com 20
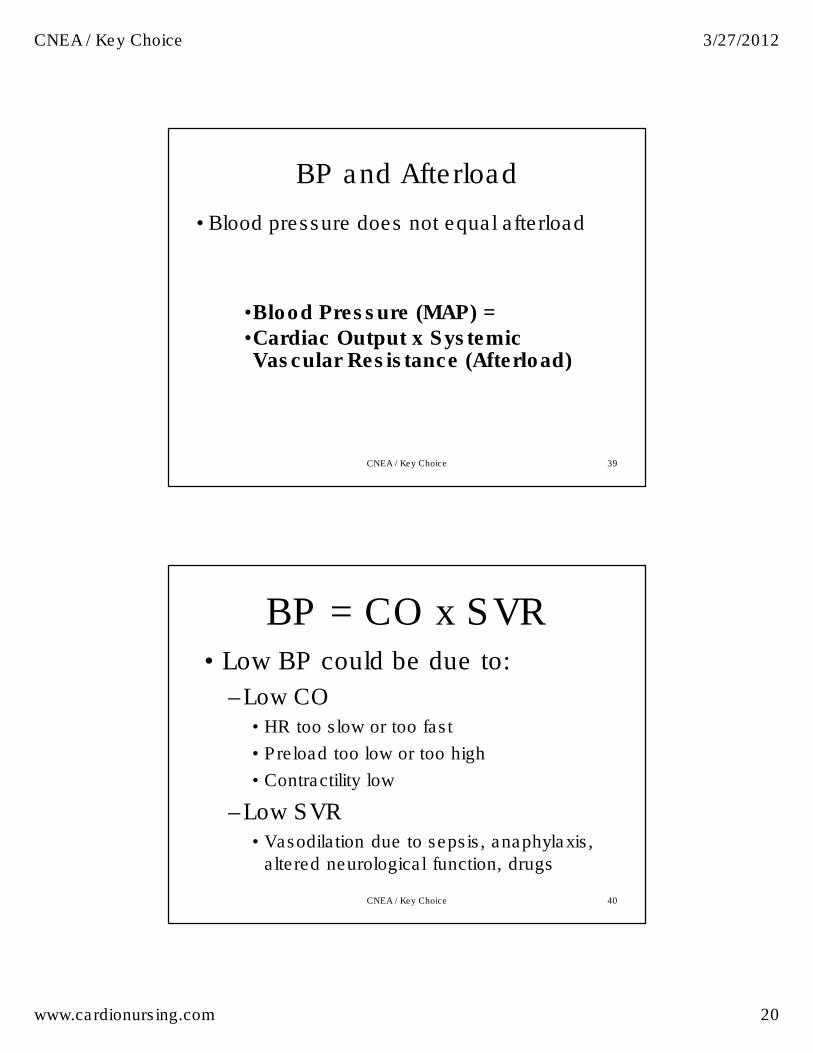
BP and Afterload
• Blood pressure does not equal afterload
•Blood Pressure (MAP) = •Cardiac Output x Systemic Vascular Resistance (Afterload)
CNEA / Key Choice 39
BP = CO x SVR• Low BP could be due to:
–Low CO• HR too slow or too fast
• Preload too low or too high
• Contractility low
–Low SVR• Vasodilation due to sepsis, anaphylaxis,
altered neurological function, drugs
CNEA / Key Choice 40
CNEA / Key Choice 3/27/2012
www.cardionursing.com 21
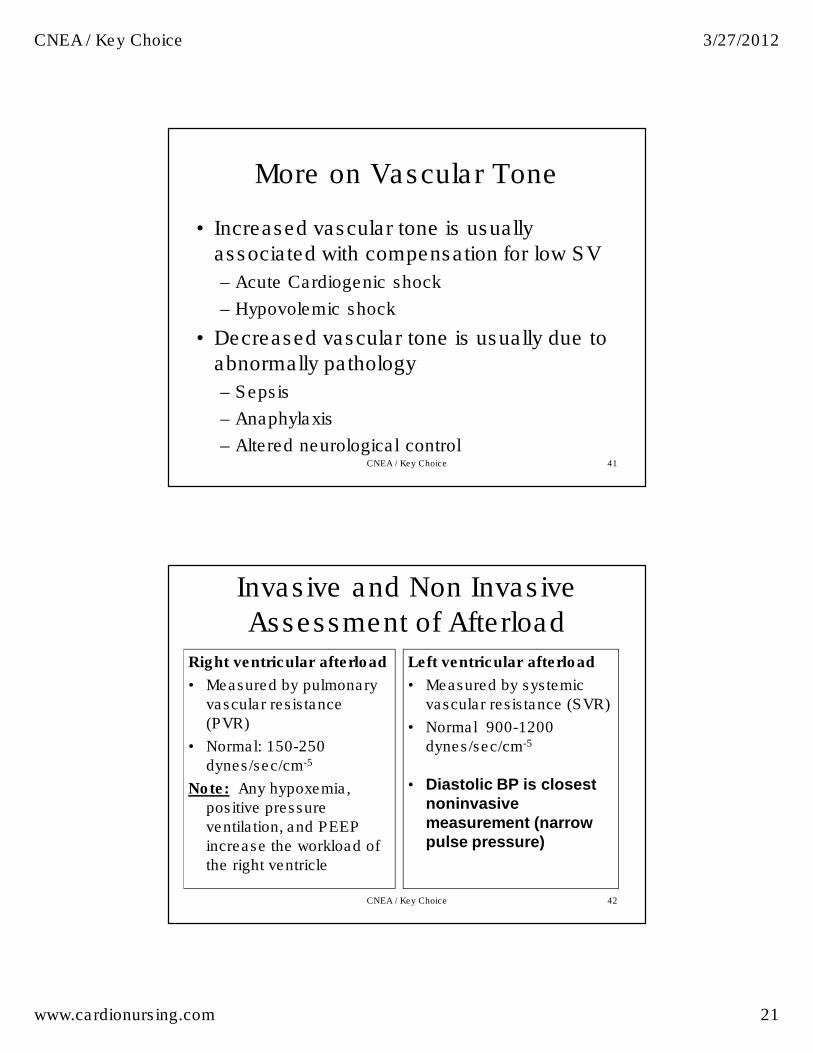
More on Vascular Tone
• Increased vascular tone is usually associated with compensation for low SV
– Acute Cardiogenic shock
– Hypovolemic shock
• Decreased vascular tone is usually due to abnormally pathology
– Sepsis
– Anaphylaxis
– Altered neurological control CNEA / Key Choice 41
42
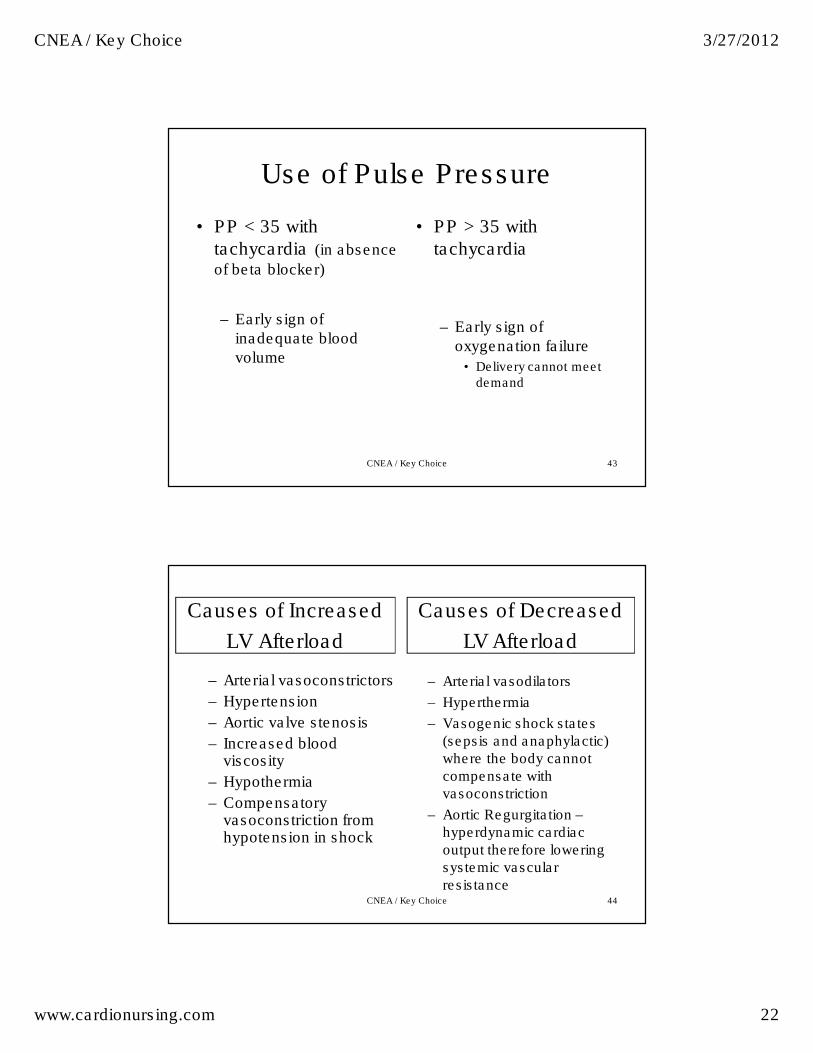
Invasive and Non Invasive Assessment of Afterload
Right ventricular afterload
• Measured by pulmonary
vascular resistance
(PVR)
• Normal: 150-250
dynes/sec/cm-5
Note: Any hypoxemia,
positive pressure
ventilation, and PEEP
increase the workload of
the right ventricle
Left ventricular afterload
• Measured by systemic
vascular resistance (SVR)
• Normal 900-1200
dynes/sec/cm-5
• Diastolic BP is closest
noninvasive
measurement (narrow
pulse pressure)
CNEA / Key Choice
CNEA / Key Choice 3/27/2012
www.cardionursing.com 22
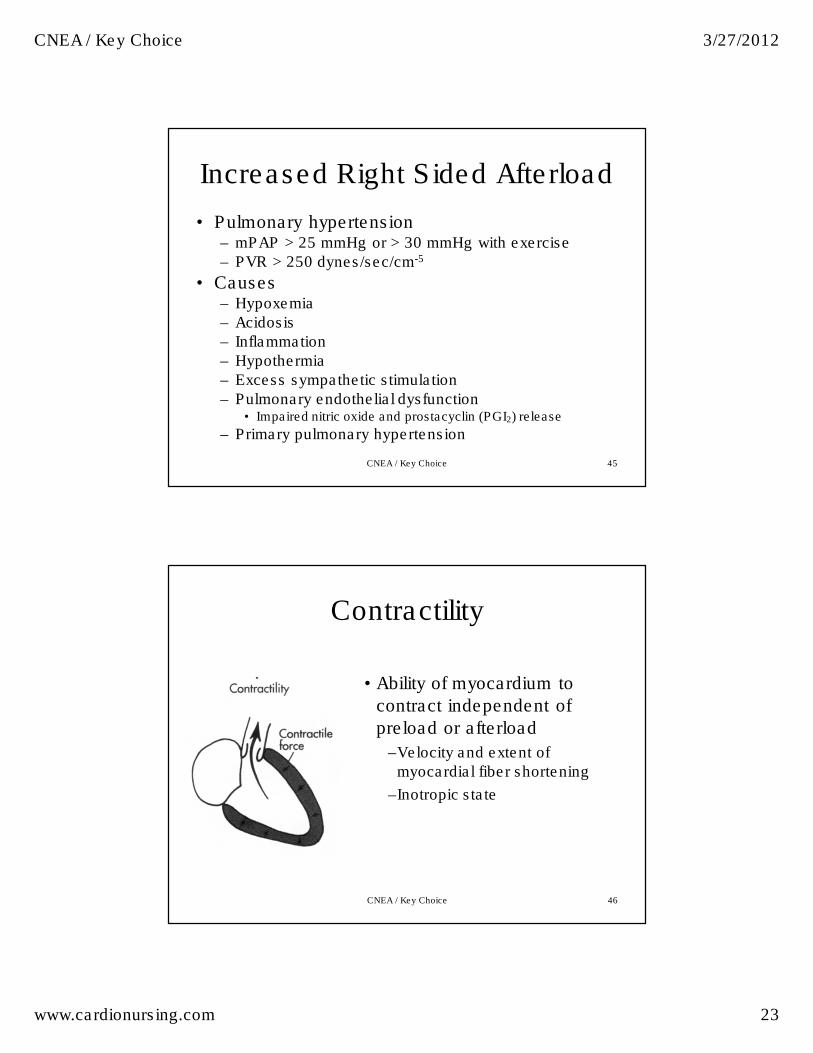
Use of Pulse Pressure
• PP < 35 with
tachycardia (in absence
of beta blocker)
– Early sign of
inadequate blood
volume
• PP > 35 with
tachycardia
– Early sign of
oxygenation failure
• Delivery cannot meet demand
CNEA / Key Choice 43
44
Causes of Increased
LV Afterload
– Arterial vasoconstrictors
– Hypertension
– Aortic valve stenosis
– Increased blood viscosity
– Hypothermia
– Compensatory vasoconstriction from hypotension in shock
– Arterial vasodilators
– Hyperthermia
– Vasogenic shock states (sepsis and anaphylactic) where the body cannot compensate with vasoconstriction
– Aortic Regurgitation –hyperdynamic cardiac output therefore lowering systemic vascular resistance
Causes of Decreased
LV Afterload
CNEA / Key Choice
CNEA / Key Choice 3/27/2012
www.cardionursing.com 23
45
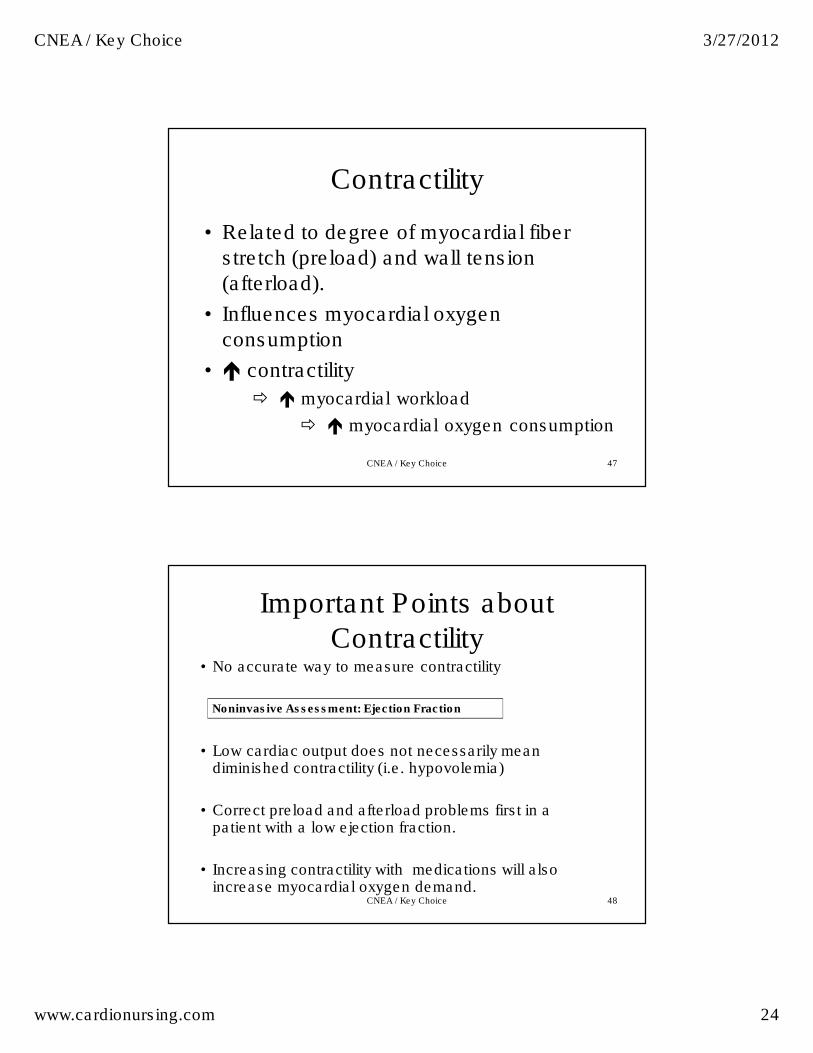
Increased Right Sided Afterload
• Pulmonary hypertension – mPAP > 25 mmHg or > 30 mmHg with exercise
– PVR > 250 dynes/sec/cm-5
• Causes – Hypoxemia
– Acidosis
– Inflammation
– Hypothermia
– Excess sympathetic stimulation
– Pulmonary endothelial dysfunction • Impaired nitric oxide and prostacyclin (PGI2) release
– Primary pulmonary hypertension
CNEA / Key Choice
46
Contractility
• Ability of myocardium to
contract independent of
preload or afterload
–Velocity and extent of
myocardial fiber shortening
–Inotropic state
CNEA / Key Choice
CNEA / Key Choice 3/27/2012
www.cardionursing.com 24
47
Contractility
• Related to degree of myocardial fiber stretch (preload) and wall tension (afterload).
• Influences myocardial oxygen consumption
• � contractility
� � myocardial workload
� � myocardial oxygen consumption
CNEA / Key Choice
48
Important Points about Contractility
• No accurate way to measure contractility
• Low cardiac output does not necessarily mean diminished contractility (i.e. hypovolemia)
• Correct preload and afterload problems first in a patient with a low ejection fraction.
• Increasing contractility with medications will also increase myocardial oxygen demand.
CNEA / Key Choice
Noninvasive Assessment: Ejection Fraction
CNEA / Key Choice 3/27/2012
www.cardionursing.com 25
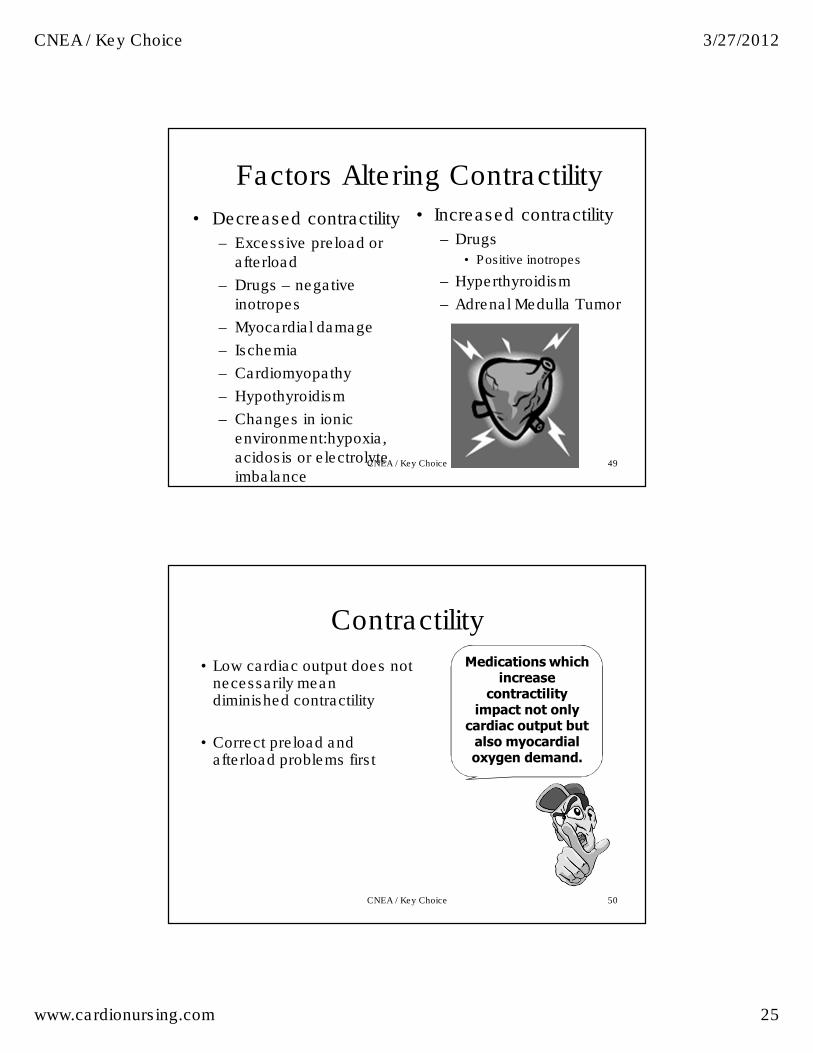
49
Factors Altering Contractility
• Decreased contractility
– Excessive preload or
afterload
– Drugs – negative
inotropes
– Myocardial damage
– Ischemia
– Cardiomyopathy
– Hypothyroidism
– Changes in ionic
environment:hypoxia,
acidosis or electrolyte
imbalance
• Increased contractility
– Drugs
• Positive inotropes
– Hyperthyroidism
– Adrenal Medulla Tumor
CNEA / Key Choice
50
Contractility
• Low cardiac output does not necessarily mean diminished contractility
• Correct preload and afterload problems first
Medications which increase contractility impact not only cardiac output but also myocardial oxygen demand.
CNEA / Key Choice
CNEA / Key Choice 3/27/2012
www.cardionursing.com 26
51
Heart Rate
• Mathematically heart rate increases cardiac output
• Physiological limit where increased heart rate will decrease cardiac output due to decreased filling time (decreased preload)
• Consider as first line strategy to increase cardiac output when temporary pacemaker in place
CNEA / Key Choice
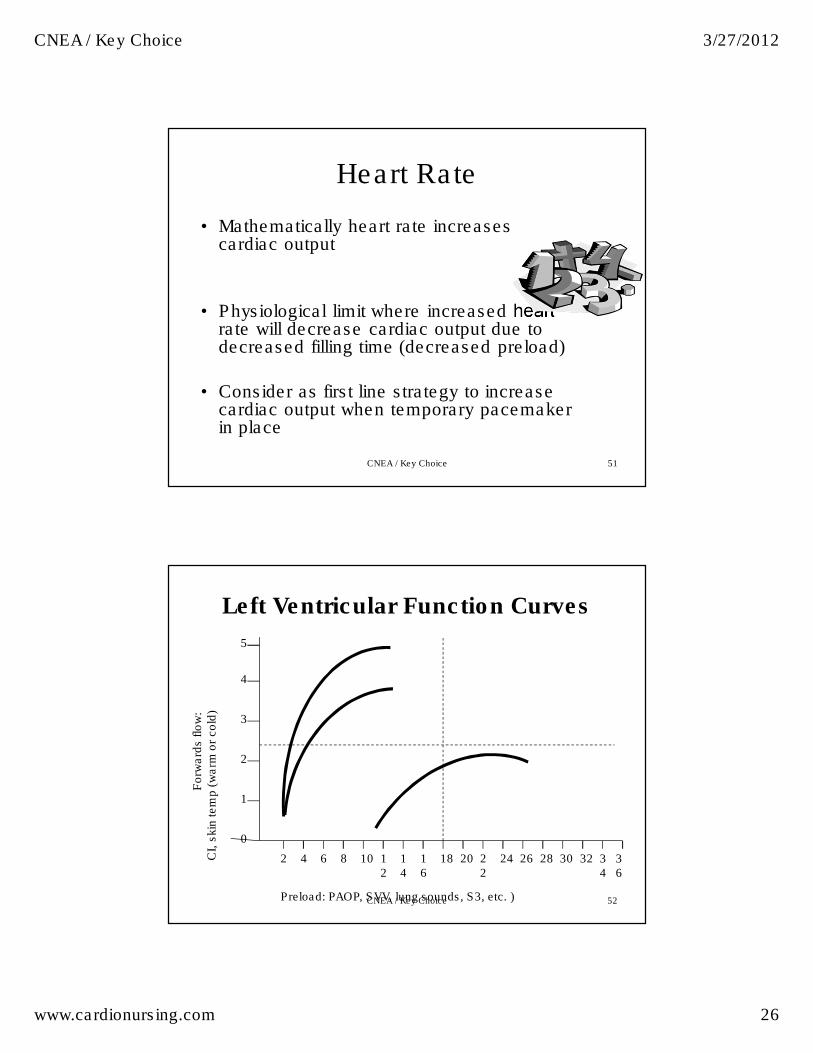
Forw
ard
s flo
w:
CI,
skin
tem
p (
warm
or
cold
)
Preload: PAOP, SVV, lung sounds, S3, etc. )
0
1
4
3
2
5
201816
14
12
108642 323028262422
34
36
Left Ventricular Function Curves
CNEA / Key Choice 52
CNEA / Key Choice 3/27/2012
www.cardionursing.com 27
CI
Preload
0
1
4
3
2
5
201816
14
12
108642 323028262422
34
36
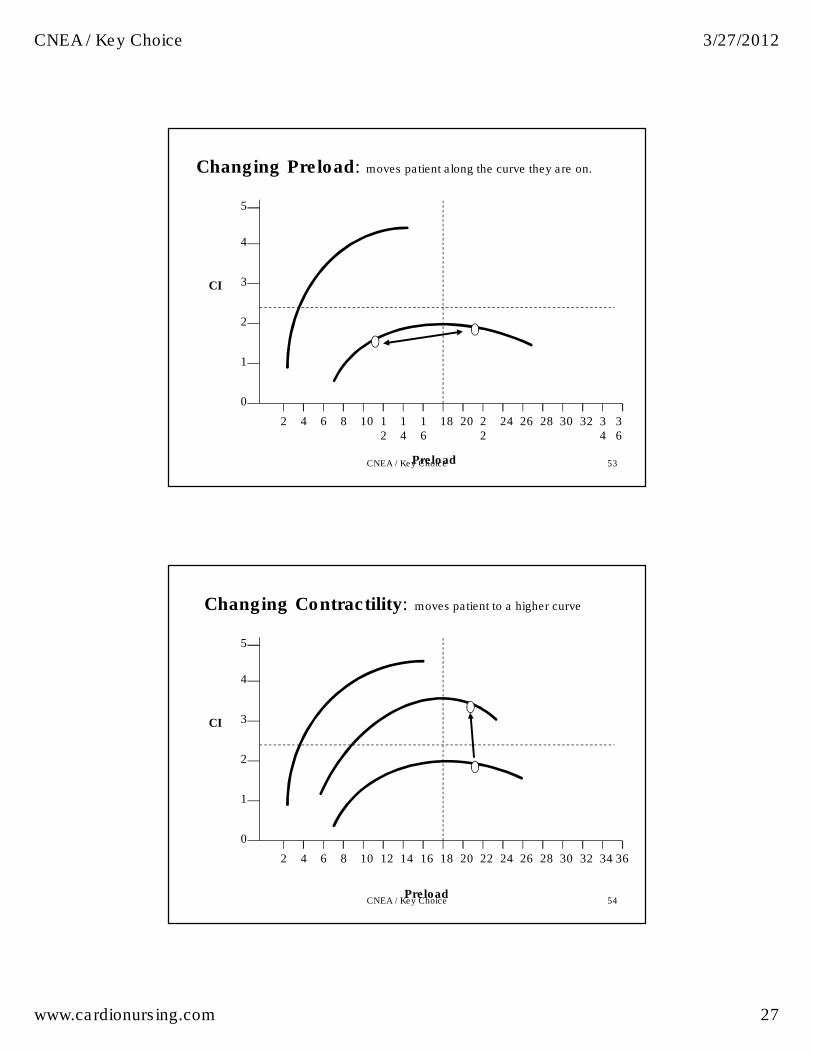
Changing Preload: moves patient along the curve they are on.
CNEA / Key Choice 53
CI
Preload
0
1
4
3
2
5
2018161412108642 323028262422 34 36
Changing Contractility: moves patient to a higher curve
CNEA / Key Choice 54
CNEA / Key Choice 3/27/2012
www.cardionursing.com 28
CI
Preload
0
1
4
3
2
5
2018161412108642 323028262422 34 36
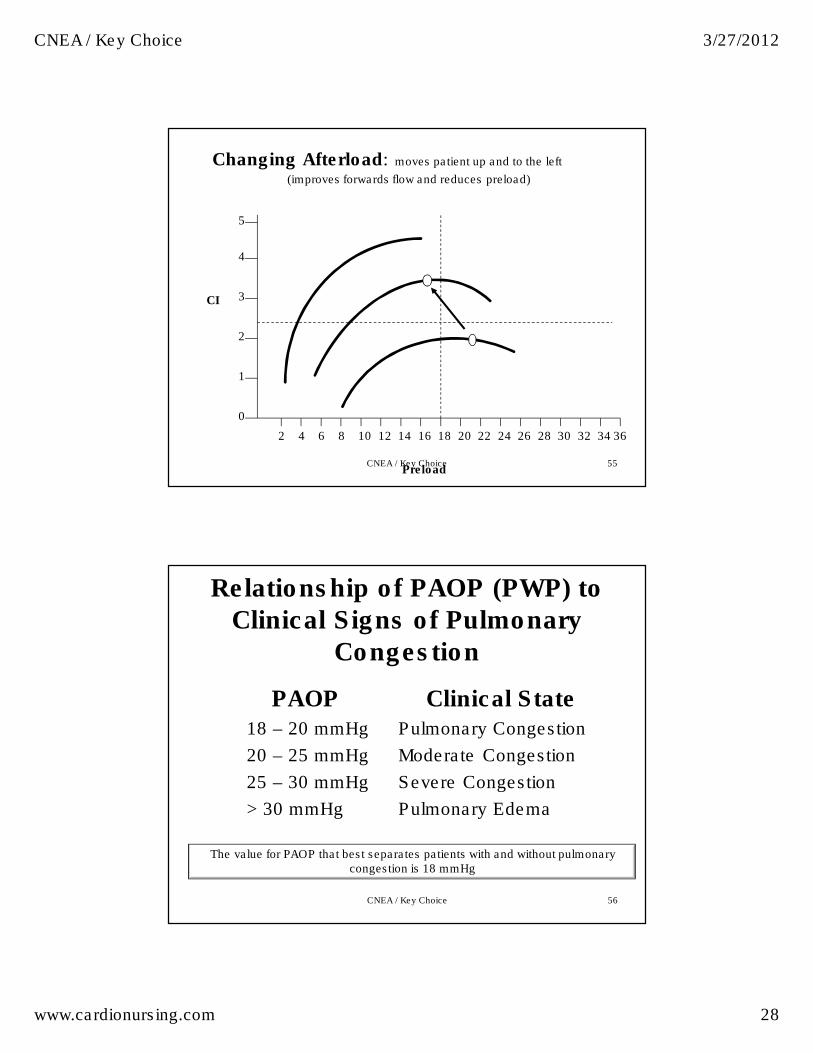
Changing Afterload: moves patient up and to the left
(improves forwards flow and reduces preload)
CNEA / Key Choice 55
Relationship of PAOP (PWP) to
Clinical Signs of Pulmonary
Congestion
PAOP18 – 20 mmHg
20 – 25 mmHg
25 – 30 mmHg
> 30 mmHg
Clinical StatePulmonary Congestion
Moderate Congestion
Severe Congestion
Pulmonary Edema
The value for PAOP that best separates patients with and without pulmonary congestion is 18 mmHg
CNEA / Key Choice 56
CNEA / Key Choice 3/27/2012
www.cardionursing.com 29
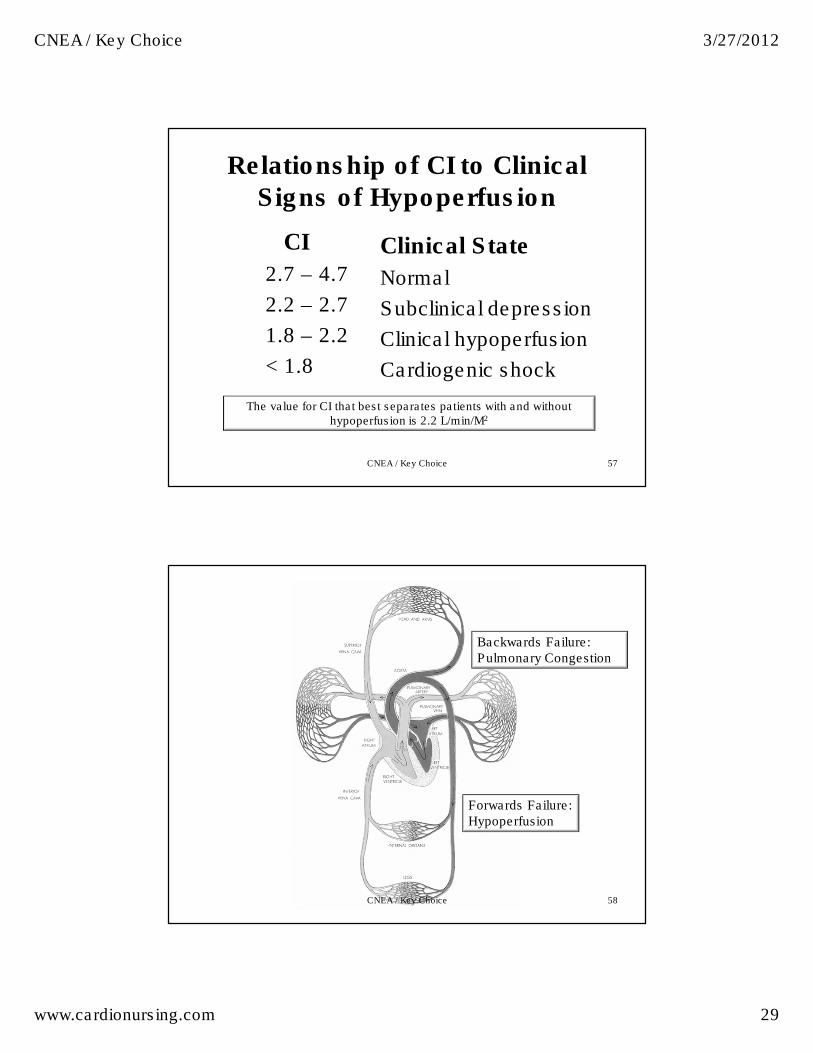
Relationship of CI to Clinical
Signs of Hypoperfusion
CI
2.7 – 4.7
2.2 – 2.7
1.8 – 2.2
< 1.8
Clinical State
Normal
Subclinical depression
Clinical hypoperfusion
Cardiogenic shock
The value for CI that best separates patients with and without hypoperfusion is 2.2 L/min/M2
CNEA / Key Choice 57
Backwards Failure: Pulmonary Congestion
Forwards Failure: Hypoperfusion
CNEA / Key Choice 58
CNEA / Key Choice 3/27/2012
www.cardionursing.com 30
0
1
4
3
2
5
2018161412108642 323028262422 34 36
Preload: PWP, lung sounds (dry or wet)
Forw
ard
s F
low
:
CI,
Skin
tem
p (w
arm
or
cold
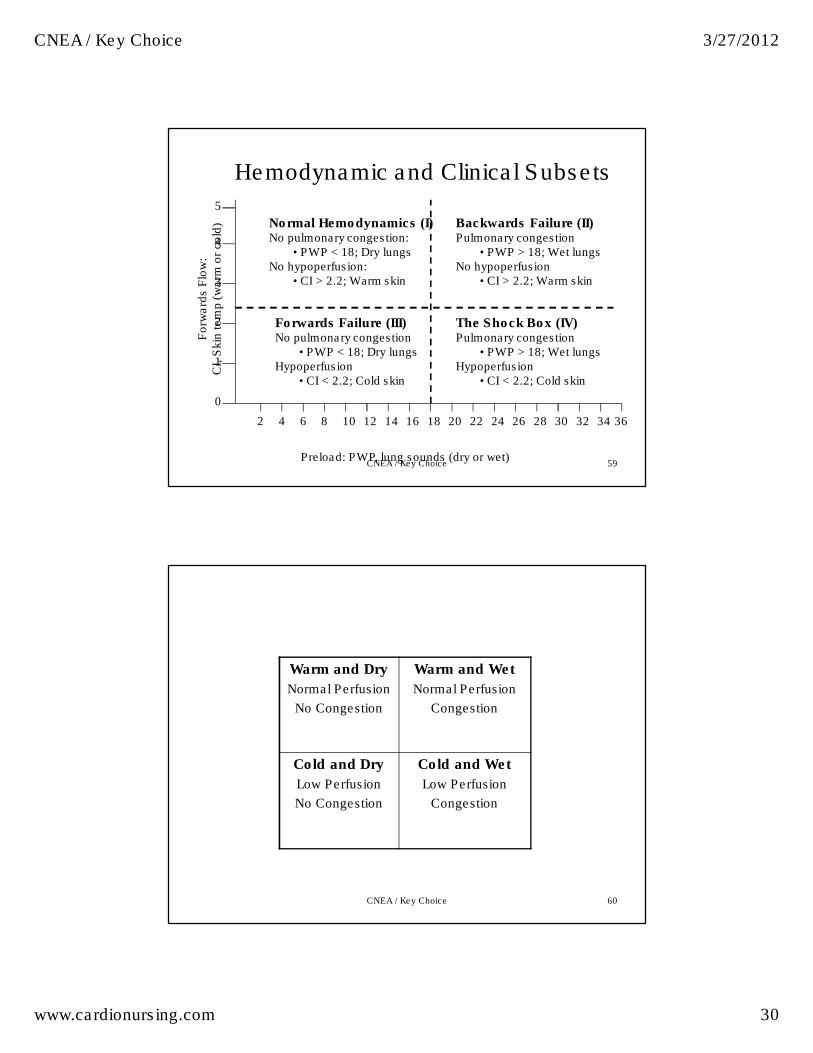
) Normal Hemodynamics (I)No pulmonary congestion:
• PWP < 18; Dry lungsNo hypoperfusion:
• CI > 2.2; Warm skin
Backwards Failure (II)Pulmonary congestion
• PWP > 18; Wet lungsNo hypoperfusion
• CI > 2.2; Warm skin
Forwards Failure (III)No pulmonary congestion
• PWP < 18; Dry lungsHypoperfusion
• CI < 2.2; Cold skin
The Shock Box (IV)Pulmonary congestion
• PWP > 18; Wet lungsHypoperfusion
• CI < 2.2; Cold skin
Hemodynamic and Clinical Subsets
CNEA / Key Choice 59
60
Warm and Dry
Normal Perfusion
No Congestion
Warm and Wet
Normal Perfusion
Congestion
Cold and Dry
Low Perfusion
No Congestion
Cold and Wet
Low Perfusion
Congestion
CNEA / Key Choice
CNEA / Key Choice 3/27/2012
www.cardionursing.com 31
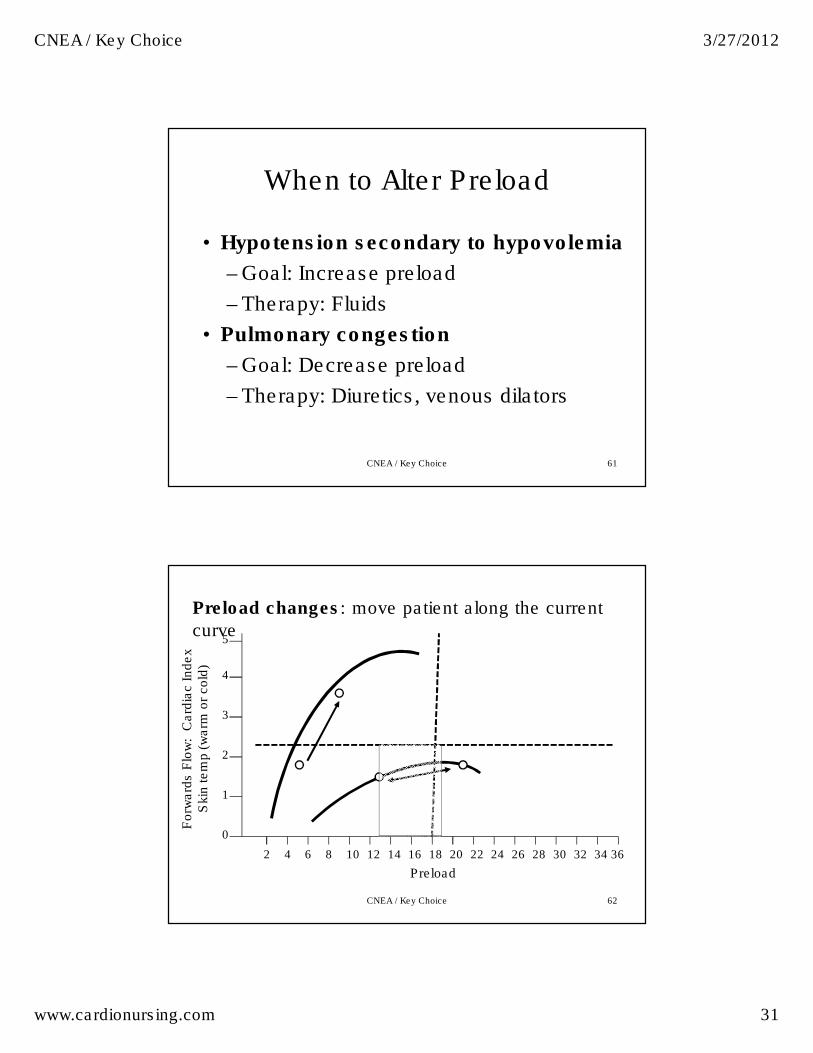
When to Alter Preload
• Hypotension secondary to hypovolemia
– Goal: Increase preload
– Therapy: Fluids
• Pulmonary congestion
– Goal: Decrease preload
– Therapy: Diuretics, venous dilators
CNEA / Key Choice 61
0
1
4
3
2
5
2018161412108642 323028262422 34 36
Preload
Forw
ard
s F
low
: C
ard
iac Index
Skin
tem
p (
warm
or
cold
)
Preload changes: move patient along the current
curve
CNEA / Key Choice 62
CNEA / Key Choice 3/27/2012
www.cardionursing.com 32
0
1
4
3
2
5
2018161412108642 323028262422 34 36
Preload
Forw
ard
s F
low
: C
ard
iac Index
Skin
tem
p (
warm
or
cold
)
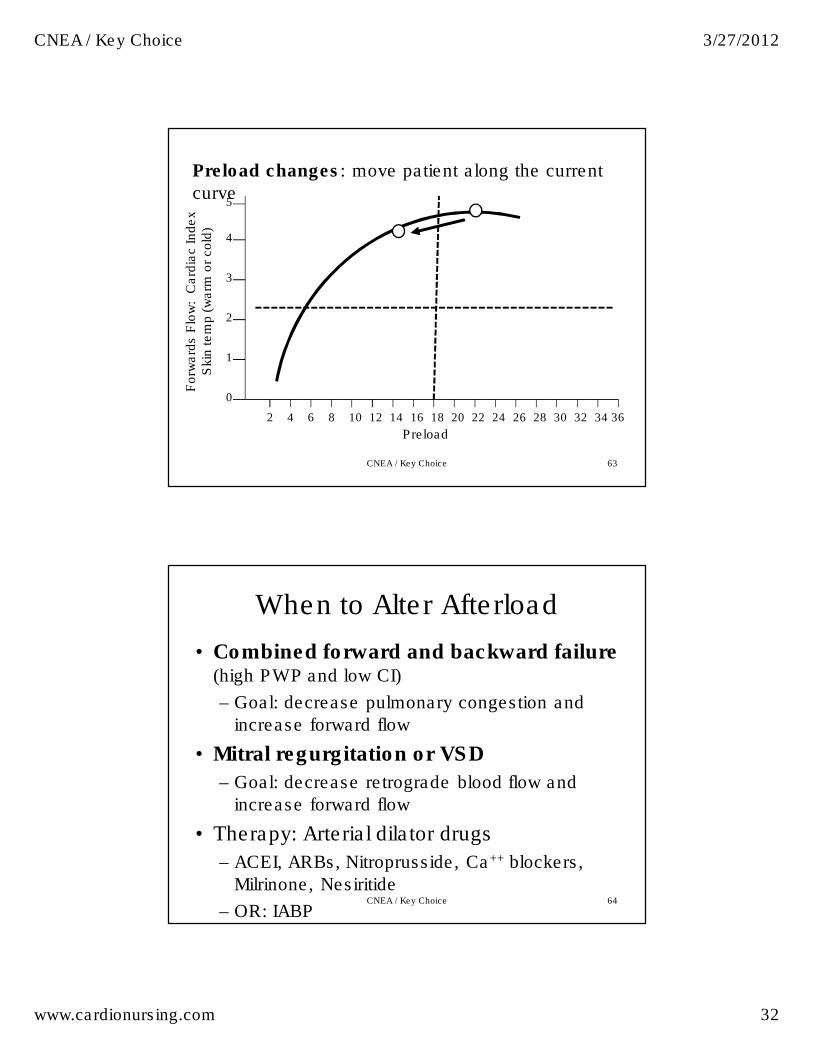
Preload changes: move patient along the current
curve
CNEA / Key Choice 63
When to Alter Afterload
• Combined forward and backward failure (high PWP and low CI)
– Goal: decrease pulmonary congestion and
increase forward flow
• Mitral regurgitation or VSD
– Goal: decrease retrograde blood flow and
increase forward flow
• Therapy: Arterial dilator drugs
– ACEI, ARBs, Nitroprusside, Ca++ blockers,
Milrinone, Nesiritide
– OR: IABP CNEA / Key Choice 64

CNEA / Key Choice 3/27/2012
www.cardionursing.com 33
0
1
4
3
2
5
2018161412108642 323028262422 34 36
Preload
Forw
ard
s F
low
: C
ard
iac Index
Skin
tem
p (
warm
or
cold
)
Afterload changes: move patient up and to the left:
improves forwards flow and reduces preload
Must have adequate BP SVR must be elevated
CNEA / Key Choice 65
When to Alter Contractility
• Subset III patients with adequate preload
• Subset IV patients (high PAOP and low CI)
– Assume a contractility problem
• Patients with low CO but optimal preload, afterload, and HR
CO = HR, preload, afterload, contractility
• Therapy: inotropes (dobutamine, dopamine,
milrinone, epinephrine, digoxin)
– Increase MVO2, use with caution in acute MI
CNEA / Key Choice 66
CNEA / Key Choice 3/27/2012
www.cardionursing.com 34
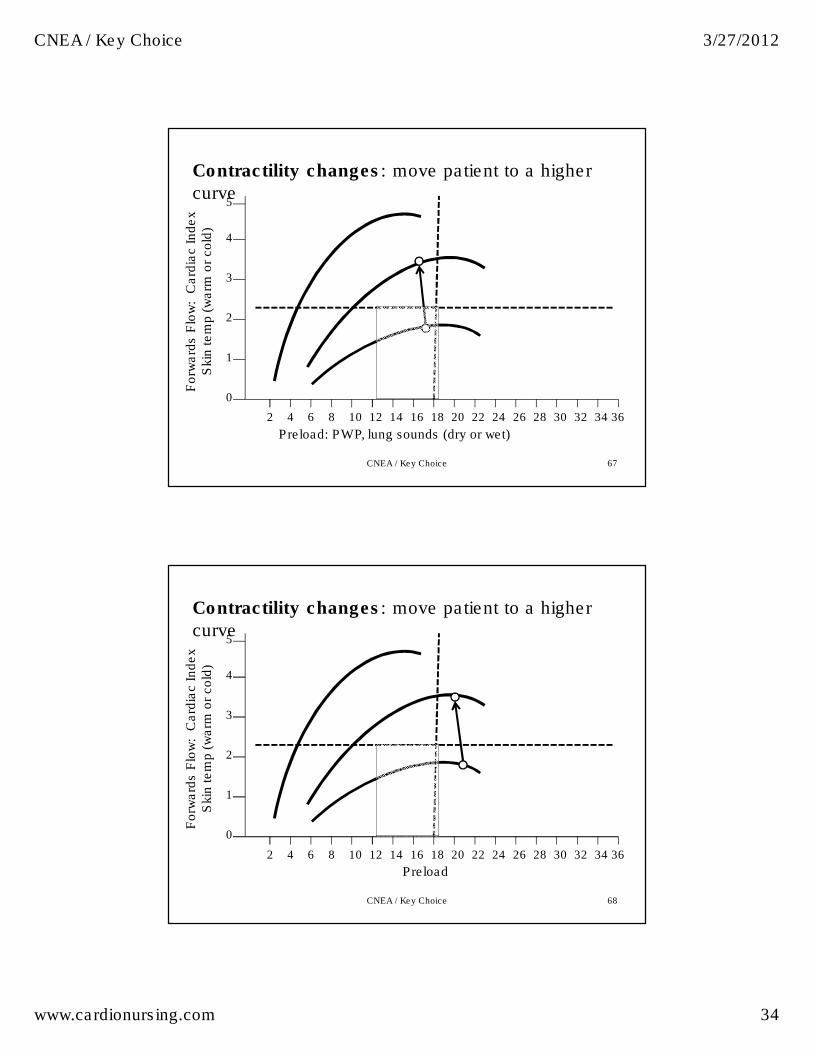
0
1
4
3
2
5
2018161412108642 323028262422 34 36
Preload: PWP, lung sounds (dry or wet)
Forw
ard
s F
low
: C
ard
iac Index
Skin
tem
p (
warm
or
cold
)
Contractility changes: move patient to a higher
curve
CNEA / Key Choice 67
0
1
4
3
2
5
2018161412108642 323028262422 34 36
Preload
Forw
ard
s F
low
: C
ard
iac Index
Skin
tem
p (
warm
or
cold
)
Contractility changes: move patient to a higher
curve
CNEA / Key Choice 68
CNEA / Key Choice 3/27/2012
www.cardionursing.com 35
69
Linking Knowledge to Practice
And: Practice to Outcomes
CNEA / Key Choice
TACHYCARDIA
Why is my patient compensating?
CNEA / Key Choice 70
CNEA / Key Choice 3/27/2012
www.cardionursing.com 36
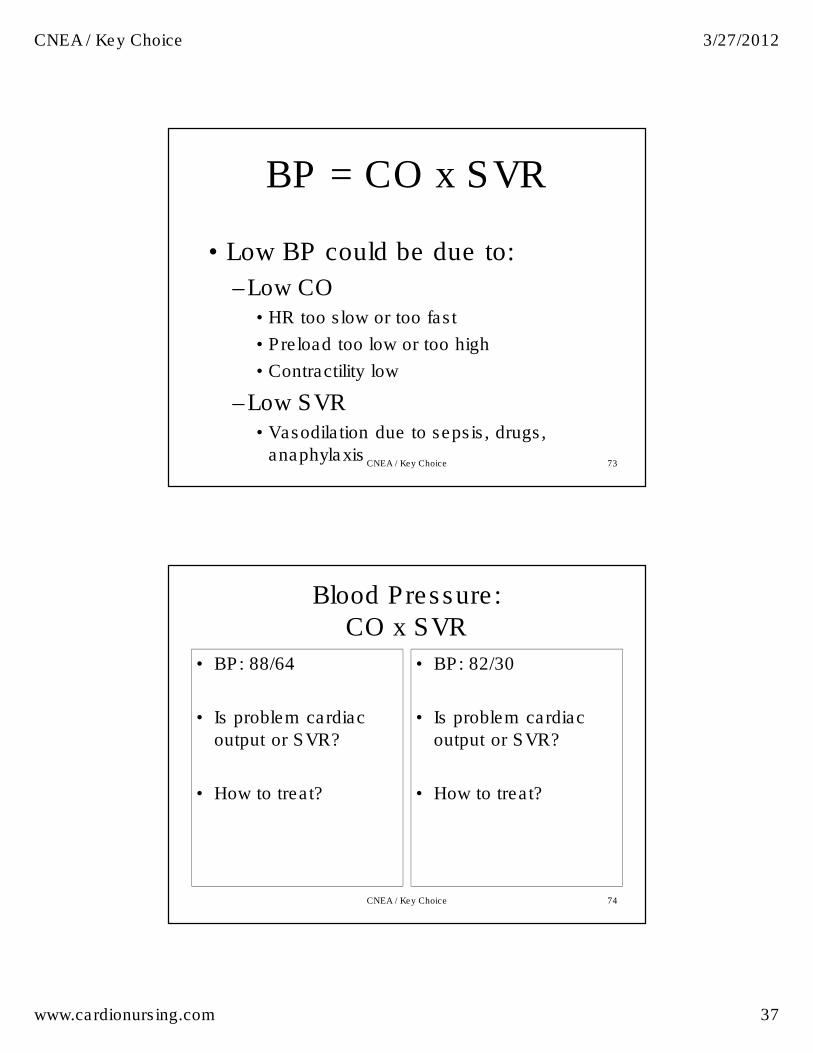
Use of Pulse Pressure
• PP < 35 with
tachycardia (in absence
of beta blocker)
– Early sign of
inadequate blood
volume
• PP > 35 with
tachycardia
– Early sign of
oxygenation failure
• Delivery cannot meet demand
CNEA / Key Choice 71
Stroke Volume Variation
• Remember – think LV ejection
– Volume
– Contractility
• Give volume 1st
• Then evaluate
• If needed – add inotrope
CNEA / Key Choice 72
CNEA / Key Choice 3/27/2012
www.cardionursing.com 37
BP = CO x SVR
• Low BP could be due to:
–Low CO• HR too slow or too fast
• Preload too low or too high
• Contractility low
–Low SVR• Vasodilation due to sepsis, drugs,
anaphylaxisCNEA / Key Choice 73
Blood Pressure:
CO x SVR
• BP: 88/64
• Is problem cardiac
output or SVR?
• How to treat?
• BP: 82/30
• Is problem cardiac
output or SVR?
• How to treat?
74CNEA / Key Choice
CNEA / Key Choice 3/27/2012
www.cardionursing.com 38
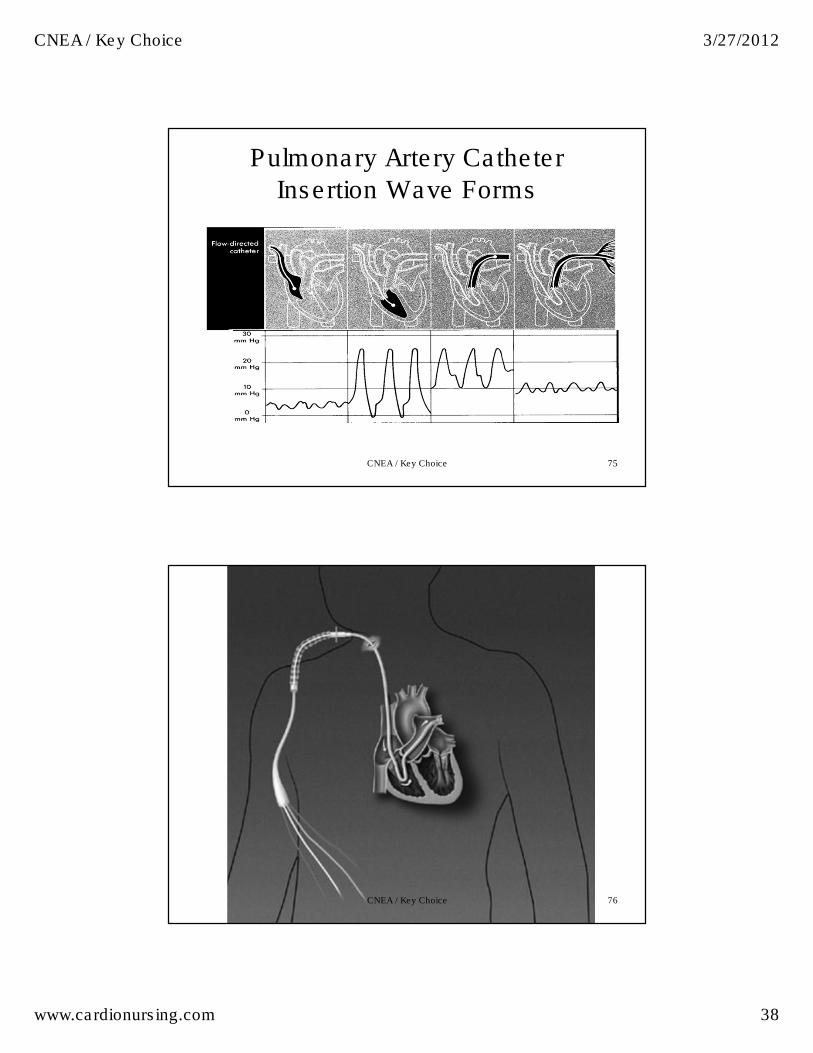
75
Pulmonary Artery Catheter
Insertion Wave Forms
CNEA / Key Choice
76CNEA / Key Choice
CNEA / Key Choice 3/27/2012
www.cardionursing.com 39
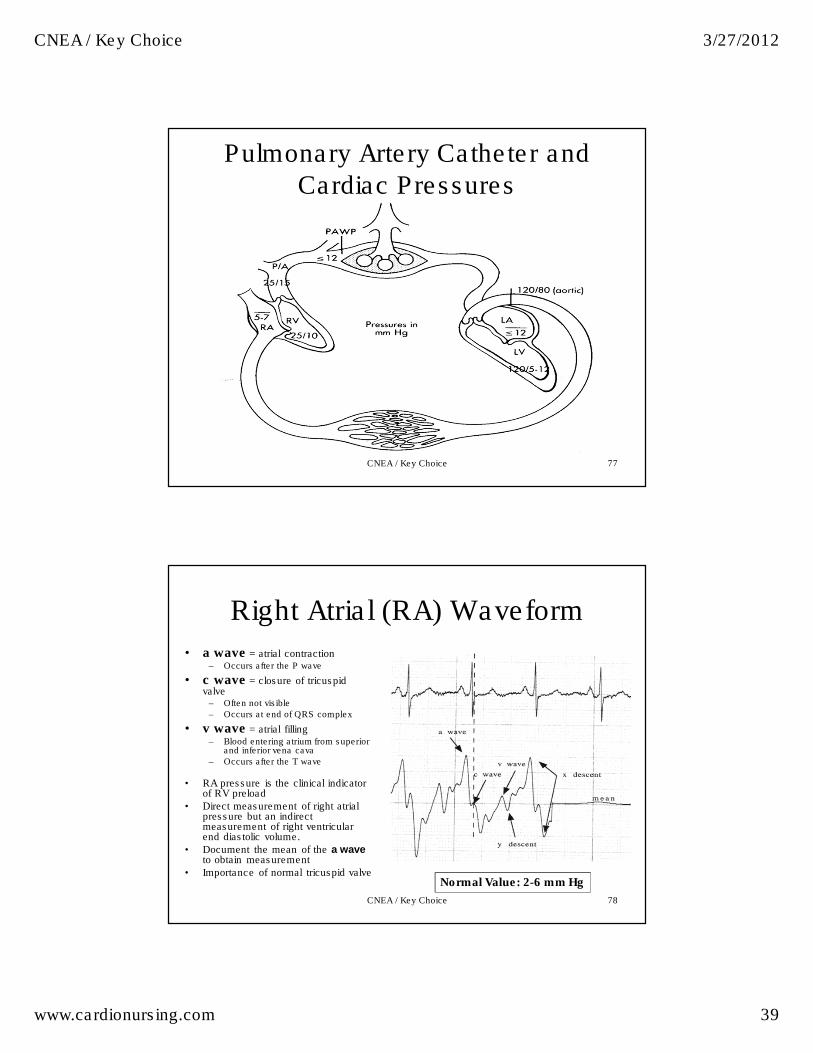
77
Pulmonary Artery Catheter and
Cardiac Pressures
CNEA / Key Choice
78
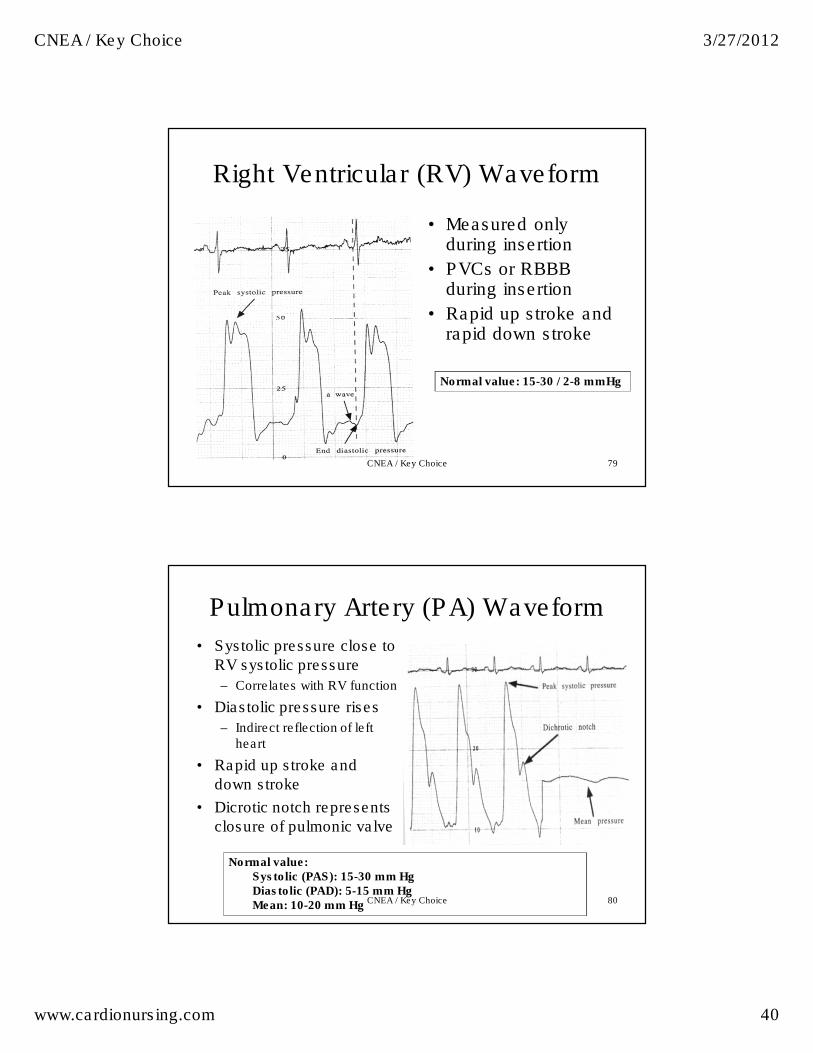
Right Atrial (RA) Waveform
• a wave = atrial contraction– Occurs after the P wave
• c wave = closure of tricuspid valve
– Often not visible
– Occurs at end of QRS complex
• v wave = atrial filling– Blood entering atrium from superior
and inferior vena cava
– Occurs after the T wave
• RA pressure is the clinical indicator of RV preload
• Direct measurement of right atrial pressure but an indirect measurement of right ventricular end diastolic volume.
• Document the mean of the a waveto obtain measurement
• Importance of normal tricuspid valve Normal Value: 2-6 mm Hg
CNEA / Key Choice
CNEA / Key Choice 3/27/2012
www.cardionursing.com 40
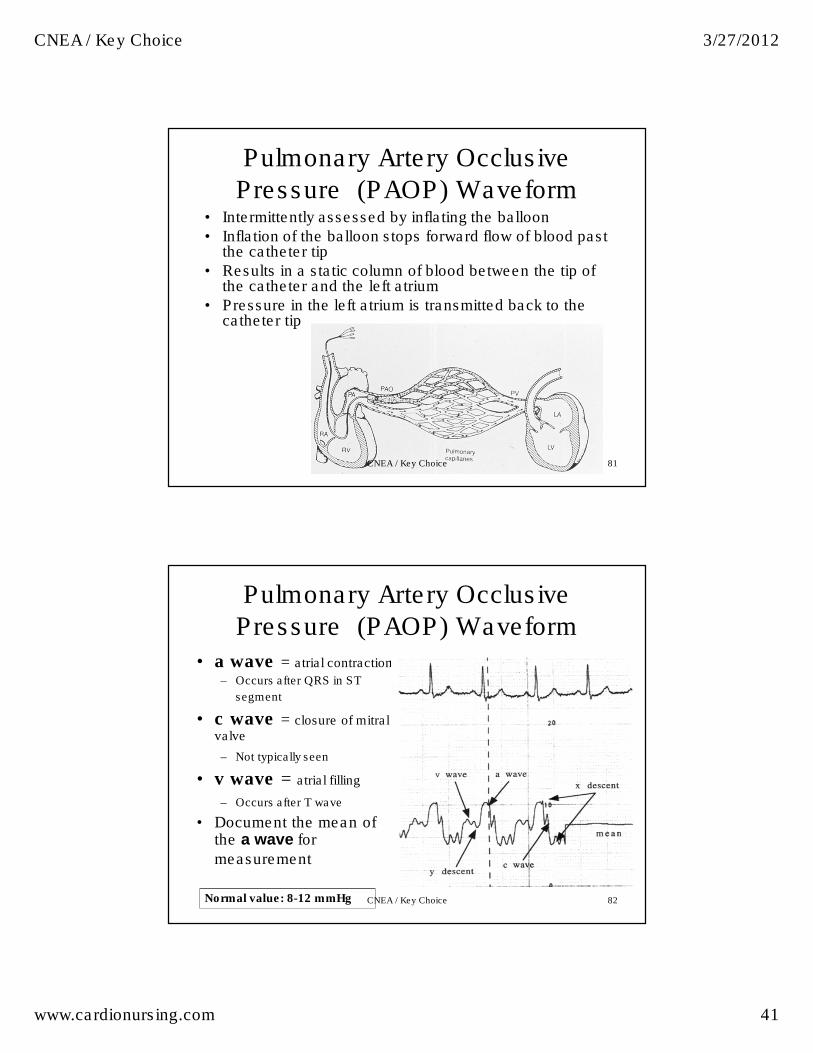
79
Right Ventricular (RV) Waveform
• Measured only during insertion
• PVCs or RBBB during insertion
• Rapid up stroke and rapid down stroke
Normal value: 15-30 / 2-8 mmHg
CNEA / Key Choice
80
Pulmonary Artery (PA) Waveform
• Systolic pressure close to
RV systolic pressure
– Correlates with RV function
• Diastolic pressure rises
– Indirect reflection of left heart
• Rapid up stroke and
down stroke
• Dicrotic notch represents
closure of pulmonic valve
Normal value: Systolic (PAS): 15-30 mm Hg Diastolic (PAD): 5-15 mm Hg Mean: 10-20 mm Hg CNEA / Key Choice
CNEA / Key Choice 3/27/2012
www.cardionursing.com 41
81
Pulmonary Artery Occlusive
Pressure (PAOP) Waveform• Intermittently assessed by inflating the balloon
• Inflation of the balloon stops forward flow of blood past the catheter tip
• Results in a static column of blood between the tip of the catheter and the left atrium
• Pressure in the left atrium is transmitted back to the catheter tip
CNEA / Key Choice
82
Pulmonary Artery Occlusive
Pressure (PAOP) Waveform
• a wave = atrial contraction
– Occurs after QRS in ST
segment
• c wave = closure of mitral valve
– Not typically seen
• v wave = atrial filling
– Occurs after T wave
• Document the mean of the a wave for
measurement
Normal value: 8-12 mmHg CNEA / Key Choice
CNEA / Key Choice 3/27/2012
www.cardionursing.com 42
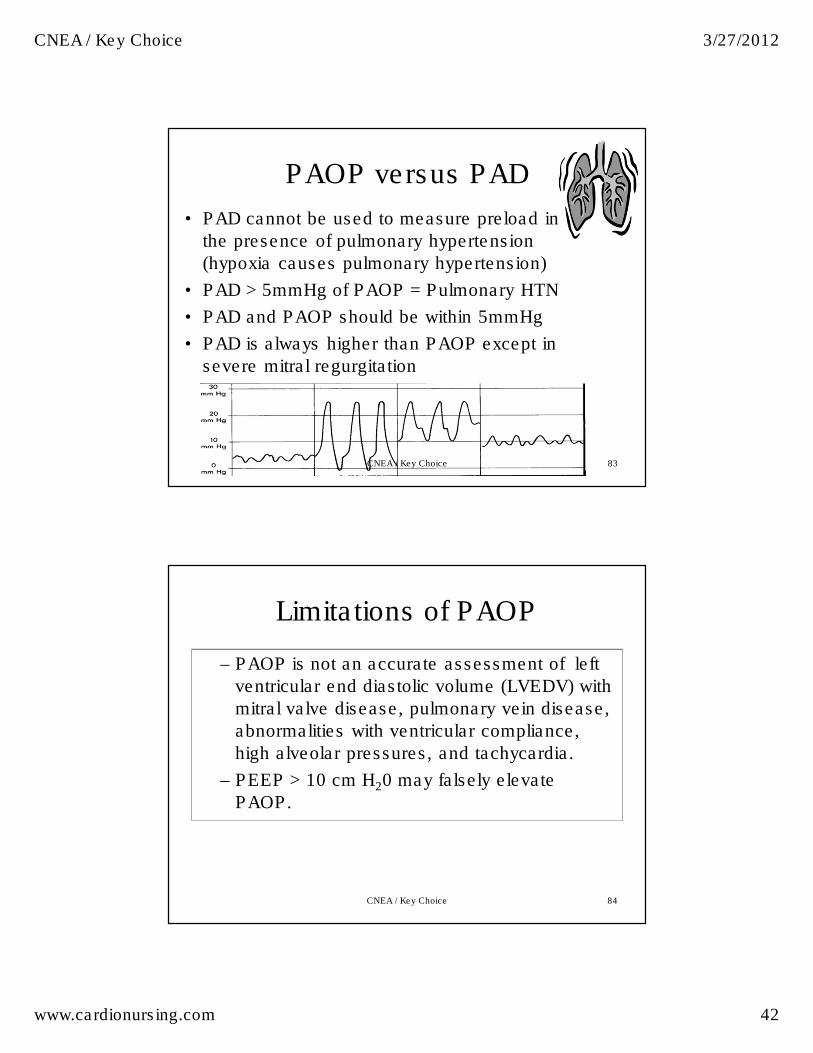
83
PAOP versus PAD
• PAD cannot be used to measure preload in
the presence of pulmonary hypertension
(hypoxia causes pulmonary hypertension)
• PAD > 5mmHg of PAOP = Pulmonary HTN
• PAD and PAOP should be within 5mmHg
• PAD is always higher than PAOP except in
severe mitral regurgitation
CNEA / Key Choice
84
Limitations of PAOP
– PAOP is not an accurate assessment of left
ventricular end diastolic volume (LVEDV) with
mitral valve disease, pulmonary vein disease,
abnormalities with ventricular compliance,
high alveolar pressures, and tachycardia.
– PEEP > 10 cm H20 may falsely elevate
PAOP.
CNEA / Key Choice
CNEA / Key Choice 3/27/2012
www.cardionursing.com 43
85
Safety Principles for PAOP
Monitoring • Never inject > 1.5 cc of air
into the balloon
• Stop injection of air when waveform changes to PAOP waveform
• Use minimal amount of inflation time; do not exceed 15 seconds
• Allow air to passively escape from the balloon; never aspirate air
• Never inject anything other than air into the balloon
• Always display waveform from distal tip on monitor
• PA waveform should always be visible unless balloon is inflated
• The presence of a PAOP waveform in the absence of balloon inflation indicates catheter migration, and the catheter needs to be withdrawn slowly until the PA waveform reappears
• Catheter should be securely sutured in place and catheter tip placement confirmed via chest X-ray
CNEA / Key Choice
86
More on a Waves
• A waves occur during atrial contraction.
• Large a waves can occur with tricuspid or mitral stenosis, decreased ventricular compliance, and when there is a loss of AV synchrony.
• Large a waves are not an accurate reflection of filling pressures.
• Large a waves are called cannon waves when due to an arrhythmia
• A waves are absent in atrial fibrillation, junctional and ventricular rhythms, and ventricular paced rhythms.
• When a waves are absent, the PAOP is read at the end of the QRS complex.
CNEA / Key Choice
CNEA / Key Choice 3/27/2012
www.cardionursing.com 44
87
More on a Waves This image cannot currently be displayed.
a v a
CNEA / Key Choice
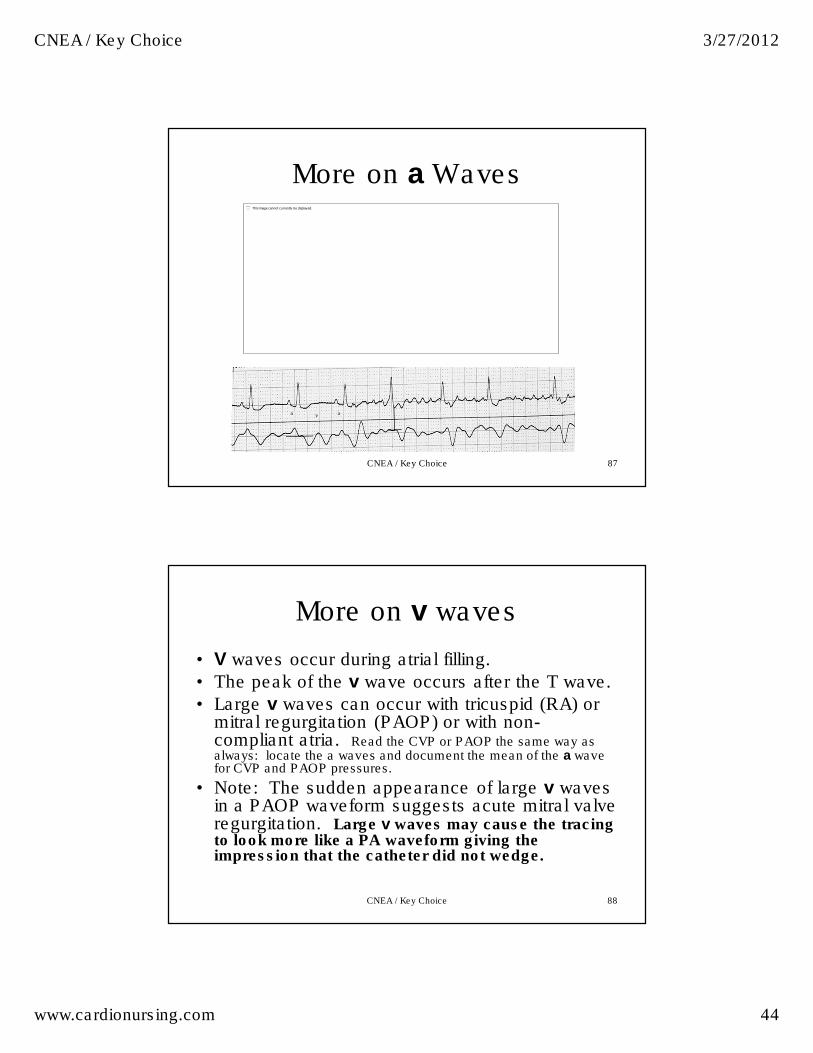
88
More on v waves
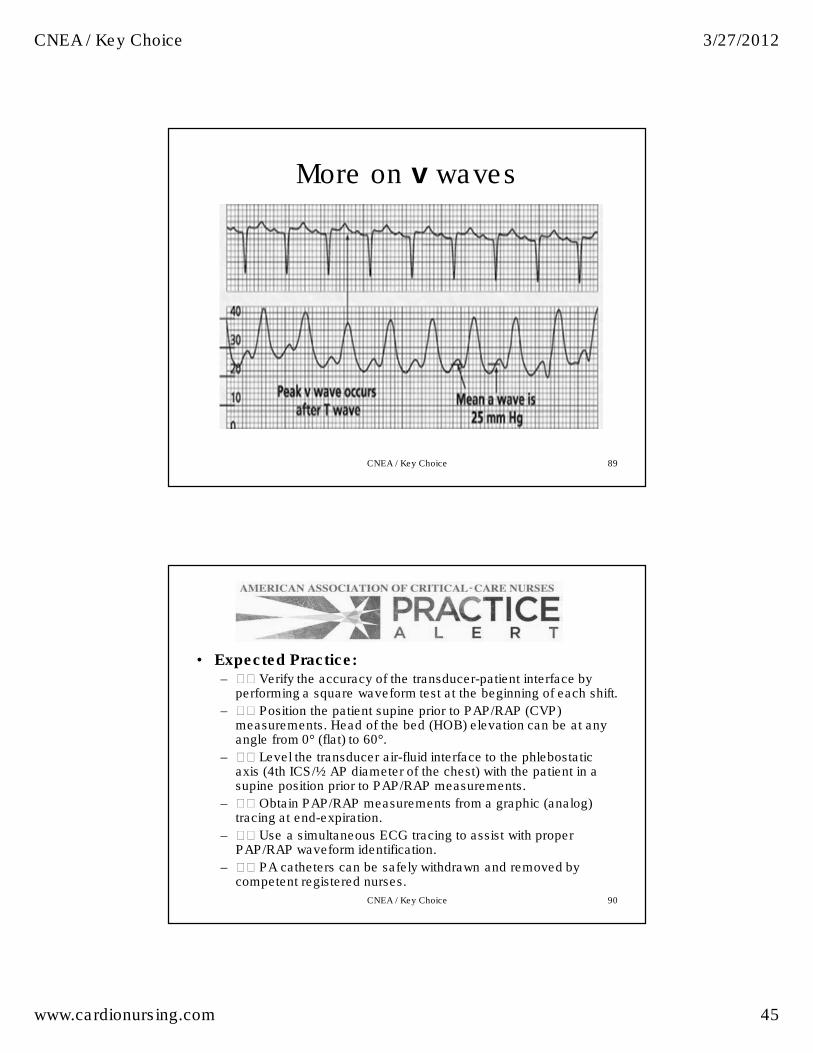
• V waves occur during atrial filling.
• The peak of the v wave occurs after the T wave.
• Large v waves can occur with tricuspid (RA) or mitral regurgitation (PAOP) or with non-compliant atria. Read the CVP or PAOP the same way as always: locate the a waves and document the mean of the a wave for CVP and PAOP pressures.
• Note: The sudden appearance of large v waves in a PAOP waveform suggests acute mitral valve regurgitation. Large v waves may cause the tracing to look more like a PA waveform giving the impression that the catheter did not wedge.
CNEA / Key Choice
CNEA / Key Choice 3/27/2012
www.cardionursing.com 45
89
More on v waves
CNEA / Key Choice
90
• Expected Practice: – �� Verify the accuracy of the transducer-patient interface by
performing a square waveform test at the beginning of each shift.
– �� Position the patient supine prior to PAP/RAP (CVP) measurements. Head of the bed (HOB) elevation can be at any angle from 0°(flat) to 60°.
– �� Level the transducer air-fluid interface to the phlebostatic axis (4th ICS/½ AP diameter of the chest) with the patient in a supine position prior to PAP/RAP measurements.
– �� Obtain PAP/RAP measurements from a graphic (analog) tracing at end-expiration.
– �� Use a simultaneous ECG tracing to assist with proper PAP/RAP waveform identification.
– �� PA catheters can be safely withdrawn and removed by competent registered nurses.
CNEA / Key Choice
CNEA / Key Choice 3/27/2012
www.cardionursing.com 46
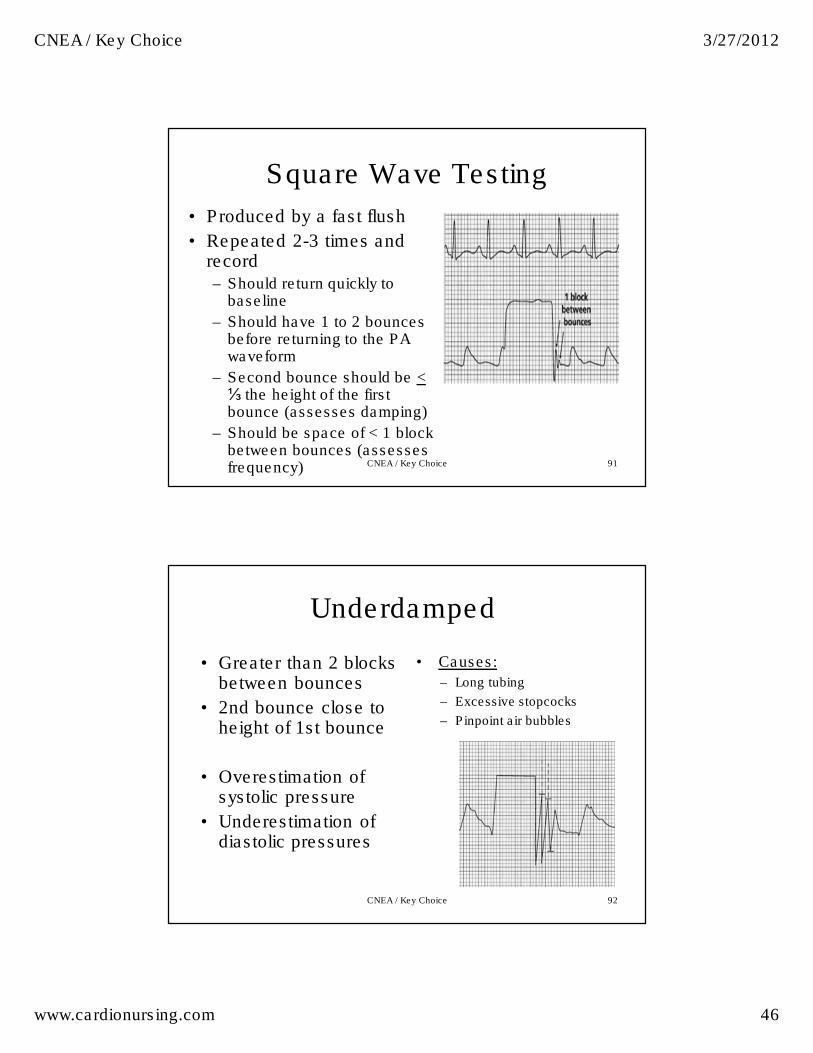
91
Square Wave Testing
• Produced by a fast flush
• Repeated 2-3 times and record – Should return quickly to
baseline
– Should have 1 to 2 bounces before returning to the PA waveform
– Second bounce should be <⅓ the height of the first bounce (assesses damping)
– Should be space of < 1 block between bounces (assesses frequency) CNEA / Key Choice
92
Underdamped
• Greater than 2 blocks between bounces
• 2nd bounce close to height of 1st bounce
• Overestimation of systolic pressure
• Underestimation of diastolic pressures
• Causes:
– Long tubing
– Excessive stopcocks
– Pinpoint air bubbles
CNEA / Key Choice
CNEA / Key Choice 3/27/2012
www.cardionursing.com 47
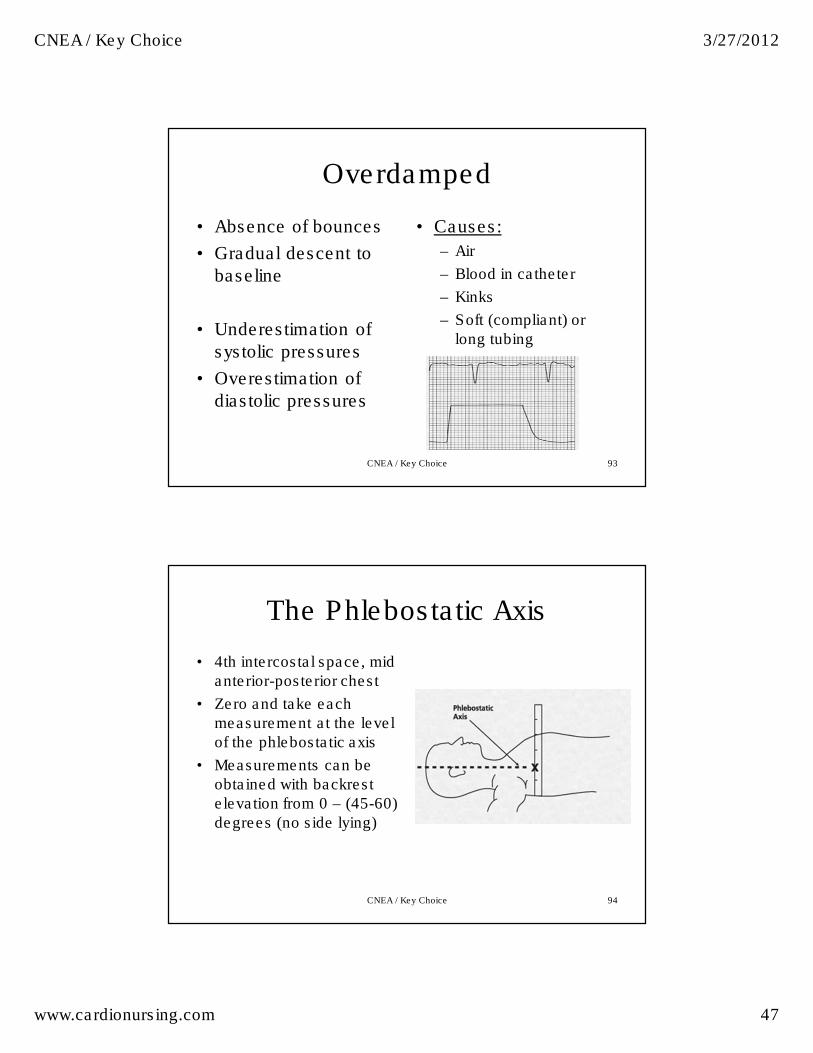
93
Overdamped
• Absence of bounces
• Gradual descent to
baseline
• Underestimation of
systolic pressures
• Overestimation of
diastolic pressures
• Causes:
– Air
– Blood in catheter
– Kinks
– Soft (compliant) or
long tubing
CNEA / Key Choice
94
The Phlebostatic Axis
• 4th intercostal space, mid
anterior-posterior chest
• Zero and take each
measurement at the level
of the phlebostatic axis
• Measurements can be
obtained with backrest
elevation from 0 – (45-60)
degrees (no side lying)
CNEA / Key Choice
CNEA / Key Choice 3/27/2012
www.cardionursing.com 48
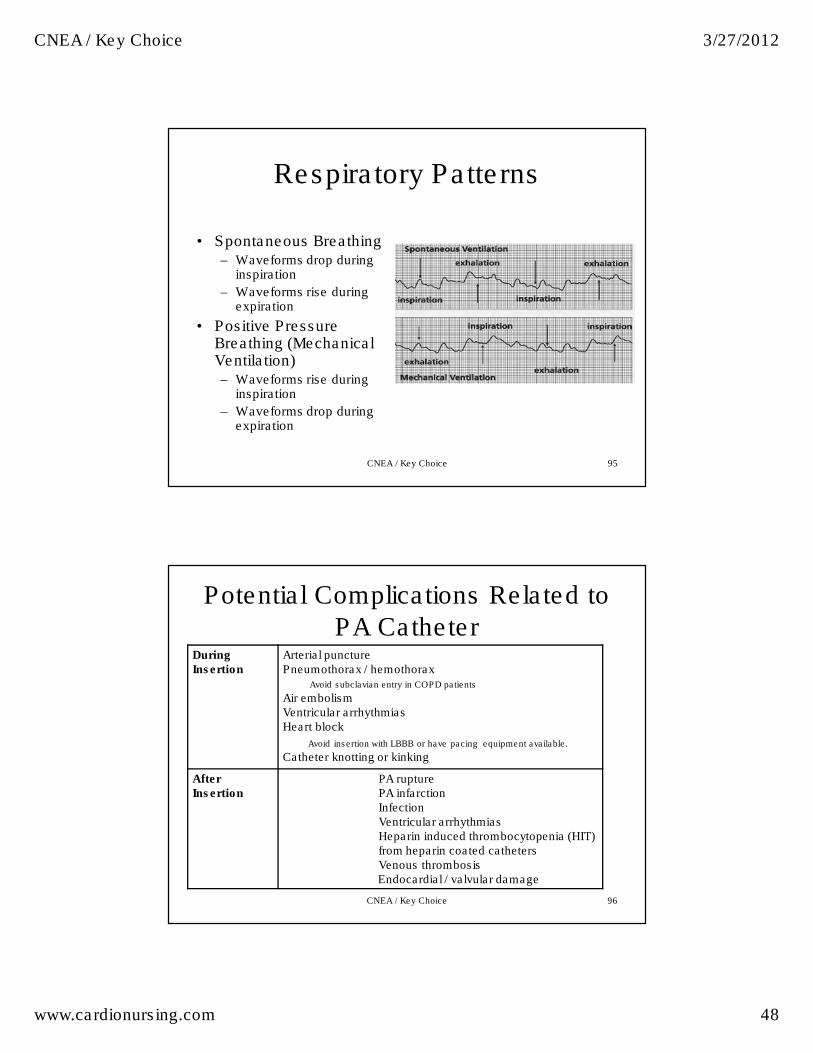
95
Respiratory Patterns
• Spontaneous Breathing – Waveforms drop during
inspiration
– Waveforms rise during expiration
• Positive Pressure Breathing (Mechanical Ventilation) – Waveforms rise during
inspiration
– Waveforms drop during expiration
CNEA / Key Choice
96
Potential Complications Related to
PA Catheter During Insertion
Arterial puncture Pneumothorax / hemothorax
Avoid subclavian entry in COPD patients
Air embolism Ventricular arrhythmias Heart block
Avoid insertion with LBBB or have pacing equipment available.
Catheter knotting or kinking
After Insertion
PA rupture PA infarction Infection Ventricular arrhythmias Heparin induced thrombocytopenia (HIT) from heparin coated catheters Venous thrombosis Endocardial / valvular damage
CNEA / Key Choice
CNEA / Key Choice 3/27/2012
www.cardionursing.com 49
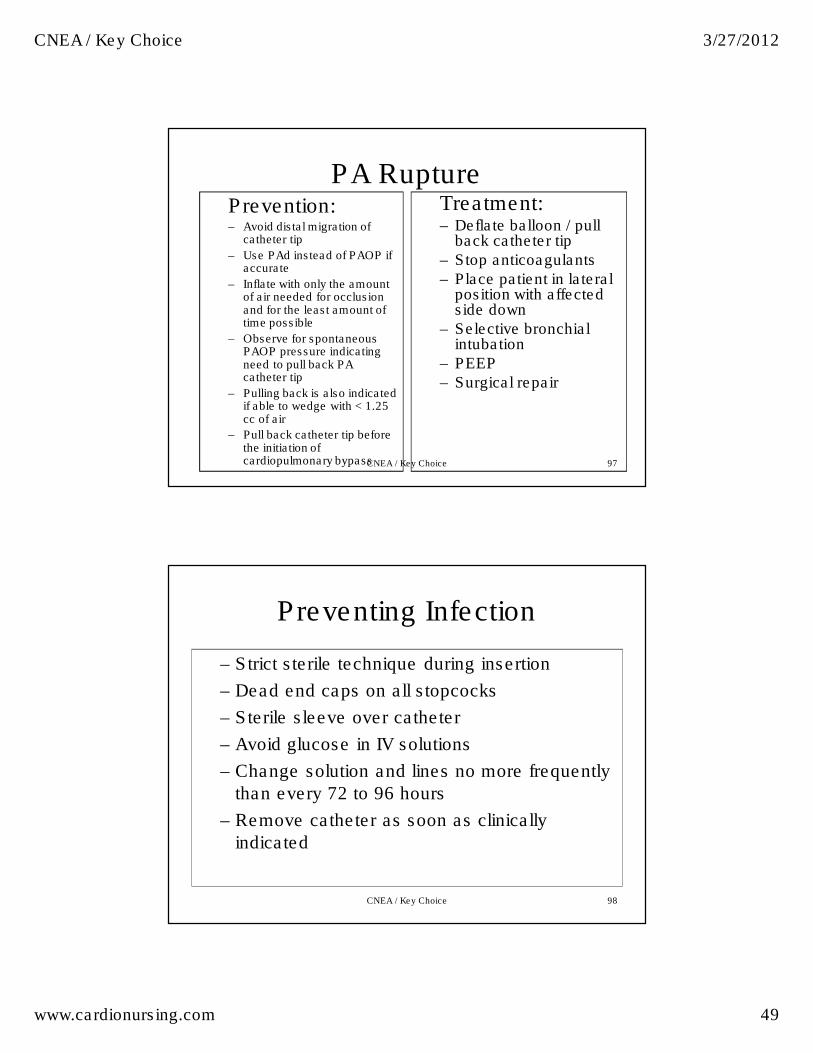
97
PA Rupture Prevention: – Avoid distal migration of
catheter tip
– Use PAd instead of PAOP if accurate
– Inflate with only the amount of air needed for occlusion and for the least amount of time possible
– Observe for spontaneous PAOP pressure indicating need to pull back PA catheter tip
– Pulling back is also indicated if able to wedge with < 1.25 cc of air
– Pull back catheter tip before the initiation of cardiopulmonary bypass
Treatment: – Deflate balloon / pull
back catheter tip
– Stop anticoagulants
– Place patient in lateral position with affected side down
– Selective bronchial intubation
– PEEP
– Surgical repair
CNEA / Key Choice
98
Preventing Infection
– Strict sterile technique during insertion
– Dead end caps on all stopcocks
– Sterile sleeve over catheter
– Avoid glucose in IV solutions
– Change solution and lines no more frequently
than every 72 to 96 hours
– Remove catheter as soon as clinically
indicated
CNEA / Key Choice
CNEA / Key Choice 3/27/2012
www.cardionursing.com 50
99
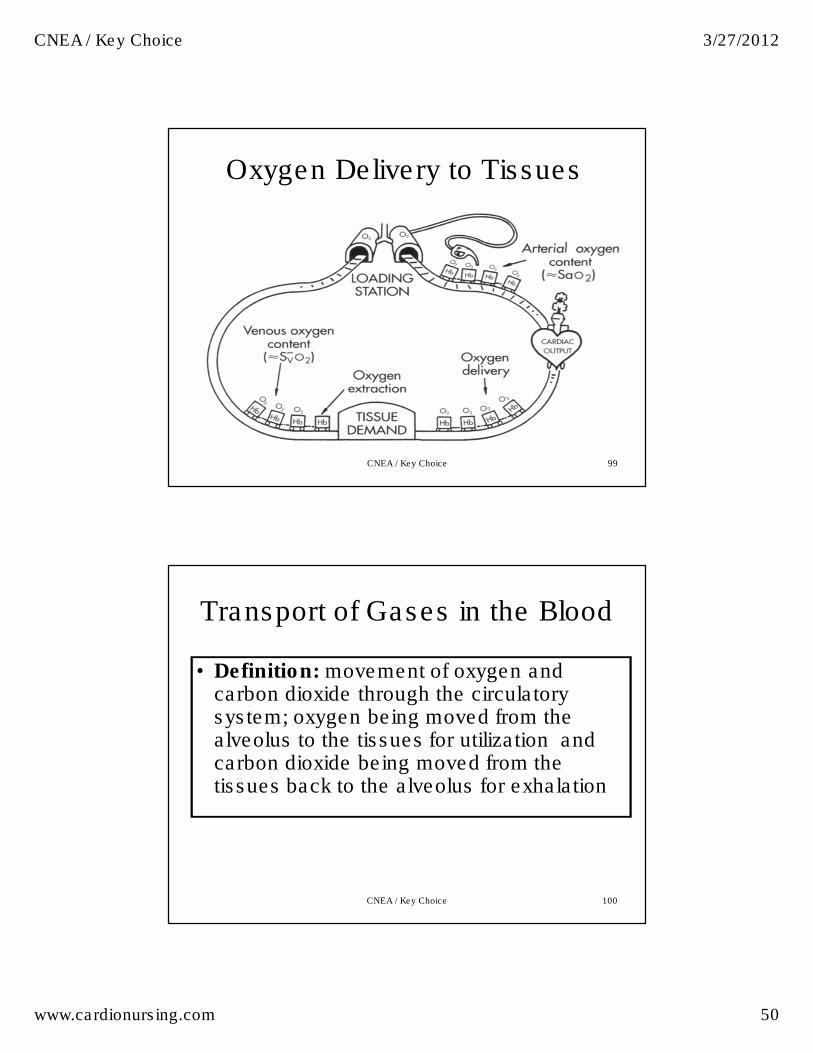
Oxygen Delivery to Tissues
CNEA / Key Choice
100
Transport of Gases in the Blood
• Definition: movement of oxygen and carbon dioxide through the circulatory system; oxygen being moved from the alveolus to the tissues for utilization and carbon dioxide being moved from the tissues back to the alveolus for exhalation
CNEA / Key Choice
CNEA / Key Choice 3/27/2012
www.cardionursing.com 51
101
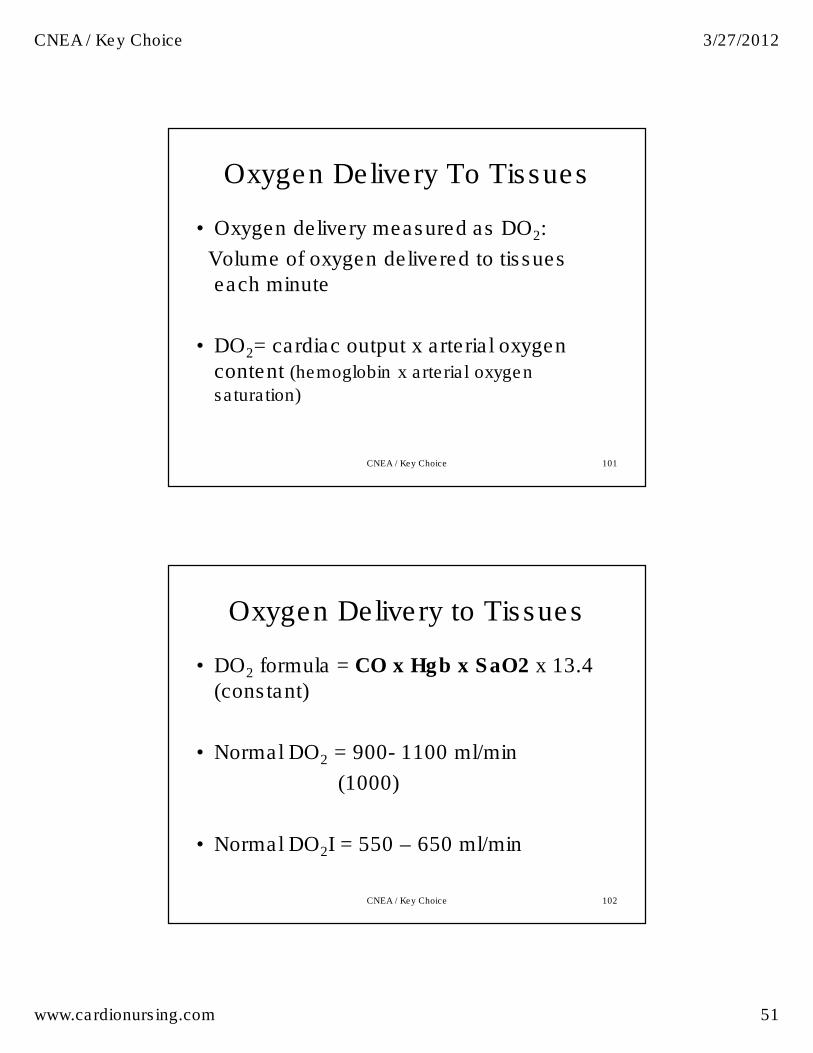
Oxygen Delivery To Tissues
• Oxygen delivery measured as DO2:
Volume of oxygen delivered to tissues each minute
• DO2= cardiac output x arterial oxygen content (hemoglobin x arterial oxygen
saturation)
CNEA / Key Choice
102
Oxygen Delivery to Tissues
• DO2 formula = CO x Hgb x SaO2 x 13.4 (constant)
• Normal DO2 = 900- 1100 ml/min
(1000)
• Normal DO2I = 550 – 650 ml/min
CNEA / Key Choice
CNEA / Key Choice 3/27/2012
www.cardionursing.com 52
103
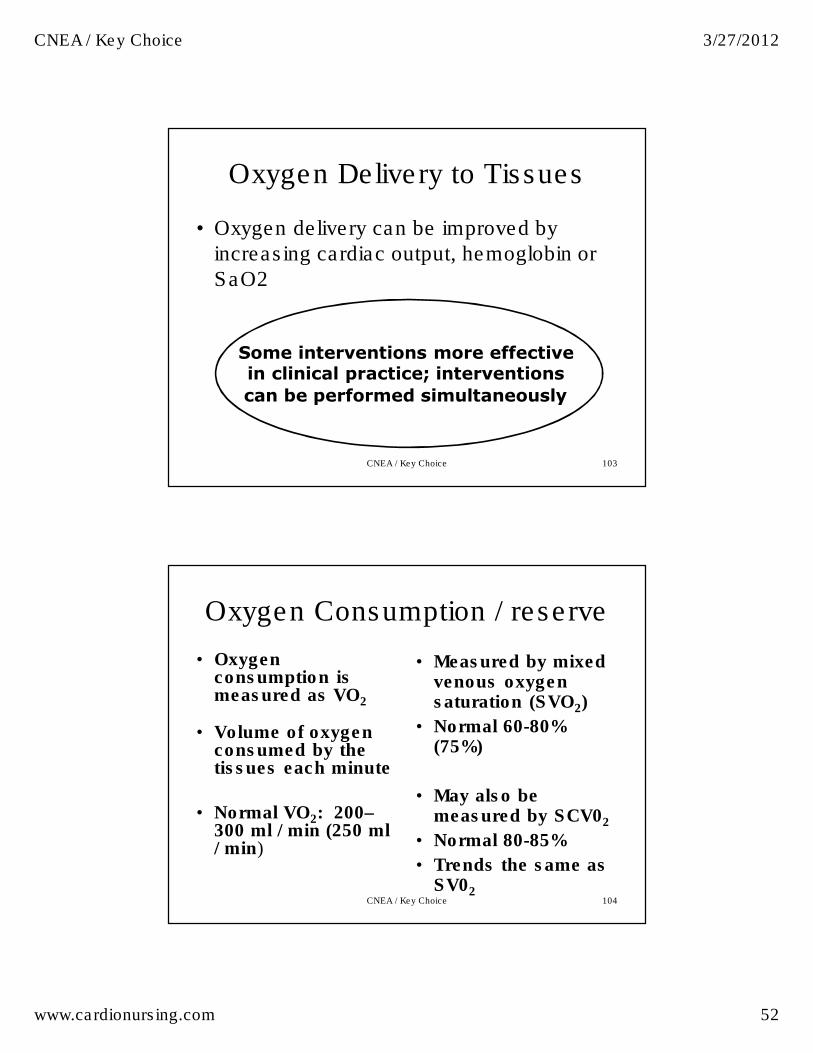
Oxygen Delivery to Tissues
• Oxygen delivery can be improved by increasing cardiac output, hemoglobin or SaO2
Some interventions more effective in clinical practice; interventions
can be performed simultaneously
CNEA / Key Choice
Oxygen Consumption / reserve
• Oxygen consumption is measured as VO2
• Volume of oxygen consumed by the tissues each minute
• Normal VO2: 200–300 ml / min (250 ml / min)
• Measured by mixed venous oxygen saturation (SVO2)
• Normal 60-80% (75%)
• May also be measured by SCV02
• Normal 80-85%
• Trends the same as SV02
104CNEA / Key Choice
CNEA / Key Choice 3/27/2012
www.cardionursing.com 53
105
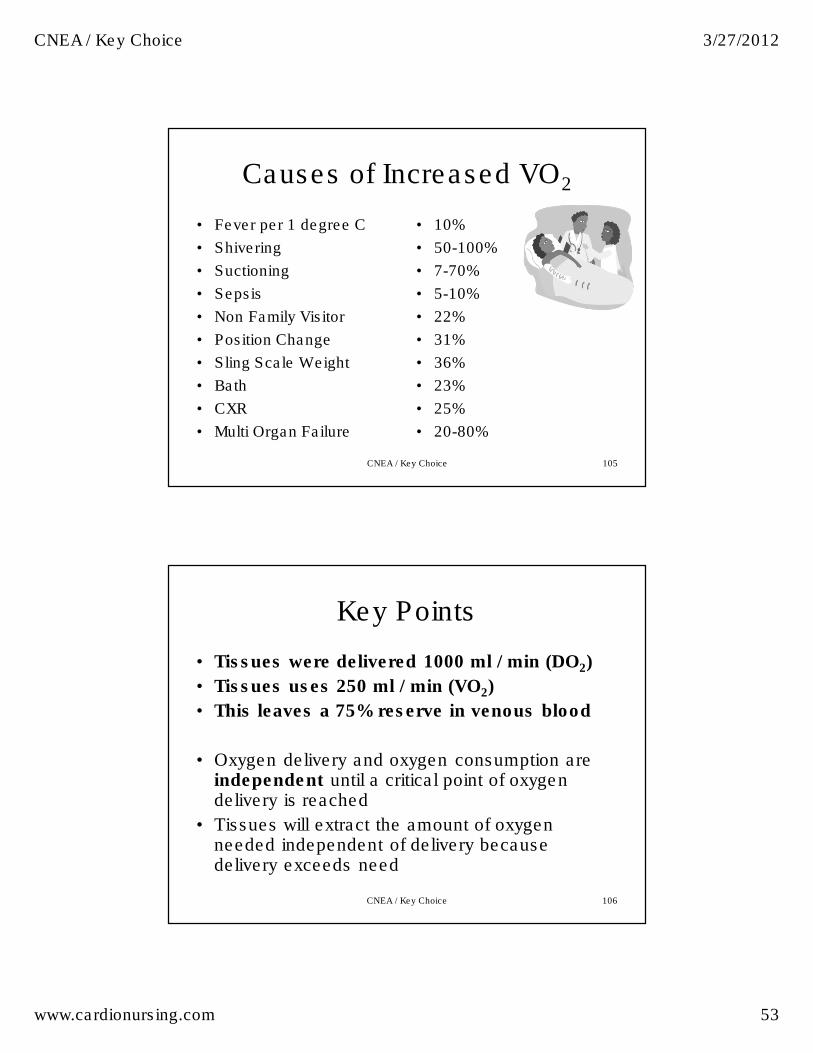
Causes of Increased VO2
• Fever per 1 degree C
• Shivering
• Suctioning
• Sepsis
• Non Family Visitor
• Position Change
• Sling Scale Weight
• Bath
• CXR
• Multi Organ Failure
• 10%
• 50-100%
• 7-70%
• 5-10%
• 22%
• 31%
• 36%
• 23%
• 25%
• 20-80%
CNEA / Key Choice
106
Key Points
• Tissues were delivered 1000 ml / min (DO2)
• Tissues uses 250 ml / min (VO2)
• This leaves a 75% reserve in venous blood
• Oxygen delivery and oxygen consumption are independent until a critical point of oxygen delivery is reached
• Tissues will extract the amount of oxygen needed independent of delivery because delivery exceeds need
CNEA / Key Choice
CNEA / Key Choice 3/27/2012
www.cardionursing.com 54
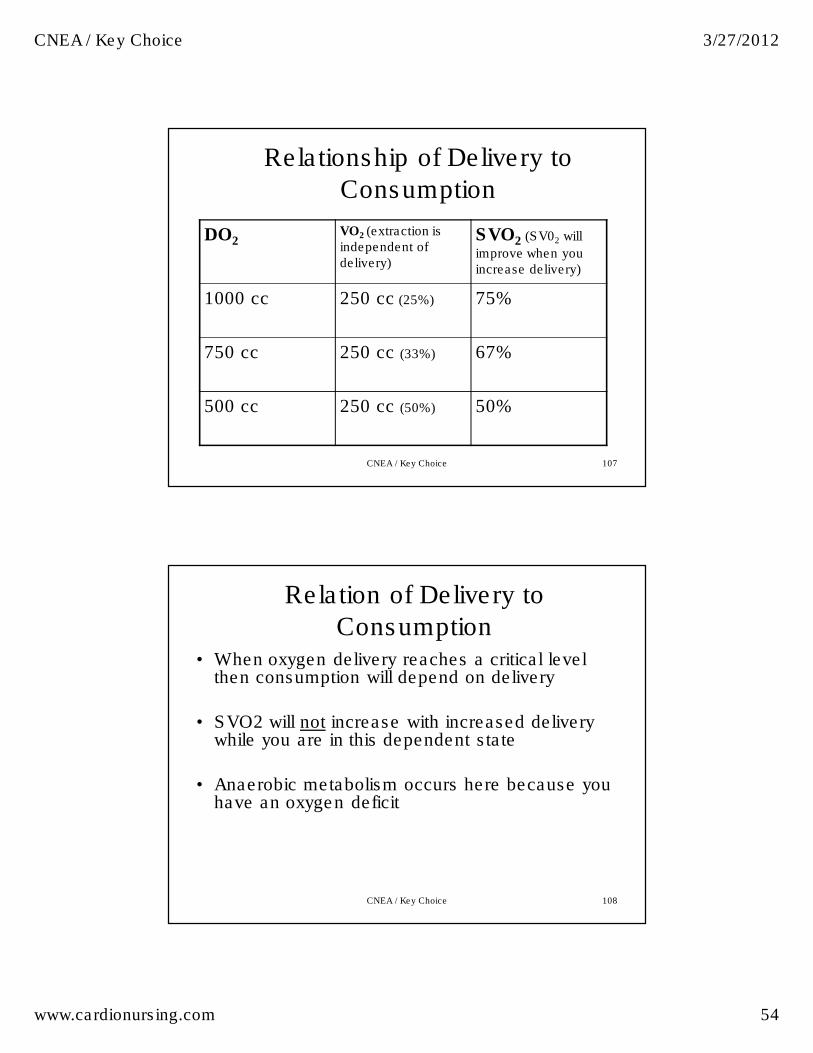
107
Relationship of Delivery to
Consumption
DO2VO2 (extraction is independent of delivery)
SVO2 (SV02 will
improve when you increase delivery)
1000 cc 250 cc (25%) 75%
750 cc 250 cc (33%) 67%
500 cc 250 cc (50%) 50%
CNEA / Key Choice
108
Relation of Delivery to
Consumption• When oxygen delivery reaches a critical level
then consumption will depend on delivery
• SVO2 will not increase with increased delivery while you are in this dependent state
• Anaerobic metabolism occurs here because you have an oxygen deficit
CNEA / Key Choice
CNEA / Key Choice 3/27/2012
www.cardionursing.com 55
109
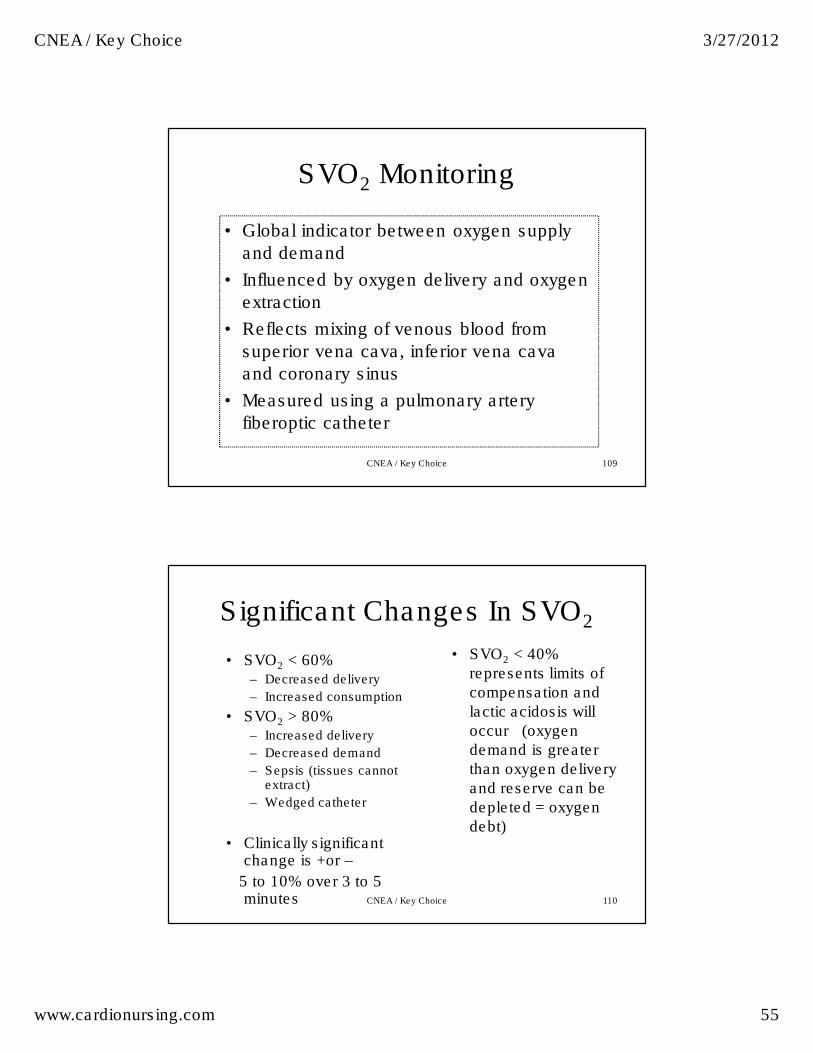
SVO2 Monitoring
• Global indicator between oxygen supply
and demand
• Influenced by oxygen delivery and oxygen
extraction
• Reflects mixing of venous blood from
superior vena cava, inferior vena cava
and coronary sinus
• Measured using a pulmonary artery
fiberoptic catheter
CNEA / Key Choice
110
Significant Changes In SVO2
• SVO2 < 60% – Decreased delivery
– Increased consumption
• SVO2 > 80%– Increased delivery
– Decreased demand
– Sepsis (tissues cannot extract)
– Wedged catheter
• Clinically significant change is +or –
5 to 10% over 3 to 5 minutes
• SVO2 < 40%
represents limits of
compensation and
lactic acidosis will
occur (oxygen
demand is greater
than oxygen delivery
and reserve can be
depleted = oxygen
debt)
CNEA / Key Choice
CNEA / Key Choice 3/27/2012
www.cardionursing.com 56
CNEA / Key Choice 111
112
Shock
• Definition:
– The condition of insufficient perfusion of cells and
vital organs causing tissue hypoxia
– Perfusion is inadequate to sustain life
– Results in cellular, metabolic and hemodynamic
derangements
CNEA / Key Choice
CNEA / Key Choice 3/27/2012
www.cardionursing.com 57
113
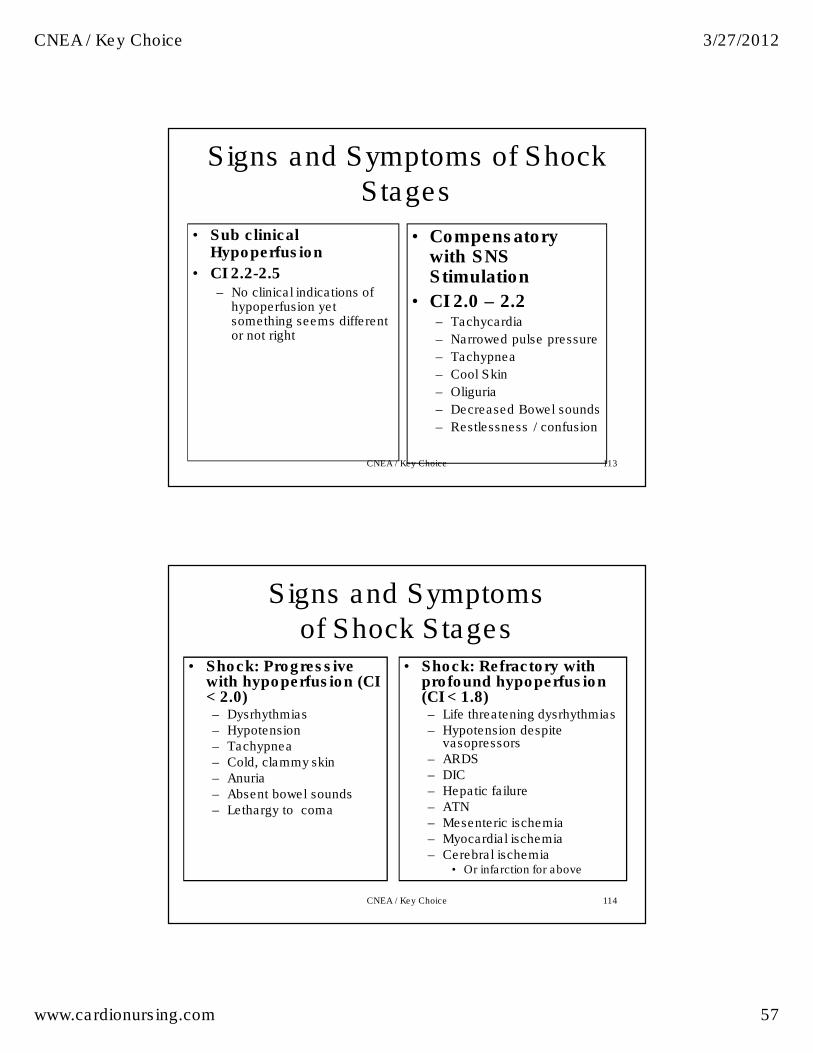
Signs and Symptoms of Shock Stages
• Sub clinical Hypoperfusion
• CI 2.2-2.5 – No clinical indications of
hypoperfusion yet something seems different or not right
• Compensatory with SNS Stimulation
• CI 2.0 – 2.2 – Tachycardia
– Narrowed pulse pressure
– Tachypnea
– Cool Skin
– Oliguria
– Decreased Bowel sounds
– Restlessness / confusion
CNEA / Key Choice
114
Signs and Symptoms of Shock Stages
• Shock: Progressive with hypoperfusion (CI < 2.0)– Dysrhythmias – Hypotension – Tachypnea – Cold, clammy skin – Anuria – Absent bowel sounds– Lethargy to coma
• Shock: Refractory with profound hypoperfusion (CI < 1.8) – Life threatening dysrhythmias – Hypotension despite
vasopressors – ARDS – DIC – Hepatic failure – ATN – Mesenteric ischemia – Myocardial ischemia – Cerebral ischemia
• Or infarction for above
CNEA / Key Choice
CNEA / Key Choice 3/27/2012
www.cardionursing.com 58
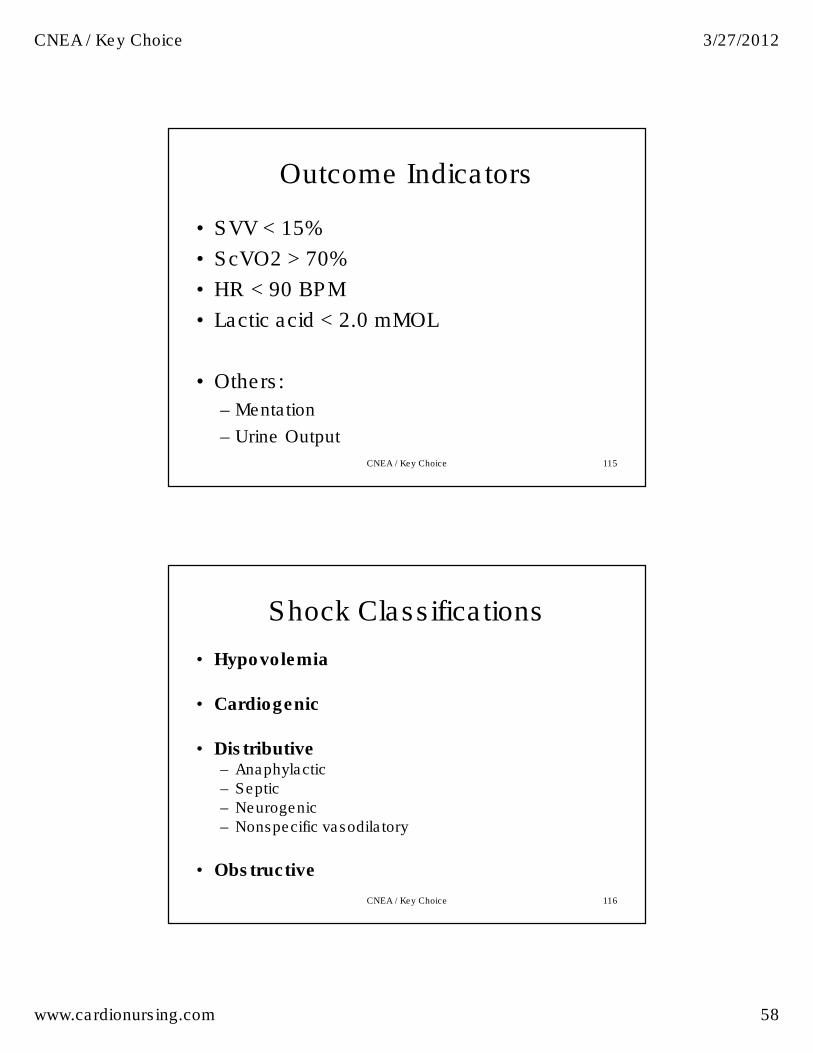
Outcome Indicators
• SVV < 15%
• ScVO2 > 70%
• HR < 90 BPM
• Lactic acid < 2.0 mMOL
• Others:
– Mentation
– Urine Output
CNEA / Key Choice 115
116
Shock Classifications
• Hypovolemia
• Cardiogenic
• Distributive – Anaphylactic
– Septic
– Neurogenic
– Nonspecific vasodilatory
• Obstructive
CNEA / Key Choice
CNEA / Key Choice 3/27/2012
www.cardionursing.com 59
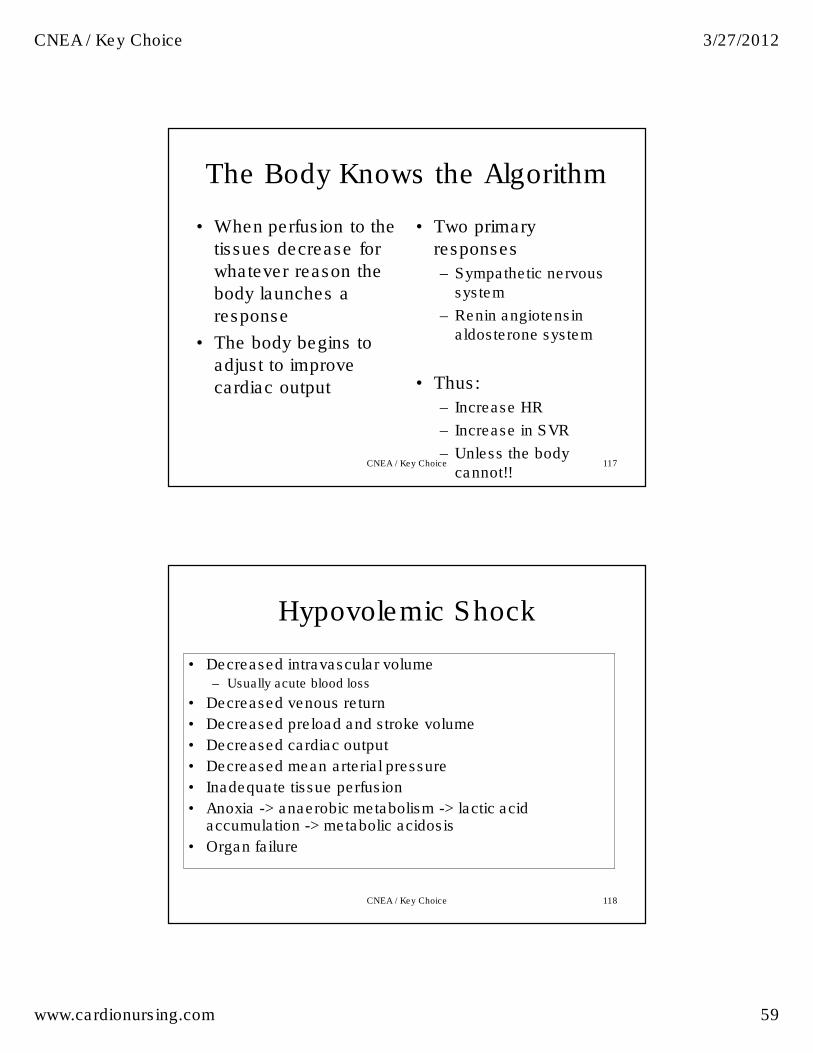
The Body Knows the Algorithm
• When perfusion to the
tissues decrease for
whatever reason the
body launches a
response
• The body begins to
adjust to improve
cardiac output
• Two primary
responses
– Sympathetic nervous
system
– Renin angiotensin
aldosterone system
• Thus:
– Increase HR
– Increase in SVR
– Unless the body
cannot!!CNEA / Key Choice 117
118
Hypovolemic Shock
• Decreased intravascular volume– Usually acute blood loss
• Decreased venous return
• Decreased preload and stroke volume
• Decreased cardiac output
• Decreased mean arterial pressure
• Inadequate tissue perfusion
• Anoxia -> anaerobic metabolism -> lactic acid accumulation -> metabolic acidosis
• Organ failure
CNEA / Key Choice
CNEA / Key Choice 3/27/2012
www.cardionursing.com 60
119
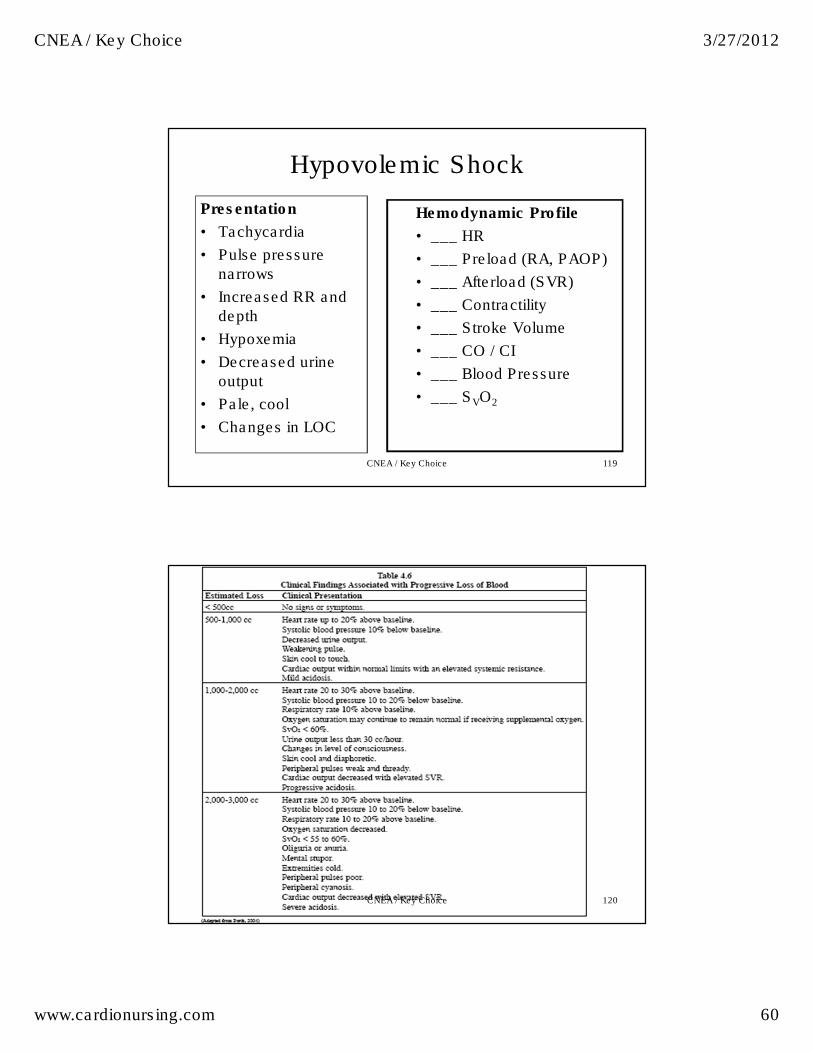
Hypovolemic Shock
Presentation
• Tachycardia
• Pulse pressure
narrows
• Increased RR and
depth
• Hypoxemia
• Decreased urine
output
• Pale, cool
• Changes in LOC
Hemodynamic Profile
• ___ HR
• ___ Preload (RA, PAOP)
• ___ Afterload (SVR)
• ___ Contractility
• ___ Stroke Volume
• ___ CO / CI
• ___ Blood Pressure
• ___ SVO2
CNEA / Key Choice
120CNEA / Key Choice
CNEA / Key Choice 3/27/2012
www.cardionursing.com 61
121
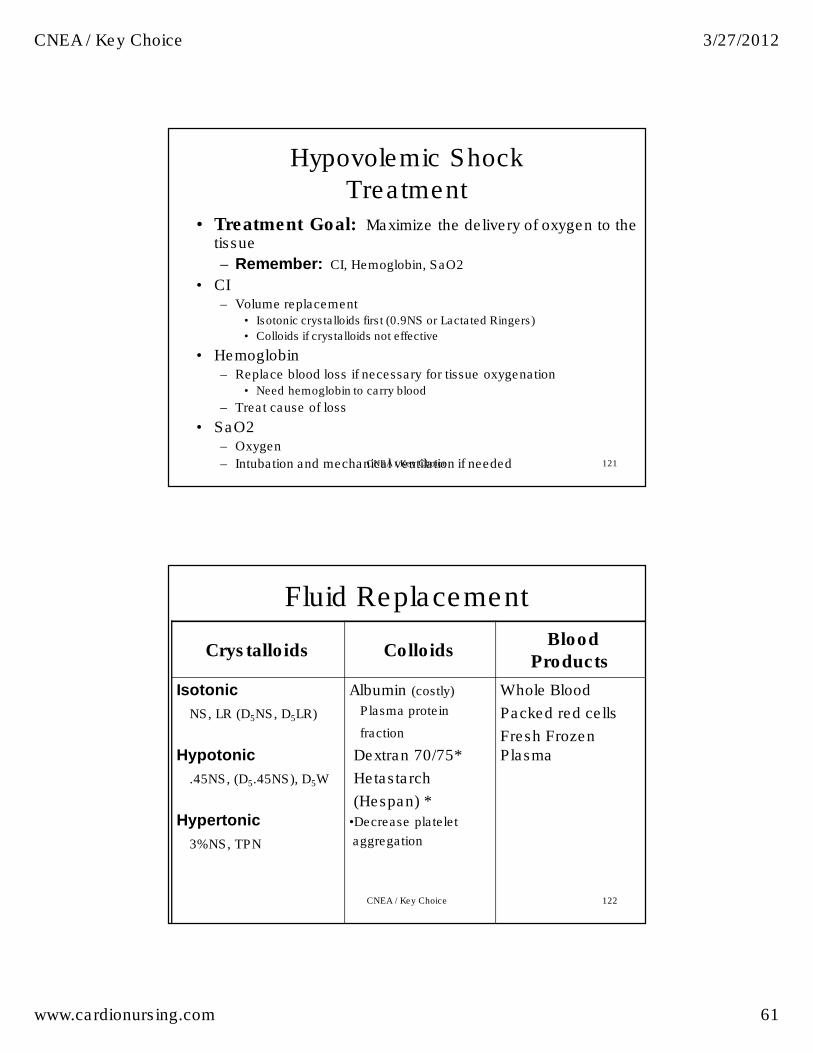
Hypovolemic Shock
Treatment
• Treatment Goal: Maximize the delivery of oxygen to the tissue
– Remember: CI, Hemoglobin, SaO2
• CI– Volume replacement
• Isotonic crystalloids first (0.9NS or Lactated Ringers)
• Colloids if crystalloids not effective
• Hemoglobin– Replace blood loss if necessary for tissue oxygenation
• Need hemoglobin to carry blood
– Treat cause of loss
• SaO2– Oxygen
– Intubation and mechanical ventilation if neededCNEA / Key Choice
122
Fluid Replacement
Crystalloids Colloids Blood
Products
Isotonic
NS, LR (D5NS, D5LR)
Hypotonic
.45NS, (D5.45NS), D5W
Hypertonic
3%NS, TPN
Albumin (costly)
Plasma protein
fraction
Dextran 70/75*
Hetastarch
(Hespan) *
•Decrease platelet
aggregation
Whole Blood
Packed red cells
Fresh Frozen
Plasma
CNEA / Key Choice
CNEA / Key Choice 3/27/2012
www.cardionursing.com 62
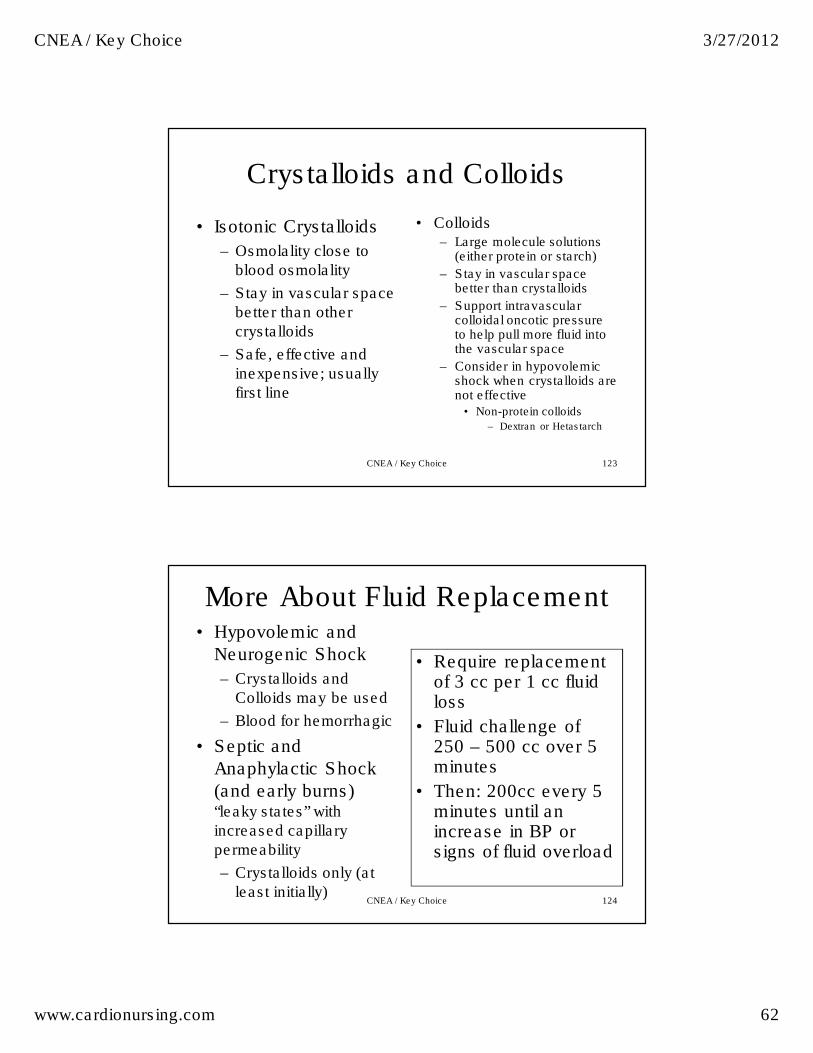
123
Crystalloids and Colloids
• Isotonic Crystalloids
– Osmolality close to
blood osmolality
– Stay in vascular space
better than other
crystalloids
– Safe, effective and
inexpensive; usually
first line
• Colloids – Large molecule solutions
(either protein or starch)
– Stay in vascular space better than crystalloids
– Support intravascular colloidal oncotic pressure to help pull more fluid into the vascular space
– Consider in hypovolemic shock when crystalloids are not effective
• Non-protein colloids– Dextran or Hetastarch
CNEA / Key Choice
124
More About Fluid Replacement • Hypovolemic and
Neurogenic Shock
– Crystalloids and
Colloids may be used
– Blood for hemorrhagic
• Septic and
Anaphylactic Shock
(and early burns) “leaky states” with
increased capillary
permeability
– Crystalloids only (at
least initially)
• Require replacement of 3 cc per 1 cc fluid loss
• Fluid challenge of 250 – 500 cc over 5 minutes
• Then: 200cc every 5 minutes until an increase in BP or signs of fluid overload
CNEA / Key Choice
CNEA / Key Choice 3/27/2012
www.cardionursing.com 63
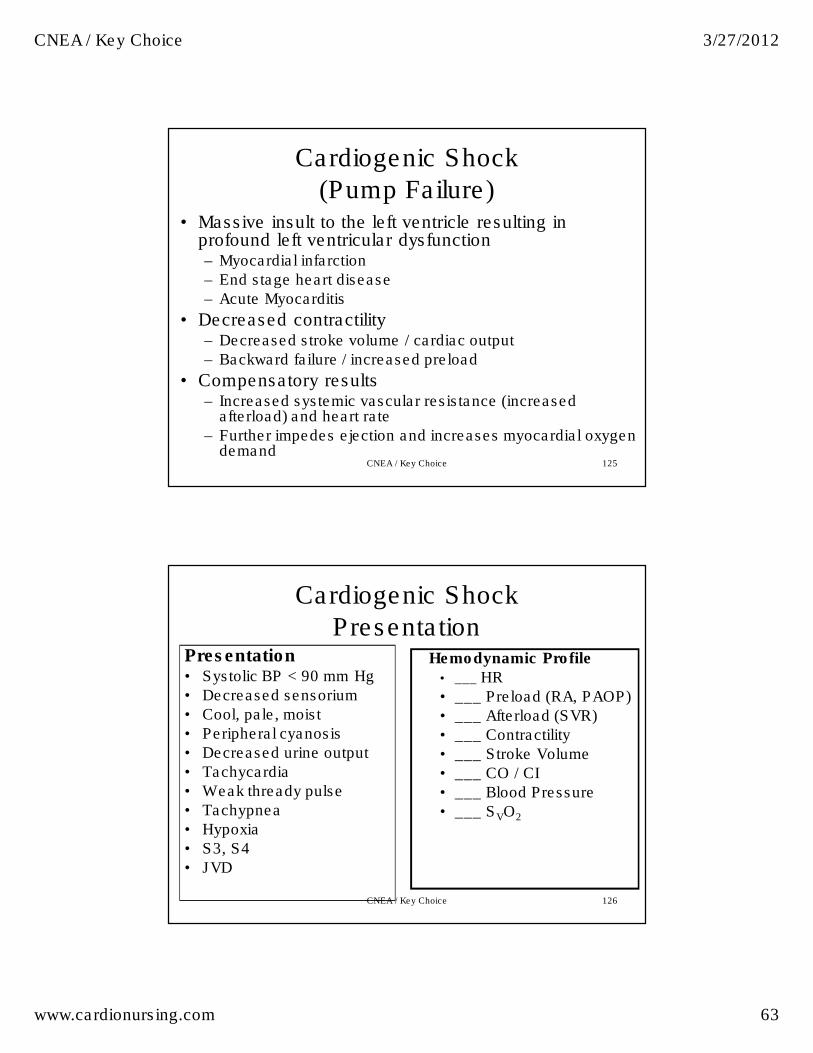
125
Cardiogenic Shock
(Pump Failure)• Massive insult to the left ventricle resulting in
profound left ventricular dysfunction– Myocardial infarction
– End stage heart disease
– Acute Myocarditis
• Decreased contractility– Decreased stroke volume / cardiac output
– Backward failure / increased preload
• Compensatory results– Increased systemic vascular resistance (increased
afterload) and heart rate
– Further impedes ejection and increases myocardial oxygen demand
CNEA / Key Choice
126
Cardiogenic Shock
PresentationPresentation• Systolic BP < 90 mm Hg
• Decreased sensorium
• Cool, pale, moist
• Peripheral cyanosis
• Decreased urine output
• Tachycardia
• Weak thready pulse
• Tachypnea
• Hypoxia
• S3, S4
• JVD
Hemodynamic Profile• ___ HR
• ___ Preload (RA, PAOP)
• ___ Afterload (SVR)
• ___ Contractility
• ___ Stroke Volume
• ___ CO / CI
• ___ Blood Pressure
• ___ SVO2
CNEA / Key Choice
CNEA / Key Choice 3/27/2012
www.cardionursing.com 64
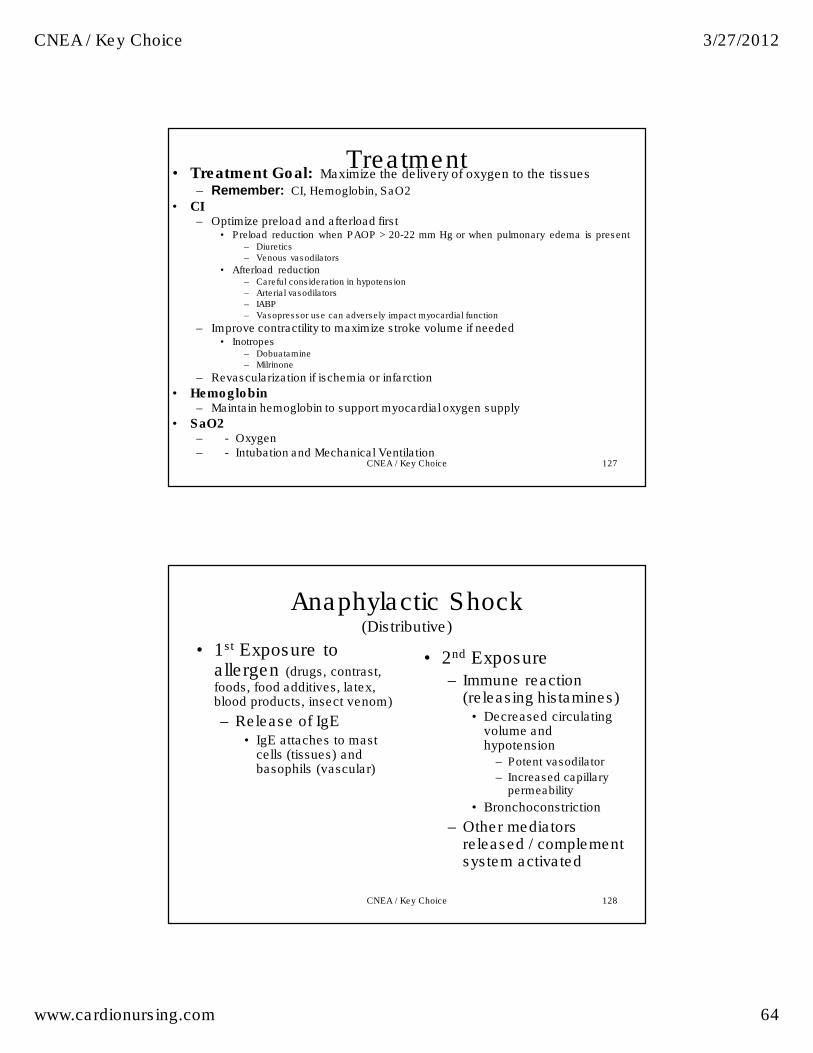
127
• Treatment Goal: Maximize the delivery of oxygen to the tissues
– Remember: CI, Hemoglobin, SaO2
• CI– Optimize preload and afterload first
• Preload reduction when PAOP > 20-22 mm Hg or when pulmonary edema is present– Diuretics
– Venous vasodilators
• Afterload reduction– Careful consideration in hypotension
– Arterial vasodilators
– IABP
– Vasopressor use can adversely impact myocardial function
– Improve contractility to maximize stroke volume if needed • Inotropes
– Dobuatamine
– Milrinone
– Revascularization if ischemia or infarction
• Hemoglobin– Maintain hemoglobin to support myocardial oxygen supply
• SaO2– - Oxygen – - Intubation and Mechanical Ventilation
Treatment
CNEA / Key Choice
128
Anaphylactic Shock(Distributive)
• 2nd Exposure – Immune reaction
(releasing histamines)• Decreased circulating
volume and hypotension
– Potent vasodilator
– Increased capillary permeability
• Bronchoconstriction
– Other mediators released / complement system activated
• 1st Exposure to allergen (drugs, contrast, foods, food additives, latex, blood products, insect venom)
– Release of IgE • IgE attaches to mast
cells (tissues) and basophils (vascular)
CNEA / Key Choice
CNEA / Key Choice 3/27/2012
www.cardionursing.com 65
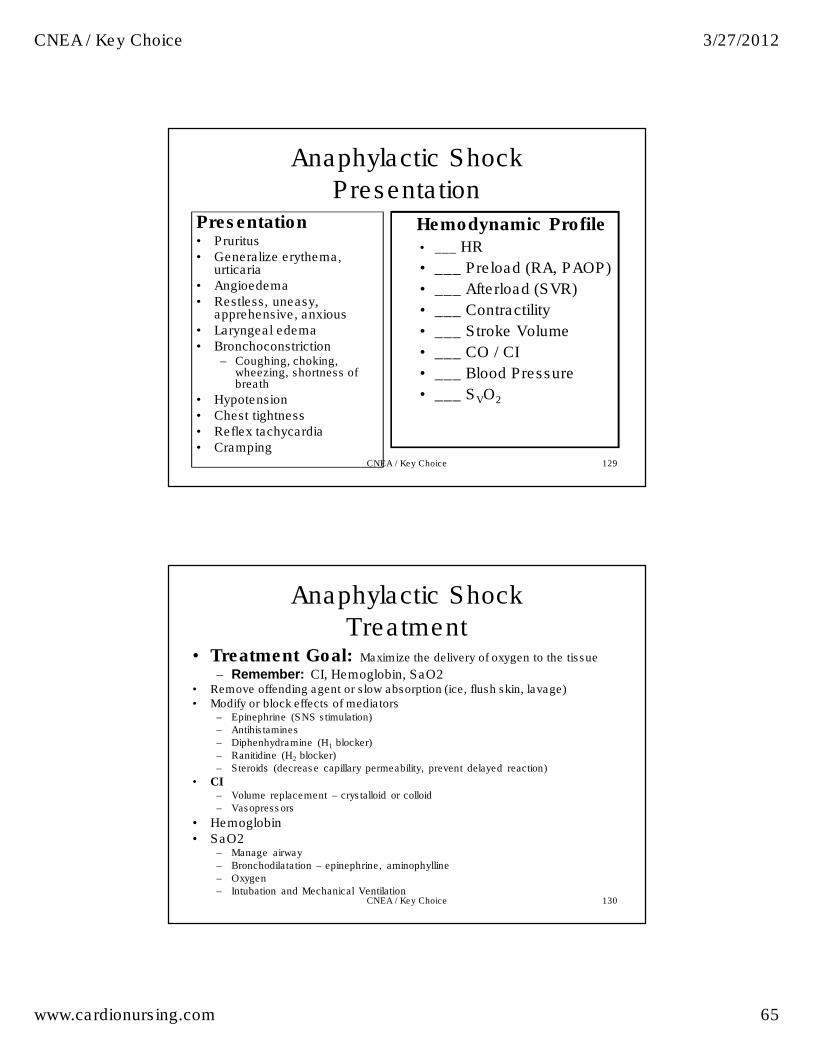
129
Anaphylactic Shock
PresentationPresentation• Pruritus• Generalize erythema,
urticaria • Angioedema• Restless, uneasy,
apprehensive, anxious• Laryngeal edema • Bronchoconstriction
– Coughing, choking, wheezing, shortness of breath
• Hypotension• Chest tightness• Reflex tachycardia• Cramping
Hemodynamic Profile• ___ HR
• ___ Preload (RA, PAOP)
• ___ Afterload (SVR)
• ___ Contractility
• ___ Stroke Volume
• ___ CO / CI
• ___ Blood Pressure
• ___ SVO2
CNEA / Key Choice
130
Anaphylactic Shock
Treatment• Treatment Goal: Maximize the delivery of oxygen to the tissue
– Remember: CI, Hemoglobin, SaO2• Remove offending agent or slow absorption (ice, flush skin, lavage) • Modify or block effects of mediators
– Epinephrine (SNS stimulation)
– Antihistamines
– Diphenhydramine (H1 blocker)
– Ranitidine (H2 blocker)
– Steroids (decrease capillary permeability, prevent delayed reaction)
• CI– Volume replacement – crystalloid or colloid
– Vasopressors
• Hemoglobin• SaO2
– Manage airway
– Bronchodilatation – epinephrine, aminophylline
– Oxygen
– Intubation and Mechanical Ventilation CNEA / Key Choice
CNEA / Key Choice 3/27/2012
www.cardionursing.com 66
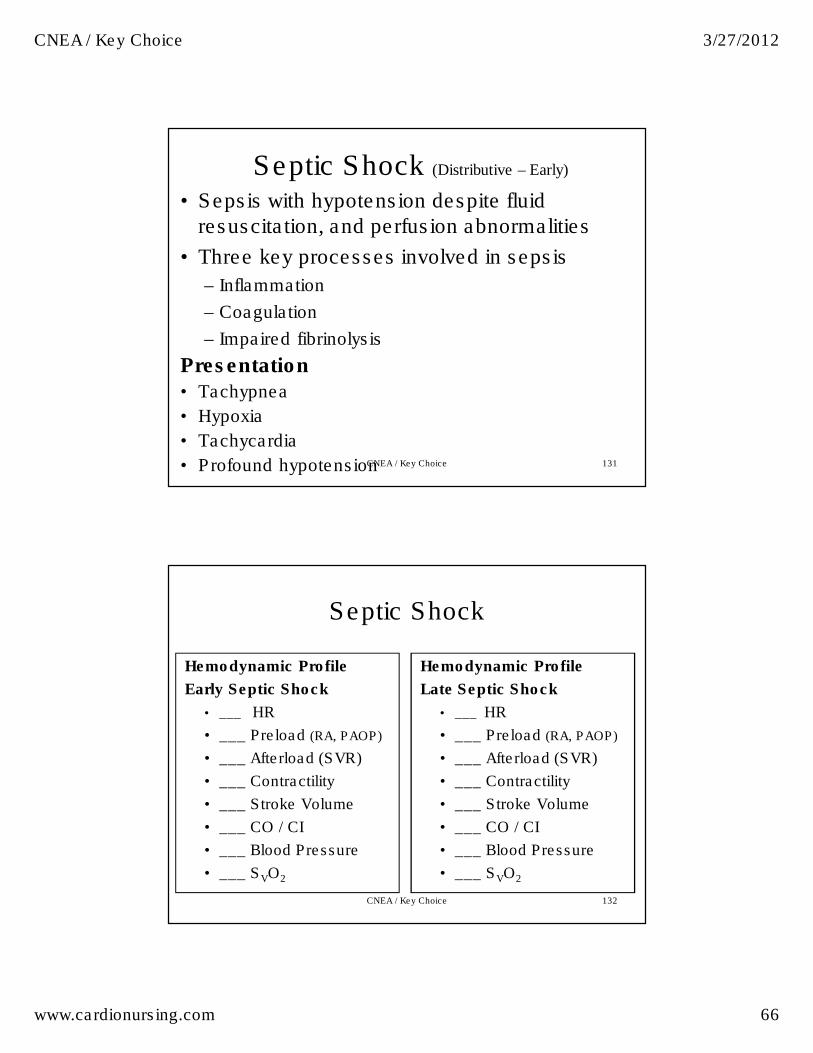
131
Septic Shock (Distributive – Early)
• Sepsis with hypotension despite fluid resuscitation, and perfusion abnormalities
• Three key processes involved in sepsis
– Inflammation
– Coagulation
– Impaired fibrinolysis
Presentation• Tachypnea
• Hypoxia
• Tachycardia
• Profound hypotensionCNEA / Key Choice
132
Septic Shock
Hemodynamic Profile
Early Septic Shock
• ___ HR
• ___ Preload (RA, PAOP)
• ___ Afterload (SVR)
• ___ Contractility
• ___ Stroke Volume
• ___ CO / CI
• ___ Blood Pressure
• ___ SVO2
Hemodynamic Profile
Late Septic Shock
• ___ HR
• ___ Preload (RA, PAOP)
• ___ Afterload (SVR)
• ___ Contractility
• ___ Stroke Volume
• ___ CO / CI
• ___ Blood Pressure
• ___ SVO2
CNEA / Key Choice
CNEA / Key Choice 3/27/2012
www.cardionursing.com 67
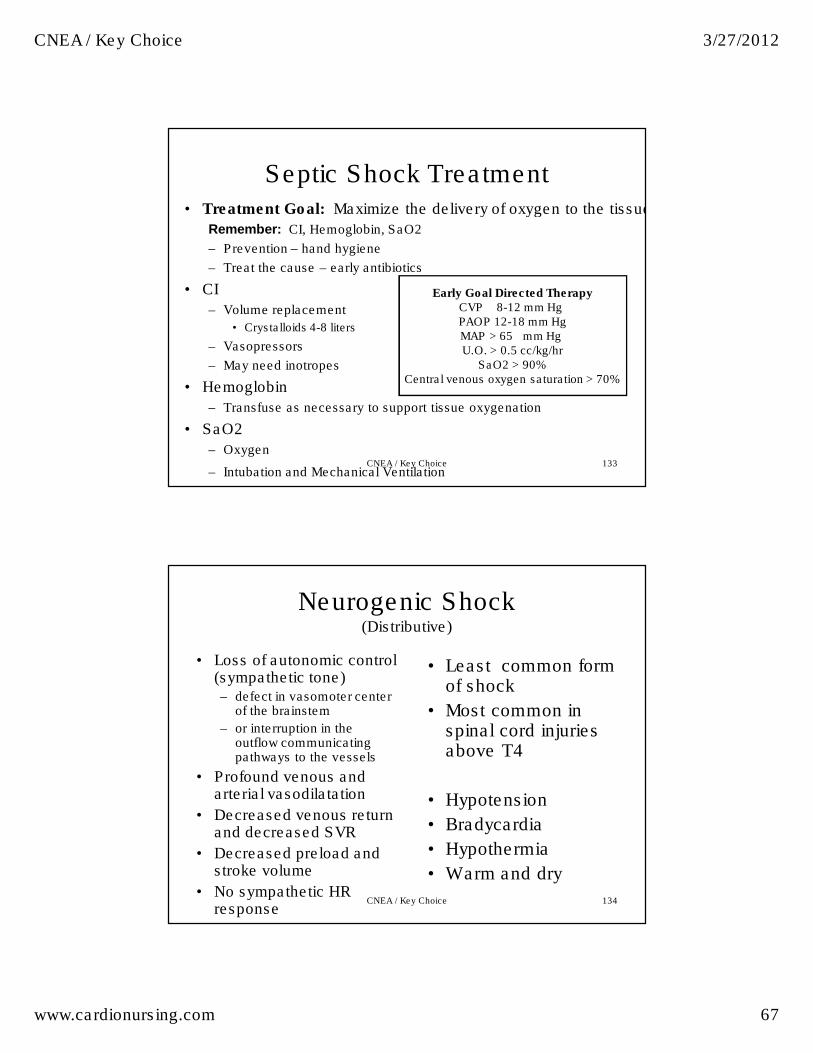
133
Septic Shock Treatment• Treatment Goal: Maximize the delivery of oxygen to the tissue
Remember: CI, Hemoglobin, SaO2
– Prevention – hand hygiene
– Treat the cause – early antibiotics
• CI
– Volume replacement
• Crystalloids 4-8 liters
– Vasopressors
– May need inotropes
• Hemoglobin
– Transfuse as necessary to support tissue oxygenation
• SaO2
– Oxygen
– Intubation and Mechanical Ventilation
Early Goal Directed TherapyCVP 8-12 mm Hg PAOP 12-18 mm HgMAP > 65 mm Hg U.O. > 0.5 cc/kg/hr
SaO2 > 90%Central venous oxygen saturation > 70%
CNEA / Key Choice
134
Neurogenic Shock(Distributive)
• Loss of autonomic control (sympathetic tone)– defect in vasomoter center
of the brainstem
– or interruption in the outflow communicating pathways to the vessels
• Profound venous and arterial vasodilatation
• Decreased venous return and decreased SVR
• Decreased preload and stroke volume
• No sympathetic HR response
• Least common form of shock
• Most common in spinal cord injuries above T4
• Hypotension
• Bradycardia
• Hypothermia
• Warm and dry
CNEA / Key Choice
CNEA / Key Choice 3/27/2012
www.cardionursing.com 68
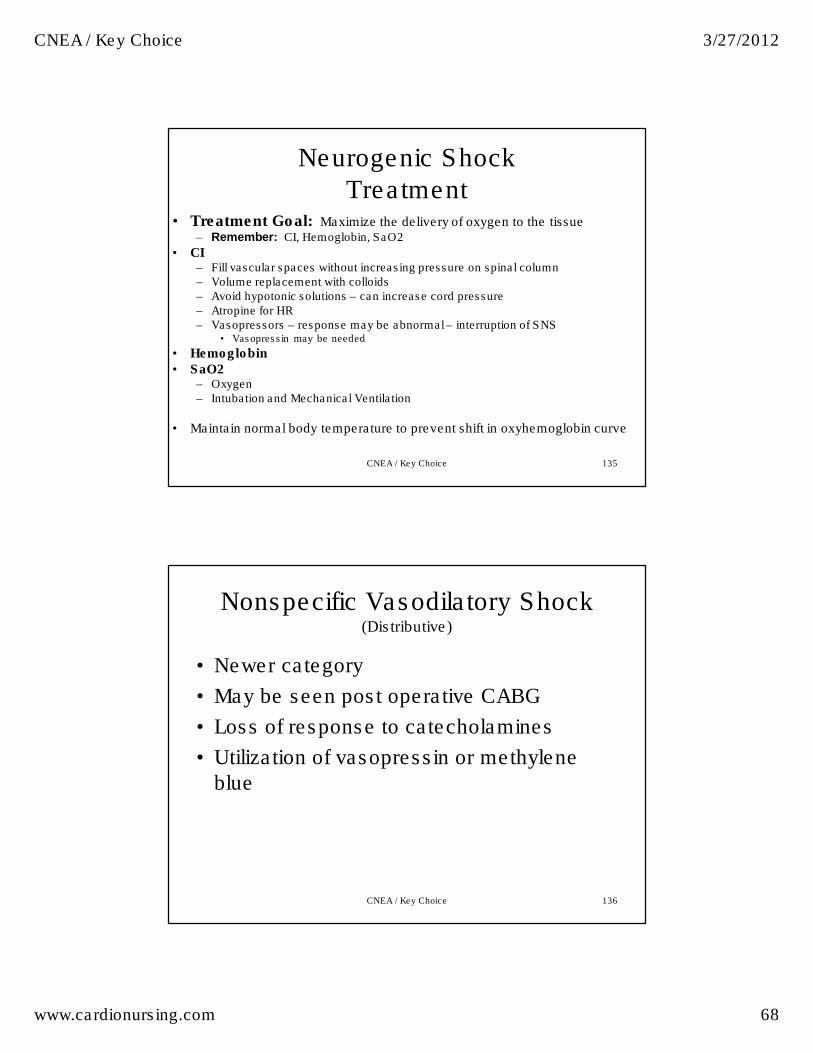
135
Neurogenic Shock
Treatment• Treatment Goal: Maximize the delivery of oxygen to the tissue
– Remember: CI, Hemoglobin, SaO2
• CI– Fill vascular spaces without increasing pressure on spinal column– Volume replacement with colloids– Avoid hypotonic solutions – can increase cord pressure– Atropine for HR – Vasopressors – response may be abnormal – interruption of SNS
• Vasopressin may be needed
• Hemoglobin• SaO2
– Oxygen – Intubation and Mechanical Ventilation
• Maintain normal body temperature to prevent shift in oxyhemoglobin curve
CNEA / Key Choice
136
Nonspecific Vasodilatory Shock (Distributive)
• Newer category
• May be seen post operative CABG
• Loss of response to catecholamines
• Utilization of vasopressin or methylene blue
CNEA / Key Choice
CNEA / Key Choice 3/27/2012
www.cardionursing.com 69
137
Obstructive Shock
• Obstruction of ventricular filling or obstruction of blood flow through the heart or great vessels resulting in decreased cardiac output– Pulmonary embolus
– Cardiac tamponade
– Constrictive pericarditis
– Pneumothorax
– Hemothorax
– Dissecting aneurysm
Treatment Focus
• Removing obstruction to flow– Surgery
– Fibrinolytic therapy
• Bedside cardiopulmonary bypass if CPR needed
CNEA / Key Choice
138
Linking Knowledge to Practice
And: Practice to Outcomes
CNEA / Key Choice
CNEA / Key Choice 3/27/2012
www.cardionursing.com 70
HEMODYNAMIC PROFILES
VARY BY TYPE OF SHOCK
CNEA / Key Choice 139
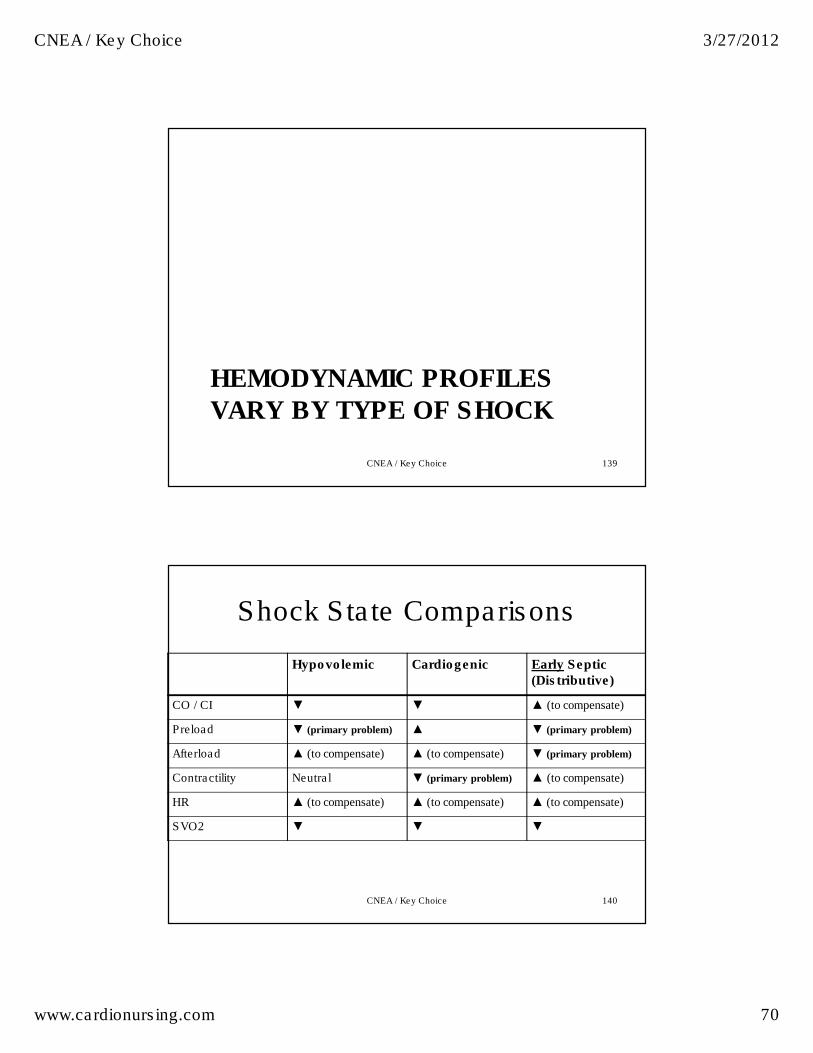
Shock State Comparisons
CNEA / Key Choice 140
Hypovolemic Cardiogenic Early Septic(Distributive)
CO / CI ▼ ▼ ▲ (to compensate)
Preload ▼ (primary problem) ▲ ▼ (primary problem)
Afterload ▲ (to compensate) ▲ (to compensate) ▼ (primary problem)
Contractility Neutral ▼ (primary problem) ▲ (to compensate)
HR ▲ (to compensate) ▲ (to compensate) ▲ (to compensate)
SVO2 ▼ ▼ ▼
CNEA / Key Choice 3/27/2012
www.cardionursing.com 71
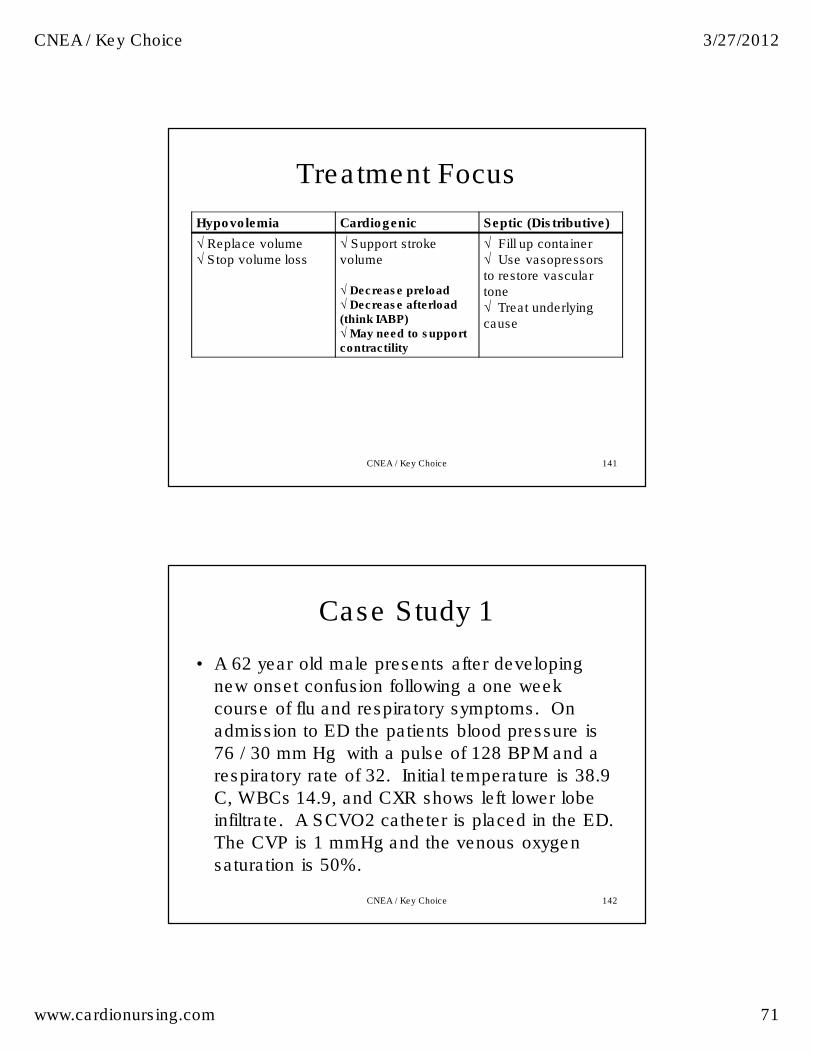
Treatment Focus
Hypovolemia Cardiogenic Septic (Distributive)
√ Replace volume √ Stop volume loss
√ Support stroke volume
√ Decrease preload √ Decrease afterload (think IABP) √ May need to support contractility
√ Fill up container √ Use vasopressorsto restore vascular tone √ Treat underlying cause
CNEA / Key Choice 141
142
Case Study 1
• A 62 year old male presents after developing
new onset confusion following a one week
course of flu and respiratory symptoms. On
admission to ED the patients blood pressure is
76 / 30 mm Hg with a pulse of 128 BPM and a
respiratory rate of 32. Initial temperature is 38.9
C, WBCs 14.9, and CXR shows left lower lobe
infiltrate. A SCVO2 catheter is placed in the ED.
The CVP is 1 mmHg and the venous oxygen
saturation is 50%.
CNEA / Key Choice
CNEA / Key Choice 3/27/2012
www.cardionursing.com 72
143
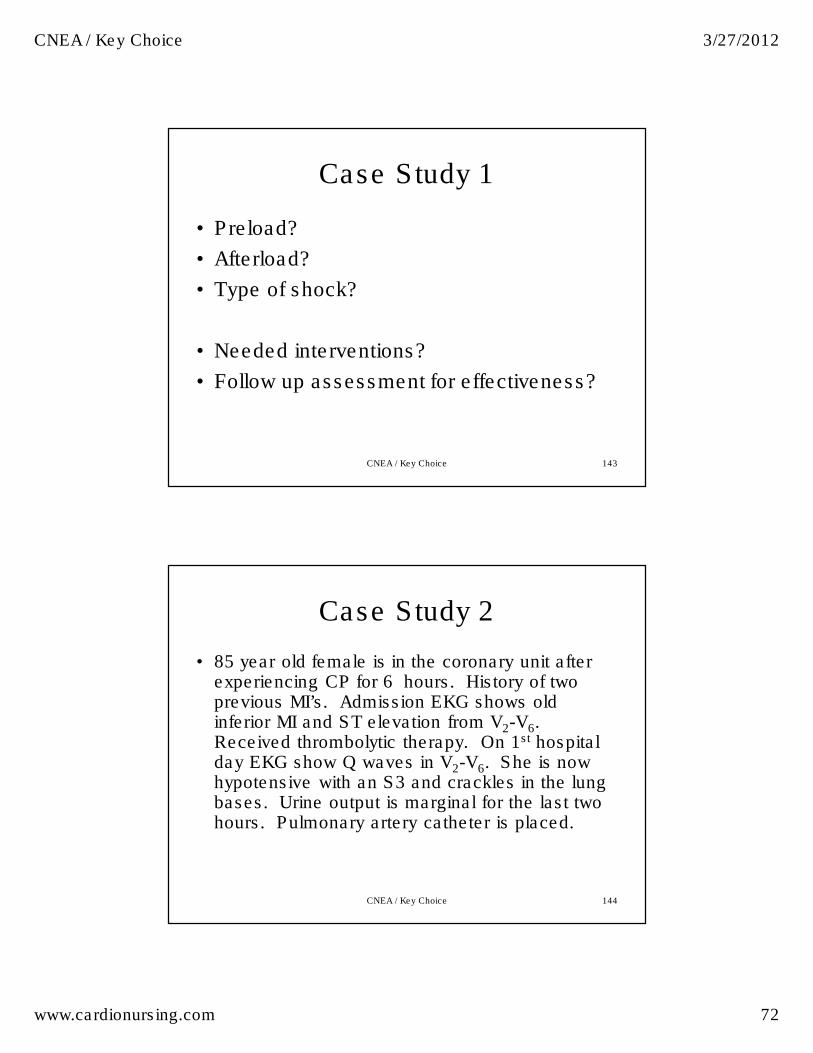
Case Study 1
• Preload?
• Afterload?
• Type of shock?
• Needed interventions?
• Follow up assessment for effectiveness?
CNEA / Key Choice
144
Case Study 2
• 85 year old female is in the coronary unit after experiencing CP for 6 hours. History of two previous MI’s. Admission EKG shows old inferior MI and ST elevation from V2-V6. Received thrombolytic therapy. On 1st hospital day EKG show Q waves in V2-V6. She is now hypotensive with an S3 and crackles in the lung bases. Urine output is marginal for the last two hours. Pulmonary artery catheter is placed.
CNEA / Key Choice
CNEA / Key Choice 3/27/2012
www.cardionursing.com 73
145
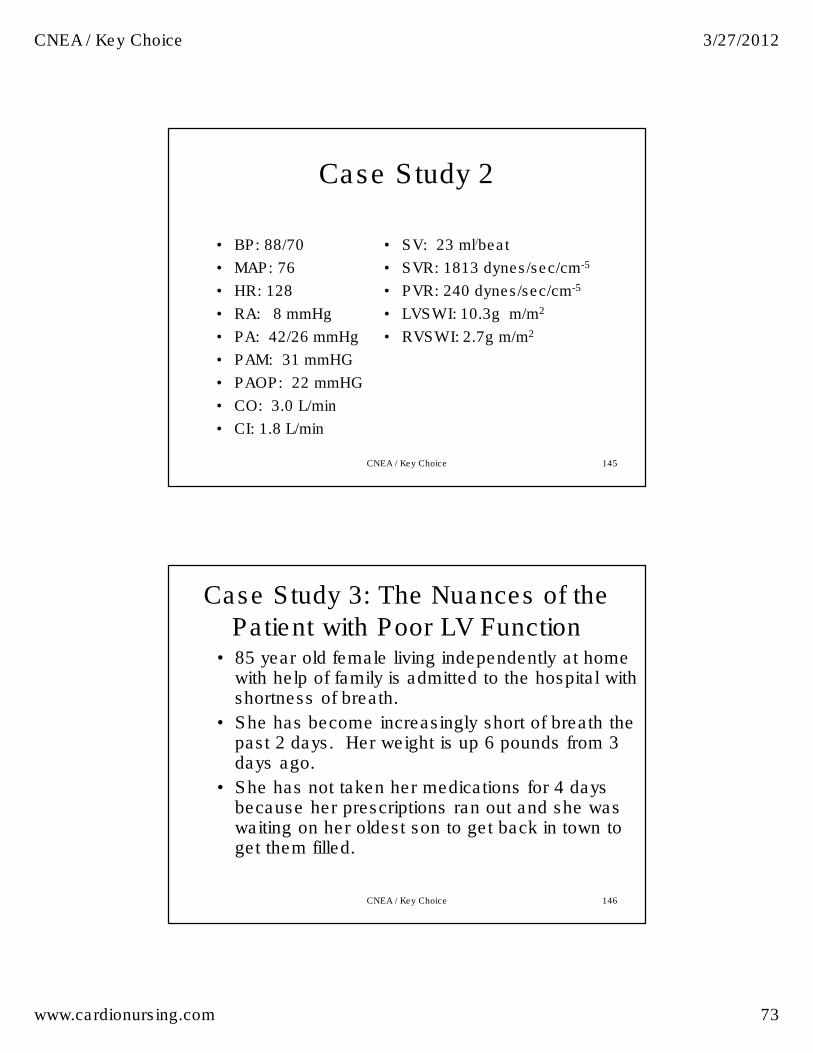
Case Study 2
• BP: 88/70
• MAP: 76
• HR: 128
• RA: 8 mmHg
• PA: 42/26 mmHg
• PAM: 31 mmHG
• PAOP: 22 mmHG
• CO: 3.0 L/min
• CI: 1.8 L/min
• SV: 23 ml/beat
• SVR: 1813 dynes/sec/cm-5
• PVR: 240 dynes/sec/cm-5
• LVSWI: 10.3g m/m2
• RVSWI: 2.7g m/m2
CNEA / Key Choice
Case Study 3: The Nuances of the
Patient with Poor LV Function • 85 year old female living independently at home
with help of family is admitted to the hospital with shortness of breath.
• She has become increasingly short of breath the past 2 days. Her weight is up 6 pounds from 3 days ago.
• She has not taken her medications for 4 days because her prescriptions ran out and she was waiting on her oldest son to get back in town to get them filled.
CNEA / Key Choice 146
CNEA / Key Choice 3/27/2012
www.cardionursing.com 74
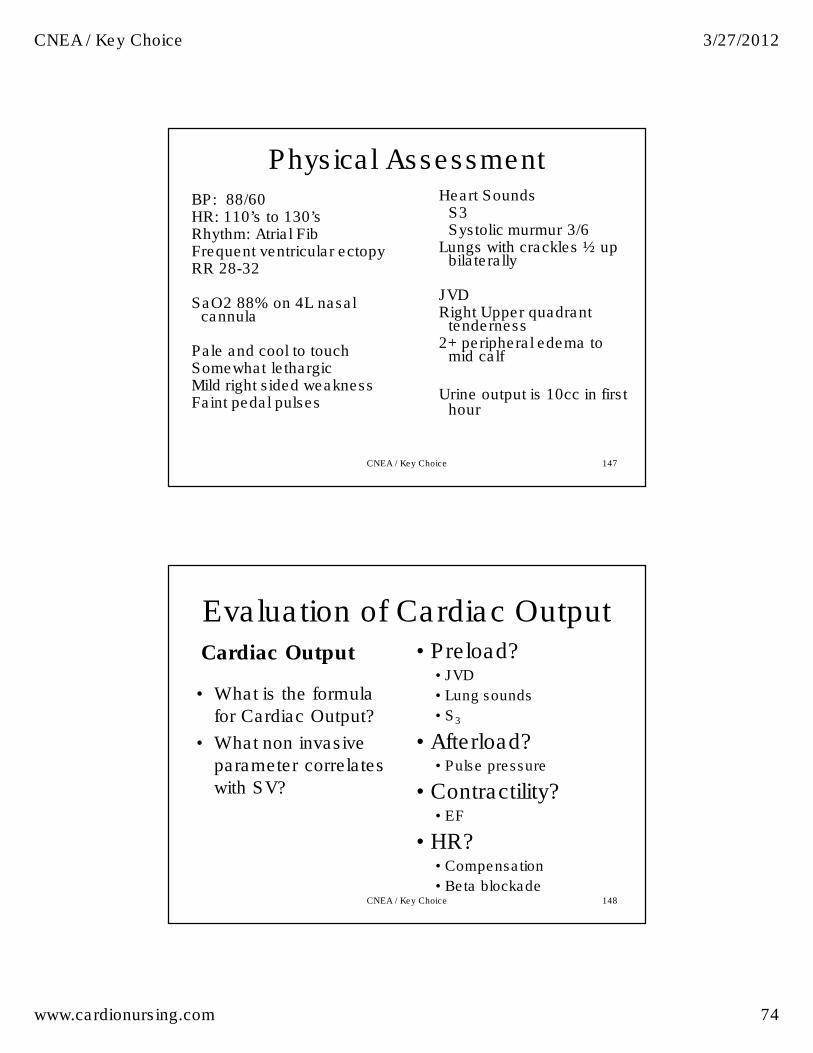
Physical Assessment
BP: 88/60 HR: 110’s to 130’sRhythm: Atrial Fib Frequent ventricular ectopyRR 28-32
SaO2 88% on 4L nasal cannula
Pale and cool to touch Somewhat lethargicMild right sided weaknessFaint pedal pulses
Heart SoundsS3Systolic murmur 3/6
Lungs with crackles ½ up bilaterally
JVDRight Upper quadrant
tenderness2+ peripheral edema to
mid calf
Urine output is 10cc in first hour
CNEA / Key Choice 147
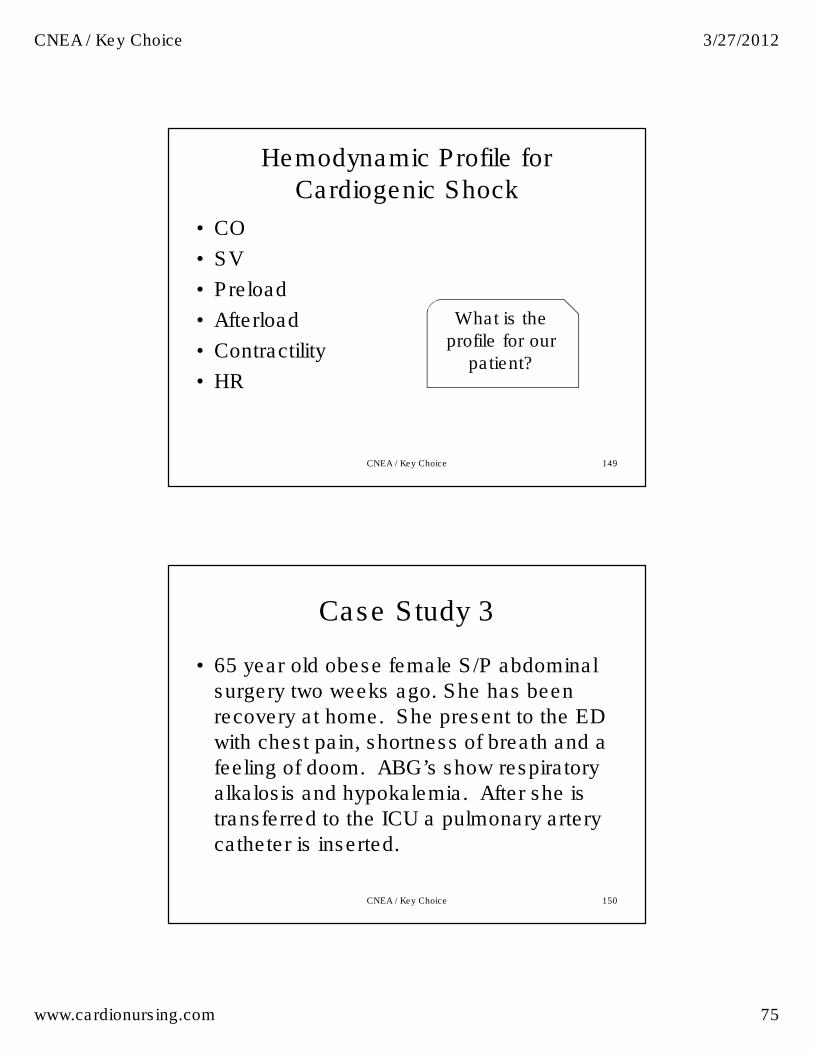
Evaluation of Cardiac Output Cardiac Output
• What is the formula
for Cardiac Output?
• What non invasive
parameter correlates
with SV?
• Preload? • JVD
• Lung sounds
• S3
• Afterload? • Pulse pressure
• Contractility?• EF
• HR? • Compensation
• Beta blockade CNEA / Key Choice 148
CNEA / Key Choice 3/27/2012
www.cardionursing.com 75
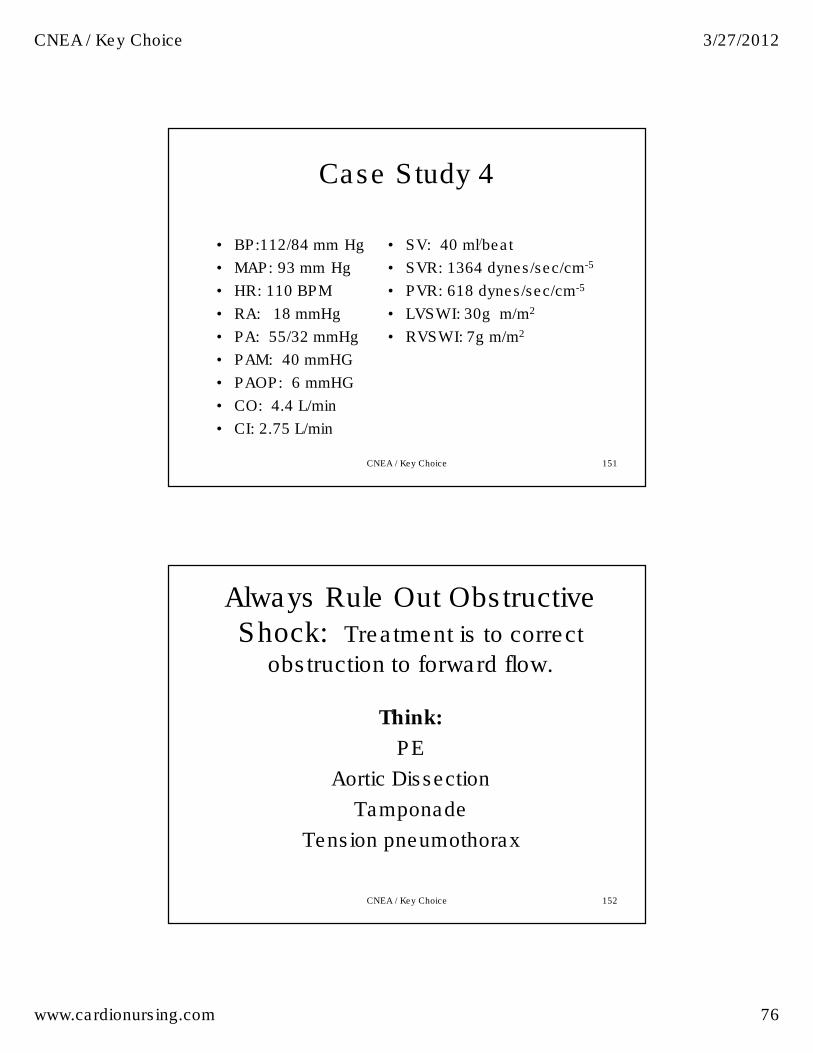
Hemodynamic Profile for
Cardiogenic Shock
• CO
• SV
• Preload
• Afterload
• Contractility
• HR
What is the
profile for our
patient?
CNEA / Key Choice 149
150
Case Study 3
• 65 year old obese female S/P abdominal surgery two weeks ago. She has been recovery at home. She present to the ED with chest pain, shortness of breath and a feeling of doom. ABG’s show respiratory alkalosis and hypokalemia. After she is transferred to the ICU a pulmonary artery catheter is inserted.
CNEA / Key Choice
CNEA / Key Choice 3/27/2012
www.cardionursing.com 76
151
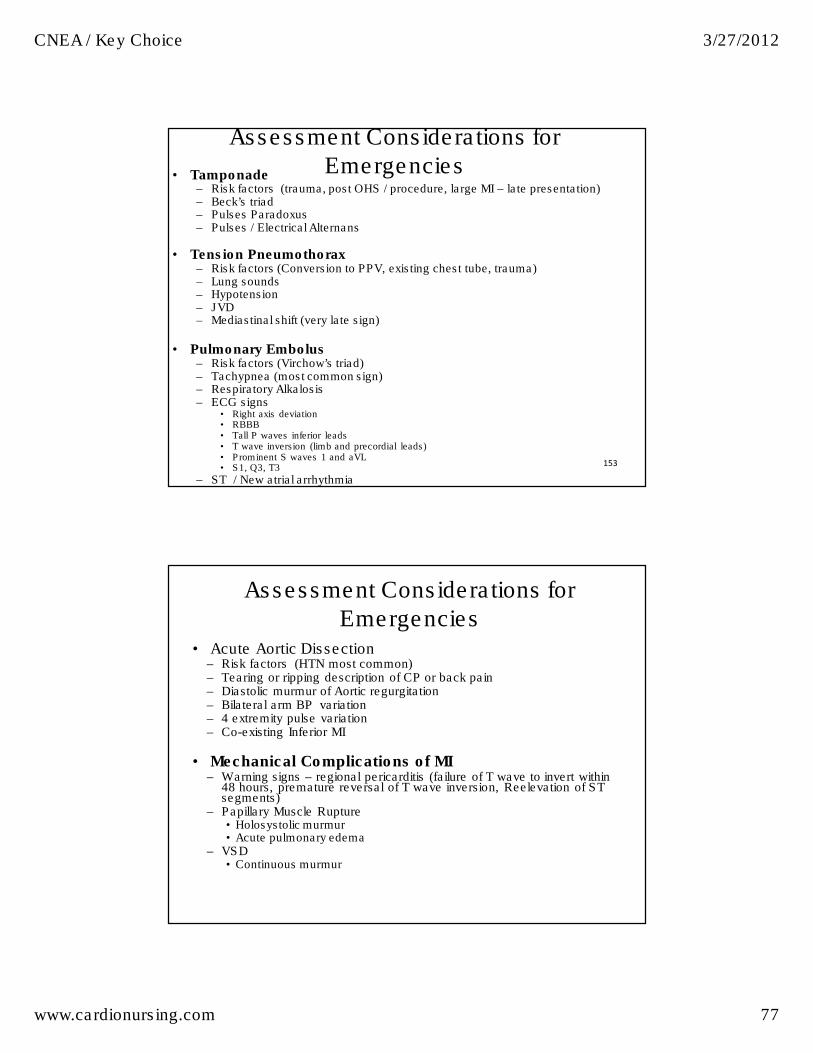
Case Study 4
• BP:112/84 mm Hg
• MAP: 93 mm Hg
• HR: 110 BPM
• RA: 18 mmHg
• PA: 55/32 mmHg
• PAM: 40 mmHG
• PAOP: 6 mmHG
• CO: 4.4 L/min
• CI: 2.75 L/min
• SV: 40 ml/beat
• SVR: 1364 dynes/sec/cm-5
• PVR: 618 dynes/sec/cm-5
• LVSWI: 30g m/m2
• RVSWI: 7g m/m2
CNEA / Key Choice
Always Rule Out Obstructive Shock: Treatment is to correct
obstruction to forward flow.
Think:
PE
Aortic Dissection
Tamponade
Tension pneumothorax
CNEA / Key Choice 152
CNEA / Key Choice 3/27/2012
www.cardionursing.com 77
153
Assessment Considerations for
Emergencies • Tamponade – Risk factors (trauma, post OHS / procedure, large MI – late presentation) – Beck’s triad – Pulses Paradoxus– Pulses / Electrical Alternans
• Tension Pneumothorax – Risk factors (Conversion to PPV, existing chest tube, trauma) – Lung sounds – Hypotension– JVD – Mediastinal shift (very late sign)
• Pulmonary Embolus – Risk factors (Virchow’s triad) – Tachypnea (most common sign) – Respiratory Alkalosis – ECG signs
• Right axis deviation • RBBB • Tall P waves inferior leads • T wave inversion (limb and precordial leads) • Prominent S waves 1 and aVL• S1, Q3, T3
– ST / New atrial arrhythmia
Assessment Considerations for
Emergencies• Acute Aortic Dissection
– Risk factors (HTN most common) – Tearing or ripping description of CP or back pain – Diastolic murmur of Aortic regurgitation – Bilateral arm BP variation – 4 extremity pulse variation – Co-existing Inferior MI
• Mechanical Complications of MI – Warning signs – regional pericarditis (failure of T wave to invert within
48 hours, premature reversal of T wave inversion, Reelevation of ST segments)
– Papillary Muscle Rupture • Holosystolic murmur • Acute pulmonary edema
– VSD • Continuous murmur

CNEA / Key Choice 3/27/2012
www.cardionursing.com 78
155
Knowing is not enough; we must apply.
Willing is not enough; we must do.
Johann Wolfgang von Goethe
CNEA / Key Choice