hemodilution, tonicity, andblood viscosity · hemodilution, tonicity, andblood viscosity* ......
TRANSCRIPT
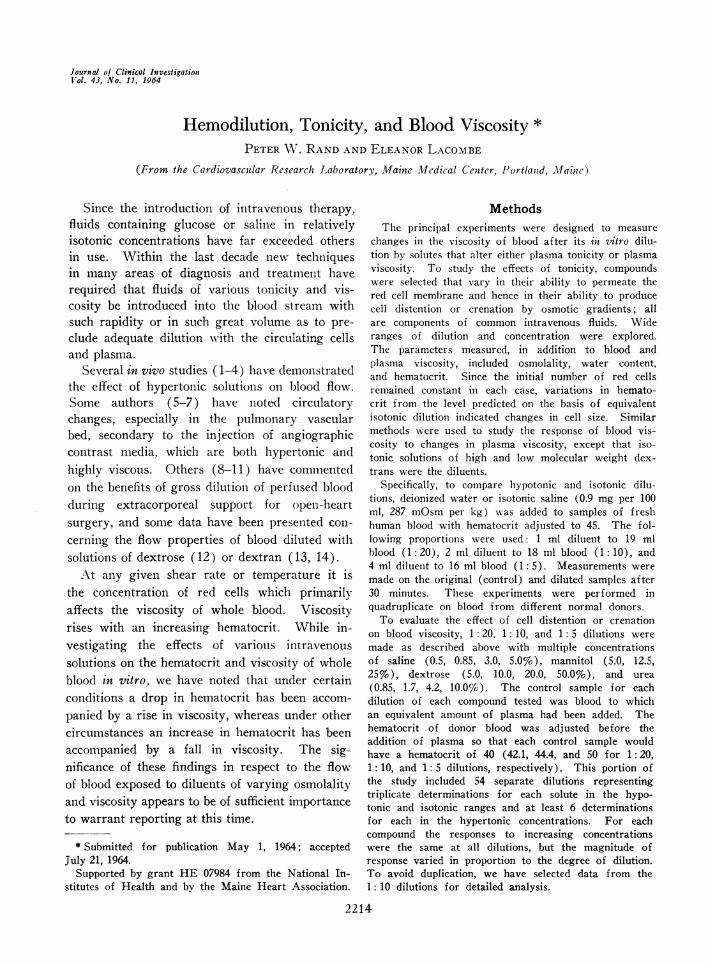
Journal of Clinical InvestigationVol. 43, No. 11, 1964
Hemodilution, Tonicity, and Blood Viscosity *
PETERW. RANDANDELEANORLACOMBE
(From the Cardiovascular Research Laboratory, Maine Medical Center, Portland, Mlaine)
Since the introduction of intravenous therapy,fluids containing glucose or saline in relativelyisotonic concentrations have far exceeded othersin use. Within the last decade new techniquesin many areas of diagnosis and treatment haverequired that fluids of various tonicity and vis-cosity be introduced into the blood stream withsuch rapidity or in such great volume as to pre-clude adequate dilution with the circulating cellsand plasma.
Several in vivo studies (1-4) have demonstratedthe effect of hypertonic solutions on blood flow.Some authors (5-7) have noted circulatorychanges, especially in the pulmonary vascularbed, secondary to the injection of angiographiccontrast media, which are both hypertonic andhighly viscous. Others (8-11) have commentedon the benefits of gross dilution of perfused bloodduring extracorporeal support for open-heartsurgery, and some data have been presented con-cerning the flow properties of blood diluted withsolutions of dextrose (12) or dextran (13, 14).
At any given shear rate or temperature it isthe concentration of red cells which primarilyaffects the viscosity of whole blood. Viscosityrises with an increasing hematocrit. While in-vestigating the effects of various intravenoussolutions on the hematocrit and viscosity of wholeblood in vitro, we have noted that under certainconditions a drop in hematocrit has been accom-panied by a rise in viscosity, whereas under othercircumstances an increase in hematocrit has beenaccompanied by a fall in viscosity. The sig-nificance of these findings in respect to the flowof blood exposed to diluents of varying osmolalityand viscosity appears to be of sufficient importanceto warrant reporting at this time.
* Submitted for publication May 1, 1964; acceptedJuly 21, 1964.
Supported by grant HE 07984 from the National In-stitutes of Health and bv the Maine Heart Association.
MethodsThe principal experiments were designed to measure
changes in the viscosity of blood after its in vitro dilu-tion by solutes that alter either plasma tonicity or plasmaviscosity. To study the effects of tonicity, compoundswere selected that vary in their ability to permeate thered cell membrane and hence in their ability to producecell distention or creation by osmotic gradients; allare components of common intravenous fluids. Wideranges of dilution and concentration were explored.The parameters measured, in addition to blood andplasma viscosity, included osmolality, water content,and hematocrit. Since the initial number of red cellsremained constant in each case, variations in hemato-crit from the level predicted on the basis of equivalentisotonic dilution indicated changes in cell size. Similarmethods were used to study the response of blood vis-cosity to changes in plasma viscosity, except that iso-tonic solutions of high and low molecular weight dex-trans were the diluents.
Specifically, to compare hypotonic and isotonic dilu-tions, deionized water or isotonic saline (0.9 mg per 100ml, 287 mOsmper kg) was added to samples of f reshhuman blood with hematocrit adjusted to 45. The fol-lowing proportions were used: 1 ml diluent to 19 mlblood (1:20), 2 ml diluent to 18 ml blood (1:10), and4 ml diluent to 16 ml blood (1: 5). Measurements weremade on the original (control) and diluted samples after30 minutes. These experiments were performed inquadruplicate on blood from different normal donors.
To evaluate the effect of cell distention or creationon blood viscosity, 1: 20, 1: 10, and 1: 5 dilutions weremade as described above with multiple concentrationsof saline (0.5, 0.85, 3.0, 5.0%), mannitol (5.0, 12.5,25%o), dextrose (5.0, 10.0, 20.0, 50.0%), and urea(0.85, 1.7, 4.2, 10.0%). The control sample for eachdilution of each compound tested was blood to whichan equivalent amount of plasma had been added. Thehematocrit of donor blood was adjusted before theaddition of plasma so that each control sample wouldhave a hematocrit of 40 (42.1, 44.4, and 50 for 1: 20,1: 10, and 1: 5 dilutions, respectively). This portion ofthe study included 54 separate dilutions representingtriplicate determinations for each solute in the hypo-tonic and isotonic ranges and at least 6 determinationsfor each in the hypertonic concentrations. For eachcompound the responses to increasing concentrationswere the same at all dilutions, but the magnitude ofresponse varied in proportion to the degree of dilution.To avoid duplication, we have selected data from the1: 10 dilutions for detailed analysis.
2214
HEMODILUTION, TONICITY, AND BLOODVISCOSITY
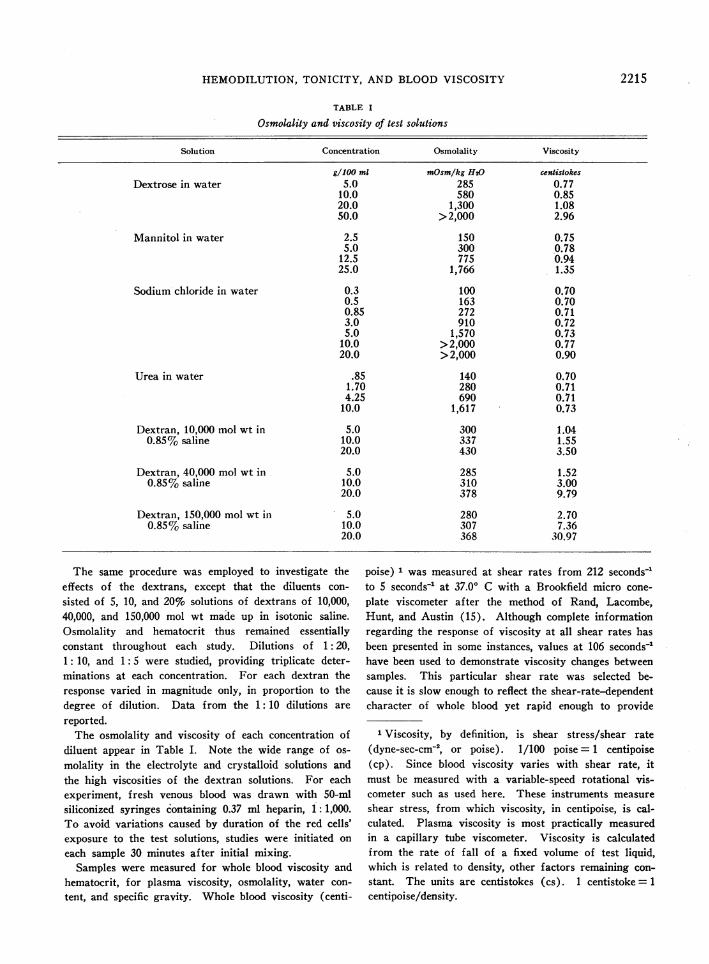
TABLE I
Osmolality and viscosity of test solutions
Solution Concentration Osmolality Viscosity
g/100 ml mOsm/kg H20 centistokesDextrose in water 5.0 285 0.77
10.0 580 0.8520.0 1,300 1.0850.0 >2,000 2.96
Mannitol in water 2.5 150 0.755.0 300 0.78
12.5 775 0.9425.0 1,766 1.35
Sodium chloride in water 0.3 100 0.700.5 163 0.700.85 272 0.713.0 910 0.725.0 1,570 0.73
10.0 >2,000 0.7720.0 >2,000 0.90
Urea in water .85 140 0.701.70 280 0.714.25 690 0.71
10.0 1,617 0.73
Dextran, 10,000 mol wt in 5.0 300 1.040.85% saline 10.0 337 1.55
20.0 430 3.50
Dextran, 40,000 mol wt in 5.0 285 1.520.85% saline 10.0 310 3.00
20.0 378 9.79
Dextran, 150,000 mol wt in 5.0 280 2.700.85% saline 10.0 307 7.36
20.0 368 30.97
The same procedure was employed to investigate theeffects of the dextrans, except that the diluents con-sisted of 5, 10, and 20% solutions of dextrans of 10,000,40,000, and 150,000 mol wt made up in isotonic saline.Osmolality and hematocrit thus remained essentiallyconstant throughout each study. Dilutions of 1:20,1: 10, and 1: 5 were studied, providing triplicate deter-minations at each concentration. For each dextran theresponse varied in magnitude only, in proportion to thedegree of dilution. Data from the 1: 10 dilutions are
reported.The osmolality and viscosity of each concentration of
diluent appear in Table I. Note the wide range of os-molality in the electrolyte and crystalloid solutions andthe high viscosities of the dextran solutions. For eachexperiment, fresh venous blood was drawn with 50-mlsiliconized syringes containing 0.37 ml heparin, 1: 1,000.To avoid variations caused by duration of the red cells'exposure to the test solutions, studies were initiated oneach sample 30 minutes after initial mixing.
Samples were measured for whole blood viscosity andhematocrit, for plasma viscosity, osmolality, water con-tent, and specific gravity. Whole blood viscosity (centi-
poise) 1 was measured at shear rates from 212 seconds-1to 5 seconds-1 at 37.00 C with a Brookfield micro cone-plate viscometer after the method of Rand, Lacombe,Hunt, and Austin (15). Although complete informationregarding the response of viscosity at all shear rates hasbeen presented in some instances, values at 106 seconds-1have been used to demonstrate viscosity changes betweensamples. This particular shear rate was selected be-cause it is slow enough to reflect the shear-rate-dependentcharacter of whole blood yet rapid enough to provide
1 Viscosity, by definition, is shear stress/shear rate(dyne-sec-cm- , or poise). 1/100 poise = 1 centipoise(cp). Since blood viscosity varies with shear rate, itmust be measured with a variable-speed rotational vis-cometer such as used here. These instruments measureshear stress, from which viscosity, in centipoise, is cal-culated. Plasma viscosity is most practically measuredin a capillary tube viscometer. Viscosity is calculatedfrom the rate of fall of a fixed volume of test liquid,which is related to density, other factors remaining con-stant. The units are centistokes (cs). 1 centistoke = 1centipoise/density.
2215
PETER W. RANDANDELEANORLACOMBE
excellent reproducibility throughout the hematocritrange involved. Normal values at this shear rate (Ta-ble II) and normal viscosity-shear-rate curves for each
hematocrit were derived from data previously obtainedin this laboratory (15).
Plasma viscosity (centistokes) was measured at 370 C
40. 8
.0-to 40
35
5.0
to 0
o toa W
'~ _ 4.0
3.0
300
° " 250
2c E
to 200
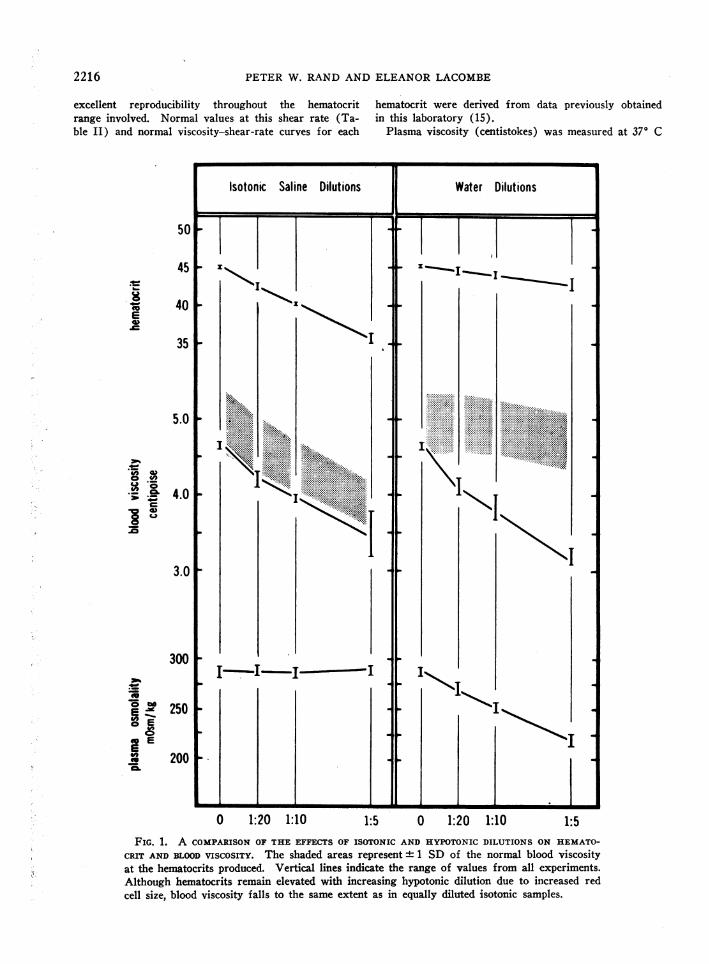
0 1:20 1:10 1:5 0 1:20 1:10FIG. 1. A COMPARISONOF THE EFFECTS OF ISOTONIC AND HYPOTONICDILUTIONS ON HEMATO-
CRIT AND BLOODVISCOSITY. The shaded areas represent 1 SD of the normal blood viscosityat the hematocrits produced. Vertical lines indicate the range of values from all experiments.Although hematocrits remain elevated with increasing hypotonic dilution due to increased redcell size, blood viscosity falls to the same extent as in equally diluted isotonic samples.
1:5
2216
HEMODILUTION, TONICITY, AND BLOODVISCOSITY
42 1
401
38 1
36 t
34!1
321
30
C4= C') CD.on Lee o 0 e t U) L)
plasma osmolality - mOsm/kg
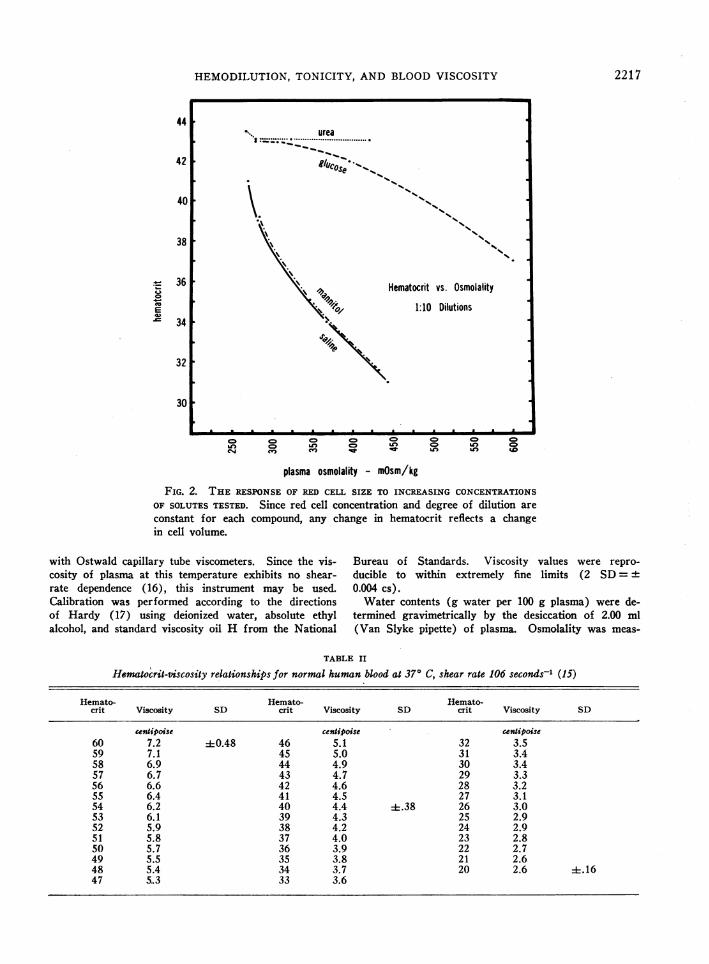
FIG. 2. THE RESPONSEOF RED CELL SIZE TO INCREASING CONCENTRATIONS
OF SOLUTESTESTED. Since red cell concentration and degree of dilution are
constant for each compound, any change in hematocrit reflects a changein cell volume.
with Ostwald capillary tube viscometers. Since the vis-cosity of plasma at this temperature exhibits no shear-rate dependence (16), this instrument may be used.Calibration was performed according to the directionsof Hardy (17) using deionized water, absolute ethylalcohol, and standard viscosity oil H from the National
Bureau of Standards. Viscosity values were repro-
ducible to within extremely fine limits (2 SD=+0.004 cs).
Water contents (g water per 100 g plasma) were de-termined gravimetrically by the desiccation of 2.00 ml(Van Slyke pipette) of plasma. Osmolality was meas-
TABLE II
Hematocrit-viscosity relationships for normal human blood at 370 C, shear rate 106 seconds-' (15)
Hemato- Hemato- Hemato-crit Viscosity SD crit Viscosity SD crit Viscosity SD
centipoisc centipoisc centipoise60 7.2 -0.48 46 S.1 32 3.559 7.1 45 5.0 31 3.458 6.9 44 4.9 30 3.457 6.7 43 4.7 29 3.356 6.6 42 4.6 28 3.255 6.4 41 4.5 27 3.154 6.2 40 4.4 :i.38 26 3.053 6.1 39 4.3 25 2.952 5.9 38 4.2 24 2.951 5.8 37 4.0 23 2.850 5.7 36 3.9 22 2.749 5.5 35 3.8 21 2.648 5.4 34 3.7 20 2.6 +.1647 5,.3 33 3.6
44urea
I:..... ................
0@C°e %%s
\_ ,, Hematocrit vs. Osmolality
Ai /atop 1:10 Dilutions-
oEwu
2217
PETER W. RANDAND ELEANORLACOMBE
2 4nH O
/' .i I____ _ _ / _ _ _ _ _ _
,/ /
6 //_CJ ~~~~/ _ _ _ _ _ _ _ _ _' _X'' \/Ifi ................ 0 . f;...f a...
.:.S i:. \A......tV
00.. ..
.E.:. .-
, \ ;;, \ f , , \, \ 0 :0.E .. 00 , I \Ca:. 0V .. : ff , , \, 7 .. V . . ., .. fitV DiR , I \, o; .. S ,, .} i 0: . 00 f ... >. . . ..... ..j .. i.t i i : .... 7-
\ De.S / \ /* * * --
W1.r C" - _
AwsOxz wq !^3d
L.!somh. Pooq 3si m odIii3oeuwq
Ca4 ;wse
isles owsfld
CD CD Cr a
II/ WSOW
APqlouno ewsold
o ,
z Cd
0f 0CZ1*4V
4-C
..
" U U
3 o d
O'OZ Z QUZ CZ
0-0 O v;0 0
O'SZ
0U-4
mo20,2
0.2\o2
Z' C
cd O
0.
242z O
2.)0 h
o0-4 4 4
V)
3 r o. 2.
0£ o °
u bID2
mo .- o4 2
Uk£ 02.)Q
2218
I} . *I I I I I I I I . . . . . . . . . . I I
W
-j
HEMODILUTION, TONICITY, AND BLOODVISCOSITY
ured cryoscopically with a Fiske osmometer. Hemato-crits were determined by the Wintrobe technique.
Results
Isotonic and hypotonic dilution (Figure 1).When increasing volumes of either plasma orisotonic saline are added to whole blood, a pre-dictable linear drop in hematocrit occurs. Withsaline dilution, however, plasma undergoes an in-crease in water concentration, a decrease in pro-tein concentration, and a fall in viscosity. As aresult, the viscosity of this blood remains lowerthan that of whole blood equally diluted withplasma.
Although the same plasma changes take placewhen equivalent dilutions are made with deionizedwater, the fall in hematocrit is delayed due to os-motic swelling of the red cells. Despite this in-crease in red cell size, viscosity decreases to thesame extent as it does with equal isotonic dilu-tion. Further examples of decreased viscosityin the face of hypotonic dilutions and osmoticallydistended cells are provided by hypotonic dilutionsof solutes tested in the subsequent series of ex-periments (see Figure 3).
Hypertonic dilution. In hypertonic concen-trations, each of the solutes used in this study dif-fers in its effect on red cell size. This is bestdemonstrated by noting the change in hematocritthat results from equal dilution of identical bloodsamples with increasingly concentrated solutions.These relationships are presented in Figure 2.As osmolality increases, the hematocrit responsewill depend on the permeability of the red cellmembrane to the particle in question. If it isfreely diffusible, as in the case of urea, no osmoticgradients will prevail, and cell size will not dimin-ish; if it cannot enter the cells, as exemplified bymannitol, water will be extracted, cells will cre-nate, and hematocrit will fall.
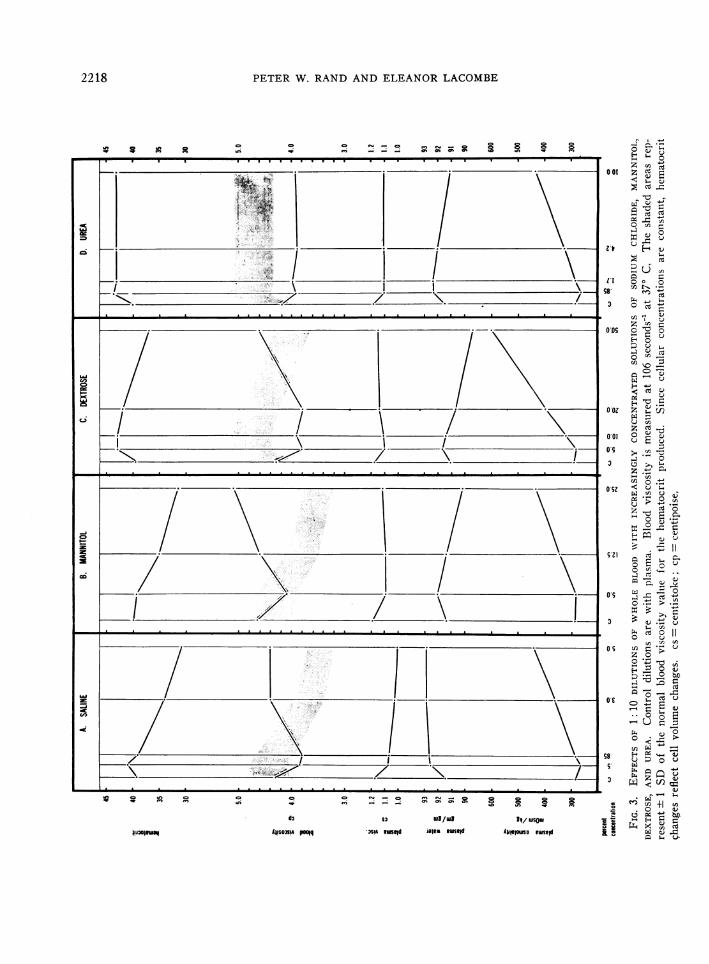
Saline (Figure 3A). When increasingly con-centrated samples of saline are used to make 1: 10dilutions with whole blood, hematocrit dropsrapidly. As has been previously shown, dilutionsin the hypotonic and isotonic range make the bloodless viscid. Despite the continuing fall in hemato-crit, however, blood viscosity begins to rise as theplasma is made more hypertonic. The viscouseffect of aqueous plasma dilution is overcome as
plasma osmolality exceeds 350 mOsmper kg.Beyond this point the viscosity of these mixturesremains well above the levels that would be ex-pected in undiluted blood at similar hematocrits.Sodium chloride appears to differ from other com-pounds tested in that it fails to produce a furtherrise in viscosity at extreme degrees of hyper-tonicity.
Mannitol (Figure 3B). As creation is pro-duced by increasingly hypertonic solutions ofmannitol, hematocrit falls, and, as in the studieswith sodium chloride, viscosity rises. With man-nitol the viscosity rise continues in the extremelyhypertonic samples. No change in the upwardslope of the viscosity curve was seen with plasmaosmolalities as high as 600 mOsmper kg. Thelarger size of the mannitol molecule creates aslight increase in plasma viscosity and a decrease(by displacement) of plasma water. Neither ofthese changes seems of sufficient magnitude to af-fect whole blood viscosity.
Dextrose (Figure 3C). Since the red cellmembrane is, to a degree, permeable to dextrose,creation will not occur until plasma osmolalityhas been elevated to moderately hypertonic levelsby the addition of increasingly concentrated solu-tions. While the red cells are swollen with addeddextrose and water, blood viscosity remains de-pressed by plasma dilution. After exposure toplasma above 400 mOsmper kg, creation occursand blood viscosity increases. As in the case ofmannitol, the rise is linear and remains so inextremely hypertonic samples (953 mOsmperkg). Changes in plasma water and viscosityagain do not seem sufficient to explain the degreeof blood viscosity change.
Urea (Figure 3D). Although urea is an os-motically active particle, it is freely diffusibleacross the red cell membrane and therefore willnot produce creation when present in hyper-tonic concentrations in the plasma. The rise inhematocrit observed in the urea dilutions is pro-portional not to its concentration (since no osmoticgradients are formed) but to the degree to whichits aqueous solvent dilutes the plasma. The he-matocrit remains at a constant level above thecontrol as plasma osmolality increases to at least600 mOsmper kg (reached in the 1: 5 dilution).With no creation occurring despite hypertonicity,
2219
PETER W. RANDANDELEANORLACOMBE
plei O
CDC-4
IIII ,I-L I9 I
424038
75
7.0
6.5
6.0
5.5
5.0
4.5
4.0
24
20
16
1.2
92
9190
350
300
250
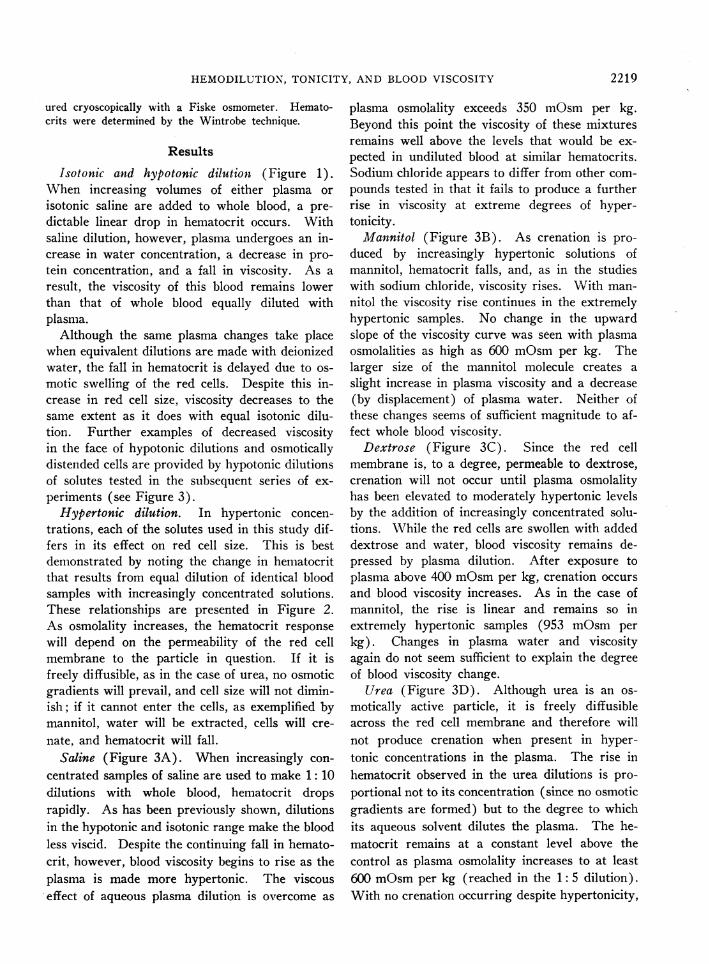
FIG. 4. EFFECTS OF 1: 10 ISOTONIC DILUTIONS OF WHOLEBLOOD WITH INCREASINGLY VISCID DEXTRAN SOLUTIONS_Data are presented as in Figure 3.
the viscosity of the blood remains at its dilutedlevel well below the control values. Again, changesin plasma viscosity are unremarkable.
Hypertonicity and hematocrit. When red cellconcentrations in normal blood exceed 50%, vis-cosity values rise sharply. The viscous response
to hypertonic dilution might be expected to beconsiderably greater as hematocrits increase. Toexplore this point, we compared the changes inblood viscosity caused by diluting (1: 10) samplesof blood at different hematocrits with 5% saline.Initial hematocrits were adjusted so that afterequal isotonic dilution (control) the per cent vol-
ume of red cells would approach either 40 or 50.The results of this study demonstrate (Table III)that the increase in viscosity after hypertonic di-lution is indeed greater at higher hematocrits.Furthermore, this change takes place despite a
drastic reduction in hematocrit secondary towcrenation.
Dilution with dextrans (Figure 4). In previ-ous experiments whole blood viscosity has beenchanged by osmotic effects. By using dextransof various molecular weights, solutions were madeup with physiologic saline that were essentiallyisotonic (hematocrits remained constant) yet
2220
- 4240
E38
7. 5
7.0
6. 5
6.0 [
5.5 [
5.0 i
4.5 j
4.0 1
A. DEXTRAN 10,000 mol wgt B: DEXTRAN 40.000 mol wgt C: DEXTRAN 150,000 md wgt
,- ~ .. lEXTANl1~oIlgtIr -
*_ -
2.4
2.0
1 6
1.2
E b ' 92la , 91
90
_ 350*E 300
°E 250
percentconcentration
C? C. C.C) C-1. In 2
1,
%r.i., .
HEMODILUTION, TONICITY, AND BLOODVISCOSITY
A. SALINE DILUTIONS
6.0
5.0 _
10.0
9.0
8.0 _
7.0 _
._VI
a
us
30
4.0
3.0
I: B. DEXTRAN DILUTIONS
.
I Dextran 150,000 mol wgt-1-10|hct3
'4.
'4.
.5 42 106 212 5 42 106 212
shear rate - inverse seconds
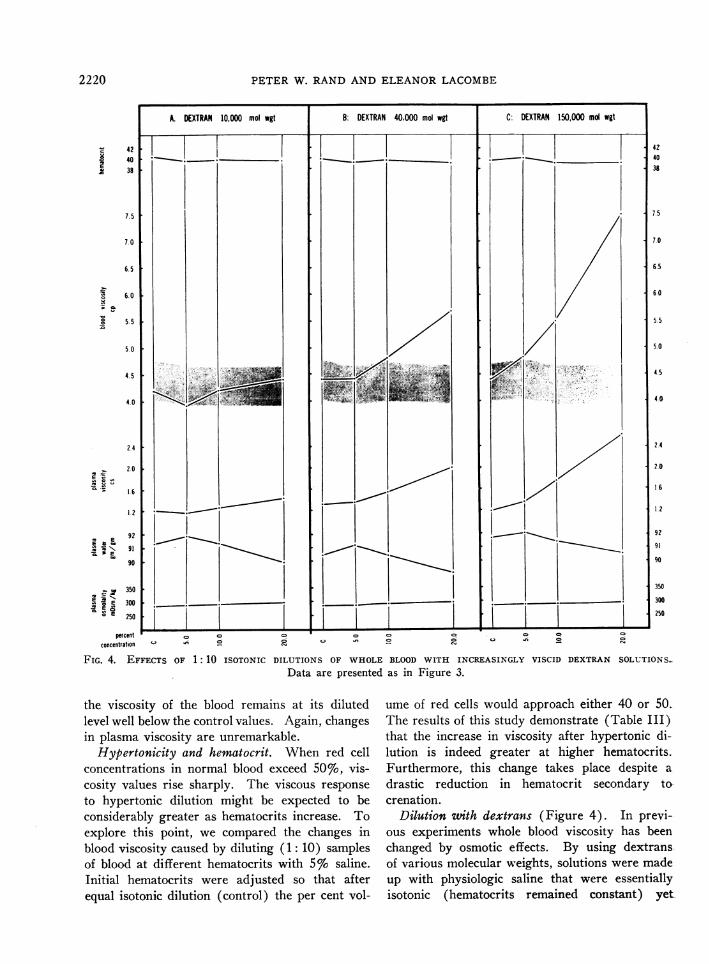
FIG. 5. SHEAR-RATEDEPENDENCEOF DILUTED BLOOD. A) EFFECTS OF ISO-
TONIC AND HYPERTONICSOLUTIONS. B) EFFECTS OF ISOTONIC DILUTION WITH
LOW AND HIGH MOLECULARWEIGHT DEXTRANS. Control samples in eachstudy are equal dilutions with plasma. hct = hematocrit.
varied greatly in viscosity. By diluting bloodwith these solutions we hoped to examine the re-
lationship between plasma viscosity and wholeblood viscosity.
The rise in plasma viscosity, even in the lowmolecular weight dextran dilutions, was markedin comparison to the previous studies. Bloodviscosity showed the effects of aqueous dilutiononly in the 5% concentrations of 10,000 mol wtdextran. In all other cases it demonstrated a
marked rise, the slope of which increased withthe molecular weight of the dextran employed.Since the dextrans are thought to have significantthough varying effects on the attractive forcesbetween red cells (18, 19), it should not be con-
cluded that their effect on whole blood viscosity
is entirely a reflection of the changes in plasmaviscosity.
Shear-rate dependence (Figure 5). The prop-
TABLE III
Effect of hematocrit on response of bloodviscosity to hypertonicity
Hemato- BloodInitial crit viscosity
hemato- after 106 ADiluent crit dilution seconds-' Viscosity
centipoise centipoisePlasma 44.4 40 4.4 1.3
55.5 50 4.7Isotonic 44.4 39 3.8 1.0
saline1:10 55.5 49 4.8
Hypertonic 44.4 31 3.4 3.5saline1:10 55.5 40 6.9
10.0
9.0
8.0
7.0
6.0
5.0
4.0
3.0
2221
PETER W. RANDAND ELEANORLACOMBE
erty of whole blood to become rapidly more viscidat low shear rates is related primarily to theconcentration of red cells (20), secondarily to therelative concentrations of the plasma proteins(21, 22). With the addition of isotonic fluid,therefore, the viscosity-shear-rate curves tend tobe lower and more gradual as both cells and plasmaare diluted. We have repeatedly observed thesame response in blood with hypertonic plasmawhether osmolality has been increased by dilu-tion with concentrated solutes or by the additionof dry sodium chloride. It may be pertinent thatboth methods increase the absolute amount ofwater in the plasma from either exogenous or en-dogenous (extracted cell water) sources and thatplasma viscosity is diminished. Dilution with10,000 mol wt dextran did little to the shear-dependent character of whole blood, but dilutionwith high molecular weight (150,000) dextranproduced greatly elevated whole blood viscosityvalues that also demonstrated an increase inshear-rate dependence at low shear rates.
Discussion
The significant degree to which whole bloodviscosity is affected by plasma proteins has beenstudied by Wells, Merrill, and Gabelnick (21),who point out that dilution of proteins reduceswhole blood viscosity both by decreasing plasmaviscosity and by diminishing protein-induced redcell aggregation [the "viscosity plus factor" ofGelin (23) and the "second heterophase effect"of Merrill and co-workers (24) ]. Our datademonstrate that the viscosity-reducing effects ofisotonic and hypotonic dilution are similar, de-spite the osmotic increase in red cell size in hypo-tonic plasma. These results should be comparedwith those of Gregersen and associates (25), whodemonstrated an increase in viscosity with in-creasing cell size (20 p3 to 114 /3) using bloodsamples of equal hematocrit from several mam-malian species.
Although the decrease in blood viscosity afterhypotonic dilution is satisfactorily explained onthe basis of plasma protein dilution, one mightspeculate that the osmotically distended spheroidalcells present less surface area for intercellular con-
tact than biconcave discs and thus offer less re-
sistance to flow. If this were the case, however,
the viscosity levels after equivalent isotonic andhypotonic dilutions would not have agreed soclosely. It should also be noted, in view of re-cent work (26, 27) suggesting a correlationamong intracellular viscosity, mean cellular he-moglobin concentrations, and whole blood vis-cosity, that despite the decrease in mean corpus-cular hemoglobin concentration produced in ourhypotonic samples, the drop in blood viscosity wasnot significantly greater than in isotonic samples.Our findings do not agree with those of \Wells,Cox, and Shahriari (28), who noted an increasedblood viscosity with hypotonic dilution.
One might expect the addition of diluents ofhigh osmolality to decrease blood viscosity be-cause of the combined protein-diluting effects ofboth exogenous water and extracted cell water.Blood viscosity rises, however, and a comparisonof the response to permeant (urea) and non-permeant (saline, mannitol) solutes strongly sug-gests that this rise is due to creation. Wehavebeen unable to find previous reports of this ef-fect, although Lilien, Jones, and Mueller (29)observed creation, a drop in hematocrit, anddecreased whole blood viscosity after the injectionof hypertonic mannitol into human and caninesubjects. Water drawn in from the extravascularspaces probably provided sufficient dilution to ex-plain the diminished viscosity they noted.
Because of their irregular surfaces, it seems ob-vious that crenated cells would offer more re-sistance to movement than normal cells if bothwere present in the same volume concentration.Both Erslev and Atwater (26) and Dintenfass(27) have presented evidence that the viscosityof blood is affected by the elastic deformability ofthe red cell, which is dependent in turn on theviscosity of the cell contents. Hypertonic non-permeant solutes, by removing cell water, wouldincrease intracellular viscosity.
In a separate study to explore this point wemeasured the viscosity and water contents of in-tracellular material obtained by freeze-thaw lysisand centrifugation of red cells from blood samplesexposed to various concentrations of solutes pre-viously mentioned. As would be expected, hyper-tonicity decreased cell water and increased theviscosity of the cellular contents.
Although the information from this study sup-
2222
HEMODILUTION, TONICITY, AND BLOODVISCOSITY
ports the concept that at equal hematocrits cre-nated cells should diminish blood flow more thannormal cells, we are unable to explain the con-
spicuous influence of creation on blood viscosityin the face of marked plasma and red cell dilution.
Our use of dextran was intended not so muchto imitate a clinical situation as to evaluate theeffect of plasma viscosity changes on whole bloodviscosity. Previous work (13) has shown thatblood viscosity increases with an increase in themolecular weight of the added dextran. Re-cent measurements with variable shear-rate vis-cometers have provided evidence that this in-crease is more than would be expected fromchanges in plasma viscosity alone and that therise in blood viscosity is more pronounced at lowshear rates (23, 30).
Classic studies by Swedish workers (18) re-
vealed that high molecular weight dextran causes
red cell aggregation, whereas low molecular weightdextran reverses or prevents it. Microelectropho-retic evidence (19, 31) suggests that this phe-nomenon involves changes in the charge of thered cell membrane. What is of primary interestto us is the degree to which plasma viscosity mustbe raised in a relatively isotonic medium toachieve blood viscosity elevations equal to thoseproduced in hypertonic media. This informa-tion nullifies the significance of the slight shiftsin plasma viscosity seen in our electrolyte andcrystalloid dilutions and provides a frame of ref-erence for studies involving highly viscous radio-graphic dyes to be mentioned. A satisfactory ex-
planation for the effects of the dextrans andother macromolecular diluents on blood rheologywill require considerable further investigation.
Whereas the addition of large molecules to bloodtends to make its viscosity more shear-rate de-pendent, the addition of hypertonic solutes, whichdilute plasma proteins, appears to flatten vis-cosity-shear-rate curves. Shear-rate dependenceis more responsive to changes in plasma composi-tion than to changes in cell size or shape. Ourviscometer lacked sufficient sensitivity at shearrates low enough to explore this point adequately,but the implication would be that the increasedviscosity of hypertonic blood would not rise to
substantially higher values as shear rate decreased.In the postcapillary venules, where shear rate
may be low, this blood should not impede flowto the same extent as normal blood with equivalentviscosity at high shear rates.
Clinical implications. The establishment of totalbody perfusion using an oxygenator primed eitherwith 5%o dextrose in water or physiologic elec-trolyte solution provides the most dramatic clini-cal example of isotonic or hypotonic blood dilu-tion. In comparison with perfusions using wholeblood only, venous return is increased, higherflow rates may be achieved, and blood pressureis more uniform (32). Cooley, Beall, and Grondin(10) report less aggregation and blood sequestra-tion in the microcirculation, improved renal func-tion, and fewer cerebral, pulmonary, and renalcomplications resulting from hemodilution perfu-sion. Although these signs of improved peripheralblood flow may all stem directly or indirectly fromchanges in the physical properties of blood, thispoint cannot be proved convincingly until the re-lationship of blood viscosity to flow through themicrocirculation is more clearly established.
Although high molecular weight dextrans havenot been found safe for clinical use, dextrans withmolecular weights of 40,000 or less have receivedmuch attention because of their ability to preventintravascular aggregation of red cells and becauseof the beneficial responses said to result fromtheir clinical use. Since isotonic saline or 5%'dextrose in water is used as a vehicle for dextraninfusion, we feel that dilution alone may figureimportantly in these effects. This point certainlyrequires further clarification.
Hypertonic medications such as 50% dextrosein water or concentrated sodium bicarbonate areusually administered in such small volumes andat such slow rates as to preclude hemodynami-cally important systemic effects. It has been ob-served that the extended infusion of hypertonicsolutions of nonpermeant particles such as man-nitol produce decreased blood viscosity and in-creased flow in vivo, at least as measured throughthe kidney (29, 33, 34). Dilutions with waterfrom the extravascular spaces as well as from thered cells probably explain these findings. Morerapid injections of hypertonic solutions, however,have been shown repeatedly to produce pulmonaryhypertension and peripheral hypotension, the re-sponse being proportional to the concentration and
2223
PETER W. RANDAND ELEANORLACOMBE
50
45
c 40E
35
30
9.0
8.0
7. 00
toI-
5.0
4.0
o 1.4C 1
"C 1 2
X 1. 0
_ 90e
c E 86o to
@^° 82m
' 78
.t' 800
E 600o EMCO 400E E_. 200
Angio -Conray
s~ - -
control 1:20 1:10dilutions
1:5
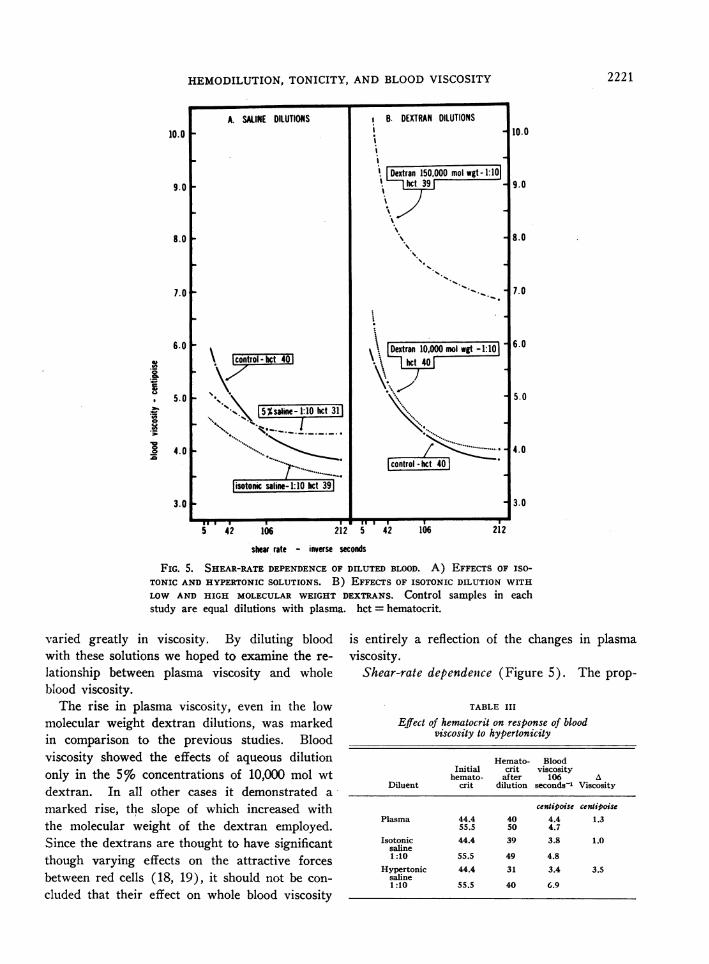
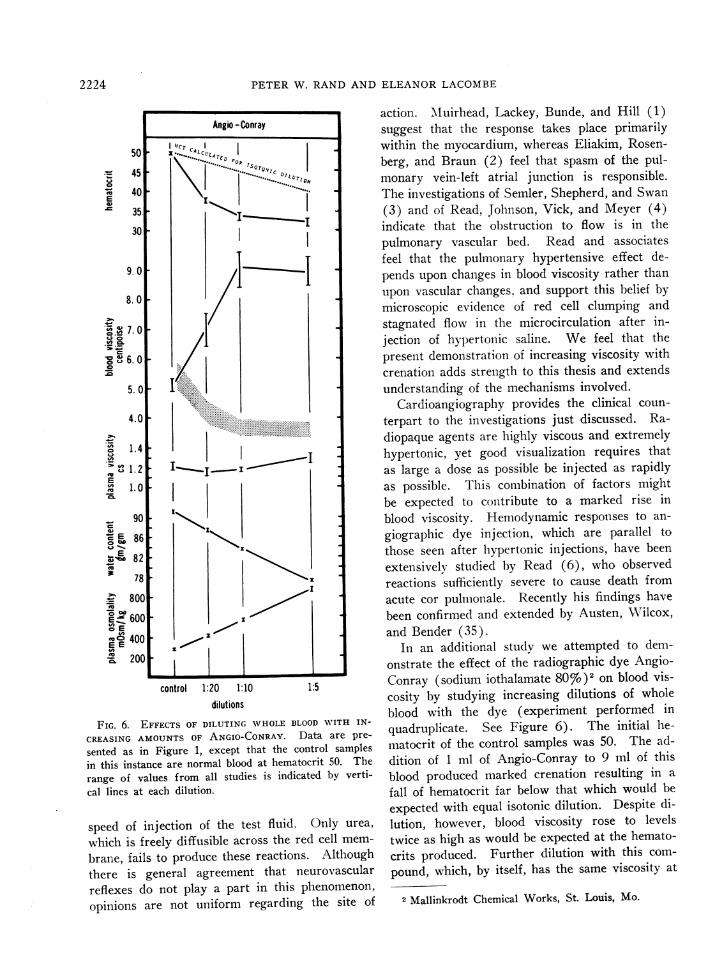
FIG. 6. EFFECTS OF DILUTING WHOLEBLOOD WITH IN-
CREASING AMOUNTSOF ANGIO-CONRAY. Data are pre-
sented as in Figure 1, except that the control samplesin this instance are normal blood at hematocrit 50. The
range of values from all studies is indicated by verti-
cal lines at each dilution.
speed of injection of the test fluid. Only urea,
which is freely diffusible across the red cell mem-
brane, fails to produce these reactions. Althoughthere is general agreement that neurovascular
reflexes do not play a part in this phenomenon,opinions are not uniform regarding the site of
action. M\Iuirhead, Lackey, Bunde, and Hill (1)suggest that the response takes place primarilywithin the myocardium, whereas Eliakim, Rosen-berg, and Braun (2) feel that spasm of the pul-monary vein-left atrial junction is responsible.The investigations of Semler, Shepherd, and Swan(3) and of Read, Johnson, Vick, and Meyer (4)indicate that the obstruction to flow is in thepulmonary vascular bed. Read and associatesfeel that the pulmonary hypertensive effect de-pends upon changes in blood viscosity rather thanupon vascular changes, and support this belief bymicroscopic evidence of red cell clumping andstagnated flow in the microcirculation after in-jection of hypertonic saline. We feel that thepresent demonstration of increasing viscosity withcreation adds strength to this thesis and extendsunderstanding of the mechanisms involved.
Cardioangiography provides the clinical coun-terpart to the investigations just discussed. Ra-diopaque agents are highly viscous and extremelyhypertonic, yet good visualization requires thatas large a dose as possible be injected as rapidlyas possible. This combination of factors mightbe expected to contribute to a marked rise inblood viscosity. Hemodynamic responses to an-giographic dye injection, which are parallel tothose seen after hypertonic injections, have beenextensively studied by Read (6), who observedreactions sufficiently severe to cause death fromacute cor pulmonale. Recently his findings havebeen confirmed and extended by Austen, Wilcox,and Bender (35).
In an additional study we attempted to dem-onstrate the effect of the radiographic dye Angio-Conray (sodium iothalamate 80%)2 on blood vis-cosity by studying increasing dilutions of wholeblood with the dye (experiment performed inquadruplicate. See Figure 6). The initial he-matocrit of the control samples was 50. The ad-dition of 1 ml of Angio-Conray to 9 ml of thisblood produced marked creation resulting in a
fall of hematocrit far below that which would be
expected with equal isotonic dilution. Despite di-lution, however, blood viscosity rose to levelstwice as high as would be expected at the hemato-crits produced. Further dilution with this com-pound, which, by itself, has the same viscosity at
2 Mallinkrodt Chemical Works, St. Louis, Mo.
2224
11
HEMODILUTION, TONICITY, AND BLOODVISCOSITY
106 seconds-' as whole blood of hematocrit 65,produced no further drop in hematocrit or rise inviscosity.
To have an effect in the pulmonary circula-tion after injection into the right ventricle,the changes we have noted must occur withinseconds. To establish this point, a hemocytom-eter chamber was partially filled with a suspensionof red cells in plasma. Rapid serial photographswere then taken as a drop of Angio-Conray wasintroduced under the coverslip. Exposures weremade at 2-second intervals starting with the ad-dition of the dye. On all occasions creation hadtaken place by the time cell movement had slowedsufficiently to observe it, an interval of less than2 seconds.
This information emphasizes two points re-garding the effects of angiographic agents onblood flow in vivo. 1) Viscosity is greatly in-creased by dilutions that are usually equalled orexceeded clinically, and 2) the viscous effects aremagnified by increasing red cell concentration( Figure 4). The implications are that theseagents should be used with caution in the pres-ence of polycythemia and especially in the pres-ence of pulmonary vascular disease.
Summary
In this study viscosity changes have been meas-ured in whole blood after in vitro dilution withvarying concentrations of several intravenousagents. In the presence of fixed red cell concen-trations, the following responses have been noted:
1) Isotonic dilution depresses both plasma andwhole blood viscosity.
2) Hypotonic dilution produces the same ef-fects despite osmotic swelling of the red cells anda consequent rise in hematocrit.
3) Hypertonic dilution causes a marked risein blood viscosity if creation is produced; hy-pertonic concentrations of diffusible solutes(urea) produce neither creation nor a rise inblood viscosity.
4) The rise in viscosity with creation is notdue to increased plasma viscosity and takes placedespite a marked decrease in hematocrit.
5) The dependence of blood viscosity on shearrate is reduced by both hypotonic and hypertonicsaline or mannitol dilution but accentuated by di-
lution with dextrans of increasing molecularweight.
Physiologic implications of these changes arediscussed. The response to angiographic dyedilution is presented to emphasize their clinicalsignificance.
AcknowledgmentsThe authors wish to express their appreciation to Mrs.
Nancy Barker, Miss Joan Gooch, and Mr. James Mc-Kenzie for technical, secretarial, and photographic as-sistance. We are indebted to Dr. Manu Chatterjee forhis critical review of the manuscript.
References1. Muirhead, E. E., R. W. Lackey, C. A. Bunde, and
J. M. Hill. Transient hypotension following rapidintravenous injections of hypertonic solutions.Amer. J. Physiol. 1947, 151, 516.
2. Eliakim, M., S. Z. Rosenberg, and K. Braun. Effectof hypertonic saline on the pulmonary and systemicpressures. Circulat. Res. 1958, 6, 357.
3. Semler, H. J., J. T. Shepherd, and H. J. C. Swan.Effect of hypertonic saline solution on the pulmo-nary circulation (abstract). Physiologist 1958, 1,71.
4. Read, R. C., J. A. Johnson, J. A. Vick, and M. W.Meyer. Vascular effects of hypertonic solutions.Circulat. Res. 1960, 8, 538.
5. Cotrim, E. S. Cardiac, blood pressure, and respira-tory effects of some contrast media: the dangersof overdosage. Acta radiol. (Stockh.) 1954, 116,58.
6. Read, R. C. Cause of death in cardioangiography.J. thorac. cardiovasc. Surg. 1959, 38, 685.
7. Bernstein, E. F., and R. L. Evans. Low-molecular-weight dextran. J. Amer. med. Ass. 1960, 174,1417.
8. Long, D. M., Jr., L. Sanchez, R. L. Varco, and C. W.Lillehei. The use of low molecular weight dextranand serum albumin as plasma expanders in extra-corporeal circulation. Surgery 1961, 50, 12.
9. Zuhdi, N., B. McCollough, J. Carey, and C. Krieger.Hypothermic perfusion for open-heart surgicalprocedures. J. int. Coll. Surg. 1961, 35, 319.
10. Cooley, D. A., A. C. Beall, Jr., and P. Grondin.Open-heart operations with disposable oxygena-tors, 5 per cent dextrose prime, and normothermia.Surgery 1962, 52, 713.
11. Roe, B. B., S. A. Hepps, and E. E. Swenson. Hemo-dilution with and without low-mole dextran: labora-tory studies and clinical experience (abstract).Circulation 1963, 28, 792.
12. DeWall, R. A., R. C. Lillehei, and R. D. Sellers.Hemodilution perfusions for open-heart surgery.New Engl. J. Med. 1962, 266, 1078.
2225
PETER W. RANDAND ELEANORLACOMBE
13. Reemtsma, K., and 0. Creech, Jr. Viscosity stud-ies of blood, plasma, and plasma substitutes. J.thorac. cardiovasc. Surg. 1962, 44, 674.
14. DeWall, R. A., and C. W. Lillehei. Simplified totalbody perfusion. Reduced flows, moderate hypo-thermia, and hemodilution. J. Amer. med. Ass.1962, 179, 430.
15. Rand, P. W., E. Lacombe, H. E. Hunt, and W. H.Austin. Viscosity of normal human blood undernormothermic and hypothermic conditions. J. appl.Physiol. 1964, 19, 117.
16. Merrill, E. W., G. C. Cokelet, A. Britten, and R. E.Wells, Jr. Non-Newtonian rheology of humanblood-effect of fibrinogen deducted by "subtrac-tion." Circulat. Res. 1963, 13, 48.
17. Hardy, R. C. NBS Viscometer Calibrating Liquidsand Capillary Tube Viscometers. National Bureauof Standards Monograph 55, 1962.
18. Thorsen, G., and H. Hint. Aggregation, sedimenta-tion and intravascular sludging of erythrocytes.Acta chir. scand. (suppl.) 1950, 154.
19. Bernstein, E. F., F. G. Emmings, G. C. Mackey, A.Castaneda, and R. L. Varco. Effect of low molec-ular weight dextran on red blood cell charge dur-ing extracorporeal circulation. Trans. Amer. Soc.Artif. Organs 1962, 8, 23.
20. Wells, R. E., Jr., and E. WV. Merrill. Influence offlow properties of blood upon viscosity-hematocritrelationships. J. clin. Invest. 1962, 41, 1591.
21. \Vells, R. E., Jr., E. W. Merrill, and H. Gabelnick.Shear-rate dependence of viscosity of blood: in-teraction of red cells and plasma proteins. Trans.Soc. Rheology 1962, 6, 19.
22. Wells, R. E., Jr., R. D. Perera, T. Gawronski, andA. A. Shahriari. Effects of plasma proteins uponthe theological character of blood in the micro-circulation (abstract). J. clin. Invest. 1963, 42,991.
23. Gelin, L. E. Rheological disturbances followingtissue injury. Abstracts of the Fourth Interna-tional Congress on Rheology. Brown University,1963, 244.
24. Merrill, E. W., E. R. Gilliland, G. Cokelet, H. Shin,A. Britten, and R. E. Wells, Jr. Rheology ofblood and flow in the microcirculation. J. appl.Physiol. 1963, 18, 255.
25. Gregersen, M. I., B. Peric, S. Chien, D. Sinclair, C.Chang, and H. Taylor. The influence of erythro-cyte size on the viscosity of blood at low shearrates. Abstracts of the Fourth International Con-gress of Rheology. Brown University, 1963, 279.
26. Erslev, A. J., and J. Atwater. Effect of mean cor-puscular hemoglobin concentration on viscosity. J.Lab. clin. Med. 1963, 62, 401.
27. Dintenfass, L. Considerations of the internal vis-cosity of red cells and its effect on the viscosityof whole blood. Angiology 1962, 13, 333.
28. Wells, R. E., Jr., P. J. Cox, Jr., and A. A. Shahriari.Effects of pH and osmolality upon blood viscosity.Clin. Res. 1963, 11, 176.
29. Lilien, 0. M., S. G. Jones, and C. B. Mueller. Themechanism of mannitol diuresis. Surg. Gynec.Obstet. 1963, 117, 221.
30. Gregersen, M. I., S. Usami, B. Peric, C. Chang, D.Sinclair, and S. Chien. Blood viscosity at lowshear rates. Effects of low and high moleculardextrans. Biorheology 1963, 1, 247.
31. Bernstein, E. F., F. G. Emmings, R. L. Evans, A.Castaneda, and R. L. Varco. Effect of low molec-ular weight dextrans on red blood cell charge dur-ing clinical extracorporeal circulation. Circula-tion 1963, 27, 816.
32. Zuhdi, N., J. Carey, J. Cutter, L. Rader, and A.Greer. Intentional hemodilution. Arch. Surg.1963, 87, 554.
33. Koch, A., A. M. Scher, and J. P. McDonald. Effectsof tonicity of perfusion fluid and urine flow onrenal vascular resistance. Fed. Proc. 1963, 22,172.
34. Gagnon, J. A., G. P. Murphy, and P. E. Teschan.Renal hemodynamic effects of hypertonic mannitolin the dog. Fed. Proc. 1963, 22, 173.
35. Austen, W. G., B. R. Wilcox, and H. W. Bender.Experimental studies of the cardiovascular re-sponses secondary to the injection of angiographicagents. J. thorac. cardiovasc. Surg. 1964, 47, 356.
2226