hematological and iron-related analytes— reference data for … · 2016-01-26 · series...
TRANSCRIPT

U.S. DEPARTMENT OF HEALTH AND HUMAN SERVICESCenters for Disease Control and PreventionNational Center for Health Statistics
Serie
s11
,Nu
mb
er2
47M
arc
h20
05 Hematological andIron-Related Analytes—Reference Data for PersonsAged 1 Year and Over:United States, 1988–94

Copyright information
All material appearing in this report is in the public domain and may bereproduced or copied without permission; citation as to source, however, isappreciated.
Suggested citation
Hollowell JG, Van Assendelft OW, Gunter EW, et al. Hematological andiron-related analytes—Reference data for persons aged 1 year and over: UnitedStates, 1988–94. National Center for Health Statistics. Vital Health Stat 11(247).2005.
Library of Congress Cataloging-in-Publication Data
Hematological and iron related analytes : reference data for persons aged 1year and over, United States, 1988–94.
p. ; cm. -- (DHHS publication ; no. (PHS) 2005-1697) (Vital and healthstatistics. Series 11, data from the third National Health and ExaminationSurvey ; no. 247)
‘‘February 2005.’’Written by Joseph G. Hollowell et al.Includes bibliographical references.ISBN 0-806-0597-8
1. Blood--Analysis. 2. Blood--Examination--United States. 3. Reference values(Medicine)--United States.
[DNLM: 1. Hemoglobins--United States. 2. Blood Chemical Analysis--UnitedStates. 3. Erythrocyte Count--statistics & numerical data--United States. 4.Health Status Indicators--United States. 5. Nutrition Surveys--United States. W2A N148vk no.247 2005] I. Hollowell, Joseph G. II. National Center for HealthStatistics (U.S.) III. National Health and Nutrition Examination Survey (U.S.) IV.Series. V. Series: Vital and health statistics. Series 11, Data from the nationalhealth survey ; no. 247.
RA407.3.A347 no. 247[QP93]614.4.’273’021 s--dc22[612.1 2005001663
Trade name disclaimer
The use of trade names is for identification only and does not implyendorsement by the Centers for Disease Control and Prevention, U.S.Department of Health and Human Services.
For sale by the U.S. Government Printing OfficeSuperintendent of DocumentsMail Stop: SSOPWashington, DC 20402-9328Printed on acid-free paper.

Series 11, Number 247
Hematological and Iron-RelatedAnalytes—Reference Data forPersons Aged 1 Year and Over:United States, 1988–94
Data From the Third National HealthExamination Survey
Hyattsville, MarylandMarch 2005DHHS Publication No. (PHS) 2005-1697
U.S. DEPARTMENT OF HEALTH AND HUMAN SERVICESCenters for Disease Control and PreventionNational Center for Health Statistics

National Center for Health Statistics
Edward J. Sondik, Ph.D., Director
Jack R. Anderson, Deputy Director
Jennifer H. Madans, Ph.D., Associate Director for Science
Lawrence H. Cox, Ph.D., Associate Director for Researchand Methodology
Edward L. Hunter, Associate Director for Planning, Budget,and Legislation
Michael H. Sadagursky, Associate Director forManagement and Operations
Margot A. Palmer, Director for Information Technology
Phillip R. Beattie, Director for Information Services
Diane M. Makuc, Dr.P.H., Acting Associate Director forAnalysis and Epidemiology
Charles J. Rothwell, Director for Vital Statistics
Jane E. Sisk, Ph.D., Director for Health Care Statistics
Jane F. Gentleman, Ph.D., Director for Health InterviewStatistics
Clifford L. Johnson, Director for Health and NutritionExamination Surveys
Division of Health Examination Statistics
Clifford L. Johnson, M.S.P.H., Director
Rosemarie Hirsch, M.D., M.P.H., Chief Analysis Branch
Kathryn S. Porter, M.D., M.S., Acting Chief, OperationsBranch
Vicki L. Burt, Sc.M., R.N., Chief, Planning Branch
Lewis Berman, M.S., Chief, Information ManagementBranch

Contents
Abstract . . . . . . . . . . . . . . . . . . . . . . . . . . . . . . . . . . . . . . . . . . . . . . . . . . . . . . . . . . . . . . . . . . . . . . . . . . . . . . . . . . . . . . . . . . . . . . . . . . 1
Introduction . . . . . . . . . . . . . . . . . . . . . . . . . . . . . . . . . . . . . . . . . . . . . . . . . . . . . . . . . . . . . . . . . . . . . . . . . . . . . . . . . . . . . . . . . . . . . . . 1
Methods . . . . . . . . . . . . . . . . . . . . . . . . . . . . . . . . . . . . . . . . . . . . . . . . . . . . . . . . . . . . . . . . . . . . . . . . . . . . . . . . . . . . . . . . . . . . . . . . . . 2Survey and Sample Collection Methods . . . . . . . . . . . . . . . . . . . . . . . . . . . . . . . . . . . . . . . . . . . . . . . . . . . . . . . . . . . . . . . . . . . . . . 2Laboratory Methods for Hematology and Definitions. . . . . . . . . . . . . . . . . . . . . . . . . . . . . . . . . . . . . . . . . . . . . . . . . . . . . . . . . . . . 3Statistical Methods . . . . . . . . . . . . . . . . . . . . . . . . . . . . . . . . . . . . . . . . . . . . . . . . . . . . . . . . . . . . . . . . . . . . . . . . . . . . . . . . . . . . . . . 6
Results . . . . . . . . . . . . . . . . . . . . . . . . . . . . . . . . . . . . . . . . . . . . . . . . . . . . . . . . . . . . . . . . . . . . . . . . . . . . . . . . . . . . . . . . . . . . . . . . . . . 7Comparison of NHANES III with NHANES II . . . . . . . . . . . . . . . . . . . . . . . . . . . . . . . . . . . . . . . . . . . . . . . . . . . . . . . . . . . . . . . . 7Description of Selected Findings . . . . . . . . . . . . . . . . . . . . . . . . . . . . . . . . . . . . . . . . . . . . . . . . . . . . . . . . . . . . . . . . . . . . . . . . . . . . 8
References . . . . . . . . . . . . . . . . . . . . . . . . . . . . . . . . . . . . . . . . . . . . . . . . . . . . . . . . . . . . . . . . . . . . . . . . . . . . . . . . . . . . . . . . . . . . . . . 18
Figures1. Hemoglobin by age, sex, and race/ethnicity: United States, Third National Health and Nutrition Examination Survey,
1988–94. . . . . . . . . . . . . . . . . . . . . . . . . . . . . . . . . . . . . . . . . . . . . . . . . . . . . . . . . . . . . . . . . . . . . . . . . . . . . . . . . . . . . . . . . . . . 92. Hematocrit by age, sex, and race/ethnicity: United States, Third National Health and Nutrition Examination Survey,
1988–94. . . . . . . . . . . . . . . . . . . . . . . . . . . . . . . . . . . . . . . . . . . . . . . . . . . . . . . . . . . . . . . . . . . . . . . . . . . . . . . . . . . . . . . . . . . . 93. Red blood cell count by age, sex, and race/ethnicity: United States, Third National Health and Nutrition Examination
Survey, 1988–94 . . . . . . . . . . . . . . . . . . . . . . . . . . . . . . . . . . . . . . . . . . . . . . . . . . . . . . . . . . . . . . . . . . . . . . . . . . . . . . . . . . . . 104. Mean cell volume by age, sex, and race/ethnicity: United States, Third National Health and Nutrition
Examination Survey, 1988–94 . . . . . . . . . . . . . . . . . . . . . . . . . . . . . . . . . . . . . . . . . . . . . . . . . . . . . . . . . . . . . . . . . . . . . . . . . 105. Mean cell hemoglobin by age, sex, and race/ethnicity: United States, Third National Health and Nutrition Examination
Survey, 1988–94 . . . . . . . . . . . . . . . . . . . . . . . . . . . . . . . . . . . . . . . . . . . . . . . . . . . . . . . . . . . . . . . . . . . . . . . . . . . . . . . . . . . . 116. Mean cell hemoglobin concentration by age, sex, and race/ethnicity: United States, Third National Health
and Nutrition Examination Survey, 1988–94 . . . . . . . . . . . . . . . . . . . . . . . . . . . . . . . . . . . . . . . . . . . . . . . . . . . . . . . . . . . . . 127. Red blood cell distribution width by age, sex, and race/ethnicity: United States, Third National Health and Nutrition
Examination Survey, 1988–94 . . . . . . . . . . . . . . . . . . . . . . . . . . . . . . . . . . . . . . . . . . . . . . . . . . . . . . . . . . . . . . . . . . . . . . . . . 128. White blood cell count by age, sex, and race/ethnicity: United States, Third National Health and Nutrition Examination
Survey, 1988–94 . . . . . . . . . . . . . . . . . . . . . . . . . . . . . . . . . . . . . . . . . . . . . . . . . . . . . . . . . . . . . . . . . . . . . . . . . . . . . . . . . . . . 139. Platelet count by age, sex, and race/ethnicity: United States, Third National Health and Nutrition Examination Survey,
1988–94. . . . . . . . . . . . . . . . . . . . . . . . . . . . . . . . . . . . . . . . . . . . . . . . . . . . . . . . . . . . . . . . . . . . . . . . . . . . . . . . . . . . . . . . . . . 1310. Mean platelet volume by age, sex, and race/ethnicity: United States, Third National Health and Nutrition Examination
Survey, 1988–94 . . . . . . . . . . . . . . . . . . . . . . . . . . . . . . . . . . . . . . . . . . . . . . . . . . . . . . . . . . . . . . . . . . . . . . . . . . . . . . . . . . . . 1411. Platelet distribution width by age, sex, and race/ethnicity: United States, Third National Health and Nutrition
Examination Survey, 1988–94 . . . . . . . . . . . . . . . . . . . . . . . . . . . . . . . . . . . . . . . . . . . . . . . . . . . . . . . . . . . . . . . . . . . . . . . . . 1512. Serum iron, by age, sex, and race/ethnicity: United States, Third National Health and Nutrition Examination Survey,
1988–94. . . . . . . . . . . . . . . . . . . . . . . . . . . . . . . . . . . . . . . . . . . . . . . . . . . . . . . . . . . . . . . . . . . . . . . . . . . . . . . . . . . . . . . . . . . 1513. Serum total iron-binding capacity by age, sex, and race/ethnicity: United States, Third National Health and Nutrition
Examination Survey, 1988–94 . . . . . . . . . . . . . . . . . . . . . . . . . . . . . . . . . . . . . . . . . . . . . . . . . . . . . . . . . . . . . . . . . . . . . . . . . 1614. Transferrin saturation by age, sex, and race/ethnicity: United States, Third National Health and Nutrition Examination
Survey, 1988–94 . . . . . . . . . . . . . . . . . . . . . . . . . . . . . . . . . . . . . . . . . . . . . . . . . . . . . . . . . . . . . . . . . . . . . . . . . . . . . . . . . . . . 1615. Erythrocyte protoporphyrin by age, sex, and race/ethnicity: United States, Third National Health and Nutrition
Examination Survey, 1988–94 . . . . . . . . . . . . . . . . . . . . . . . . . . . . . . . . . . . . . . . . . . . . . . . . . . . . . . . . . . . . . . . . . . . . . . . . . 1716. Serum ferritin by age, sex, and race/ethnicity: United States, Third National Health and Nutrition Examination Survey,
1988–94 . . . . . . . . . . . . . . . . . . . . . . . . . . . . . . . . . . . . . . . . . . . . . . . . . . . . . . . . . . . . . . . . . . . . . . . . . . . . . . . . . . . . . . . . . . 17
iii

Text TablesA. Sample size and response rates of persons 1 year and over for the Third National Health and Nutrition Examination
Survey, by age, sex, and race/ethnicity: United States, 1988–94 . . . . . . . . . . . . . . . . . . . . . . . . . . . . . . . . . . . . . . . . . . . . . . 3B. Hematologic reference ranges . . . . . . . . . . . . . . . . . . . . . . . . . . . . . . . . . . . . . . . . . . . . . . . . . . . . . . . . . . . . . . . . . . . . . . . . . . 4C. Hemoglobin, hematocrit, red blood cells, and white blood cells in children 1–14 years of age, by age group and sex:
Comparison of the Third National Health and Nutrition Examination Survey (1988–91) with the Second NationalHealth and Nutrition Examination Survey (1971–74). . . . . . . . . . . . . . . . . . . . . . . . . . . . . . . . . . . . . . . . . . . . . . . . . . . . . . . . 8
Detailed Tables1. Hemoglobin in gram per liter for persons 1 year and over, number of examined persons, mean, standard deviation,
standard error of the mean, and selected percentiles, by race/ethnicity and age: United States, 1988–94 . . . . . . . . . . . . . 192. Hemoglobin in gram per liter for males 1 year and over, number of examined persons, mean, standard deviation,
standard error of the mean, and selected percentiles, by race/ethnicity and age: United States, 1988–94 . . . . . . . . . . . . . 203. Hemoglobin in gram per liter for females 1 year and over, number of examined persons, mean, standard deviation,
standard error of the mean, and selected percentiles, by race/ethnicity and age: United States, 1988–94 . . . . . . . . . . . . . 214. Hematocrit as fractions (liters per liter) for persons 1 year and over, number of examined persons, mean, standard
deviation, standard error of the mean, and selected percentiles, by race/ethnicity and age: United States, 1988–94 . . . . . 225. Hematocrit as fractions (liters per liter) for males 1 year and over, number of examined persons, mean, standard
deviation, standard error of the mean, and selected percentiles, by race/ethnicity and age: United States, 1988–94 . . . . . 236. Hematocrit as fractions (liters per liter) for females 1 year and over, number of examined persons, mean, standard
deviation, standard error of the mean, and selected percentiles, by race/ethnicity and age: United States, 1988–94 . . . . . 247. Red blood cell count as 1012 cells per liter for persons 1 year and over, number of examined persons, mean, standard
deviation, standard error of the mean, and selected percentiles, by race/ethnicity and age: United States, 1988–94 . . . . . 258. Red blood cell count as 1012 cells per liter for males 1 year and over, number of examined persons, mean, standard
deviation, standard error of the mean, and selected percentiles, by race/ethnicity and age: United States, 1988–94 . . . . . 269. Red blood cell count as 1012 cells per liter for females 1 year and over, number of examined persons, mean, standard
deviation, standard error of the mean, and selected percentiles, by race/ethnicity and age: United States, 1988–94 . . . . . 2710. Mean cell volume in femtoliter for persons 1 year and over, number of examined persons, mean, standard deviation,
standard error of the mean, and selected percentiles, by race/ethnicity and age: United States, 1988–94 . . . . . . . . . . . . . 2811. Mean cell volume in femtoliter for males 1 year and over, number of examined persons, mean, standard deviation,
standard error of the mean, and selected percentiles, by race/ethnicity and age: United States, 1988–94 . . . . . . . . . . . . . 2912. Mean cell volume in femtoliter for females 1 year and over, number of examined persons, mean, standard deviation,
standard error of the mean, and selected percentiles, by race/ethnicity and age: United States, 1988–94 . . . . . . . . . . . . . 3013. Mean cell hemoglobin in picogram for persons 1 year and over, number of examined persons, mean, standard
deviation, standard error of the mean, and selected percentiles, by race/ethnicity and age: United States, 1988–94 . . . . 3114. Mean cell hemoglobin in picogram for males 1 year and over, number of examined persons, mean, standard deviation,
standard error of the mean, and selected percentiles, by race/ethnicity and age: United States, 1988–94 . . . . . . . . . . . . . 3215. Mean cell hemoglobin in picogram for females 1 year and over, number of examined persons, mean, standard
deviation, standard error of the mean, and selected percentiles, by race/ethnicity and age: United States, 1988–94 . . . . . 3316. Mean cell hemoglobin concentration in gram per liter for persons 1 year and over, number of examined persons, mean,
standard deviation, standard error of the mean, and selected percentiles, by race/ethnicity and age: United States,1988–94. . . . . . . . . . . . . . . . . . . . . . . . . . . . . . . . . . . . . . . . . . . . . . . . . . . . . . . . . . . . . . . . . . . . . . . . . . . . . . . . . . . . . . . . . . . 34
17. Mean cell hemoglobin concentration in gram per liter for males 1 year and over, number of examined persons, mean,standard deviation, standard error of the mean, and selected percentiles, by race/ethnicity and age: United States,1988–94. . . . . . . . . . . . . . . . . . . . . . . . . . . . . . . . . . . . . . . . . . . . . . . . . . . . . . . . . . . . . . . . . . . . . . . . . . . . . . . . . . . . . . . . . . . 35
18. Mean cell hemoglobin concentration in gram per liter for females 1 year and over, number of examined persons, mean,standard deviation, standard error of the mean, and selected percentiles, by race/ethnicity and age: United States,1988–94. . . . . . . . . . . . . . . . . . . . . . . . . . . . . . . . . . . . . . . . . . . . . . . . . . . . . . . . . . . . . . . . . . . . . . . . . . . . . . . . . . . . . . . . . . . 36
19. Red cell distribution width in percentages for persons 1 year and over, number of examined persons, mean, standarddeviation, standard error of the mean, and selected percentiles, by race/ethnicity and age: United States, 1988–94 . . . . . 37
20. Red cell distribution width in percentages for males 1 year and over, number of examined persons, mean, standarddeviation, standard error of the mean, and selected percentiles, by race/ethnicity and age: United States, 1988–94 . . . . . 38
21. Red cell distribution width in percentages for females 1 year and over, number of examined persons, mean, standarddeviation, standard error of the mean, and selected percentiles, by race/ethnicity and age: United States, 1988–94 . . . . . 39
22. Platelet count as 109 cells per liter for persons 1 year and over, number of examined persons, mean, standarddeviation, standard error of the mean, and selected percentiles, by race/ethnicity and age: United States, 1988–94 . . . . . 40
iv

23. Platelet count as 109 cells per liter for males 1 year and over, number of examined persons, mean, standard deviation,standard error of the mean, and selected percentiles, by race/ethnicity and age: United States, 1988–94 . . . . . . . . . . . . . 41
24. Platelet count as 109 cells per liter for females 1 year and over, number of examined persons, mean, standarddeviation, standard error of the mean, and selected percentiles, by race/ethnicity and age: United States, 1988–94 . . . . . 42
25. Mean platelet volume in femtoliter for persons 1 year and over, number of examined persons, mean, standarddeviation, standard error of the mean, and selected percentiles, by race/ethnicity and age: United States, 1988–94 . . . . . 43
26. Mean platelet volume in femtoliter for males 1 year and over, number of examined persons, mean, standard deviation,standard error of the mean, and selected percentiles, by race/ethnicity and age: United States, 1988–94 . . . . . . . . . . . . . 44
27. Mean platelet volume in femtoliter for females 1 year and over, number of examined persons, mean, standarddeviation, standard error of the mean, and selected percentiles, by race/ethnicity and age: United States, 1988–94 . . . . . 45
28. Platelet distribution width in percentages for persons 1 year and over, number of examined persons, mean, standarddeviation, standard error of the mean, and selected percentiles, by race/ethnicity and age: United States, 1988–94 . . . . . 46
29. Platelet distribution width in percentages for males 1 year and over, number of examined persons, mean, standarddeviation, standard error of the mean, and selected percentiles, by race/ethnicity and age: United States, 1988–94 . . . . . 47
30. Platelet distribution width in percentages for females 1 year and over, number of examined persons, mean, standarddeviation, standard error of the mean, and selected percentiles, by race/ethnicity and age: United States, 1988–94 . . . . . 48
31. White blood cell count as 109 cells per liter for persons 1 year and over, number of examined persons, mean, standarddeviation, standard error of the mean, and selected percentiles, by race/ethnicity and age: United States, 1988–94 . . . . . 49
32. White blood cell count as 109 cells per liter for males 1 year and over, number of examined persons, mean, standarddeviation, standard error of the mean, and selected percentiles, by race/ethnicity and age: United States, 1988–94 . . . . . 50
33. White blood cell count as 109 cells per liter for females 1 year and over, number of examined persons, mean, standarddeviation, standard error of the mean, and selected percentiles, by race/ethnicity and age: United States, 1988–94 . . . . . 51
34. White blood cell differential count as 109 cells per liter for persons 1 year and over, leukocyte count measuredelectronically, differential percentage, count numbers, and standard error of the mean for segmented neutrophils,lymphocytes, monocytes, eosinophils, and basophils determined using differential smear, by race/ethnicity and age,United States, 1988–94. . . . . . . . . . . . . . . . . . . . . . . . . . . . . . . . . . . . . . . . . . . . . . . . . . . . . . . . . . . . . . . . . . . . . . . . . . . . . . . 52
35. White blood cell differential count as 109 cells per liter for males 1 year and over, leukocyte count measuredelectronically, differential percentage, count numbers, and standard error of the mean for segmented neutrophils,lymphocytes, monocytes, eosinophils, and basophils determined using differential smear, by race/ethnicity and age,United States, 1988–94. . . . . . . . . . . . . . . . . . . . . . . . . . . . . . . . . . . . . . . . . . . . . . . . . . . . . . . . . . . . . . . . . . . . . . . . . . . . . . . 53
36. White blood cell differential count as 109 cells per liter for females 1 year and over, leukocyte count measuredelectronically, differential percentage, count numbers, and standard error of the mean for segmented neutrophils,lymphocytes, monocytes, eosinophils, and basophils determined using differential smear, by race/ethnicity and age,United States, 1988–94. . . . . . . . . . . . . . . . . . . . . . . . . . . . . . . . . . . . . . . . . . . . . . . . . . . . . . . . . . . . . . . . . . . . . . . . . . . . . . . 54
37. Granulocytes as 109 cells per liter, measured electronically (Coultery 3-part differential) for persons 1 year and over,number of examined persons, mean, standard deviation, standard error of the mean, and selected percentiles, byrace/ethnicity and age: United States, 1988–94 . . . . . . . . . . . . . . . . . . . . . . . . . . . . . . . . . . . . . . . . . . . . . . . . . . . . . . . . . . . 55
38. Granulocytes as 109 cells per liter, measured electronically (Coultery 3-part differential) for males 1 year and over,number of examined persons, mean, standard deviation, standard error of the mean, and selected percentiles, byrace/ethnicity and age: United States, 1988–94 . . . . . . . . . . . . . . . . . . . . . . . . . . . . . . . . . . . . . . . . . . . . . . . . . . . . . . . . . . . 56
39. Granulocytes as 109 cells per liter, measured electronically (Coultery 3-part differential) for females 1 year and over,number of examined persons, mean, standard deviation, standard error of the mean, and selected percentiles, byrace/ethnicity and age: United States, 1988–94 . . . . . . . . . . . . . . . . . . . . . . . . . . . . . . . . . . . . . . . . . . . . . . . . . . . . . . . . . . . 57
40. Granulocytes in percentages, measured electronically (Coultery 3-part differential) for persons 1 year and over, numberof examined persons, mean, standard deviation, standard error of the mean, and selected percentiles, by race/ethnicityand age: United States, 1988–94 . . . . . . . . . . . . . . . . . . . . . . . . . . . . . . . . . . . . . . . . . . . . . . . . . . . . . . . . . . . . . . . . . . . . . . . 58
41. Granulocytes in percentages, measured electronically (Coultery 3-part differential) for males 1 year and over, numberof examined persons, mean, standard deviation, standard error of the mean, and selected percentiles, by race/ethnicityand age: United States, 1988–94 . . . . . . . . . . . . . . . . . . . . . . . . . . . . . . . . . . . . . . . . . . . . . . . . . . . . . . . . . . . . . . . . . . . . . . . 59
42. Granulocytes in percentages, measured electronically (Coultery 3-part differential) for females 1 year and over, numberof examined persons, mean, standard deviation, standard error of the mean, and selected percentiles, by race/ethnicityand age: United States, 1988–94 . . . . . . . . . . . . . . . . . . . . . . . . . . . . . . . . . . . . . . . . . . . . . . . . . . . . . . . . . . . . . . . . . . . . . . . 60
43. Lymphocytes as 109 cells per liter, measured electronically (Coultery 3-part differential) for persons 1 year and over,number of examined persons, mean, standard deviation, standard error of the mean, and selected percentiles, byrace/ethnicity and age: United States, 1988–94 . . . . . . . . . . . . . . . . . . . . . . . . . . . . . . . . . . . . . . . . . . . . . . . . . . . . . . . . . . . 61
44. Lymphocytes as 109 cells per liter, measured electronically (Coultery 3-part differential) for males 1 year and over,number of examined persons, mean, standard deviation, standard error of the mean, and selected percentiles, byrace/ethnicity and age: United States, 1988–94 . . . . . . . . . . . . . . . . . . . . . . . . . . . . . . . . . . . . . . . . . . . . . . . . . . . . . . . . . . . 62
v

45. Lymphocytes as 109 cells per liter, measured electronically (Coultery 3-part differential) for females 1 year and over,number of examined persons, mean, standard deviation, standard error of the mean, and selected percentiles, byrace/ethnicity and age: United States, 1988–94 . . . . . . . . . . . . . . . . . . . . . . . . . . . . . . . . . . . . . . . . . . . . . . . . . . . . . . . . . . . 63
46. Lymphocytes in percentages, measured electronically (Coultery 3-part differential) for persons 1 year and over,number of examined persons, mean, standard deviation, standard error of the mean, and selected percentiles, byrace/ethnicity and age: United States, 1988–94 . . . . . . . . . . . . . . . . . . . . . . . . . . . . . . . . . . . . . . . . . . . . . . . . . . . . . . . . . . . 64
47. Lymphocytes in percentages, measured electronically (Coultery 3-part differential) for males 1 year and over, numberof examined persons, mean, standard deviation, standard error of the mean, and selected percentiles, by race/ethnicityand age: United States, 1988–94 . . . . . . . . . . . . . . . . . . . . . . . . . . . . . . . . . . . . . . . . . . . . . . . . . . . . . . . . . . . . . . . . . . . . . . . 65
48. Lymphocytes in percentages, measured electronically (Coultery 3-part differential) for females 1 year and over,number of examined persons, mean, standard deviation, standard error of the mean, and selected percentiles, byrace/ethnicity and age: United States, 1988–94 . . . . . . . . . . . . . . . . . . . . . . . . . . . . . . . . . . . . . . . . . . . . . . . . . . . . . . . . . . . 66
49. Mononuclear cells as 109 cells per liter, measured electronically (Coultery 3-part differential) for persons 1 year andover, number of examined persons, mean, standard deviation, standard error of the mean, and selected percentiles, byrace/ethnicity and age: United States, 1988–94 . . . . . . . . . . . . . . . . . . . . . . . . . . . . . . . . . . . . . . . . . . . . . . . . . . . . . . . . . . . 67
50. Mononuclear cells as 109 cells per liter, measured electronically (Coultery 3-part differential) for males 1 year andover, number of examined persons, mean, standard deviation, standard error of the mean, and selected percentiles, byrace/ethnicity and age: United States, 1988–94 . . . . . . . . . . . . . . . . . . . . . . . . . . . . . . . . . . . . . . . . . . . . . . . . . . . . . . . . . . . 68
51. Mononuclear cells as 109 cells per liter, measured electronically (Coultery 3-part differential) for females 1 year andover, number of examined persons, mean, standard deviation, standard error of the mean, and selected percentiles, byrace/ethnicity and age: United States, 1988–94 . . . . . . . . . . . . . . . . . . . . . . . . . . . . . . . . . . . . . . . . . . . . . . . . . . . . . . . . . . . 69
52. Mononuclear cells in percentages, measured electronically (Coultery 3-part differential) for persons 1 year and over,number of examined persons, mean, standard deviation, standard error of the mean, and selected percentiles, byrace/ethnicity and age: United States, 1988–94 . . . . . . . . . . . . . . . . . . . . . . . . . . . . . . . . . . . . . . . . . . . . . . . . . . . . . . . . . . . 70
53. Mononuclear cells in percentages, measured electronically (Coultery 3-part differential) for males 1 year and over,number of examined persons, mean, standard deviation, standard error of the mean, and selected percentiles, byrace/ethnicity and age: United States, 1988–94 . . . . . . . . . . . . . . . . . . . . . . . . . . . . . . . . . . . . . . . . . . . . . . . . . . . . . . . . . . . 71
54. Mononuclear cells in percentages, measured electronically (Coultery 3-part differential) for females 1 year and over,number of examined persons, mean, standard deviation, standard error of the mean, and selected percentiles, byrace/ethnicity and age: United States, 1988–94 . . . . . . . . . . . . . . . . . . . . . . . . . . . . . . . . . . . . . . . . . . . . . . . . . . . . . . . . . . . 72
55. Percent distribution of hemoglobin in gram per liter for persons 1 year and over, by race/ethnicity and age:United States, 1988–94. . . . . . . . . . . . . . . . . . . . . . . . . . . . . . . . . . . . . . . . . . . . . . . . . . . . . . . . . . . . . . . . . . . . . . . . . . . . . . . 73
56. Percent distribution of hemoglobin in gram per liter for males 1 year and over, by race/ethnicity and age:United States, 1988–94. . . . . . . . . . . . . . . . . . . . . . . . . . . . . . . . . . . . . . . . . . . . . . . . . . . . . . . . . . . . . . . . . . . . . . . . . . . . . . . 75
57. Percent distribution of hemoglobin in gram per liter for females 1 year and over, by race/ethnicity and age:United States, 1988–94. . . . . . . . . . . . . . . . . . . . . . . . . . . . . . . . . . . . . . . . . . . . . . . . . . . . . . . . . . . . . . . . . . . . . . . . . . . . . . . 77
58. Percent distribution of hematocrit as fractions (liter per liter) for persons 1 year and over, by race/ethnicity and age:United States, 1988–94. . . . . . . . . . . . . . . . . . . . . . . . . . . . . . . . . . . . . . . . . . . . . . . . . . . . . . . . . . . . . . . . . . . . . . . . . . . . . . . 79
59. Percent distribution of hematocrit as fractions (liter per liter) for males 1 year and over, by race/ethnicity and age:United States, 1988–94. . . . . . . . . . . . . . . . . . . . . . . . . . . . . . . . . . . . . . . . . . . . . . . . . . . . . . . . . . . . . . . . . . . . . . . . . . . . . . . 81
60. Percent distribution of hematocrit as fractions (liter per liter) for females 1 year and over, by race/ethnicity and age:United States, 1988–94. . . . . . . . . . . . . . . . . . . . . . . . . . . . . . . . . . . . . . . . . . . . . . . . . . . . . . . . . . . . . . . . . . . . . . . . . . . . . . . 83
61. Percent distribution of red blood cell count as 1012 cells per liter for persons 1 year and over, by race/ethnicityand age: United States, 1988–94 . . . . . . . . . . . . . . . . . . . . . . . . . . . . . . . . . . . . . . . . . . . . . . . . . . . . . . . . . . . . . . . . . . . . . . . 85
62. Percent distribution of red blood cell count as 1012 cells per liter for males 1 year and over, by race/ethnicityand age: United States, 1988–94 . . . . . . . . . . . . . . . . . . . . . . . . . . . . . . . . . . . . . . . . . . . . . . . . . . . . . . . . . . . . . . . . . . . . . . . 86
63. Percent distribution of red blood cell count as 1012 cells per liter for females 1 year and over, by race/ethnicityand age: United States, 1988–94 . . . . . . . . . . . . . . . . . . . . . . . . . . . . . . . . . . . . . . . . . . . . . . . . . . . . . . . . . . . . . . . . . . . . . . . 87
64. Percent distribution of mean cell volume in femtoliter for persons 1 year and over, by race/ethnicity and age:United States, 1988–94. . . . . . . . . . . . . . . . . . . . . . . . . . . . . . . . . . . . . . . . . . . . . . . . . . . . . . . . . . . . . . . . . . . . . . . . . . . . . . . 88
65. Percent distribution of mean cell volume in femtoliter for males 1 year and over, by race/ethnicity and age:United States, 1988–94. . . . . . . . . . . . . . . . . . . . . . . . . . . . . . . . . . . . . . . . . . . . . . . . . . . . . . . . . . . . . . . . . . . . . . . . . . . . . . . 89
66. Percent distribution of mean cell volume in femtoliter for females 1 year and over, by race/ethnicity and age:United States, 1988–94. . . . . . . . . . . . . . . . . . . . . . . . . . . . . . . . . . . . . . . . . . . . . . . . . . . . . . . . . . . . . . . . . . . . . . . . . . . . . . . 90
67. Percent distribution of mean cell hemoglobin in picogram for persons 1 year and over, by race/ethnicity and age:United States, 1988–94. . . . . . . . . . . . . . . . . . . . . . . . . . . . . . . . . . . . . . . . . . . . . . . . . . . . . . . . . . . . . . . . . . . . . . . . . . . . . . . 91
68. Percent distribution of mean cell hemoglobin in picogram for males 1 year and over, by race/ethnicity and age:United States, 1988–94. . . . . . . . . . . . . . . . . . . . . . . . . . . . . . . . . . . . . . . . . . . . . . . . . . . . . . . . . . . . . . . . . . . . . . . . . . . . . . . 92
vi

69. Percent distribution of mean cell hemoglobin in picogram for females 1 year and over, by race/ethnicity and age:United States, 1988–94. . . . . . . . . . . . . . . . . . . . . . . . . . . . . . . . . . . . . . . . . . . . . . . . . . . . . . . . . . . . . . . . . . . . . . . . . . . . . . . 93
70. Percent distribution of mean cell hemoglobin concentration in gram per liter for persons 1 year and over, byrace/ethnicity and age: United States, 1988–94 . . . . . . . . . . . . . . . . . . . . . . . . . . . . . . . . . . . . . . . . . . . . . . . . . . . . . . . . . . . 94
71. Percent distribution of mean cell hemoglobin concentration in gram per liter for males 1 year and over, byrace/ethnicity and age: United States, 1988–94 . . . . . . . . . . . . . . . . . . . . . . . . . . . . . . . . . . . . . . . . . . . . . . . . . . . . . . . . . . . 95
72. Percent distribution of mean cell hemoglobin concentration in gram per liter for females 1 year and over, byrace/ethnicity and age: United States, 1988–94 . . . . . . . . . . . . . . . . . . . . . . . . . . . . . . . . . . . . . . . . . . . . . . . . . . . . . . . . . . . 96
73. Percent distribution of red cell distribution width in percents for persons 1 year and over, by race/ethnicity and age:United States, 1988–94. . . . . . . . . . . . . . . . . . . . . . . . . . . . . . . . . . . . . . . . . . . . . . . . . . . . . . . . . . . . . . . . . . . . . . . . . . . . . . . 97
74. Percent distribution of red cell distribution width in percents for males 1 year and over, by race/ethnicity and age:United States, 1988–94. . . . . . . . . . . . . . . . . . . . . . . . . . . . . . . . . . . . . . . . . . . . . . . . . . . . . . . . . . . . . . . . . . . . . . . . . . . . . . . 99
75. Percent distribution of red cell distribution width in percents for females 1 year and over, by race/ethnicity and age:United States, 1988–94 . . . . . . . . . . . . . . . . . . . . . . . . . . . . . . . . . . . . . . . . . . . . . . . . . . . . . . . . . . . . . . . . . . . . . . . . . . . . . 101
76. Percent distribution of platelet count as 109 cells per liter for persons 1 year and over, by race/ethnicity and age:United States, 1988–94. . . . . . . . . . . . . . . . . . . . . . . . . . . . . . . . . . . . . . . . . . . . . . . . . . . . . . . . . . . . . . . . . . . . . . . . . . . . . . 103
77. Percent distribution of platelet count as 109 cells per liter for males 1 year and over, by race/ethnicity and age:United States, 1988–94 . . . . . . . . . . . . . . . . . . . . . . . . . . . . . . . . . . . . . . . . . . . . . . . . . . . . . . . . . . . . . . . . . . . . . . . . . . . . . 104
78. Percent distribution of platelet count as 109 cells per liter for females 1 year and over, by race/ethnicity and age:United States, 1988–94. . . . . . . . . . . . . . . . . . . . . . . . . . . . . . . . . . . . . . . . . . . . . . . . . . . . . . . . . . . . . . . . . . . . . . . . . . . . . . 105
79. Percent distribution of white blood cell count as 109 cells per liter for persons 1 year and over, by race/ethnicityand age: United States, 1988–94 . . . . . . . . . . . . . . . . . . . . . . . . . . . . . . . . . . . . . . . . . . . . . . . . . . . . . . . . . . . . . . . . . . . . . 106
80. Percent distribution of white blood cell count as 109 cells per liter for males 1 year and over, by race/ethnicity andage: United States, 1988–94. . . . . . . . . . . . . . . . . . . . . . . . . . . . . . . . . . . . . . . . . . . . . . . . . . . . . . . . . . . . . . . . . . . . . . . . . . 107
81. Percent distribution of white blood cell count as 109 cells per liter for females 1 year and over, by race/ethnicityand age: United States, 1988–94 . . . . . . . . . . . . . . . . . . . . . . . . . . . . . . . . . . . . . . . . . . . . . . . . . . . . . . . . . . . . . . . . . . . . . . 108
82. Percent distribution of granulocytes as 109 cells per liter, measured electronically (Coultery 3-part differential) forpersons 1 year and over, by race/ethnicity and age: United States, 1988–94 . . . . . . . . . . . . . . . . . . . . . . . . . . . . . . . . . . . 109
83. Percent distribution of granulocytes as 109 cells per liter, measured electronically (Coultery 3-part differential) formales 1 year and over, by race/ethnicity and age: United States, 1988–94. . . . . . . . . . . . . . . . . . . . . . . . . . . . . . . . . . . . . 111
84. Percent distribution of granulocytes as 109 cells per liter, measured electronically (Coultery 3-part differential) forfemales 1 year and over, by race/ethnicity and age: United States, 1988–94 . . . . . . . . . . . . . . . . . . . . . . . . . . . . . . . . . . . 113
85. Percent distribution of lymphocytes as 109 cells per liter, measured electronically (Coultery 3-part differential) forpersons 1 year and over, by race/ethnicity and age: United States, 1988–94 . . . . . . . . . . . . . . . . . . . . . . . . . . . . . . . . . . . 115
86. Percent distribution of lymphocytes as 109 cells per liter, measured electronically (Coultery 3-part differential) formales 1 year and over, by race/ethnicity and age: United States, 1988–94. . . . . . . . . . . . . . . . . . . . . . . . . . . . . . . . . . . . . 117
87. Percent distribution of lymphocytes as 109 cells per liter, measured electronically (Coultery 3-part differential) forfemales 1 year and over, by race/ethnicity and age: United States, 1988–94 . . . . . . . . . . . . . . . . . . . . . . . . . . . . . . . . . . . 119
88. Percent distribution of mononuclear cells as 109 cells per liter, measured electronically (Coultery 3-part differential)for persons 1 year and over, by race/ethnicity and age: United States, 1988–94 . . . . . . . . . . . . . . . . . . . . . . . . . . . . . . . 121
89. Percent distribution of mononuclear cells as 109 cells per liter, measured electronically (Coultery 3-part differential)for males 1 year and over, by race/ethnicity and age: United States, 1988–94 . . . . . . . . . . . . . . . . . . . . . . . . . . . . . . . . . 122
90. Percent distribution of mononuclear cells as 109 cells per liter, measured electronically (Coultery 3-part differential)for females 1 year and over, by race/ethnicity and age: United States, 1988–94 . . . . . . . . . . . . . . . . . . . . . . . . . . . . . . . . 123
91. Serum iron in microgram per deciliter for persons 1 year and over, number of examined persons, mean, standarddeviation, standard error of the mean, and selected percentiles, by race/ethnicity and age: United States, 1988–94 . . . . 124
92. Serum iron in microgram per deciliter for males 1 year and over, number of examined males, mean, standarddeviation, standard error of the mean, and selected percentiles, by race/ethnicity and age: United States, 1988–94 . . . . 125
93. Serum iron in microgram per deciliter for females 1 year and over, number of examined females, mean, standarddeviation, standard error of the mean, and selected percentiles, by race/ethnicity and age: United States, 1988–94 . . . . 126
94. Serum total iron-binding capacity in microgram per deciliter for persons 1 year and over, number ofexamined persons, mean, standard deviation, standard error of the mean, and selected percentiles, by race/ethnicityand age: United States, 1988–94 . . . . . . . . . . . . . . . . . . . . . . . . . . . . . . . . . . . . . . . . . . . . . . . . . . . . . . . . . . . . . . . . . . . . . 127
95. Serum total iron-binding capacity in microgram per deciliter for males 1 year and over, number of examined males,mean, standard deviation, standard error of the mean, and selected percentiles, by race/ethnicity and age:United States, 1988–94. . . . . . . . . . . . . . . . . . . . . . . . . . . . . . . . . . . . . . . . . . . . . . . . . . . . . . . . . . . . . . . . . . . . . . . . . . . . . . 128
96. Serum total iron-binding capacity in microgram per deciliter for females 1 year and over, number ofexamined females, mean, standard deviation, standard error of the mean, and selected percentiles, by race/ethnicityand age: United States, 1988–94 . . . . . . . . . . . . . . . . . . . . . . . . . . . . . . . . . . . . . . . . . . . . . . . . . . . . . . . . . . . . . . . . . . . . . . 129
vii

97. Transferrin saturation in percentages for persons 1 year and over, number of examined persons, mean, standarddeviation, standard error of the mean, and selected percentiles, by race/ethnicity and age: United States, 1988–94 . . . 130
98. Transferrin saturation in percentages for males 1 year and over, number of examined males, mean, standard deviation,standard error of the mean, and selected percentiles, by race/ethnicity and age: United States, 1988–94 . . . . . . . . . . . . 131
99. Transferrin saturation in percentages for females 1 year and over, number of examined females, mean, standarddeviation, standard error of the mean, and selected percentiles, by race/ethnicity and age: United States, 1988–94 . . . . 132
100. Erythrocyte protoporphyrin in microgram per deciliter of red blood cells for persons 1 year and over, number ofexamined persons, mean, standard deviation, standard error of the mean, and selected percentiles, by race/ethnicityand age: United States, 1988–94 . . . . . . . . . . . . . . . . . . . . . . . . . . . . . . . . . . . . . . . . . . . . . . . . . . . . . . . . . . . . . . . . . . . . . . 133
101. Erythrocyte protoporphyrin in microgram per deciliter of red blood cells for males 1 year and over, number ofexamined males, mean, standard deviation, standard error of the mean, and selected percentiles, by race/ethnicity andage: United States, 1988–94. . . . . . . . . . . . . . . . . . . . . . . . . . . . . . . . . . . . . . . . . . . . . . . . . . . . . . . . . . . . . . . . . . . . . . . . . . 134
102. Erythrocyte protoporphyrin in microgram per deciliter of red blood cells for females 1 year and over, number ofexamined females, mean, standard deviation, standard error of the mean, and selected percentiles, by race/ethnicityand age: United States, 1988–94 . . . . . . . . . . . . . . . . . . . . . . . . . . . . . . . . . . . . . . . . . . . . . . . . . . . . . . . . . . . . . . . . . . . . . . 135
103. Serum ferritin in nanogram per milliliter for persons 1 year and over, number of examined persons, mean, standarddeviation, standard error of the mean, and selected percentiles, by race/ethnicity and age: United States, 1988–94 . . . . 136
104. Serum ferritin in nanogram per milliliter for males 1 year and over, number of examined males, mean, standarddeviation, standard error of the mean, and selected percentiles, by race/ethnicity and age: United States, 1988–94 . . . . 137
105. Serum ferritin in nanogram per milliliter for females 1 year and over, number of examined females, mean, standarddeviation, standard error of the mean, and selected percentiles, by race/ethnicity and age: United States, 1988–94 . . . . 138
106. Percent distribution of serum iron in microgram per deciliter for persons 1 year and over, by race/ethnicity andage: United States, 1988–94. . . . . . . . . . . . . . . . . . . . . . . . . . . . . . . . . . . . . . . . . . . . . . . . . . . . . . . . . . . . . . . . . . . . . . . . . . 139
107. Percent distribution of serum iron in microgram per deciliter for males 1 year and over, by race/ethnicity andage: United States, 1988–94 . . . . . . . . . . . . . . . . . . . . . . . . . . . . . . . . . . . . . . . . . . . . . . . . . . . . . . . . . . . . . . . . . . . . . . . . . 141
108. Percent distribution of serum iron in microgram per deciliter for females 1 year and over, by race/ethnicity andage: United States, 1988–94. . . . . . . . . . . . . . . . . . . . . . . . . . . . . . . . . . . . . . . . . . . . . . . . . . . . . . . . . . . . . . . . . . . . . . . . . . 143
109. Percent distribution of serum total iron-binding capacity in microgram per deciliter for persons 1 year and over, byrace/ethnicity and age: United States, 1988–94 . . . . . . . . . . . . . . . . . . . . . . . . . . . . . . . . . . . . . . . . . . . . . . . . . . . . . . . . . . 145
110. Percent distribution of serum total iron-binding capacity in microgram per deciliter for males 1 year and over, byrace/ethnicity and age: United States, 1988–94 . . . . . . . . . . . . . . . . . . . . . . . . . . . . . . . . . . . . . . . . . . . . . . . . . . . . . . . . . . 146
111. Percent distribution of serum total iron-binding capacity in microgram per deciliter for females 1 year and over, byrace/ethnicity and age: United States, 1988–94 . . . . . . . . . . . . . . . . . . . . . . . . . . . . . . . . . . . . . . . . . . . . . . . . . . . . . . . . . . 147
112. Percent distribution of transferrin saturation in percent for persons 1 year and over, by race/ethnicity and age:United States, 1988–94. . . . . . . . . . . . . . . . . . . . . . . . . . . . . . . . . . . . . . . . . . . . . . . . . . . . . . . . . . . . . . . . . . . . . . . . . . . . . . 148
113. Percent distribution of transferrin saturation in percents for males 1 year and over, by race/ethnicity and age:United States, 1988–94. . . . . . . . . . . . . . . . . . . . . . . . . . . . . . . . . . . . . . . . . . . . . . . . . . . . . . . . . . . . . . . . . . . . . . . . . . . . . . 149
114. Percent distribution of transferrin saturation in percents for females 1 year and over, by race/ethnicity and age:United States, 1988–94 . . . . . . . . . . . . . . . . . . . . . . . . . . . . . . . . . . . . . . . . . . . . . . . . . . . . . . . . . . . . . . . . . . . . . . . . . . . . . 150
115. Percent distribution of erythrocyte protoporphyrin in microgram per deciliter of red blood cells for persons 1 year andover, by race/ethnicity and age: United States, 1988–94 . . . . . . . . . . . . . . . . . . . . . . . . . . . . . . . . . . . . . . . . . . . . . . . . . . . 151
116. Percent distribution of erythrocyte protoporphyrin in microgram per deciliter of red blood cells for males 1 year andover, by race/ethnicity and age: United States, 1988–94 . . . . . . . . . . . . . . . . . . . . . . . . . . . . . . . . . . . . . . . . . . . . . . . . . . . 152
117. Percent distribution of erythrocyte protoporphyrin in microgram per deciliter of red blood cells for females 1 year andover, by race/ethnicity and age: United States, 1988–94 . . . . . . . . . . . . . . . . . . . . . . . . . . . . . . . . . . . . . . . . . . . . . . . . . . . 153
118. Percent distribution of serum ferritin in nanogram per milliliter for persons 1 year and over, by race/ethnicity andage: United States, 1988–94. . . . . . . . . . . . . . . . . . . . . . . . . . . . . . . . . . . . . . . . . . . . . . . . . . . . . . . . . . . . . . . . . . . . . . . . . . 154
119. Percent distribution of serum ferritin in nanogram per milliliter for males 1 year and over, by race/ethnicity andage: United States, 1988–94. . . . . . . . . . . . . . . . . . . . . . . . . . . . . . . . . . . . . . . . . . . . . . . . . . . . . . . . . . . . . . . . . . . . . . . . . . 155
120. Percent distribution of serum ferritin in nanogram per milliliter for females 1 year and over, by race/ethnicity andage: United States, 1988–94. . . . . . . . . . . . . . . . . . . . . . . . . . . . . . . . . . . . . . . . . . . . . . . . . . . . . . . . . . . . . . . . . . . . . . . . . . 156
viii

ObjectivesThis report presents national
estimates of hematologic andiron-related analytes for persons 1 yearof age and over, by age, sex, andrace/ethnicity.
MethodsThe analysis is based on data from
the third National Health and NutritionExamination Survey (NHANES III)(1988–94), which was designed toprovide information on the health andnutritional status of the civiliannoninstitutionalized U.S. population.The sample used for these analysesincluded the 26,372 participants whohad laboratory tests.
ResultsThis report provides mean, standard
error of the mean, median, andpercentile laboratory values for the U.S.population, 1988–94, for hematologicaland iron-related analytes. In addition,percentage distributions are provided.
ConclusionsData on hematological and iron
analytes provide reference values forclinical and longitudinal comparisons.
Keywords: NHANES III c healthstatus c hemoglobin c hematocrit cred blood cells c white blood cells cplatelets c serum iron c ferritin cerythrocyte protoporphyrin c U.S.population
Hematological and Iron-RelatedAnalytes—Reference Data forPersons Aged 1 Year and Over:United States, 1988–94by Joseph G. Hollowell, M.D., M.P.H., University of Kansas MedicalCenter and McKing Consulting Corporation; Onno W. van Assendelft,M.D., Ph.D., National Center for Infectious Diseases, Centers forDisease Control and Prevention (CDC); Elaine W. Gunter, B.S.,M.T.(ASCP), National Center for Environmental Health, CDC;Brenda G. Lewis, M.P.H., M.T.(ASCP) and Matthew Najjar, B.A.,National Center for Health Statistics, CDC; and Christine Pfeiffer,Ph.D., National Center for Environmental Health, CDC
Introduction
This report describes theconcentrations of hematologicalelements, iron, and iron-carrying
proteins in the blood and presentsreference data for the U.S. population 1year of age and over, by sex,race/ethnicity group, and age. Thesource for these data is the thirdNational Health and NutritionExamination Survey (NHANES III),conducted from 1988 through 1994 bythe National Center for Health Statistics(NCHS), Centers for Disease Controland Prevention (CDC).
The National Health and NutritionExamination Surveys (NHANES) aredesigned to provide information on thehealth and nutritional status of thecivilian noninstitutionalized populationof the United States. The surveyprogram was begun in 1960 with threesurveys of health status, the NationalHealth Examination Surveys (NHES)(1–3). In 1970 an expanded nutritioncomponent was added to provide datawith which to assess nutritional statusand dietary practices, and the name was
changed to the National Health andNutrition Examination Survey (4,5).NHANES III is the seventh nationalsurvey. The current NHANES wasfielded in 1999 and is a continuouslyrunning survey.
One of the goals of NHANES IIIwas to estimate national populationreference distributions of selected healthparameters, including nutritional statusindicators. This report provides nationalreference data on count, size, andhemoglobin content of erythrocytes (redblood cells or RBCs); the count andpercentage of various types ofleukocytes (white blood cells or WBCs);and the count and size of thrombocytes(platelets) in blood. It also providesreference data on the concentration ofiron, total iron-binding capacity (TIBC),ferritin, transferrin saturation, anderythrocyte protoporphyrin. As acornerstone of the National NutritionMonitoring and Related ResearchProgram, NHANES provides data forpublic policy decisions and programplanning, including the regulation offood fortification (6).
Page 1

Page 2 [ Series 11, No. 247
Methods
Survey and SampleCollection Methods
Source of Data and SurveyDesign
NHANES III used a stratified,multistage design to obtain arepresentative probability sample of thecivilian noninstitutionalized populationof the United States, 2 months of ageand over. The survey was conductedfrom October 1988 through October1994 and was designed as two 3-yearphases, each of which constitutes anational probability sample. The 6-yearsample, also a national probabilitysample, provides more statisticallyreliable estimates because of its largersize. Subgroups of the population wereoversampled to allow increasedprecision in estimates for these groups;subgroups included non-Hispanic blackpersons, Mexican-American persons, allchildren 2 months to 5 years of age, andall persons 60 years of age and over. Adetailed description of sample designspecifications and other methods of thesurvey is included in the Plan andOperation of the Third National Healthand Nutrition Examination Survey,1988–94 (7). Sample collections,procedures, and methods related tolaboratory examinations are found inLaboratory Methods Used for the ThirdNational Health and NutritionExamination Survey (NHANES III),1988–94, a component of the abovereference (8).
The survey included an interviewconducted in the household and anexamination at a mobile examinationcenter (MEC). Information obtainedduring the interview included individualcharacteristics such as sex, age,self-reported race and ethnicity, years ofeducation completed, and householdincome information. The intervieweralso asked questions on selected healthconditions and behaviors, includinginformation on smoking and use ofvitamin or mineral supplements.
The MEC examination consisted ofa variety of physical measurements, a
phlebotomy, and an additional personalinterview. To increase response rates, ahome examination was offered to frailolder people or others unable to travelto the MEC. The home examination wasmore limited than the MEC examinationbut did include a phlebotomy and aninterview. The home examinations canaccount for the 134 individuals age 70years and over who had blood tests butwho were not examined at the MEC.
The categories of age andrace/ethnicity used for the tables in thisreport are based on the sample designsubdomains and are those recommendedfor improved precision of estimates inthe ‘‘Key Variables for Analysis’’section of the NHANES III AnalyticGuidelines (7). In this series report, ageis defined as age in years at the lastbirthday at the time of the householdinterview. Self-reported race andHispanic ethnicity were obtained duringthe interview. Separate estimates arepresented only for non-Hispanic whitepersons, non-Hispanic black persons,and Mexican-American persons; personsof other race/ethnicity were not reportedin sufficient numbers to allow reliableestimates but are included in the totalcategory of all racial/ethnic groups.
Before the examinee underwentphlebotomy, a questionnaire wasadministered to determine eligibility forall phlebotomy procedures, includingquestions to determine risks that wouldprohibit the venipuncture, such as theexaminee being a diagnosedhemophiliac or currently takingblood-thinning medication. Questionswere also asked to document anddetermine fasting compliance, and thetime of the day of the venipuncture wasrecorded to aid in interpreting the resultsof the laboratory tests performed.Examinees age 12 years and over wereinstructed to fast for 10–16 hours beforethe morning examination or for 6 hoursbefore the afternoon or eveningexamination.
Examination and SpecimenCollection
The examination componentconsisted of interviews and a series oftests and procedures that included:
+ A general medical examination andscreening by a physician, includingadditional medical historyinformation.
+ Body measurements.+ A dietary interview.+ Laboratory tests on whole blood,
serum, plasma, and urine specimens.+ Selected tests such as blood pressure
and bone density.
The examination component wasperformed in identically equipped MECsspecially designed for this study.Because of strict adherence to continuityof protocols for the duration of thesurvey, environment and equipmentcontributions to differences betweenexamination findings from one samplelocation to another were minimized. Thefull-time examination teams werespecifically trained to follow the studyprotocols, which provided forstandardization and evaluation of theirperformance.
Specimen Collection
Serum, plasma, and whole bloodspecimens were collected from surveyparticipants by NCHS field laboratorypersonnel and were sent for analyses toCDC laboratories and to 23 contractlaboratories.
Venipuncture
The primary area from which theblood was drawn was the antecubitalfossa; the dorsum of the hand was asecondary site. With the examinee in arecumbent position, the venipuncturearea was cleansed with alcohol, and atourniquet was applied proximal to thesite. Once the needle was inserted intothe vein, the tourniquet was released tofree the flow of blood.
Unlike previous NHANES, noattempt was made in NHANES III tocollect blood specimens from smallchildren by fingerstick collectiontechniques. Even though explicitprotocols for proper collection had beenfollowed in previous surveys, these datainvariably were deleted from the databecause of hemodilution of fingersticksamples (caused by excessive milking),inadequate sample volumes, breakage ofcontainers during shipment, or possiblecontamination of the blood lead

Series 11, No. 247 [ Page 3
specimen. Therefore, NCHS decidedthat no attempt would be made tocollect blood from children under 1 yearof age. Furthermore, MEC teamsreceived extensive training in pediatricphlebotomy techniques, includinginstruction by a pediatric nursepractitioner, which they usedsuccessfully in collecting blood fromyoung children 1 year and over.Volumes of blood collected fromNHANES participants ranged from 7mL from children 1–3 years old to 100+mL in some adults 20–59 years old. Forthe hematologic measurements, 3-mLevacuated specimen tubes with K3EDTAanticoagulant (0.06 mL, 7.5 percent)were used.
Survey Response Rates andSample Sizes
Survey response rates and samplesizes for all 6 years of NHANES III aresummarized in table A. Of the 37,489persons 1 year and over who wereselected over the 6 years of the survey,31,887 (85.1 percent) were interviewedin their homes. All interviewed persons
Table A. Sample size and response rates of persex, and race/ethnicity: United States, 1988–94
Characteristic
Age
1 year and over . . . . . . . . . . . . . . . . . . . . . . . . .1–2 years . . . . . . . . . . . . . . . . . . . . . . . . . . .3–5 years . . . . . . . . . . . . . . . . . . . . . . . . . . .6–8 years . . . . . . . . . . . . . . . . . . . . . . . . . . .9–11 years . . . . . . . . . . . . . . . . . . . . . . . . . . .12–14 years . . . . . . . . . . . . . . . . . . . . . . . . . .15–19 years . . . . . . . . . . . . . . . . . . . . . . . . . .20–29 years . . . . . . . . . . . . . . . . . . . . . . . . . .30–39 years . . . . . . . . . . . . . . . . . . . . . . . . . .40–49 years . . . . . . . . . . . . . . . . . . . . . . . . . .50–59 years . . . . . . . . . . . . . . . . . . . . . . . . . .60–69 years . . . . . . . . . . . . . . . . . . . . . . . . . .70 years and over . . . . . . . . . . . . . . . . . . . . . .
Sex
Male . . . . . . . . . . . . . . . . . . . . . . . . . . . . . . .Female . . . . . . . . . . . . . . . . . . . . . . . . . . . . .
Race/ethnic group
Non-Hispanic white . . . . . . . . . . . . . . . . . . . . . .Non-Hispanic black . . . . . . . . . . . . . . . . . . . . . .Mexican American . . . . . . . . . . . . . . . . . . . . . .Others . . . . . . . . . . . . . . . . . . . . . . . . . . . . .
1MEC is mobile examination center.2A home visit that included phlebotomy for blood tests for people nMEC.
were invited to the MEC for a medicalexamination. Seventy-seven percent(28,857) of the selected persons 1 yearof age and over were examined in theMEC or in the home, and 26,372(70.3 percent) had at least one bloodtest. Each data table lists the totalnumber of persons who had valid testsfor that specific analyte.
Laboratory Methods forHematology andDefinitions
Definitions of HematologicalElements
Red blood cell count (erythrocytecount; RBC) × 1012/L—The number ofRBCs in a given volume of blood. AnRBC is a hemoglobin-containing,deformable, biconcave disk composed ofprotein-lipid stroma with a lipidperipheral cell membrane. The maturecells do not contain a nucleus.
Hemoglobin concentration (Hb)g/L—The red, iron-containing
sons 1 year and over for the Third National Hea
Samplesize
(number)
Interviewed
Number Percent Nu
. . . 37,489 31,887 85.1 28
. . . 2,839 2,689 94.7 2
. . . 3,720 3,465 93.1 3
. . . 1,845 1,690 91.6 1
. . . 1,940 1,777 91.6 1
. . . 1,494 1,345 90.0 1
. . . 2,393 2,096 87.6 1
. . . 4,437 3,783 85.3 3
. . . 4,357 3,594 82.5 3
. . . 3,469 2,794 80.5 2
. . . 2,620 2,058 78.5 1
. . . 3,346 2,608 77.9 2
. . . 5,029 3,988 79.3 2
. . . 18,037 15,228 84.4 13
. . . 19,452 16,659 85.6 15
. . . 14,495 11,868 81.9 10
. . . 10,721 9,300 86.7 8
. . . 10,723 9,382 87.5 8
. . . 1,549 1,336 86.3 1
ot able to travel to the MEC can explain why the number of persons w
chromoprotein within a circulatingmature RBC that has the primaryphysiologic function of oxygen transportand also plays a role in carbon dioxidetransport. Measurement of hemoglobinitself is a direct means of determiningthe presence of anemia, which is mostfrequently associated with irondeficiency.
Hematocrit level (relative volumeof erythrocytes; Hct) L/L—A measureof the volume of RBCs in a givenvolume of blood. Hematocrit level isoften used as a diagnostic screening toolfor nutritional or iron deficiency. Thismeasurement alone is not conclusive indetecting iron deficiency, although it isuseful in the diagnosis of anemia forwhich there are many additional causes.
Mean corpuscular volume (MCV)fL (femtoliter; 10-15L)—The averagevolume of the individual RBCs of theblood sample.
Mean corpuscular hemoglobin(MCH) pg (picogram; 10-12g)—Theaverage amount of hemoglobin byweight in the individual RBCs of theblood sample.
lth and Nutrition Examination Survey, by age,
MEC-examined1 Blood-tested
mber Percent Number Percent
,857 77.0 26,372 70.3,527 89.0 1,786 62.9,260 87.6 2,618 70.4,601 86.8 1,384 75.0,685 86.9 1,507 77.7,274 85.3 1,161 77.7,937 80.9 1,786 74.6,508 79.1 3,331 75.1,328 76.4 3,158 72.5,582 74.4 2,467 71.1,853 70.7 1,802 68.8,309 69.0 2,242 67.0,993 59.5 23,127 62.2
,799 76.5 12,623 70.0,058 77.4 13,749 70.7
,167 70.1 9,521 65.7,694 81.1 7,749 72.3,741 81.5 7,945 74.1,255 81.0 1,157 74.7
ith blood tests exceeds the number who were examined in the
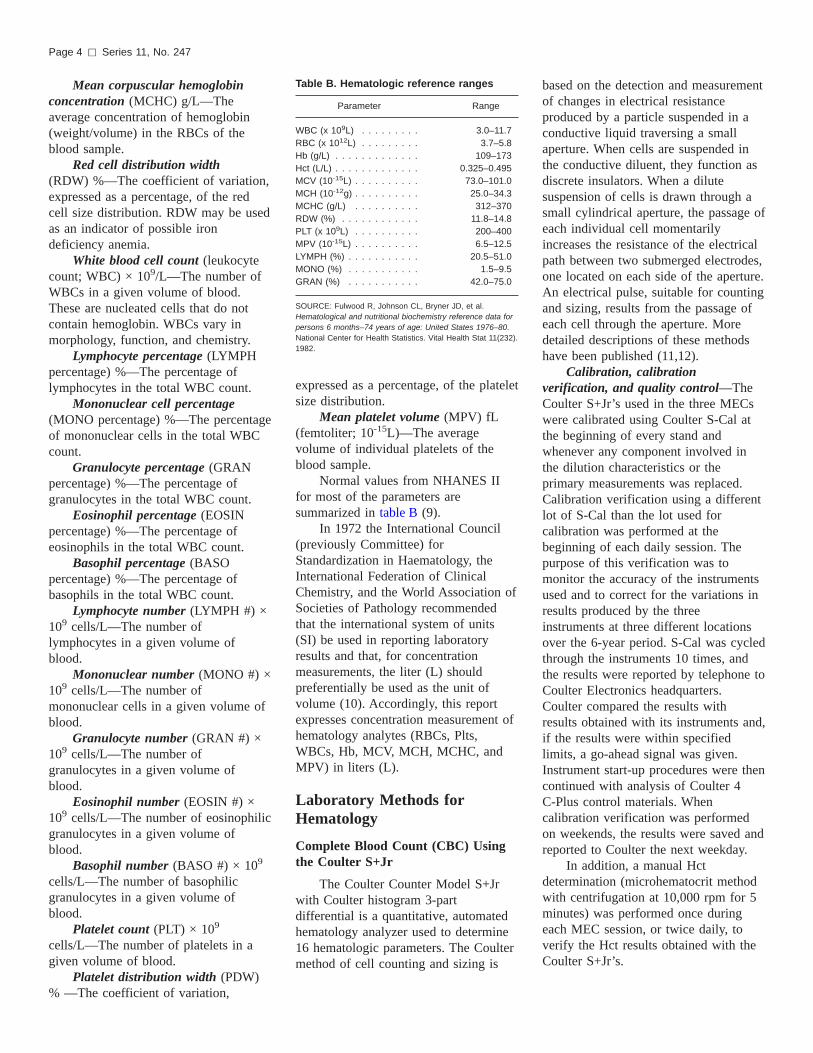
Table B. Hematologic reference ranges
Parameter Range
WBC (x 109L) . . . . . . . . . 3.0–11.7RBC (x 1012L) . . . . . . . . . 3.7–5.8Hb (g/L) . . . . . . . . . . . . . 109–173Hct (L/L) . . . . . . . . . . . . . 0.325–0.495MCV (10-15L) . . . . . . . . . . 73.0–101.0MCH (10-12g) . . . . . . . . . . 25.0–34.3MCHC (g/L) . . . . . . . . . . 312–370RDW (%) . . . . . . . . . . . . 11.8–14.8PLT (x 109L) . . . . . . . . . . 200–400MPV (10-15L) . . . . . . . . . . 6.5–12.5LYMPH (%) . . . . . . . . . . . 20.5–51.0MONO (%) . . . . . . . . . . . 1.5–9.5GRAN (%) . . . . . . . . . . . 42.0–75.0
SOURCE: Fulwood R, Johnson CL, Bryner JD, et al.Hematological and nutritional biochemistry reference data forpersons 6 months–74 years of age: United States 1976–80.National Center for Health Statistics. Vital Health Stat 11(232).1982.
Page 4 [ Series 11, No. 247
Mean corpuscular hemoglobinconcentration (MCHC) g/L—Theaverage concentration of hemoglobin(weight/volume) in the RBCs of theblood sample.
Red cell distribution width(RDW) %—The coefficient of variation,expressed as a percentage, of the redcell size distribution. RDW may be usedas an indicator of possible irondeficiency anemia.
White blood cell count (leukocytecount; WBC) × 109/L—The number ofWBCs in a given volume of blood.These are nucleated cells that do notcontain hemoglobin. WBCs vary inmorphology, function, and chemistry.
Lymphocyte percentage (LYMPHpercentage) %—The percentage oflymphocytes in the total WBC count.
Mononuclear cell percentage(MONO percentage) %—The percentageof mononuclear cells in the total WBCcount.
Granulocyte percentage (GRANpercentage) %—The percentage ofgranulocytes in the total WBC count.
Eosinophil percentage (EOSINpercentage) %—The percentage ofeosinophils in the total WBC count.
Basophil percentage (BASOpercentage) %—The percentage ofbasophils in the total WBC count.
Lymphocyte number (LYMPH #) ×109 cells/L—The number oflymphocytes in a given volume ofblood.
Mononuclear number (MONO #) ×109 cells/L—The number ofmononuclear cells in a given volume ofblood.
Granulocyte number (GRAN #) ×109 cells/L—The number ofgranulocytes in a given volume ofblood.
Eosinophil number (EOSIN #) ×109 cells/L—The number of eosinophilicgranulocytes in a given volume ofblood.
Basophil number (BASO #) × 109
cells/L—The number of basophilicgranulocytes in a given volume ofblood.
Platelet count (PLT) × 109
cells/L—The number of platelets in agiven volume of blood.
Platelet distribution width (PDW)% —The coefficient of variation,
expressed as a percentage, of the plateletsize distribution.
Mean platelet volume (MPV) fL(femtoliter; 10-15L)—The averagevolume of individual platelets of theblood sample.
Normal values from NHANES IIfor most of the parameters aresummarized in table B (9).
In 1972 the International Council(previously Committee) forStandardization in Haematology, theInternational Federation of ClinicalChemistry, and the World Association ofSocieties of Pathology recommendedthat the international system of units(SI) be used in reporting laboratoryresults and that, for concentrationmeasurements, the liter (L) shouldpreferentially be used as the unit ofvolume (10). Accordingly, this reportexpresses concentration measurement ofhematology analytes (RBCs, Plts,WBCs, Hb, MCV, MCH, MCHC, andMPV) in liters (L).
Laboratory Methods forHematology
Complete Blood Count (CBC) Usingthe Coulter S+Jr
The Coulter Counter Model S+Jrwith Coulter histogram 3-partdifferential is a quantitative, automatedhematology analyzer used to determine16 hematologic parameters. The Coultermethod of cell counting and sizing is
based on the detection and measurementof changes in electrical resistanceproduced by a particle suspended in aconductive liquid traversing a smallaperture. When cells are suspended inthe conductive diluent, they function asdiscrete insulators. When a dilutesuspension of cells is drawn through asmall cylindrical aperture, the passage ofeach individual cell momentarilyincreases the resistance of the electricalpath between two submerged electrodes,one located on each side of the aperture.An electrical pulse, suitable for countingand sizing, results from the passage ofeach cell through the aperture. Moredetailed descriptions of these methodshave been published (11,12).
Calibration, calibrationverification, and quality control—TheCoulter S+Jr’s used in the three MECswere calibrated using Coulter S-Cal atthe beginning of every stand andwhenever any component involved inthe dilution characteristics or theprimary measurements was replaced.Calibration verification using a differentlot of S-Cal than the lot used forcalibration was performed at thebeginning of each daily session. Thepurpose of this verification was tomonitor the accuracy of the instrumentsused and to correct for the variations inresults produced by the threeinstruments at three different locationsover the 6-year period. S-Cal was cycledthrough the instruments 10 times, andthe results were reported by telephone toCoulter Electronics headquarters.Coulter compared the results withresults obtained with its instruments and,if the results were within specifiedlimits, a go-ahead signal was given.Instrument start-up procedures were thencontinued with analysis of Coulter 4C-Plus control materials. Whencalibration verification was performedon weekends, the results were saved andreported to Coulter the next weekday.
In addition, a manual Hctdetermination (microhematocrit methodwith centrifugation at 10,000 rpm for 5minutes) was performed once duringeach MEC session, or twice daily, toverify the Hct results obtained with theCoulter S+Jr’s.

Series 11, No. 247 [ Page 5
Direct and Derived Values forComplete Blood Count
1. The directly measured parametersfrom the Coulter S+Jr’s are WBC,RBC, and Hb.
2. The derived parameters with theirformulas are as follows:
a. MCV—derived from the RBChistogram
b. PLT—derived from the platelethistogram
c. MPV—derived from the platelethistogram
All particles between 2 and 20 fLcounted in the RBC channel areclassified as platelets. A platelet sizedistribution histogram is obtained. Usinga least-squares fit method, threelognormal curves are fitted. The counterthen determines PLT, MPV, and PDWfrom the fitted curves.
d. Lymph percentage—derived fromthe WBC histogram
e. Mono percentage—derived fromthe WBC histogram
f. Gran percentage—derived fromthe WBC histogram
Cells larger than 35 fL remaining insuspension after erythrocytes havebeen lysed are classified as WBC.Under the controlled conditions oflysis, three distinct populations ofwhite cells can be demonstrated.The smallest cells are the matureand variant lymphocytes. Themidsize population is occupied bylarge mononuclear cells andincludes monocytes, blast cells,promyelocytes, prolymphocytes,promonocytes, myelocytes, andplasma cells. The thirdsubpopulation, granulocytes,consists of metamyelocytes,eosinophils, basophils, bandneutrophils, and segmentedneutrophils.
3. The computed parameters with theirformulas are as follows:
a. Hematocrit—RBC (× 1012/L) ×MCV (fL)
b. MCH—Hb (g/L)/RBC (× 1012/L)
c. MCHC—Hb (g/L)/Hct (L/L)
d. Lymph #—(Lymph %/100) ×electronic WBC count
e. Mono #—(Mono %/100) ×electronic WBC count
f. Gran #—(Gran %/100) ×electronic WBC count
g. RDW—The size distribution ofthe RBC population expressed asthe coefficient of variation
h. PDW—The size distribution ofthe PLT population expressed as thecoefficient of variation
i. Eosinophils and basophils weremeasured from a blood smear takenfrom persons whose WBC wasoutside the 95 percent referencerange (table A) and 10 percent ofpersons whose WBC was within the95 percent reference range. Thesmear was stained, and thepercentage of each cell type wasdetermined by visual microscopy.The number of each cell type wasalso calculated (cell type %/100) ×electronic total WBC from theCoulter Counter.
Definitions of Iron andIron-Related Analytes
The iron and related analytespresented in this report are defined asfollows:
Serum iron (µg/dL)—The amountof iron in a given amount of serum.Approximately two-thirds of total bodyiron is functional iron, mostly in theform of hemoglobin within thecirculating erythrocytes. Otheriron-containing enzymes and myoglobinmake up about 15 percent of functionaliron. The remaining iron is storage iron,that is, ferritin and hemosiderin (13).The measurement of serum iron isuseful in detecting iron-deficient states.Low levels of serum iron are found notonly in iron-deficiency anemia but alsooften in individuals who are sufferingfrom infectious or chronic inflammatorydiseases or from cancer (14).
Serum total iron-binding capacity(TIBC) (µg/dL)—The measure of themaximum amount of iron that a givenserum sample can contain. Serum TIBC
permits some distinction to be madebetween iron deficiency (in whichvalues are usually elevated) andinfectious, chronic inflammatorydiseases and neoplastic disease (inwhich values are often depressed).
Normal Ranges for Serum Iron andTIBC
Iron values for adult males (over 20years old) are generally higher thanthose for adult females, and childrenhave lower values than adults. Low ironvalues in conjunction with elevatedTIBC (yielding less than 15 percentsaturation) are generally indicative ofiron deficiency anemia.
Normal ranges (5th–95thpercentiles) for the U.S. populationbased on NHANES II data (9) are asfollows:
Males 18 years old or over: 60–190µg/dL iron, 300–455 µg/dL TIBC
Females 18 years old or over:40–175 µg/dL iron, 285–510 µg/dLTIBC
Children 3–7 years old: 32–175µg/dL iron, 305–490 µg/dL TIBC
Transferrin saturation (%)—Anestimation of the degree of saturation ofthe iron transport protein. It reflects theadequacy of iron transport to the tissue(12). This determination is more usefulin the detection of iron deficiency thanserum iron or TIBC alone. In irondeficiency anemia, the percentage oftransferrin saturation is usually low; ininfections, which often show a lowserum iron value, the percentage oftransferrin saturation value is morelikely to be only moderately depressed.Very elevated transferrin saturation(greater than 50 percent for females andgreater than 60 percent for males) is agood screening indicator forhemochromatosis, that is, iron overload(12).
Ferritin (ng/mL)—A major ironstorage protein, like hemoglobin.Isoferritin moieties have been identifiedfor liver and spleen (L isoferritin) andfor heart and kidney (H isoferritin).Serum ferritin levels increase as a resultof iron overload, aging, infection,inflammation, liver disease, juvenilerheumatoid arthritis, leukemia, and

Page 6 [ Series 11, No. 247
Hodgkin’s disease; and they decrease asa result of iron deficiency (15).
Erythrocyte protoporphyrin (EP)(µg/dL RBC)—Protoporphyrin IX(PPIX) combines with iron to formheme, a constituent of hemoglobin inthe blood. Protoporphyrin consists offour substituted methyl pyrole ringslinked by methene bridges. In cases ofiron deficiency, where inadequate iron isavailable to form heme, zinc ispreferentially substituted to form zincprotoporphyrin (ZP), a highlyfluorescent compound. In leadpoisoning, the insertion of iron is alsoblocked, and ZP is formed. Erythrocyteprotoporphyrin is also elevated inerythropoietic protoporphyria, a rarehereditary metabolic disease.
Normal Ranges for EP
Based on NHANES II data, femalestend to have higher average EP valuesthan males, and children tend to havehigher average values than adults (13).
Children under 6 years old: 36–97µg/dL RBC
Children 6–14 years old: 37–83µg/dL RBC
Males 15–74 years old: 33–81µg/dL RBC
Females 15–74 years old: 37–93µg/dL RBC
Laboratory Methods for Ironand Iron-Related Analytes
Serum Iron and TIBC
Serum iron and TIBC are measuredby a modification of the automatedTechnicon AAII-25t method, which isbased on the procedures of Giovannielloet al., and Ramsey (8,16,17).
The method has been modifiedfurther to be performed on an AlpkemtRFA (rapid-flow analysis) system. Ironis quantitated by measuring the intensityof the violet complex formed in thereaction between Ferroziney and Fe++in an acetate buffer at 562 nm. Thioureais added to complex Cu++, which canalso bind with Ferroziney and yieldfalsely elevated iron values. Dialysis isused to remove protein interference. InTIBC determinations, serum is mixedwith 400 µg/dL iron solution to saturate
the iron-binding sites of the serumtransferrin molecules. Magnesiumcarbonate is used to remove excess iron.The magnesium carbonate is precipitatedby centrifugation, and the supernatant ismeasured for iron content.
CDC modifications to theTechnicon AAII-25t method—Thereagent concentrations used and theirratios are based on proceduresdeveloped at CDC. In a modificationdeveloped in conjunction with Alpkem,Type H rather than type C membranesare used in order to provide maximumefficiency of dialysis. Ferroziney aswell as thiourea is incorporated into theacetate buffer (8).
Transferrin Saturation
The transferrin saturation valueswere calculated using the examinee’sserum iron and TIBC values as follows:
Transferrin saturation (%) =Serum Iron (µg/dL)
TIBC (µg/dL) c 100
Ferritin
Ferritin is measured using theBio-Rad Laboratories’ ‘‘QuantimunetFerritin IRMA’’ kit, which is asingle-incubation 2-site immuno-radiometric assay (IRMA) based on thegeneral principles of assays as describedby Addison et al,. and Miles andmodified by Jeong et al. (8,18–20). Inthis IRMA, which measures the mostbasic isoferritin, the highly purified125I-labeled antibody to ferritin is thetracer, and the ferritin antibodies areimmobilized on polyacrylamide beads asthe solid phase. Serum or ferritinstandards (made from human liver) aremixed with the combined tracer/solid-phase antibody reagent, and the mixtureis incubated. During incubation, both theimmobilized and the 125I-labeledantibodies bind to the ferritin antigen inthe serum or standards, thus creating asandwich. After incubation, the beadsare diluted with saline, centrifuged, anddecanted. The level of 125I-labeledferritin found in the pellets is measuredwith a gamma counter. There is a directrelationship between the radioactivelevels of the pellets and the amount ofendogenous ferritin in the serum or
standards, rather than the inverserelationship measured by mostradioimmunoassays.
Erythrocyte Protoporphyrin (EP)
Erythrocyte protoporphyrin ismeasured by a modification of themethod of Sassa et al. (8,21).Protoporphyrin is extracted fromEDTA-whole blood into a 2:1 (v/v)mixture of ethyl acetate-acetic acid, thenback-extracted into dilute hydrochloricacid. The protoporphyrin in the aqueousphase is measured fluorometrically atexcitation and at emission wavelengthsof 404 and 655 nm, respectively.Calculations are based on a processedprotoporphyrin IX (free acid) standardcurve. Using the hematocrit value of thespecimen, the final concentration ofprotoporphyrin in a specimen isexpressed as microgram per deciliter ofpacked RBCs (µg/dL RBC).
CDC modifications—The followingmodifications of the original methodsare based on CDC optimizationexperiments (8):
+ Sample size was increased from 2µL to 10 µL.
+ Ethyl acetate-acetic acid and 0.43mol/L HCl volumes were increasedfrom 0.3 mL to 1.0 mL.
+ Processed protoporphyrin IXstandards were prepared daily.
+ Hydrolysis time for the dimethylester was decreased from 48 hoursto 3 hours, on the basis of the workof Culbreth et al. (22).
+ For maximum fluorescent intensityof the extracted protoporphyrin IX,0.43 mol/L HCl was chosen.
Statistical MethodsThis report presents population
means, standard errors of the means,percentage distribution, and percentilesfor the analytes described. Data for thetables are weighted to account forsurvey design and nonresponse. Sampleweights must be used to produceaccurate population estimates becauseeach sample person does not have thesame probability of selection. Thesample weights incorporate the

Series 11, No. 247 [ Page 7
differential probabilities of selection andinclude adjustments for oversampling ofcertain populations, noncoverage, andnonresponse. Sample weights for the6-year sample are used to produceestimates for all the analytes.
Standard errors of the means wereestimated using SAS for calculatingvariance estimates and incorporatingSUDAAN, a program that takes intoaccount the sampling weights and thecomplex sample design (23,24).Reliability of an estimated mean orpercentage also depends on thecoefficient of variation or relativestandard error (RSE), defined as theratio of the standard error of theestimate to the estimate times 100.When the RSE of the estimate is large,the estimate is less reliable. In thisreport, estimates with an RSE greaterthan 30 percent are deemed unreliableand are excluded from the tables. Theuse of these criteria followrecommendations described in ‘‘TheJoint Policy on Variance Estimation andStatistical Reporting Standards onNHANES III and CSFII Reports:HNIS/NCHS Analytic Working GroupRecommendations’’ in the NHANES IIIAnalytic Guidelines (7). Other analysesin this report describe data contained inthe report tables and did not employstatistical methods for comparison.
Results
NHANES III hematological andbiochemical measures representthe most recent cross-sectional
data from which estimates can begeneralized to the U.S. population.These cross-sectional data were obtainedfrom different age groups. The data usedto conduct the analysis in this report canbe found in National Health andExamination Survey, III 1988–94,CD-ROM Series 11 No. 1 (25).
Tables 1–9 present means, standarderrors of the means, age-adjusted means,and selected percentiles for hemoglobin,hematocrit, and RBC count, by sex,race/ethnicity, and age categories.Tables 10–21 present estimates of RBCvolume, mean cell (RBC) hb, mean cell(RBC) hb concentration, and RBC
distribution width, by sex, race/ethnicity,and age categories. Tables 22–30 presentestimates of platelet numbers and size,by sex, race/ethnicity, and age.Tables 31–54 present total WBC countsas well as counts of granulocytes,lymphocytes, monocytes, eosinophilsand basophils, by sex, race/ethnicity, andage categories. Tables 55–90 presentpercentage distributions of the aboveblood components, by sex, race/ethnicity, and age. Tables 91–105present the concentrations of serum iron,serum TIBC, transferrin saturation,erythrocyte protoporphyrin, and serumferritin. Tables 106–120 show thepercentage distribution of the above.The percentage distribution tables canbe used to calculate the percentage ofthe population that is below or above aselected concentration.
In figures 1–16, the median values(50th percentile values) for each of theage, sex, and race/ethnicity groups aregraphically depicted for thehematological and biochemical analytes.
Comparison of NHANESIII with NHANES II
Race/Ethnic and AgeComparisons
Because of the different ageintervals in the published data fromNHANES II and NHANES III, datausing the tables included with thisreport, direct comparisons can be madeonly for the total population and formale or female children of allrace/ethnic groups age 1–2, 3–5, 6–8,9–11, and 12–14 years (9). Table Ccompares data from NHANES III andpreviously published data fromNHANES II for selected hematologicelements (Hb, Hct, RBCs, and WBCs)in children age 1–14 years of allrace/ethnic groups.
The race and ethnicity categoriesare not comparable in the two surveys.In NHANES III, the race/ethnicitycategories include non-Hispanic white,non-Hispanic black, Mexican American,and remaining races. Hispanicindividuals who were not MexicanAmericans are listed with the remaininggroup (7). In NHANES II, the groups
were white, black, and other. Persons ofMexican descent were included in thewhite category unless they were knownto be American Indian or of anotherrace, in which case they were listed asother. Black persons and persons ofmixed black and other parentage wererecorded as black (14).
Laboratory Comparisons
When comparing data fromNHANES III tables in this report withdata from NHANES II, it should benoted that in NHANES II hematocritwas determined using centrifugation(microhematocrit method) and theresults expressed as a percentage. InNHANES III hematocrit was determinedusing the hematology analyzer andexpressed as a fraction (liter/liter). Thereporting units for hemoglobin andmean cell hemoglobin concentrationswere expressed as g/dL in NHANES IIand as g/L in NHANES III.
In NHANES I (1971–75),NHANES II (1976–80), and HispanicHANES (1982–84), RBCs and WBCswere counted using a semiautomatedcell counter (Coulter model FN). Hbdeterminations were made using aCoulter hemoglobinometer, and packedcell volume (PCV) was determinedusing the microhematocrit centrifugemethod. The hematologic indices MCH,MCHC, and MCV were calculated asfollows:
MCH = Hb/RBCMCHC = Hb/PCVMCV = PCV/RBC
In NHANES III, these hematologicparameters were determined using afully automated Coulter S+Jrhematology analyzer. These analyzersmeasured the mean (red) cell volume(MCV) directly, utilizing a process ofcontinuous integration of pulse heightsdivided by the pulse number; PCVvalues were calculated through themultiplication of MCV and RBC.Therefore, individual values for MCV,PCV (hematocrit), and MCHC fromNHANES III cannot be compareddirectly with values from the previousNHANES (8).

Table C. Hemoglobin, hematocrit, red blood cells, and white blood cells in children 1–14 years of age, by age group and sex: Comparisonof the Third National Health and Nutrition Examination Survey (1988–91) with the Second National Health and Nutrition Examination Survey(1971–74)
Characteristic
Male1 Female1
NHANES III NHANES II NHANES III NHANES II
Number Mean SD2 SE3 Number Mean SD2 SE3 Number Mean SD2 SE3 Number Mean SD2 SE3
Hemoglobin (g/L)
1–2 years . . . . . . . . . . . . . . . . . 931 120.1 8.2 0.4 518 120 10.1 0.7 858 118.3 8.5 0.6 461 120 9.5 0.53–5 years . . . . . . . . . . . . . . . . . 1,281 123.5 7.7 0.4 1,019 123 8.4 0.4 1,337 120.7 7.8 0.4 919 123 8.6 0.56–8 years . . . . . . . . . . . . . . . . . 709 128.8 8.0 0.5 382 127 9.0 0.7 675 123.7 7.7 0.6 369 127 8.8 0.69–11 years . . . . . . . . . . . . . . . . 773 132.8 8.4 0.5 432 131 8.6 0.5 734 126.5 7.8 0.6 402 131 8.5 0.612–14 years . . . . . . . . . . . . . . . 540 141.4 10.8 0.8 485 138 10.5 0.5 621 125.4 8.9 0.7 463 132 9.1 0.6
Hematocrit (L/L)
1–2 years . . . . . . . . . . . . . . . . . 931 0.36 0.02 0.001 518 0.36 0.26 0.02 858 0.36 0.02 0.00 461 0.35 0.03 0.003–5 years . . . . . . . . . . . . . . . . . 1,281 0.37 0.02 0.001 1,019 0.36 0.23 0.02 1,337 0.37 0.02 0.00 919 0.36 0.02 0.026–8 years . . . . . . . . . . . . . . . . . 709 0.38 0.02 0.001 382 0.37 0.24 0.02 675 0.38 0.02 0.00 369 0.37 0.02 0.019–11 years . . . . . . . . . . . . . . . . 773 0.39 0.02 0.001 432 0.38 0.24 0.02 734 0.39 0.02 0.00 402 0.38 0.02 0.0212–14 years . . . . . . . . . . . . . . . 540 0.42 0.03 0.002 485 0.40 0.29 0.01 621 0.40 0.03 0.00 463 0.39 0.02 0.02
Red blood cells (1012 cells per liter)
1–2 years . . . . . . . . . . . . . . . . . 931 4.55 0.34 0.020 516 4.60 0.42 0.03 858 4.50 0.34 0.021 455 4.40 0.35 0.023–5 years . . . . . . . . . . . . . . . . . 1,281 4.51 0.34 0.017 1,007 4.40 0.32 0.02 1,337 4.49 0.32 0.016 915 4.40 0.35 0.026–8 years . . . . . . . . . . . . . . . . . 709 4.60 0.29 0.019 379 4.50 0.34 0.03 675 4.56 0.31 0.022 367 4.50 0.33 0.029–11 years . . . . . . . . . . . . . . . . 773 4.71 0.32 0.020 427 4.60 0.35 0.02 734 4.62 0.30 0.020 395 4.50 0.34 0.0312–14 years . . . . . . . . . . . . . . . 540 4.93 0.39 0.030 482 4.80 0.36 0.02 621 4.59 0.32 0.023 461 4.50 0.33 0.02
White blood cells (109 cells per liter)
1–2 years . . . . . . . . . . . . . . . . . 931 8.74 2.53 0.13 516 8.90 2.94 0.15 858 8.66 2.41 0.13 457 9.10 2.88 0.163–5 years . . . . . . . . . . . . . . . . . 1,281 7.68 2.26 0.10 1,006 7.60 2.24 0.09 1,337 7.90 2.12 0.09 916 7.90 2.28 0.106–8 years . . . . . . . . . . . . . . . . . 709 7.45 2.02 0.12 378 7.50 1.95 0.14 675 7.63 2.10 0.13 367 7.60 2.35 0.139–11 years . . . . . . . . . . . . . . . . 773 7.01 2.07 0.11 427 7.00 1.80 0.10 734 7.20 1.98 0.12 397 7.10 1.74 0.1112–14 years . . . . . . . . . . . . . . . 540 7.02 2.07 0.14 480 6.90 1.81 0.10 621 7.30 2.06 0.13 461 7.10 2.05 0.09
1Includes all race/ethnic groups.2SD is standard deviation.3SE is standard error.
NOTE: NHANES III is the Third National Health and Nutrition Examination Survey, and NHANES II is the Second National Health and Nutrition Examination Survey.
Page 8 [ Series 11, No. 247
Description of SelectedFindings
Hb (tables 1–3; figure 1) andHct (tables 4–6; figure 2)
+ The mean Hb concentration for allpersons in the United States age 1year and over was 139.1 g/L (13.9g/dL) (table 1).
+ The mean Hb for males (146.7 g/L)was higher than for females (131.9)
+ The mean Hb of non-Hispanic whitepersons (140.5 g/L) and MexicanAmericans (138.7 g/L) was higherthan that of non-Hispanic blackpersons (131.4 g/L). The median Hbdifference between the race/ethnicgroups persisted across all agegroups after stratifying by sex(figure 1).
+ Median Hb concentration wasapproximately the same for bothsexes in each race/ethnic groupbelow 9 years of age.
+ During puberty, mean Hb increasedmore rapidly in males than infemales, reaching a high of 154.1g/L in the 20–29-year age group.The mean Hb then decreasedgradually with age to 143.6 g/L atage 70 years.
+ After puberty, the mean Hb infemales of all race/ethnic groupsremained lower than 132.9 g/Lfound at age 14 years and remainedabout the same in older ages.
+ The comparison values and changeswith age in Hct were about the sameas the changes seen in Hb.
+ Median Hct, like Hb, was higher inmales than in females after puberty.In both sexes, median Hct washigher in non-Hispanic whitepersons and Mexican Americansthan in non-Hispanic black persons(figure 2).
The percentage distributions for Hband Hct (tables 53–58) can be used todetermine the percentage of thepopulation with values that defineanemia. The median and percentilesfrom 2.5th and 97.5th are available ineach table so that reference intervals foreach analyte can be identified for thepopulation.
RBC Count (tables 7–9;figure 3)
+ The median RBC counts forchildren ages 1–8 years of all

Figure 1. Hemoglobin by age, sex, and race/ethnicity: United States, Third National Health and Nutrition Examination Survey, 1988–94
Figure 2. Hematocrit by age, sex, and race/ethnicity: United States, Third National Health and Nutrition Examination Survey, 1988–94
Series 11, No. 247 [ Page 9
race/ethnic groups were generallythe same (about 4.4 to 4.6 × 10¹²/L)(figure 3).
+ For age groups 12 years and over,males had higher RBC counts thanfemales generally and within each of
the race/ethnic groups.+ In females age 12 and over, the
RBC count remained relativelyunchanged (4.3 to 4.6 × 10¹²/L).
+ In males, the median RBC countincreased to 5.0 to 5.2 × 10¹²/L for
ages 15–29 years; then the RBCcount decreased gradually in eachage group to about 4.7 × 10¹²/L formales age 70 years and over.

Figure 3. Red blood cell count by age, sex, and race/ethnicity: United States, Third National Health and Nutrition Examination Survey,1988–94
Page 10 [ Series 11, No. 247
MCV, MCH, MCHC, andRDW (tables 10–21;figures 4–7)
+ The median MCV increased withage, from about 80 fL at age 2 years
Figure 4. Mean cell volume by age, sex, and rac
to about 90 fL at age 39 years,regardless of sex or race/ethnicgroup. The MCV in non-Hispanicblack persons was about 1–2 fLlower than in non-Hispanic whitepersons and Mexican Americans in
e/ethnicity: United States, Third National Healt
each age group (figure 4).+ The median MCH increased with
age from about 26–27 pg at age 2years to 29–31 pg in adulthood. TheMCH in non-Hispanic black personswas about 1 pg lower than in
h and Nutrition Examination Survey, 1988–94

Figure 5. Mean cell hemoglobin by age, sex, and race/ethnicity: United States, Third National Health and Nutrition Examination Survey,1988–94
Series 11, No. 247 [ Page 11
non-Hispanic white persons andMexican Americans for each sex-agegroup. There was no apparentdifference in MCH by sex (figure 5).
+ The median MCHC varied byrace/ethnic group, with non-Hispanicblack persons having an MCHCabout 3–5 g/L lower thannon-Hispanic white persons andMexican Americans for each agegroup (figure 6).
+ The median RDW decreased slightlyfrom age 1 to 11, then increasedgradually with age by about1 percent. There was no apparentsex difference, but the median RDWwas greater among non-Hispanicblack persons than amongnon-Hispanic white persons at allage groups, a difference that appearsto increase with age (figure 7).
WBC Count and DifferentialCount and Percentage(tables 31–36; figure 8)
+ The mean WBC count was higheramong young children (8.70 ×10⁹/L) and decreased with age toage 11 years (7.10 × 10⁹/L)(table 31). After age 11 years, the
WBC remained at about 6.0–7.5 ×10⁹/L (figure 8).
+ The WBC count tended to be higherin females than in males for allrace/ethnic and age groups.
+ In each age-sex group, the WBCcount was higher in non-Hispanicwhite persons and MexicanAmericans than in non-Hispanicblack persons.
+ Because of the decreased samplesize selected for testing bydifferential smear, the age intervalfor groups was expanded foranalysis (tables 34–36).
Platelet Count, Platelet Volume,and Platelet Distribution Width(tables 22–30; figures 9–11)
+ Median platelet counts in childrendecreased from about 358 × 109/L atages 1–2 years to 273 × 109/L at15–19 years of age (table 22).
+ In adult males of all race/ethnicgroups, the median platelet countdecreased to about 265 × 109/L atage 30, then leveled off. There waslittle difference among males in therace/ethnic groups (figure 9).
+ Platelet counts were lower innon-Hispanic white females than inblack and Mexican-Americanfemales until age 50–59 years.Platelet counts in adult females wereabout 20–30 × 109/L higher than inadult males.
+ The mean platelet volume increasedduring childhood from a mean of7.4 at age 1–2 years to 8.3 fL at age15–17 years. This volume leveledoff during adulthood (table 25).There was no apparent difference inplatelet volume among age-sex orrace/ethnic groups.
Serum Iron (tables 91–93;figure 12)
+ Median serum iron increased fromabout 66 µg/dL at age 2 years toabout 84 µg/dL at age 11–14, withno apparent differences byrace/ethnic groups or sex.
+ After age 14, median serum iron inmales was about 10 µg/dL higherthan in females for each age-race/ethnic group.
+ After age 14, median serum iron innon-Hispanic white persons andMexican Americans, both males and

Figure 6. Mean cell hemoglobin concentration by age, sex, and race/ethnicity: United States, Third National Health and NutritionExamination Survey, 1988–94
Figure 7. Red blood cell distribution width by age, sex, and race/ethnicity: United States, Third National Health and Nutrition ExaminationSurvey, 1988–94
Page 12 [ Series 11, No. 247

Figure 9. Platelet count by age, sex, and race/ethnicity: United States, Third National Health and Nutrition Examination Survey, 1988–94
Figure 8. White blood cell count by age, sex, and race/ethnicity: United States, Third National Health and Nutrition Examination Survey,1988–94
Series 11, No. 247 [ Page 13

Figure 10. Mean platelet volume by age, sex, and race/ethnicity: United States, Third National Health and Nutrition Examination Survey,1988–94
Page 14 [ Series 11, No. 247
females, was 10 to 20 µg/dL higherthan non-Hispanic black persons ineach age group.
+ The median serum iron in males andwhite females peaked at age 20–29and then decreased.
Serum TIBC (tables 94–96;figure 13)
+ During childhood, median TIBCdecreased from 380.4 µg/dL at age1–2 years to 363.2 at age 3–5 years,and then increased to 390.1 µg/dL atage 12–14 years.
+ In males, median TIBC fell fromage 14 years to age 29 years, thenchanged very little until age 59years when it again decreased. Infemales, TIBC remained high untilage 19 years, then decreased steadilyuntil age 70 years and over.
+ After age 15 years, median TIBCwas higher in females than in malesin each age and race/ethnic group.Mexican Americans had highermedian TIBC than the non-Hispanicwhite and black groups.
Transferrin Saturation(tables 97–99; figure 14)
+ The median percentage saturationincreased from 2–5 years of age inmales and females.
+ From 5–14 years of age, thepercentage saturation changed verylittle in males and females, withlittle difference among race/ethnicgroups.
+ From age 14 years, the percentagesaturation increased more in malesthan in females.
+ Until age 60 years, the percentagesaturation in white females washigher than in black and Mexican-American females.
Erythrocyte Protoporphyrin(tables 100–102; figure 15)
+ When comparing each race/ethnic-sex group, median erythrocyteprotoporphyrin at age 2 years wasabout 8 µg/dL of RBC higher thanat age 5 years. In MexicanAmericans, EP was about 10 µg/dLof RBC higher than in non-Hispanicwhite persons and non-Hispanicblack persons.
+ Until age 14 years, the valueschanged little from those at age 3–5years. From age 14 until age 70years and over, the race/ethnic

Figure 11. Platelet distribution width by age, sex, and race/ethnicity: United States, Third National Health and Nutrition Examination Survey,1988–94
Figure 12. Serum iron by age, sex, and race/ethnicity: United States, Third National Health and Nutrition Examination Survey, 1988–94
Series 11, No. 247 [ Page 15

Figure 13. Serum total iron-binding capacity by age, sex, and race/ethnicity: United States, Third National Health and Nutrition ExaminationSurvey, 1988–94
Figure 14. Transferrin saturation by age, sex, and race/ethnicity: United States, Third National Health and Nutrition Examination Survey,1988–94
Page 16 [ Series 11, No. 247
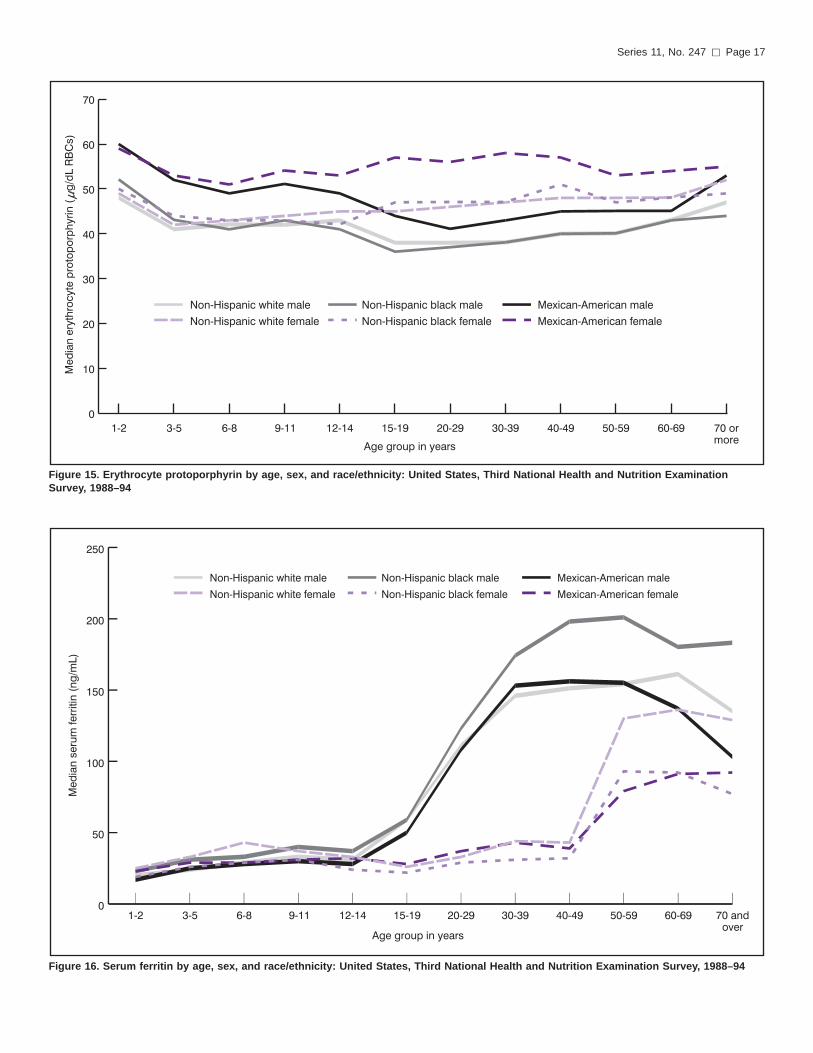
Figure 15. Erythrocyte protoporphyrin by age, sex, and race/ethnicity: United States, Third National Health and Nutrition ExaminationSurvey, 1988–94
Figure 16. Serum ferritin by age, sex, and race/ethnicity: United States, Third National Health and Nutrition Examination Survey, 1988–94
Series 11, No. 247 [ Page 17

Page 18 [ Series 11, No. 247
relationships remained the same, butfor each sex-age group, EPconcentrations for females were10–20 µg/dL of red cells higherthan for males.
Serum Ferritin (tables 103–105;figure 16)
+ Median serum ferritin concentrationin both males and females across allrace/ethnic groups increased slightlyfrom age 1–2 years to age 12–14years, 22 to 32 ng/mL (table 103).
+ In females, there was little change inserum ferritin levels with age untilage 40–49 when the concentration is38 ng/mL, with little differenceamong the race/ethnic groups(table 105).
+ At age 50–59, the median ferritinconcentration among females of allrace/ethnic groups was about 82ng/mL but ranged from 79 ng/mL innon-Hispanic white persons to 130ng/mL in non-Hispanic blackpersons, a difference that remainswith increasing age.
+ In males, an increase in medianferritin concentration began by age15 years and continued to a peak of156 ng/mL at age 50–59 years forall race/ethnic groups; however,median ferritin concentration rangedfrom 154 ng/mL in non-Hispanicwhite persons to 201 ng/mL innon-Hispanic black persons(table 104).
References
1. National Center for Health Statistics.Plan and initial program of the HealthExamination Survey l. Vital Health Stat1(4). 1965.
2. National Center for Health Statistics.Plan, operation, and response results ofa program of children’s examinations.Vital Health Stat 1(5). 1967.
3. National Center for Health Statistics.Plan and operation of a healthexamination of U.S. youths 12–17years of age. Vital Health Stat 1(8).1969.
4. Miller HW. Plan and operation of theHealth and Nutrition ExaminationSurvey, United States, 1971–73.National Center for Health Statistics.
Vital Health Stat 1(10a) and (10b).1973.
5. Engel A, Murphy RS, Maurer K,Collins E. Plan and operation of theHANES I Augmentation Survey ofAdults 25–74 Years, United States,1974–1975. National Center for HealthStatistics. Vital Health Stat 1(14). 1978.
6. U.S. Department of Health and HumanServices (HHS) and U.S. Departmentof Agriculture (USDA). Ten-yearcomprehensive plan for the NationalNutrition Monitoring and RelatedResearch Program; notice. FederalRegister 58:32752–806. 1993.
7. U.S. Department of Health and HumanServices (DHHS). National Center forHealth Statistics. NHANES IIIreference manuals and reports(CD-ROM). Hyattsville, MD: Centersfor Disease Control and Prevention.1996. Available from NationalTechnical Information Service (NTIS),Springfield, VA. Acrobat.PDF format;includes access software: AdobeSystems, Inc. Acrobat Reader.
8. Gunter EW, Lewis BL, KoncikowskiSM. Laboratory methods used for thethird National Health and NutritionExamination Survey (NHANES III),1988–94. Included in Reference 7.
9. Fulwood R, Johnson CL, Bryner JD, etal. Hematological and nutritionalbiochemistry reference for persons 6months–74 years of age: United States1976–80. National Center for HealthStatistics. Vital Health Stat 11(232).1982.
10. International Council forStandardization in Haematology,International Federation of ClinicalChemistry, World Association ofSocieties of Pathology,Recommendation for use of SI inclinical laboratory measurements. Br JHaemat 2:787. 1972.
11. Grover NB, Neaman J, Ben-asson S,Dojanski F. Electrical sizing of particlesin suspension. Rigid spheroids and redblood cells. Biophys J 12:1099–1116.1972.
12. Hamilton PJ, Davison RL. Theinterrelationships and stability ofCoulter-S determined blood indices. JClin Pathol 26:700–5. 1973.
13. Yip, Ray. Iron. In: Present Knowledgein Nutrition, 8th ed. Bowman BA,Russell RM, eds. Washington, DC:ILSI Press, 311–25. 2001.
14. Gibson RS. Principles of nutritionalassessment. New York: Oxford Press.1990.
15. Instruction manual, Bio-RadQuantimune Ferritin IRMA. Hercules,CA: Bio-Rad Laboratories. 1986.
16. Giovanniello TJ, Bendetto G, PalmerDW, Peters T. Fully and semiautomatedmethods for the determination of ironand total iron-binding capacity. ClinChem 35(2):260–4. 1989.
17. Ramsey WNM. The determination ofthe total iron-binding capacity ofserum. Clin Chem Acta 2:221–6. 1957.
18. Addison G, Beamish M, Hales C, et al.An immunoradiometric assay forferritin in the serum of normal patientsand patients with iron deficiency andiron overload. J Clin Path 25:326–9.1972.
19. Miles L. Measurement of serum ferritinby a 2-site immunoradiometric assay.In: Abraham G, ed. Handbook ofradioimmunoassay. New York: MarcelDekker, Inc. Chapter 4. 1977.
20. Jeong H, Blackmore J, Lewin N.Ferritin immunoradiometric assay, U.S.Patent No. 4,244,940.
21. Sassa S, Granick JL, Granick S, et al.Microanalyses of erythrocyteprotoporphyrin levels byspectrophotometry in the detection ofchronic lead intoxication in thesubclinical range. Biochem Med8:135–48. 1973.
22. Culbreth P, Walter G, Carter R, BurtisC. Separation of protoporphyrin andrelated compounds by reversed-phaseliquid chromatography. Clin Chem25(6):605–10. 1979.
23. SAS Institute, Inc. SAS proceduresguide, version 6. 3d ed. Cary, NC: SASInstitute Inc. 1990.
24. Shah BV, Barnwell BG, Bieler GS.SUDAAN user’s manual, release 7.0.Research Triangle Park, NC: ResearchTriangle Institute. 1996.
25. National Health and NutritionExamination Survey III, 1988–94.National Center for Health Statistics,Centers for Disease Control andPrevention. U.S. Department of Healthand Human Services. CD-ROM Series11, No. 1, Revised October 1997.SETS Version 1.22a.

Table 1. Hemoglobin in gram per liter for persons 1 year and over, number of examined persons, mean, standard deviation, standard errorof the mean, and selected percentiles, by race/ethnicity and age: United States, 1988–94
Race/ethnicity and age
Number ofexaminedpersons Mean
Standarddeviation
Standarderror ofmean
Percentile
2.5th 5th 10th 15th 25th 50th 75th 85th 90th 95th 97.5th
All race/ethnic groups1
1 year and over . . . . . . . . . . . 26,372 139.1 14.5 0.251 112.5 116.5 121.0 124.1 129.1 138.7 149.7 155.1 158.2 163.0 167.11–2 years . . . . . . . . . . . . . 1,789 120.1 8.1 0.362 104.6 107.1 110.0 112.1 115.0 120.1 125.5 128.6 130.6 133.2 136.23–5 years . . . . . . . . . . . . . 2,618 123.7 7.7 0.287 108.6 111.5 114.1 116.1 118.6 123.5 128.7 132.2 134.1 136.6 138.66–8 years . . . . . . . . . . . . . 1,384 128.5 7.9 0.401 113.0 115.1 118.1 120.1 123.6 129.2 133.7 136.2 138.2 141.5 144.19–11 years . . . . . . . . . . . . . 1,507 131.9 8.2 0.398 117.1 119.0 121.6 123.6 127.0 131.6 137.7 140.6 142.2 145.1 147.212–14 years . . . . . . . . . . . . 1,161 137.4 11.2 0.625 116.0 119.5 123.1 126.0 129.7 137.2 145.2 149.6 152.2 156.5 160.215–19 years . . . . . . . . . . . . 1,786 141.0 14.0 0.629 114.6 119.0 122.6 126.5 131.2 140.6 151.2 156.2 159.1 163.2 168.620–29 years . . . . . . . . . . . . 3,331 142.7 15.1 0.496 113.6 118.5 122.5 126.0 131.7 143.6 154.7 159.2 161.7 165.2 168.630–39 years . . . . . . . . . . . . 3,158 142.3 14.8 0.499 112.6 117.6 123.6 127.0 132.2 142.6 153.2 157.7 161.2 165.1 168.740–49 years . . . . . . . . . . . . 2,467 141.6 14.5 0.556 111.6 118.6 124.1 127.5 131.7 142.2 152.2 156.7 159.0 164.0 168.050–59 years . . . . . . . . . . . . 1,802 142.5 13.3 0.595 116.6 121.6 126.1 129.1 133.0 142.7 152.2 156.2 159.1 163.5 168.660–69 years . . . . . . . . . . . . 2,242 140.7 13.0 0.520 115.5 120.0 124.5 127.6 132.6 140.7 149.2 153.6 156.5 162.0 167.170 years and over . . . . . . . . 3,127 137.7 13.7 0.465 109.1 114.6 121.1 124.6 129.6 138.1 146.6 151.6 154.5 159.2 164.2
Non-Hispanic white
1 year and over . . . . . . . . . . . 9,521 140.5 13.9 0.286 114.6 118.6 123.1 126.1 130.6 140.2 150.7 155.7 158.7 163.2 167.21–2 years . . . . . . . . . . . . . 567 120.4 7.5 0.410 * 108.1 111.5 113.1 115.5 120.1 125.5 128.6 130.2 133.1 *3–5 years . . . . . . . . . . . . . 655 124.5 7.3 0.371 * 113.5 115.6 117.1 119.6 124.0 129.2 132.7 134.6 137.1 *6–8 years . . . . . . . . . . . . . 365 129.5 7.4 0.508 * 117.0 119.6 122.5 125.6 129.7 134.1 136.2 138.7 142.0 *9–11 years . . . . . . . . . . . . . 386 133.1 7.7 0.514 * 121.1 123.1 126.0 128.1 133.1 139.1 140.7 143.7 146.1 *12–14 years . . . . . . . . . . . . 293 138.7 10.8 0.822 * * 125.1 127.5 131.2 138.6 146.2 151.1 153.2 * *15–19 years . . . . . . . . . . . . 465 142.4 13.0 0.788 * 121.6 126.1 128.2 133.1 142.5 152.2 156.7 159.1 162.2 *20–29 years . . . . . . . . . . . . 858 143.7 14.4 0.644 * 120.1 124.6 128.1 133.6 144.5 155.2 159.7 162.2 165.6 *30–39 years . . . . . . . . . . . . 1,007 143.7 13.7 0.563 * 121.6 126.5 129.1 134.1 143.7 153.6 158.6 161.6 165.1 *40–49 years . . . . . . . . . . . . 871 143.1 13.5 0.600 * 122.0 126.6 129.2 133.2 143.6 153.2 157.6 159.6 164.6 *50–59 years . . . . . . . . . . . . 883 143.4 13.0 0.570 * 123.1 127.5 129.7 134.0 143.2 153.0 157.0 159.7 164.0 *60–69 years . . . . . . . . . . . . 966 141.4 12.8 0.537 * 121.0 125.5 128.6 133.1 141.5 150.0 153.7 156.7 162.6 *70 years and over . . . . . . . . 2,205 138.5 13.2 0.367 * 116.6 122.1 125.6 130.2 138.6 147.1 152.0 155.0 159.6 *
Non-Hispanic black
1 year and over . . . . . . . . . . . 7,749 131.4 14.9 0.236 104.1 110.0 114.1 117.1 121.5 130.5 142.1 147.7 151.6 156.6 161.21–2 years . . . . . . . . . . . . . 540 117.7 8.4 0.448 * 104.0 107.1 109.1 112.5 118.0 123.1 126.1 128.1 132.1 *3–5 years . . . . . . . . . . . . . 852 120.4 8.0 0.339 * 107.1 110.5 113.0 115.6 120.5 125.6 128.1 130.6 133.7 *6–8 years . . . . . . . . . . . . . 449 124.5 8.2 0.476 * 112.1 114.1 116.0 119.1 124.5 129.7 133.1 135.7 138.1 *9–11 years . . . . . . . . . . . . . 519 126.6 8.7 0.474 * 115.0 117.1 118.6 122.0 126.6 131.6 135.1 137.5 140.2 *12–14 years . . . . . . . . . . . . 404 128.9 10.6 0.651 * 113.0 116.0 118.1 122.5 128.7 135.7 140.1 143.1 147.0 *15–19 years . . . . . . . . . . . . 624 134.3 14.9 0.740 * 112.1 116.0 119.6 123.5 134.2 146.1 150.6 153.7 158.5 *20–29 years . . . . . . . . . . . . 1,052 135.3 15.9 0.607 * 110.6 116.1 119.0 123.5 135.6 147.6 152.6 155.6 161.2 *30–39 years . . . . . . . . . . . . 1,063 134.0 16.1 0.609 * 109.0 115.0 118.0 123.0 134.2 145.5 151.0 154.2 158.7 *40–49 years . . . . . . . . . . . . 761 133.5 16.3 0.730 * 107.6 113.1 118.5 124.0 133.7 145.1 150.7 153.6 158.5 *50–59 years . . . . . . . . . . . . 463 135.4 14.0 0.805 * 112.6 119.0 122.6 126.1 134.6 144.2 150.1 153.2 159.6 *60–69 years . . . . . . . . . . . . 550 132.9 13.0 0.688 * 112.6 117.0 120.1 124.0 133.2 142.0 147.1 149.0 153.7 *70 years and over . . . . . . . . 472 128.4 15.1 0.862 * 102.1 109.6 113.5 120.0 129.6 138.7 143.6 146.7 152.1 *
Mexican American
1 year and over . . . . . . . . . . . 7,945 138.7 15.6 0.451 110.1 115.5 120.0 123.0 127.6 138.0 150.6 156.6 160.1 164.1 167.21–2 years . . . . . . . . . . . . . 583 120.4 9.2 0.682 * 104.6 110.0 112.1 115.0 121.0 126.1 129.5 131.6 134.0 *3–5 years . . . . . . . . . . . . . 972 124.6 7.9 0.453 * 111.6 115.5 117.0 119.5 125.0 129.7 133.1 134.7 137.6 *6–8 years . . . . . . . . . . . . . 507 129.1 8.0 0.641 * 116.1 119.6 122.0 123.6 129.0 135.1 137.5 138.1 141.6 *9–11 years . . . . . . . . . . . . . 537 132.9 8.2 0.634 * 120.0 122.6 124.0 127.1 133.1 139.0 141.7 143.6 147.1 *12–14 years . . . . . . . . . . . . 409 136.6 9.5 0.846 * 121.1 125.0 126.5 130.7 136.6 143.2 146.5 149.1 152.2 *15–19 years . . . . . . . . . . . . 601 142.0 15.3 1.117 * 116.6 121.6 126.0 131.7 142.6 153.2 159.2 162.1 164.7 *20–29 years . . . . . . . . . . . . 1,279 144.3 15.7 0.787 * 117.6 123.1 127.0 132.7 146.1 157.1 161.2 163.2 167.2 *30–39 years . . . . . . . . . . . . 954 142.7 16.0 0.927 * 117.5 121.6 125.6 131.7 143.6 155.1 159.7 162.2 165.6 *40–49 years . . . . . . . . . . . . 725 141.7 17.3 1.151 * 111.1 121.1 125.1 131.7 143.2 154.7 158.6 161.2 165.7 *50–59 years . . . . . . . . . . . . 360 143.0 13.8 1.309 * 121.6 127.1 130.5 134.6 144.1 152.6 157.6 160.7 164.1 *60–69 years . . . . . . . . . . . . 647 140.6 13.6 0.956 * 120.0 123.1 126.5 132.0 141.2 149.5 154.1 158.5 162.7 *70 years and over . . . . . . . . 371 138.9 15.4 1.433 * 117.0 122.1 124.6 130.2 138.7 149.5 155.1 158.6 162.1 *
* Does not meet standards for reliability or precision.1Includes all other race/ethnic groups not listed separately.
Series 11, No. 247 [ Page 19

Table 2. Hemoglobin in gram per liter for males 1 year and over, number of examined persons, mean, standard deviation, standard error ofthe mean, and selected percentiles, by race/ethnicity and age: United States, 1988–94
Race/ethnicity and age
Number ofexaminedpersons Mean
Standarddeviation
Standarderror ofmean
Percentile
2.5th 5th 10th 15th 25th 50th 75th 85th 90th 95th 97.5th
All race/ethnic groups1
1 year and over . . . . . . . . . . . 12,623 146.7 13.9 0.347 116.6 121.0 126.6 131.6 138.7 148.6 156.5 160.5 163.1 167.1 170.21–2 years . . . . . . . . . . . . . 931 120.1 8.2 0.448 104.6 107.0 109.1 112.1 115.0 120.0 125.6 128.2 130.6 133.2 136.13–5 years . . . . . . . . . . . . . 1,281 123.5 7.7 0.362 108.5 111.5 114.5 116.1 118.6 123.0 128.2 132.2 134.2 136.7 139.06–8 years . . . . . . . . . . . . . 709 128.8 8.0 0.505 113.6 115.1 119.0 120.6 124.1 129.1 134.1 137.1 138.7 141.7 145.19–11 years . . . . . . . . . . . . . 773 132.8 8.4 0.505 117.1 119.6 122.5 124.5 127.5 133.5 139.2 141.6 144.0 146.0 148.212–14 years . . . . . . . . . . . . 540 141.4 10.8 0.778 120.5 124.1 127.1 130.7 133.7 142.1 149.2 153.1 154.6 159.0 163.015–19 years . . . . . . . . . . . . 836 150.7 10.3 0.599 130.6 134.6 137.6 140.0 144.2 151.1 157.6 160.6 163.5 168.7 170.720–29 years . . . . . . . . . . . . 1,562 154.1 9.2 0.390 137.1 139.5 142.7 144.7 147.6 154.6 160.6 163.2 165.2 168.6 172.130–39 years . . . . . . . . . . . . 1,401 152.5 10.2 0.457 133.1 136.1 140.1 142.2 146.1 152.7 159.7 163.2 165.1 168.7 171.640–49 years . . . . . . . . . . . . 1,164 151.2 10.2 0.499 129.7 134.6 138.7 142.0 145.5 151.7 157.7 160.7 164.0 168.0 171.050–59 years . . . . . . . . . . . . 833 150.3 11.2 0.652 126.1 132.0 136.7 140.0 143.5 151.1 157.6 161.6 163.5 168.6 172.160–69 years . . . . . . . . . . . . 1,130 147.6 11.5 0.574 123.6 128.2 133.7 136.6 141.1 147.7 154.5 158.6 161.7 166.7 170.170 years and over . . . . . . . . 1,463 143.6 14.3 0.627 110.5 116.6 125.6 130.6 136.1 144.7 153.1 156.6 160.1 164.7 168.5
Non-Hispanic white
1 year and over . . . . . . . . . . . 4,491 147.8 13.3 0.398 118.1 123.0 129.0 133.7 140.6 149.6 157.1 160.7 163.2 167.2 170.61–2 years . . . . . . . . . . . . . 297 120.4 7.6 0.528 * 108.1 111.1 113.0 115.1 120.0 125.6 128.2 130.2 133.2 *3–5 years . . . . . . . . . . . . . 323 124.1 7.5 0.497 * 113.1 115.0 116.6 119.1 123.1 128.7 133.1 134.7 137.7 *6–8 years . . . . . . . . . . . . . 190 129.8 7.6 0.662 * * 120.6 123.0 125.6 130.0 135.0 137.2 139.6 * *9–11 years . . . . . . . . . . . . . 200 134.1 7.6 0.641 * * 124.1 126.1 128.2 134.1 140.2 142.1 144.2 * *12–14 years . . . . . . . . . . . . 139 142.3 10.2 1.040 * * 129.1 132.0 134.6 142.6 150.2 153.2 154.7 * *15–19 years . . . . . . . . . . . . 195 151.6 9.3 0.802 * * 139.2 141.0 146.2 152.0 158.1 160.6 162.5 * *20–29 years . . . . . . . . . . . . 381 154.9 8.8 0.538 * 141.6 143.6 145.6 148.5 155.5 161.1 163.7 165.7 168.6 *30–39 years . . . . . . . . . . . . 435 153.0 9.7 0.556 * 137.7 141.0 143.2 146.7 153.0 160.0 163.2 165.1 168.7 *40–49 years . . . . . . . . . . . . 414 152.1 9.7 0.573 * 137.0 140.2 142.7 146.2 152.6 158.2 161.2 164.2 168.2 *50–59 years . . . . . . . . . . . . 410 151.1 10.9 0.648 * 133.1 138.5 140.7 144.0 152.0 158.0 161.7 164.0 169.7 *60–69 years . . . . . . . . . . . . 493 148.2 11.2 0.603 * 128.7 134.6 137.2 141.7 148.5 154.7 159.6 162.5 167.1 *70 years and over . . . . . . . . 1,014 144.5 13.7 0.516 * 119.6 127.6 132.2 137.1 146.1 153.2 157.0 160.2 165.1 *
Non-Hispanic black
1 year and over . . . . . . . . . . . 3,633 139.4 14.6 0.339 110.1 115.1 119.6 123.0 129.2 141.1 150.0 154.1 157.0 161.6 164.51–2 years . . . . . . . . . . . . . 275 117.2 8.3 0.568 * 103.1 106.6 108.0 112.5 117.6 123.0 125.6 127.0 130.7 *3–5 years . . . . . . . . . . . . . 419 120.1 8.2 0.457 * 105.6 109.0 112.5 116.0 120.5 125.6 128.0 130.2 134.6 *6–8 years . . . . . . . . . . . . . 229 125.3 8.6 0.645 * 112.1 115.1 117.1 120.1 125.1 130.5 134.2 136.2 138.7 *9–11 years . . . . . . . . . . . . . 267 126.7 9.5 0.665 * 114.6 117.1 119.0 122.1 126.6 132.2 136.1 137.6 140.0 *12–14 years . . . . . . . . . . . . 184 133.1 10.9 0.916 * * 120.1 123.0 126.5 132.7 140.5 144.5 145.6 * *15–19 years . . . . . . . . . . . . 298 145.3 10.1 0.666 * 128.6 132.5 135.1 138.7 145.7 152.1 155.2 158.2 160.7 *20–29 years . . . . . . . . . . . . 463 148.5 9.4 0.498 * 134.0 137.2 139.2 142.2 148.2 154.5 158.7 161.7 164.6 *30–39 years . . . . . . . . . . . . 461 145.7 11.9 0.632 * 127.1 132.6 135.6 140.1 145.7 153.2 156.6 159.2 163.1 *40–49 years . . . . . . . . . . . . 336 145.0 10.9 0.681 * 127.0 130.6 134.0 138.5 145.2 152.2 157.0 158.6 162.1 *50–59 years . . . . . . . . . . . . 207 143.1 13.0 1.034 * * 124.6 129.6 135.6 143.6 151.7 157.1 160.1 * *60–69 years . . . . . . . . . . . . 274 139.0 13.7 0.944 * 114.0 121.5 126.5 132.7 140.0 148.2 152.7 154.6 159.6 *70 years and over . . . . . . . . 220 134.3 15.0 1.153 * * 115.6 120.6 127.0 136.1 143.6 147.7 152.6 * *
Mexican American
1 year and over . . . . . . . . . . . 3,951 146.8 14.7 0.604 115.6 120.1 125.1 129.2 137.2 149.2 157.7 161.6 163.7 167.1 170.11–2 years . . . . . . . . . . . . . 298 120.1 9.4 0.859 * * 108.6 110.5 115.0 121.1 126.1 129.2 131.6 * *3–5 years . . . . . . . . . . . . . 466 124.8 7.7 0.560 * 112.5 115.5 117.1 120.1 125.1 129.6 133.1 134.7 137.6 *6–8 years . . . . . . . . . . . . . 250 129.4 8.3 0.827 * * 119.6 122.0 124.0 129.1 134.2 137.0 140.2 * *9–11 years . . . . . . . . . . . . . 272 133.9 8.5 0.815 * * 122.5 124.5 127.5 134.7 140.6 142.6 144.2 * *12–14 years . . . . . . . . . . . . 191 140.8 9.0 1.028 * * 130.7 132.0 134.1 140.2 146.7 149.7 152.1 * *15–19 years . . . . . . . . . . . . 304 153.0 9.2 0.834 * 139.0 141.2 144.0 146.2 153.1 160.1 163.2 164.7 167.1 *20–29 years . . . . . . . . . . . . 647 155.3 8.9 0.551 * 140.5 143.5 146.2 149.6 155.7 161.6 164.2 166.6 169.7 *30–39 years . . . . . . . . . . . . 450 154.4 8.6 0.639 * 141.0 143.0 145.5 148.7 154.6 160.7 163.7 165.2 167.7 *40–49 years . . . . . . . . . . . . 369 152.6 10.6 0.872 * 136.2 139.7 142.6 146.1 153.7 159.1 163.2 165.5 168.7 *50–59 years . . . . . . . . . . . . 175 150.8 11.6 1.381 * * 137.2 140.1 144.7 151.2 159.5 162.6 164.1 * *60–69 years . . . . . . . . . . . . 330 148.8 11.8 1.019 * 129.2 135.2 137.7 141.7 149.2 156.1 161.0 162.7 165.2 *70 years and over . . . . . . . . 199 143.9 15.2 1.697 * * 125.5 126.1 135.0 146.2 156.2 160.5 162.0 * *
* Does not meet standards for reliability or precision.1Includes all other race/ethnic groups not listed separately.
Page 20 [ Series 11, No. 247

Table 3. Hemoglobin in gram per liter for females 1 year and over, number of examined persons, mean, standard deviation, standard errorof the mean, and selected percentiles, by race/ethnicity and age: United States, 1988–94
Race/ethnicity and age
Number ofexaminedpersons Mean
Standarddeviation
Standarderror ofmean
Percentile
2.5th 5th 10th 15th 25th 50th 75th 85th 90th 95th 97.5th
All race/ethnic groups1
1 year and over . . . . . . . . . . . 13,749 131.9 11.0 0.263 110.1 114.0 118.5 121.1 125.5 132.2 139.1 143.1 145.6 149.2 152.71–2 years . . . . . . . . . . . . . 858 120.2 8.0 0.507 105.1 108.0 110.1 112.5 115.1 120.1 125.5 129.0 130.6 133.2 137.03–5 years . . . . . . . . . . . . . 1,337 123.9 7.7 0.393 108.6 111.1 114.1 116.1 119.0 124.0 129.2 132.2 133.7 136.2 137.76–8 years . . . . . . . . . . . . . 675 128.2 7.7 0.549 112.5 115.0 118.0 119.1 123.1 129.5 133.6 135.7 137.6 140.1 143.29–11 years . . . . . . . . . . . . . 734 131.0 7.8 0.536 117.0 118.5 121.5 122.6 126.6 130.6 136.2 139.2 140.6 144.2 146.612–14 years . . . . . . . . . . . . 621 132.9 10.0 0.743 113.1 117.0 120.5 123.1 126.1 132.6 140.5 143.7 146.5 149.2 151.215–19 years . . . . . . . . . . . . 950 131.5 10.0 0.603 112.0 114.6 119.0 121.6 125.1 132.1 138.7 142.2 144.2 146.6 148.720–29 years . . . . . . . . . . . . 1,769 131.4 10.6 0.468 109.6 113.6 118.5 120.6 124.6 132.1 138.7 142.0 144.7 147.6 150.030–39 years . . . . . . . . . . . . 1,757 132.2 11.3 0.500 108.5 113.0 117.6 121.1 126.1 133.0 139.6 142.7 146.2 150.2 152.740–49 years . . . . . . . . . . . . 1,303 132.2 11.8 0.607 104.5 112.0 119.0 122.6 127.0 132.7 139.6 143.5 145.6 149.5 152.550–59 years . . . . . . . . . . . . 969 135.1 10.6 0.636 114.6 117.5 122.5 125.5 129.0 134.6 142.2 146.6 148.7 152.7 155.160–69 years . . . . . . . . . . . . 1,112 134.8 11.1 0.619 113.1 116.5 121.1 124.0 128.1 135.6 141.7 145.7 147.7 152.0 154.670 years and over . . . . . . . . 1,664 133.7 11.8 0.536 108.5 113.6 119.5 122.6 127.1 134.2 141.6 145.2 147.6 152.1 156.2
Non-Hispanic white1 year and over . . . . . . . . . . . 5,030 133.5 10.4 0.294 112.6 116.5 120.6 123.1 127.1 133.6 140.2 144.1 146.6 150.2 153.6
1–2 years . . . . . . . . . . . . . 270 120.5 7.3 0.593 * 108.5 111.5 113.5 116.1 120.1 125.0 128.7 130.2 132.5 *3–5 years . . . . . . . . . . . . . 332 124.8 7.0 0.514 * 113.6 116.1 118.1 120.0 124.5 130.0 132.2 134.2 137.0 *6–8 years . . . . . . . . . . . . . 175 129.2 7.2 0.725 * * 119.1 120.6 125.5 129.7 133.7 135.7 137.5 * *9–11 years . . . . . . . . . . . . . 186 132.2 7.8 0.757 * * 122.0 125.0 127.6 132.1 137.2 140.1 142.0 * *12–14 years . . . . . . . . . . . . 154 134.3 9.7 1.043 * * 122.1 124.6 127.6 133.1 141.7 144.6 148.6 * *15–19 years . . . . . . . . . . . . 270 133.3 9.2 0.742 * 117.6 121.6 123.5 127.5 133.2 140.0 143.2 145.0 147.5 *20–29 years . . . . . . . . . . . . 477 133.0 10.0 0.610 * 115.6 120.1 122.6 126.5 134.1 140.1 143.6 145.2 148.1 *30–39 years . . . . . . . . . . . . 572 134.2 10.2 0.565 * 116.5 122.0 125.0 128.0 134.5 140.7 144.5 147.6 151.7 *40–49 years . . . . . . . . . . . . 457 133.9 10.3 0.643 * 117.6 122.6 124.6 128.2 133.7 140.6 144.2 146.7 149.7 *50–59 years . . . . . . . . . . . . 473 136.1 10.2 0.627 * 120.5 124.0 126.6 129.7 135.7 143.5 147.2 150.0 153.7 *60–69 years . . . . . . . . . . . . 473 135.3 10.9 0.665 * 116.6 121.6 125.1 128.6 136.1 142.5 146.1 148.2 152.1 *70 years and over . . . . . . . . 1,191 134.4 11.1 0.429 * 115.5 121.0 123.6 127.6 134.7 141.7 145.5 147.7 153.0 *
Non-Hispanic black
1 year and over . . . . . . . . . . . 4,116 124.6 11.4 0.247 99.1 107.1 111.5 114.1 118.1 125.1 131.7 135.6 138.1 142.6 145.71–2 years . . . . . . . . . . . . . 265 118.3 8.5 0.628 * 104.5 107.6 110.0 112.5 119.0 124.0 127.0 129.0 132.6 *3–5 years . . . . . . . . . . . . . 433 120.7 7.8 0.448 * 109.0 111.5 113.1 115.6 120.6 126.0 128.2 130.6 133.2 *6–8 years . . . . . . . . . . . . . 220 123.7 7.7 0.620 * * 113.5 115.1 118.1 123.6 129.5 131.7 134.5 * *9–11 years . . . . . . . . . . . . . 252 126.5 7.8 0.592 * 115.1 117.1 118.5 121.6 126.5 131.1 134.7 137.2 140.6 *12–14 years . . . . . . . . . . . . 220 125.4 8.9 0.717 * * 113.1 116.0 119.6 125.5 132.6 134.7 136.2 * *15–19 years . . . . . . . . . . . . 326 123.2 10.0 0.666 * 106.6 112.1 114.1 118.0 123.6 129.1 133.1 136.1 139.5 *20–29 years . . . . . . . . . . . . 589 124.2 11.0 0.546 * 107.0 111.1 113.6 118.1 124.1 131.6 135.2 138.0 142.0 *30–39 years . . . . . . . . . . . . 602 124.4 12.2 0.596 * 103.5 110.1 113.1 117.5 125.1 132.2 136.1 138.2 143.1 *40–49 years . . . . . . . . . . . . 425 124.2 13.8 0.802 * 101.1 109.0 111.6 118.0 126.0 132.6 136.2 138.1 142.6 *50–59 years . . . . . . . . . . . . 256 129.0 11.3 0.845 * 110.6 116.1 118.6 123.6 129.2 135.6 140.2 142.6 145.7 *60–69 years . . . . . . . . . . . . 276 128.6 10.6 0.767 * 112.1 115.6 118.1 121.6 129.2 135.6 140.1 142.2 146.1 *70 years and over . . . . . . . . 252 124.6 14.0 1.057 * 97.5 108.0 111.0 116.6 126.1 132.7 138.2 143.0 146.7 *
Mexican American
1 year and over . . . . . . . . . . . 3,994 130.2 11.3 0.464 106.0 112.0 117.0 119.6 123.6 130.7 137.6 141.1 143.2 147.5 150.51–2 years . . . . . . . . . . . . . 285 120.7 8.9 0.820 * * 111.5 113.1 115.6 121.0 126.6 129.6 131.2 * *3–5 years . . . . . . . . . . . . . 506 124.5 8.0 0.556 * 111.1 115.5 116.6 119.0 124.6 130.1 133.0 135.1 137.5 *6–8 years . . . . . . . . . . . . . 257 128.8 7.8 0.755 * * 119.6 122.0 123.5 128.6 135.2 137.6 137.7 * *9–11 years . . . . . . . . . . . . . 265 131.8 7.6 0.726 * * 123.0 123.1 126.6 131.1 136.5 139.2 141.5 * *12–14 years . . . . . . . . . . . . 218 133.2 8.5 0.897 * * 121.1 124.5 126.6 133.5 138.7 142.7 143.6 * *15–19 years . . . . . . . . . . . . 297 129.9 10.8 0.973 * 114.0 116.6 119.1 123.6 130.7 137.2 140.2 142.1 145.2 *20–29 years . . . . . . . . . . . . 632 130.4 10.6 0.655 * 112.1 116.6 119.6 124.0 131.5 137.7 140.2 142.6 146.2 *30–39 years . . . . . . . . . . . . 504 129.9 11.7 0.814 * 108.5 117.1 120.0 123.6 131.1 138.1 140.7 142.7 145.7 *40–49 years . . . . . . . . . . . . 356 130.1 15.3 1.257 * 99.6 111.1 116.6 124.1 132.2 139.2 143.5 146.7 151.1 *50–59 years . . . . . . . . . . . . 185 135.5 11.5 1.311 * * 122.0 125.6 129.7 136.1 143.6 147.0 149.1 * *60–69 years . . . . . . . . . . . . 317 134.2 11.2 0.978 * 117.1 120.6 123.0 127.1 134.1 142.6 145.6 147.5 150.2 *70 years and over . . . . . . . . 172 134.1 14.0 1.655 * * 119.1 122.6 126.6 136.1 143.7 146.2 149.1 * *
* Does not meet standards for reliability or precision.1Includes all other race/ethnic groups not listed separately.
Series 11, No. 247 [ Page 21

Table 4. Hematocrit as fractions (liters per liter) for persons 1 year and over, number of examined persons, mean, standard deviation,standard error of the mean, and selected percentiles, by race/ethnicity and age: United States, 1988–94
Race/ethnicity and age
Number ofexaminedpersons Mean
Standarddeviation
Standarderror ofmean
Percentile
2.5th 5th 10th 15th 25th 50th 75th 85th 90th 95th 97.5th
All race/ethnic groups1
1 year and over . . . . . . . . . . . 26,370 0.41 0.04 0.001 0.34 0.35 0.36 0.37 0.38 0.41 0.44 0.46 0.47 0.48 0.491–2 years . . . . . . . . . . . . . 1,789 0.36 0.02 0.001 0.32 0.32 0.33 0.34 0.34 0.36 0.37 0.38 0.39 0.40 0.403–5 years . . . . . . . . . . . . . 2,618 0.37 0.02 0.001 0.33 0.33 0.34 0.35 0.35 0.37 0.38 0.39 0.40 0.41 0.416–8 years . . . . . . . . . . . . . 1,384 0.38 0.02 0.001 0.34 0.34 0.35 0.36 0.37 0.38 0.40 0.40 0.41 0.42 0.429–11 years . . . . . . . . . . . . . 1,507 0.39 0.02 0.001 0.35 0.36 0.36 0.37 0.38 0.39 0.41 0.41 0.42 0.43 0.4412–14 years . . . . . . . . . . . . 1,161 0.41 0.03 0.002 0.35 0.36 0.37 0.38 0.39 0.41 0.43 0.44 0.45 0.47 0.4715–19 years . . . . . . . . . . . . 1,786 0.42 0.04 0.002 0.34 0.36 0.37 0.38 0.39 0.42 0.45 0.46 0.47 0.48 0.4920–29 years . . . . . . . . . . . . 3,331 0.42 0.04 0.001 0.34 0.36 0.37 0.38 0.39 0.42 0.45 0.47 0.48 0.49 0.4930–39 years . . . . . . . . . . . . 3,158 0.42 0.04 0.001 0.34 0.36 0.37 0.38 0.39 0.42 0.45 0.46 0.47 0.49 0.5040–49 years . . . . . . . . . . . . 2,467 0.42 0.04 0.001 0.34 0.36 0.37 0.38 0.39 0.42 0.45 0.46 0.47 0.48 0.4950–59 years . . . . . . . . . . . . 1,802 0.42 0.04 0.002 0.35 0.36 0.38 0.38 0.39 0.42 0.45 0.46 0.47 0.48 0.4960–69 years . . . . . . . . . . . . 2,241 0.42 0.04 0.001 0.35 0.36 0.37 0.38 0.39 0.42 0.44 0.46 0.47 0.48 0.5070 years and over . . . . . . . . 3,126 0.41 0.04 0.001 0.33 0.35 0.36 0.37 0.39 0.41 0.44 0.45 0.46 0.47 0.49
Non-Hispanic white
1 year and over . . . . . . . . . . . 9,520 0.42 0.04 0.001 0.34 0.35 0.37 0.38 0.39 0.41 0.44 0.46 0.47 0.48 0.491–2 years . . . . . . . . . . . . . 567 0.36 0.02 0.001 * 0.32 0.33 0.34 0.35 0.36 0.37 0.38 0.39 0.39 *3–5 years . . . . . . . . . . . . . 655 0.37 0.02 0.001 * 0.34 0.34 0.35 0.36 0.37 0.38 0.39 0.40 0.41 *6–8 years . . . . . . . . . . . . . 365 0.38 0.02 0.001 * 0.34 0.36 0.36 0.37 0.38 0.40 0.40 0.41 0.42 *9–11 years . . . . . . . . . . . . . 386 0.39 0.02 0.001 * 0.36 0.37 0.37 0.38 0.39 0.41 0.42 0.42 0.43 *12–14 years . . . . . . . . . . . . 293 0.41 0.03 0.002 * * 0.38 0.38 0.39 0.41 0.43 0.44 0.45 * *15–19 years . . . . . . . . . . . . 465 0.42 0.04 0.002 * 0.36 0.38 0.38 0.39 0.42 0.45 0.46 0.47 0.48 *20–29 years . . . . . . . . . . . . 858 0.42 0.04 0.002 * 0.36 0.37 0.38 0.39 0.43 0.45 0.47 0.48 0.49 *30–39 years . . . . . . . . . . . . 1,007 0.42 0.04 0.001 * 0.36 0.38 0.38 0.40 0.42 0.45 0.46 0.47 0.49 *40–49 years . . . . . . . . . . . . 871 0.42 0.04 0.002 * 0.36 0.37 0.38 0.39 0.42 0.45 0.46 0.47 0.48 *50–59 years . . . . . . . . . . . . 883 0.42 0.04 0.002 * 0.36 0.38 0.39 0.40 0.42 0.45 0.46 0.47 0.48 *60–69 years . . . . . . . . . . . . 966 0.42 0.04 0.002 * 0.36 0.38 0.38 0.39 0.42 0.44 0.46 0.47 0.48 *70 years and over . . . . . . . . 2,204 0.41 0.04 0.001 * 0.35 0.37 0.38 0.39 0.41 0.44 0.45 0.46 0.47 *
Non-Hispanic black
1 year and over . . . . . . . . . . . 7,749 0.40 0.04 0.001 0.32 0.33 0.35 0.36 0.37 0.39 0.43 0.44 0.45 0.47 0.481–2 years . . . . . . . . . . . . . 540 0.36 0.02 0.001 * 0.32 0.33 0.33 0.34 0.36 0.37 0.38 0.39 0.39 *3–5 years . . . . . . . . . . . . . 852 0.36 0.02 0.001 * 0.33 0.34 0.34 0.35 0.36 0.38 0.38 0.39 0.40 *6–8 years . . . . . . . . . . . . . 449 0.37 0.02 0.001 * 0.34 0.35 0.35 0.36 0.37 0.39 0.40 0.40 0.41 *9–11 years . . . . . . . . . . . . . 519 0.38 0.03 0.001 * 0.35 0.35 0.36 0.37 0.38 0.39 0.40 0.41 0.42 *12–14 years . . . . . . . . . . . . 404 0.39 0.03 0.002 * 0.35 0.36 0.36 0.37 0.39 0.41 0.42 0.43 0.44 *15–19 years . . . . . . . . . . . . 624 0.41 0.04 0.002 * 0.34 0.35 0.36 0.37 0.40 0.44 0.45 0.46 0.47 *20–29 years . . . . . . . . . . . . 1,052 0.41 0.05 0.002 * 0.34 0.35 0.36 0.37 0.41 0.44 0.46 0.47 0.48 *30–39 years . . . . . . . . . . . . 1,063 0.40 0.04 0.002 * 0.34 0.35 0.36 0.37 0.40 0.43 0.45 0.46 0.47 *40–49 years . . . . . . . . . . . . 761 0.40 0.04 0.002 * 0.33 0.35 0.36 0.38 0.40 0.43 0.45 0.46 0.47 *50–59 years . . . . . . . . . . . . 463 0.41 0.04 0.002 * 0.35 0.36 0.37 0.38 0.40 0.44 0.45 0.46 0.48 *60–69 years . . . . . . . . . . . . 550 0.40 0.04 0.002 * 0.34 0.36 0.36 0.38 0.40 0.42 0.44 0.45 0.46 *70 years and over . . . . . . . . 472 0.39 0.04 0.003 * 0.31 0.34 0.35 0.36 0.39 0.42 0.43 0.44 0.45 *
Mexican American
1 year and over . . . . . . . . . . . 7,945 0.41 0.04 0.001 0.33 0.35 0.36 0.37 0.38 0.41 0.45 0.46 0.47 0.48 0.491–2 years . . . . . . . . . . . . . 583 0.36 0.02 0.002 * 0.32 0.33 0.34 0.35 0.36 0.38 0.39 0.39 0.40 *3–5 years . . . . . . . . . . . . . 972 0.37 0.02 0.001 * 0.34 0.34 0.35 0.36 0.37 0.39 0.39 0.40 0.41 *6–8 years . . . . . . . . . . . . . 507 0.38 0.02 0.002 * 0.35 0.36 0.36 0.37 0.38 0.40 0.40 0.41 0.42 *9–11 years . . . . . . . . . . . . . 537 0.39 0.02 0.002 * 0.36 0.37 0.37 0.38 0.39 0.41 0.42 0.42 0.43 *12–14 years . . . . . . . . . . . . 409 0.41 0.03 0.002 * 0.36 0.37 0.38 0.39 0.41 0.42 0.43 0.44 0.45 *15–19 years . . . . . . . . . . . . 601 0.42 0.04 0.003 * 0.35 0.37 0.38 0.39 0.42 0.45 0.47 0.47 0.49 *20–29 years . . . . . . . . . . . . 1,279 0.43 0.04 0.002 * 0.35 0.37 0.38 0.39 0.43 0.46 0.47 0.48 0.49 *30–39 years . . . . . . . . . . . . 954 0.42 0.04 0.003 * 0.35 0.36 0.38 0.39 0.42 0.46 0.47 0.48 0.49 *40–49 years . . . . . . . . . . . . 725 0.42 0.05 0.003 * 0.34 0.36 0.38 0.39 0.43 0.45 0.47 0.47 0.49 *50–59 years . . . . . . . . . . . . 360 0.42 0.04 0.004 * 0.36 0.38 0.38 0.40 0.43 0.45 0.46 0.47 0.48 *60–69 years . . . . . . . . . . . . 647 0.42 0.04 0.003 * 0.36 0.37 0.38 0.39 0.42 0.44 0.46 0.47 0.48 *70 years and over . . . . . . . . 371 0.42 0.04 0.004 * 0.35 0.37 0.38 0.39 0.41 0.44 0.46 0.47 0.48 *
* Does not meet standards for reliability or precision.1Includes all other race/ethnic groups not listed separately.
Page 22 [ Series 11, No. 247

Table 5. Hematocrit as fractions (liters per liter) for males 1 year and over, number of examined persons, mean, standard deviation,standard error of the mean, and selected percentiles, by race/ethnicity and age: United States, 1988–94
Race/ethnicity and age
Number ofexaminedpersons Mean
Standarddeviation
Standarderror ofmean
Percentile
2.5th 5th 10th 15th 25th 50th 75th 85th 90th 95th 97.5th
All race/ethnic groups1
1 year and over . . . . . . . . . . . 12,623 0.43 0.04 0.001 0.35 0.36 0.38 0.39 0.41 0.44 0.46 0.47 0.48 0.49 0.501–2 years . . . . . . . . . . . . . 931 0.36 0.02 0.001 0.32 0.32 0.33 0.34 0.34 0.36 0.37 0.38 0.39 0.40 0.403–5 years . . . . . . . . . . . . . 1,281 0.37 0.02 0.001 0.33 0.33 0.34 0.35 0.35 0.37 0.38 0.39 0.40 0.41 0.416–8 years . . . . . . . . . . . . . 709 0.38 0.02 0.001 0.33 0.34 0.36 0.36 0.37 0.38 0.40 0.41 0.41 0.42 0.439–11 years . . . . . . . . . . . . . 773 0.39 0.02 0.001 0.35 0.36 0.37 0.37 0.38 0.39 0.41 0.42 0.43 0.43 0.4412–14 years . . . . . . . . . . . . 540 0.42 0.03 0.002 0.37 0.38 0.38 0.39 0.40 0.42 0.44 0.45 0.46 0.47 0.4815–19 years . . . . . . . . . . . . 836 0.45 0.03 0.002 0.39 0.40 0.41 0.42 0.43 0.45 0.46 0.47 0.48 0.49 0.5020–29 years . . . . . . . . . . . . 1,562 0.45 0.03 0.001 0.41 0.41 0.42 0.43 0.43 0.45 0.47 0.48 0.49 0.49 0.5030–39 years . . . . . . . . . . . . 1,401 0.45 0.03 0.001 0.40 0.41 0.41 0.42 0.43 0.45 0.47 0.48 0.49 0.50 0.5040–49 years . . . . . . . . . . . . 1,164 0.45 0.03 0.001 0.38 0.40 0.41 0.42 0.43 0.45 0.46 0.47 0.48 0.49 0.5050–59 years . . . . . . . . . . . . 833 0.44 0.03 0.002 0.38 0.39 0.41 0.41 0.42 0.44 0.46 0.47 0.48 0.49 0.5060–69 years . . . . . . . . . . . . 1,130 0.44 0.03 0.002 0.37 0.38 0.40 0.41 0.42 0.44 0.46 0.47 0.48 0.50 0.5070 years and over . . . . . . . . 1,463 0.43 0.04 0.002 0.34 0.36 0.38 0.39 0.41 0.43 0.45 0.47 0.48 0.49 0.50
Non-Hispanic white
1 year and over . . . . . . . . . . . 4,491 0.44 0.04 0.001 0.35 0.37 0.38 0.40 0.41 0.44 0.46 0.47 0.48 0.49 0.501–2 years . . . . . . . . . . . . . 297 0.36 0.02 0.001 * 0.32 0.33 0.34 0.34 0.36 0.37 0.38 0.39 0.39 *3–5 years . . . . . . . . . . . . . 323 0.37 0.02 0.001 * 0.34 0.34 0.35 0.35 0.37 0.38 0.39 0.40 0.41 *6–8 years . . . . . . . . . . . . . 190 0.38 0.02 0.002 * * 0.36 0.36 0.37 0.38 0.40 0.41 0.41 * *9–11 years . . . . . . . . . . . . . 200 0.40 0.02 0.002 * * 0.37 0.37 0.38 0.40 0.41 0.42 0.43 * *12–14 years . . . . . . . . . . . . 139 0.42 0.03 0.003 * * 0.38 0.39 0.40 0.42 0.44 0.45 0.46 * *15–19 years . . . . . . . . . . . . 195 0.45 0.03 0.002 * * 0.41 0.42 0.43 0.45 0.46 0.47 0.48 * *20–29 years . . . . . . . . . . . . 381 0.45 0.02 0.001 * 0.41 0.43 0.43 0.43 0.45 0.47 0.48 0.49 0.49 *30–39 years . . . . . . . . . . . . 435 0.45 0.03 0.001 * 0.41 0.41 0.42 0.43 0.45 0.47 0.48 0.49 0.50 *40–49 years . . . . . . . . . . . . 414 0.45 0.03 0.002 * 0.40 0.41 0.42 0.43 0.45 0.46 0.47 0.48 0.49 *50–59 years . . . . . . . . . . . . 410 0.44 0.03 0.002 * 0.39 0.41 0.41 0.43 0.45 0.46 0.47 0.48 0.50 *60–69 years . . . . . . . . . . . . 493 0.44 0.03 0.002 * 0.39 0.40 0.41 0.42 0.44 0.46 0.47 0.48 0.50 *70 years and over . . . . . . . . 1,014 0.43 0.04 0.001 * 0.37 0.38 0.39 0.41 0.43 0.45 0.47 0.48 0.49 *
Non-Hispanic black
1 year and over . . . . . . . . . . . 3,633 0.42 0.04 0.001 0.34 0.35 0.36 0.37 0.39 0.42 0.45 0.46 0.47 0.48 0.491–2 years . . . . . . . . . . . . . 275 0.35 0.02 0.002 * 0.32 0.33 0.33 0.34 0.35 0.37 0.38 0.38 0.39 *3–5 years . . . . . . . . . . . . . 419 0.36 0.02 0.001 * 0.32 0.33 0.34 0.35 0.36 0.38 0.38 0.39 0.40 *6–8 years . . . . . . . . . . . . . 229 0.38 0.02 0.002 * 0.34 0.35 0.36 0.36 0.38 0.39 0.40 0.41 0.41 *9–11 years . . . . . . . . . . . . . 267 0.38 0.03 0.002 * 0.34 0.36 0.36 0.37 0.38 0.40 0.41 0.41 0.42 *12–14 years . . . . . . . . . . . . 184 0.40 0.03 0.003 * * 0.37 0.37 0.38 0.40 0.42 0.43 0.44 * *15–19 years . . . . . . . . . . . . 298 0.44 0.03 0.002 * 0.39 0.40 0.40 0.42 0.44 0.46 0.47 0.47 0.48 *20–29 years . . . . . . . . . . . . 463 0.44 0.03 0.001 * 0.40 0.41 0.42 0.43 0.44 0.46 0.47 0.48 0.49 *30–39 years . . . . . . . . . . . . 461 0.44 0.03 0.002 * 0.38 0.40 0.41 0.42 0.44 0.46 0.47 0.47 0.48 *40–49 years . . . . . . . . . . . . 336 0.43 0.03 0.002 * 0.38 0.39 0.40 0.41 0.44 0.45 0.46 0.47 0.48 *50–59 years . . . . . . . . . . . . 207 0.43 0.04 0.003 * * 0.38 0.39 0.41 0.43 0.46 0.47 0.48 * *60–69 years . . . . . . . . . . . . 274 0.42 0.04 0.003 * 0.35 0.38 0.38 0.40 0.42 0.45 0.45 0.47 0.47 *70 years and over . . . . . . . . 220 0.41 0.04 0.004 * * 0.35 0.37 0.38 0.41 0.43 0.45 0.46 * *
Mexican American
1 year and over . . . . . . . . . . . 3,951 0.43 0.04 0.002 0.35 0.36 0.37 0.39 0.41 0.44 0.46 0.47 0.48 0.49 0.501–2 years . . . . . . . . . . . . . 298 0.36 0.03 0.002 * *0.32 0.33 0.33 0.34 0.36 0.38 0.39 0.39 *0.40 *3–5 years . . . . . . . . . . . . . 466 0.37 0.02 0.002 * 0.34 0.34 0.35 0.36 0.37 0.39 0.40 0.40 0.41 *6–8 years . . . . . . . . . . . . . 250 0.38 0.02 0.002 * * 0.36 0.36 0.37 0.38 0.39 0.40 0.41 * *9–11 years . . . . . . . . . . . . . 272 0.40 0.02 0.002 * * 0.37 0.37 0.38 0.40 0.41 0.42 0.43 * *12–14 years . . . . . . . . . . . . 191 0.42 0.03 0.003 * * 0.39 0.39 0.40 0.42 0.43 0.45 0.45 * *15–19 years . . . . . . . . . . . . 304 0.45 0.03 0.002 * 0.41 0.42 0.43 0.43 0.45 0.47 0.48 0.49 0.49 *20–29 years . . . . . . . . . . . . 647 0.46 0.03 0.002 * 0.42 0.42 0.43 0.44 0.46 0.47 0.48 0.49 0.50 *30–39 years . . . . . . . . . . . . 450 0.46 0.02 0.002 * 0.41 0.42 0.43 0.44 0.46 0.47 0.48 0.49 0.49 *40–49 years . . . . . . . . . . . . 369 0.45 0.03 0.002 * 0.40 0.42 0.42 0.43 0.45 0.47 0.48 0.49 0.50 *50–59 years . . . . . . . . . . . . 175 0.45 0.03 0.004 * * 0.41 0.42 0.43 0.45 0.47 0.48 0.48 * *60–69 years . . . . . . . . . . . . 330 0.44 0.03 0.003 * 0.39 0.40 0.41 0.42 0.44 0.47 0.48 0.48 0.49 *70 years and over . . . . . . . . 199 0.43 0.04 0.005 * * 0.38 0.38 0.40 0.43 0.47 0.48 0.48 * *
* Does not meet standards for reliability or precision.1Includes all other race/ethnic groups not listed separately.
Series 11, No. 247 [ Page 23

Table 6. Hematocrit as fractions (liters per liter) for females 1 year and over, number of examined persons, mean, standard deviation,standard error of the mean, and selected percentiles, by race/ethnicity and age: United States, 1988–94
Race/ethnicity and age
Number ofexaminedpersons Mean
Standarddeviation
Standarderror ofmean
Percentile
2.5th 5th 10th 15th 25th 50th 75th 85th 90th 95th 97.5th
All race/ethnic groups1
1 year and over . . . . . . . . . . . 13,747 0.39 0.03 0.001 0.33 0.34 0.36 0.36 0.37 0.39 0.41 0.42 0.43 0.44 0.451–2 years . . . . . . . . . . . . . 858 0.36 0.02 0.001 0.32 0.32 0.33 0.34 0.35 0.36 0.37 0.38 0.39 0.40 0.403–5 years . . . . . . . . . . . . . 1,337 0.37 0.02 0.001 0.32 0.33 0.34 0.35 0.35 0.37 0.38 0.39 0.40 0.40 0.416–8 years . . . . . . . . . . . . . 675 0.38 0.02 0.001 0.34 0.34 0.35 0.36 0.37 0.38 0.40 0.40 0.41 0.42 0.429–11 years . . . . . . . . . . . . . 734 0.39 0.02 0.001 0.35 0.35 0.36 0.37 0.38 0.39 0.40 0.41 0.42 0.42 0.4312–14 years . . . . . . . . . . . . 621 0.40 0.03 0.002 0.34 0.35 0.36 0.37 0.38 0.39 0.41 0.42 0.43 0.44 0.4415–19 years . . . . . . . . . . . . 950 0.39 0.03 0.002 0.33 0.34 0.36 0.36 0.38 0.39 0.41 0.42 0.42 0.43 0.4420–29 years . . . . . . . . . . . . 1,769 0.39 0.03 0.001 0.33 0.34 0.36 0.36 0.37 0.39 0.41 0.42 0.43 0.43 0.4430–39 years . . . . . . . . . . . . 1,757 0.39 0.03 0.001 0.33 0.34 0.36 0.36 0.38 0.39 0.41 0.42 0.43 0.44 0.4540–49 years . . . . . . . . . . . . 1,303 0.39 0.03 0.002 0.33 0.34 0.36 0.37 0.38 0.39 0.41 0.42 0.43 0.44 0.4550–59 years . . . . . . . . . . . . 969 0.40 0.03 0.002 0.35 0.35 0.36 0.37 0.38 0.40 0.42 0.43 0.44 0.45 0.4660–69 years . . . . . . . . . . . . 1,111 0.40 0.03 0.002 0.34 0.35 0.36 0.37 0.38 0.40 0.42 0.43 0.44 0.45 0.4670 years and over . . . . . . . . 1,663 0.40 0.03 0.001 0.33 0.34 0.36 0.37 0.38 0.40 0.42 0.43 0.44 0.45 0.46
Non-Hispanic white
1 year and over . . . . . . . . . . . 5,029 0.40 0.03 0.001 0.34 0.35 0.36 0.37 0.38 0.40 0.41 0.42 0.43 0.44 0.451–2 years . . . . . . . . . . . . . 270 0.36 0.02 0.002 * 0.32 0.33 0.34 0.35 0.36 0.37 0.38 0.39 0.39 *3–5 years . . . . . . . . . . . . . 332 0.37 0.02 0.001 * 0.34 0.34 0.35 0.36 0.37 0.38 0.39 0.40 0.40 *6–8 years . . . . . . . . . . . . . 175 0.38 0.02 0.002 * * 0.36 0.36 0.37 0.38 0.40 0.40 0.41 * *9–11 years . . . . . . . . . . . . . 186 0.39 0.02 0.002 * * 0.36 0.37 0.38 0.39 0.41 0.41 0.42 * *12–14 years . . . . . . . . . . . . 154 0.40 0.03 0.003 * * 0.37 0.37 0.38 0.40 0.41 0.42 0.43 * *15–19 years . . . . . . . . . . . . 270 0.40 0.03 0.002 * 0.35 0.36 0.37 0.38 0.40 0.41 0.42 0.42 0.44 *20–29 years . . . . . . . . . . . . 477 0.39 0.03 0.002 * 0.35 0.36 0.36 0.38 0.39 0.41 0.42 0.43 0.44 *30–39 years . . . . . . . . . . . . 572 0.40 0.03 0.001 * 0.35 0.36 0.37 0.38 0.40 0.41 0.43 0.43 0.45 *40–49 years . . . . . . . . . . . . 457 0.40 0.03 0.002 * 0.35 0.36 0.37 0.38 0.40 0.41 0.42 0.43 0.44 *50–59 years . . . . . . . . . . . . 473 0.40 0.03 0.002 * 0.36 0.37 0.38 0.39 0.40 0.42 0.43 0.44 0.45 *60–69 years . . . . . . . . . . . . 473 0.40 0.03 0.002 * 0.35 0.37 0.37 0.38 0.40 0.42 0.43 0.44 0.45 *70 years and over . . . . . . . . 1,190 0.40 0.03 0.001 * 0.35 0.36 0.37 0.38 0.40 0.42 0.43 0.44 0.45 *
Non-Hispanic black
1 year and over . . . . . . . . . . . 4,116 0.38 0.03 0.001 0.31 0.33 0.34 0.35 0.36 0.38 0.40 0.41 0.41 0.43 0.431–2 years . . . . . . . . . . . . . 265 0.36 0.02 0.002 * 0.32 0.33 0.33 0.34 0.36 0.37 0.38 0.39 0.39 *3–5 years . . . . . . . . . . . . . 433 0.36 0.02 0.001 * 0.33 0.34 0.34 0.35 0.36 0.38 0.39 0.39 0.40 *6–8 years . . . . . . . . . . . . . 220 0.37 0.02 0.002 * * 0.35 0.35 0.36 0.37 0.39 0.39 0.40 * *9–11 years . . . . . . . . . . . . . 252 0.38 0.02 0.002 * 0.35 0.35 0.36 0.37 0.38 0.39 0.40 0.41 0.42 *12–14 years . . . . . . . . . . . . 220 0.38 0.02 0.002 * * 0.35 0.36 0.36 0.38 0.39 0.40 0.41 * *15–19 years . . . . . . . . . . . . 326 0.37 0.03 0.002 * 0.33 0.34 0.35 0.36 0.37 0.39 0.40 0.41 0.42 *20–29 years . . . . . . . . . . . . 589 0.38 0.03 0.002 * 0.32 0.34 0.35 0.36 0.38 0.40 0.41 0.41 0.43 *30–39 years . . . . . . . . . . . . 602 0.38 0.03 0.002 * 0.32 0.34 0.35 0.36 0.38 0.40 0.41 0.41 0.42 *40–49 years . . . . . . . . . . . . 425 0.38 0.04 0.002 * 0.31 0.34 0.34 0.36 0.38 0.40 0.41 0.42 0.43 *50–59 years . . . . . . . . . . . . 256 0.39 0.03 0.002 * 0.34 0.36 0.36 0.37 0.39 0.41 0.42 0.43 0.44 *60–69 years . . . . . . . . . . . . 276 0.39 0.03 0.002 * 0.34 0.35 0.36 0.37 0.39 0.41 0.42 0.42 0.43 *70 years and over . . . . . . . . 252 0.38 0.04 0.003 * 0.31 0.33 0.34 0.36 0.38 0.40 0.42 0.43 0.44 *
Mexican American
1 year and over . . . . . . . . . . . 3,994 0.39 0.03 0.001 0.32 0.34 0.35 0.36 0.37 0.39 0.41 0.42 0.42 0.43 0.441–2 years . . . . . . . . . . . . . 285 0.36 0.02 0.002 * * 0.34 0.34 0.35 0.36 0.37 0.39 0.39 * *3–5 years . . . . . . . . . . . . . 506 0.37 0.02 0.002 * 0.34 0.34 0.35 0.36 0.37 0.39 0.39 0.40 0.41 *6–8 years . . . . . . . . . . . . . 257 0.38 0.02 0.002 * * 0.35 0.36 0.37 0.38 0.40 0.40 0.41 * *9–11 years . . . . . . . . . . . . . 265 0.39 0.02 0.002 * * 0.36 0.37 0.37 0.39 0.40 0.41 0.42 * *12–14 years . . . . . . . . . . . . 218 0.39 0.02 0.003 * * 0.36 0.37 0.38 0.39 0.41 0.42 0.42 * *15–19 years . . . . . . . . . . . . 297 0.39 0.03 0.003 * 0.34 0.35 0.36 0.37 0.39 0.41 0.42 0.42 0.43 *20–29 years . . . . . . . . . . . . 632 0.39 0.03 0.002 * 0.34 0.35 0.36 0.37 0.39 0.41 0.42 0.42 0.43 *30–39 years . . . . . . . . . . . . 504 0.39 0.03 0.002 * 0.33 0.35 0.36 0.37 0.39 0.41 0.42 0.42 0.43 *40–49 years . . . . . . . . . . . . 356 0.39 0.04 0.003 * 0.31 0.34 0.36 0.37 0.39 0.41 0.42 0.43 0.44 *50–59 years . . . . . . . . . . . . 185 0.40 0.03 0.004 * * 0.36 0.37 0.38 0.41 0.42 0.43 0.44 * *60–69 years . . . . . . . . . . . . 317 0.40 0.03 0.003 * 0.35 0.36 0.37 0.38 0.40 0.42 0.43 0.44 0.45 *70 years and over . . . . . . . . 172 0.40 0.04 0.005 * * 0.36 0.37 0.39 0.40 0.43 0.43 0.45 * *
* Does not meet standards for reliability or precision.1Includes all other race/ethnic groups not listed separately.
Page 24 [ Series 11, No. 247
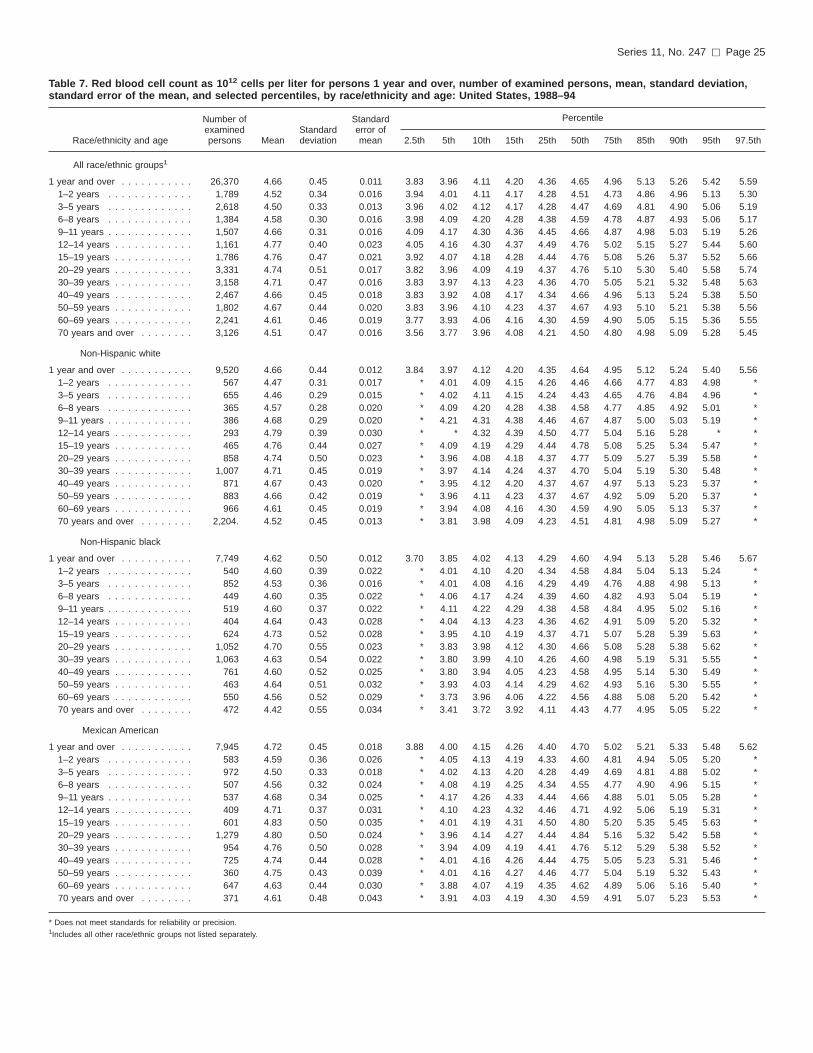
Table 7. Red blood cell count as 1012 cells per liter for persons 1 year and over, number of examined persons, mean, standard deviation,standard error of the mean, and selected percentiles, by race/ethnicity and age: United States, 1988–94
Race/ethnicity and age
Number ofexaminedpersons Mean
Standarddeviation
Standarderror ofmean
Percentile
2.5th 5th 10th 15th 25th 50th 75th 85th 90th 95th 97.5th
All race/ethnic groups1
1 year and over . . . . . . . . . . . 26,370 4.66 0.45 0.011 3.83 3.96 4.11 4.20 4.36 4.65 4.96 5.13 5.26 5.42 5.591–2 years . . . . . . . . . . . . . 1,789 4.52 0.34 0.016 3.94 4.01 4.11 4.17 4.28 4.51 4.73 4.86 4.96 5.13 5.303–5 years . . . . . . . . . . . . . 2,618 4.50 0.33 0.013 3.96 4.02 4.12 4.17 4.28 4.47 4.69 4.81 4.90 5.06 5.196–8 years . . . . . . . . . . . . . 1,384 4.58 0.30 0.016 3.98 4.09 4.20 4.28 4.38 4.59 4.78 4.87 4.93 5.06 5.179–11 years . . . . . . . . . . . . . 1,507 4.66 0.31 0.016 4.09 4.17 4.30 4.36 4.45 4.66 4.87 4.98 5.03 5.19 5.2612–14 years . . . . . . . . . . . . 1,161 4.77 0.40 0.023 4.05 4.16 4.30 4.37 4.49 4.76 5.02 5.15 5.27 5.44 5.6015–19 years . . . . . . . . . . . . 1,786 4.76 0.47 0.021 3.92 4.07 4.18 4.28 4.44 4.76 5.08 5.26 5.37 5.52 5.6620–29 years . . . . . . . . . . . . 3,331 4.74 0.51 0.017 3.82 3.96 4.09 4.19 4.37 4.76 5.10 5.30 5.40 5.58 5.7430–39 years . . . . . . . . . . . . 3,158 4.71 0.47 0.016 3.83 3.97 4.13 4.23 4.36 4.70 5.05 5.21 5.32 5.48 5.6340–49 years . . . . . . . . . . . . 2,467 4.66 0.45 0.018 3.83 3.92 4.08 4.17 4.34 4.66 4.96 5.13 5.24 5.38 5.5050–59 years . . . . . . . . . . . . 1,802 4.67 0.44 0.020 3.83 3.96 4.10 4.23 4.37 4.67 4.93 5.10 5.21 5.38 5.5660–69 years . . . . . . . . . . . . 2,241 4.61 0.46 0.019 3.77 3.93 4.06 4.16 4.30 4.59 4.90 5.05 5.15 5.36 5.5570 years and over . . . . . . . . 3,126 4.51 0.47 0.016 3.56 3.77 3.96 4.08 4.21 4.50 4.80 4.98 5.09 5.28 5.45
Non-Hispanic white
1 year and over . . . . . . . . . . . 9,520 4.66 0.44 0.012 3.84 3.97 4.12 4.20 4.35 4.64 4.95 5.12 5.24 5.40 5.561–2 years . . . . . . . . . . . . . 567 4.47 0.31 0.017 * 4.01 4.09 4.15 4.26 4.46 4.66 4.77 4.83 4.98 *3–5 years . . . . . . . . . . . . . 655 4.46 0.29 0.015 * 4.02 4.11 4.15 4.24 4.43 4.65 4.76 4.84 4.96 *6–8 years . . . . . . . . . . . . . 365 4.57 0.28 0.020 * 4.09 4.20 4.28 4.38 4.58 4.77 4.85 4.92 5.01 *9–11 years . . . . . . . . . . . . . 386 4.68 0.29 0.020 * 4.21 4.31 4.38 4.46 4.67 4.87 5.00 5.03 5.19 *12–14 years . . . . . . . . . . . . 293 4.79 0.39 0.030 * * 4.32 4.39 4.50 4.77 5.04 5.16 5.28 * *15–19 years . . . . . . . . . . . . 465 4.76 0.44 0.027 * 4.09 4.19 4.29 4.44 4.78 5.08 5.25 5.34 5.47 *20–29 years . . . . . . . . . . . . 858 4.74 0.50 0.023 * 3.96 4.08 4.18 4.37 4.77 5.09 5.27 5.39 5.58 *30–39 years . . . . . . . . . . . . 1,007 4.71 0.45 0.019 * 3.97 4.14 4.24 4.37 4.70 5.04 5.19 5.30 5.48 *40–49 years . . . . . . . . . . . . 871 4.67 0.43 0.020 * 3.95 4.12 4.20 4.37 4.67 4.97 5.13 5.23 5.37 *50–59 years . . . . . . . . . . . . 883 4.66 0.42 0.019 * 3.96 4.11 4.23 4.37 4.67 4.92 5.09 5.20 5.37 *60–69 years . . . . . . . . . . . . 966 4.61 0.45 0.019 * 3.94 4.08 4.16 4.30 4.59 4.90 5.05 5.13 5.37 *70 years and over . . . . . . . . 2,204. 4.52 0.45 0.013 * 3.81 3.98 4.09 4.23 4.51 4.81 4.98 5.09 5.27 *
Non-Hispanic black
1 year and over . . . . . . . . . . . 7,749 4.62 0.50 0.012 3.70 3.85 4.02 4.13 4.29 4.60 4.94 5.13 5.28 5.46 5.671–2 years . . . . . . . . . . . . . 540 4.60 0.39 0.022 * 4.01 4.10 4.20 4.34 4.58 4.84 5.04 5.13 5.24 *3–5 years . . . . . . . . . . . . . 852 4.53 0.36 0.016 * 4.01 4.08 4.16 4.29 4.49 4.76 4.88 4.98 5.13 *6–8 years . . . . . . . . . . . . . 449 4.60 0.35 0.022 * 4.06 4.17 4.24 4.39 4.60 4.82 4.93 5.04 5.19 *9–11 years . . . . . . . . . . . . . 519 4.60 0.37 0.022 * 4.11 4.22 4.29 4.38 4.58 4.84 4.95 5.02 5.16 *12–14 years . . . . . . . . . . . . 404 4.64 0.43 0.028 * 4.04 4.13 4.23 4.36 4.62 4.91 5.09 5.20 5.32 *15–19 years . . . . . . . . . . . . 624 4.73 0.52 0.028 * 3.95 4.10 4.19 4.37 4.71 5.07 5.28 5.39 5.63 *20–29 years . . . . . . . . . . . . 1,052 4.70 0.55 0.023 * 3.83 3.98 4.12 4.30 4.66 5.08 5.28 5.38 5.62 *30–39 years . . . . . . . . . . . . 1,063 4.63 0.54 0.022 * 3.80 3.99 4.10 4.26 4.60 4.98 5.19 5.31 5.55 *40–49 years . . . . . . . . . . . . 761 4.60 0.52 0.025 * 3.80 3.94 4.05 4.23 4.58 4.95 5.14 5.30 5.49 *50–59 years . . . . . . . . . . . . 463 4.64 0.51 0.032 * 3.93 4.03 4.14 4.29 4.62 4.93 5.16 5.30 5.55 *60–69 years . . . . . . . . . . . . 550 4.56 0.52 0.029 * 3.73 3.96 4.06 4.22 4.56 4.88 5.08 5.20 5.42 *70 years and over . . . . . . . . 472 4.42 0.55 0.034 * 3.41 3.72 3.92 4.11 4.43 4.77 4.95 5.05 5.22 *
Mexican American
1 year and over . . . . . . . . . . . 7,945 4.72 0.45 0.018 3.88 4.00 4.15 4.26 4.40 4.70 5.02 5.21 5.33 5.48 5.621–2 years . . . . . . . . . . . . . 583 4.59 0.36 0.026 * 4.05 4.13 4.19 4.33 4.60 4.81 4.94 5.05 5.20 *3–5 years . . . . . . . . . . . . . 972 4.50 0.33 0.018 * 4.02 4.13 4.20 4.28 4.49 4.69 4.81 4.88 5.02 *6–8 years . . . . . . . . . . . . . 507 4.56 0.32 0.024 * 4.08 4.19 4.25 4.34 4.55 4.77 4.90 4.96 5.15 *9–11 years . . . . . . . . . . . . . 537 4.68 0.34 0.025 * 4.17 4.26 4.33 4.44 4.66 4.88 5.01 5.05 5.28 *12–14 years . . . . . . . . . . . . 409 4.71 0.37 0.031 * 4.10 4.23 4.32 4.46 4.71 4.92 5.06 5.19 5.31 *15–19 years . . . . . . . . . . . . 601 4.83 0.50 0.035 * 4.01 4.19 4.31 4.50 4.80 5.20 5.35 5.45 5.63 *20–29 years . . . . . . . . . . . . 1,279 4.80 0.50 0.024 * 3.96 4.14 4.27 4.44 4.84 5.16 5.32 5.42 5.58 *30–39 years . . . . . . . . . . . . 954 4.76 0.50 0.028 * 3.94 4.09 4.19 4.41 4.76 5.12 5.29 5.38 5.52 *40–49 years . . . . . . . . . . . . 725 4.74 0.44 0.028 * 4.01 4.16 4.26 4.44 4.75 5.05 5.23 5.31 5.46 *50–59 years . . . . . . . . . . . . 360 4.75 0.43 0.039 * 4.01 4.16 4.27 4.46 4.77 5.04 5.19 5.32 5.43 *60–69 years . . . . . . . . . . . . 647 4.63 0.44 0.030 * 3.88 4.07 4.19 4.35 4.62 4.89 5.06 5.16 5.40 *70 years and over . . . . . . . . 371 4.61 0.48 0.043 * 3.91 4.03 4.19 4.30 4.59 4.91 5.07 5.23 5.53 *
* Does not meet standards for reliability or precision.1Includes all other race/ethnic groups not listed separately.
Series 11, No. 247 [ Page 25

Table 8. Red blood cell count as 1012 cells per liter for males 1 year and over, number of examined persons, mean, standard deviation,standard error of the mean, and selected percentiles, by race/ethnicity and age: United States, 1988–94
Race/ethnicity and age
Number ofexaminedpersons Mean
Standarddeviation
Standarderror ofmean
Percentile
2.5th 5th 10th 15th 25th 50th 75th 85th 90th 95th 97.5th
All race/ethnic groups1
1 year and over . . . . . . . . . . . 12,623 4.90 0.42 0.014 4.09 4.23 4.38 4.48 4.63 4.91 5.16 5.32 5.41 5.58 5.721–2 years . . . . . . . . . . . . . 931 4.55 0.34 0.020 3.94 4.05 4.12 4.20 4.30 4.54 4.76 4.88 4.98 5.13 5.243–5 years . . . . . . . . . . . . . 1,281 4.51 0.34 0.017 3.96 4.02 4.13 4.18 4.29 4.47 4.69 4.84 4.95 5.07 5.246–8 years . . . . . . . . . . . . . 709 4.60 0.29 0.019 3.99 4.11 4.25 4.30 4.44 4.60 4.80 4.88 4.95 5.06 5.159–11 years . . . . . . . . . . . . . 773 4.71 0.32 0.020 4.13 4.23 4.32 4.39 4.47 4.70 4.92 5.02 5.10 5.21 5.3012–14 years . . . . . . . . . . . . 540 4.93 0.39 0.030 4.25 4.34 4.44 4.52 4.66 4.90 5.16 5.31 5.44 5.58 5.7015–19 years . . . . . . . . . . . . 836 5.06 0.37 0.023 4.36 4.48 4.62 4.71 4.80 5.04 5.31 5.41 5.52 5.66 5.8120–29 years . . . . . . . . . . . . 1,562 5.11 0.36 0.016 4.44 4.53 4.66 4.79 4.88 5.08 5.34 5.48 5.59 5.75 5.8430–39 years . . . . . . . . . . . . 1,401 5.02 0.36 0.017 4.34 4.47 4.57 4.66 4.80 5.01 5.27 5.37 5.48 5.63 5.7340–49 years . . . . . . . . . . . . 1,164 4.93 0.38 0.020 4.15 4.36 4.51 4.60 4.70 4.94 5.17 5.31 5.37 5.49 5.6150–59 years . . . . . . . . . . . . 833 4.89 0.40 0.025 4.08 4.28 4.39 4.51 4.66 4.88 5.11 5.27 5.38 5.54 5.6860–69 years . . . . . . . . . . . . 1,130 4.80 0.44 0.023 3.86 4.06 4.27 4.36 4.51 4.81 5.07 5.21 5.33 5.52 5.6970 years and over . . . . . . . . 1,463 4.67 0.50 0.023 3.55 3.87 4.09 4.20 4.38 4.67 5.01 5.16 5.28 5.45 5.63
Non-Hispanic white
1 year and over . . . . . . . . . . . 4,491 4.89 0.40 0.016 4.11 4.25 4.38 4.48 4.63 4.91 5.16 5.30 5.39 5.55 5.661–2 years . . . . . . . . . . . . . 297 4.50 0.32 0.023 * 4.05 4.12 4.18 4.29 4.51 4.69 4.79 4.88 5.00 *3–5 years . . . . . . . . . . . . . 323 4.46 0.28 0.019 * 4.02 4.13 4.17 4.27 4.42 4.64 4.76 4.84 4.96 *6–8 years . . . . . . . . . . . . . 190 4.60 0.26 0.024 * * 4.26 4.31 4.45 4.59 4.79 4.87 4.93 * *9–11 years . . . . . . . . . . . . . 200 4.72 0.29 0.025 * * 4.35 4.40 4.48 4.72 4.94 5.02 5.10 * *12–14 years . . . . . . . . . . . . 139 4.93 0.38 0.040 * * 4.45 4.52 4.67 4.91 5.16 5.31 5.43 * *15–19 years . . . . . . . . . . . . 195 5.05 0.33 0.029 * * 4.66 4.73 4.83 5.04 5.30 5.39 5.47 * *20–29 years . . . . . . . . . . . . 381 5.11 0.35 0.022 * 4.53 4.67 4.81 4.87 5.07 5.34 5.48 5.58 5.73 *30–39 years . . . . . . . . . . . . 435 5.01 0.34 0.020 * 4.47 4.56 4.65 4.80 4.98 5.24 5.34 5.47 5.59 *40–49 years . . . . . . . . . . . . 414 4.93 0.35 0.021 * 4.38 4.52 4.61 4.72 4.93 5.16 5.30 5.37 5.48 *50–59 years . . . . . . . . . . . . 410 4.87 0.37 0.023 * 4.29 4.40 4.54 4.66 4.88 5.09 5.24 5.34 5.48 *60–69 years . . . . . . . . . . . . 493 4.80 0.43 0.024 * 4.06 4.29 4.36 4.51 4.81 5.07 5.18 5.35 5.52 *70 years and over . . . . . . . . 1,014 4.69 0.49 0.019 * 3.90 4.13 4.23 4.40 4.68 5.01 5.15 5.27 5.45 *
Non-Hispanic black
1 year and over . . . . . . . . . . . 3,633 4.87 0.49 0.017 3.94 4.10 4.27 4.40 4.56 4.86 5.18 5.35 5.46 5.67 5.871–2 years . . . . . . . . . . . . . 275 4.60 0.39 0.029 * 4.01 4.09 4.20 4.29 4.59 4.84 5.02 5.13 5.27 *3–5 years . . . . . . . . . . . . . 419 4.54 0.34 0.020 * 4.03 4.10 4.17 4.29 4.52 4.77 4.88 4.94 5.11 *6–8 years . . . . . . . . . . . . . 229 4.62 0.37 0.030 * 4.06 4.13 4.27 4.41 4.63 4.83 4.94 5.10 5.34 *9–11 years . . . . . . . . . . . . . 267 4.60 0.42 0.032 * 4.09 4.20 4.28 4.38 4.62 4.88 4.98 5.12 5.23 *12–14 years . . . . . . . . . . . . 184 4.81 0.45 0.041 * * 4.28 4.42 4.52 4.77 5.10 5.20 5.31 * *15–19 years . . . . . . . . . . . . 298 5.05 0.42 0.029 * 4.47 4.57 4.65 4.79 5.00 5.33 5.49 5.63 5.77 *20–29 years . . . . . . . . . . . . 463 5.09 0.42 0.024 * 4.46 4.57 4.63 4.80 5.07 5.34 5.48 5.62 5.85 *30–39 years . . . . . . . . . . . . 461 4.99 0.46 0.026 * 4.30 4.48 4.60 4.73 4.98 5.27 5.42 5.55 5.76 *40–49 years . . . . . . . . . . . . 336 4.91 0.48 0.032 * 4.12 4.31 4.46 4.61 4.92 5.23 5.42 5.52 5.63 *50–59 years . . . . . . . . . . . . 207 4.87 0.53 0.045 * * 4.17 4.31 4.52 4.87 5.23 5.39 5.55 * *60–69 years . . . . . . . . . . . . 274 4.74 0.56 0.041 * 3.80 4.05 4.19 4.38 4.75 5.10 5.29 5.42 5.66 *70 years and over . . . . . . . . 220 4.60 0.57 0.047 * * 3.92 4.07 4.25 4.63 4.94 5.12 5.23 * *
Mexican American
1 year and over . . . . . . . . . . . 3,951 4.96 0.41 0.022 4.16 4.27 4.42 4.53 4.69 4.95 5.23 5.37 5.46 5.61 5.731–2 years . . . . . . . . . . . . . 298 4.61 0.37 0.034 * * 4.16 4.20 4.33 4.62 4.84 4.96 5.09 * *3–5 years . . . . . . . . . . . . . 466 4.53 0.33 0.024 * 4.08 4.16 4.23 4.30 4.51 4.69 4.81 4.92 5.12 *6–8 years . . . . . . . . . . . . . 250 4.58 0.32 0.031 * * 4.22 4.27 4.36 4.56 4.81 4.91 4.98 * *9–11 years . . . . . . . . . . . . . 272 4.75 0.36 0.034 * * 4.31 4.38 4.48 4.73 4.95 5.06 5.20 * *12–14 years . . . . . . . . . . . . 191 4.91 0.32 0.036 * * 4.49 4.56 4.67 4.88 5.09 5.26 5.32 * *15–19 years . . . . . . . . . . . . 304 5.15 0.36 0.032 * 4.61 4.67 4.76 4.88 5.15 5.37 5.55 5.62 5.81 *20–29 years . . . . . . . . . . . . 647 5.12 0.33 0.020 * 4.61 4.74 4.79 4.90 5.11 5.34 5.48 5.55 5.70 *30–39 years . . . . . . . . . . . . 450 5.09 0.35 0.026 * 4.55 4.66 4.73 4.87 5.09 5.33 5.43 5.52 5.58 *40–49 years . . . . . . . . . . . . 369 5.01 0.36 0.029 * 4.37 4.59 4.66 4.78 5.01 5.24 5.35 5.45 5.63 *50–59 years . . . . . . . . . . . . 175 4.97 0.38 0.046 * * 4.51 4.64 4.77 4.96 5.28 5.36 5.43 * *60–69 years . . . . . . . . . . . . 330 4.85 0.40 0.034 * 4.17 4.35 4.47 4.60 4.86 5.08 5.25 5.39 5.52 *70 years and over . . . . . . . . 199 4.75 0.52 0.058 * * 4.16 4.26 4.38 4.73 5.04 5.30 5.53 * *
* Does not meet standards for reliability or precision.1Includes all other race/ethnic groups not listed separately.
Page 26 [ Series 11, No. 247

Table 9. Red blood cell count as 1012 cells per liter for females 1 year and over, number of examined persons, mean, standard deviation,standard error of the mean, and selected percentiles, by race/ethnicity and age: United States, 1988–94
Race/ethnicity and age
Number ofexaminedpersons Mean
Standarddeviation
Standarderror ofmean
Percentile
2.5th 5th 10th 15th 25th 50th 75th 85th 90th 95th 97.5th
All race/ethnic groups1
1 year and over . . . . . . . . . . . 13,747 4.44 0.36 0.012 3.75 3.87 4.00 4.09 4.20 4.43 4.67 4.80 4.88 5.02 5.151–2 years . . . . . . . . . . . . . 858 4.50 0.34 0.021 3.92 4.00 4.09 4.15 4.26 4.48 4.70 4.83 4.94 5.12 5.323–5 years . . . . . . . . . . . . . 1,337 4.49 0.32 0.016 3.94 4.02 4.10 4.15 4.26 4.48 4.68 4.80 4.88 5.00 5.166–8 years . . . . . . . . . . . . . 675 4.56 0.31 0.022 3.94 4.08 4.16 4.24 4.34 4.57 4.76 4.86 4.92 5.05 5.199–11 years . . . . . . . . . . . . . 734 4.62 0.30 0.020 4.06 4.13 4.26 4.33 4.43 4.61 4.81 4.91 4.97 5.12 5.2512–14 years . . . . . . . . . . . . 621 4.59 0.32 0.023 3.97 4.05 4.16 4.28 4.37 4.57 4.83 4.94 5.02 5.13 5.1515–19 years . . . . . . . . . . . . 950 4.47 0.35 0.021 3.74 3.92 4.08 4.13 4.25 4.46 4.70 4.83 4.94 5.06 5.1520–29 years . . . . . . . . . . . . 1,769 4.38 0.35 0.015 3.68 3.83 3.96 4.03 4.13 4.38 4.62 4.74 4.84 4.94 5.0730–39 years . . . . . . . . . . . . 1,757 4.40 0.35 0.015 3.72 3.84 3.97 4.07 4.19 4.38 4.61 4.74 4.83 4.98 5.1340–49 years . . . . . . . . . . . . 1,303 4.39 0.34 0.017 3.79 3.86 3.96 4.05 4.16 4.38 4.62 4.75 4.84 4.95 5.1050–59 years . . . . . . . . . . . . 969 4.46 0.37 0.022 3.81 3.88 4.01 4.08 4.23 4.45 4.71 4.82 4.91 5.10 5.2060–69 years . . . . . . . . . . . . 1,111 4.45 0.41 0.022 3.61 3.85 4.03 4.09 4.19 4.42 4.70 4.83 4.89 5.06 5.2670 years and over . . . . . . . . 1,663 4.40 0.40 0.018 3.56 3.77 3.91 4.01 4.14 4.40 4.65 4.81 4.89 5.06 5.17
Non-Hispanic white1 year and over . . . . . . . . . . . 5,029 4.43 0.35 0.013 3.78 3.88 4.01 4.09 4.20 4.42 4.67 4.80 4.88 5.00 5.13
1–2 years . . . . . . . . . . . . . 270 4.43 0.30 0.024 * 3.99 4.07 4.13 4.24 4.41 4.63 4.75 4.80 4.94 *3–5 years . . . . . . . . . . . . . 332 4.45 0.30 0.022 * 4.02 4.09 4.13 4.23 4.44 4.66 4.75 4.84 4.94 *6–8 years . . . . . . . . . . . . . 175 4.54 0.30 0.030 * * 4.13 4.23 4.31 4.57 4.75 4.84 4.91 * *9–11 years . . . . . . . . . . . . . 186 4.63 0.29 0.028 * * 4.28 4.34 4.44 4.62 4.84 4.93 4.98 * *12–14 years . . . . . . . . . . . . 154 4.60 0.31 0.033 * * 4.21 4.31 4.37 4.59 4.84 4.91 5.02 * *15–19 years . . . . . . . . . . . . 270 4.47 0.33 0.027 * 3.95 4.10 4.13 4.26 4.46 4.68 4.82 4.94 5.05 *20–29 years . . . . . . . . . . . . 477 4.38 0.35 0.021 * 3.85 3.97 4.05 4.13 4.38 4.62 4.75 4.84 4.93 *30–39 years . . . . . . . . . . . . 572 4.40 0.33 0.018 * 3.86 3.97 4.09 4.19 4.38 4.61 4.73 4.82 4.96 *40–49 years . . . . . . . . . . . . 457 4.40 0.33 0.020 * 3.87 3.98 4.06 4.16 4.38 4.62 4.75 4.84 4.95 *50–59 years . . . . . . . . . . . . 473 4.46 0.36 0.022 * 3.88 4.02 4.08 4.23 4.44 4.71 4.81 4.91 5.10 *60–69 years . . . . . . . . . . . . 473 4.44 0.40 0.024 * 3.89 4.03 4.09 4.19 4.41 4.69 4.83 4.88 5.01 *70 years and over . . . . . . . . 1,190 4.40 0.39 0.015 * 3.79 3.93 4.02 4.15 4.40 4.65 4.80 4.89 5.05 *
Non-Hispanic black
1 year and over . . . . . . . . . . . 4,116 4.41 0.41 0.013 3.59 3.76 3.92 4.01 4.16 4.41 4.66 4.82 4.93 5.09 5.231–2 years . . . . . . . . . . . . . 265 4.60 0.39 0.028 * 4.01 4.10 4.20 4.36 4.56 4.84 5.04 5.14 5.23 *3–5 years . . . . . . . . . . . . . 433 4.51 0.37 0.021 * 3.99 4.07 4.13 4.29 4.48 4.73 4.88 5.02 5.18 *6–8 years . . . . . . . . . . . . . 220 4.58 0.33 0.026 * * 4.19 4.24 4.37 4.58 4.80 4.89 4.99 * *9–11 years . . . . . . . . . . . . . 252 4.59 0.32 0.024 * 4.15 4.22 4.30 4.39 4.57 4.80 4.92 4.97 5.12 *12–14 years . . . . . . . . . . . . 220 4.50 0.34 0.027 * * 4.06 4.10 4.28 4.47 4.69 4.81 4.95 * *15–19 years . . . . . . . . . . . . 326 4.40 0.39 0.025 * 3.78 3.96 4.04 4.16 4.38 4.65 4.79 4.88 5.06 *20–29 years . . . . . . . . . . . . 589 4.37 0.42 0.020 * 3.75 3.85 3.94 4.09 4.36 4.62 4.79 4.91 5.09 *30–39 years . . . . . . . . . . . . 602 4.33 0.40 0.020 * 3.71 3.83 3.97 4.09 4.32 4.56 4.70 4.81 4.96 *40–49 years . . . . . . . . . . . . 425 4.35 0.41 0.024 * 3.70 3.83 3.94 4.06 4.35 4.62 4.79 4.87 5.05 *50–59 years . . . . . . . . . . . . 256 4.45 0.40 0.030 * 3.89 3.99 4.07 4.19 4.44 4.69 4.83 4.94 5.13 *60–69 years . . . . . . . . . . . . 276 4.43 0.44 0.031 * 3.69 3.88 4.02 4.14 4.44 4.69 4.87 4.95 5.13 *70 years and over . . . . . . . . 252 4.31 0.50 0.038 * 3.36 3.57 3.80 4.04 4.37 4.63 4.81 4.93 5.05 *
Mexican American
1 year and over . . . . . . . . . . . 3,994 4.47 0.35 0.019 3.76 3.89 4.01 4.11 4.24 4.48 4.69 4.81 4.90 5.04 5.161–2 years . . . . . . . . . . . . . 285 4.57 0.34 0.030 * * 4.12 4.18 4.36 4.56 4.78 4.89 4.97 * *3–5 years . . . . . . . . . . . . . 506 4.47 0.33 0.022 * 3.99 4.09 4.16 4.26 4.48 4.68 4.80 4.87 4.97 *6–8 years . . . . . . . . . . . . . 257 4.54 0.32 0.030 * * 4.17 4.22 4.32 4.53 4.72 4.89 4.95 * *9–11 years . . . . . . . . . . . . . 265 4.59 0.30 0.028 * * 4.23 4.29 4.35 4.56 4.76 4.91 5.00 * *12–14 years . . . . . . . . . . . . 218 4.54 0.31 0.032 * * 4.13 4.19 4.30 4.53 4.77 4.87 4.93 * *15–19 years . . . . . . . . . . . . 297 4.47 0.36 0.032 * 3.85 4.01 4.08 4.22 4.48 4.69 4.80 4.90 5.12 *20–29 years . . . . . . . . . . . . 632 4.39 0.35 0.021 * 3.79 3.95 4.02 4.17 4.41 4.63 4.77 4.84 4.92 *30–39 years . . . . . . . . . . . . 504 4.40 0.36 0.024 * 3.82 3.94 4.01 4.13 4.41 4.63 4.75 4.81 4.94 *40–49 years . . . . . . . . . . . . 356 4.47 0.35 0.028 * 3.85 4.01 4.12 4.24 4.47 4.70 4.79 4.89 5.05 *50–59 years . . . . . . . . . . . . 185 4.53 0.36 0.040 * * 4.05 4.14 4.27 4.57 4.77 4.90 4.96 * *60–69 years . . . . . . . . . . . . 317 4.45 0.38 0.032 * 3.77 3.94 4.05 4.23 4.46 4.68 4.81 4.87 5.10 *70 years and over . . . . . . . . 172 4.47 0.40 0.046 * * 3.96 4.12 4.21 4.48 4.67 4.87 4.97 * *
* Does not meet standards for reliability or precision.1Includes all other race/ethnic groups not listed separately.
Series 11, No. 247 [ Page 27
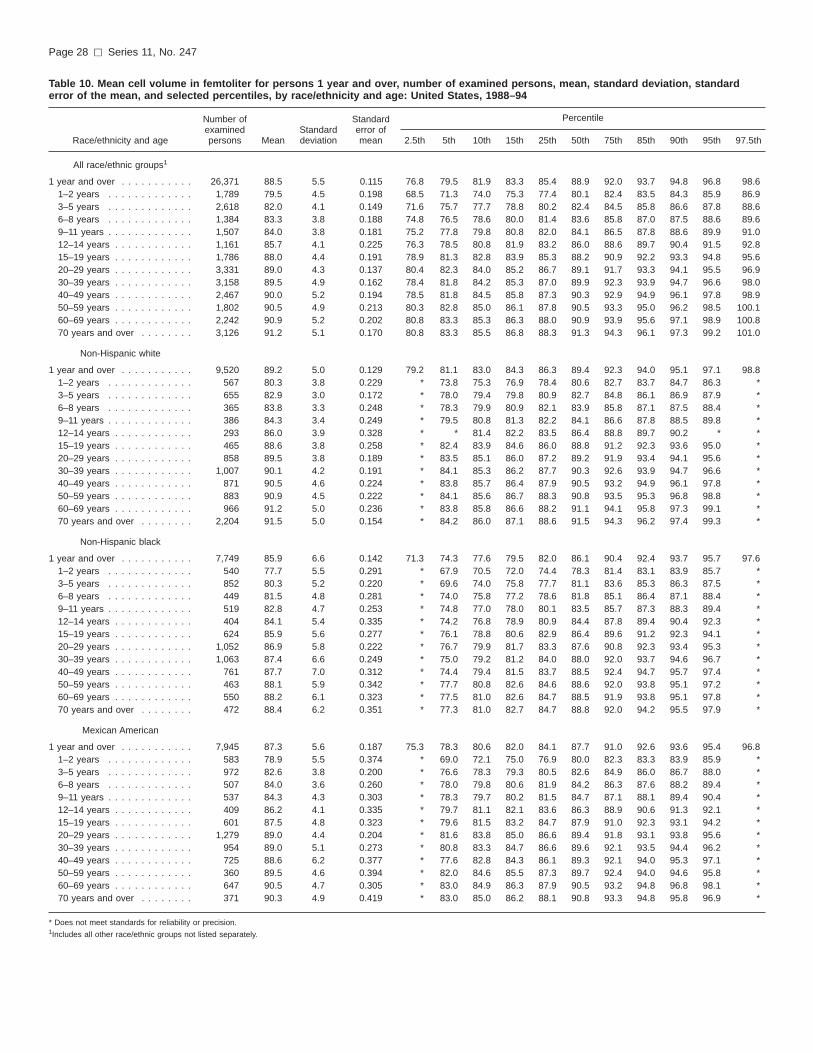
Table 10. Mean cell volume in femtoliter for persons 1 year and over, number of examined persons, mean, standard deviation, standarderror of the mean, and selected percentiles, by race/ethnicity and age: United States, 1988–94
Race/ethnicity and age
Number ofexaminedpersons Mean
Standarddeviation
Standarderror ofmean
Percentile
2.5th 5th 10th 15th 25th 50th 75th 85th 90th 95th 97.5th
All race/ethnic groups1
1 year and over . . . . . . . . . . . 26,371 88.5 5.5 0.115 76.8 79.5 81.9 83.3 85.4 88.9 92.0 93.7 94.8 96.8 98.61–2 years . . . . . . . . . . . . . 1,789 79.5 4.5 0.198 68.5 71.3 74.0 75.3 77.4 80.1 82.4 83.5 84.3 85.9 86.93–5 years . . . . . . . . . . . . . 2,618 82.0 4.1 0.149 71.6 75.7 77.7 78.8 80.2 82.4 84.5 85.8 86.6 87.8 88.66–8 years . . . . . . . . . . . . . 1,384 83.3 3.8 0.188 74.8 76.5 78.6 80.0 81.4 83.6 85.8 87.0 87.5 88.6 89.69–11 years . . . . . . . . . . . . . 1,507 84.0 3.8 0.181 75.2 77.8 79.8 80.8 82.0 84.1 86.5 87.8 88.6 89.9 91.012–14 years . . . . . . . . . . . . 1,161 85.7 4.1 0.225 76.3 78.5 80.8 81.9 83.2 86.0 88.6 89.7 90.4 91.5 92.815–19 years . . . . . . . . . . . . 1,786 88.0 4.4 0.191 78.9 81.3 82.8 83.9 85.3 88.2 90.9 92.2 93.3 94.8 95.620–29 years . . . . . . . . . . . . 3,331 89.0 4.3 0.137 80.4 82.3 84.0 85.2 86.7 89.1 91.7 93.3 94.1 95.5 96.930–39 years . . . . . . . . . . . . 3,158 89.5 4.9 0.162 78.4 81.8 84.2 85.3 87.0 89.9 92.3 93.9 94.7 96.6 98.040–49 years . . . . . . . . . . . . 2,467 90.0 5.2 0.194 78.5 81.8 84.5 85.8 87.3 90.3 92.9 94.9 96.1 97.8 98.950–59 years . . . . . . . . . . . . 1,802 90.5 4.9 0.213 80.3 82.8 85.0 86.1 87.8 90.5 93.3 95.0 96.2 98.5 100.160–69 years . . . . . . . . . . . . 2,242 90.9 5.2 0.202 80.8 83.3 85.3 86.3 88.0 90.9 93.9 95.6 97.1 98.9 100.870 years and over . . . . . . . . 3,126 91.2 5.1 0.170 80.8 83.3 85.5 86.8 88.3 91.3 94.3 96.1 97.3 99.2 101.0
Non-Hispanic white
1 year and over . . . . . . . . . . . 9,520 89.2 5.0 0.129 79.2 81.1 83.0 84.3 86.3 89.4 92.3 94.0 95.1 97.1 98.81–2 years . . . . . . . . . . . . . 567 80.3 3.8 0.229 * 73.8 75.3 76.9 78.4 80.6 82.7 83.7 84.7 86.3 *3–5 years . . . . . . . . . . . . . 655 82.9 3.0 0.172 * 78.0 79.4 79.8 80.9 82.7 84.8 86.1 86.9 87.9 *6–8 years . . . . . . . . . . . . . 365 83.8 3.3 0.248 * 78.3 79.9 80.9 82.1 83.9 85.8 87.1 87.5 88.4 *9–11 years . . . . . . . . . . . . . 386 84.3 3.4 0.249 * 79.5 80.8 81.3 82.2 84.1 86.6 87.8 88.5 89.8 *12–14 years . . . . . . . . . . . . 293 86.0 3.9 0.328 * * 81.4 82.2 83.5 86.4 88.8 89.7 90.2 * *15–19 years . . . . . . . . . . . . 465 88.6 3.8 0.258 * 82.4 83.9 84.6 86.0 88.8 91.2 92.3 93.6 95.0 *20–29 years . . . . . . . . . . . . 858 89.5 3.8 0.189 * 83.5 85.1 86.0 87.2 89.2 91.9 93.4 94.1 95.6 *30–39 years . . . . . . . . . . . . 1,007 90.1 4.2 0.191 * 84.1 85.3 86.2 87.7 90.3 92.6 93.9 94.7 96.6 *40–49 years . . . . . . . . . . . . 871 90.5 4.6 0.224 * 83.8 85.7 86.4 87.9 90.5 93.2 94.9 96.1 97.8 *50–59 years . . . . . . . . . . . . 883 90.9 4.5 0.222 * 84.1 85.6 86.7 88.3 90.8 93.5 95.3 96.8 98.8 *60–69 years . . . . . . . . . . . . 966 91.2 5.0 0.236 * 83.8 85.8 86.6 88.2 91.1 94.1 95.8 97.3 99.1 *70 years and over . . . . . . . . 2,204 91.5 5.0 0.154 * 84.2 86.0 87.1 88.6 91.5 94.3 96.2 97.4 99.3 *
Non-Hispanic black
1 year and over . . . . . . . . . . . 7,749 85.9 6.6 0.142 71.3 74.3 77.6 79.5 82.0 86.1 90.4 92.4 93.7 95.7 97.61–2 years . . . . . . . . . . . . . 540 77.7 5.5 0.291 * 67.9 70.5 72.0 74.4 78.3 81.4 83.1 83.9 85.7 *3–5 years . . . . . . . . . . . . . 852 80.3 5.2 0.220 * 69.6 74.0 75.8 77.7 81.1 83.6 85.3 86.3 87.5 *6–8 years . . . . . . . . . . . . . 449 81.5 4.8 0.281 * 74.0 75.8 77.2 78.6 81.8 85.1 86.4 87.1 88.4 *9–11 years . . . . . . . . . . . . . 519 82.8 4.7 0.253 * 74.8 77.0 78.0 80.1 83.5 85.7 87.3 88.3 89.4 *12–14 years . . . . . . . . . . . . 404 84.1 5.4 0.335 * 74.2 76.8 78.9 80.9 84.4 87.8 89.4 90.4 92.3 *15–19 years . . . . . . . . . . . . 624 85.9 5.6 0.277 * 76.1 78.8 80.6 82.9 86.4 89.6 91.2 92.3 94.1 *20–29 years . . . . . . . . . . . . 1,052 86.9 5.8 0.222 * 76.7 79.9 81.7 83.3 87.6 90.8 92.3 93.4 95.3 *30–39 years . . . . . . . . . . . . 1,063 87.4 6.6 0.249 * 75.0 79.2 81.2 84.0 88.0 92.0 93.7 94.6 96.7 *40–49 years . . . . . . . . . . . . 761 87.7 7.0 0.312 * 74.4 79.4 81.5 83.7 88.5 92.4 94.7 95.7 97.4 *50–59 years . . . . . . . . . . . . 463 88.1 5.9 0.342 * 77.7 80.8 82.6 84.6 88.6 92.0 93.8 95.1 97.2 *60–69 years . . . . . . . . . . . . 550 88.2 6.1 0.323 * 77.5 81.0 82.6 84.7 88.5 91.9 93.8 95.1 97.8 *70 years and over . . . . . . . . 472 88.4 6.2 0.351 * 77.3 81.0 82.7 84.7 88.8 92.0 94.2 95.5 97.9 *
Mexican American
1 year and over . . . . . . . . . . . 7,945 87.3 5.6 0.187 75.3 78.3 80.6 82.0 84.1 87.7 91.0 92.6 93.6 95.4 96.81–2 years . . . . . . . . . . . . . 583 78.9 5.5 0.374 * 69.0 72.1 75.0 76.9 80.0 82.3 83.3 83.9 85.9 *3–5 years . . . . . . . . . . . . . 972 82.6 3.8 0.200 * 76.6 78.3 79.3 80.5 82.6 84.9 86.0 86.7 88.0 *6–8 years . . . . . . . . . . . . . 507 84.0 3.6 0.260 * 78.0 79.8 80.6 81.9 84.2 86.3 87.6 88.2 89.4 *9–11 years . . . . . . . . . . . . . 537 84.3 4.3 0.303 * 78.3 79.7 80.2 81.5 84.7 87.1 88.1 89.4 90.4 *12–14 years . . . . . . . . . . . . 409 86.2 4.1 0.335 * 79.7 81.1 82.1 83.6 86.3 88.9 90.6 91.3 92.1 *15–19 years . . . . . . . . . . . . 601 87.5 4.8 0.323 * 79.6 81.5 83.2 84.7 87.9 91.0 92.3 93.1 94.2 *20–29 years . . . . . . . . . . . . 1,279 89.0 4.4 0.204 * 81.6 83.8 85.0 86.6 89.4 91.8 93.1 93.8 95.6 *30–39 years . . . . . . . . . . . . 954 89.0 5.1 0.273 * 80.8 83.3 84.7 86.6 89.6 92.1 93.5 94.4 96.2 *40–49 years . . . . . . . . . . . . 725 88.6 6.2 0.377 * 77.6 82.8 84.3 86.1 89.3 92.1 94.0 95.3 97.1 *50–59 years . . . . . . . . . . . . 360 89.5 4.6 0.394 * 82.0 84.6 85.5 87.3 89.7 92.4 94.0 94.6 95.8 *60–69 years . . . . . . . . . . . . 647 90.5 4.7 0.305 * 83.0 84.9 86.3 87.9 90.5 93.2 94.8 96.8 98.1 *70 years and over . . . . . . . . 371 90.3 4.9 0.419 * 83.0 85.0 86.2 88.1 90.8 93.3 94.8 95.8 96.9 *
* Does not meet standards for reliability or precision.1Includes all other race/ethnic groups not listed separately.
Page 28 [ Series 11, No. 247

Table 11. Mean cell volume in femtoliter for males 1 year and over, number of examined persons, mean, standard deviation, standard errorof the mean, and selected percentiles, by race/ethnicity and age: United States, 1988–94
Race/ethnicity and age
Number ofexaminedpersons Mean
Standarddeviation
Standarderror ofmean
Percentile
2.5th 5th 10th 15th 25th 50th 75th 85th 90th 95th 97.5th
All race/ethnic groups1
1 year and over . . . . . . . . . . . 12,623 88.5 5.4 0.16 77.5 79.7 82.0 83.4 85.5 88.8 91.9 93.6 94.9 96.7 98.61–2 years . . . . . . . . . . . . . 931 79.2 4.5 0.25 67.9 70.5 73.2 74.7 77.3 79.9 82.1 83.3 84.0 85.2 86.13–5 years . . . . . . . . . . . . . 1,281 81.8 4.3 0.20 71.5 75.1 77.5 78.8 80.1 82.1 84.2 85.5 86.5 87.8 88.66–8 years . . . . . . . . . . . . . 709 83.2 4.0 0.25 73.6 76.3 78.4 79.9 81.3 83.5 85.8 87.1 87.5 88.6 89.19–11 years . . . . . . . . . . . . . 773 83.9 3.7 0.22 74.7 77.7 79.8 80.7 82.0 83.9 86.0 87.5 88.0 89.7 90.912–14 years . . . . . . . . . . . . 540 85.3 4.0 0.29 77.2 78.6 80.7 81.5 82.9 85.5 88.3 89.3 89.8 90.9 92.015–19 years . . . . . . . . . . . . 836 88.3 3.9 0.22 81.2 82.0 83.8 84.4 85.6 88.2 90.8 92.0 92.8 94.4 95.520–29 years . . . . . . . . . . . . 1,562 88.9 3.9 0.16 81.1 82.8 84.3 85.3 86.6 88.9 91.4 92.9 93.6 95.4 96.630–39 years . . . . . . . . . . . . 1,401 89.5 4.3 0.19 81.4 82.9 84.6 85.6 87.0 89.6 91.9 93.4 94.4 96.5 97.940–49 years . . . . . . . . . . . . 1,164 90.4 4.7 0.23 81.3 83.7 85.6 86.1 87.6 90.5 92.9 94.7 95.9 97.6 99.150–59 years . . . . . . . . . . . . 833 90.8 4.8 0.27 81.4 84.1 85.6 86.3 88.1 90.9 93.6 95.2 96.5 98.6 100.360–69 years . . . . . . . . . . . . 1,130 91.5 5.1 0.25 82.3 83.6 85.5 86.8 88.3 91.5 94.6 96.3 97.4 99.1 100.970 years and over . . . . . . . . 1,463 91.8 5.6 0.24 79.6 83.1 85.8 87.2 89.0 91.9 95.1 96.7 97.7 99.7 102.0
Non-Hispanic white
1 year and over . . . . . . . . . . . 4,491 89.1 5.0 0.19 79.3 81.2 82.9 84.1 86.0 89.2 92.2 93.9 95.1 97.0 98.71–2 years . . . . . . . . . . . . . 297 79.9 4.0 0.29 * 73.0 74.4 75.8 78.2 80.2 82.3 83.5 84.3 85.3 *3–5 years . . . . . . . . . . . . . 323 82.7 3.1 0.21 * 77.9 79.3 79.6 80.8 82.5 84.6 85.7 86.9 88.1 *6–8 years . . . . . . . . . . . . . 190 83.5 3.5 0.32 * * 79.6 80.5 81.8 83.6 85.8 87.1 87.4 * *9–11 years . . . . . . . . . . . . . 200 84.1 3.1 0.28 * * 80.6 81.6 82.3 83.9 85.8 87.5 87.9 * *12–14 years . . . . . . . . . . . . 139 85.5 3.8 0.40 * * 81.0 81.7 83.0 85.6 88.4 89.3 89.7 * *15–19 years . . . . . . . . . . . . 195 88.6 3.5 0.32 * * 84.3 84.9 85.9 88.5 91.3 92.0 92.8 * *20–29 years . . . . . . . . . . . . 381 89.1 3.6 0.23 * 83.5 84.8 85.8 86.7 88.8 91.5 93.1 93.6 95.5 *30–39 years . . . . . . . . . . . . 435 89.8 3.8 0.23 * 84.1 85.2 85.8 87.3 89.7 91.9 93.3 94.3 96.3 *40–49 years . . . . . . . . . . . . 414 90.7 4.3 0.27 * 85.1 86.0 86.8 87.9 90.6 93.0 94.6 95.6 97.4 *50–59 years . . . . . . . . . . . . 410 91.3 4.4 0.27 * 84.8 85.9 86.8 88.5 91.2 93.8 95.3 96.9 98.8 *60–69 years . . . . . . . . . . . . 493 91.7 5.0 0.28 * 83.8 86.0 87.2 88.6 91.7 94.9 96.3 97.5 99.1 *70 years and over . . . . . . . . 1,014 92.0 5.5 0.22 * 84.2 86.2 87.3 89.2 92.1 95.2 96.7 97.8 99.7 *
Non-Hispanic black
1 year and over . . . . . . . . . . . 3,633 86.2 6.6 0.21 71.9 74.5 77.7 79.8 82.3 86.4 90.6 92.6 94.0 96.2 98.11–2 years . . . . . . . . . . . . . 275 77.4 5.5 0.38 * 67.9 70.1 71.5 74.0 78.2 81.3 83.1 84.3 85.8 *3–5 years . . . . . . . . . . . . . 419 80.0 5.3 0.30 * 69.2 73.6 75.5 77.5 80.8 83.3 85.0 86.0 87.5 *6–8 years . . . . . . . . . . . . . 229 81.7 5.0 0.37 * 73.5 76.3 77.6 78.8 81.8 85.4 86.5 87.5 88.8 *9–11 years . . . . . . . . . . . . . 267 82.9 4.8 0.33 * 74.7 76.9 78.1 80.2 83.3 85.9 87.5 88.6 89.3 *12–14 years . . . . . . . . . . . . 184 83.6 5.4 0.45 * * 76.3 78.1 80.7 83.9 87.1 89.4 90.6 * *15–19 years . . . . . . . . . . . . 298 86.7 5.1 0.33 * 77.3 80.6 81.8 83.7 87.2 90.0 91.2 92.1 94.5 *20–29 years . . . . . . . . . . . . 463 87.6 5.3 0.28 * 78.8 81.0 82.6 84.6 88.5 91.0 92.3 93.5 95.4 *30–39 years . . . . . . . . . . . . 461 87.8 6.3 0.33 * 75.8 80.4 81.8 84.3 88.8 92.1 93.7 94.7 97.1 *40–49 years . . . . . . . . . . . . 336 88.8 6.6 0.41 * 76.8 81.5 82.9 85.0 88.9 93.2 95.7 96.9 99.0 *50–59 years . . . . . . . . . . . . 207 88.8 5.8 0.46 * * 81.3 83.6 85.6 88.7 92.7 94.6 95.9 * *60–69 years . . . . . . . . . . . . 274 88.8 6.7 0.46 * 77.0 80.9 82.9 85.3 89.1 93.3 95.2 96.6 99.7 *70 years and over . . . . . . . . 220 88.7 6.0 0.46 * * 80.6 83.1 85.7 89.5 92.1 94.5 95.9 * *
Mexican American
1 year and over . . . . . . . . . . . 3,951 87.6 5.4 0.26 76.6 78.8 81.0 82.3 84.5 88.0 91.3 92.9 93.9 95.8 96.91–2 years . . . . . . . . . . . . . 298 78.5 5.6 0.46 * * 71.7 74.3 76.9 79.6 82.0 82.9 83.8 * *3–5 years . . . . . . . . . . . . . 466 82.2 3.7 0.25 * 76.5 77.9 78.7 80.1 82.2 84.6 85.9 86.7 87.9 *6–8 years . . . . . . . . . . . . . 250 83.8 3.5 0.32 * * 79.4 80.5 81.8 84.0 86.3 87.3 88.3 * *9–11 years . . . . . . . . . . . . . 272 83.8 4.7 0.41 * * 79.5 79.8 81.0 84.0 86.8 88.1 88.9 * *12–14 years . . . . . . . . . . . . 191 85.2 4.2 0.43 * * 80.6 81.1 82.3 85.0 87.7 89.6 90.6 * *15–19 years . . . . . . . . . . . . 304 88.0 4.2 0.35 * 80.6 82.4 83.7 85.1 88.2 91.1 92.6 93.3 94.6 *20–29 years . . . . . . . . . . . . 647 89.4 3.8 0.21 * 83.4 84.6 85.5 87.1 89.5 91.8 93.1 93.8 95.5 *30–39 years . . . . . . . . . . . . 450 89.8 4.4 0.30 * 83.0 84.8 85.6 87.1 89.9 92.6 94.0 95.1 96.5 *40–49 years . . . . . . . . . . . . 369 90.0 4.6 0.34 * 83.6 84.8 85.6 87.3 90.1 93.0 94.9 95.8 97.6 *50–59 years . . . . . . . . . . . . 175 89.9 4.4 0.47 * * 84.6 85.5 87.6 90.0 92.9 94.5 95.0 * *60–69 years . . . . . . . . . . . . 330 91.1 5.0 0.39 * 83.5 84.9 86.3 88.3 90.9 94.1 96.6 97.4 98.8 *70 years and over . . . . . . . . 199 90.7 4.7 0.47 * * 85.0 85.9 88.3 91.4 93.8 95.0 95.8 * *
* Does not meet standards for reliability or precision.1Includes all other race/ethnic groups not listed separately.
Series 11, No. 247 [ Page 29
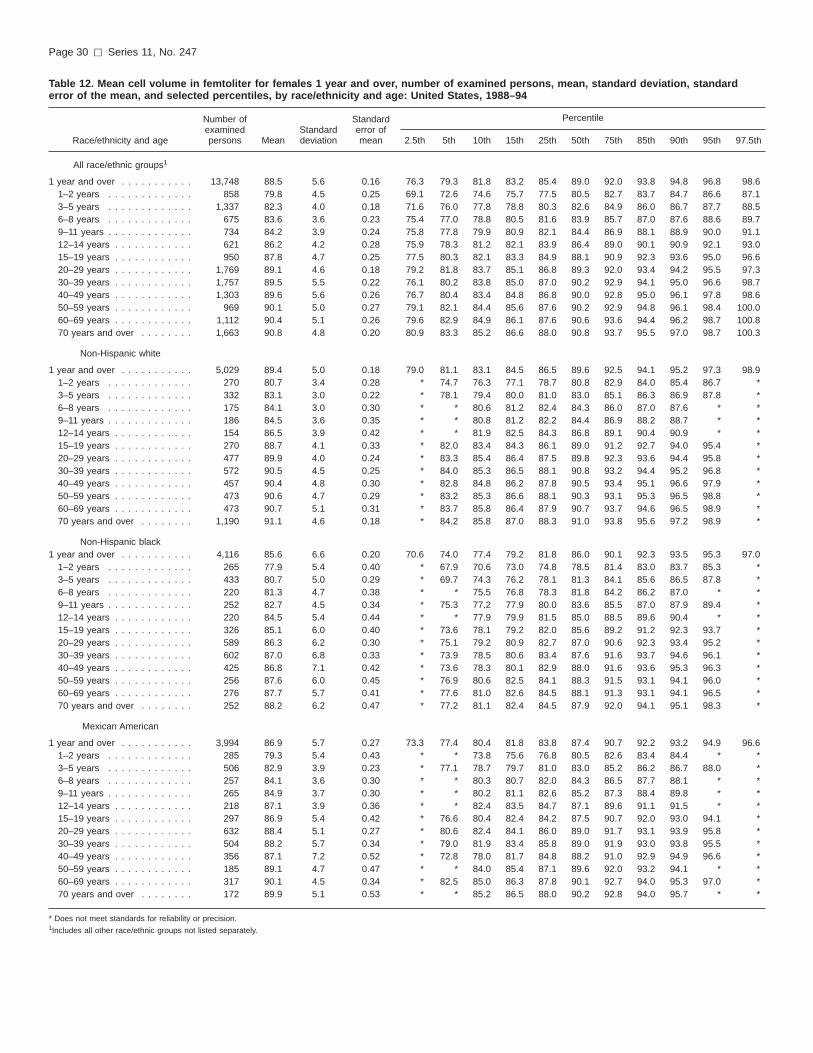
Table 12. Mean cell volume in femtoliter for females 1 year and over, number of examined persons, mean, standard deviation, standarderror of the mean, and selected percentiles, by race/ethnicity and age: United States, 1988–94
Race/ethnicity and age
Number ofexaminedpersons Mean
Standarddeviation
Standarderror ofmean
Percentile
2.5th 5th 10th 15th 25th 50th 75th 85th 90th 95th 97.5th
All race/ethnic groups1
1 year and over . . . . . . . . . . . 13,748 88.5 5.6 0.16 76.3 79.3 81.8 83.2 85.4 89.0 92.0 93.8 94.8 96.8 98.61–2 years . . . . . . . . . . . . . 858 79.8 4.5 0.25 69.1 72.6 74.6 75.7 77.5 80.5 82.7 83.7 84.7 86.6 87.13–5 years . . . . . . . . . . . . . 1,337 82.3 4.0 0.18 71.6 76.0 77.8 78.8 80.3 82.6 84.9 86.0 86.7 87.7 88.56–8 years . . . . . . . . . . . . . 675 83.6 3.6 0.23 75.4 77.0 78.8 80.5 81.6 83.9 85.7 87.0 87.6 88.6 89.79–11 years . . . . . . . . . . . . . 734 84.2 3.9 0.24 75.8 77.8 79.9 80.9 82.1 84.4 86.9 88.1 88.9 90.0 91.112–14 years . . . . . . . . . . . . 621 86.2 4.2 0.28 75.9 78.3 81.2 82.1 83.9 86.4 89.0 90.1 90.9 92.1 93.015–19 years . . . . . . . . . . . . 950 87.8 4.7 0.25 77.5 80.3 82.1 83.3 84.9 88.1 90.9 92.3 93.6 95.0 96.620–29 years . . . . . . . . . . . . 1,769 89.1 4.6 0.18 79.2 81.8 83.7 85.1 86.8 89.3 92.0 93.4 94.2 95.5 97.330–39 years . . . . . . . . . . . . 1,757 89.5 5.5 0.22 76.1 80.2 83.8 85.0 87.0 90.2 92.9 94.1 95.0 96.6 98.740–49 years . . . . . . . . . . . . 1,303 89.6 5.6 0.26 76.7 80.4 83.4 84.8 86.8 90.0 92.8 95.0 96.1 97.8 98.650–59 years . . . . . . . . . . . . 969 90.1 5.0 0.27 79.1 82.1 84.4 85.6 87.6 90.2 92.9 94.8 96.1 98.4 100.060–69 years . . . . . . . . . . . . 1,112 90.4 5.1 0.26 79.6 82.9 84.9 86.1 87.6 90.6 93.6 94.4 96.2 98.7 100.870 years and over . . . . . . . . 1,663 90.8 4.8 0.20 80.9 83.3 85.2 86.6 88.0 90.8 93.7 95.5 97.0 98.7 100.3
Non-Hispanic white
1 year and over . . . . . . . . . . . 5,029 89.4 5.0 0.18 79.0 81.1 83.1 84.5 86.5 89.6 92.5 94.1 95.2 97.3 98.91–2 years . . . . . . . . . . . . . 270 80.7 3.4 0.28 * 74.7 76.3 77.1 78.7 80.8 82.9 84.0 85.4 86.7 *3–5 years . . . . . . . . . . . . . 332 83.1 3.0 0.22 * 78.1 79.4 80.0 81.0 83.0 85.1 86.3 86.9 87.8 *6–8 years . . . . . . . . . . . . . 175 84.1 3.0 0.30 * * 80.6 81.2 82.4 84.3 86.0 87.0 87.6 * *9–11 years . . . . . . . . . . . . . 186 84.5 3.6 0.35 * * 80.8 81.2 82.2 84.4 86.9 88.2 88.7 * *12–14 years . . . . . . . . . . . . 154 86.5 3.9 0.42 * * 81.9 82.5 84.3 86.8 89.1 90.4 90.9 * *15–19 years . . . . . . . . . . . . 270 88.7 4.1 0.33 * 82.0 83.4 84.3 86.1 89.0 91.2 92.7 94.0 95.4 *20–29 years . . . . . . . . . . . . 477 89.9 4.0 0.24 * 83.3 85.4 86.4 87.5 89.8 92.3 93.6 94.4 95.8 *30–39 years . . . . . . . . . . . . 572 90.5 4.5 0.25 * 84.0 85.3 86.5 88.1 90.8 93.2 94.4 95.2 96.8 *40–49 years . . . . . . . . . . . . 457 90.4 4.8 0.30 * 82.8 84.8 86.2 87.8 90.5 93.4 95.1 96.6 97.9 *50–59 years . . . . . . . . . . . . 473 90.6 4.7 0.29 * 83.2 85.3 86.6 88.1 90.3 93.1 95.3 96.5 98.8 *60–69 years . . . . . . . . . . . . 473 90.7 5.1 0.31 * 83.7 85.8 86.4 87.9 90.7 93.7 94.6 96.5 98.9 *70 years and over . . . . . . . . 1,190 91.1 4.6 0.18 * 84.2 85.8 87.0 88.3 91.0 93.8 95.6 97.2 98.9 *
Non-Hispanic black1 year and over . . . . . . . . . . . 4,116 85.6 6.6 0.20 70.6 74.0 77.4 79.2 81.8 86.0 90.1 92.3 93.5 95.3 97.0
1–2 years . . . . . . . . . . . . . 265 77.9 5.4 0.40 * 67.9 70.6 73.0 74.8 78.5 81.4 83.0 83.7 85.3 *3–5 years . . . . . . . . . . . . . 433 80.7 5.0 0.29 * 69.7 74.3 76.2 78.1 81.3 84.1 85.6 86.5 87.8 *6–8 years . . . . . . . . . . . . . 220 81.3 4.7 0.38 * * 75.5 76.8 78.3 81.8 84.2 86.2 87.0 * *9–11 years . . . . . . . . . . . . . 252 82.7 4.5 0.34 * 75.3 77.2 77.9 80.0 83.6 85.5 87.0 87.9 89.4 *12–14 years . . . . . . . . . . . . 220 84.5 5.4 0.44 * * 77.9 79.9 81.5 85.0 88.5 89.6 90.4 * *15–19 years . . . . . . . . . . . . 326 85.1 6.0 0.40 * 73.6 78.1 79.2 82.0 85.6 89.2 91.2 92.3 93.7 *20–29 years . . . . . . . . . . . . 589 86.3 6.2 0.30 * 75.1 79.2 80.9 82.7 87.0 90.6 92.3 93.4 95.2 *30–39 years . . . . . . . . . . . . 602 87.0 6.8 0.33 * 73.9 78.5 80.6 83.4 87.6 91.6 93.7 94.6 96.1 *40–49 years . . . . . . . . . . . . 425 86.8 7.1 0.42 * 73.6 78.3 80.1 82.9 88.0 91.6 93.6 95.3 96.3 *50–59 years . . . . . . . . . . . . 256 87.6 6.0 0.45 * 76.9 80.6 82.5 84.1 88.3 91.5 93.1 94.1 96.0 *60–69 years . . . . . . . . . . . . 276 87.7 5.7 0.41 * 77.6 81.0 82.6 84.5 88.1 91.3 93.1 94.1 96.5 *70 years and over . . . . . . . . 252 88.2 6.2 0.47 * 77.2 81.1 82.4 84.5 87.9 92.0 94.1 95.1 98.3 *
Mexican American
1 year and over . . . . . . . . . . . 3,994 86.9 5.7 0.27 73.3 77.4 80.4 81.8 83.8 87.4 90.7 92.2 93.2 94.9 96.61–2 years . . . . . . . . . . . . . 285 79.3 5.4 0.43 * * 73.8 75.6 76.8 80.5 82.6 83.4 84.4 * *3–5 years . . . . . . . . . . . . . 506 82.9 3.9 0.23 * 77.1 78.7 79.7 81.0 83.0 85.2 86.2 86.7 88.0 *6–8 years . . . . . . . . . . . . . 257 84.1 3.6 0.30 * * 80.3 80.7 82.0 84.3 86.5 87.7 88.1 * *9–11 years . . . . . . . . . . . . . 265 84.9 3.7 0.30 * * 80.2 81.1 82.6 85.2 87.3 88.4 89.8 * *12–14 years . . . . . . . . . . . . 218 87.1 3.9 0.36 * * 82.4 83.5 84.7 87.1 89.6 91.1 91.5 * *15–19 years . . . . . . . . . . . . 297 86.9 5.4 0.42 * 76.6 80.4 82.4 84.2 87.5 90.7 92.0 93.0 94.1 *20–29 years . . . . . . . . . . . . 632 88.4 5.1 0.27 * 80.6 82.4 84.1 86.0 89.0 91.7 93.1 93.9 95.8 *30–39 years . . . . . . . . . . . . 504 88.2 5.7 0.34 * 79.0 81.9 83.4 85.8 89.0 91.9 93.0 93.8 95.5 *40–49 years . . . . . . . . . . . . 356 87.1 7.2 0.52 * 72.8 78.0 81.7 84.8 88.2 91.0 92.9 94.9 96.6 *50–59 years . . . . . . . . . . . . 185 89.1 4.7 0.47 * * 84.0 85.4 87.1 89.6 92.0 93.2 94.1 * *60–69 years . . . . . . . . . . . . 317 90.1 4.5 0.34 * 82.5 85.0 86.3 87.8 90.1 92.7 94.0 95.3 97.0 *70 years and over . . . . . . . . 172 89.9 5.1 0.53 * * 85.2 86.5 88.0 90.2 92.8 94.0 95.7 * *
* Does not meet standards for reliability or precision.1Includes all other race/ethnic groups not listed separately.
Page 30 [ Series 11, No. 247

Table 13. Mean cell hemoglobin in picogram for persons 1 year and over, number of examined persons, mean, standard deviation, standarderror of the mean, and selected percentiles, by race/ethnicity and age: United States, 1988–94
Race/ethnicity and age
Number ofexaminedpersons Mean
Standarddeviation
Standarderror ofmean
Percentile
2.5th 5th 10th 15th 25th 50th 75th 85th 90th 95th 97.5th
All race/ethnic groups1
1 year and over . . . . . . . . . . . 26,369 29.9 2.1 0.037 25.3 26.4 27.4 27.9 28.8 30.0 31.2 31.8 32.3 32.9 33.51–2 years . . . . . . . . . . . . . 1,788 26.6 1.8 0.076 22.3 23.3 24.4 25.1 25.8 26.9 27.8 28.2 28.6 29.1 29.53–5 years . . . . . . . . . . . . . 2,618 27.6 1.6 0.057 23.5 24.8 25.8 26.3 26.8 27.8 28.5 29.0 29.3 29.8 30.16–8 years . . . . . . . . . . . . . 1,384 28.2 1.7 0.082 24.6 25.3 26.3 26.8 27.3 28.3 29.1 29.6 29.8 30.2 30.89–11 years . . . . . . . . . . . . . 1,507 28.3 1.5 0.070 24.7 25.8 26.8 27.0 27.5 28.4 29.3 29.7 30.0 30.7 31.212–14 years . . . . . . . . . . . . 1,161 28.9 1.6 0.085 25.3 26.1 26.9 27.5 28.0 29.0 30.1 30.5 30.8 31.1 31.515–19 years . . . . . . . . . . . . 1,786 29.7 1.7 0.072 25.8 26.8 27.6 28.0 28.8 29.8 30.8 31.3 31.7 32.3 32.620–29 years . . . . . . . . . . . . 3,331 30.1 1.7 0.052 26.6 27.4 28.1 28.7 29.3 30.2 31.1 31.7 32.1 32.6 33.130–39 years . . . . . . . . . . . . 3,158 30.3 1.9 0.062 25.9 27.2 28.1 28.7 29.3 30.5 31.4 31.9 32.3 32.9 33.540–49 years . . . . . . . . . . . . 2,467 30.4 2.1 0.075 25.8 26.9 28.2 28.8 29.5 30.6 31.7 32.3 32.7 33.3 33.850–59 years . . . . . . . . . . . . 1,802 30.6 1.9 0.080 26.3 27.5 28.5 29.0 29.6 30.6 31.8 32.3 32.7 33.5 34.160–69 years . . . . . . . . . . . . 2,241 30.6 2.1 0.077 26.6 27.5 28.4 28.9 29.6 30.7 31.7 32.3 32.9 33.6 34.270 years and over . . . . . . . . 3,126 30.6 2.0 0.063 26.5 27.5 28.4 28.9 29.5 30.6 31.8 32.4 32.9 33.6 34.2
Non-Hispanic white
1 year and over . . . . . . . . . . . 9,520 30.2 1.9 0.036 26.5 27.1 27.9 28.4 29.1 30.3 31.4 32.0 32.4 33.0 33.71–2 years . . . . . . . . . . . . . 567 27.0 1.5 0.080 * 24.4 25.3 25.7 26.3 27.1 27.9 28.4 28.8 29.1 *3–5 years . . . . . . . . . . . . . 655 28.0 1.1 0.058 * 26.3 26.6 26.8 27.3 27.9 28.7 29.1 29.4 29.9 *6–8 years . . . . . . . . . . . . . 365 28.5 1.6 0.108 * 26.4 27.0 27.3 27.7 28.4 29.2 29.6 29.9 30.3 *9–11 years . . . . . . . . . . . . . 386 28.5 1.3 0.087 * 26.7 27.0 27.3 27.7 28.5 29.4 29.8 30.0 30.8 *12–14 years . . . . . . . . . . . . 293 29.0 1.5 0.113 * *26.6 27.2 27.6 28.1 29.1 30.2 30.5 30.8 *31.1 *15–19 years . . . . . . . . . . . . 465 30.0 1.5 0.088 * 27.6 28.1 28.4 29.1 30.0 30.9 31.4 31.8 32.3 *20–29 years . . . . . . . . . . . . 858 30.4 1.5 0.065 * 28.1 28.8 29.1 29.5 30.3 31.3 31.9 32.2 32.7 *30–39 years . . . . . . . . . . . . 1,007 30.6 1.6 0.066 * 28.1 28.8 29.1 29.6 30.7 31.5 32.0 32.3 32.9 *40–49 years . . . . . . . . . . . . 871 30.7 1.8 0.080 * 27.9 28.8 29.3 29.8 30.8 31.8 32.3 32.8 33.4 *50–59 years . . . . . . . . . . . . 883 30.8 1.7 0.075 * 28.2 29.0 29.3 29.8 30.8 31.9 32.5 32.8 33.6 *60–69 years . . . . . . . . . . . . 966 30.8 2.0 0.083 * 28.1 28.6 29.1 29.7 30.9 31.8 32.4 32.9 33.6 *70 years and over . . . . . . . . 2,204 30.7 1.9 0.052 * 27.9 28.6 29.1 29.6 30.8 31.9 32.5 33.0 33.7 *
Non-Hispanic black
1 year and over . . . . . . . . . . . 7,749 28.5 2.5 0.056 22.7 24.0 25.4 26.1 27.1 28.8 30.3 31.0 31.5 32.3 33.01–2 years . . . . . . . . . . . . . 540 25.7 2.2 0.116 * 21.6 22.8 23.5 24.4 26.0 27.1 27.8 28.3 29.1 *3–5 years . . . . . . . . . . . . . 852 26.7 2.1 0.088 * 22.3 24.2 24.9 25.6 27.0 28.1 28.6 29.0 29.5 *6–8 years . . . . . . . . . . . . . 449 27.2 1.9 0.114 * 24.1 24.8 25.3 25.9 27.3 28.5 29.1 29.4 30.1 *9–11 years . . . . . . . . . . . . . 519 27.6 1.9 0.102 * 24.4 25.2 25.8 26.5 27.9 28.9 29.4 29.7 30.3 *12–14 years . . . . . . . . . . . . 404 27.9 2.1 0.130 * 24.1 25.2 25.8 26.7 28.1 29.3 30.0 30.5 30.9 *15–19 years . . . . . . . . . . . . 624 28.5 2.2 0.109 * 24.9 25.7 26.5 27.2 28.8 30.0 30.5 30.9 31.6 *20–29 years . . . . . . . . . . . . 1,052 28.9 2.3 0.087 * 24.6 26.1 26.8 27.6 29.2 30.5 31.1 31.4 32.1 *30–39 years . . . . . . . . . . . . 1,063 29.1 2.6 0.098 * 23.9 25.8 26.7 27.7 29.4 30.8 31.5 32.0 32.8 *40–49 years . . . . . . . . . . . . 761 29.1 2.8 0.124 * 23.8 26.0 26.6 27.6 29.4 31.0 31.9 32.3 33.0 *50–59 years . . . . . . . . . . . . 463 29.3 2.3 0.133 * 24.9 26.6 27.0 28.0 29.6 31.0 31.4 31.9 32.5 *60–69 years . . . . . . . . . . . . 550 29.3 2.5 0.132 * 25.1 26.3 27.1 28.0 29.4 30.8 31.5 31.9 32.6 *70 years and over . . . . . . . . 472 29.2 2.4 0.136 * 24.6 26.2 26.7 27.9 29.4 30.8 31.4 31.9 32.9 *
Mexican American
1 year and over . . . . . . . . . . . 7,944 29.4 2.1 0.045 24.7 25.9 27.0 27.5 28.3 29.6 30.9 31.5 31.9 32.4 33.01–2 years . . . . . . . . . . . . . 582 26.3 2.2 0.129 * 22.2 23.6 24.7 25.6 26.8 27.6 28.0 28.3 29.2 *3–5 years . . . . . . . . . . . . . 972 27.8 1.5 0.067 * 25.3 26.1 26.5 27.0 27.9 28.7 29.1 29.4 29.8 *6–8 years . . . . . . . . . . . . . 507 28.4 1.4 0.086 * 26.3 26.7 27.1 27.6 28.4 29.3 29.6 29.9 30.3 *9–11 years . . . . . . . . . . . . . 537 28.5 1.8 0.107 * 25.6 26.7 27.0 27.5 28.6 29.5 30.1 30.4 31.0 *12–14 years . . . . . . . . . . . . 409 29.1 1.5 0.107 * 26.5 27.3 27.6 28.2 29.1 30.1 30.7 31.0 31.5 *15–19 years . . . . . . . . . . . . 601 29.5 1.9 0.110 * 26.0 27.2 27.7 28.5 29.8 30.8 31.3 31.6 32.0 *20–29 years . . . . . . . . . . . . 1,279 30.1 1.7 0.069 * 27.3 28.1 28.6 29.2 30.3 31.2 31.7 31.9 32.5 *30–39 years . . . . . . . . . . . . 954 30.0 2.0 0.092 * 26.9 28.0 28.5 29.2 30.3 31.3 31.8 32.1 32.6 *40–49 years . . . . . . . . . . . . 725 29.9 2.6 0.136 * 24.9 27.4 28.2 29.0 30.1 31.4 32.1 32.5 33.1 *50–59 years . . . . . . . . . . . . 360 30.2 1.9 0.138 * 27.3 28.1 28.6 29.3 30.3 31.3 31.9 32.3 32.7 *60–69 years . . . . . . . . . . . . 647 30.4 1.9 0.105 * 27.5 28.3 28.7 29.4 30.4 31.6 32.2 32.8 33.5 *70 years and over . . . . . . . . 371 30.2 1.9 0.142 * 27.1 28.3 28.6 29.3 30.3 31.4 31.9 32.2 32.7 *
* Does not meet standards for reliability or precision.1Includes all other race/ethnic groups not listed separately.
Series 11, No. 247 [ Page 31

Table 14. Mean cell hemoglobin in picogram for males 1 year and over, number of examined persons, mean, standard deviation, standarderror of the mean, and selected percentiles, by race/ethnicity and age: United States, 1988–94
Race/ethnicity and age
Number ofexaminedpersons Mean
Standarddeviation
Standarderror ofmean
Percentile
2.5th 5th 10th 15th 25th 50th 75th 85th 90th 95th 97.5th
All race/ethnic groups1
1 year and over . . . . . . . . . . . 12,623 30.0 2.1 0.052 25.6 26.6 27.5 28.0 28.8 30.1 31.3 31.9 32.3 33.0 33.71–2 years . . . . . . . . . . . . . 931 26.5 1.8 0.098 22.1 23.0 24.1 24.8 25.8 26.8 27.7 28.0 28.4 28.9 29.33–5 years . . . . . . . . . . . . . 1,281 27.5 1.7 0.077 23.4 24.7 25.7 26.3 26.8 27.7 28.5 28.9 29.2 29.7 30.06–8 years . . . . . . . . . . . . . 709 28.1 1.9 0.118 24.2 25.3 26.3 26.7 27.3 28.2 29.1 29.5 29.7 30.3 31.19–11 years . . . . . . . . . . . . . 773 28.3 1.5 0.088 24.5 25.9 26.8 27.1 27.5 28.4 29.1 29.6 29.9 30.3 31.012–14 years . . . . . . . . . . . . 540 28.8 1.6 0.109 25.6 26.1 27.0 27.4 27.9 28.8 30.0 30.3 30.6 31.0 31.115–19 years . . . . . . . . . . . . 836 29.8 1.5 0.085 26.7 27.4 27.9 28.3 29.0 29.9 30.8 31.2 31.6 32.2 32.720–29 years . . . . . . . . . . . . 1,562 30.2 1.5 0.063 27.2 27.8 28.4 28.9 29.4 30.2 31.1 31.7 32.1 32.6 33.030–39 years . . . . . . . . . . . . 1,401 30.4 1.6 0.072 27.2 27.9 28.4 28.9 29.5 30.5 31.4 31.8 32.3 32.9 33.640–49 years . . . . . . . . . . . . 1,164 30.7 1.8 0.087 26.9 28.0 28.8 29.3 29.8 30.8 31.7 32.3 32.8 33.3 34.150–59 years . . . . . . . . . . . . 833 30.8 1.8 0.101 27.1 28.3 29.0 29.4 29.8 30.9 31.9 32.4 32.9 33.7 34.360–69 years . . . . . . . . . . . . 1,130 30.9 2.0 0.095 27.0 28.1 28.5 29.1 29.8 31.0 32.0 32.6 33.1 33.7 34.370 years and over . . . . . . . . 1,463 30.8 2.1 0.091 25.8 27.3 28.6 29.1 29.8 31.0 32.1 32.7 33.2 33.9 34.4
Non-Hispanic white
1 year and over . . . . . . . . . . . 4,491 30.2 1.9 0.052 26.5 27.3 27.9 28.4 29.2 30.3 31.4 32.0 32.4 33.1 33.91–2 years . . . . . . . . . . . . . 297 26.8 1.6 0.109 * 24.0 24.8 25.5 26.2 27.0 27.8 28.1 28.5 28.9 *3–5 years . . . . . . . . . . . . . 323 27.9 1.1 0.074 * 26.1 26.5 26.8 27.1 27.8 28.6 29.0 29.3 29.8 *6–8 years . . . . . . . . . . . . . 190 28.4 1.9 0.163 * * 26.9 27.0 27.6 28.3 29.1 29.5 29.9 * *9–11 years . . . . . . . . . . . . . 200 28.4 1.2 0.102 * * 27.0 27.3 27.7 28.4 29.3 29.6 29.9 * *12–14 years . . . . . . . . . . . . 139 28.9 1.4 0.145 * * 27.2 27.5 28.0 28.9 30.1 30.4 30.6 * *15–19 years . . . . . . . . . . . . 195 30.1 1.3 0.107 * * 28.3 28.8 29.3 30.1 30.9 31.2 31.6 * *20–29 years . . . . . . . . . . . . 381 30.4 1.4 0.085 * 28.2 28.7 29.1 29.4 30.3 31.2 31.9 32.3 32.7 *30–39 years . . . . . . . . . . . . 435 30.6 1.4 0.082 * 28.3 28.8 29.2 29.6 30.6 31.4 31.9 32.3 32.8 *40–49 years . . . . . . . . . . . . 414 30.9 1.6 0.096 * 28.7 29.3 29.6 29.9 30.9 31.7 32.4 32.8 33.4 *50–59 years . . . . . . . . . . . . 410 31.1 1.6 0.092 * 28.8 29.3 29.6 30.0 31.0 32.1 32.5 33.1 33.8 *60–69 years . . . . . . . . . . . . 493 31.0 1.9 0.100 * 28.2 28.7 29.3 29.9 31.1 32.1 32.7 33.2 33.8 *70 years and over . . . . . . . . 1,014 30.9 2.1 0.077 * 27.9 28.8 29.3 29.9 31.1 32.1 32.7 33.2 33.9 *
Non-Hispanic black
1 year and over . . . . . . . . . . . 3,633 28.7 2.5 0.081 23.1 24.2 25.6 26.3 27.3 28.9 30.4 31.1 31.6 32.5 33.31–2 years . . . . . . . . . . . . . 275 25.6 2.2 0.153 * 21.7 22.7 23.3 24.3 25.9 27.0 27.8 28.4 29.1 *3–5 years . . . . . . . . . . . . . 419 26.6 2.1 0.121 * 21.9 24.1 24.9 25.6 26.8 28.1 28.7 29.0 29.5 *6–8 years . . . . . . . . . . . . . 229 27.2 2.0 0.152 * 23.9 24.8 25.4 26.1 27.4 28.6 29.1 29.4 30.3 *9–11 years . . . . . . . . . . . . . 267 27.6 1.9 0.137 * 24.1 25.5 25.9 26.6 27.8 28.8 29.4 29.8 30.3 *12–14 years . . . . . . . . . . . . 184 27.8 2.0 0.174 * * 24.9 25.6 26.6 28.0 29.1 29.8 30.4 * *15–19 years . . . . . . . . . . . . 298 28.9 2.0 0.137 * 25.5 26.2 27.0 27.6 29.0 30.3 30.6 30.9 31.7 *20–29 years . . . . . . . . . . . . 463 29.3 2.0 0.110 * 25.7 26.8 27.3 28.1 29.6 30.6 31.3 31.6 32.3 *30–39 years . . . . . . . . . . . . 461 29.3 2.4 0.130 * 24.3 26.6 27.3 28.0 29.6 30.9 31.5 31.9 32.9 *40–49 years . . . . . . . . . . . . 336 29.7 2.5 0.160 * 25.4 26.8 27.3 28.1 29.8 31.4 32.3 32.7 33.4 *50–59 years . . . . . . . . . . . . 207 29.5 2.3 0.182 * * 26.8 27.1 28.4 29.8 31.1 31.8 32.0 * *60–69 years . . . . . . . . . . . . 274 29.5 2.6 0.183 * 24.9 26.5 27.0 28.1 29.5 31.1 31.8 32.3 33.5 *70 years and over . . . . . . . . 220 29.4 2.4 0.185 * * 26.5 27.1 28.3 29.6 30.8 31.3 32.1 * *
Mexican American
1 year and over . . . . . . . . . . . 3,951 29.6 2.0 0.061 25.2 26.3 27.1 27.6 28.5 29.8 31.0 31.6 32.0 32.6 33.01–2 years . . . . . . . . . . . . . 298 26.1 2.2 0.165 * * 23.4 24.4 25.4 26.5 27.5 27.9 28.1 * *3–5 years . . . . . . . . . . . . . 466 27.6 1.5 0.087 * 25.1 26.0 26.4 26.9 27.6 28.6 29.0 29.4 29.6 *6–8 years . . . . . . . . . . . . . 250 28.3 1.3 0.107 * * 26.5 26.9 27.4 28.4 29.0 29.6 29.9 * *9–11 years . . . . . . . . . . . . . 272 28.3 1.9 0.148 * * 26.4 26.7 27.2 28.4 29.4 29.9 30.1 * *12–14 years . . . . . . . . . . . . 191 28.7 1.5 0.143 * * 27.0 27.4 27.7 28.8 29.7 30.3 30.8 * *15–19 years . . . . . . . . . . . . 304 29.7 1.6 0.120 * 26.8 27.5 28.0 28.7 30.0 30.9 31.4 31.6 32.0 *20–29 years . . . . . . . . . . . . 647 30.4 1.5 0.074 * 28.1 28.5 29.1 29.5 30.5 31.3 31.7 31.9 32.5 *30–39 years . . . . . . . . . . . . 450 30.4 1.6 0.098 * 28.0 28.6 29.1 29.5 30.4 31.5 32.0 32.2 32.7 *40–49 years . . . . . . . . . . . . 369 30.6 1.9 0.125 * 27.9 28.5 28.9 29.6 30.5 31.7 32.3 32.8 33.3 *50–59 years . . . . . . . . . . . . 175 30.4 1.8 0.175 * * 28.4 28.8 29.3 30.4 31.8 32.2 32.4 * *60–69 years . . . . . . . . . . . . 330 30.7 1.9 0.136 * 27.8 28.6 29.0 29.6 30.9 31.9 32.7 32.9 34.1 *70 years and over . . . . . . . . 199 30.3 1.8 0.163 * * 28.2 28.6 29.4 30.4 31.6 32.2 32.4 * *
* Does not meet standards for reliability or precision.1Includes all other race/ethnic groups not listed separately.
Page 32 [ Series 11, No. 247

Table 15. Mean cell hemoglobin in picogram for females 1 year and over, number of examined persons, mean, standard deviation, standarderror of the mean, and selected percentiles, by race/ethnicity and age: United States, 1988–94
Race/ethnicity and age
Number ofexaminedpersons Mean
Standarddeviation
Standarderror ofmean
Percentile
2.5th 5th 10th 15th 25th 50th 75th 85th 90th 95th 97.5th
All race/ethnic groups1
1 year and over . . . . . . . . . . . 13,746 29.8 2.2 0.052 25.0 26.3 27.2 27.9 28.7 30.0 31.1 31.8 32.2 32.8 33.41–2 years . . . . . . . . . . . . . 857 26.8 1.8 0.098 22.6 23.8 24.7 25.2 26.0 27.0 27.9 28.4 28.8 29.3 29.63–5 years . . . . . . . . . . . . . 1,337 27.7 1.6 0.070 23.7 25.0 25.9 26.4 26.9 27.9 28.7 29.1 29.4 29.9 30.16–8 years . . . . . . . . . . . . . 675 28.2 1.4 0.090 24.9 25.4 26.4 26.9 27.4 28.4 29.2 29.6 29.8 30.2 30.39–11 years . . . . . . . . . . . . . 734 28.4 1.6 0.094 24.9 25.7 26.7 27.0 27.6 28.5 29.3 29.8 30.1 30.9 31.512–14 years . . . . . . . . . . . . 621 29.0 1.7 0.110 25.0 25.8 26.8 27.6 28.2 29.1 30.2 30.6 30.8 31.3 31.615–19 years . . . . . . . . . . . . 950 29.5 1.9 0.099 25.1 26.3 27.3 27.9 28.4 29.6 30.7 31.3 31.8 32.3 32.620–29 years . . . . . . . . . . . . 1,769 30.1 1.8 0.071 25.9 27.0 27.9 28.5 29.2 30.2 31.2 31.8 32.1 32.6 33.130–39 years . . . . . . . . . . . . 1,757 30.1 2.2 0.085 24.6 26.3 27.7 28.4 29.1 30.4 31.5 32.0 32.3 32.9 33.440–49 years . . . . . . . . . . . . 1,303 30.2 2.3 0.103 24.0 26.5 27.6 28.3 29.2 30.4 31.7 32.1 32.5 33.3 33.750–59 years . . . . . . . . . . . . 969 30.4 2.0 0.104 25.7 27.0 28.1 28.7 29.4 30.5 31.5 32.2 32.6 33.1 34.060–69 years . . . . . . . . . . . . 1,111 30.4 2.1 0.104 26.3 27.3 28.3 28.8 29.4 30.5 31.4 32.1 32.6 33.2 33.870 years and over . . . . . . . . 1,663 30.5 1.8 0.073 26.7 27.6 28.4 28.8 29.4 30.5 31.6 32.2 32.7 33.4 33.9
Non-Hispanic white
1 year and over . . . . . . . . . . . 5,029 30.2 1.9 0.049 26.4 27.1 27.9 28.4 29.1 30.3 31.4 32.0 32.3 33.0 33.61–2 years . . . . . . . . . . . . . 270 27.2 1.3 0.099 * 25.1 25.5 25.9 26.5 27.2 28.1 28.7 29.0 29.3 *3–5 years . . . . . . . . . . . . . 332 28.1 1.1 0.079 * 26.4 26.7 26.9 27.3 28.0 28.8 29.2 29.5 30.0 *6–8 years . . . . . . . . . . . . . 175 28.5 1.1 0.108 * * 27.1 27.3 27.8 28.5 29.2 29.8 29.9 * *9–11 years . . . . . . . . . . . . . 186 28.6 1.4 0.131 * * 27.0 27.3 27.9 28.6 29.4 29.8 30.1 * *12–14 years . . . . . . . . . . . . 154 29.2 1.5 0.156 * * 27.6 27.7 28.4 29.4 30.2 30.8 30.9 * *15–19 years . . . . . . . . . . . . 270 29.9 1.6 0.125 * 27.3 28.0 28.3 28.9 29.9 31.0 31.4 31.9 32.5 *20–29 years . . . . . . . . . . . . 477 30.4 1.5 0.089 * 28.1 28.8 29.0 29.5 30.3 31.4 31.9 32.2 32.8 *30–39 years . . . . . . . . . . . . 572 30.5 1.7 0.093 * 27.9 28.7 29.0 29.6 30.7 31.6 32.1 32.5 33.0 *40–49 years . . . . . . . . . . . . 457 30.5 1.9 0.115 * 27.3 28.2 29.0 29.5 30.6 31.8 32.3 32.8 33.4 *50–59 years . . . . . . . . . . . . 473 30.6 1.8 0.106 * 27.8 28.5 29.1 29.7 30.6 31.8 32.4 32.7 33.3 *60–69 years . . . . . . . . . . . . 473 30.6 2.1 0.121 * 27.7 28.6 29.0 29.6 30.6 31.5 32.2 32.7 33.4 *70 years and over . . . . . . . . 1,190 30.6 1.7 0.063 * 28.0 28.5 29.0 29.5 30.5 31.6 32.2 32.8 33.5 *
Non-Hispanic black
1 year and over . . . . . . . . . . . 4,116 28.4 2.6 0.078 22.5 23.8 25.3 26.0 26.9 28.6 30.1 30.9 31.4 32.0 32.71–2 years . . . . . . . . . . . . . 265 25.8 2.2 0.157 * 21.5 22.8 23.8 24.5 26.2 27.2 27.8 28.3 29.0 *3–5 years . . . . . . . . . . . . . 433 26.9 2.0 0.112 * 22.5 24.4 25.0 25.8 27.3 28.2 28.6 29.0 29.6 *6–8 years . . . . . . . . . . . . . 220 27.1 1.9 0.152 * * 24.8 25.0 25.7 27.3 28.4 29.1 29.4 * *9–11 years . . . . . . . . . . . . . 252 27.6 1.8 0.135 * 24.6 25.1 25.5 26.4 28.1 28.9 29.3 29.7 30.3 *12–14 years . . . . . . . . . . . . 220 28.0 2.2 0.173 * * 25.4 25.8 26.8 28.4 29.5 30.1 30.7 * *15–19 years . . . . . . . . . . . . 326 28.1 2.3 0.149 * 24.2 25.3 26.0 26.8 28.4 29.6 30.4 30.7 31.6 *20–29 years . . . . . . . . . . . . 589 28.6 2.4 0.118 * 24.0 25.9 26.4 27.2 28.9 30.4 30.9 31.3 32.0 *30–39 years . . . . . . . . . . . . 602 28.8 2.7 0.131 * 23.5 25.5 26.3 27.4 29.3 30.7 31.5 32.0 32.7 *40–49 years . . . . . . . . . . . . 425 28.7 2.9 0.165 * 22.9 25.6 26.1 27.1 29.1 30.6 31.5 31.9 32.4 *50–59 years . . . . . . . . . . . . 256 29.1 2.3 0.172 * 24.7 26.5 26.9 27.8 29.5 30.7 31.2 31.4 32.3 *60–69 years . . . . . . . . . . . . 276 29.2 2.4 0.170 * 25.3 26.2 27.2 28.0 29.3 30.6 31.1 31.5 32.4 *70 years and over . . . . . . . . 252 29.1 2.4 0.178 * 24.6 26.1 26.6 27.6 29.2 30.8 31.4 31.9 32.9 *
Mexican American
1 year and over . . . . . . . . . . . 3,993 29.2 2.2 0.066 23.7 25.5 26.9 27.4 28.1 29.4 30.6 31.2 31.6 32.2 32.81–2 years . . . . . . . . . . . . . 284 26.6 2.2 0.165 * * 24.0 25.1 25.8 27.0 27.8 28.3 28.5 * *3–5 years . . . . . . . . . . . . . 506 27.9 1.5 0.086 * 25.5 26.3 26.7 27.1 28.0 28.8 29.3 29.4 30.1 *6–8 years . . . . . . . . . . . . . 257 28.4 1.4 0.114 * * 26.9 27.3 27.7 28.5 29.4 29.7 29.9 * *9–11 years . . . . . . . . . . . . . 265 28.8 1.5 0.121 * * 27.1 27.5 27.9 28.8 29.8 30.4 30.5 * *12–14 years . . . . . . . . . . . . 218 29.4 1.5 0.128 * * 27.8 28.0 28.5 29.3 30.5 30.9 31.2 * *15–19 years . . . . . . . . . . . . 297 29.2 2.1 0.161 * 25.1 26.8 27.5 28.3 29.5 30.5 31.1 31.6 32.0 *20–29 years . . . . . . . . . . . . 632 29.7 2.0 0.103 * 26.5 27.4 28.1 28.8 30.0 31.0 31.6 31.9 32.4 *30–39 years . . . . . . . . . . . . 504 29.6 2.3 0.133 * 26.0 27.1 27.9 28.7 29.9 31.0 31.5 31.8 32.5 *40–49 years . . . . . . . . . . . . 356 29.2 3.0 0.208 * 22.4 25.1 27.1 28.3 29.6 30.8 31.7 32.2 32.8 *50–59 years . . . . . . . . . . . . 185 30.0 1.9 0.179 * * 27.8 28.4 29.3 30.1 31.1 31.6 31.8 * *60–69 years . . . . . . . . . . . . 317 30.2 1.8 0.132 * 27.0 28.0 28.6 29.1 30.2 31.3 31.9 32.3 33.0 *70 years and over . . . . . . . . 172 30.0 2.0 0.202 * * 28.3 28.6 29.3 30.2 31.1 31.7 31.9 * *
* Does not meet standards for reliability or precision.1Includes all other race/ethnic groups not listed separately.
Series 11, No. 247 [ Page 33

Table 16. Mean cell hemoglobin concentration in gram per liter for persons 1 year and over, number of examined persons, mean, standarddeviation, standard error of the mean, and selected percentiles, by race/ethnicity and age: United States, 1988–94
Race/ethnicity and age
Number ofexaminedpersons Mean
Standarddeviation
Standarderror ofmean
Percentile
2.5th 5th 10th 15th 25th 50th 75th 85th 90th 95th 97.5th
All race/ethnic groups1
1 year and over . . . . . . . . . . . 26,369 337.4 8.6 0.356 320.1 323.6 327.2 329.4 332.6 338.1 343.0 345.8 347.7 350.5 352.91–2 years . . . . . . . . . . . . . 1,788 335.0 8.4 0.584 318.0 321.6 325.3 327.2 330.4 335.4 340.3 343.7 345.3 348.1 350.63–5 years . . . . . . . . . . . . . 2,618 336.0 8.6 0.494 319.0 321.5 325.3 327.8 331.4 336.6 341.3 344.1 346.7 349.5 352.76–8 years . . . . . . . . . . . . . 1,384 337.3 8.3 0.656 320.9 323.2 327.3 329.1 332.3 338.1 343.1 345.7 347.0 350.8 352.19–11 years . . . . . . . . . . . . . 1,507 337.3 7.7 0.581 322.2 324.4 327.9 329.4 333.0 337.9 342.8 345.1 346.7 349.3 351.012–14 years . . . . . . . . . . . . 1,161 336.8 8.2 0.705 319.8 323.1 326.5 328.4 331.9 337.8 342.5 345.3 347.1 349.1 352.615–19 years . . . . . . . . . . . . 1,786 336.9 8.2 0.566 320.8 324.2 327.0 328.6 331.9 337.4 342.5 345.0 347.3 350.3 352.420–29 years . . . . . . . . . . . . 3,331 338.3 8.5 0.430 321.0 324.3 328.4 330.7 333.3 339.0 343.7 346.5 348.6 351.6 354.530–39 years . . . . . . . . . . . . 3,158 338.0 8.2 0.427 320.4 324.3 328.0 330.3 333.5 338.7 343.5 346.3 348.2 350.8 352.940–49 years . . . . . . . . . . . . 2,467 338.1 9.0 0.531 320.4 323.9 327.8 330.0 333.5 338.7 343.8 346.5 348.3 350.9 353.150–59 years . . . . . . . . . . . . 1,802 338.1 8.1 0.558 321.1 324.6 328.3 330.4 333.5 339.0 343.3 346.1 348.0 351.5 353.560–69 years . . . . . . . . . . . . 2,241 336.8 9.8 0.604 319.8 322.9 326.7 328.8 331.6 336.9 342.1 345.1 347.0 350.2 352.870 years and over . . . . . . . . 3,126 335.5 8.5 0.448 318.0 321.2 324.9 327.3 330.5 336.1 341.5 344.1 346.2 348.8 350.9
Non-Hispanic white
1 year and over . . . . . . . . . . . 9,520 338.4 8.2 0.379 322.2 325.4 328.7 330.9 333.8 339.0 343.7 346.5 348.3 351.0 353.31–2 years . . . . . . . . . . . . . 567 336.5 7.9 0.675 * 324.4 327.1 329.6 332.2 336.8 341.9 344.7 346.1 348.7 *3–5 years . . . . . . . . . . . . . 655 337.4 8.2 0.652 * 323.5 327.4 330.2 332.8 337.7 342.1 345.4 347.7 350.6 *6–8 years . . . . . . . . . . . . . 365 338.7 8.1 0.866 * 324.9 328.0 330.6 334.2 339.2 344.4 346.5 348.1 351.5 *9–11 years . . . . . . . . . . . . . 386 338.1 6.9 0.721 * 326.2 329.3 331.3 334.3 338.4 343.3 345.5 347.1 349.1 *12–14 years . . . . . . . . . . . . 293 337.7 7.6 0.906 * * 328.2 329.8 332.4 338.5 342.9 345.5 347.3 * *15–19 years . . . . . . . . . . . . 465 338.2 7.6 0.720 * 326.1 328.4 330.8 333.1 338.8 343.4 345.8 347.9 350.7 *20–29 years . . . . . . . . . . . . 858 339.4 8.2 0.570 * 326.8 330.3 331.9 334.3 340.1 344.8 347.5 349.2 352.1 *30–39 years . . . . . . . . . . . . 1,007 339.2 7.5 0.485 * 326.3 330.1 332.0 335.0 339.8 344.3 347.0 348.7 351.5 *40–49 years . . . . . . . . . . . . 871 339.2 8.5 0.591 * 325.8 329.1 331.8 334.9 339.6 344.8 347.1 348.9 351.3 *50–59 years . . . . . . . . . . . . 883 339.0 7.5 0.513 * 326.0 329.8 331.7 334.6 339.5 344.2 346.5 348.7 351.9 *60–69 years . . . . . . . . . . . . 966 337.3 9.5 0.626 * 323.9 327.7 329.7 332.3 337.5 342.2 345.4 347.5 350.5 *70 years and over . . . . . . . . 2,204 336.0 8.5 0.368 * 322.0 325.8 328.0 331.0 336.5 341.9 344.5 346.6 349.1 *
Non-Hispanic black
1 year and over . . . . . . . . . . . 7,749 332.1 9.2 0.430 313.7 317.5 321.2 323.6 327.1 332.8 338.1 341.0 342.8 345.8 348.51–2 years . . . . . . . . . . . . . 540 331.1 9.3 0.723 * 318.1 321.0 323.0 325.9 331.3 336.4 339.2 341.5 345.0 *3–5 years . . . . . . . . . . . . . 852 332.4 8.8 0.543 * 317.6 320.8 323.6 327.1 333.4 338.2 341.4 342.9 347.0 *6–8 years . . . . . . . . . . . . . 449 332.9 9.2 0.782 * 318.9 321.3 323.7 327.3 333.4 339.2 342.1 343.6 346.1 *9–11 years . . . . . . . . . . . . . 519 333.6 8.4 0.664 * 320.1 323.4 324.9 327.9 334.2 339.2 342.1 344.1 347.3 *12–14 years . . . . . . . . . . . . 404 331.6 9.0 0.802 * 316.4 320.2 322.5 326.2 332.3 338.4 341.2 343.3 345.7 *15–19 years . . . . . . . . . . . . 624 331.6 8.8 0.631 * 317.9 320.9 323.3 326.3 332.2 337.3 339.8 341.7 344.4 *20–29 years . . . . . . . . . . . . 1,052 332.4 8.6 0.477 * 318.0 321.7 323.8 327.4 333.2 338.6 340.9 342.9 345.9 *30–39 years . . . . . . . . . . . . 1,063 332.5 9.0 0.499 * 316.6 321.1 324.2 328.0 333.3 338.4 341.4 343.0 346.6 *40–49 years . . . . . . . . . . . . 761 331.7 9.5 0.618 * 317.1 320.9 323.4 327.1 332.5 337.9 340.8 343.1 345.6 *50–59 years . . . . . . . . . . . . 463 332.1 8.9 0.748 * 316.4 321.4 323.9 327.3 333.0 338.3 340.3 342.3 345.5 *60–69 years . . . . . . . . . . . . 550 332.2 12.3 0.941 * 318.6 321.7 323.5 326.3 332.4 337.9 340.9 342.5 346.0 *70 years and over . . . . . . . . 472 329.9 8.1 0.670 * 315.9 319.3 322.7 325.1 330.4 335.6 338.5 340.9 343.6 *
Mexican American
1 year and over . . . . . . . . . . . 7,944 337.1 8.7 0.633 319.7 323.4 326.8 328.9 332.2 337.9 342.9 345.6 347.6 350.7 353.31–2 years . . . . . . . . . . . . . 582 333.6 8.7 0.930 * 319.3 323.2 325.9 328.4 334.5 339.9 342.5 344.2 346.7 *3–5 years . . . . . . . . . . . . . 972 336.4 8.2 0.671 * 323.2 326.5 328.7 331.5 336.9 341.7 344.6 346.1 349.0 *6–8 years . . . . . . . . . . . . . 507 337.6 7.6 0.872 * 325.3 327.2 328.8 332.6 338.7 343.6 344.8 346.2 348.4 *9–11 years . . . . . . . . . . . . . 537 338.1 8.7 0.963 * 324.7 326.9 329.0 333.0 339.3 343.7 346.6 349.3 351.6 *12–14 years . . . . . . . . . . . . 409 337.5 7.7 0.983 * 325.1 328.3 329.5 333.0 338.0 342.7 345.1 347.6 351.2 *15–19 years . . . . . . . . . . . . 601 336.9 8.5 0.888 * 323.5 326.6 328.4 331.3 337.3 342.7 345.3 347.6 351.6 *20–29 years . . . . . . . . . . . . 1,279 338.2 8.5 0.611 * 325.0 328.2 330.1 333.5 338.5 343.8 346.4 348.7 351.5 *30–39 years . . . . . . . . . . . . 954 337.3 8.5 0.710 * 323.4 327.3 329.5 332.7 337.8 343.2 345.9 347.8 350.6 *40–49 years . . . . . . . . . . . . 725 336.8 10.1 0.967 * 321.4 325.8 328.3 332.0 338.3 342.8 346.0 348.3 351.4 *50–59 years . . . . . . . . . . . . 360 337.0 9.1 1.237 * 323.1 326.2 327.8 330.9 338.0 342.3 346.3 348.5 353.1 *60–69 years . . . . . . . . . . . . 647 336.1 8.1 0.815 * 323.1 326.1 328.0 330.7 336.4 341.7 344.6 346.4 348.4 *70 years and over . . . . . . . . 371 334.1 8.4 1.122 * 321.5 325.2 327.4 329.8 334.7 339.5 341.6 344.1 346.5 *
* Does not meet standards for reliability or precision.1Includes all other race/ethnic groups not listed separately.
Page 34 [ Series 11, No. 247

Table 17. Mean cell hemoglobin concentration in gram per liter for males 1 year and over, number of examined persons, mean, standarddeviation, standard error of the mean, and selected percentiles, by race/ethnicity and age: United States, 1988–94
Race/ethnicity and age
Number ofexaminedpersons Mean
Standarddeviation
Standarderror ofmean
Percentile
2.5th 5th 10th 15th 25th 50th 75th 85th 90th 95th 97.5th
All race/ethnic groups1
1 year and over . . . . . . . . . . . 12,623 338.5 8.3 0.496 321.8 325.1 328.6 330.8 333.8 339.2 343.8 346.6 348.6 351.6 353.81–2 years . . . . . . . . . . . . . 931 334.4 8.4 0.621 315.1 320.2 324.7 326.8 330.0 335.0 339.8 343.3 344.8 347.2 348.73–5 years . . . . . . . . . . . . . 1,281 335.6 9.1 0.577 315.5 320.2 324.1 327.3 330.9 336.1 341.3 343.9 345.9 349.4 353.76–8 years . . . . . . . . . . . . . 709 337.3 8.8 0.743 320.8 322.8 326.8 328.8 332.1 337.6 343.6 345.7 347.4 350.8 351.99–11 years . . . . . . . . . . . . . 773 337.1 7.4 0.604 322.0 323.9 327.0 329.7 333.5 338.3 342.1 344.4 345.9 348.1 349.812–14 years . . . . . . . . . . . . 540 337.0 7.8 0.762 319.2 323.4 327.6 328.8 332.1 338.2 342.4 344.8 347.1 349.3 352.715–19 years . . . . . . . . . . . . 836 338.2 8.0 0.626 322.3 325.5 328.0 330.5 332.9 338.4 343.1 346.8 349.2 351.7 355.120–29 years . . . . . . . . . . . . 1,562 339.5 8.2 0.468 323.7 326.9 330.8 332.4 334.6 340.0 344.8 347.9 349.5 352.2 355.230–39 years . . . . . . . . . . . . 1,401 339.8 7.6 0.461 323.6 327.5 330.5 332.4 335.5 340.5 345.1 348.1 349.4 352.2 353.640–49 years . . . . . . . . . . . . 1,164 340.0 8.5 0.563 323.3 327.0 330.4 332.2 335.5 340.4 345.2 347.3 349.4 352.3 354.550–59 years . . . . . . . . . . . . 833 339.6 7.6 0.591 324.2 326.9 329.8 332.5 335.4 340.4 344.3 346.7 349.3 352.7 353.960–69 years . . . . . . . . . . . . 1,130 337.4 8.1 0.542 322.1 324.7 327.8 330.1 332.7 337.7 342.4 345.6 347.7 350.5 353.670 years and over . . . . . . . . 1,463 335.9 8.6 0.509 318.4 322.0 325.2 327.6 330.5 336.6 342.0 344.7 346.7 349.1 350.7
Non-Hispanic white
1 year and over . . . . . . . . . . . 4,491 339.4 8.0 0.538 323.4 326.7 330.1 332.1 334.9 340.0 344.6 347.2 349.2 352.0 354.11–2 years . . . . . . . . . . . . . 297 335.7 8.1 0.728 * 321.7 326.6 329.2 331.3 336.2 340.9 344.3 345.3 347.7 *3–5 years . . . . . . . . . . . . . 323 336.9 8.7 0.743 * 322.5 326.9 329.1 332.4 337.1 341.9 344.7 347.0 350.3 *6–8 years . . . . . . . . . . . . . 190 338.6 8.7 0.970 * * 327.8 329.3 333.4 339.4 344.7 346.7 348.4 * *9–11 years . . . . . . . . . . . . . 200 338.0 6.6 0.719 * * 329.6 331.9 334.4 338.7 343.0 344.5 346.1 * *12–14 years . . . . . . . . . . . . 139 337.8 7.5 0.979 * * 328.3 329.6 333.2 338.8 342.5 344.6 347.3 * *15–19 years . . . . . . . . . . . . 195 339.5 7.2 0.800 * * 331.0 332.3 335.0 340.2 343.5 347.3 349.8 * *20–29 years . . . . . . . . . . . . 381 340.5 8.1 0.643 * 329.0 331.9 333.4 335.9 340.9 345.8 348.6 350.2 352.8 *30–39 years . . . . . . . . . . . . 435 340.8 7.2 0.535 * 329.4 332.1 333.8 336.9 341.3 345.7 348.5 350.2 352.4 *40–49 years . . . . . . . . . . . . 414 340.8 8.4 0.636 * 328.2 331.5 333.3 336.4 340.9 345.8 347.4 349.7 352.7 *50–59 years . . . . . . . . . . . . 410 340.4 6.9 0.527 * 329.2 331.8 333.3 336.0 340.8 345.1 347.2 350.2 353.0 *60–69 years . . . . . . . . . . . . 493 337.9 7.9 0.547 * 325.8 329.0 330.8 333.1 338.0 342.4 346.0 348.0 350.6 *70 years and over . . . . . . . . 1,014 336.4 8.6 0.415 * 322.7 325.7 328.1 331.2 337.2 342.5 345.5 347.2 349.3 *
Non-Hispanic black
1 year and over . . . . . . . . . . . 3,633 333.1 8.6 0.588 315.8 319.2 322.7 325.0 328.1 333.5 338.7 341.6 343.6 346.4 349.61–2 years . . . . . . . . . . . . . 275 330.5 8.2 0.748 * 316.1 320.6 322.7 325.8 331.3 335.6 337.9 340.4 343.7 *3–5 years . . . . . . . . . . . . . 419 332.1 9.3 0.687 * 316.6 319.9 322.5 327.0 333.3 337.9 341.3 342.8 347.4 *6–8 years . . . . . . . . . . . . . 229 332.9 9.8 0.984 * 318.0 321.1 322.9 327.1 333.8 339.3 342.0 343.3 345.8 *9–11 years . . . . . . . . . . . . . 267 333.3 8.5 0.792 * 319.6 323.3 324.6 327.9 333.9 338.8 341.4 343.8 345.3 *12–14 years . . . . . . . . . . . . 184 332.1 8.5 0.945 * * 320.3 321.8 326.4 332.3 338.7 341.7 343.2 * *15–19 years . . . . . . . . . . . . 298 332.8 8.5 0.746 * 319.1 323.0 324.9 327.5 333.1 337.9 341.1 342.4 346.0 *20–29 years . . . . . . . . . . . . 463 334.2 8.2 0.574 * 320.3 324.0 326.6 329.6 334.6 339.8 342.4 344.8 347.5 *30–39 years . . . . . . . . . . . . 461 334.0 8.2 0.580 * 320.2 323.9 326.8 329.6 334.6 339.2 342.3 344.1 348.1 *40–49 years . . . . . . . . . . . . 336 334.2 8.1 0.667 * 320.3 323.9 326.7 329.3 334.1 340.2 343.1 344.4 347.2 *50–59 years . . . . . . . . . . . . 207 332.5 8.8 0.922 * * 322.8 325.3 328.0 333.2 338.3 340.2 342.1 * *60–69 years . . . . . . . . . . . . 274 331.9 8.9 0.813 * 318.8 321.8 323.8 326.2 332.3 337.7 341.0 343.3 347.9 *70 years and over . . . . . . . . 220 330.6 8.2 0.841 * * 322.4 323.7 326.4 330.8 335.6 338.8 342.1 * *
Mexican American
1 year and over . . . . . . . . . . . 3,951 338.1 8.1 0.838 322.1 325.4 328.0 330.0 333.4 338.6 343.7 346.3 348.3 351.6 353.81–2 years . . . . . . . . . . . . . 298 332.8 8.8 1.013 * * 321.8 324.3 327.6 333.5 339.4 341.5 343.3 * *3–5 years . . . . . . . . . . . . . 466 336.0 8.0 0.741 * 323.2 326.2 327.9 331.2 336.3 341.4 344.2 345.5 347.9 *6–8 years . . . . . . . . . . . . . 250 337.6 7.6 0.955 * * 327.0 328.2 332.8 338.5 343.4 345.2 346.1 * *9–11 years . . . . . . . . . . . . . 272 337.4 8.2 0.982 * * 326.7 328.7 332.9 338.7 342.9 344.7 347.0 * *12–14 years . . . . . . . . . . . . 191 337.3 7.6 1.098 * * 328.3 329.7 333.2 337.5 341.6 344.5 348.0 * *15–19 years . . . . . . . . . . . . 304 338.2 7.9 0.898 * 326.4 327.9 329.6 333.2 338.2 343.8 346.3 348.5 352.1 *20–29 years . . . . . . . . . . . . 647 339.7 7.8 0.611 * 327.4 330.1 332.4 335.1 339.6 345.3 347.8 350.1 352.3 *30–39 years . . . . . . . . . . . . 450 338.7 7.5 0.703 * 326.2 329.1 330.9 334.1 339.1 344.1 346.4 348.1 350.7 *40–49 years . . . . . . . . . . . . 369 339.4 8.3 0.863 * 326.9 329.4 331.8 334.2 339.8 344.5 347.6 349.8 352.9 *50–59 years . . . . . . . . . . . . 175 337.9 9.2 1.389 * * 326.5 328.7 331.5 338.8 343.9 347.4 350.7 * *60–69 years . . . . . . . . . . . . 330 337.4 7.6 0.826 * 325.8 328.2 330.0 333.0 337.4 343.2 345.8 347.6 349.2 *70 years and over . . . . . . . . 199 334.5 7.2 1.011 * * 326.1 327.7 329.7 334.9 340.0 341.3 343.7 * *
* Does not meet standards for reliability or precision.1Includes all other race/ethnic groups not listed separately.
Series 11, No. 247 [ Page 35

Table 18. Mean cell hemoglobin concentration in gram per liter for females 1 year and over, number of examined persons, mean, standarddeviation, standard error of the mean, and selected percentiles, by race/ethnicity and age: United States, 1988–94
Race/ethnicity and age
Number ofexaminedpersons Mean
Standarddeviation
Standarderror ofmean
Percentile
2.5th 5th 10th 15th 25th 50th 75th 85th 90th 95th 97.5th
All race/ethnic groups1
1 year and over . . . . . . . . . . . 13,746 336.4 8.7 0.501 319.1 322.4 326.0 328.3 331.5 337.0 342.1 345.0 346.7 349.4 351.71–2 years . . . . . . . . . . . . . 857 335.7 8.4 0.667 320.6 322.8 325.6 327.5 331.1 336.0 340.9 344.1 346.1 349.0 351.23–5 years . . . . . . . . . . . . . 1,337 336.5 8.0 0.509 320.7 322.8 326.0 328.4 331.8 337.2 341.3 344.4 347.4 349.6 352.26–8 years . . . . . . . . . . . . . 675 337.4 7.8 0.695 321.0 324.3 327.7 329.4 332.5 338.3 342.7 345.5 346.8 350.8 352.29–11 years . . . . . . . . . . . . . 734 337.4 7.9 0.680 322.6 324.8 328.1 329.2 332.6 337.6 343.3 345.6 347.3 349.9 353.112–14 years . . . . . . . . . . . . 621 336.5 8.6 0.797 320.8 322.8 325.3 328.1 331.0 337.3 343.0 345.8 347.0 348.9 350.915–19 years . . . . . . . . . . . . 950 335.7 8.1 0.612 320.1 322.8 325.6 327.9 330.7 336.1 341.5 344.2 345.6 348.8 350.420–29 years . . . . . . . . . . . . 1,769 337.0 8.6 0.472 320.2 322.6 326.8 329.0 332.0 337.9 342.7 345.5 347.1 350.1 353.730–39 years . . . . . . . . . . . . 1,757 336.3 8.3 0.460 318.1 321.9 326.1 328.4 331.5 337.0 342.2 344.4 346.6 348.7 350.940–49 years . . . . . . . . . . . . 1,303 336.2 9.1 0.583 316.1 322.0 325.7 328.3 332.1 337.1 341.9 345.4 347.3 349.8 351.050–59 years . . . . . . . . . . . . 969 336.7 8.3 0.620 317.5 322.7 326.0 329.0 331.9 337.4 342.5 345.5 346.8 349.9 351.860–69 years . . . . . . . . . . . . 1,111 336.2 11.0 0.764 318.6 322.2 325.8 328.0 330.5 336.2 341.7 344.5 346.6 349.8 351.970 years and over . . . . . . . . 1,663 335.2 8.5 0.481 317.6 320.7 324.7 327.1 330.4 335.7 341.0 343.7 345.8 348.5 351.2
Non-Hispanic white
1 year and over . . . . . . . . . . . 5,029 337.5 8.3 0.526 321.2 324.5 327.7 329.8 332.7 337.9 342.9 345.7 347.4 350.0 352.31–2 years . . . . . . . . . . . . . 270 337.4 7.5 0.770 * 325.4 328.0 330.7 333.3 337.2 342.4 345.3 347.8 350.4 *3–5 years . . . . . . . . . . . . . 332 338.0 7.6 0.705 * 324.4 328.3 331.4 333.4 338.1 342.6 346.7 348.5 350.8 *6–8 years . . . . . . . . . . . . . 175 338.8 7.4 0.945 * * 328.6 331.2 334.7 339.1 343.7 346.3 347.6 * *9–11 years . . . . . . . . . . . . . 186 338.3 7.3 0.902 * * 329.2 330.9 334.2 338.1 343.7 346.0 347.3 * *12–14 years . . . . . . . . . . . . 154 337.5 7.7 1.055 * * 328.1 330.1 332.3 338.2 343.2 346.0 347.3 * *15–19 years . . . . . . . . . . . . 270 337.0 7.7 0.798 * 324.9 327.4 328.6 331.7 337.1 342.8 345.1 346.1 349.3 *20–29 years . . . . . . . . . . . . 477 338.3 8.1 0.626 * 324.9 328.9 330.7 333.1 339.2 343.8 346.0 347.9 350.7 *30–39 years . . . . . . . . . . . . 572 337.6 7.5 0.530 * 325.2 328.2 330.4 333.4 338.1 342.9 345.2 347.0 348.9 *40–49 years . . . . . . . . . . . . 457 337.6 8.4 0.664 * 324.5 327.5 329.6 333.5 338.3 342.9 346.4 348.2 350.1 *50–59 years . . . . . . . . . . . . 473 337.7 7.7 0.600 * 324.7 328.2 330.4 333.3 337.8 343.1 346.0 347.5 350.2 *60–69 years . . . . . . . . . . . . 473 336.9 10.8 0.839 * 323.2 327.0 328.5 331.2 336.8 342.0 345.0 347.0 350.4 *70 years and over . . . . . . . . 1,190 335.7 8.4 0.412 * 321.5 326.0 327.8 330.9 336.1 341.5 344.0 346.3 348.9 *
Non-Hispanic black
1 year and over . . . . . . . . . . . 4,116 331.2 9.6 0.616 312.3 316.1 320.0 322.7 326.0 331.9 337.5 340.2 342.1 345.3 347.71–2 years . . . . . . . . . . . . . 265 331.6 10.3 0.932 * 318.7 321.8 323.5 326.0 331.3 337.2 340.8 342.7 345.3 *3–5 years . . . . . . . . . . . . . 433 332.8 8.3 0.583 * 319.6 321.5 324.4 327.2 333.5 338.5 341.4 343.1 346.6 *6–8 years . . . . . . . . . . . . . 220 332.9 8.5 0.844 * * 321.4 324.2 327.4 333.2 339.1 342.1 344.0 * *9–11 years . . . . . . . . . . . . . 252 333.8 8.3 0.764 * 321.7 323.5 325.2 327.9 334.4 339.7 343.0 344.2 347.6 *12–14 years . . . . . . . . . . . . 220 331.1 9.3 0.924 * * 319.5 322.7 325.7 332.3 338.0 341.0 343.3 * *15–19 years . . . . . . . . . . . . 326 330.3 8.8 0.718 * 317.1 320.0 321.8 324.8 331.0 336.5 339.2 340.9 343.2 *20–29 years . . . . . . . . . . . . 589 330.9 8.7 0.525 * 316.2 320.2 322.4 325.9 332.1 337.1 339.5 341.3 344.2 *30–39 years . . . . . . . . . . . . 602 331.3 9.5 0.569 * 313.4 318.2 322.1 326.8 331.9 337.8 340.5 342.5 345.6 *40–49 years . . . . . . . . . . . . 425 329.7 10.0 0.714 * 313.1 318.8 321.7 324.8 330.8 335.9 338.7 340.7 343.8 *50–59 years . . . . . . . . . . . . 256 331.7 9.1 0.832 * 316.2 319.7 323.6 326.2 332.7 338.0 340.4 342.6 346.2 *60–69 years . . . . . . . . . . . . 276 332.5 14.2 1.253 * 318.0 321.7 323.4 326.4 332.5 337.9 340.7 342.4 345.3 *70 years and over . . . . . . . . 252 329.5 8.0 0.737 * 315.9 318.6 321.1 324.3 330.1 335.6 338.4 340.0 342.2 *
Mexican American
1 year and over . . . . . . . . . . . 3,993 336.1 9.1 0.940 317.2 321.6 325.6 327.8 330.9 336.8 342.1 344.7 346.7 349.8 352.41–2 years . . . . . . . . . . . . . 284 334.5 8.6 1.026 * * 325.3 327.0 330.3 335.4 340.7 342.9 344.7 * *3–5 years . . . . . . . . . . . . . 506 336.8 8.2 0.737 * 323.3 326.8 329.7 331.8 337.6 342.5 344.8 346.9 349.4 *6–8 years . . . . . . . . . . . . . 257 337.6 7.7 0.965 * * 327.8 329.0 332.6 338.8 343.7 344.5 346.2 * *9–11 years . . . . . . . . . . . . . 265 338.9 9.2 1.138 * * 327.2 329.2 333.1 340.0 345.7 349.1 349.9 * *12–14 years . . . . . . . . . . . . 218 337.7 7.8 1.067 * * 328.3 329.3 332.9 338.3 343.5 345.3 347.3 * *15–19 years . . . . . . . . . . . . 297 335.5 8.9 1.038 * 320.8 324.0 326.9 330.2 336.6 341.7 344.3 346.3 349.7 *20–29 years . . . . . . . . . . . . 632 336.2 9.0 0.718 * 323.1 325.8 328.2 331.1 337.1 342.1 344.3 346.2 349.3 *30–39 years . . . . . . . . . . . . 504 335.7 9.3 0.834 * 319.7 324.6 327.7 330.9 336.1 341.8 344.5 347.4 350.3 *40–49 years . . . . . . . . . . . . 356 334.1 11.1 1.187 * 312.4 321.8 325.3 328.9 336.0 341.1 344.0 346.3 349.6 *50–59 years . . . . . . . . . . . . 185 336.1 9.0 1.326 * * 326.1 327.1 330.6 336.9 341.7 344.6 347.0 * *60–69 years . . . . . . . . . . . . 317 335.1 8.3 0.943 * 321.9 324.9 326.9 329.3 335.3 341.1 344.2 345.5 347.6 *70 years and over . . . . . . . . 172 333.7 9.5 1.452 * * 323.7 327.3 329.9 334.5 339.0 342.5 345.1 * *
* Does not meet standards for reliability or precision.1Includes all other race/ethnic groups not listed separately.
Page 36 [ Series 11, No. 247

Table 19. Red cell distribution width in percentages for persons 1 year and over, number of examined persons, mean, standard deviation,standard error of the mean, and selected percentiles, by race/ethnicity and age: United States, 1988–94
Race/ethnicity and age
Number ofexaminedpersons Mean
Standarddeviation
Standarderror ofmean
Percentile
2.5th 5th 10th 15th 25th 50th 75th 85th 90th 95th 97.5th
All race/ethnic groups1
1 year and over . . . . . . . . . . . 26,372 12.9 1.0 0.013 11.6 11.8 12.0 12.1 12.3 12.7 13.2 13.6 13.9 14.4 15.21–2 years . . . . . . . . . . . . . 1,789 13.1 1.3 0.049 11.6 11.7 11.9 12.1 12.3 12.8 13.6 14.1 14.5 15.3 16.63–5 years . . . . . . . . . . . . . 2,618 12.5 0.8 0.024 11.4 11.6 11.8 11.9 12.1 12.4 12.9 13.2 13.4 13.9 14.46–8 years . . . . . . . . . . . . . 1,384 12.4 0.6 0.026 11.5 11.6 11.8 11.9 12.0 12.4 12.8 13.0 13.1 13.4 13.89–11 years . . . . . . . . . . . . . 1,507 12.5 0.7 0.029 11.5 11.6 11.8 11.8 12.0 12.4 12.8 13.1 13.3 13.6 13.912–14 years . . . . . . . . . . . . 1,161 12.7 0.8 0.036 11.7 11.8 11.9 12.1 12.2 12.6 13.0 13.3 13.4 13.8 14.415–19 years . . . . . . . . . . . . 1,786 12.7 0.8 0.028 11.6 11.8 11.9 12.1 12.2 12.6 12.9 13.3 13.5 13.9 14.520–29 years . . . . . . . . . . . . 3,331 12.7 0.8 0.021 11.6 11.8 11.9 12.1 12.3 12.6 13.0 13.3 13.5 13.9 14.530–39 years . . . . . . . . . . . . 3,158 12.8 0.9 0.026 11.6 11.8 12.0 12.1 12.3 12.7 13.1 13.5 13.8 14.3 15.040–49 years . . . . . . . . . . . . 2,467 13.0 1.1 0.035 11.8 11.9 12.1 12.3 12.4 12.8 13.3 13.6 13.9 14.6 15.350–59 years . . . . . . . . . . . . 1,802 13.0 1.0 0.036 11.9 12.0 12.1 12.3 12.4 12.9 13.4 13.8 14.1 14.7 15.460–69 years . . . . . . . . . . . . 2,242 13.2 1.0 0.033 11.8 12.0 12.2 12.4 12.6 13.0 13.6 13.9 14.3 15.0 15.670 years and over . . . . . . . . 3,127 13.4 1.1 0.032 12.1 12.2 12.3 12.5 12.8 13.2 13.9 14.3 14.7 15.4 16.1
Non-Hispanic white
1 year and over . . . . . . . . . . . 9,521 12.8 0.9 0.015 11.6 11.8 11.9 12.1 12.3 12.6 13.1 13.4 13.7 14.2 14.81–2 years . . . . . . . . . . . . . 567 13.0 1.2 0.062 * 11.7 11.9 12.0 12.3 12.8 13.4 13.9 14.1 14.8 *3–5 years . . . . . . . . . . . . . 655 12.4 0.6 0.029 * 11.5 11.7 11.8 12.0 12.4 12.7 12.9 13.1 13.4 *6–8 years . . . . . . . . . . . . . 365 12.3 0.6 0.037 * 11.5 11.7 11.8 11.9 12.3 12.6 12.9 13.0 13.2 *9–11 years . . . . . . . . . . . . . 386 12.3 0.5 0.034 * 11.6 11.7 11.8 12.0 12.3 12.7 12.9 13.1 13.3 *12–14 years . . . . . . . . . . . . 293 12.6 0.7 0.053 * * 11.9 12.0 12.2 12.5 13.0 13.2 13.4 * *15–19 years . . . . . . . . . . . . 465 12.5 0.6 0.037 * 11.8 11.8 12.0 12.1 12.5 12.8 13.1 13.2 13.6 *20–29 years . . . . . . . . . . . . 858 12.6 0.6 0.026 * 11.8 11.9 12.1 12.3 12.6 12.9 13.1 13.3 13.6 *30–39 years . . . . . . . . . . . . 1,007 12.7 0.7 0.028 * 11.8 11.9 12.0 12.2 12.6 13.0 13.3 13.5 13.9 *40–49 years . . . . . . . . . . . . 871 12.9 1.0 0.041 * 11.9 12.1 12.2 12.4 12.7 13.2 13.4 13.7 14.2 *50–59 years . . . . . . . . . . . . 883 13.0 0.9 0.036 * 11.9 12.1 12.2 12.4 12.9 13.3 13.6 13.9 14.4 *60–69 years . . . . . . . . . . . . 966 13.1 0.9 0.037 * 12.0 12.2 12.3 12.6 12.9 13.5 13.8 14.1 14.8 *70 years and over . . . . . . . . 2,205 13.4 1.1 0.029 * 12.2 12.3 12.5 12.7 13.2 13.8 14.2 14.6 15.3 *
Non-Hispanic black
1 year and over . . . . . . . . . . . 7,749 13.4 1.3 0.020 11.8 11.9 12.2 12.3 12.6 13.1 13.8 14.3 14.7 15.5 16.61–2 years . . . . . . . . . . . . . 540 13.4 1.4 0.069 * 11.9 12.2 12.3 12.6 13.1 14.0 14.6 15.0 16.1 *3–5 years . . . . . . . . . . . . . 852 12.9 1.0 0.037 * 11.7 11.9 12.0 12.2 12.7 13.3 13.7 14.0 14.6 *6–8 years . . . . . . . . . . . . . 449 12.7 0.8 0.040 * 11.7 11.9 12.1 12.3 12.6 13.1 13.4 13.6 14.0 *9–11 years . . . . . . . . . . . . . 519 12.8 1.1 0.054 * 11.8 11.9 12.1 12.3 12.7 13.3 13.5 13.7 14.1 *12–14 years . . . . . . . . . . . . 404 13.0 1.1 0.062 * 11.9 12.1 12.2 12.4 12.8 13.3 13.8 14.1 14.5 *15–19 years . . . . . . . . . . . . 624 13.2 1.0 0.047 * 11.9 12.1 12.3 12.5 12.9 13.5 14.0 14.4 15.1 *20–29 years . . . . . . . . . . . . 1,052 13.2 1.2 0.041 * 11.9 12.1 12.2 12.5 12.9 13.6 14.1 14.4 15.0 *30–39 years . . . . . . . . . . . . 1,063 13.4 1.4 0.049 * 12.1 12.3 12.4 12.7 13.1 13.9 14.3 14.8 15.8 *40–49 years . . . . . . . . . . . . 761 13.7 1.5 0.062 * 12.1 12.3 12.5 12.8 13.4 14.1 14.6 15.0 16.1 *50–59 years . . . . . . . . . . . . 463 13.7 1.4 0.075 * 12.3 12.4 12.6 12.8 13.4 14.3 14.8 15.2 16.2 *60–69 years . . . . . . . . . . . . 550 13.9 1.3 0.063 * 12.2 12.4 12.7 13.0 13.6 14.4 15.1 15.6 16.3 *70 years and over . . . . . . . . 472 14.1 1.3 0.069 * 12.4 12.8 12.9 13.2 13.9 14.8 15.3 15.6 16.4 *
Mexican American
1 year and over . . . . . . . . . . . 7,945 12.9 1.0 0.018 11.7 11.9 12.0 12.1 12.3 12.7 13.2 13.6 13.8 14.4 15.41–2 years . . . . . . . . . . . . . 583 13.3 1.6 0.083 * 11.8 11.9 12.1 12.4 13.0 13.8 14.4 15.1 16.4 *3–5 years . . . . . . . . . . . . . 972 12.7 0.9 0.035 * 11.6 11.8 11.9 12.1 12.6 13.1 13.3 13.6 14.2 *6–8 years . . . . . . . . . . . . . 507 12.5 0.6 0.031 * 11.7 11.9 12.0 12.2 12.5 12.8 13.1 13.3 13.5 *9–11 years . . . . . . . . . . . . . 537 12.6 0.8 0.043 * 11.7 11.8 11.9 12.1 12.4 12.9 13.1 13.4 13.8 *12–14 years . . . . . . . . . . . . 409 12.7 0.6 0.037 * 11.8 11.9 12.1 12.3 12.6 13.0 13.2 13.4 13.8 *15–19 years . . . . . . . . . . . . 601 12.9 0.9 0.046 * 11.9 12.1 12.2 12.4 12.8 13.1 13.4 13.8 14.3 *20–29 years . . . . . . . . . . . . 1,279 12.8 0.8 0.028 * 11.9 12.0 12.1 12.3 12.6 13.1 13.4 13.6 14.1 *30–39 years . . . . . . . . . . . . 954 13.0 1.0 0.041 * 11.9 12.1 12.2 12.4 12.8 13.3 13.6 13.8 14.4 *40–49 years . . . . . . . . . . . . 725 13.2 1.3 0.061 * 12.0 12.3 12.3 12.5 12.9 13.4 13.8 14.2 15.4 *50–59 years . . . . . . . . . . . . 360 13.2 1.1 0.074 * 12.1 12.3 12.4 12.6 12.9 13.5 13.8 14.3 14.9 *60–69 years . . . . . . . . . . . . 647 13.3 1.1 0.057 * 12.1 12.3 12.4 12.6 13.1 13.6 13.9 14.3 14.9 *70 years and over . . . . . . . . 371 13.6 1.2 0.081 * 12.3 12.5 12.7 12.9 13.4 13.9 14.3 14.8 15.9 *
* Does not meet standards for reliability or precision.1Includes all other race/ethnic groups not listed separately.
Series 11, No. 247 [ Page 37

Table 20. Red cell distribution width in percentages for males 1 year and over, number of examined persons, mean, standard deviation,standard error of the mean, and selected percentiles, by race/ethnicity and age: United States, 1988–94
Race/ethnicity and age
Number ofexaminedpersons Mean
Standarddeviation
Standarderror ofmean
Percentile
2.5th 5th 10th 15th 25th 50th 75th 85th 90th 95th 97.5th
All race/ethnic groups1
1 year and over . . . . . . . . . . . 12,623 12.8 0.9 0.017 11.7 11.8 12.0 12.1 12.3 12.7 13.2 13.5 13.8 14.3 14.91–2 years . . . . . . . . . . . . . 931 13.3 1.4 0.071 11.7 11.8 12.0 12.2 12.4 12.9 13.8 14.3 14.7 15.6 17.33–5 years . . . . . . . . . . . . . 1,281 12.7 0.8 0.032 11.6 11.7 11.9 12.0 12.2 12.5 13.0 13.3 13.6 13.9 14.46–8 years . . . . . . . . . . . . . 709 12.6 0.6 0.036 11.6 11.7 11.8 12.0 12.2 12.5 12.9 13.1 13.2 13.4 13.99–11 years . . . . . . . . . . . . . 773 12.5 0.7 0.041 11.6 11.7 11.8 11.9 12.1 12.4 12.8 13.1 13.3 13.6 13.912–14 years . . . . . . . . . . . . 540 12.8 0.7 0.047 11.8 11.8 12.1 12.2 12.3 12.7 13.1 13.3 13.5 13.8 14.215–19 years . . . . . . . . . . . . 836 12.6 0.6 0.031 11.6 11.8 11.9 12.1 12.3 12.6 12.9 13.1 13.3 13.6 14.020–29 years . . . . . . . . . . . . 1,562 12.6 0.6 0.023 11.6 11.8 11.9 12.1 12.2 12.6 12.9 13.2 13.3 13.6 14.030–39 years . . . . . . . . . . . . 1,401 12.7 0.8 0.032 11.6 11.8 11.9 12.1 12.3 12.7 13.1 13.3 13.5 14.0 14.640–49 years . . . . . . . . . . . . 1,164 12.9 0.8 0.037 11.8 11.9 12.1 12.3 12.4 12.7 13.2 13.5 13.7 14.2 14.650–59 years . . . . . . . . . . . . 833 13.0 0.9 0.049 11.9 12.0 12.1 12.3 12.4 12.9 13.4 13.7 14.0 14.8 15.460–69 years . . . . . . . . . . . . 1,130 13.2 1.0 0.044 11.9 12.1 12.3 12.4 12.6 13.1 13.6 13.9 14.3 14.9 15.870 years and over . . . . . . . . 1,463 13.6 1.2 0.049 12.1 12.3 12.4 12.6 12.8 13.3 14.0 14.6 14.9 15.6 16.4
Non-Hispanic white
1 year and over . . . . . . . . . . . 4,491 12.8 0.8 0.020 11.7 11.8 12.0 12.1 12.3 12.7 13.1 13.4 13.7 14.1 14.81–2 years . . . . . . . . . . . . . 297 13.2 1.3 0.095 * 11.9 12.0 12.2 12.4 12.9 13.6 14.0 14.4 15.3 *3–5 years . . . . . . . . . . . . . 323 12.5 0.6 0.042 * 11.7 11.8 11.9 12.1 12.4 12.8 13.1 13.3 13.6 *6–8 years . . . . . . . . . . . . . 190 12.5 0.6 0.053 * * 11.8 11.9 12.1 12.4 12.8 13.0 13.1 * *9–11 years . . . . . . . . . . . . . 200 12.4 0.5 0.043 * * 11.8 11.9 12.1 12.3 12.6 12.8 13.1 * *12–14 years . . . . . . . . . . . . 139 12.7 0.6 0.062 * * 12.0 12.1 12.3 12.6 13.0 13.3 13.4 * *15–19 years . . . . . . . . . . . . 195 12.5 0.5 0.047 * * 11.9 12.1 12.3 12.6 12.8 13.1 13.1 * *20–29 years . . . . . . . . . . . . 381 12.6 0.5 0.035 * 11.8 12.0 12.0 12.2 12.5 12.9 13.1 13.2 13.4 *30–39 years . . . . . . . . . . . . 435 12.6 0.7 0.039 * 11.8 11.9 12.0 12.2 12.6 13.0 13.2 13.4 13.8 *40–49 years . . . . . . . . . . . . 414 12.8 0.8 0.048 * 11.9 12.1 12.2 12.4 12.7 13.2 13.4 13.6 13.9 *50–59 years . . . . . . . . . . . . 410 13.0 0.8 0.052 * 11.9 12.1 12.3 12.4 12.9 13.3 13.6 13.8 14.6 *60–69 years . . . . . . . . . . . . 493 13.1 0.8 0.047 * 12.0 12.3 12.4 12.6 13.0 13.6 13.8 14.1 14.8 *70 years and over . . . . . . . . 1,014 13.5 1.2 0.047 * 12.3 12.4 12.6 12.8 13.3 13.9 14.4 14.8 15.4 *
Non-Hispanic black
1 year and over . . . . . . . . . . . 3,633 13.3 1.2 0.027 11.8 11.9 12.1 12.3 12.6 13.1 13.7 14.2 14.6 15.3 16.21–2 years . . . . . . . . . . . . . 275 13.7 1.6 0.105 * 12.0 12.2 12.3 12.7 13.3 14.2 14.8 15.6 16.8 *3–5 years . . . . . . . . . . . . . 419 13.0 1.0 0.052 * 11.8 11.9 12.1 12.3 12.9 13.5 13.8 14.1 14.7 *6–8 years . . . . . . . . . . . . . 229 12.8 0.8 0.059 * 11.8 12.0 12.1 12.3 12.7 13.1 13.4 13.7 14.1 *9–11 years . . . . . . . . . . . . . 267 12.9 1.3 0.084 * 11.8 11.9 12.1 12.4 12.7 13.3 13.6 13.8 14.1 *12–14 years . . . . . . . . . . . . 184 13.2 1.2 0.097 * * 12.3 12.4 12.6 13.0 13.5 14.1 14.3 * *15–19 years . . . . . . . . . . . . 298 12.9 0.7 0.045 * 11.9 12.1 12.2 12.4 12.8 13.3 13.6 13.9 14.2 *20–29 years . . . . . . . . . . . . 463 13.0 0.8 0.041 * 11.9 12.0 12.2 12.4 12.8 13.3 13.6 14.1 14.5 *30–39 years . . . . . . . . . . . . 461 13.3 1.3 0.065 * 12.0 12.2 12.4 12.6 13.1 13.7 14.1 14.5 15.2 *40–49 years . . . . . . . . . . . . 336 13.4 1.1 0.062 * 11.9 12.3 12.5 12.7 13.3 14.0 14.3 14.6 15.3 *50–59 years . . . . . . . . . . . . 207 13.8 1.5 0.107 * * 12.4 12.6 12.8 13.5 14.4 14.9 15.3 * *60–69 years . . . . . . . . . . . . 274 14.1 1.5 0.097 * 12.3 12.5 12.7 13.1 13.7 14.7 15.5 16.1 17.0 *70 years and over . . . . . . . . 220 14.2 1.4 0.097 * * 12.7 12.8 13.2 14.0 14.9 15.4 15.6 * *
Mexican American
1 year and over . . . . . . . . . . . 3,951 12.9 0.9 0.022 11.8 11.9 12.1 12.2 12.4 12.7 13.1 13.4 13.7 14.1 14.61–2 years . . . . . . . . . . . . . 298 13.6 1.7 0.118 * * 12.3 12.4 12.6 13.1 14.0 14.7 15.9 * *3–5 years . . . . . . . . . . . . . 466 12.8 0.9 0.050 * 11.8 11.9 12.1 12.3 12.7 13.1 13.4 13.7 14.2 *6–8 years . . . . . . . . . . . . . 250 12.6 0.5 0.040 * * 12.0 12.2 12.3 12.6 12.9 13.1 13.3 * *9–11 years . . . . . . . . . . . . . 272 12.6 0.9 0.065 * * 11.9 12.0 12.2 12.5 12.9 13.1 13.4 * *12–14 years . . . . . . . . . . . . 191 12.8 0.6 0.050 * * 12.2 12.3 12.4 12.8 13.1 13.4 13.6 * *15–19 years . . . . . . . . . . . . 304 12.8 0.6 0.043 * 12.0 12.1 12.3 12.4 12.8 13.1 13.3 13.6 13.8 *20–29 years . . . . . . . . . . . . 647 12.7 0.6 0.026 * 11.9 12.0 12.1 12.3 12.6 12.9 13.2 13.4 13.6 *30–39 years . . . . . . . . . . . . 450 12.8 0.6 0.033 * 12.0 12.1 12.2 12.4 12.7 13.1 13.3 13.4 13.8 *40–49 years . . . . . . . . . . . . 369 13.0 1.0 0.064 * 12.1 12.3 12.4 12.5 12.8 13.2 13.4 13.7 14.1 *50–59 years . . . . . . . . . . . . 175 13.2 1.0 0.091 * * 12.4 12.5 12.6 12.9 13.4 13.9 14.2 * *60–69 years . . . . . . . . . . . . 330 13.3 1.4 0.091 * 12.2 12.4 12.4 12.6 13.1 13.7 14.0 14.3 15.4 *70 years and over . . . . . . . . 199 13.6 1.2 0.103 * * 12.6 12.8 12.9 13.4 13.9 14.4 15.0 * *
* Does not meet standards for reliability or precision.1Includes all other race/ethnic groups not listed separately.
Page 38 [ Series 11, No. 247

Table 21. Red cell distribution width in percentages for females 1 year and over, number of examined persons, mean, standard deviation,standard error of the mean, and selected percentiles, by race/ethnicity and age: United States, 1988–94
Race/ethnicity and age
Number ofexaminedpersons Mean
Standarddeviation
Standarderror ofmean
Percentile
2.5th 5th 10th 15th 25th 50th 75th 85th 90th 95th 97.5th
All race/ethnic groups1
1 year and over . . . . . . . . . . . 13,749 12.9 1.0 0.019 11.6 11.8 11.9 12.1 12.3 12.7 13.3 13.6 14.0 14.6 15.41–2 years . . . . . . . . . . . . . 858 12.9 1.1 0.058 11.3 11.6 11.8 12.0 12.2 12.7 13.3 13.8 14.1 14.8 15.43–5 years . . . . . . . . . . . . . 1,337 12.4 0.8 0.032 11.3 11.4 11.6 11.8 11.9 12.3 12.8 13.0 13.3 13.6 14.36–8 years . . . . . . . . . . . . . 675 12.3 0.6 0.033 11.4 11.5 11.6 11.8 11.9 12.2 12.6 12.9 13.0 13.3 13.79–11 years . . . . . . . . . . . . . 734 12.4 0.6 0.036 11.4 11.5 11.6 11.8 11.9 12.3 12.8 13.0 13.2 13.4 13.912–14 years . . . . . . . . . . . . 621 12.6 0.8 0.051 11.6 11.8 11.9 11.9 12.1 12.4 12.9 13.3 13.4 13.9 14.815–19 years . . . . . . . . . . . . 950 12.7 0.9 0.043 11.6 11.8 11.9 12.0 12.2 12.6 13.1 13.4 13.7 14.2 15.120–29 years . . . . . . . . . . . . 1,769 12.8 0.9 0.032 11.6 11.8 11.9 12.1 12.3 12.6 13.0 13.4 13.7 14.3 15.130–39 years . . . . . . . . . . . . 1,757 12.9 1.1 0.038 11.6 11.8 12.0 12.1 12.3 12.7 13.3 13.6 14.0 14.7 15.640–49 years . . . . . . . . . . . . 1,303 13.1 1.3 0.053 11.8 11.9 12.1 12.3 12.4 12.8 13.4 13.8 14.2 15.0 16.250–59 years . . . . . . . . . . . . 969 13.1 1.0 0.047 11.9 12.0 12.1 12.2 12.4 12.9 13.4 13.8 14.1 14.6 15.560–69 years . . . . . . . . . . . . 1,112 13.2 1.0 0.046 11.7 11.9 12.1 12.3 12.5 13.0 13.6 13.9 14.4 15.2 15.570 years and over . . . . . . . . 1,664 13.4 1.0 0.038 12.0 12.1 12.3 12.4 12.7 13.2 13.8 14.2 14.5 15.2 15.9
Non-Hispanic white
1 year and over . . . . . . . . . . . 5,030 12.8 0.9 0.021 11.6 11.8 11.9 12.1 12.3 12.6 13.2 13.5 13.8 14.3 15.01–2 years . . . . . . . . . . . . . 270 12.8 1.0 0.068 * 11.6 11.8 11.9 12.1 12.6 13.2 13.6 13.9 14.4 *3–5 years . . . . . . . . . . . . . 332 12.2 0.6 0.036 * 11.4 11.6 11.7 11.8 12.2 12.6 12.8 12.9 13.3 *6–8 years . . . . . . . . . . . . . 175 12.2 0.5 0.042 * * 11.5 11.7 11.9 12.1 12.4 12.6 12.8 * *9–11 years . . . . . . . . . . . . . 186 12.3 0.6 0.050 * * 11.6 11.8 11.9 12.3 12.7 12.9 13.1 * *12–14 years . . . . . . . . . . . . 154 12.6 0.9 0.080 * * 11.8 11.9 12.1 12.4 12.9 13.2 13.4 * *15–19 years . . . . . . . . . . . . 270 12.6 0.7 0.051 * 11.8 11.8 11.9 12.1 12.4 12.8 13.1 13.3 13.9 *20–29 years . . . . . . . . . . . . 477 12.6 0.7 0.036 * 11.7 11.9 12.1 12.3 12.6 12.9 13.2 13.4 13.8 *30–39 years . . . . . . . . . . . . 572 12.7 0.8 0.037 * 11.8 11.9 12.1 12.2 12.6 13.1 13.4 13.6 14.1 *40–49 years . . . . . . . . . . . . 457 12.9 1.1 0.060 * 11.8 12.1 12.2 12.4 12.7 13.3 13.5 13.8 14.6 *50–59 years . . . . . . . . . . . . 473 13.0 0.9 0.046 * 11.9 12.1 12.2 12.4 12.8 13.3 13.6 13.9 14.3 *60–69 years . . . . . . . . . . . . 473 13.1 1.0 0.054 * 11.9 12.1 12.3 12.5 12.9 13.4 13.8 14.3 14.9 *70 years and over . . . . . . . . 1,191 13.3 1.0 0.034 * 12.1 12.3 12.4 12.6 13.1 13.7 14.1 14.4 14.9 *
Non-Hispanic black
1 year and over . . . . . . . . . . . 4,116 13.4 1.4 0.029 11.8 11.9 12.2 12.3 12.6 13.1 13.9 14.4 14.9 15.8 16.91–2 years . . . . . . . . . . . . . 265 13.2 1.1 0.076 * 11.9 12.1 12.3 12.4 13.0 13.8 14.1 14.6 15.3 *3–5 years . . . . . . . . . . . . . 433 12.7 0.9 0.049 * 11.6 11.8 11.9 12.1 12.6 13.1 13.4 13.9 14.4 *6–8 years . . . . . . . . . . . . . 220 12.7 0.7 0.051 * * 11.9 12.0 12.2 12.6 13.1 13.3 13.5 * *9–11 years . . . . . . . . . . . . . 252 12.7 0.8 0.058 * 11.8 11.9 12.0 12.3 12.6 13.1 13.4 13.6 14.3 *12–14 years . . . . . . . . . . . . 220 12.9 0.9 0.072 * * 12.1 12.1 12.3 12.7 13.1 13.5 13.9 * *15–19 years . . . . . . . . . . . . 326 13.4 1.2 0.078 * 12.1 12.2 12.4 12.6 13.2 13.8 14.5 15.0 15.8 *20–29 years . . . . . . . . . . . . 589 13.4 1.4 0.065 * 11.9 12.1 12.3 12.6 13.1 13.8 14.3 14.7 15.4 *30–39 years . . . . . . . . . . . . 602 13.5 1.5 0.068 * 12.1 12.3 12.4 12.7 13.1 13.9 14.4 15.0 16.1 *40–49 years . . . . . . . . . . . . 425 13.9 1.8 0.098 * 12.2 12.3 12.5 12.9 13.5 14.4 14.8 15.3 16.9 *50–59 years . . . . . . . . . . . . 256 13.7 1.4 0.099 * 12.3 12.4 12.6 12.8 13.4 14.2 14.7 15.1 15.9 *60–69 years . . . . . . . . . . . . 276 13.7 1.1 0.077 * 12.1 12.4 12.6 12.9 13.6 14.3 14.9 15.2 15.9 *70 years and over . . . . . . . . 252 14.0 1.3 0.092 * 12.4 12.8 13.0 13.2 13.8 14.6 15.0 15.5 16.1 *
Mexican American
1 year and over . . . . . . . . . . . 3,994 13.0 1.1 0.029 11.6 11.8 11.9 12.1 12.3 12.7 13.3 13.7 14.0 14.9 16.01–2 years . . . . . . . . . . . . . 285 13.1 1.5 0.107 * * 11.8 11.9 12.1 12.8 13.4 14.0 14.4 * *3–5 years . . . . . . . . . . . . . 506 12.6 0.8 0.044 * 11.6 11.7 11.8 12.0 12.4 12.9 13.2 13.5 14.0 *6–8 years . . . . . . . . . . . . . 257 12.5 0.6 0.044 * * 11.8 11.9 12.1 12.4 12.8 13.1 13.3 * *9–11 years . . . . . . . . . . . . . 265 12.5 0.7 0.049 * * 11.8 11.9 12.1 12.4 12.9 13.1 13.4 * *12–14 years . . . . . . . . . . . . 218 12.5 0.6 0.049 * * 11.8 11.9 12.1 12.6 12.9 13.1 13.3 * *15–19 years . . . . . . . . . . . . 297 12.9 1.1 0.079 * 11.9 12.1 12.1 12.3 12.7 13.2 13.7 13.9 15.2 *20–29 years . . . . . . . . . . . . 632 12.9 1.0 0.049 * 11.9 12.0 12.1 12.3 12.7 13.2 13.7 14.1 14.7 *30–39 years . . . . . . . . . . . . 504 13.2 1.3 0.070 * 11.9 12.1 12.3 12.4 12.9 13.5 13.9 14.4 15.6 *40–49 years . . . . . . . . . . . . 356 13.4 1.5 0.100 * 12.0 12.2 12.3 12.5 13.0 13.6 14.4 15.3 16.6 *50–59 years . . . . . . . . . . . . 185 13.2 1.2 0.110 * * 12.3 12.4 12.5 12.9 13.6 13.7 14.3 * *60–69 years . . . . . . . . . . . . 317 13.2 0.9 0.065 * 12.0 12.3 12.4 12.6 13.0 13.6 13.9 14.3 14.8 *70 years and over . . . . . . . . 172 13.6 1.3 0.119 * * 12.4 12.7 12.9 13.4 13.8 14.1 14.5 * *
* Does not meet standards for reliability or precision.1Includes all other race/ethnic groups not listed separately.
Series 11, No. 247 [ Page 39

Table 22. Platelet count as 109 cells per liter for persons 1 year and over, number of examined persons, mean, standard deviation, standarderror of the mean, and selected percentiles, by race/ethnicity and age: United States, 1988–94
Race/ethnicity and age
Number ofexaminedpersons Mean
Standarddeviation
Standarderror ofmean
Percentile
2.5th 5th 10th 15th 25th 50th 75th 85th 90th 95th 97.5th
All race/ethnic groups1
1 year and over . . . . . . . . . . . 26,367 283 74.0 1.804 165 181 200 213 232 275 323 353 376 414 4531–2 years . . . . . . . . . . . . . 1,788 370 93.2 4.544 238 249 267 280 304 358 422 478 502 546 5953–5 years . . . . . . . . . . . . . 2,618 352 78.9 3.178 225 240 261 275 301 345 396 426 450 489 5326–8 years . . . . . . . . . . . . . 1,384 336 75.9 4.206 225 235 250 265 285 327 375 409 427 462 5049–11 years . . . . . . . . . . . . . 1,507 316 65.4 3.473 214 225 238 249 269 311 354 384 408 434 46912–14 years . . . . . . . . . . . . 1,161 295 62.9 3.805 189 204 223 233 251 291 338 359 380 408 42615–19 years . . . . . . . . . . . . 1,785 279 60.7 2.963 180 196 210 220 237 273 314 339 353 386 41620–29 years . . . . . . . . . . . . 3,330 271 63.9 2.284 164 180 196 209 227 267 307 333 350 385 42030–39 years . . . . . . . . . . . . 3,158 274 66.7 2.445 169 184 199 211 228 265 313 341 365 394 42240–49 years . . . . . . . . . . . . 2,467 272 69.0 2.864 164 175 190 206 223 265 311 343 360 390 42350–59 years . . . . . . . . . . . . 1,802 275 70.3 3.414 161 180 196 210 231 269 310 340 358 395 43360–69 years . . . . . . . . . . . . 2,242 266 70.5 3.070 146 167 189 202 221 259 304 328 350 383 43070 years and over . . . . . . . . 3,125 259 76.6 2.824 143 157 177 187 208 248 298 330 352 392 440
Non-Hispanic white
1 year and over . . . . . . . . . . . 9,516 278 72.2 2.019 164 180 197 210 229 271 318 348 368 405 4421–2 years . . . . . . . . . . . . . 566 370 90.6 5.465 * 249 266 277 303 357 415 472 495 540 *3–5 years . . . . . . . . . . . . . 655 346 76.7 4.300 * 240 260 273 295 339 389 416 443 478 *6–8 years . . . . . . . . . . . . . 365 336 77.3 5.810 * 235 250 265 284 327 375 410 426 462 *9–11 years . . . . . . . . . . . . . 386 311 64.2 4.689 * 225 235 247 266 306 345 378 394 428 *12–14 years . . . . . . . . . . . . 293 292 62.1 5.208 * * 219 231 248 289 335 356 375 * *15–19 years . . . . . . . . . . . . 464 275 58.1 3.873 * 197 209 219 236 271 311 333 350 373 *20–29 years . . . . . . . . . . . . 857 268 62.3 3.056 * 180 195 206 224 265 306 331 349 376 *30–39 years . . . . . . . . . . . . 1,007 269 64.5 2.916 * 185 198 210 225 261 302 336 356 389 *40–49 years . . . . . . . . . . . . 871 269 66.9 3.252 * 175 187 205 222 263 306 335 355 379 *50–59 years . . . . . . . . . . . . 883 277 68.8 3.324 * 180 197 211 232 271 311 339 358 395 *60–69 years . . . . . . . . . . . . 966 265 70.8 3.270 * 167 188 202 221 257 303 328 349 380 *70 years and over . . . . . . . . 2,203 259 76.6 2.342 * 156 176 187 207 248 298 332 353 394 *
Non-Hispanic black
1 year and over . . . . . . . . . . . 7,749 298 80.9 1.748 168 186 205 220 244 290 342 375 400 440 4811–2 years . . . . . . . . . . . . . 540 391 96.4 5.549 * 257 281 295 322 378 446 497 522 568 *3–5 years . . . . . . . . . . . . . 852 365 88.1 4.036 * 245 269 284 307 350 411 448 474 528 *6–8 years . . . . . . . . . . . . . 449 341 73.2 4.622 * 233 252 268 291 338 384 408 426 469 *9–11 years . . . . . . . . . . . . . 519 331 67.2 3.946 * 230 250 265 285 329 370 398 418 455 *12–14 years . . . . . . . . . . . . 404 306 64.0 4.259 * 206 234 248 265 303 341 372 395 416 *15–19 years . . . . . . . . . . . . 624 293 68.1 3.645 * 196 208 223 244 290 330 363 384 413 *20–29 years . . . . . . . . . . . . 1,052 285 73.2 3.021 * 179 200 214 237 277 322 353 373 418 *30–39 years . . . . . . . . . . . . 1,063 284 72.8 2.986 * 178 197 210 232 279 328 356 376 411 *40–49 years . . . . . . . . . . . . 761 285 75.6 3.668 * 183 200 214 234 276 331 360 384 428 *50–59 years . . . . . . . . . . . . 463 276 75.9 4.718 * 180 199 208 230 268 306 337 358 403 *60–69 years . . . . . . . . . . . . 550 273 74.0 4.222 * 164 186 204 225 268 313 345 370 400 *70 years and over . . . . . . . . 472 264 83.1 5.115 * 166 182 192 208 256 301 329 350 392 *
Mexican American
1 year and over . . . . . . . . . . . 7,945 298 79.5 2.506 174 188 208 222 245 289 344 375 399 441 4791–2 years . . . . . . . . . . . . . 583 385 102.8 6.826 * 254 271 284 310 370 446 487 513 575 *3–5 years . . . . . . . . . . . . . 972 351 84.7 4.355 * 228 247 265 289 346 401 439 462 506 *6–8 years . . . . . . . . . . . . . 507 349 74.9 5.330 * 246 255 277 298 343 393 429 452 479 *9–11 years . . . . . . . . . . . . . 537 328 69.1 4.777 * 239 251 258 277 319 369 402 421 459 *12–14 years . . . . . . . . . . . . 409 312 70.2 5.565 * 220 231 241 263 303 353 383 409 443 *15–19 years . . . . . . . . . . . . 601 287 68.6 4.485 * 188 209 222 242 280 325 359 375 402 *20–29 years . . . . . . . . . . . . 1,279 279 66.5 2.980 * 182 200 214 234 270 320 345 364 390 *30–39 years . . . . . . . . . . . . 954 283 69.5 3.606 * 183 205 217 235 274 325 349 375 404 *40–49 years . . . . . . . . . . . . 725 283 74.5 4.435 * 183 197 205 233 276 331 351 374 414 *50–59 years . . . . . . . . . . . . 360 277 77.6 6.555 * 169 187 197 226 273 317 357 381 419 *60–69 years . . . . . . . . . . . . 647 266 70.0 4.410 * 171 189 199 213 260 310 338 354 388 *70 years and over . . . . . . . . 371 261 71.1 5.914 * 168 181 192 211 252 302 335 349 378 *
* Does not meet standards for reliability or precision.1Includes all other race/ethnic groups not listed separately.
Page 40 [ Series 11, No. 247
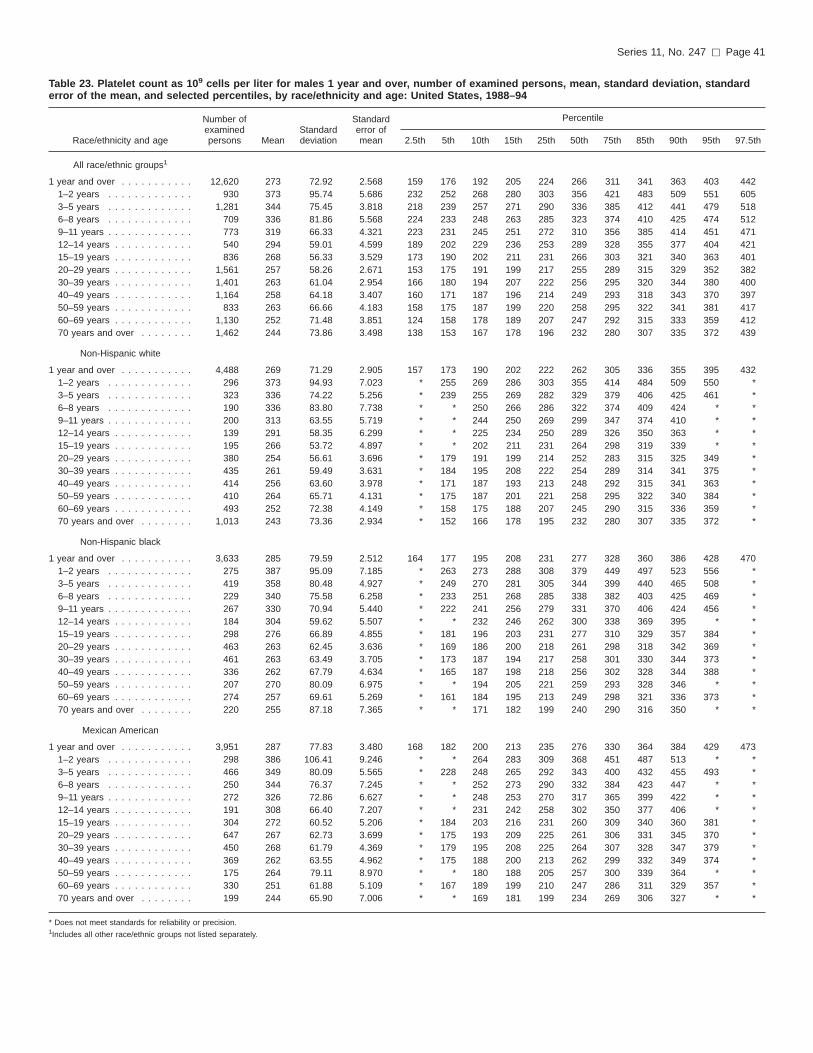
Table 23. Platelet count as 109 cells per liter for males 1 year and over, number of examined persons, mean, standard deviation, standarderror of the mean, and selected percentiles, by race/ethnicity and age: United States, 1988–94
Race/ethnicity and age
Number ofexaminedpersons Mean
Standarddeviation
Standarderror ofmean
Percentile
2.5th 5th 10th 15th 25th 50th 75th 85th 90th 95th 97.5th
All race/ethnic groups1
1 year and over . . . . . . . . . . . 12,620 273 72.92 2.568 159 176 192 205 224 266 311 341 363 403 4421–2 years . . . . . . . . . . . . . 930 373 95.74 5.686 232 252 268 280 303 356 421 483 509 551 6053–5 years . . . . . . . . . . . . . 1,281 344 75.45 3.818 218 239 257 271 290 336 385 412 441 479 5186–8 years . . . . . . . . . . . . . 709 336 81.86 5.568 224 233 248 263 285 323 374 410 425 474 5129–11 years . . . . . . . . . . . . . 773 319 66.33 4.321 223 231 245 251 272 310 356 385 414 451 47112–14 years . . . . . . . . . . . . 540 294 59.01 4.599 189 202 229 236 253 289 328 355 377 404 42115–19 years . . . . . . . . . . . . 836 268 56.33 3.529 173 190 202 211 231 266 303 321 340 363 40120–29 years . . . . . . . . . . . . 1,561 257 58.26 2.671 153 175 191 199 217 255 289 315 329 352 38230–39 years . . . . . . . . . . . . 1,401 263 61.04 2.954 166 180 194 207 222 256 295 320 344 380 40040–49 years . . . . . . . . . . . . 1,164 258 64.18 3.407 160 171 187 196 214 249 293 318 343 370 39750–59 years . . . . . . . . . . . . 833 263 66.66 4.183 158 175 187 199 220 258 295 322 341 381 41760–69 years . . . . . . . . . . . . 1,130 252 71.48 3.851 124 158 178 189 207 247 292 315 333 359 41270 years and over . . . . . . . . 1,462 244 73.86 3.498 138 153 167 178 196 232 280 307 335 372 439
Non-Hispanic white
1 year and over . . . . . . . . . . . 4,488 269 71.29 2.905 157 173 190 202 222 262 305 336 355 395 4321–2 years . . . . . . . . . . . . . 296 373 94.93 7.023 * 255 269 286 303 355 414 484 509 550 *3–5 years . . . . . . . . . . . . . 323 336 74.22 5.256 * 239 255 269 282 329 379 406 425 461 *6–8 years . . . . . . . . . . . . . 190 336 83.80 7.738 * * 250 266 286 322 374 409 424 * *9–11 years . . . . . . . . . . . . . 200 313 63.55 5.719 * * 244 250 269 299 347 374 410 * *12–14 years . . . . . . . . . . . . 139 291 58.35 6.299 * * 225 234 250 289 326 350 363 * *15–19 years . . . . . . . . . . . . 195 266 53.72 4.897 * * 202 211 231 264 298 319 339 * *20–29 years . . . . . . . . . . . . 380 254 56.61 3.696 * 179 191 199 214 252 283 315 325 349 *30–39 years . . . . . . . . . . . . 435 261 59.49 3.631 * 184 195 208 222 254 289 314 341 375 *40–49 years . . . . . . . . . . . . 414 256 63.60 3.978 * 171 187 193 213 248 292 315 341 363 *50–59 years . . . . . . . . . . . . 410 264 65.71 4.131 * 175 187 201 221 258 295 322 340 384 *60–69 years . . . . . . . . . . . . 493 252 72.38 4.149 * 158 175 188 207 245 290 315 336 359 *70 years and over . . . . . . . . 1,013 243 73.36 2.934 * 152 166 178 195 232 280 307 335 372 *
Non-Hispanic black
1 year and over . . . . . . . . . . . 3,633 285 79.59 2.512 164 177 195 208 231 277 328 360 386 428 4701–2 years . . . . . . . . . . . . . 275 387 95.09 7.185 * 263 273 288 308 379 449 497 523 556 *3–5 years . . . . . . . . . . . . . 419 358 80.48 4.927 * 249 270 281 305 344 399 440 465 508 *6–8 years . . . . . . . . . . . . . 229 340 75.58 6.258 * 233 251 268 285 338 382 403 425 469 *9–11 years . . . . . . . . . . . . . 267 330 70.94 5.440 * 222 241 256 279 331 370 406 424 456 *12–14 years . . . . . . . . . . . . 184 304 59.62 5.507 * * 232 246 262 300 338 369 395 * *15–19 years . . . . . . . . . . . . 298 276 66.89 4.855 * 181 196 203 231 277 310 329 357 384 *20–29 years . . . . . . . . . . . . 463 263 62.45 3.636 * 169 186 200 218 261 298 318 342 369 *30–39 years . . . . . . . . . . . . 461 263 63.49 3.705 * 173 187 194 217 258 301 330 344 373 *40–49 years . . . . . . . . . . . . 336 262 67.79 4.634 * 165 187 198 218 256 302 328 344 388 *50–59 years . . . . . . . . . . . . 207 270 80.09 6.975 * * 194 205 221 259 293 328 346 * *60–69 years . . . . . . . . . . . . 274 257 69.61 5.269 * 161 184 195 213 249 298 321 336 373 *70 years and over . . . . . . . . 220 255 87.18 7.365 * * 171 182 199 240 290 316 350 * *
Mexican American
1 year and over . . . . . . . . . . . 3,951 287 77.83 3.480 168 182 200 213 235 276 330 364 384 429 4731–2 years . . . . . . . . . . . . . 298 386 106.41 9.246 * * 264 283 309 368 451 487 513 * *3–5 years . . . . . . . . . . . . . 466 349 80.09 5.565 * 228 248 265 292 343 400 432 455 493 *6–8 years . . . . . . . . . . . . . 250 344 76.37 7.245 * * 252 273 290 332 384 423 447 * *9–11 years . . . . . . . . . . . . . 272 326 72.86 6.627 * * 248 253 270 317 365 399 422 * *12–14 years . . . . . . . . . . . . 191 308 66.40 7.207 * * 231 242 258 302 350 377 406 * *15–19 years . . . . . . . . . . . . 304 272 60.52 5.206 * 184 203 216 231 260 309 340 360 381 *20–29 years . . . . . . . . . . . . 647 267 62.73 3.699 * 175 193 209 225 261 306 331 345 370 *30–39 years . . . . . . . . . . . . 450 268 61.79 4.369 * 179 195 208 225 264 307 328 347 379 *40–49 years . . . . . . . . . . . . 369 262 63.55 4.962 * 175 188 200 213 262 299 332 349 374 *50–59 years . . . . . . . . . . . . 175 264 79.11 8.970 * * 180 188 205 257 300 339 364 * *60–69 years . . . . . . . . . . . . 330 251 61.88 5.109 * 167 189 199 210 247 286 311 329 357 *70 years and over . . . . . . . . 199 244 65.90 7.006 * * 169 181 199 234 269 306 327 * *
* Does not meet standards for reliability or precision.1Includes all other race/ethnic groups not listed separately.
Series 11, No. 247 [ Page 41

Table 24. Platelet count as 109 cells per liter for females 1 year and over, number of examined persons, mean, standard deviation, standarderror of the mean, and selected percentiles, by race/ethnicity and age: United States, 1988–94
Race/ethnicity and age
Number ofexaminedpersons Mean
Standarddeviation
Standarderror ofmean
Percentile
2.5th 5th 10th 15th 25th 50th 75th 85th 90th 95th 97.5th
All race/ethnic groups1
1 year and over . . . . . . . . . . . 13,747 292.0 73.97 2.496 172 188 208 221 240 284 334 363 385 421 4601–2 years . . . . . . . . . . . . . 858 374.0 90.25 5.554 241 248 264 277 306 366 425 472 496 539 5883–5 years . . . . . . . . . . . . . 1,337 361.0 81.37 4.012 231 242 266 283 307 353 410 438 463 503 5526–8 years . . . . . . . . . . . . . 675 336.0 68.37 4.744 228 241 256 266 285 331 376 408 430 461 4839–11 years . . . . . . . . . . . . . 734 314.0 64.35 4.282 210 218 233 247 266 313 351 383 395 430 45712–14 years . . . . . . . . . . . . 621 297.0 66.92 4.841 188 207 221 228 249 291 344 370 380 413 44315–19 years . . . . . . . . . . . . 949 289.0 62.96 3.684 192 203 219 230 244 282 324 351 367 401 42820–29 years . . . . . . . . . . . . 1,769 284.0 66.39 2.846 172 186 208 218 237 279 324 350 370 398 44230–39 years . . . . . . . . . . . . 1,757 284.0 70.16 3.018 174 187 205 215 233 276 328 356 378 406 43240–49 years . . . . . . . . . . . . 1,303 285.0 70.78 3.535 169 182 204 220 236 277 327 358 371 406 43950–59 years . . . . . . . . . . . . 969 287.0 71.74 4.155 175 190 207 223 240 281 324 350 369 406 45960–69 years . . . . . . . . . . . . 1,112 277.0 67.55 3.652 165 182 203 214 233 270 313 339 361 399 43770 years and over . . . . . . . . 1,663 269.0 76.76 3.394 145 166 184 200 217 261 310 341 361 404 441
Non-Hispanic white
1 year and over . . . . . . . . . . . 5,028 287.0 71.89 2.767 170 186 207 219 237 280 329 358 377 413 4501–2 years . . . . . . . . . . . . . 270 368.0 85.32 6.710 * 244 263 273 301 363 418 460 485 528 *3–5 years . . . . . . . . . . . . . 332 358.0 77.66 5.508 * 245 268 283 307 352 407 426 448 494 *6–8 years . . . . . . . . . . . . . 175 335.0 68.84 6.725 * * 255 264 284 331 376 418 431 * *9–11 years . . . . . . . . . . . . . 186 309.0 64.73 6.133 * * 227 238 256 307 344 380 390 * *12–14 years . . . . . . . . . . . . 154 293.0 66.42 6.916 * * 218 226 247 289 344 363 378 * *15–19 years . . . . . . . . . . . . 269 285.0 60.76 4.788 * 203 219 228 242 281 318 342 352 392 *20–29 years . . . . . . . . . . . . 477 281.0 64.73 3.830 * 183 206 216 234 277 320 349 365 395 *30–39 years . . . . . . . . . . . . 572 278.0 68.04 3.677 * 186 202 211 229 271 320 348 371 394 *40–49 years . . . . . . . . . . . . 457 282.0 67.58 4.085 * 180 205 220 234 275 323 352 366 392 *50–59 years . . . . . . . . . . . . 473 288.0 69.52 4.131 * 194 209 223 241 283 325 347 368 402 *60–69 years . . . . . . . . . . . . 473 277.0 67.19 3.993 * 182 205 215 233 270 312 336 359 395 *70 years and over . . . . . . . . 1,190 269.0 76.93 2.882 * 165 184 200 217 261 312 343 363 410 *
Non-Hispanic black
1 year and over . . . . . . . . . . . 4,116 309.0 80.33 2.382 178 198 217 233 256 301 352 386 408 449 4901–2 years . . . . . . . . . . . . . 265 395.0 97.52 7.337 * 254 292 302 329 377 441 497 521 591 *3–5 years . . . . . . . . . . . . . 433 372.0 94.66 5.571 * 241 269 292 313 358 419 458 495 565 *6–8 years . . . . . . . . . . . . . 220 342.0 70.76 5.843 * * 252 273 295 339 387 415 430 * *9–11 years . . . . . . . . . . . . . 252 332.0 63.13 4.871 * 242 259 271 289 326 370 395 413 455 *12–14 years . . . . . . . . . . . . 220 309.0 67.41 5.567 * * 235 249 267 305 343 372 393 * *15–19 years . . . . . . . . . . . . 326 311.0 64.73 4.391 * 214 225 241 262 307 354 384 402 430 *20–29 years . . . . . . . . . . . . 589 303.0 76.53 3.862 * 197 217 236 253 295 344 372 397 440 *30–39 years . . . . . . . . . . . . 602 301.0 75.29 3.758 * 197 211 226 252 297 347 375 400 434 *40–49 years . . . . . . . . . . . . 425 303.0 76.61 4.551 * 198 217 231 248 295 351 379 403 439 *50–59 years . . . . . . . . . . . . 256 282.0 71.80 5.496 * 194 203 216 236 278 322 343 366 403 *60–69 years . . . . . . . . . . . . 276 284.0 75.02 5.531 * 170 200 219 238 280 317 355 389 424 *70 years and over . . . . . . . . 252 269.0 79.85 6.161 * 173 187 198 219 264 305 330 348 375 *
Mexican American
1 year and over . . . . . . . . . . . 3,994 311.0 79.35 3.529 182 197 221 235 257 303 357 388 411 450 4871–2 years . . . . . . . . . . . . . 285 384.0 98.77 7.739 * * 274 284 310 375 441 487 509 * *3–5 years . . . . . . . . . . . . . 506 354.0 88.95 5.231 * 228 242 267 285 350 403 445 473 520 *6–8 years . . . . . . . . . . . . . 257 354.0 73.06 6.029 * * 262 284 303 351 393 436 452 * *9–11 years . . . . . . . . . . . . . 265 331.0 64.24 5.220 * * 256 268 287 321 371 404 418 * *12–14 years . . . . . . . . . . . . 218 315.0 73.13 6.552 * * 234 241 267 303 359 385 409 * *15–19 years . . . . . . . . . . . . 297 302.0 73.33 5.629 * 203 224 233 256 293 343 372 396 425 *20–29 years . . . . . . . . . . . . 632 293.0 68.13 3.585 * 195 215 229 249 285 338 362 376 411 *30–39 years . . . . . . . . . . . . 504 300.0 73.42 4.326 * 199 217 227 244 297 342 375 399 422 *40–49 years . . . . . . . . . . . . 356 305.0 78.67 5.515 * 195 211 231 252 302 344 374 406 448 *50–59 years . . . . . . . . . . . . 185 289.0 74.06 7.203 * * 199 216 246 279 340 370 394 * *60–69 years . . . . . . . . . . . . 317 277.0 73.70 5.476 * 177 190 196 220 271 328 354 376 400 *70 years and over . . . . . . . . 172 278.0 71.91 7.253 * * 193 205 228 274 327 348 362 * *
* Does not meet standards for reliability or precision.1Includes all other race/ethnic groups not listed separately.
Page 42 [ Series 11, No. 247

Table 25. Mean platelet volume in femtoliter for persons 1 year and over, number of examined persons, mean, standard deviation, standarderror of the mean, and selected percentiles, by race/ethnicity and age: United States, 1988–94
Race/ethnicity and age
Number ofexaminedpersons Mean
Standarddeviation
Standarderror ofmean
Percentile
2.5th 5th 10th 15th 25th 50th 75th 85th 90th 95th 97.5th
All race/ethnic groups1
1 year and over . . . . . . . . . . . 26,373 8.3 1.0 0.020 6.7 6.9 7.2 7.3 7.7 8.2 8.9 9.3 9.6 10.0 10.41–2 years . . . . . . . . . . . . . 1,789 7.4 0.7 0.032 6.2 6.3 6.5 6.7 6.9 7.3 7.8 8.1 8.3 8.6 8.93–5 years . . . . . . . . . . . . . 2,619 7.7 1.0 0.037 6.4 6.6 6.8 6.9 7.1 7.6 8.1 8.4 8.6 9.0 9.36–8 years . . . . . . . . . . . . . 1,384 7.9 0.8 0.039 6.6 6.8 6.9 7.1 7.3 7.8 8.4 8.7 8.9 9.3 9.69–11 years . . . . . . . . . . . . . 1,507 8.1 0.8 0.040 6.7 6.9 7.1 7.3 7.5 8.1 8.6 8.9 9.1 9.5 9.812–14 years . . . . . . . . . . . . 1,161 8.1 0.9 0.048 6.5 6.8 7.0 7.2 7.4 8.0 8.6 8.9 9.1 9.6 10.115–19 years . . . . . . . . . . . . 1,786 8.3 0.9 0.041 6.8 6.9 7.2 7.3 7.7 8.2 8.8 9.1 9.5 10.0 10.420–29 years . . . . . . . . . . . . 3,331 8.4 1.0 0.031 6.8 7.1 7.3 7.5 7.8 8.3 8.9 9.4 9.7 10.1 10.430–39 years . . . . . . . . . . . . 3,158 8.4 0.9 0.030 6.8 7.0 7.3 7.5 7.8 8.3 8.9 9.3 9.6 10.0 10.340–49 years . . . . . . . . . . . . 2,467 8.5 1.0 0.037 6.8 7.1 7.3 7.6 7.8 8.4 9.1 9.5 9.8 10.3 10.750–59 years . . . . . . . . . . . . 1,802 8.4 1.0 0.043 6.8 7.1 7.3 7.4 7.8 8.4 9.0 9.4 9.7 10.1 10.560–69 years . . . . . . . . . . . . 2,242 8.5 1.3 0.050 6.8 7.0 7.3 7.4 7.8 8.4 9.0 9.4 9.7 10.2 10.870 years and over . . . . . . . . 3,127 8.4 1.0 0.034 6.7 6.9 7.2 7.4 7.7 8.3 9.0 9.4 9.7 10.1 10.6
Non-Hispanic white
1 year and over . . . . . . . . . . . 9,523 8.3 1.0 0.024 6.7 6.9 7.2 7.4 7.7 8.2 8.9 9.3 9.5 9.9 10.41–2 years . . . . . . . . . . . . . 567 7.4 0.7 0.041 * 6.4 6.5 6.7 6.8 7.3 7.8 8.1 8.3 8.6 *3–5 years . . . . . . . . . . . . . 656 7.6 1.1 0.060 * 6.5 6.8 6.9 7.1 7.6 8.1 8.4 8.6 8.9 *6–8 years . . . . . . . . . . . . . 365 7.9 0.8 0.053 * 6.8 6.9 7.1 7.3 7.8 8.3 8.7 8.9 9.3 *9–11 years . . . . . . . . . . . . . 386 8.1 0.8 0.054 * 6.9 7.2 7.3 7.5 8.1 8.6 9.0 9.2 9.5 *12–14 years . . . . . . . . . . . . 293 8.1 0.9 0.069 * * 7.0 7.3 7.5 8.1 8.6 8.9 9.1 * *15–19 years . . . . . . . . . . . . 465 8.3 0.9 0.058 * 6.9 7.2 7.4 7.7 8.2 8.8 9.1 9.4 9.9 *20–29 years . . . . . . . . . . . . 858 8.4 1.0 0.043 * 7.1 7.3 7.5 7.8 8.3 8.9 9.3 9.6 10.0 *30–39 years . . . . . . . . . . . . 1,007 8.4 0.9 0.037 * 7.1 7.3 7.5 7.8 8.3 8.9 9.2 9.4 9.9 *40–49 years . . . . . . . . . . . . 871 8.5 1.0 0.044 * 7.1 7.3 7.6 7.8 8.4 9.1 9.5 9.7 10.2 *50–59 years . . . . . . . . . . . . 883 8.4 0.9 0.043 * 7.0 7.3 7.4 7.8 8.3 9.0 9.3 9.6 10.0 *60–69 years . . . . . . . . . . . . 967 8.4 1.3 0.056 * 7.0 7.3 7.4 7.7 8.3 9.0 9.4 9.6 10.1 *70 years and over . . . . . . . . 2,205 8.4 1.0 0.028 * 6.9 7.2 7.4 7.7 8.3 9.0 9.4 9.7 10.1 *
Non-Hispanic black
1 year and over . . . . . . . . . . . 7,749 8.4 1.0 0.023 6.7 6.9 7.2 7.4 7.7 8.3 9.0 9.4 9.7 10.2 10.61–2 years . . . . . . . . . . . . . 540 7.5 0.7 0.042 * 6.5 6.6 6.7 7.0 7.4 7.9 8.3 8.4 8.8 *3–5 years . . . . . . . . . . . . . 852 7.8 0.9 0.039 * 6.7 6.8 7.0 7.3 7.7 8.3 8.8 9.0 9.3 *6–8 years . . . . . . . . . . . . . 449 8.0 0.8 0.052 * 6.8 7.0 7.2 7.4 7.9 8.5 8.8 9.0 9.6 *9–11 years . . . . . . . . . . . . . 519 8.2 0.8 0.049 * 6.8 7.2 7.3 7.7 8.1 8.7 8.9 9.2 9.6 *12–14 years . . . . . . . . . . . . 404 8.1 0.9 0.059 * 6.8 7.1 7.3 7.5 8.0 8.8 9.1 9.2 9.6 *15–19 years . . . . . . . . . . . . 624 8.4 0.9 0.048 * 7.0 7.4 7.5 7.8 8.4 8.9 9.3 9.5 9.8 *20–29 years . . . . . . . . . . . . 1,052 8.5 1.0 0.041 * 7.2 7.4 7.6 7.8 8.4 9.1 9.5 9.8 10.2 *30–39 years . . . . . . . . . . . . 1,063 8.5 1.0 0.041 * 7.1 7.3 7.5 7.8 8.4 9.2 9.6 9.9 10.3 *40–49 years . . . . . . . . . . . . 761 8.6 1.0 0.047 * 7.1 7.4 7.6 7.9 8.5 9.1 9.5 9.8 10.2 *50–59 years . . . . . . . . . . . . 463 8.7 1.0 0.065 * 7.2 7.4 7.7 8.0 8.6 9.3 9.8 10.1 10.5 *60–69 years . . . . . . . . . . . . 550 8.6 1.0 0.058 * 7.1 7.3 7.5 7.8 8.5 9.1 9.5 9.9 10.5 *70 years and over . . . . . . . . 472 8.6 1.2 0.073 * 7.0 7.3 7.5 7.7 8.4 9.1 9.7 10.1 10.5 *
Mexican American
1 year and over . . . . . . . . . . . 7,944 8.3 1.0 0.029 6.6 6.8 7.1 7.3 7.6 8.2 8.9 9.3 9.5 9.9 10.41–2 years . . . . . . . . . . . . . 583 7.3 0.7 0.044 * 6.3 6.5 6.6 6.8 7.3 7.8 8.0 8.3 8.5 *3–5 years . . . . . . . . . . . . . 972 7.7 0.8 0.039 * 6.6 6.8 6.9 7.2 7.6 8.2 8.5 8.8 9.2 *6–8 years . . . . . . . . . . . . . 507 7.9 0.8 0.053 * 6.7 7.0 7.1 7.3 7.8 8.3 8.7 9.0 9.4 *9–11 years . . . . . . . . . . . . . 537 8.2 1.0 0.064 * 6.9 7.2 7.3 7.6 8.0 8.7 9.1 9.4 9.8 *12–14 years . . . . . . . . . . . . 409 8.1 0.9 0.068 * 6.8 7.0 7.2 7.6 8.1 8.6 8.9 9.1 9.4 *15–19 years . . . . . . . . . . . . 601 8.3 0.9 0.058 * 6.9 7.2 7.3 7.6 8.2 8.8 9.3 9.6 10.0 *20–29 years . . . . . . . . . . . . 1,279 8.4 0.9 0.039 * 7.0 7.3 7.5 7.8 8.3 8.9 9.4 9.6 10.1 *30–39 years . . . . . . . . . . . . 954 8.5 1.0 0.047 * 7.1 7.3 7.5 7.8 8.4 9.1 9.5 9.8 10.0 *40–49 years . . . . . . . . . . . . 725 8.6 1.0 0.058 * 7.2 7.5 7.7 7.9 8.5 9.1 9.5 9.8 10.3 *50–59 years . . . . . . . . . . . . 360 8.6 1.1 0.090 * 7.2 7.3 7.5 7.8 8.4 9.2 9.6 9.9 10.6 *60–69 years . . . . . . . . . . . . 646 8.6 1.0 0.058 * 7.0 7.3 7.5 7.9 8.6 9.1 9.4 9.7 10.3 *70 years and over . . . . . . . . 371 8.3 1.0 0.076 * 7.0 7.2 7.4 7.7 8.3 8.9 9.2 9.5 9.9 *
* Does not meet standards for reliability or precision.1Includes all other race/ethnic groups not listed separately.
Series 11, No. 247 [ Page 43

Table 26. Mean platelet volume in femtoliter for males 1 year and over, number of examined persons, mean, standard deviation, standarderror of the mean, and selected percentiles, by race/ethnicity and age: United States, 1988–94
Race/ethnicity and age
Number ofexaminedpersons Mean
Standarddeviation
Standarderror ofmean
Percentile
2.5th 5th 10th 15th 25th 50th 75th 85th 90th 95th 97.5th
All race/ethnic groups1
1 year and over . . . . . . . . . . . 12,624 8.3 1.0 0.030 6.6 6.9 7.2 7.3 7.6 8.2 8.8 9.2 9.4 9.9 10.31–2 years . . . . . . . . . . . . . 931 7.4 0.7 0.037 6.3 6.4 6.5 6.7 6.9 7.3 7.8 8.1 8.3 8.6 8.93–5 years . . . . . . . . . . . . . 1,282 7.7 1.2 0.055 6.4 6.6 6.8 6.9 7.2 7.7 8.1 8.4 8.7 9.1 9.36–8 years . . . . . . . . . . . . . 709 7.9 0.7 0.045 6.6 6.8 7.0 7.1 7.3 7.8 8.3 8.6 8.9 9.2 9.59–11 years . . . . . . . . . . . . . 773 8.1 0.8 0.049 6.6 6.8 7.1 7.3 7.5 8.1 8.6 8.9 9.1 9.4 9.712–14 years . . . . . . . . . . . . 540 8.0 0.8 0.058 6.5 6.8 7.0 7.2 7.5 8.0 8.6 8.9 9.1 9.3 9.715–19 years . . . . . . . . . . . . 836 8.2 0.9 0.050 6.8 6.8 7.1 7.3 7.6 8.2 8.7 9.0 9.3 9.7 10.120–29 years . . . . . . . . . . . . 1,562 8.4 1.0 0.040 6.8 7.0 7.3 7.5 7.8 8.3 9.0 9.4 9.8 10.1 10.530–39 years . . . . . . . . . . . . 1,401 8.3 0.9 0.038 6.8 6.9 7.3 7.5 7.7 8.3 8.8 9.1 9.4 9.8 10.240–49 years . . . . . . . . . . . . 1,164 8.5 1.0 0.048 6.9 7.1 7.3 7.5 7.8 8.4 9.1 9.4 9.7 10.2 10.750–59 years . . . . . . . . . . . . 833 8.3 1.0 0.055 6.7 6.9 7.2 7.3 7.7 8.3 8.9 9.3 9.5 10.1 10.360–69 years . . . . . . . . . . . . 1,130 8.4 1.5 0.074 6.8 7.0 7.3 7.4 7.7 8.3 8.9 9.3 9.6 10.0 10.670 years and over . . . . . . . . 1,463 8.3 1.0 0.042 6.7 6.9 7.1 7.3 7.7 8.3 8.9 9.3 9.6 10.1 10.5
Non-Hispanic white
1 year and over . . . . . . . . . . . 4,493 8.3 1.0 0.036 6.7 6.9 7.2 7.3 7.7 8.2 8.8 9.2 9.4 9.9 10.31–2 years . . . . . . . . . . . . . 297 7.3 0.7 0.046 * 6.4 6.5 6.7 6.8 7.3 7.8 8.1 8.3 8.6 *3–5 years . . . . . . . . . . . . . 324 7.7 1.4 0.093 * 6.6 6.8 6.9 7.2 7.6 8.1 8.4 8.6 8.9 *6–8 years . . . . . . . . . . . . . 190 7.9 0.7 0.061 * * 6.9 7.1 7.3 7.8 8.3 8.6 8.8 * *9–11 years . . . . . . . . . . . . . 200 8.1 0.8 0.066 * * 7.1 7.3 7.5 8.1 8.6 8.9 9.1 * *12–14 years . . . . . . . . . . . . 139 8.1 0.8 0.080 * * 7.0 7.3 7.6 8.1 8.6 8.9 9.1 * *15–19 years . . . . . . . . . . . . 195 8.2 0.9 0.073 * * 7.1 7.3 7.7 8.2 8.7 8.9 9.1 * *20–29 years . . . . . . . . . . . . 381 8.4 0.9 0.057 * 7.0 7.3 7.5 7.8 8.3 8.9 9.3 9.7 10.0 *30–39 years . . . . . . . . . . . . 435 8.3 0.9 0.048 * 7.0 7.3 7.5 7.7 8.3 8.8 9.1 9.3 9.7 *40–49 years . . . . . . . . . . . . 414 8.5 1.0 0.059 * 7.1 7.3 7.5 7.8 8.4 9.1 9.4 9.7 10.3 *50–59 years . . . . . . . . . . . . 410 8.3 1.0 0.057 * 6.9 7.2 7.3 7.7 8.2 8.9 9.3 9.7 10.1 *60–69 years . . . . . . . . . . . . 494 8.4 1.6 0.086 * 7.0 7.3 7.3 7.6 8.3 8.9 9.3 9.6 10.0 *70 years and over . . . . . . . . 1,014 8.3 1.0 0.036 * 6.9 7.1 7.3 7.7 8.3 8.9 9.3 9.6 10.1 *
Non-Hispanic black
1 year and over . . . . . . . . . . . 3,633 8.3 1.0 0.033 6.7 6.9 7.2 7.4 7.7 8.3 8.9 9.3 9.6 10.1 10.41–2 years . . . . . . . . . . . . . 275 7.5 0.8 0.056 * 6.4 6.6 6.8 7.0 7.5 8.0 8.3 8.4 8.8 *3–5 years . . . . . . . . . . . . . 419 7.8 0.8 0.049 * 6.7 6.8 7.0 7.3 7.8 8.3 8.8 9.0 9.2 *6–8 years . . . . . . . . . . . . . 229 8.0 0.8 0.067 * 6.8 7.0 7.2 7.4 7.9 8.5 8.8 9.1 9.6 *9–11 years . . . . . . . . . . . . . 267 8.2 0.9 0.068 * 6.8 7.2 7.3 7.6 8.1 8.7 9.0 9.3 9.7 *12–14 years . . . . . . . . . . . . 184 8.1 0.9 0.079 * * 7.1 7.3 7.5 8.0 8.6 9.0 9.1 * *15–19 years . . . . . . . . . . . . 298 8.3 0.9 0.065 * 7.0 7.3 7.5 7.8 8.3 8.9 9.3 9.4 9.9 *20–29 years . . . . . . . . . . . . 463 8.5 1.1 0.062 * 7.2 7.4 7.5 7.8 8.4 9.1 9.6 10.1 10.4 *30–39 years . . . . . . . . . . . . 461 8.5 1.0 0.058 * 7.0 7.3 7.4 7.7 8.4 9.1 9.7 10.0 10.3 *40–49 years . . . . . . . . . . . . 336 8.5 0.9 0.062 * 7.1 7.3 7.5 7.8 8.4 9.0 9.5 9.8 10.1 *50–59 years . . . . . . . . . . . . 207 8.5 1.0 0.084 * * 7.3 7.7 7.9 8.5 9.1 9.4 9.7 * *60–69 years . . . . . . . . . . . . 274 8.4 0.9 0.064 * 7.0 7.3 7.5 7.8 8.4 9.0 9.3 9.6 9.9 *70 years and over . . . . . . . . 220 8.4 1.2 0.103 * * 7.2 7.4 7.6 8.3 9.0 9.6 9.9 * *
Mexican American
1 year and over . . . . . . . . . . . 3,950 8.3 1.0 0.041 6.6 6.8 7.1 7.3 7.6 8.2 8.8 9.2 9.5 9.9 10.31–2 years . . . . . . . . . . . . . 298 7.3 0.7 0.054 * * 6.5 6.6 6.8 7.3 7.7 7.9 8.3 * *3–5 years . . . . . . . . . . . . . 466 7.8 0.8 0.052 * 6.5 6.8 6.8 7.2 7.7 8.3 8.6 8.9 9.2 *6–8 years . . . . . . . . . . . . . 250 7.9 0.8 0.065 * * 7.0 7.1 7.3 7.8 8.4 8.7 9.1 * *9–11 years . . . . . . . . . . . . . 272 8.2 1.1 0.089 * * 7.2 7.3 7.6 8.0 8.8 9.1 9.4 * *12–14 years . . . . . . . . . . . . 191 8.1 1.1 0.102 * * 7.1 7.2 7.5 8.0 8.6 8.9 9.1 * *15–19 years . . . . . . . . . . . . 304 8.3 0.9 0.068 * 7.0 7.3 7.4 7.7 8.2 8.9 9.2 9.5 9.8 *20–29 years . . . . . . . . . . . . 647 8.3 0.9 0.047 * 6.9 7.3 7.4 7.7 8.3 8.9 9.3 9.5 10.0 *30–39 years . . . . . . . . . . . . 450 8.4 0.9 0.059 * 7.0 7.3 7.5 7.8 8.4 9.1 9.4 9.6 9.9 *40–49 years . . . . . . . . . . . . 369 8.6 1.0 0.070 * 7.2 7.5 7.7 7.9 8.5 9.1 9.4 9.7 10.1 *50–59 years . . . . . . . . . . . . 175 8.5 1.2 0.116 * * 7.3 7.5 7.8 8.4 9.0 9.5 9.9 * *60–69 years . . . . . . . . . . . . 329 8.5 0.9 0.068 * 7.0 7.3 7.5 7.9 8.5 9.1 9.3 9.4 9.9 *70 years and over . . . . . . . . 199 8.2 0.9 0.085 * * 7.1 7.3 7.6 8.2 8.9 9.1 9.3 * *
* Does not meet standards for reliability or precision.1Includes all other race/ethnic groups not listed separately.
Page 44 [ Series 11, No. 247

Table 27. Mean platelet volume in femtoliter for females 1 year and over, number of examined persons, mean, standard deviation, standarderror of the mean, and selected percentiles, by race/ethnicity and age: United States, 1988–94
Race/ethnicity and age
Number ofexaminedpersons Mean
Standarddeviation
Standarderror ofmean
Percentile
2.5th 5th 10th 15th 25th 50th 75th 85th 90th 95th 97.5th
All race/ethnic groups1
1 year and over . . . . . . . . . . . 13,749 8.3 1.0 0.028 6.7 6.9 7.2 7.4 7.7 8.3 8.9 9.3 9.6 10.1 10.51–2 years . . . . . . . . . . . . . 858 7.4 0.8 0.045 6.2 6.3 6.5 6.7 6.9 7.3 7.8 8.2 8.4 8.6 8.93–5 years . . . . . . . . . . . . . 1,337 7.6 0.8 0.036 6.3 6.6 6.7 6.8 7.1 7.6 8.1 8.4 8.6 8.9 9.36–8 years . . . . . . . . . . . . . 675 7.9 0.8 0.053 6.7 6.7 6.9 7.1 7.3 7.8 8.4 8.7 9.1 9.3 9.69–11 years . . . . . . . . . . . . . 734 8.1 0.8 0.052 6.8 6.9 7.2 7.3 7.4 8.1 8.6 8.9 9.2 9.6 9.812–14 years . . . . . . . . . . . . 621 8.1 0.9 0.064 6.6 6.8 7.0 7.2 7.4 8.0 8.6 8.9 9.3 9.8 10.315–19 years . . . . . . . . . . . . 950 8.3 1.0 0.055 6.9 7.0 7.2 7.4 7.7 8.2 8.9 9.3 9.7 10.2 10.420–29 years . . . . . . . . . . . . 1,769 8.4 0.9 0.039 6.8 7.1 7.3 7.5 7.8 8.3 8.9 9.4 9.6 10.0 10.430–39 years . . . . . . . . . . . . 1,757 8.4 0.9 0.038 6.9 7.1 7.3 7.6 7.8 8.3 9.0 9.4 9.7 10.1 10.440–49 years . . . . . . . . . . . . 1,303 8.5 1.0 0.047 6.8 7.0 7.3 7.6 7.8 8.4 9.1 9.5 9.8 10.3 10.750–59 years . . . . . . . . . . . . 969 8.5 1.0 0.055 7.0 7.2 7.4 7.6 7.9 8.4 9.1 9.4 9.8 10.3 10.860–69 years . . . . . . . . . . . . 1,112 8.5 1.0 0.050 6.8 7.1 7.3 7.6 7.9 8.4 9.1 9.4 9.8 10.3 10.870 years and over . . . . . . . . 1,664 8.4 1.0 0.044 6.8 7.0 7.2 7.4 7.8 8.4 9.1 9.4 9.7 10.2 10.6
Non-Hispanic white
1 year and over . . . . . . . . . . . 5,030 8.3 1.0 0.031 6.7 6.9 7.2 7.4 7.7 8.3 8.9 9.3 9.6 10.0 10.41–2 years . . . . . . . . . . . . . 270 7.4 0.8 0.061 * 6.3 6.5 6.7 6.9 7.3 7.9 8.2 8.3 8.6 *3–5 years . . . . . . . . . . . . . 332 7.6 0.7 0.050 * 6.5 6.7 6.8 7.1 7.5 8.0 8.3 8.6 8.9 *6–8 years . . . . . . . . . . . . . 175 7.9 0.8 0.076 * * 6.9 7.1 7.3 7.8 8.4 8.9 9.1 * *9–11 years . . . . . . . . . . . . . 186 8.2 0.8 0.074 * * 7.2 7.3 7.5 8.2 8.7 9.1 9.2 * *12–14 years . . . . . . . . . . . . 154 8.1 1.0 0.098 * * 7.0 7.2 7.4 8.0 8.6 8.9 9.4 * *15–19 years . . . . . . . . . . . . 270 8.3 1.0 0.076 * 7.1 7.2 7.4 7.7 8.2 8.8 9.3 9.6 10.1 *20–29 years . . . . . . . . . . . . 477 8.4 1.0 0.055 * 7.1 7.3 7.4 7.7 8.2 8.9 9.3 9.6 10.0 *30–39 years . . . . . . . . . . . . 572 8.4 0.9 0.047 * 7.1 7.4 7.6 7.8 8.3 8.9 9.3 9.6 10.1 *40–49 years . . . . . . . . . . . . 457 8.5 0.9 0.056 * 7.0 7.3 7.6 7.8 8.3 9.1 9.5 9.7 10.2 *50–59 years . . . . . . . . . . . . 473 8.5 0.9 0.053 * 7.1 7.4 7.6 7.9 8.4 9.0 9.3 9.5 9.9 *60–69 years . . . . . . . . . . . . 473 8.5 0.9 0.055 * 7.0 7.3 7.5 7.8 8.4 9.0 9.4 9.7 10.2 *70 years and over . . . . . . . . 1,191 8.4 1.0 0.037 * 7.0 7.2 7.4 7.7 8.3 9.1 9.4 9.7 10.2 *
Non-Hispanic black
1 year and over . . . . . . . . . . . 4,116 8.4 1.0 0.032 6.7 7.0 7.2 7.4 7.7 8.4 9.0 9.4 9.8 10.2 10.71–2 years . . . . . . . . . . . . . 265 7.5 0.7 0.053 * 6.5 6.6 6.7 6.9 7.4 7.9 8.3 8.4 8.9 *3–5 years . . . . . . . . . . . . . 433 7.8 0.9 0.052 * 6.6 6.9 7.0 7.2 7.7 8.3 8.7 9.0 9.3 *6–8 years . . . . . . . . . . . . . 220 8.0 0.8 0.069 * * 7.0 7.2 7.4 7.9 8.5 8.8 8.9 * *9–11 years . . . . . . . . . . . . . 252 8.1 0.8 0.060 * 6.9 7.2 7.3 7.7 8.1 8.6 8.8 9.1 9.6 *12–14 years . . . . . . . . . . . . 220 8.2 0.9 0.074 * * 7.1 7.2 7.5 8.1 8.8 9.1 9.3 * *15–19 years . . . . . . . . . . . . 326 8.4 0.9 0.059 * 7.0 7.4 7.5 7.8 8.4 9.0 9.2 9.5 9.8 *20–29 years . . . . . . . . . . . . 589 8.5 0.9 0.046 * 7.2 7.4 7.6 7.9 8.4 9.1 9.4 9.8 10.1 *30–39 years . . . . . . . . . . . . 602 8.5 1.0 0.048 * 7.1 7.3 7.5 7.8 8.4 9.2 9.6 9.8 10.3 *40–49 years . . . . . . . . . . . . 425 8.6 1.0 0.058 * 7.2 7.4 7.7 8.0 8.6 9.2 9.5 9.9 10.3 *50–59 years . . . . . . . . . . . . 256 8.8 1.1 0.082 * 7.2 7.4 7.7 8.1 8.6 9.4 10.0 10.2 10.6 *60–69 years . . . . . . . . . . . . 276 8.7 1.1 0.082 * 7.1 7.3 7.5 7.9 8.6 9.2 9.8 10.3 10.9 *70 years and over . . . . . . . . 252 8.6 1.2 0.089 * 7.1 7.4 7.5 7.8 8.5 9.2 9.8 10.2 10.5 *
Mexican American
1 year and over . . . . . . . . . . . 3,994 8.3 1.0 0.041 6.6 6.9 7.2 7.3 7.6 8.2 8.9 9.3 9.6 10.1 10.51–2 years . . . . . . . . . . . . . 285 7.4 0.7 0.060 * * 6.5 6.6 6.8 7.4 7.8 8.1 8.3 * *3–5 years . . . . . . . . . . . . . 506 7.6 0.8 0.048 * 6.6 6.8 6.9 7.1 7.6 8.1 8.4 8.7 9.1 *6–8 years . . . . . . . . . . . . . 257 7.9 0.8 0.071 * * 7.0 7.1 7.3 7.8 8.3 8.8 9.0 * *9–11 years . . . . . . . . . . . . . 265 8.1 0.8 0.073 * * 7.2 7.3 7.6 7.9 8.6 9.1 9.5 * *12–14 years . . . . . . . . . . . . 218 8.0 0.8 0.075 * * 7.0 7.2 7.6 8.1 8.5 8.8 9.0 * *15–19 years . . . . . . . . . . . . 297 8.3 1.0 0.083 * 6.9 7.1 7.3 7.6 8.1 8.8 9.3 9.7 10.1 *20–29 years . . . . . . . . . . . . 632 8.5 0.9 0.053 * 7.1 7.3 7.5 7.9 8.4 9.1 9.4 9.8 10.1 *30–39 years . . . . . . . . . . . . 504 8.6 1.0 0.062 * 7.2 7.3 7.6 7.9 8.4 9.1 9.6 9.9 10.4 *40–49 years . . . . . . . . . . . . 356 8.6 1.1 0.081 * 7.2 7.5 7.7 7.9 8.6 9.2 9.6 9.9 10.4 *50–59 years . . . . . . . . . . . . 185 8.7 1.1 0.117 * * 7.3 7.6 7.9 8.4 9.3 9.6 10.0 * *60–69 years . . . . . . . . . . . . 317 8.6 1.0 0.081 * 7.1 7.4 7.7 7.9 8.6 9.3 9.5 10.0 10.3 *70 years and over . . . . . . . . 172 8.4 1.0 0.112 * * 7.3 7.4 7.8 8.4 8.9 9.3 9.8 * *
* Does not meet standards for reliability or precision.1Includes all other race/ethnic groups not listed separately.
Series 11, No. 247 [ Page 45

Table 28. Platelet distribution width in percentages for persons 1 year and over, number of examined persons, mean, standard deviation,standard error of the mean, and selected percentiles, by race/ethnicity and age: United States, 1988–94
Race/ethnicity and age
Number ofexaminedpersons Mean
Standarddeviation
Standarderror ofmean
Percentile
2.5th 5th 10th 15th 25th 50th 75th 85th 90th 95th 97.5th
All race/ethnic groups1
1 year and over . . . . . . . . . . . 26,200 16.4 0.5 0.013 15.6 15.7 15.8 15.9 16.0 16.4 16.7 16.9 17.0 17.3 17.61–2 years . . . . . . . . . . . . . 1,773 16.1 0.5 0.025 15.4 15.4 15.6 15.7 15.8 16.1 16.3 16.5 16.6 16.9 17.13–5 years . . . . . . . . . . . . . 2,586 16.1 0.4 0.015 15.5 15.6 15.6 15.8 15.9 16.1 16.4 16.5 16.6 16.8 17.06–8 years . . . . . . . . . . . . . 1,379 16.2 0.4 0.023 15.4 15.6 15.7 15.8 15.9 16.2 16.4 16.6 16.8 17.0 17.19–11 years . . . . . . . . . . . . . 1,498 16.2 0.4 0.022 15.5 15.6 15.8 15.8 16.0 16.2 16.5 16.6 16.8 17.0 17.312–14 years . . . . . . . . . . . . 1,150 16.4 0.5 0.029 15.6 15.7 15.8 15.9 16.0 16.3 16.6 16.8 17.0 17.2 17.515–19 years . . . . . . . . . . . . 1,772 16.4 0.5 0.024 15.6 15.7 15.8 15.9 16.0 16.4 16.7 16.9 17.0 17.3 17.520–29 years . . . . . . . . . . . . 3,315 16.4 0.5 0.018 15.6 15.6 15.8 15.9 16.0 16.4 16.6 16.9 17.0 17.3 17.530–39 years . . . . . . . . . . . . 3,136 16.4 0.5 0.018 15.6 15.7 15.8 15.9 16.0 16.4 16.7 16.9 17.0 17.4 17.540–49 years . . . . . . . . . . . . 2,455 16.4 0.5 0.021 15.6 15.7 15.8 15.9 16.1 16.4 16.7 16.9 17.0 17.3 17.650–59 years . . . . . . . . . . . . 1,793 16.5 0.5 0.024 15.6 15.8 15.9 16.0 16.1 16.4 16.8 17.0 17.1 17.4 17.860–69 years . . . . . . . . . . . . 2,230 16.5 0.5 0.021 15.7 15.8 15.9 16.0 16.2 16.5 16.9 17.0 17.2 17.4 17.870 years and over . . . . . . . . 3,113 16.6 0.6 0.020 15.7 15.9 16.0 16.1 16.3 16.6 16.9 17.1 17.3 17.6 17.8
Non-Hispanic white
1 year and over . . . . . . . . . . . 9,490 16.4 0.5 0.015 15.6 15.7 15.9 15.9 16.1 16.4 16.7 16.9 17.1 17.3 17.61–2 years . . . . . . . . . . . . . 565 16.0 0.6 0.034 * 15.4 15.6 15.6 15.8 16.0 16.3 16.5 16.6 16.8 *3–5 years . . . . . . . . . . . . . 652 16.1 0.4 0.020 * 15.6 15.7 15.8 15.9 16.1 16.4 16.5 16.6 16.7 *6–8 years . . . . . . . . . . . . . 362 16.2 0.4 0.034 * 15.6 15.7 15.8 15.9 16.2 16.5 16.6 16.8 17.0 *9–11 years . . . . . . . . . . . . . 384 16.3 0.4 0.030 * 15.6 15.8 15.9 16.0 16.2 16.5 16.6 16.8 17.0 *12–14 years . . . . . . . . . . . . 293 16.4 0.5 0.039 * * 15.9 15.9 16.1 16.4 16.7 16.8 17.0 * *15–19 years . . . . . . . . . . . . 463 16.4 0.5 0.034 * 15.8 15.9 15.9 16.1 16.4 16.7 16.9 17.0 17.3 *20–29 years . . . . . . . . . . . . 855 16.4 0.5 0.025 * 15.7 15.9 15.9 16.1 16.4 16.7 16.9 17.0 17.3 *30–39 years . . . . . . . . . . . . 999 16.4 0.5 0.023 * 15.8 15.9 15.9 16.1 16.4 16.7 16.9 17.0 17.3 *40–49 years . . . . . . . . . . . . 870 16.4 0.5 0.024 * 15.8 15.9 16.0 16.1 16.4 16.7 16.9 17.0 17.3 *50–59 years . . . . . . . . . . . . 883 16.5 0.5 0.025 * 15.8 15.9 16.0 16.1 16.4 16.8 17.0 17.1 17.3 *60–69 years . . . . . . . . . . . . 964 16.6 0.5 0.023 * 15.8 16.0 16.1 16.2 16.5 16.9 17.0 17.2 17.4 *70 years and over . . . . . . . . 2,200 16.6 0.5 0.016 * 15.9 16.0 16.1 16.3 16.6 16.9 17.1 17.3 17.6 *
Non-Hispanic black
1 year and over . . . . . . . . . . . 7,697 16.3 0.6 0.014 15.4 15.5 15.7 15.8 15.9 16.2 16.6 16.9 17.0 17.3 17.61–2 years . . . . . . . . . . . . . 536 16.2 0.5 0.025 * 15.5 15.7 15.8 15.9 16.1 16.5 16.6 16.8 17.1 *3–5 years . . . . . . . . . . . . . 839 16.1 0.5 0.020 * 15.5 15.6 15.7 15.8 16.1 16.4 16.6 16.7 17.0 *6–8 years . . . . . . . . . . . . . 448 16.1 0.4 0.025 * 15.5 15.6 15.7 15.8 16.1 16.4 16.6 16.7 16.9 *9–11 years . . . . . . . . . . . . . 515 16.2 0.4 0.023 * 15.6 15.7 15.8 15.9 16.1 16.4 16.6 16.7 16.9 *12–14 years . . . . . . . . . . . . 400 16.3 0.5 0.032 * 15.6 15.7 15.8 15.9 16.3 16.6 16.9 17.0 17.2 *15–19 years . . . . . . . . . . . . 621 16.3 0.6 0.029 * 15.5 15.6 15.8 15.9 16.3 16.6 16.9 17.1 17.4 *20–29 years . . . . . . . . . . . . 1,050 16.3 0.6 0.022 * 15.4 15.6 15.8 15.9 16.3 16.6 16.9 17.0 17.3 *30–39 years . . . . . . . . . . . . 1,055 16.3 0.6 0.022 * 15.5 15.6 15.8 15.9 16.2 16.6 16.9 17.1 17.4 *40–49 years . . . . . . . . . . . . 760 16.3 0.6 0.026 * 15.5 15.7 15.8 15.9 16.3 16.6 16.9 17.0 17.4 *50–59 years . . . . . . . . . . . . 460 16.3 0.6 0.032 * 15.6 15.7 15.8 15.9 16.3 16.7 16.9 17.0 17.4 *60–69 years . . . . . . . . . . . . 546 16.4 0.6 0.030 * 15.6 15.8 15.9 16.0 16.3 16.8 17.0 17.2 17.4 *70 years and over . . . . . . . . 467 16.5 0.8 0.048 * 15.7 15.8 15.9 16.1 16.4 16.9 17.1 17.4 17.6 *
Mexican American
1 year and over . . . . . . . . . . . 7,858 16.3 0.6 0.011 15.6 15.6 15.8 15.9 16.0 16.3 16.6 16.8 17.0 17.3 17.51–2 years . . . . . . . . . . . . . 573 16.1 0.4 0.020 * 15.4 15.6 15.7 15.8 16.1 16.3 16.5 16.6 16.9 *3–5 years . . . . . . . . . . . . . 956 16.1 0.4 0.015 * 15.5 15.6 15.7 15.8 16.1 16.4 16.5 16.6 16.8 *6–8 years . . . . . . . . . . . . . 506 16.1 0.4 0.019 * 15.5 15.6 15.7 15.8 16.1 16.4 16.4 16.5 16.7 *9–11 years . . . . . . . . . . . . . 534 16.2 0.6 0.032 * 15.6 15.7 15.8 15.9 16.1 16.5 16.7 16.8 17.0 *12–14 years . . . . . . . . . . . . 402 16.3 0.8 0.045 * 15.7 15.8 15.8 15.9 16.3 16.6 16.8 16.9 17.1 *15–19 years . . . . . . . . . . . . 592 16.4 0.6 0.029 * 15.8 15.8 15.9 16.1 16.4 16.7 16.9 17.1 17.3 *20–29 years . . . . . . . . . . . . 1,268 16.4 0.5 0.017 * 15.7 15.8 15.9 16.0 16.3 16.6 16.9 17.0 17.3 *30–39 years . . . . . . . . . . . . 948 16.4 0.5 0.019 * 15.7 15.8 15.9 16.0 16.4 16.8 16.9 17.1 17.3 *40–49 years . . . . . . . . . . . . 717 16.4 0.7 0.029 * 15.7 15.8 15.9 16.0 16.3 16.7 16.9 17.1 17.4 *50–59 years . . . . . . . . . . . . 354 16.5 0.5 0.031 * 15.8 15.9 16.0 16.1 16.4 16.8 17.0 17.1 17.3 *60–69 years . . . . . . . . . . . . 641 16.5 0.5 0.024 * 15.8 15.9 16.0 16.1 16.4 16.8 17.0 17.1 17.4 *70 years and over . . . . . . . . 367 16.6 0.5 0.031 * 15.9 16.0 16.1 16.3 16.5 16.9 17.1 17.3 17.5 *
* Does not meet standards for reliability or precision.1Includes all other race/ethnic groups not listed separately.
Page 46 [ Series 11, No. 247

Table 29. Platelet distribution width in percentages for males 1 year and over, number of examined persons, mean, standard deviation,standard error of the mean, and selected percentiles, by race/ethnicity and age: United States, 1988–94
Race/ethnicity and age
Number ofexaminedpersons Mean
Standarddeviation
Standarderror ofmean
Percentile
2.5th 5th 10th 15th 25th 50th 75th 85th 90th 95th 97.5th
All race/ethnic groups1
1 year and over . . . . . . . . . . . 12,543 16.5 0.5 0.019 15.6 15.8 15.9 15.9 16.1 16.4 16.8 17.0 17.1 17.4 17.71–2 years . . . . . . . . . . . . . 921 16.1 0.4 0.023 15.4 15.5 15.6 15.7 15.8 16.1 16.3 16.5 16.6 16.9 17.03–5 years . . . . . . . . . . . . . 1,267 16.2 0.4 0.019 15.5 15.6 15.7 15.8 15.9 16.1 16.4 16.5 16.7 16.8 17.06–8 years . . . . . . . . . . . . . 707 16.3 0.4 0.027 15.6 15.7 15.8 15.8 15.9 16.3 16.5 16.7 16.9 17.1 17.19–11 years . . . . . . . . . . . . . 770 16.2 0.4 0.026 15.5 15.6 15.8 15.8 16.0 16.2 16.4 16.6 16.8 17.0 17.112–14 years . . . . . . . . . . . . 535 16.4 0.5 0.038 15.7 15.8 15.8 15.9 16.1 16.4 16.7 16.9 17.0 17.4 17.815–19 years . . . . . . . . . . . . 830 16.5 0.5 0.029 15.6 15.8 15.9 16.0 16.1 16.4 16.8 17.0 17.1 17.3 17.620–29 years . . . . . . . . . . . . 1,556 16.5 0.5 0.023 15.6 15.8 15.9 15.9 16.1 16.4 16.8 16.9 17.1 17.3 17.630–39 years . . . . . . . . . . . . 1,390 16.5 0.5 0.022 15.6 15.8 15.9 16.0 16.1 16.4 16.8 17.0 17.1 17.4 17.540–49 years . . . . . . . . . . . . 1,157 16.5 0.5 0.026 15.6 15.8 15.9 16.0 16.1 16.5 16.8 17.0 17.2 17.5 17.850–59 years . . . . . . . . . . . . 829 16.5 0.5 0.030 15.7 15.8 15.9 16.0 16.2 16.5 16.8 17.1 17.2 17.5 17.960–69 years . . . . . . . . . . . . 1,125 16.6 0.5 0.025 15.8 15.8 16.0 16.1 16.3 16.5 16.9 17.1 17.3 17.6 17.870 years and over . . . . . . . . 1,456 16.7 0.6 0.024 15.8 16.0 16.1 16.2 16.4 16.7 17.1 17.3 17.4 17.7 17.9
Non-Hispanic white
1 year and over . . . . . . . . . . . 4,473 16.5 0.5 0.023 15.6 15.8 15.9 16.0 16.1 16.4 16.8 17.0 17.1 17.4 17.71–2 years . . . . . . . . . . . . . 295 16.1 0.4 0.029 * 15.4 15.6 15.6 15.8 16.0 16.3 16.5 16.6 16.8 *3–5 years . . . . . . . . . . . . . 323 16.2 0.3 0.024 * 15.6 15.7 15.8 15.9 16.1 16.4 16.5 16.6 16.8 *6–8 years . . . . . . . . . . . . . 188 16.3 0.4 0.040 * * 15.8 15.9 16.0 16.3 16.6 16.8 17.0 * *9–11 years . . . . . . . . . . . . . 199 16.2 0.4 0.033 * * 15.8 15.9 16.0 16.2 16.5 16.6 16.8 * *12–14 years . . . . . . . . . . . . 139 16.5 0.5 0.052 * * 15.9 16.0 16.1 16.4 16.8 16.9 17.0 * *15–19 years . . . . . . . . . . . . 194 16.5 0.5 0.042 * * 15.9 16.0 16.1 16.4 16.8 17.0 17.1 * *20–29 years . . . . . . . . . . . . 379 16.5 0.6 0.035 * 15.8 15.9 16.0 16.1 16.4 16.8 16.9 17.1 17.3 *30–39 years . . . . . . . . . . . . 431 16.5 0.5 0.029 * 15.8 15.9 16.0 16.1 16.4 16.8 17.0 17.1 17.4 *40–49 years . . . . . . . . . . . . 414 16.5 0.5 0.031 * 15.8 15.9 16.0 16.2 16.5 16.8 17.0 17.2 17.5 *50–59 years . . . . . . . . . . . . 410 16.5 0.5 0.032 * 15.8 16.0 16.1 16.2 16.5 16.8 17.0 17.2 17.5 *60–69 years . . . . . . . . . . . . 491 16.6 0.5 0.028 * 15.8 16.0 16.1 16.3 16.6 16.9 17.1 17.3 17.6 *70 years and over . . . . . . . . 1,010 16.8 0.5 0.020 * 16.0 16.1 16.3 16.4 16.8 17.1 17.3 17.4 17.7 *
Non-Hispanic black
1 year and over . . . . . . . . . . . 3,618 16.4 0.6 0.020 15.4 15.6 15.7 15.8 15.9 16.3 16.7 16.9 17.1 17.4 17.71–2 years . . . . . . . . . . . . . 273 16.2 0.5 0.032 * 15.6 15.7 15.8 15.9 16.2 16.5 16.6 16.8 17.0 *3–5 years . . . . . . . . . . . . . 415 16.2 0.5 0.029 * 15.6 15.7 15.7 15.9 16.1 16.4 16.6 16.8 17.0 *6–8 years . . . . . . . . . . . . . 229 16.2 0.4 0.034 * 15.5 15.7 15.8 15.9 16.1 16.4 16.6 16.7 16.9 *9–11 years . . . . . . . . . . . . . 266 16.2 0.4 0.032 * 15.5 15.7 15.7 15.8 16.1 16.4 16.6 16.7 16.9 *12–14 years . . . . . . . . . . . . 182 16.4 0.5 0.042 * * 15.9 15.9 16.0 16.4 16.8 16.9 17.1 * *15–19 years . . . . . . . . . . . . 297 16.4 0.6 0.043 * 15.6 15.8 15.9 16.0 16.4 16.8 17.0 17.2 17.5 *20–29 years . . . . . . . . . . . . 463 16.4 0.6 0.033 * 15.6 15.7 15.8 15.9 16.3 16.7 16.9 17.1 17.5 *30–39 years . . . . . . . . . . . . 459 16.4 0.6 0.033 * 15.6 15.7 15.8 15.9 16.4 16.8 17.0 17.1 17.4 *40–49 years . . . . . . . . . . . . 336 16.4 0.6 0.037 * 15.6 15.7 15.8 16.0 16.3 16.6 16.9 17.0 17.4 *50–59 years . . . . . . . . . . . . 206 16.4 0.6 0.046 * * 15.7 15.8 16.0 16.4 16.8 16.9 17.1 * *60–69 years . . . . . . . . . . . . 273 16.4 0.6 0.043 * 15.6 15.8 15.8 16.0 16.4 16.9 17.1 17.3 17.5 *70 years and over . . . . . . . . 219 16.6 0.9 0.072 * * 15.9 16.0 16.1 16.6 17.1 17.3 17.5 * *
Mexican American
1 year and over . . . . . . . . . . . 3,906 16.4 0.6 0.016 15.6 15.7 15.8 15.9 16.0 16.3 16.7 16.9 17.1 17.3 17.51–2 years . . . . . . . . . . . . . 292 16.1 0.4 0.029 * * 15.6 15.7 15.9 16.1 16.4 16.5 16.7 * *3–5 years . . . . . . . . . . . . . 456 16.1 0.4 0.021 * 15.6 15.7 15.8 15.9 16.1 16.4 16.5 16.6 16.8 *6–8 years . . . . . . . . . . . . . 250 16.2 0.4 0.025 * * 15.8 15.8 15.9 16.1 16.4 16.5 16.6 * *9–11 years . . . . . . . . . . . . . 271 16.2 0.8 0.052 * * 15.8 15.8 15.9 16.1 16.5 16.7 16.8 * *12–14 years . . . . . . . . . . . . 188 16.4 1.0 0.085 * * 15.8 15.8 16.0 16.4 16.6 16.8 17.0 * *15–19 years . . . . . . . . . . . . 300 16.5 0.7 0.045 * * 15.9 15.9 16.1 16.4 16.8 17.0 17.1 * *20–29 years . . . . . . . . . . . . 643 16.4 0.5 0.023 * 15.7 15.8 15.9 16.0 16.4 16.7 16.9 17.1 17.3 *30–39 years . . . . . . . . . . . . 445 16.5 0.5 0.027 * 15.7 15.9 16.0 16.1 16.4 16.8 17.0 17.1 17.4 *40–49 years . . . . . . . . . . . . 364 16.5 0.7 0.040 * 15.7 15.9 16.0 16.1 16.4 16.8 17.1 17.3 17.6 *50–59 years . . . . . . . . . . . . 172 16.5 0.5 0.043 * * 15.9 16.0 16.2 16.5 16.9 17.0 17.2 * *60–69 years . . . . . . . . . . . . 328 16.5 0.5 0.034 * 15.9 15.9 16.0 16.1 16.4 16.8 17.0 17.3 17.5 *70 years and over . . . . . . . . 197 16.6 0.5 0.038 * * 16.1 16.2 16.3 16.6 16.9 17.1 17.3 * *
* Does not meet standards for reliability or precision.1Includes all other race/ethnic groups not listed separately.
Series 11, No. 247 [ Page 47

Table 30. Platelet distribution width in percentages for females 1 year and over, number of examined persons, mean, standard deviation,standard error of the mean, and selected percentiles, by race/ethnicity and age: United States, 1988–94
Race/ethnicity and age
Number ofexaminedpersons Mean
Standarddeviation
Standarderror ofmean
Percentile
2.5th 5th 10th 15th 25th 50th 75th 85th 90th 95th 97.5th
All race/ethnic groups1
1 year and over . . . . . . . . . . . 13,657 16.3 0.5 0.017 15.5 15.6 15.8 15.9 16.0 16.3 16.6 16.8 17.0 17.2 17.51–2 years . . . . . . . . . . . . . 852 16.1 0.6 0.040 15.4 15.4 15.6 15.7 15.8 16.0 16.3 16.5 16.6 16.9 17.23–5 years . . . . . . . . . . . . . 1,319 16.1 0.4 0.019 15.4 15.5 15.6 15.7 15.8 16.0 16.3 16.5 16.6 16.7 16.96–8 years . . . . . . . . . . . . . 672 16.1 0.4 0.030 15.4 15.5 15.6 15.7 15.8 16.1 16.4 16.5 16.6 16.8 17.19–11 years . . . . . . . . . . . . . 728 16.2 0.4 0.029 15.6 15.6 15.8 15.8 15.9 16.2 16.5 16.6 16.8 17.0 17.312–14 years . . . . . . . . . . . . 615 16.3 0.4 0.033 15.6 15.6 15.8 15.9 16.0 16.3 16.6 16.8 16.9 17.1 17.415–19 years . . . . . . . . . . . . 942 16.3 0.5 0.030 15.5 15.6 15.8 15.9 16.0 16.3 16.6 16.9 17.0 17.3 17.420–29 years . . . . . . . . . . . . 1,759 16.3 0.5 0.021 15.5 15.6 15.8 15.9 16.0 16.3 16.6 16.8 16.9 17.1 17.430–39 years . . . . . . . . . . . . 1,746 16.4 0.5 0.023 15.5 15.6 15.8 15.9 16.0 16.3 16.6 16.8 17.0 17.2 17.540–49 years . . . . . . . . . . . . 1,298 16.3 0.5 0.025 15.5 15.6 15.8 15.9 16.0 16.3 16.6 16.8 16.9 17.1 17.550–59 years . . . . . . . . . . . . 964 16.4 0.5 0.031 15.6 15.7 15.8 15.9 16.0 16.4 16.7 16.9 17.0 17.2 17.560–69 years . . . . . . . . . . . . 1,105 16.5 0.5 0.027 15.6 15.8 15.9 16.0 16.1 16.4 16.8 17.0 17.1 17.3 17.670 years and over . . . . . . . . 1,657 16.5 0.6 0.026 15.7 15.8 15.9 16.0 16.2 16.5 16.9 17.0 17.2 17.5 17.8
Non-Hispanic white1 year and over . . . . . . . . . . . 5,017 16.4 0.5 0.021 15.6 15.7 15.8 15.9 16.0 16.3 16.6 16.9 17.0 17.2 17.5
1–2 years . . . . . . . . . . . . . 270 16.0 0.7 0.057 * 15.4 15.6 15.6 15.8 16.0 16.3 16.4 16.6 16.8 *3–5 years . . . . . . . . . . . . . 329 16.0 0.4 0.026 * 15.6 15.6 15.7 15.8 16.0 16.3 16.4 16.6 16.7 *6–8 years . . . . . . . . . . . . . 174 16.1 0.4 0.044 * * 15.6 15.7 15.8 16.1 16.4 16.6 16.6 * *9–11 years . . . . . . . . . . . . . 185 16.3 0.4 0.043 * * 15.8 15.9 16.0 16.3 16.5 16.7 16.8 * *12–14 years . . . . . . . . . . . . 154 16.4 0.4 0.045 * * 15.9 15.9 16.1 16.4 16.6 16.8 16.8 * *15–19 years . . . . . . . . . . . . 269 16.4 0.5 0.042 * 15.6 15.8 15.9 16.0 16.3 16.6 16.9 17.0 17.3 *20–29 years . . . . . . . . . . . . 476 16.3 0.5 0.028 * 15.6 15.8 15.9 16.0 16.3 16.6 16.8 16.9 17.1 *30–39 years . . . . . . . . . . . . 568 16.4 0.5 0.029 * 15.7 15.8 15.9 16.0 16.3 16.7 16.9 17.0 17.1 *40–49 years . . . . . . . . . . . . 456 16.3 0.4 0.028 * 15.7 15.8 15.9 16.0 16.3 16.6 16.8 16.9 17.1 *50–59 years . . . . . . . . . . . . 473 16.4 0.5 0.032 * 15.7 15.9 15.9 16.1 16.4 16.8 16.9 17.0 17.2 *60–69 years . . . . . . . . . . . . 473 16.5 0.5 0.030 * 15.8 15.9 16.0 16.1 16.4 16.8 17.0 17.1 17.3 *70 years and over . . . . . . . . 1,190 16.6 0.5 0.020 * 15.8 16.0 16.1 16.3 16.5 16.9 17.0 17.2 17.5 *
Non-Hispanic black
1 year and over . . . . . . . . . . . 4,079 16.2 0.6 0.018 15.4 15.5 15.6 15.7 15.9 16.2 16.5 16.8 17.0 17.2 17.51–2 years . . . . . . . . . . . . . 263 16.2 0.5 0.037 * 15.5 15.6 15.8 15.9 16.1 16.5 16.6 16.8 17.2 *3–5 years . . . . . . . . . . . . . 424 16.1 0.5 0.027 * 15.5 15.6 15.7 15.8 16.0 16.4 16.5 16.6 16.9 *6–8 years . . . . . . . . . . . . . 219 16.1 0.4 0.035 * * 15.6 15.7 15.8 16.1 16.3 16.6 16.7 * *9–11 years . . . . . . . . . . . . . 249 16.2 0.4 0.030 * 15.6 15.8 15.8 15.9 16.1 16.4 16.5 16.7 16.9 *12–14 years . . . . . . . . . . . . 218 16.2 0.5 0.043 * * 15.6 15.7 15.9 16.2 16.5 16.8 16.9 * *15–19 years . . . . . . . . . . . . 324 16.2 0.5 0.037 * 15.4 15.6 15.7 15.8 16.2 16.5 16.8 16.9 17.3 *20–29 years . . . . . . . . . . . . 587 16.2 0.6 0.028 * 15.4 15.5 15.7 15.9 16.2 16.5 16.8 16.9 17.2 *30–39 years . . . . . . . . . . . . 596 16.2 0.6 0.029 * 15.5 15.6 15.7 15.9 16.1 16.5 16.8 17.0 17.3 *40–49 years . . . . . . . . . . . . 424 16.3 0.6 0.034 * 15.4 15.6 15.7 15.9 16.1 16.6 16.8 17.0 17.4 *50–59 years . . . . . . . . . . . . 254 16.3 0.6 0.043 * 15.6 15.6 15.8 15.9 16.2 16.6 16.8 16.9 17.1 *60–69 years . . . . . . . . . . . . 273 16.4 0.5 0.040 * 15.6 15.7 15.9 16.0 16.3 16.7 16.9 17.1 17.3 *70 years and over . . . . . . . . 248 16.4 0.8 0.061 * 15.6 15.8 15.9 16.0 16.3 16.8 17.0 17.1 17.5 *
Mexican American
1 year and over . . . . . . . . . . . 3,952 16.3 0.5 0.014 15.5 15.6 15.8 15.8 15.9 16.3 16.6 16.8 16.9 17.1 17.41–2 years . . . . . . . . . . . . . 281 16.1 0.4 0.028 * * 15.6 15.7 15.8 16.0 16.3 16.4 16.5 * *3–5 years . . . . . . . . . . . . . 500 16.1 0.4 0.021 * 15.5 15.6 15.7 15.8 16.1 16.3 16.5 16.6 16.8 *6–8 years . . . . . . . . . . . . . 256 16.0 0.4 0.028 * * 15.6 15.6 15.7 16.0 16.3 16.4 16.4 * *9–11 years . . . . . . . . . . . . . 263 16.1 0.4 0.032 * * 15.7 15.8 15.8 16.1 16.4 16.6 16.8 * *12–14 years . . . . . . . . . . . . 214 16.2 0.4 0.037 * * 15.7 15.8 15.9 16.2 16.5 16.7 16.8 * *15–19 years . . . . . . . . . . . . 292 16.4 0.5 0.033 * 15.8 15.8 15.9 16.0 16.3 16.7 16.9 17.0 17.3 *20–29 years . . . . . . . . . . . . 625 16.4 0.5 0.025 * 15.7 15.8 15.9 16.0 16.3 16.6 16.8 17.0 17.3 *30–39 years . . . . . . . . . . . . 503 16.4 0.5 0.027 * 15.6 15.8 15.9 16.0 16.3 16.6 16.9 17.0 17.3 *40–49 years . . . . . . . . . . . . 353 16.3 0.7 0.042 * 15.6 15.8 15.9 16.0 16.3 16.6 16.8 16.9 17.2 *50–59 years . . . . . . . . . . . . 182 16.5 0.5 0.043 * * 15.9 16.0 16.1 16.4 16.6 17.0 17.1 * *60–69 years . . . . . . . . . . . . 313 16.4 0.5 0.033 * 15.8 15.9 16.0 16.1 16.4 16.7 16.9 17.0 17.3 *70 years and over . . . . . . . . 170 16.5 0.5 0.051 * * 15.9 16.0 16.1 16.5 16.8 17.0 17.2 * *
* Does not meet standards for reliability or precision.1Includes all other race/ethnic groups not listed separately.
Page 48 [ Series 11, No. 247

Table 31. White blood cell count as 109 cells per liter for persons 1 year and over, number of examined persons, mean, standard deviation,standard error of the mean, and selected percentiles, by race/ethnicity and age: United States, 1988–94
Race/ethnicity and age
Number ofexaminedpersons Mean
Standarddeviation
Standarderror ofmean
Percentile
2.5th 5th 10th 15th 25th 50th 75th 85th 90th 95th 97.5th
All race/ethnic groups1
1 year and over . . . . . . . . . . . 26,372 7.33 2.27 0.030 4.01 4.40 4.90 5.20 5.80 7.01 8.51 9.39 10.06 11.26 12.561–2 years . . . . . . . . . . . . . 1,789 8.70 2.47 0.095 4.85 5.20 5.80 6.35 6.95 8.36 10.01 11.20 12.00 13.20 14.143–5 years . . . . . . . . . . . . . 2,618 7.79 2.20 0.070 4.10 4.66 5.25 5.65 6.30 7.55 8.94 10.05 10.64 11.70 12.656–8 years . . . . . . . . . . . . . 1,384 7.53 2.06 0.090 4.25 4.70 5.30 5.55 6.10 7.35 8.65 9.35 10.10 11.15 12.419–11 years . . . . . . . . . . . . . 1,507 7.10 2.03 0.085 4.00 4.30 4.65 5.10 5.60 6.90 8.19 9.01 9.51 10.40 11.8512–14 years . . . . . . . . . . . . 1,161 7.15 2.07 0.099 4.05 4.30 4.76 5.10 5.70 6.90 8.19 9.11 9.69 10.90 11.6115–19 years . . . . . . . . . . . . 1,786 7.36 2.16 0.083 3.90 4.40 5.01 5.35 5.85 7.09 8.55 9.40 10.19 11.31 12.8520–29 years . . . . . . . . . . . . 3,331 7.39 2.23 0.063 3.95 4.35 4.80 5.20 5.80 7.10 8.65 9.56 10.26 11.40 12.6030–39 years . . . . . . . . . . . . 3,158 7.32 2.26 0.065 4.05 4.41 4.90 5.16 5.70 6.95 8.55 9.34 10.20 11.31 12.6040–49 years . . . . . . . . . . . . 2,467 7.18 2.10 0.069 3.90 4.35 4.90 5.15 5.70 6.90 8.31 9.25 9.86 11.01 12.3150–59 years . . . . . . . . . . . . 1,803 7.19 2.21 0.085 3.95 4.40 4.80 5.10 5.65 6.90 8.30 9.35 10.01 11.15 12.0660–69 years . . . . . . . . . . . . 2,241 7.17 2.52 0.087 3.90 4.30 4.85 5.15 5.75 6.76 8.30 9.01 9.55 10.60 12.3170 years and over . . . . . . . . 3,127 7.29 2.62 0.076 4.09 4.45 4.90 5.20 5.76 6.95 8.30 9.14 9.80 11.06 12.50
Non-Hispanic white
1 year and over . . . . . . . . . . . 9,521 7.39 2.27 0.035 4.15 4.55 5.00 5.30 5.85 7.09 8.51 9.40 10.06 11.30 12.601–2 years . . . . . . . . . . . . . 567 8.73 2.32 0.119 * 5.35 6.10 6.55 7.09 8.35 10.01 11.19 11.95 13.05 *3–5 years . . . . . . . . . . . . . 655 7.83 2.09 0.100 * 4.75 5.45 5.80 6.45 7.60 8.94 10.05 10.45 11.69 *6–8 years . . . . . . . . . . . . . 365 7.65 2.01 0.129 * 5.01 5.40 5.70 6.15 7.50 8.70 9.36 10.35 11.20 *9–11 years . . . . . . . . . . . . . 386 7.22 1.99 0.124 * 4.40 4.85 5.30 6.00 7.05 8.20 9.01 9.51 10.25 *12–14 years . . . . . . . . . . . . 293 7.22 2.00 0.143 * * 4.85 5.20 6.00 6.95 8.40 9.15 9.56 * *15–19 years . . . . . . . . . . . . 465 7.54 2.08 0.118 * 4.85 5.26 5.55 6.05 7.25 8.65 9.52 10.19 11.50 *20–29 years . . . . . . . . . . . . 858 7.48 2.24 0.094 * 4.40 4.85 5.30 5.90 7.15 8.81 9.65 10.45 11.45 *30–39 years . . . . . . . . . . . . 1,007 7.34 2.25 0.087 * 4.55 4.95 5.20 5.70 7.00 8.55 9.26 10.19 11.44 *40–49 years . . . . . . . . . . . . 871 7.22 2.07 0.086 * 4.50 4.95 5.20 5.76 6.95 8.31 9.19 9.85 11.01 *50–59 years . . . . . . . . . . . . 883 7.24 2.23 0.092 * 4.55 4.85 5.15 5.70 6.95 8.36 9.36 10.01 11.20 *60–69 years . . . . . . . . . . . . 966 7.21 2.58 0.102 * 4.35 4.95 5.20 5.80 6.80 8.30 9.00 9.55 10.61 *70 years and over . . . . . . . . 2,205 7.38 2.67 0.070 * 4.55 5.00 5.34 5.85 7.05 8.36 9.19 9.81 11.20 *
Non-Hispanic black
1 year and over . . . . . . . . . . . 7,749 6.65 2.16 0.025 3.45 3.80 4.20 4.55 5.10 6.34 7.80 8.80 9.51 10.51 11.641–2 years . . . . . . . . . . . . . 540 7.99 2.38 0.114 * 4.60 5.25 5.65 6.35 7.51 9.50 10.40 11.26 12.35 *3–5 years . . . . . . . . . . . . . 852 7.14 2.14 0.082 * 4.05 4.60 5.00 5.60 6.85 8.40 9.40 10.19 11.35 *6–8 years . . . . . . . . . . . . . 449 6.86 2.06 0.109 * 3.95 4.45 4.85 5.40 6.65 8.01 8.94 9.40 10.39 *9–11 years . . . . . . . . . . . . . 519 6.39 1.93 0.095 * 3.70 4.20 4.45 4.91 6.16 7.55 8.20 8.75 10.00 *12–14 years . . . . . . . . . . . . 404 6.39 2.29 0.127 * 3.65 4.10 4.45 4.90 5.90 7.40 8.15 8.80 10.19 *15–19 years . . . . . . . . . . . . 624 6.37 2.03 0.091 * 3.60 4.05 4.40 4.95 6.09 7.51 8.39 8.86 9.64 *20–29 years . . . . . . . . . . . . 1,052 6.68 2.13 0.073 * 3.95 4.35 4.65 5.15 6.30 7.85 8.90 9.65 10.39 *30–39 years . . . . . . . . . . . . 1,063 6.63 2.22 0.076 * 3.70 4.15 4.45 5.01 6.30 7.80 8.85 9.61 10.65 *40–49 years . . . . . . . . . . . . 761 6.56 2.16 0.087 * 3.70 4.20 4.45 4.90 6.20 7.66 8.80 9.60 10.44 *50–59 years . . . . . . . . . . . . 463 6.71 2.10 0.109 * 3.75 4.15 4.51 5.16 6.55 7.85 8.94 9.81 10.70 *60–69 years . . . . . . . . . . . . 550 6.50 2.18 0.104 * 3.90 4.30 4.55 5.01 6.15 7.45 8.55 9.20 10.16 *70 years and over . . . . . . . . 472 6.36 1.91 0.098 * 3.85 4.25 4.50 4.91 6.05 7.55 8.31 9.00 9.75 *
Mexican American
1 year and over . . . . . . . . . . . 7,946 7.77 2.21 0.035 4.35 4.84 5.30 5.65 6.25 7.45 8.94 9.94 10.64 11.70 12.811–2 years . . . . . . . . . . . . . 583 9.27 2.79 0.144 * 5.70 6.26 6.70 7.30 8.86 10.69 11.65 12.76 14.85 *3–5 years . . . . . . . . . . . . . 972 8.31 2.44 0.098 * 5.15 5.70 6.05 6.60 7.95 9.69 10.64 11.65 12.51 *6–8 years . . . . . . . . . . . . . 507 8.04 2.07 0.115 * 5.00 5.65 6.05 6.76 7.80 9.01 9.89 10.19 11.70 *9–11 years . . . . . . . . . . . . . 537 7.59 2.07 0.111 * 4.65 5.01 5.55 6.05 7.30 8.90 10.01 10.39 11.30 *12–14 years . . . . . . . . . . . . 409 7.66 2.16 0.133 * 4.70 5.25 5.55 6.00 7.34 8.84 9.90 10.70 11.50 *15–19 years . . . . . . . . . . . . 601 7.77 1.98 0.101 * 4.80 5.45 5.90 6.30 7.60 8.90 9.76 10.64 11.45 *20–29 years . . . . . . . . . . . . 1,279 7.57 2.04 0.071 * 4.70 5.20 5.50 6.10 7.35 8.81 9.61 10.26 11.35 *30–39 years . . . . . . . . . . . . 954 7.75 2.31 0.093 * 4.80 5.30 5.55 6.15 7.30 8.89 10.11 10.95 12.30 *40–49 years . . . . . . . . . . . . 725 7.58 2.08 0.096 * 4.95 5.20 5.60 6.15 7.30 8.75 9.56 9.90 11.05 *50–59 years . . . . . . . . . . . . 361 7.56 2.13 0.140 * 4.75 5.20 5.55 6.05 7.16 8.69 9.85 10.35 11.31 *60–69 years . . . . . . . . . . . . 647 7.47 2.06 0.101 * 4.85 5.30 5.65 6.15 7.20 8.40 9.35 10.01 10.61 *70 years and over . . . . . . . . 371 7.43 2.45 0.158 * 4.75 5.20 5.55 5.91 7.01 8.44 9.30 9.90 11.01 *
* Does not meet standards for reliability or precision.1Includes all other race/ethnic groups not listed separately.
Series 11, No. 247 [ Page 49

Table 32. White blood cell count as 109 cells per liter for males 1 year and over, number of examined persons, mean, standard deviation,standard error of the mean, and selected percentiles, by race/ethnicity and age: United States, 1988–94
Race/ethnicity and age
Number ofexaminedpersons Mean
Standarddeviation
Standarderror ofmean
Percentile
2.5th 5th 10th 15th 25th 50th 75th 85th 90th 95th 97.5th
All race/ethnic groups1
1 year and over . . . . . . . . . . . 12,624 7.30 2.26 0.043 4.05 4.40 4.90 5.25 5.76 7.00 8.40 9.26 9.95 11.15 12.441–2 years . . . . . . . . . . . . . 931 8.74 2.53 0.126 4.84 5.16 5.85 6.40 7.00 8.35 10.01 11.26 12.01 13.40 14.193–5 years . . . . . . . . . . . . . 1,281 7.68 2.26 0.096 4.10 4.70 5.10 5.60 6.15 7.35 8.70 9.95 10.60 11.75 12.856–8 years . . . . . . . . . . . . . 709 7.45 2.02 0.115 4.20 4.90 5.20 5.55 6.05 7.20 8.51 9.25 9.80 11.44 12.809–11 years . . . . . . . . . . . . . 773 7.01 2.07 0.113 4.00 4.10 4.55 4.95 5.55 6.90 8.11 8.95 9.50 10.05 11.7612–14 years . . . . . . . . . . . . 540 7.02 2.07 0.135 4.01 4.25 4.65 4.91 5.55 6.70 8.01 9.25 9.65 11.19 12.4415–19 years . . . . . . . . . . . . 836 7.15 2.11 0.110 3.70 4.30 4.80 5.10 5.60 6.85 8.35 9.19 10.15 11.06 12.4020–29 years . . . . . . . . . . . . 1,562 7.14 2.08 0.080 4.00 4.30 4.85 5.20 5.76 6.85 8.20 9.15 9.65 10.81 11.9430–39 years . . . . . . . . . . . . 1,401 7.23 2.13 0.086 4.10 4.45 4.90 5.20 5.65 6.95 8.44 9.15 9.90 11.00 12.2040–49 years . . . . . . . . . . . . 1,164 7.24 2.13 0.095 3.95 4.45 4.95 5.20 5.75 7.00 8.35 9.31 9.85 11.15 12.6950–59 years . . . . . . . . . . . . 834 7.36 2.26 0.119 4.01 4.59 4.95 5.20 5.80 7.01 8.44 9.56 10.06 11.51 13.0160–69 years . . . . . . . . . . . . 1,130 7.34 2.86 0.129 4.20 4.55 5.05 5.35 5.80 6.90 8.40 9.10 9.56 10.59 12.1970 years and over . . . . . . . . 1,463 7.43 2.72 0.108 4.10 4.50 5.00 5.35 5.91 7.05 8.39 9.20 10.01 11.31 12.69
Non-Hispanic white
1 year and over . . . . . . . . . . . 4,491 7.37 2.28 0.051 4.20 4.55 5.00 5.34 5.85 7.09 8.50 9.30 9.94 11.19 12.551–2 years . . . . . . . . . . . . . 297 8.73 2.34 0.157 * 5.40 6.10 6.51 7.15 8.34 10.05 11.19 12.00 13.30 *3–5 years . . . . . . . . . . . . . 323 7.67 2.17 0.139 * 4.70 5.01 5.59 6.15 7.35 8.70 9.91 10.56 11.90 *6–8 years . . . . . . . . . . . . . 190 7.52 1.89 0.159 * * 5.40 5.70 6.15 7.40 8.55 9.19 9.70 * *9–11 years . . . . . . . . . . . . . 200 7.11 1.98 0.161 * * 4.60 5.26 5.70 7.00 8.11 9.00 9.50 * *12–14 years . . . . . . . . . . . . 139 7.04 2.04 0.199 * * 4.76 4.91 5.50 6.70 8.01 9.20 9.56 * *15–19 years . . . . . . . . . . . . 195 7.47 2.13 0.176 * * 5.10 5.35 5.85 7.20 8.66 9.51 10.19 * *20–29 years . . . . . . . . . . . . 381 7.17 2.07 0.122 * 4.30 4.85 5.25 5.80 6.90 8.26 9.25 9.70 10.76 *30–39 years . . . . . . . . . . . . 435 7.27 2.12 0.117 * 4.60 4.95 5.30 5.65 7.00 8.51 9.15 9.90 11.01 *40–49 years . . . . . . . . . . . . 414 7.31 2.10 0.119 * 4.60 5.01 5.26 5.80 7.10 8.36 9.31 9.85 11.15 *50–59 years . . . . . . . . . . . . 410 7.45 2.32 0.132 * 4.60 4.95 5.25 5.95 7.10 8.55 9.69 10.30 11.90 *60–69 years . . . . . . . . . . . . 493 7.39 2.97 0.154 * 4.70 5.10 5.40 5.85 6.95 8.45 9.01 9.56 10.59 *70 years and over . . . . . . . . 1,014 7.59 2.78 0.101 * 4.70 5.20 5.55 6.05 7.15 8.51 9.31 10.19 11.45 *
Non-Hispanic black
1 year and over . . . . . . . . . . . 3,633 6.48 2.08 0.034 3.40 3.70 4.15 4.45 5.00 6.15 7.60 8.51 9.30 10.30 11.351–2 years . . . . . . . . . . . . . 275 8.02 2.50 0.173 * 4.60 5.15 5.55 6.20 7.30 9.61 10.90 11.50 12.90 *3–5 years . . . . . . . . . . . . . 419 7.05 2.06 0.115 * 4.16 4.70 5.00 5.60 6.65 8.31 9.39 10.15 10.86 *6–8 years . . . . . . . . . . . . . 229 6.75 2.12 0.160 * 3.95 4.34 4.76 5.26 6.45 7.95 8.85 9.31 10.40 *9–11 years . . . . . . . . . . . . . 267 6.25 1.96 0.137 * 3.55 4.05 4.30 4.80 6.15 7.45 8.06 8.40 9.86 *12–14 years . . . . . . . . . . . . 184 6.19 2.07 0.175 * * 3.95 4.20 4.80 5.80 7.05 8.01 9.10 * *15–19 years . . . . . . . . . . . . 298 5.88 1.64 0.109 * 3.35 3.80 4.15 4.55 5.85 6.95 7.75 8.06 8.56 *20–29 years . . . . . . . . . . . . 463 6.41 1.93 0.103 * 4.00 4.35 4.55 4.95 6.01 7.55 8.40 9.01 9.90 *30–39 years . . . . . . . . . . . . 461 6.36 2.12 0.113 * 3.50 3.95 4.25 4.85 6.10 7.55 8.50 9.06 10.01 *40–49 years . . . . . . . . . . . . 336 6.54 2.25 0.140 * 3.60 4.15 4.40 4.85 6.10 7.60 8.80 9.70 10.76 *50–59 years . . . . . . . . . . . . 207 6.80 2.08 0.166 * * 4.25 4.65 5.20 6.65 7.90 9.05 9.94 * *60–69 years . . . . . . . . . . . . 274 6.41 1.87 0.129 * 3.90 4.40 4.59 5.01 6.10 7.35 8.10 8.89 10.06 *70 years and over . . . . . . . . 220 6.20 1.89 0.146 * * 4.10 4.30 4.90 5.90 7.20 7.95 8.85 * *
Mexican American
1 year and over . . . . . . . . . . . 3,952 7.59 2.17 0.048 4.30 4.75 5.20 5.55 6.10 7.30 8.70 9.61 10.26 11.51 12.611–2 years . . . . . . . . . . . . . 298 9.38 2.96 0.206 * * 6.35 6.55 7.40 8.76 10.81 11.70 13.05 * *3–5 years . . . . . . . . . . . . . 466 8.23 2.41 0.134 * 5.30 5.80 6.10 6.76 7.90 9.19 10.20 11.16 12.40 *6–8 years . . . . . . . . . . . . . 250 7.91 2.03 0.154 * * 5.65 6.05 6.75 7.70 8.91 9.60 9.86 * *9–11 years . . . . . . . . . . . . . 272 7.41 2.06 0.150 * * 4.95 5.50 6.00 7.20 8.60 9.40 10.06 * *12–14 years . . . . . . . . . . . . 191 7.73 2.19 0.191 * * 5.30 5.60 6.15 7.45 8.81 10.06 10.70 * *15–19 years . . . . . . . . . . . . 304 7.34 1.91 0.132 * 4.60 5.10 5.60 6.10 6.90 8.44 9.06 9.90 11.44 *20–29 years . . . . . . . . . . . . 647 7.36 1.99 0.094 * 4.55 5.10 5.40 5.85 7.20 8.45 9.39 10.01 11.01 *30–39 years . . . . . . . . . . . . 450 7.47 2.20 0.125 * 4.65 5.15 5.45 5.90 7.05 8.51 9.45 10.26 11.90 *40–49 years . . . . . . . . . . . . 369 7.40 1.98 0.124 * 4.90 5.15 5.50 6.05 7.20 8.70 9.26 9.76 10.69 *50–59 years . . . . . . . . . . . . 176 7.56 2.16 0.196 * * 5.20 5.55 6.10 7.15 8.65 9.51 10.05 * *60–69 years . . . . . . . . . . . . 330 7.51 1.91 0.127 * 4.90 5.45 5.65 6.20 7.15 8.51 9.81 10.05 10.61 *70 years and over . . . . . . . . 199 7.31 2.11 0.180 * * 5.45 5.55 5.95 7.00 8.06 8.86 9.50 * *
* Does not meet standards for reliability or precision.1Includes all other race/ethnic groups not listed separately.
Page 50 [ Series 11, No. 247
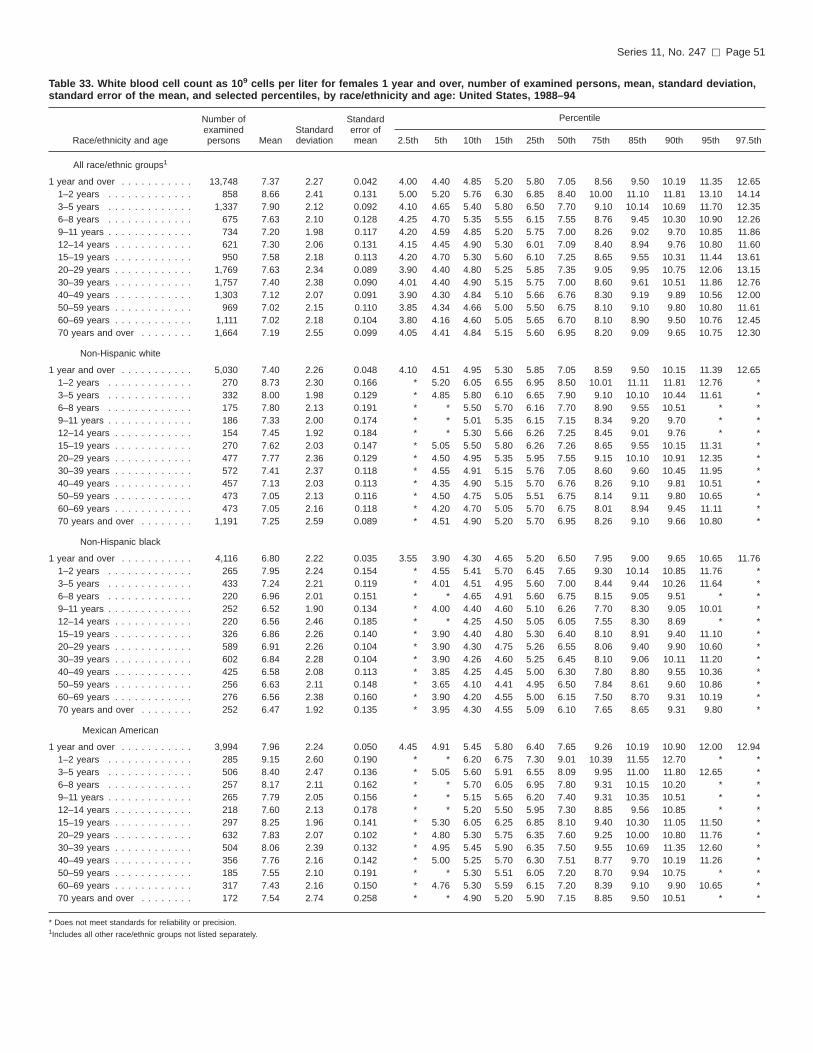
Table 33. White blood cell count as 109 cells per liter for females 1 year and over, number of examined persons, mean, standard deviation,standard error of the mean, and selected percentiles, by race/ethnicity and age: United States, 1988–94
Race/ethnicity and age
Number ofexaminedpersons Mean
Standarddeviation
Standarderror ofmean
Percentile
2.5th 5th 10th 15th 25th 50th 75th 85th 90th 95th 97.5th
All race/ethnic groups1
1 year and over . . . . . . . . . . . 13,748 7.37 2.27 0.042 4.00 4.40 4.85 5.20 5.80 7.05 8.56 9.50 10.19 11.35 12.651–2 years . . . . . . . . . . . . . 858 8.66 2.41 0.131 5.00 5.20 5.76 6.30 6.85 8.40 10.00 11.10 11.81 13.10 14.143–5 years . . . . . . . . . . . . . 1,337 7.90 2.12 0.092 4.10 4.65 5.40 5.80 6.50 7.70 9.10 10.14 10.69 11.70 12.356–8 years . . . . . . . . . . . . . 675 7.63 2.10 0.128 4.25 4.70 5.35 5.55 6.15 7.55 8.76 9.45 10.30 10.90 12.269–11 years . . . . . . . . . . . . . 734 7.20 1.98 0.117 4.20 4.59 4.85 5.20 5.75 7.00 8.26 9.02 9.70 10.85 11.8612–14 years . . . . . . . . . . . . 621 7.30 2.06 0.131 4.15 4.45 4.90 5.30 6.01 7.09 8.40 8.94 9.76 10.80 11.6015–19 years . . . . . . . . . . . . 950 7.58 2.18 0.113 4.20 4.70 5.30 5.60 6.10 7.25 8.65 9.55 10.31 11.44 13.6120–29 years . . . . . . . . . . . . 1,769 7.63 2.34 0.089 3.90 4.40 4.80 5.25 5.85 7.35 9.05 9.95 10.75 12.06 13.1530–39 years . . . . . . . . . . . . 1,757 7.40 2.38 0.090 4.01 4.40 4.90 5.15 5.75 7.00 8.60 9.61 10.51 11.86 12.7640–49 years . . . . . . . . . . . . 1,303 7.12 2.07 0.091 3.90 4.30 4.84 5.10 5.66 6.76 8.30 9.19 9.89 10.56 12.0050–59 years . . . . . . . . . . . . 969 7.02 2.15 0.110 3.85 4.34 4.66 5.00 5.50 6.75 8.10 9.10 9.80 10.80 11.6160–69 years . . . . . . . . . . . . 1,111 7.02 2.18 0.104 3.80 4.16 4.60 5.05 5.65 6.70 8.10 8.90 9.50 10.76 12.4570 years and over . . . . . . . . 1,664 7.19 2.55 0.099 4.05 4.41 4.84 5.15 5.60 6.95 8.20 9.09 9.65 10.75 12.30
Non-Hispanic white
1 year and over . . . . . . . . . . . 5,030 7.40 2.26 0.048 4.10 4.51 4.95 5.30 5.85 7.05 8.59 9.50 10.15 11.39 12.651–2 years . . . . . . . . . . . . . 270 8.73 2.30 0.166 * 5.20 6.05 6.55 6.95 8.50 10.01 11.11 11.81 12.76 *3–5 years . . . . . . . . . . . . . 332 8.00 1.98 0.129 * 4.85 5.80 6.10 6.65 7.90 9.10 10.10 10.44 11.61 *6–8 years . . . . . . . . . . . . . 175 7.80 2.13 0.191 * * 5.50 5.70 6.16 7.70 8.90 9.55 10.51 * *9–11 years . . . . . . . . . . . . . 186 7.33 2.00 0.174 * * 5.01 5.35 6.15 7.15 8.34 9.20 9.70 * *12–14 years . . . . . . . . . . . . 154 7.45 1.92 0.184 * * 5.30 5.66 6.26 7.25 8.45 9.01 9.76 * *15–19 years . . . . . . . . . . . . 270 7.62 2.03 0.147 * 5.05 5.50 5.80 6.26 7.26 8.65 9.55 10.15 11.31 *20–29 years . . . . . . . . . . . . 477 7.77 2.36 0.129 * 4.50 4.95 5.35 5.95 7.55 9.15 10.10 10.91 12.35 *30–39 years . . . . . . . . . . . . 572 7.41 2.37 0.118 * 4.55 4.91 5.15 5.76 7.05 8.60 9.60 10.45 11.95 *40–49 years . . . . . . . . . . . . 457 7.13 2.03 0.113 * 4.35 4.90 5.15 5.70 6.76 8.26 9.10 9.81 10.51 *50–59 years . . . . . . . . . . . . 473 7.05 2.13 0.116 * 4.50 4.75 5.05 5.51 6.75 8.14 9.11 9.80 10.65 *60–69 years . . . . . . . . . . . . 473 7.05 2.16 0.118 * 4.20 4.70 5.05 5.70 6.75 8.01 8.94 9.45 11.11 *70 years and over . . . . . . . . 1,191 7.25 2.59 0.089 * 4.51 4.90 5.20 5.70 6.95 8.26 9.10 9.66 10.80 *
Non-Hispanic black
1 year and over . . . . . . . . . . . 4,116 6.80 2.22 0.035 3.55 3.90 4.30 4.65 5.20 6.50 7.95 9.00 9.65 10.65 11.761–2 years . . . . . . . . . . . . . 265 7.95 2.24 0.154 * 4.55 5.41 5.70 6.45 7.65 9.30 10.14 10.85 11.76 *3–5 years . . . . . . . . . . . . . 433 7.24 2.21 0.119 * 4.01 4.51 4.95 5.60 7.00 8.44 9.44 10.26 11.64 *6–8 years . . . . . . . . . . . . . 220 6.96 2.01 0.151 * * 4.65 4.91 5.60 6.75 8.15 9.05 9.51 * *9–11 years . . . . . . . . . . . . . 252 6.52 1.90 0.134 * 4.00 4.40 4.60 5.10 6.26 7.70 8.30 9.05 10.01 *12–14 years . . . . . . . . . . . . 220 6.56 2.46 0.185 * * 4.25 4.50 5.05 6.05 7.55 8.30 8.69 * *15–19 years . . . . . . . . . . . . 326 6.86 2.26 0.140 * 3.90 4.40 4.80 5.30 6.40 8.10 8.91 9.40 11.10 *20–29 years . . . . . . . . . . . . 589 6.91 2.26 0.104 * 3.90 4.30 4.75 5.26 6.55 8.06 9.40 9.90 10.60 *30–39 years . . . . . . . . . . . . 602 6.84 2.28 0.104 * 3.90 4.26 4.60 5.25 6.45 8.10 9.06 10.11 11.20 *40–49 years . . . . . . . . . . . . 425 6.58 2.08 0.113 * 3.85 4.25 4.45 5.00 6.30 7.80 8.80 9.55 10.36 *50–59 years . . . . . . . . . . . . 256 6.63 2.11 0.148 * 3.65 4.10 4.41 4.95 6.50 7.84 8.61 9.60 10.86 *60–69 years . . . . . . . . . . . . 276 6.56 2.38 0.160 * 3.90 4.20 4.55 5.00 6.15 7.50 8.70 9.31 10.19 *70 years and over . . . . . . . . 252 6.47 1.92 0.135 * 3.95 4.30 4.55 5.09 6.10 7.65 8.65 9.31 9.80 *
Mexican American
1 year and over . . . . . . . . . . . 3,994 7.96 2.24 0.050 4.45 4.91 5.45 5.80 6.40 7.65 9.26 10.19 10.90 12.00 12.941–2 years . . . . . . . . . . . . . 285 9.15 2.60 0.190 * * 6.20 6.75 7.30 9.01 10.39 11.55 12.70 * *3–5 years . . . . . . . . . . . . . 506 8.40 2.47 0.136 * 5.05 5.60 5.91 6.55 8.09 9.95 11.00 11.80 12.65 *6–8 years . . . . . . . . . . . . . 257 8.17 2.11 0.162 * * 5.70 6.05 6.95 7.80 9.31 10.15 10.20 * *9–11 years . . . . . . . . . . . . . 265 7.79 2.05 0.156 * * 5.15 5.65 6.20 7.40 9.31 10.35 10.51 * *12–14 years . . . . . . . . . . . . 218 7.60 2.13 0.178 * * 5.20 5.50 5.95 7.30 8.85 9.56 10.85 * *15–19 years . . . . . . . . . . . . 297 8.25 1.96 0.141 * 5.30 6.05 6.25 6.85 8.10 9.40 10.30 11.05 11.50 *20–29 years . . . . . . . . . . . . 632 7.83 2.07 0.102 * 4.80 5.30 5.75 6.35 7.60 9.25 10.00 10.80 11.76 *30–39 years . . . . . . . . . . . . 504 8.06 2.39 0.132 * 4.95 5.45 5.90 6.35 7.50 9.55 10.69 11.35 12.60 *40–49 years . . . . . . . . . . . . 356 7.76 2.16 0.142 * 5.00 5.25 5.70 6.30 7.51 8.77 9.70 10.19 11.26 *50–59 years . . . . . . . . . . . . 185 7.55 2.10 0.191 * * 5.30 5.51 6.05 7.20 8.70 9.94 10.75 * *60–69 years . . . . . . . . . . . . 317 7.43 2.16 0.150 * 4.76 5.30 5.59 6.15 7.20 8.39 9.10 9.90 10.65 *70 years and over . . . . . . . . 172 7.54 2.74 0.258 * * 4.90 5.20 5.90 7.15 8.85 9.50 10.51 * *
* Does not meet standards for reliability or precision.1Includes all other race/ethnic groups not listed separately.
Series 11, No. 247 [ Page 51
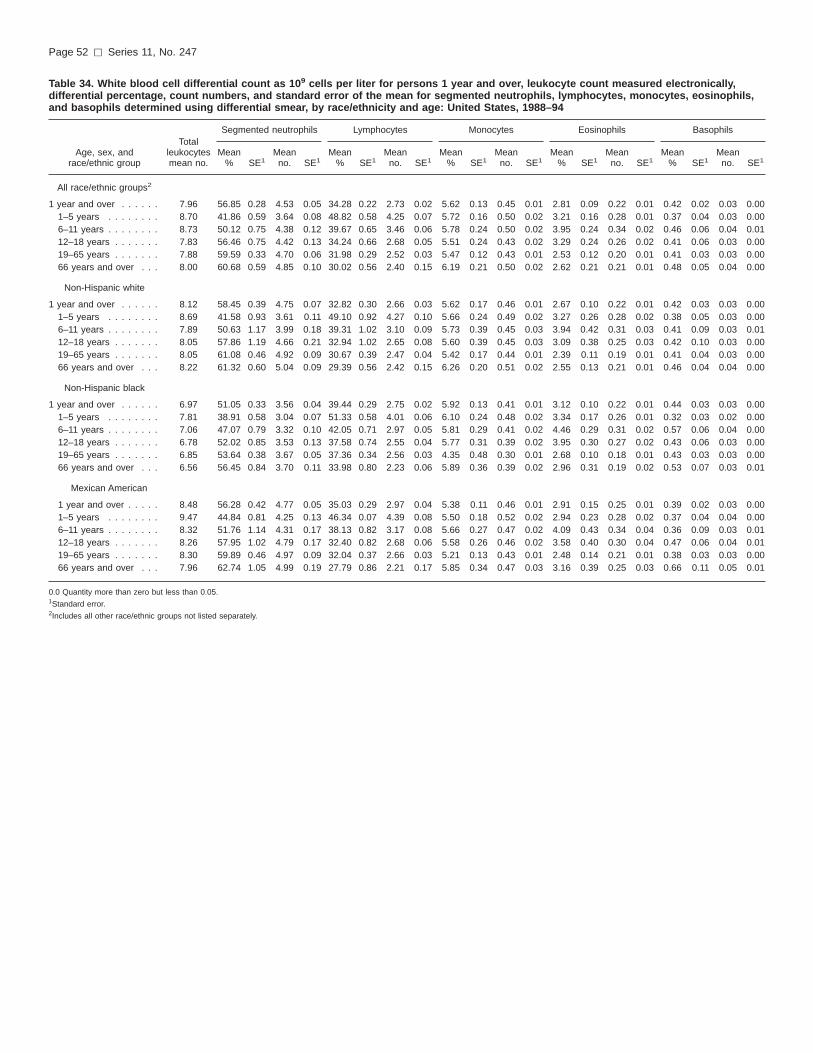
Table 34. White blood cell differential count as 109 cells per liter for persons 1 year and over, leukocyte count measured electronically,differential percentage, count numbers, and standard error of the mean for segmented neutrophils, lymphocytes, monocytes, eosinophils,and basophils determined using differential smear, by race/ethnicity and age: United States, 1988–94
Age, sex, andrace/ethnic group
Totalleukocytesmean no.
Segmented neutrophils Lymphocytes Monocytes Eosinophils Basophils
Mean% SE1
Meanno. SE1
Mean% SE1
Meanno. SE1
Mean% SE1
Meanno. SE1
Mean% SE1
Meanno. SE1
Mean% SE1
Meanno. SE1
All race/ethnic groups2
1 year and over . . . . . . 7.96 56.85 0.28 4.53 0.05 34.28 0.22 2.73 0.02 5.62 0.13 0.45 0.01 2.81 0.09 0.22 0.01 0.42 0.02 0.03 0.001–5 years . . . . . . . . 8.70 41.86 0.59 3.64 0.08 48.82 0.58 4.25 0.07 5.72 0.16 0.50 0.02 3.21 0.16 0.28 0.01 0.37 0.04 0.03 0.006–11 years . . . . . . . . 8.73 50.12 0.75 4.38 0.12 39.67 0.65 3.46 0.06 5.78 0.24 0.50 0.02 3.95 0.24 0.34 0.02 0.46 0.06 0.04 0.0112–18 years . . . . . . . 7.83 56.46 0.75 4.42 0.13 34.24 0.66 2.68 0.05 5.51 0.24 0.43 0.02 3.29 0.24 0.26 0.02 0.41 0.06 0.03 0.0019–65 years . . . . . . . 7.88 59.59 0.33 4.70 0.06 31.98 0.29 2.52 0.03 5.47 0.12 0.43 0.01 2.53 0.12 0.20 0.01 0.41 0.03 0.03 0.0066 years and over . . . 8.00 60.68 0.59 4.85 0.10 30.02 0.56 2.40 0.15 6.19 0.21 0.50 0.02 2.62 0.21 0.21 0.01 0.48 0.05 0.04 0.00
Non-Hispanic white
1 year and over . . . . . . 8.12 58.45 0.39 4.75 0.07 32.82 0.30 2.66 0.03 5.62 0.17 0.46 0.01 2.67 0.10 0.22 0.01 0.42 0.03 0.03 0.001–5 years . . . . . . . . 8.69 41.58 0.93 3.61 0.11 49.10 0.92 4.27 0.10 5.66 0.24 0.49 0.02 3.27 0.26 0.28 0.02 0.38 0.05 0.03 0.006–11 years . . . . . . . . 7.89 50.63 1.17 3.99 0.18 39.31 1.02 3.10 0.09 5.73 0.39 0.45 0.03 3.94 0.42 0.31 0.03 0.41 0.09 0.03 0.0112–18 years . . . . . . . 8.05 57.86 1.19 4.66 0.21 32.94 1.02 2.65 0.08 5.60 0.39 0.45 0.03 3.09 0.38 0.25 0.03 0.42 0.10 0.03 0.0019–65 years . . . . . . . 8.05 61.08 0.46 4.92 0.09 30.67 0.39 2.47 0.04 5.42 0.17 0.44 0.01 2.39 0.11 0.19 0.01 0.41 0.04 0.03 0.0066 years and over . . . 8.22 61.32 0.60 5.04 0.09 29.39 0.56 2.42 0.15 6.26 0.20 0.51 0.02 2.55 0.13 0.21 0.01 0.46 0.04 0.04 0.00
Non-Hispanic black
1 year and over . . . . . . 6.97 51.05 0.33 3.56 0.04 39.44 0.29 2.75 0.02 5.92 0.13 0.41 0.01 3.12 0.10 0.22 0.01 0.44 0.03 0.03 0.001–5 years . . . . . . . . 7.81 38.91 0.58 3.04 0.07 51.33 0.58 4.01 0.06 6.10 0.24 0.48 0.02 3.34 0.17 0.26 0.01 0.32 0.03 0.02 0.006–11 years . . . . . . . . 7.06 47.07 0.79 3.32 0.10 42.05 0.71 2.97 0.05 5.81 0.29 0.41 0.02 4.46 0.29 0.31 0.02 0.57 0.06 0.04 0.0012–18 years . . . . . . . 6.78 52.02 0.85 3.53 0.13 37.58 0.74 2.55 0.04 5.77 0.31 0.39 0.02 3.95 0.30 0.27 0.02 0.43 0.06 0.03 0.0019–65 years . . . . . . . 6.85 53.64 0.38 3.67 0.05 37.36 0.34 2.56 0.03 4.35 0.48 0.30 0.01 2.68 0.10 0.18 0.01 0.43 0.03 0.03 0.0066 years and over . . . 6.56 56.45 0.84 3.70 0.11 33.98 0.80 2.23 0.06 5.89 0.36 0.39 0.02 2.96 0.31 0.19 0.02 0.53 0.07 0.03 0.01
Mexican American
1 year and over . . . . . 8.48 56.28 0.42 4.77 0.05 35.03 0.29 2.97 0.04 5.38 0.11 0.46 0.01 2.91 0.15 0.25 0.01 0.39 0.02 0.03 0.001–5 years . . . . . . . . 9.47 44.84 0.81 4.25 0.13 46.34 0.07 4.39 0.08 5.50 0.18 0.52 0.02 2.94 0.23 0.28 0.02 0.37 0.04 0.04 0.006–11 years . . . . . . . . 8.32 51.76 1.14 4.31 0.17 38.13 0.82 3.17 0.08 5.66 0.27 0.47 0.02 4.09 0.43 0.34 0.04 0.36 0.09 0.03 0.0112–18 years . . . . . . . 8.26 57.95 1.02 4.79 0.17 32.40 0.82 2.68 0.06 5.58 0.26 0.46 0.02 3.58 0.40 0.30 0.04 0.47 0.06 0.04 0.0119–65 years . . . . . . . 8.30 59.89 0.46 4.97 0.09 32.04 0.37 2.66 0.03 5.21 0.13 0.43 0.01 2.48 0.14 0.21 0.01 0.38 0.03 0.03 0.0066 years and over . . . 7.96 62.74 1.05 4.99 0.19 27.79 0.86 2.21 0.17 5.85 0.34 0.47 0.03 3.16 0.39 0.25 0.03 0.66 0.11 0.05 0.01
0.0 Quantity more than zero but less than 0.05.1Standard error.2Includes all other race/ethnic groups not listed separately.
Page 52 [ Series 11, No. 247

Table 35. White blood cell differential count as 109 cells per liter for males 1 year and over, leukocyte count measured electronically,differential count percentage, numbers, and standard error of the mean for segmented neutrophils, lymphocytes, monocytes, eosinophils,and basophils determined using differential smear, by race/ethnicity and age: United States, 1988–94
Age, sex, andrace/ethnic group
Totalleukocytesmean no.
Segmented neutrophils Lymphocytes Monocytes Eosinophils Basophils
Mean% SE1
Meanno. SE1
Mean% SE1
Meanno. SE1
Mean% SE1
Meanno. SE1
Mean% SE1
Meanno. SE1
Mean% SE1
Meanno. SE1
All race/ethnic groups2
1 year and over . . . . . . 7.96 55.96 0.40 4.45 0.07 34.69 0.32 2.76 0.04 5.84 0.19 0.46 0.01 3.09 0.19 0.25 0.01 0.40 0.03 0.03 0.001–5 years . . . . . . . . 8.67 42.56 0.66 3.69 0.10 47.85 0.65 4.15 0.09 5.85 0.18 0.51 0.02 3.36 0.18 0.29 0.02 0.36 0.04 0.03 0.016–11 years . . . . . . . . 7.84 50.71 0.94 3.98 0.15 38.84 0.83 3.05 0.08 5.82 0.29 0.46 0.02 4.20 0.29 0.33 0.03 0.43 0.07 0.03 0.0412–18 years . . . . . . . 7.73 54.55 0.93 4.22 0.17 34.97 0.82 2.70 0.04 5.89 0.31 0.46 0.03 4.01 0.31 0.31 0.03 0.38 0.08 0.03 0.0119–65 years . . . . . . . 7.83 58.82 0.44 4.61 0.09 32.39 0.39 2.54 0.04 5.67 0.15 0.44 0.01 2.72 0.15 0.21 0.01 0.39 0.04 0.03 0.0066 years and over . . . 8.23 60.54 0.76 4.98 0.12 29.45 0.74 2.42 0.27 6.57 0.27 0.54 0.02 2.94 0.27 0.24 0.02 0.49 0.06 0.04 0.01
Non-Hispanic white
1 year and over . . . . . . 8.13 57.52 0.56 4.68 0.09 33.34 0.44 2.71 0.06 5.84 0.26 0.47 0.02 2.88 0.15 0.23 0.01 0.40 0.04 0.03 0.001–5 years . . . . . . . . 8.67 42.18 0.91 3.66 0.96 48.29 0.87 4.19 0.13 5.84 0.27 0.51 0.02 3.32 0.29 0.29 0.02 0.37 0.07 0.03 0.016–11 years . . . . . . . . 8.03 51.06 1.33 4.10 0.24 38.69 1.14 3.11 0.14 5.84 0.45 0.47 0.03 4.04 0.58 0.32 0.05 0.38 0.10 0.03 0.0112–18 years . . . . . . . 8.04 55.89 1.54 4.49 0.30 33.82 1.29 2.72 0.12 5.95 0.54 0.48 0.04 3.73 0.67 0.30 0.05 0.39 0.14 0.03 0.0119–65 years . . . . . . . 7.98 60.31 0.56 4.81 0.12 31.16 0.48 2.49 0.06 5.62 0.22 0.45 0.02 2.52 0.15 0.20 0.01 0.39 0.05 0.03 0.0066 years and over . . . 8.52 61.22 0.72 5.22 0.12 28.78 0.68 2.45 0.26 6.66 0.26 0.57 0.02 2.85 0.18 0.24 0.01 0.48 0.06 0.04 0.00
Non-Hispanic black
1 year and over . . . . . . 6.82 49.69 0.50 3.39 0.06 40.06 0.42 2.73 0.03 6.20 0.20 0.42 0.01 3.58 0.16 0.24 0.01 0.42 0.04 0.03 0.001–5 years . . . . . . . . 7.73 39.52 0.80 3.05 0.10 50.37 0.83 3.89 0.09 6.10 0.28 0.47 0.02 3.71 0.21 0.29 0.02 0.31 0.04 0.02 0.006–11 years . . . . . . . . 7.04 46.51 1.12 3.27 0.17 42.57 1.05 3.00 0.09 5.53 0.36 0.38 0.02 4.73 0.39 0.33 0.03 0.58 0.08 0.04 0.0112–18 years . . . . . . . 6.31 49.08 1.25 3.10 0.18 38.76 1.14 2.45 0.07 6.26 0.41 0.40 0.03 4.97 0.51 0.31 0.03 0.49 0.08 0.03 0.0119–65 years . . . . . . . 6.68 52.48 0.60 3.51 0.10 37.84 0.56 2.53 0.04 4.66 0.55 0.31 0.01 2.98 0.17 0.20 0.01 0.39 0.03 0.03 0.0066 years and over . . . 6.37 56.57 1.15 3.60 0.17 32.50 1.19 2.07 0.08 6.27 0.44 0.40 0.03 3.81 0.54 0.24 0.03 0.55 0.10 0.04 0.01
Mexican American
1 year and over . . . . . 8.28 55.06 0.58 4.56 0.07 35.54 0.41 2.94 0.05 5.82 0.17 0.48 0.01 3.20 0.22 0.26 0.02 0.40 0.03 0.03 0.001–5 years . . . . . . . . 9.48 44.45 1.05 4.21 0.19 46.25 0.97 4.38 0.13 5.79 0.22 0.55 0.03 3.16 0.27 0.30 0.03 0.34 0.05 0.03 0.016–11 years . . . . . . . . 7.88 51.41 1.62 4.05 0.28 37.52 1.23 2.96 0.11 6.30 0.37 0.50 0.03 4.46 0.56 0.35 0.05 0.35 0.06 0.03 0.0012–18 years . . . . . . . 8.02 55.39 1.31 4.44 0.21 34.05 1.18 2.73 0.11 5.83 0.33 0.47 0.03 4.25 0.56 0.34 0.07 0.49 0.09 0.04 0.0119–65 years . . . . . . . 8.09 58.74 0.68 4.75 0.14 32.53 0.57 2.63 0.05 5.67 0.18 0.46 0.02 2.68 0.18 0.22 0.01 0.39 0.04 0.03 0.0066 years and over . . . 7.68 62.62 1.30 4.81 0.26 27.45 1.10 2.11 0.09 6.43 0.39 0.49 0.03 2.80 0.46 0.22 0.04 0.59 0.12 0.05 0.01
0.00 Quantity more than zero but less than 0.05.1Standard error.2Includes all other race/ethnic groups not listed separately.
Series 11, No. 247 [ Page 53

Table 36. White blood cell differential count as 109 cells per liter for females 1 year and over, leukocyte count measured electronically,differential count numbers and standard error of the mean for segmented neutrophils, lymphocytes, monocytes, eosinophils, and basophilsdetermined using differential smear, by race/ethnicity and age: United States, 1988–94
Age, sex, andrace/ethnic group
Totalleukocytesmean no.
Segmented neutrophils Lymphocytes Monocytes Eosinophils Basophils
Mean% SE1
Meanno. SE1
Mean% SE1
Meanno. SE1
Mean% SE1
Meanno. SE1
Mean% SE1
Meanno. SE1
Mean% SE1
Meanno. SE1
All race/ethnic groups2
1 year and over . . . . . . 7.96 57.69 0.39 4.59 0.07 33.90 0.31 2.70 0.03 5.41 0.17 0.43 0.01 2.54 0.17 0.20 0.01 0.44 0.03 0.04 0.001–5 years . . . . . . . . 8.74 40.89 0.95 3.57 0.12 50.14 0.99 4.38 0.09 5.55 0.21 0.49 0.02 3.02 0.21 0.26 0.02 0.39 0.04 0.03 0.006–11 years . . . . . . . . 7.62 49.47 1.04 3.77 0.16 40.57 0.95 3.09 0.08 5.73 0.31 0.44 0.03 3.74 0.31 0.28 0.02 0.49 0.09 0.04 0.0112–18 years . . . . . . . 7.93 58.30 1.05 4.62 0.20 33.55 0.99 2.66 0.06 5.13 0.28 0.41 0.02 2.58 0.28 0.20 0.02 0.43 0.07 0.03 0.0119–65 years . . . . . . . 7.94 60.29 0.46 4.79 0.09 31.62 0.41 2.51 0.03 5.28 0.14 0.42 0.01 2.36 0.10 0.19 0.01 0.43 0.03 0.03 0.0066 years and over . . . 7.82 60.78 0.84 4.75 0.15 30.48 0.80 2.38 0.15 5.89 0.25 0.46 0.02 2.37 0.19 0.19 0.02 0.47 0.06 0.04 0.01
Non-Hispanic white
1 year and over . . . . . . 8.10 59.35 0.53 4.81 0.09 32.32 0.42 2.62 0.04 5.40 0.23 0.44 0.02 2.47 0.13 0.20 0.01 0.43 0.04 0.03 0.001–5 years . . . . . . . . 8.73 40.70 1.54 3.55 0.19 50.29 1.61 4.39 0.15 5.41 0.32 0.47 0.03 3.19 0.29 0.28 0.04 0.40 0.06 0.03 0.016–11 years . . . . . . . . 7.75 50.17 1.60 3.89 0.26 39.97 1.45 3.10 0.10 5.60 0.50 0.43 0.04 3.84 0.58 0.30 0.04 0.44 0.07 0.03 0.0112–18 years . . . . . . . 8.06 59.73 1.42 4.81 0.29 32.10 1.30 2.59 0.09 5.26 0.43 0.42 0.04 2.46 0.67 0.20 0.02 0.44 0.14 0.04 0.0119–65 years . . . . . . . 8.11 61.80 0.60 5.01 0.13 30.21 0.52 2.45 0.04 5.24 0.20 0.42 0.01 2.28 0.15 0.18 0.01 0.43 0.12 0.03 0.0066 years and over . . . 7.98 61.40 0.79 4.90 0.14 29.89 0.74 2.39 0.15 5.95 0.24 0.47 0.02 2.32 0.18 0.19 0.01 0.45 0.04 0.04 0.00
Non-Hispanic black
1 year and over . . . . . . 7.08 52.17 0.46 3.69 0.06 38.94 0.39 2.76 0.03 5.69 0.18 0.40 0.01 2.74 0.12 0.19 0.01 0.45 0.04 0.03 0.001–5 years . . . . . . . . 7.90 38.23 0.88 3.02 0.10 52.40 0.85 4.14 0.09 6.12 0.34 0.48 0.02 2.92 0.24 0.23 0.02 0.34 0.05 0.03 0.006–11 years . . . . . . . . 7.07 47.65 1.17 3.37 0.14 41.52 1.00 2.94 0.07 6.10 0.40 0.43 0.02 4.19 0.37 0.30 0.03 0.56 0.08 0.04 0.0112–18 years . . . . . . . 7.17 54.42 1.17 3.90 0.18 36.62 1.00 2.63 0.06 5.36 0.37 0.38 0.02 3.11 0.29 0.22 0.02 0.39 0.07 0.03 0.0119–65 years . . . . . . . 6.98 54.50 0.50 3.80 0.07 37.00 0.44 2.58 0.04 4.12 0.51 0.29 0.01 2.46 0.12 0.17 0.01 0.46 0.04 0.03 0.0166 years and over . . . 6.67 56.38 1.25 3.76 0.15 34.92 1.11 2.33 0.09 5.64 0.48 0.38 0.02 2.42 0.30 0.16 0.02 0.53 0.09 0.04 0.01
Mexican American
1 year and over . . . . . . 8.70 57.58 0.60 5.01 0.08 34.49 0.42 3.00 0.05 4.92 0.15 0.43 0.01 2.60 0.20 0.23 0.02 0.39 0.03 0.03 0.001–5 years . . . . . . . . 9.46 45.29 1.06 4.28 0.16 46.44 0.95 4.39 0.11 5.17 0.22 0.49 0.02 2.69 0.26 0.25 0.03 0.39 0.05 0.04 0.006–11 years . . . . . . . . 8.83 52.18 1.34 4.61 0.19 38.85 1.03 3.43 0.14 4.91 0.28 0.43 0.03 3.66 0.45 0.32 0.04 0.37 0.15 0.03 0.0112–18 years . . . . . . . 8.51 60.72 1.27 5.17 0.22 30.62 1.04 2.61 0.08 5.30 0.31 0.45 0.03 2.86 0.34 0.24 0.03 0.44 0.08 0.04 0.0119–65 years . . . . . . . 8.52 61.06 0.52 5.20 0.10 31.55 0.44 2.69 0.05 4.74 0.14 0.40 0.01 2.28 0.16 0.19 0.01 0.36 0.03 0.03 0.0066 years and over . . . 8.29 62.87 1.45 5.21 0.24 28.18 1.26 2.34 0.38 5.18 0.42 0.43 0.04 2.87 0.47 0.24 0.04 0.74 0.16 0.06 0.01
0.0 Quantity more than zero but less than 0.05.1Standard error.2Includes all other race/ethnic groups not listed separately.
Page 54 [ Series 11, No. 247
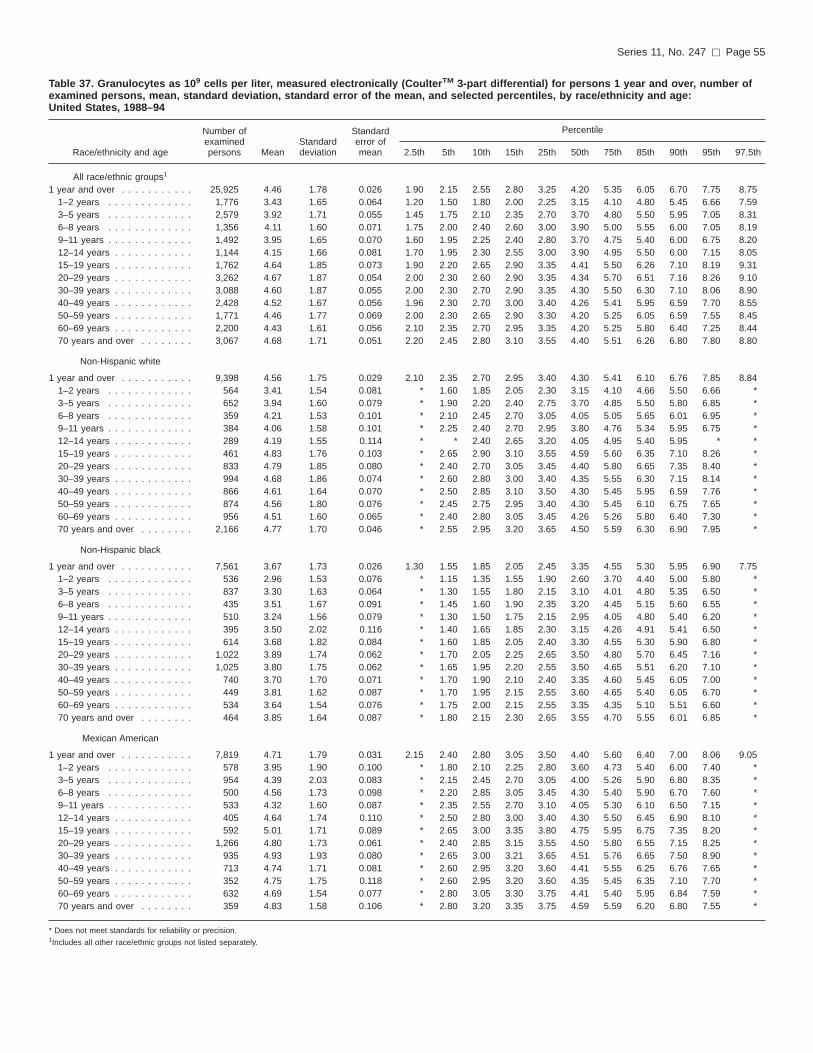
Table 37. Granulocytes as 109 cells per liter, measured electronically (CoulterTM 3-part differential) for persons 1 year and over, number ofexamined persons, mean, standard deviation, standard error of the mean, and selected percentiles, by race/ethnicity and age:United States, 1988–94
Race/ethnicity and age
Number ofexaminedpersons Mean
Standarddeviation
Standarderror ofmean
Percentile
2.5th 5th 10th 15th 25th 50th 75th 85th 90th 95th 97.5th
All race/ethnic groups1
1 year and over . . . . . . . . . . . 25,925 4.46 1.78 0.026 1.90 2.15 2.55 2.80 3.25 4.20 5.35 6.05 6.70 7.75 8.751–2 years . . . . . . . . . . . . . 1,776 3.43 1.65 0.064 1.20 1.50 1.80 2.00 2.25 3.15 4.10 4.80 5.45 6.66 7.593–5 years . . . . . . . . . . . . . 2,579 3.92 1.71 0.055 1.45 1.75 2.10 2.35 2.70 3.70 4.80 5.50 5.95 7.05 8.316–8 years . . . . . . . . . . . . . 1,356 4.11 1.60 0.071 1.75 2.00 2.40 2.60 3.00 3.90 5.00 5.55 6.00 7.05 8.199–11 years . . . . . . . . . . . . . 1,492 3.95 1.65 0.070 1.60 1.95 2.25 2.40 2.80 3.70 4.75 5.40 6.00 6.75 8.2012–14 years . . . . . . . . . . . . 1,144 4.15 1.66 0.081 1.70 1.95 2.30 2.55 3.00 3.90 4.95 5.50 6.00 7.15 8.0515–19 years . . . . . . . . . . . . 1,762 4.64 1.85 0.073 1.90 2.20 2.65 2.90 3.35 4.41 5.50 6.26 7.10 8.19 9.3120–29 years . . . . . . . . . . . . 3,262 4.67 1.87 0.054 2.00 2.30 2.60 2.90 3.35 4.34 5.70 6.51 7.16 8.26 9.1030–39 years . . . . . . . . . . . . 3,088 4.60 1.87 0.055 2.00 2.30 2.70 2.90 3.35 4.30 5.50 6.30 7.10 8.06 8.9040–49 years . . . . . . . . . . . . 2,428 4.52 1.67 0.056 1.96 2.30 2.70 3.00 3.40 4.26 5.41 5.95 6.59 7.70 8.5550–59 years . . . . . . . . . . . . 1,771 4.46 1.77 0.069 2.00 2.30 2.65 2.90 3.30 4.20 5.25 6.05 6.59 7.55 8.4560–69 years . . . . . . . . . . . . 2,200 4.43 1.61 0.056 2.10 2.35 2.70 2.95 3.35 4.20 5.25 5.80 6.40 7.25 8.4470 years and over . . . . . . . . 3,067 4.68 1.71 0.051 2.20 2.45 2.80 3.10 3.55 4.40 5.51 6.26 6.80 7.80 8.80
Non-Hispanic white
1 year and over . . . . . . . . . . . 9,398 4.56 1.75 0.029 2.10 2.35 2.70 2.95 3.40 4.30 5.41 6.10 6.76 7.85 8.841–2 years . . . . . . . . . . . . . 564 3.41 1.54 0.081 * 1.60 1.85 2.05 2.30 3.15 4.10 4.66 5.50 6.66 *3–5 years . . . . . . . . . . . . . 652 3.94 1.60 0.079 * 1.90 2.20 2.40 2.75 3.70 4.85 5.50 5.80 6.85 *6–8 years . . . . . . . . . . . . . 359 4.21 1.53 0.101 * 2.10 2.45 2.70 3.05 4.05 5.05 5.65 6.01 6.95 *9–11 years . . . . . . . . . . . . . 384 4.06 1.58 0.101 * 2.25 2.40 2.70 2.95 3.80 4.76 5.34 5.95 6.75 *12–14 years . . . . . . . . . . . . 289 4.19 1.55 0.114 * * 2.40 2.65 3.20 4.05 4.95 5.40 5.95 * *15–19 years . . . . . . . . . . . . 461 4.83 1.76 0.103 * 2.65 2.90 3.10 3.55 4.59 5.60 6.35 7.10 8.26 *20–29 years . . . . . . . . . . . . 833 4.79 1.85 0.080 * 2.40 2.70 3.05 3.45 4.40 5.80 6.65 7.35 8.40 *30–39 years . . . . . . . . . . . . 994 4.68 1.86 0.074 * 2.60 2.80 3.00 3.40 4.35 5.55 6.30 7.15 8.14 *40–49 years . . . . . . . . . . . . 866 4.61 1.64 0.070 * 2.50 2.85 3.10 3.50 4.30 5.45 5.95 6.59 7.76 *50–59 years . . . . . . . . . . . . 874 4.56 1.80 0.076 * 2.45 2.75 2.95 3.40 4.30 5.45 6.10 6.75 7.65 *60–69 years . . . . . . . . . . . . 956 4.51 1.60 0.065 * 2.40 2.80 3.05 3.45 4.26 5.26 5.80 6.40 7.30 *70 years and over . . . . . . . . 2,166 4.77 1.70 0.046 * 2.55 2.95 3.20 3.65 4.50 5.59 6.30 6.90 7.95 *
Non-Hispanic black
1 year and over . . . . . . . . . . . 7,561 3.67 1.73 0.026 1.30 1.55 1.85 2.05 2.45 3.35 4.55 5.30 5.95 6.90 7.751–2 years . . . . . . . . . . . . . 536 2.96 1.53 0.076 * 1.15 1.35 1.55 1.90 2.60 3.70 4.40 5.00 5.80 *3–5 years . . . . . . . . . . . . . 837 3.30 1.63 0.064 * 1.30 1.55 1.80 2.15 3.10 4.01 4.80 5.35 6.50 *6–8 years . . . . . . . . . . . . . 435 3.51 1.67 0.091 * 1.45 1.60 1.90 2.35 3.20 4.45 5.15 5.60 6.55 *9–11 years . . . . . . . . . . . . . 510 3.24 1.56 0.079 * 1.30 1.50 1.75 2.15 2.95 4.05 4.80 5.40 6.20 *12–14 years . . . . . . . . . . . . 395 3.50 2.02 0.116 * 1.40 1.65 1.85 2.30 3.15 4.26 4.91 5.41 6.50 *15–19 years . . . . . . . . . . . . 614 3.68 1.82 0.084 * 1.60 1.85 2.05 2.40 3.30 4.55 5.30 5.90 6.80 *20–29 years . . . . . . . . . . . . 1,022 3.89 1.74 0.062 * 1.70 2.05 2.25 2.65 3.50 4.80 5.70 6.45 7.16 *30–39 years . . . . . . . . . . . . 1,025 3.80 1.75 0.062 * 1.65 1.95 2.20 2.55 3.50 4.65 5.51 6.20 7.10 *40–49 years . . . . . . . . . . . . 740 3.70 1.70 0.071 * 1.70 1.90 2.10 2.40 3.35 4.60 5.45 6.05 7.00 *50–59 years . . . . . . . . . . . . 449 3.81 1.62 0.087 * 1.70 1.95 2.15 2.55 3.60 4.65 5.40 6.05 6.70 *60–69 years . . . . . . . . . . . . 534 3.64 1.54 0.076 * 1.75 2.00 2.15 2.55 3.35 4.35 5.10 5.51 6.60 *70 years and over . . . . . . . . 464 3.85 1.64 0.087 * 1.80 2.15 2.30 2.65 3.55 4.70 5.55 6.01 6.85 *
Mexican American
1 year and over . . . . . . . . . . . 7,819 4.71 1.79 0.031 2.15 2.40 2.80 3.05 3.50 4.40 5.60 6.40 7.00 8.06 9.051–2 years . . . . . . . . . . . . . 578 3.95 1.90 0.100 * 1.80 2.10 2.25 2.80 3.60 4.73 5.40 6.00 7.40 *3–5 years . . . . . . . . . . . . . 954 4.39 2.03 0.083 * 2.15 2.45 2.70 3.05 4.00 5.26 5.90 6.80 8.35 *6–8 years . . . . . . . . . . . . . 500 4.56 1.73 0.098 * 2.20 2.85 3.05 3.45 4.30 5.40 5.90 6.70 7.60 *9–11 years . . . . . . . . . . . . . 533 4.32 1.60 0.087 * 2.35 2.55 2.70 3.10 4.05 5.30 6.10 6.50 7.15 *12–14 years . . . . . . . . . . . . 405 4.64 1.74 0.110 * 2.50 2.80 3.00 3.40 4.30 5.50 6.45 6.90 8.10 *15–19 years . . . . . . . . . . . . 592 5.01 1.71 0.089 * 2.65 3.00 3.35 3.80 4.75 5.95 6.75 7.35 8.20 *20–29 years . . . . . . . . . . . . 1,266 4.80 1.73 0.061 * 2.40 2.85 3.15 3.55 4.50 5.80 6.55 7.15 8.25 *30–39 years . . . . . . . . . . . . 935 4.93 1.93 0.080 * 2.65 3.00 3.21 3.65 4.51 5.76 6.65 7.50 8.90 *40–49 years . . . . . . . . . . . . 713 4.74 1.71 0.081 * 2.60 2.95 3.20 3.60 4.41 5.55 6.25 6.76 7.65 *50–59 years . . . . . . . . . . . . 352 4.75 1.75 0.118 * 2.60 2.95 3.20 3.60 4.35 5.45 6.35 7.10 7.70 *60–69 years . . . . . . . . . . . . 632 4.69 1.54 0.077 * 2.80 3.05 3.30 3.75 4.41 5.40 5.95 6.84 7.59 *70 years and over . . . . . . . . 359 4.83 1.58 0.106 * 2.80 3.20 3.35 3.75 4.59 5.59 6.20 6.80 7.55 *
* Does not meet standards for reliability or precision.1Includes all other race/ethnic groups not listed separately.
Series 11, No. 247 [ Page 55

Table 38. Granulocytes as 109 cells per liter, measured electronically (CoulterTM 3-part differential) for males 1 year and over, number ofexamined persons, mean, standard deviation, standard error of the mean, and selected percentiles, by race/ethnicity and age:United States, 1988–94
Race/ethnicity and age
Number ofexaminedpersons Mean
Standarddeviation
Standarderror ofmean
Percentile
2.5th 5th 10th 15th 25th 50th 75th 85th 90th 95th 97.5th
All race/ethnic groups1
1 year and over . . . . . . . . . . . 12,457 4.40 1.73 0.036 1.90 2.15 2.55 2.80 3.25 4.15 5.20 5.91 6.50 7.60 8.601–2 years . . . . . . . . . . . . . 927 3.47 1.72 0.085 1.20 1.50 1.80 2.05 2.30 3.15 4.10 4.85 5.65 6.75 7.503–5 years . . . . . . . . . . . . . 1,268 3.86 1.73 0.073 1.40 1.75 2.10 2.35 2.65 3.55 4.70 5.40 5.90 7.30 8.506–8 years . . . . . . . . . . . . . 698 4.04 1.54 0.088 1.80 1.95 2.35 2.60 3.00 3.85 4.85 5.35 5.76 6.90 8.209–11 years . . . . . . . . . . . . . 770 3.87 1.64 0.089 1.60 1.90 2.25 2.40 2.75 3.55 4.70 5.30 5.85 6.41 7.3012–14 years . . . . . . . . . . . . 533 3.97 1.63 0.106 1.65 1.80 2.15 2.40 2.85 3.75 4.70 5.30 5.90 7.45 8.5015–19 years . . . . . . . . . . . . 829 4.43 1.78 0.093 1.90 2.10 2.50 2.75 3.05 4.25 5.30 6.05 6.80 7.95 9.0520–29 years . . . . . . . . . . . . 1,538 4.47 1.69 0.065 2.05 2.30 2.60 2.95 3.35 4.20 5.35 5.95 6.55 7.50 8.4430–39 years . . . . . . . . . . . . 1,378 4.51 1.76 0.072 2.00 2.35 2.70 2.95 3.30 4.15 5.30 6.15 6.80 7.70 8.8940–49 years . . . . . . . . . . . . 1,149 4.52 1.67 0.074 1.85 2.35 2.70 3.05 3.45 4.26 5.40 5.90 6.40 7.66 8.6550–59 years . . . . . . . . . . . . 820 4.63 1.84 0.097 2.05 2.35 2.75 3.00 3.45 4.30 5.50 6.15 6.90 7.65 9.0060–69 years . . . . . . . . . . . . 1,111 4.54 1.47 0.066 2.15 2.50 2.95 3.15 3.60 4.30 5.26 5.91 6.50 7.26 8.1170 years and over . . . . . . . . 1,436 4.82 1.77 0.071 2.30 2.55 2.90 3.25 3.65 4.50 5.65 6.40 7.10 8.19 9.10
Non-Hispanic white
1 year and over . . . . . . . . . . . 4,449 4.52 1.69 0.042 2.05 2.35 2.70 2.95 3.40 4.25 5.35 6.00 6.60 7.70 8.661–2 years . . . . . . . . . . . . . 296 3.42 1.52 0.099 * 1.60 1.90 2.10 2.30 3.15 4.09 4.70 5.65 6.65 *3–5 years . . . . . . . . . . . . . 323 3.83 1.58 0.099 * 1.80 2.15 2.40 2.70 3.55 4.70 5.35 5.70 7.10 *6–8 years . . . . . . . . . . . . . 187 4.12 1.42 0.117 * * 2.50 2.70 3.05 4.05 5.00 5.45 5.75 * *9–11 years . . . . . . . . . . . . . 200 3.95 1.50 0.119 * * 2.40 2.65 2.95 3.70 4.70 5.30 5.70 * *12–14 years . . . . . . . . . . . . 138 3.97 1.58 0.151 * * 2.20 2.45 2.80 3.75 4.60 5.20 5.85 * *15–19 years . . . . . . . . . . . . 195 4.71 1.78 0.143 * * 2.75 2.90 3.45 4.60 5.55 6.34 7.10 * *20–29 years . . . . . . . . . . . . 371 4.54 1.59 0.093 * 2.40 2.65 3.05 3.45 4.30 5.45 6.05 6.55 7.51 *30–39 years . . . . . . . . . . . . 431 4.60 1.76 0.095 * 2.65 2.85 3.05 3.35 4.30 5.40 6.16 7.05 7.90 *40–49 years . . . . . . . . . . . . 413 4.63 1.64 0.091 * 2.55 2.90 3.15 3.50 4.35 5.45 5.90 6.35 7.70 *50–59 years . . . . . . . . . . . . 407 4.75 1.88 0.105 * 2.60 2.85 3.10 3.55 4.35 5.55 6.25 6.95 8.01 *60–69 years . . . . . . . . . . . . 490 4.62 1.44 0.073 * 2.80 3.00 3.20 3.65 4.35 5.34 6.05 6.51 7.30 *70 years and over . . . . . . . . 998 4.94 1.76 0.063 * 2.75 3.15 3.40 3.80 4.60 5.76 6.55 7.25 8.20 *
Non-Hispanic black
1 year and over . . . . . . . . . . . 3,564 3.52 1.62 0.036 1.30 1.50 1.80 2.00 2.35 3.20 4.40 5.05 5.65 6.65 7.501–2 years . . . . . . . . . . . . . 273 2.99 1.60 0.111 * 1.15 1.40 1.55 1.90 2.60 3.70 4.45 5.20 6.30 *3–5 years . . . . . . . . . . . . . 415 3.32 1.61 0.091 * 1.35 1.55 1.80 2.15 3.10 4.01 4.85 5.50 6.85 *6–8 years . . . . . . . . . . . . . 224 3.39 1.67 0.128 * 1.40 1.60 1.75 2.20 3.15 4.10 5.10 5.60 6.75 *9–11 years . . . . . . . . . . . . . 265 3.11 1.51 0.106 * 1.30 1.50 1.80 2.15 2.80 3.70 4.62 5.10 6.30 *12–14 years . . . . . . . . . . . . 180 3.30 1.66 0.142 * * 1.55 1.75 2.10 3.00 3.95 4.90 5.40 * *15–19 years . . . . . . . . . . . . 297 3.30 1.36 0.090 * 1.40 1.80 2.00 2.30 3.00 4.20 4.65 5.10 5.65 *20–29 years . . . . . . . . . . . . 454 3.69 1.56 0.084 * 1.80 2.00 2.25 2.55 3.40 4.51 5.30 5.80 6.65 *30–39 years . . . . . . . . . . . . 445 3.61 1.70 0.092 * 1.55 1.80 2.00 2.40 3.25 4.55 5.15 5.76 6.70 *40–49 years . . . . . . . . . . . . 329 3.64 1.79 0.113 * 1.65 1.85 2.00 2.30 3.25 4.51 5.55 6.10 7.15 *50–59 years . . . . . . . . . . . . 201 3.91 1.62 0.131 * * 2.05 2.30 2.75 3.65 4.75 5.30 6.10 * *60–69 years . . . . . . . . . . . . 265 3.60 1.43 0.101 * 1.75 1.95 2.20 2.55 3.35 4.35 4.95 5.41 6.30 *70 years and over . . . . . . . . 216 3.80 1.64 0.128 * * 2.10 2.25 2.70 3.55 4.51 5.35 5.84 * *
Mexican American
1 year and over . . . . . . . . . . . 3,903 4.55 1.73 0.043 2.10 2.35 2.75 3.00 3.40 4.25 5.40 6.10 6.70 7.70 8.801–2 years . . . . . . . . . . . . . 298 3.93 1.94 0.137 * * 2.00 2.20 2.80 3.55 4.76 5.50 5.95 * *3–5 years . . . . . . . . . . . . . 458 4.38 2.06 0.117 * 2.30 2.55 2.75 3.15 4.01 5.00 5.70 6.35 7.91 *6–8 years . . . . . . . . . . . . . 248 4.50 1.75 0.135 * * 2.85 3.20 3.45 4.20 5.05 5.85 6.41 * *9–11 years . . . . . . . . . . . . . 271 4.17 1.55 0.115 * * 2.50 2.70 2.95 3.95 5.10 5.70 6.40 * *12–14 years . . . . . . . . . . . . 189 4.55 1.68 0.149 * * 2.90 3.00 3.35 4.25 5.30 6.41 6.84 * *15–19 years . . . . . . . . . . . . 299 4.59 1.64 0.116 * * 2.80 3.05 3.45 4.20 5.55 6.10 6.70 * *20–29 years . . . . . . . . . . . . 643 4.62 1.64 0.079 * 2.35 2.80 3.10 3.45 4.40 5.49 6.26 6.80 7.80 *30–39 years . . . . . . . . . . . . 447 4.66 1.80 0.103 * 2.50 2.80 3.05 3.45 4.35 5.45 6.26 6.80 7.91 *40–49 years . . . . . . . . . . . . 363 4.56 1.56 0.099 * 2.45 2.85 3.10 3.50 4.30 5.45 6.00 6.54 7.50 *50–59 years . . . . . . . . . . . . 171 4.87 1.92 0.179 * * 3.00 3.20 3.55 4.65 5.45 6.34 7.05 * *60–69 years . . . . . . . . . . . . 323 4.76 1.53 0.104 * 2.80 3.15 3.40 3.75 4.40 5.50 6.25 7.00 7.60 *70 years and over . . . . . . . . 193 4.85 1.61 0.141 * * 3.30 3.35 3.85 4.65 5.35 6.01 6.55 * *
* Does not meet standards for reliability or precision.1Includes all other race/ethnic groups not listed separately.
Page 56 [ Series 11, No. 247

Table 39. Granulocytes as 109 cells per liter, measured electronically (CoulterTM 3-part differential) for females 1 year and over, number ofexamined persons, mean, standard deviation, standard error of the mean, and selected percentiles, by race/ethnicity and age:United States, 1988–94
Race/ethnicity and age
Number ofexaminedpersons Mean
Standarddeviation
Standarderror ofmean
Percentile
2.5th 5th 10th 15th 25th 50th 75th 85th 90th 95th 97.5th
All race/ethnic groups1
1 year and over . . . . . . . . . . . 13,468 4.51 1.83 0.036 1.90 2.20 2.55 2.80 3.25 4.25 5.45 6.20 6.80 7.90 8.851–2 years . . . . . . . . . . . . . 849 3.39 1.58 0.089 1.20 1.50 1.80 1.95 2.20 3.15 4.10 4.76 5.30 6.40 7.703–5 years . . . . . . . . . . . . . 1,311 3.99 1.69 0.076 1.50 1.80 2.10 2.35 2.75 3.80 4.90 5.51 6.01 6.95 7.956–8 years . . . . . . . . . . . . . 658 4.19 1.65 0.105 1.65 2.00 2.40 2.55 3.00 4.00 5.15 5.80 6.30 7.45 8.119–11 years . . . . . . . . . . . . . 722 4.03 1.66 0.101 1.60 2.05 2.25 2.50 2.85 3.75 4.75 5.55 6.25 6.90 8.4112–14 years . . . . . . . . . . . . 611 4.34 1.68 0.111 1.85 2.25 2.55 2.75 3.20 4.25 5.20 5.55 6.20 7.00 7.5115–19 years . . . . . . . . . . . . 933 4.84 1.91 0.102 1.95 2.40 2.85 3.20 3.55 4.55 5.65 6.55 7.20 8.30 9.6020–29 years . . . . . . . . . . . . 1,724 4.87 2.01 0.079 1.95 2.25 2.55 2.85 3.35 4.45 6.05 6.95 7.60 8.65 9.6530–39 years . . . . . . . . . . . . 1,710 4.70 1.97 0.078 1.95 2.30 2.65 2.90 3.40 4.30 5.65 6.45 7.20 8.36 9.2040–49 years . . . . . . . . . . . . 1,279 4.52 1.68 0.077 2.00 2.30 2.60 2.90 3.35 4.25 5.50 6.05 6.60 7.70 8.3550–59 years . . . . . . . . . . . . 951 4.30 1.69 0.090 1.90 2.25 2.55 2.80 3.15 4.05 5.10 5.80 6.34 7.20 8.2560–69 years . . . . . . . . . . . . 1,089 4.34 1.72 0.085 2.00 2.30 2.50 2.75 3.15 4.10 5.15 5.70 6.25 7.25 8.6070 years and over . . . . . . . . 1,631 4.59 1.66 0.067 2.10 2.40 2.75 3.05 3.45 4.35 5.45 6.20 6.60 7.50 8.35
Non-Hispanic white
1 year and over . . . . . . . . . . . 4,949 4.61 1.80 0.042 2.10 2.35 2.70 2.95 3.35 4.30 5.50 6.20 6.90 8.00 8.901–2 years . . . . . . . . . . . . . 268 3.40 1.56 0.120 * 1.60 1.85 2.00 2.20 3.20 4.10 4.55 5.35 6.85 *3–5 years . . . . . . . . . . . . . 329 4.07 1.61 0.112 * 2.00 2.25 2.45 2.90 3.95 5.00 5.60 5.90 6.80 *6–8 years . . . . . . . . . . . . . 172 4.31 1.65 0.158 * * 2.40 2.60 3.10 4.05 5.34 5.95 6.55 * *9–11 years . . . . . . . . . . . . . 184 4.16 1.64 0.152 * * 2.50 2.70 3.05 3.90 4.80 5.55 6.30 * *12–14 years . . . . . . . . . . . . 151 4.46 1.46 0.149 * * 2.85 3.15 3.40 4.40 5.20 5.51 6.09 * *15–19 years . . . . . . . . . . . . 266 4.94 1.75 0.135 * 2.80 3.20 3.40 3.70 4.55 5.65 6.59 7.10 8.31 *20–29 years . . . . . . . . . . . . 462 5.04 2.03 0.119 * 2.40 2.70 3.10 3.55 4.65 6.20 7.16 7.90 8.76 *30–39 years . . . . . . . . . . . . 563 4.77 1.95 0.103 * 2.40 2.70 3.00 3.50 4.35 5.65 6.55 7.20 8.36 *40–49 years . . . . . . . . . . . . 453 4.58 1.64 0.097 * 2.45 2.80 3.05 3.50 4.30 5.50 5.95 6.59 7.80 *50–59 years . . . . . . . . . . . . 467 4.39 1.70 0.099 * 2.40 2.65 2.85 3.20 4.10 5.20 5.90 6.35 7.30 *60–69 years . . . . . . . . . . . . 466 4.42 1.73 0.101 * 2.40 2.65 2.85 3.20 4.20 5.25 5.75 6.26 7.35 *70 years and over . . . . . . . . 1,168 4.65 1.64 0.060 * 2.50 2.90 3.15 3.50 4.40 5.45 6.25 6.65 7.50 *
Non-Hispanic black
1 year and over . . . . . . . . . . . 3,997 3.79 1.80 0.038 1.35 1.55 1.90 2.10 2.50 3.45 4.65 5.55 6.20 7.10 8.001–2 years . . . . . . . . . . . . . 263 2.93 1.47 0.106 * 1.15 1.35 1.60 1.90 2.65 3.75 4.35 4.80 5.40 *3–5 years . . . . . . . . . . . . . 422 3.27 1.65 0.094 * 1.25 1.60 1.75 2.15 3.00 4.00 4.75 5.25 6.25 *6–8 years . . . . . . . . . . . . . 211 3.63 1.66 0.133 * * 1.65 2.00 2.45 3.40 4.65 5.15 5.66 * *9–11 years . . . . . . . . . . . . . 245 3.38 1.60 0.119 * 1.30 1.55 1.75 2.20 3.20 4.20 4.90 5.60 6.20 *12–14 years . . . . . . . . . . . . 215 3.68 2.27 0.181 * * 1.70 1.90 2.55 3.35 4.50 5.05 5.50 * *15–19 years . . . . . . . . . . . . 317 4.08 2.12 0.139 * 1.70 1.95 2.15 2.70 3.65 5.00 5.95 6.45 7.75 *20–29 years . . . . . . . . . . . . 568 4.06 1.87 0.092 * 1.60 2.05 2.30 2.70 3.65 5.05 6.30 6.70 7.30 *30–39 years . . . . . . . . . . . . 580 3.96 1.78 0.086 * 1.70 2.00 2.25 2.65 3.65 4.80 5.80 6.35 7.35 *40–49 years . . . . . . . . . . . . 411 3.75 1.63 0.094 * 1.70 1.95 2.15 2.45 3.45 4.65 5.40 6.05 6.95 *50–59 years . . . . . . . . . . . . 248 3.72 1.61 0.119 * 1.60 1.85 2.00 2.40 3.60 4.60 5.50 5.91 6.80 *60–69 years . . . . . . . . . . . . 269 3.67 1.62 0.115 * 1.80 2.00 2.10 2.60 3.30 4.45 5.20 5.90 6.65 *70 years and over . . . . . . . . 248 3.88 1.64 0.121 * 1.85 2.15 2.35 2.65 3.50 4.80 5.60 6.20 7.40 *
Mexican American
1 year and over . . . . . . . . . . . 3,916 4.88 1.84 0.045 2.20 2.50 2.90 3.15 3.60 4.55 5.84 6.70 7.30 8.40 9.391–2 years . . . . . . . . . . . . . 280 3.98 1.85 0.138 * * 2.15 2.30 2.80 3.75 4.70 5.30 6.05 * *3–5 years . . . . . . . . . . . . . 496 4.41 2.00 0.113 * 1.90 2.40 2.55 3.00 4.00 5.40 6.09 7.10 8.39 *6–8 years . . . . . . . . . . . . . 252 4.63 1.72 0.136 * * 2.80 2.95 3.30 4.35 5.60 6.10 6.80 * *9–11 years . . . . . . . . . . . . . 262 4.49 1.63 0.126 * * 2.55 2.85 3.25 4.10 5.76 6.40 6.76 * *12–14 years . . . . . . . . . . . . 216 4.72 1.79 0.153 * * 2.80 3.00 3.40 4.35 5.55 6.50 7.10 * *15–19 years . . . . . . . . . . . . 293 5.46 1.66 0.121 * 2.90 3.55 3.80 4.26 5.40 6.41 7.26 7.70 8.39 *20–29 years . . . . . . . . . . . . 623 5.02 1.80 0.090 * 2.50 3.00 3.25 3.70 4.75 6.10 6.80 7.70 8.56 *30–39 years . . . . . . . . . . . . 488 5.23 2.02 0.114 * 2.90 3.25 3.48 3.90 4.75 6.10 7.09 8.10 9.56 *40–49 years . . . . . . . . . . . . 350 4.93 1.84 0.123 * 2.75 3.00 3.35 3.75 4.60 5.76 6.45 7.10 8.06 *50–59 years . . . . . . . . . . . . 181 4.65 1.56 0.145 * * 2.95 3.20 3.60 4.26 5.40 6.51 7.15 * *60–69 years . . . . . . . . . . . . 309 4.63 1.54 0.110 * 2.75 3.00 3.25 3.65 4.45 5.20 5.85 6.40 7.55 *70 years and over . . . . . . . . 166 4.80 1.55 0.151 * * 3.10 3.35 3.65 4.50 5.60 6.26 7.10 * *
* Does not meet standards for reliability or precision.1Includes all other race/ethnic groups not listed separately.
Series 11, No. 247 [ Page 57

Table 40. Granulocytes in percentages, measured electronically (CoulterTM 3-part differential) for persons 1 year and over, number ofexamined persons, mean, standard deviation, standard error of the mean, and selected percentiles, by race/ethnicity and age:United States, 1988–94
Race/ethnicity and age
Number ofexaminedpersons Mean
Standarddeviation
Standarderror ofmean
Percentile
2.5th 5th 10th 15th 25th 50th 75th 85th 90th 95th 97.5th
All race/ethnic groups1
1 year and over . . . . . . . . . . . 25,925 60.0 10.3 0.152 36.3 41.5 47.0 50.2 54.3 60.9 67.0 69.8 72.1 75.3 77.81–2 years . . . . . . . . . . . . . 1,776 38.9 11.7 0.451 19.0 21.9 25.0 27.6 30.4 38.0 45.9 50.4 54.5 60.4 64.83–5 years . . . . . . . . . . . . . 2,579 49.2 10.9 0.349 28.4 31.9 35.5 38.0 41.7 48.8 56.6 60.0 63.0 67.6 72.06–8 years . . . . . . . . . . . . . 1,356 53.7 10.0 0.444 34.1 37.1 41.0 43.5 47.3 53.7 60.4 64.0 66.1 69.8 72.89–11 years . . . . . . . . . . . . . 1,492 54.4 9.8 0.414 35.0 38.9 42.5 45.1 48.3 54.2 60.7 64.6 66.8 70.0 73.012–14 years . . . . . . . . . . . . 1,144 56.9 9.1 0.441 38.4 41.4 44.8 48.0 51.9 57.1 62.9 65.1 67.6 72.0 74.315–19 years . . . . . . . . . . . . 1,762 61.7 9.6 0.371 41.3 45.0 50.0 52.3 56.3 62.3 68.0 70.8 72.9 76.2 79.020–29 years . . . . . . . . . . . . 3,262 62.1 8.9 0.254 44.0 47.4 51.1 53.1 56.6 62.3 67.8 71.3 73.4 76.4 78.930–39 years . . . . . . . . . . . . 3,088 61.8 8.6 0.253 42.3 47.1 51.2 53.3 56.9 62.1 67.6 69.9 72.4 75.3 78.340–49 years . . . . . . . . . . . . 2,428 62.1 8.5 0.281 43.8 46.7 51.3 54.1 57.2 62.3 68.1 70.4 72.3 75.3 77.150–59 years . . . . . . . . . . . . 1,771 61.2 8.5 0.329 43.5 47.3 50.6 53.0 55.8 61.6 66.6 69.5 71.7 74.4 76.660–69 years . . . . . . . . . . . . 2,200 61.6 9.0 0.312 43.3 46.6 50.6 52.7 56.3 62.5 67.3 69.9 72.0 74.9 77.970 years and over . . . . . . . . 3,067 64.2 9.5 0.281 44.3 48.1 51.9 55.2 58.7 65.0 70.8 73.5 75.4 78.0 80.6
Non-Hispanic white
1 year and over . . . . . . . . . . . 9,398 61.2 9.7 0.144 39.3 44.3 49.2 52.2 55.8 61.9 67.7 70.3 72.7 75.5 78.21–2 years . . . . . . . . . . . . . 564 38.7 11.5 0.589 * 22.4 25.3 27.7 30.1 37.8 45.6 50.2 53.3 60.1 *3–5 years . . . . . . . . . . . . . 652 49.4 10.1 0.485 * 33.8 36.9 38.6 42.2 48.8 56.3 59.6 62.4 66.6 *6–8 years . . . . . . . . . . . . . 359 54.4 9.4 0.608 * 38.3 42.3 44.1 47.7 54.2 61.3 64.3 66.7 69.9 *9–11 years . . . . . . . . . . . . . 384 55.2 8.8 0.545 * 42.2 44.9 46.6 49.2 54.8 61.1 64.6 66.5 68.2 *12–14 years . . . . . . . . . . . . 289 57.3 8.6 0.616 * * 46.2 48.6 52.4 57.4 63.0 65.0 66.9 * *15–19 years . . . . . . . . . . . . 461 63.1 8.6 0.488 * 49.8 52.0 54.3 57.8 63.8 68.7 71.2 73.1 77.1 *20–29 years . . . . . . . . . . . . 833 63.1 8.2 0.346 * 50.5 52.7 54.7 57.6 63.4 68.6 71.9 74.0 76.6 *30–39 years . . . . . . . . . . . . 994 62.8 7.9 0.305 * 50.6 53.0 55.2 57.9 62.7 68.2 70.2 73.0 75.5 *40–49 years . . . . . . . . . . . . 866 63.1 7.8 0.324 * 49.3 53.5 55.8 58.6 62.8 68.8 71.0 73.0 75.4 *50–59 years . . . . . . . . . . . . 874 62.1 7.7 0.318 * 49.8 52.5 54.5 56.8 62.1 67.0 69.7 72.0 74.4 *60–69 years . . . . . . . . . . . . 956 62.5 8.5 0.334 * 48.4 52.1 54.0 57.5 63.1 67.8 70.4 72.5 75.6 *70 years and over . . . . . . . . 2,166 64.8 9.3 0.244 * 49.0 53.3 55.9 59.4 65.4 71.1 73.7 75.6 78.1 *
Non-Hispanic black
1 year and over . . . . . . . . . . . 7,561 53.9 11.9 0.273 28.8 33.1 38.2 41.6 46.3 54.5 62.3 66.2 68.6 72.2 75.11–2 years . . . . . . . . . . . . . 536 36.4 11.9 0.639 * 18.7 21.8 24.5 28.0 35.2 43.5 49.2 54.4 58.0 *3–5 years . . . . . . . . . . . . . 837 45.0 12.4 0.533 * 25.4 29.4 32.0 36.1 44.7 53.0 57.8 60.5 66.4 *6–8 years . . . . . . . . . . . . . 435 49.8 12.1 0.720 * 28.6 33.4 37.7 41.9 50.8 58.4 62.5 65.4 68.2 *9–11 years . . . . . . . . . . . . . 510 49.2 11.7 0.644 * 29.6 34.0 36.8 40.8 49.2 57.0 60.9 65.0 68.5 *12–14 years . . . . . . . . . . . . 395 52.7 11.4 0.716 * 33.5 37.8 41.2 44.6 52.9 60.6 64.2 66.5 71.6 *15–19 years . . . . . . . . . . . . 614 55.7 11.2 0.563 * 37.2 41.0 43.8 48.3 56.0 63.1 67.2 70.2 74.2 *20–29 years . . . . . . . . . . . . 1,022 56.8 10.6 0.412 * 39.5 43.4 46.0 50.0 57.0 64.0 67.6 70.4 74.5 *30–39 years . . . . . . . . . . . . 1,025 56.0 10.2 0.396 * 38.9 42.2 45.1 49.0 56.0 63.0 66.9 69.4 72.5 *40–49 years . . . . . . . . . . . . 740 54.8 10.3 0.469 * 37.8 41.6 43.8 47.9 55.6 62.2 65.5 67.7 70.6 *50–59 years . . . . . . . . . . . . 449 55.7 10.5 0.615 * 37.2 41.6 44.8 48.7 55.8 63.4 66.8 68.9 72.1 *60–69 years . . . . . . . . . . . . 534 55.5 10.3 0.553 * 38.9 42.8 45.0 48.1 56.3 63.2 66.5 68.6 70.8 *70 years and over . . . . . . . . 464 59.1 11.1 0.644 * 40.5 44.7 47.0 51.3 59.2 66.6 70.3 72.6 76.9 *
Mexican American
1 year and over . . . . . . . . . . . 7,819 60.0 10.2 0.225 37.3 41.7 46.9 49.9 54.2 60.6 66.8 70.1 72.2 75.2 78.01–2 years . . . . . . . . . . . . . 578 42.1 11.3 0.627 * 24.8 27.9 29.9 34.2 41.4 49.3 54.0 56.6 61.9 *3–5 years . . . . . . . . . . . . . 954 51.7 10.9 0.473 * 35.0 38.0 40.6 43.7 51.0 59.4 63.4 65.5 70.8 *6–8 years . . . . . . . . . . . . . 500 55.8 10.5 0.626 * 38.9 42.6 44.7 47.7 56.7 63.1 66.6 68.8 72.6 *9–11 years . . . . . . . . . . . . . 533 56.3 8.7 0.505 * 40.7 45.5 48.1 50.2 56.7 62.2 65.0 67.0 71.6 *12–14 years . . . . . . . . . . . . 405 59.5 8.1 0.534 * 46.2 49.9 51.9 54.6 59.1 64.4 67.9 70.0 73.1 *15–19 years . . . . . . . . . . . . 592 63.6 8.4 0.459 * 50.2 52.8 54.9 57.6 63.4 69.7 72.6 74.2 76.8 *20–29 years . . . . . . . . . . . . 1,266 62.4 8.7 0.328 * 47.6 51.3 53.3 56.7 62.5 68.5 71.6 73.6 76.6 *30–39 years . . . . . . . . . . . . 935 62.5 8.3 0.360 * 48.6 52.0 54.2 57.3 62.6 67.8 70.3 72.8 76.1 *40–49 years . . . . . . . . . . . . 713 61.8 8.3 0.413 * 48.6 51.4 53.3 56.3 61.9 66.9 70.4 71.8 74.7 *50–59 years . . . . . . . . . . . . 352 62.5 8.6 0.613 * 49.4 52.4 54.0 56.6 61.8 68.9 71.5 72.6 75.1 *60–69 years . . . . . . . . . . . . 632 62.3 7.8 0.414 * 49.4 52.3 54.7 58.0 62.4 67.2 70.0 71.3 74.2 *70 years and over . . . . . . . . 359 65.3 8.6 0.602 * 50.5 54.1 57.0 59.8 65.6 71.0 74.8 76.1 78.3 *
* Does not meet standards for reliability or precision.1Includes all other race/ethnic groups not listed separately.
Page 58 [ Series 11, No. 247

Table 41. Granulocytes in percentages, measured electronically (CoulterTM 3-part differential) for males 1 year and over, number ofexamined persons, mean, standard deviation, standard error of the mean, and selected percentiles, by race/ethnicity and age:United States, 1988–94
Race/ethnicity and age
Number ofexaminedpersons Mean
Standarddeviation
Standarderror ofmean
Percentile
2.5th 5th 10th 15th 25th 50th 75th 85th 90th 95th 97.5th
All race/ethnic groups1
1 year and over . . . . . . . . . . . 12,457 59.7 10.3 0.218 36.3 40.9 46.3 49.8 54.2 60.5 66.5 69.3 71.6 74.9 77.51–2 years . . . . . . . . . . . . . 927 39.0 11.7 0.575 19.9 22.4 25.6 27.8 30.4 37.9 46.3 50.4 54.0 60.0 64.63–5 years . . . . . . . . . . . . . 1,268 49.0 10.8 0.457 29.1 32.5 36.5 38.3 41.5 48.1 56.3 59.8 63.4 68.4 72.16–8 years . . . . . . . . . . . . . 698 53.5 9.8 0.554 33.9 37.3 41.0 43.6 47.3 53.8 60.4 63.3 65.2 67.9 71.69–11 years . . . . . . . . . . . . . 770 54.2 9.5 0.513 35.8 38.8 41.7 44.5 48.3 54.4 60.0 63.7 65.9 69.7 72.512–14 years . . . . . . . . . . . . 533 55.5 9.6 0.623 37.0 38.7 42.1 45.1 50.1 55.6 61.2 64.9 66.4 72.7 74.615–19 years . . . . . . . . . . . . 829 60.6 9.1 0.473 42.0 44.1 49.2 51.0 54.8 60.8 66.8 69.6 71.7 75.1 77.620–29 years . . . . . . . . . . . . 1,538 61.8 8.2 0.313 45.1 48.0 52.1 53.7 56.8 62.2 67.1 69.7 72.2 75.0 78.030–39 years . . . . . . . . . . . . 1,378 61.3 8.5 0.341 41.9 47.0 50.8 53.0 56.5 61.3 67.1 69.3 70.6 73.9 77.340–49 years . . . . . . . . . . . . 1,149 61.6 8.5 0.377 42.8 45.2 50.1 54.0 56.9 62.0 67.0 69.6 71.2 75.3 76.950–59 years . . . . . . . . . . . . 820 62.0 8.4 0.438 44.8 48.6 51.3 54.0 56.4 62.3 67.4 70.0 72.6 75.6 77.160–69 years . . . . . . . . . . . . 1,111 62.4 9.1 0.408 43.7 47.3 51.7 54.0 58.0 63.3 67.9 70.5 72.4 75.9 78.370 years and over . . . . . . . . 1,436 65.0 9.8 0.390 45.8 48.9 53.5 55.6 59.6 65.8 71.8 74.1 76.1 79.6 81.9
Non-Hispanic white
1 year and over . . . . . . . . . . . 4,449 60.8 9.6 0.210 38.5 43.6 48.6 52.0 55.8 61.6 67.1 69.7 72.2 75.3 77.81–2 years . . . . . . . . . . . . . 296 38.8 11.2 0.713 * 22.6 25.6 27.7 30.1 37.5 46.3 50.1 53.0 57.8 *3–5 years . . . . . . . . . . . . . 323 48.9 9.9 0.599 * 34.7 37.2 39.0 41.8 47.8 56.0 59.3 62.5 66.4 *6–8 years . . . . . . . . . . . . . 187 54.3 8.8 0.705 * * 43.6 44.8 48.0 54.9 61.3 63.9 64.8 * *9–11 years . . . . . . . . . . . . . 200 54.9 8.2 0.632 * * 43.7 45.9 49.5 55.2 60.1 63.4 65.7 * *12–14 years . . . . . . . . . . . . 138 55.5 9.1 0.842 * * 42.9 45.6 50.7 55.4 59.6 64.5 65.2 * *15–19 years . . . . . . . . . . . . 195 62.0 8.4 0.654 * * 51.0 52.8 56.3 63.1 67.8 70.4 72.1 * *20–29 years . . . . . . . . . . . . 371 62.7 7.4 0.418 * 51.2 53.1 55.8 57.6 62.9 67.6 70.1 72.9 74.9 *30–39 years . . . . . . . . . . . . 431 62.3 7.7 0.405 * 50.6 53.0 55.3 57.8 61.8 67.6 69.8 72.2 74.7 *40–49 years . . . . . . . . . . . . 413 62.7 7.8 0.420 * 47.8 53.1 55.8 58.6 62.5 67.8 69.9 71.7 75.3 *50–59 years . . . . . . . . . . . . 407 62.8 7.5 0.406 * 50.3 53.2 55.3 57.9 62.8 67.6 70.1 72.6 75.5 *60–69 years . . . . . . . . . . . . 490 63.2 8.6 0.423 * 49.5 52.7 55.4 58.5 64.0 68.1 70.8 72.9 76.0 *70 years and over . . . . . . . . 998 65.5 9.8 0.338 * 50.3 54.1 56.5 60.3 66.3 71.9 74.3 76.5 80.0 *
Non-Hispanic black
1 year and over . . . . . . . . . . . 3,564 53.3 11.7 0.394 28.8 33.0 37.6 41.0 45.8 54.0 61.4 65.5 68.0 71.7 74.21–2 years . . . . . . . . . . . . . 273 36.6 12.0 0.827 * 18.0 22.3 25.6 28.9 35.4 43.2 49.2 55.0 58.0 *3–5 years . . . . . . . . . . . . . 415 45.8 12.6 0.707 * 25.4 29.9 32.6 36.8 46.2 53.3 59.3 61.5 68.2 *6–8 years . . . . . . . . . . . . . 224 48.7 12.0 0.911 * 27.3 33.2 36.9 41.5 49.6 57.0 60.8 64.1 67.2 *9–11 years . . . . . . . . . . . . . 265 48.4 11.0 0.768 * 29.9 34.8 37.0 40.8 48.6 54.9 60.0 62.4 67.1 *12–14 years . . . . . . . . . . . . 180 51.7 11.8 1.002 * * 36.6 38.0 43.6 51.1 60.4 65.1 66.4 * *15–19 years . . . . . . . . . . . . 297 54.7 10.3 0.679 * 35.3 41.2 44.3 48.3 55.0 61.5 65.2 67.9 71.5 *20–29 years . . . . . . . . . . . . 454 56.4 9.8 0.525 * 39.6 43.5 46.5 50.4 56.8 63.1 66.5 68.9 72.4 *30–39 years . . . . . . . . . . . . 445 55.2 10.2 0.549 * 38.3 41.9 44.3 48.2 55.1 62.6 66.7 68.8 72.1 *40–49 years . . . . . . . . . . . . 329 54.0 10.8 0.682 * 36.6 40.3 43.0 45.7 54.7 61.6 65.7 67.9 70.9 *50–59 years . . . . . . . . . . . . 201 56.6 10.3 0.830 * * 43.6 46.5 50.0 56.9 64.1 67.4 68.8 * *60–69 years . . . . . . . . . . . . 265 56.0 10.7 0.747 * 39.0 41.4 44.9 49.0 57.4 63.5 67.1 69.4 71.4 *70 years and over . . . . . . . . 216 59.9 10.5 0.818 * * 46.9 48.4 52.8 59.6 66.6 70.7 72.8 * *
Mexican American
1 year and over . . . . . . . . . . . 3,903 59.4 10.1 0.313 37.8 41.8 46.8 49.4 53.8 60.0 66.2 69.4 71.5 74.6 77.11–2 years . . . . . . . . . . . . . 298 41.4 11.4 0.896 * * 27.5 29.8 33.3 40.9 48.5 52.5 56.3 * *3–5 years . . . . . . . . . . . . . 458 52.2 10.4 0.662 * 37.0 39.3 41.8 44.6 52.5 58.6 63.3 64.9 71.0 *6–8 years . . . . . . . . . . . . . 248 55.9 10.4 0.901 * * 42.8 45.1 47.6 56.6 62.9 67.6 69.8 * *9–11 years . . . . . . . . . . . . . 271 55.8 8.4 0.694 * * 46.3 47.3 49.8 55.7 61.1 63.9 66.0 * *12–14 years . . . . . . . . . . . . 189 58.1 7.9 0.784 * * 48.0 50.0 53.1 57.6 63.1 66.1 68.6 * *15–19 years . . . . . . . . . . . . 299 61.7 8.4 0.660 * * 51.4 53.5 55.8 61.5 68.0 70.8 72.1 * *20–29 years . . . . . . . . . . . . 643 61.9 8.5 0.458 * 47.5 51.3 53.0 56.4 62.1 67.6 71.0 73.3 75.9 *30–39 years . . . . . . . . . . . . 447 61.4 8.3 0.531 * 47.1 51.0 53.1 56.2 62.0 67.0 69.2 70.8 74.0 *40–49 years . . . . . . . . . . . . 363 61.0 8.2 0.582 * 48.4 50.2 52.7 55.8 61.3 65.8 69.1 71.2 74.3 *50–59 years . . . . . . . . . . . . 171 63.7 9.3 0.972 * * 53.4 54.6 57.9 64.0 69.9 72.2 75.0 * *60–69 years . . . . . . . . . . . . 323 62.7 7.2 0.547 * 50.1 53.8 55.7 58.7 62.9 67.0 69.1 70.7 74.1 *70 years and over . . . . . . . . 193 66.2 8.0 0.787 * * 56.1 57.4 59.8 65.8 72.5 75.9 76.5 * *
* Does not meet standards for reliability or precision.1Includes all other race/ethnic groups not listed separately.
Series 11, No. 247 [ Page 59

Table 42. Granulocytes in percentages, measured electronically (CoulterTM 3-part differential) for females 1 year and over, number ofexamined persons, mean, standard deviation, standard error of the mean, and selected percentiles, by race/ethnicity and age:United States, 1988–94
Race/ethnicity and age
Number ofexaminedpersons Mean
Standarddeviation
Standarderror ofmean
Percentile
2.5th 5th 10th 15th 25th 50th 75th 85th 90th 95th 97.5th
All race/ethnic groups1
1 year and over . . . . . . . . . . . 13,468 60.4 10.4 0.211 36.5 42.0 47.3 50.5 54.4 61.2 67.4 70.3 72.5 75.5 78.21–2 years . . . . . . . . . . . . . 849 38.8 11.7 0.627 18.8 20.9 24.3 27.2 30.4 38.1 45.5 50.3 55.0 60.7 64.93–5 years . . . . . . . . . . . . . 1,311 49.3 10.9 0.472 28.1 31.0 35.3 37.3 42.0 49.5 57.0 60.3 62.3 66.7 71.66–8 years . . . . . . . . . . . . . 658 53.9 10.3 0.630 34.4 36.3 41.0 43.0 47.3 53.5 60.4 65.2 67.6 70.6 73.69–11 years . . . . . . . . . . . . . 722 54.6 10.1 0.589 34.2 39.0 43.3 45.9 48.4 53.8 61.0 65.1 67.5 70.1 74.212–14 years . . . . . . . . . . . . 611 58.5 8.3 0.530 41.4 44.3 48.0 50.0 53.4 59.3 63.3 66.2 68.3 71.6 73.615–19 years . . . . . . . . . . . . 933 62.7 9.9 0.508 41.0 46.6 51.7 54.0 57.7 63.1 69.1 71.6 73.8 77.9 82.320–29 years . . . . . . . . . . . . 1,724 62.3 9.5 0.359 42.9 47.3 50.4 52.5 55.8 63.0 69.0 72.2 74.4 77.3 79.530–39 years . . . . . . . . . . . . 1,710 62.4 8.8 0.333 42.4 47.2 51.8 53.5 57.2 62.6 68.3 70.8 73.2 75.9 78.640–49 years . . . . . . . . . . . . 1,279 62.5 8.5 0.371 44.4 47.9 51.7 54.1 57.4 62.4 69.0 71.3 73.0 75.3 77.250–59 years . . . . . . . . . . . . 951 60.4 8.6 0.436 41.6 45.3 49.8 52.0 55.5 60.8 66.3 68.9 70.8 73.0 75.960–69 years . . . . . . . . . . . . 1,089 61.0 8.8 0.420 43.0 45.9 49.8 52.2 55.2 61.7 66.8 69.7 71.5 74.0 77.670 years and over . . . . . . . . 1,631 63.7 9.3 0.361 43.5 47.3 51.5 54.6 58.4 64.5 70.1 73.0 75.0 77.1 79.3
Non-Hispanic white
1 year and over . . . . . . . . . . . 4,949 61.6 9.7 0.199 40.3 45.1 49.7 52.2 56.0 62.2 68.2 71.1 73.2 76.0 78.61–2 years . . . . . . . . . . . . . 268 38.6 11.7 0.860 * 20.5 25.0 27.8 30.3 38.1 44.4 50.2 55.9 61.5 *3–5 years . . . . . . . . . . . . . 329 49.9 10.4 0.692 * 32.5 35.5 38.0 43.0 50.2 57.0 60.8 62.4 66.7 *6–8 years . . . . . . . . . . . . . 172 54.4 10.1 0.928 * * 41.6 43.0 47.3 53.5 61.1 65.7 69.5 * *9–11 years . . . . . . . . . . . . . 184 55.5 9.3 0.822 * * 45.9 47.0 49.0 54.2 62.0 65.4 67.4 * *12–14 years . . . . . . . . . . . . 151 59.4 7.4 0.724 * * 49.4 51.4 53.8 60.3 64.2 66.4 68.3 * *15–19 years . . . . . . . . . . . . 266 64.2 8.7 0.639 * 51.6 53.9 56.0 58.3 64.3 69.6 71.8 74.0 79.0 *20–29 years . . . . . . . . . . . . 462 63.6 8.8 0.496 * 48.9 51.9 54.3 57.5 63.8 69.6 73.4 74.8 78.2 *30–39 years . . . . . . . . . . . . 563 63.3 8.0 0.405 * 50.6 52.7 55.1 58.0 63.3 68.6 71.4 73.3 76.1 *40–49 years . . . . . . . . . . . . 453 63.6 7.8 0.440 * 51.0 53.7 55.8 58.5 62.9 69.4 71.8 73.8 75.8 *50–59 years . . . . . . . . . . . . 467 61.4 7.8 0.435 * 49.3 51.8 53.8 56.4 61.5 66.5 69.2 71.1 73.3 *60–69 years . . . . . . . . . . . . 466 61.9 8.3 0.463 * 47.5 51.3 52.9 56.3 62.6 67.2 69.9 72.1 74.6 *70 years and over . . . . . . . . 1,168 64.3 8.9 0.315 * 48.7 52.6 55.7 59.0 64.8 70.3 73.3 75.1 77.1 *
Non-Hispanic black
1 year and over . . . . . . . . . . . 3,997 54.4 11.9 0.378 28.7 33.3 38.8 42.1 46.8 55.0 62.7 66.6 69.0 73.0 76.11–2 years . . . . . . . . . . . . . 263 36.1 11.8 0.907 * 18.7 21.1 23.3 27.9 35.0 43.5 49.3 53.5 57.9 *3–5 years . . . . . . . . . . . . . 422 44.1 12.1 0.733 * 25.6 28.6 31.1 35.9 43.6 52.6 56.7 59.3 65.5 *6–8 years . . . . . . . . . . . . . 211 50.8 12.1 1.038 * * 34.3 38.8 42.9 51.3 60.0 63.1 66.6 * *9–11 years . . . . . . . . . . . . . 245 50.0 12.3 0.985 * 29.1 33.1 36.5 41.3 49.5 58.3 62.4 67.0 70.8 *12–14 years . . . . . . . . . . . . 215 53.5 11.0 0.940 * * 41.0 42.6 46.8 53.1 60.9 64.1 66.5 * *15–19 years . . . . . . . . . . . . 317 56.7 12.0 0.843 * 37.9 41.0 43.0 47.8 56.8 64.9 68.8 72.0 77.9 *20–29 years . . . . . . . . . . . . 568 57.1 11.2 0.587 * 38.8 42.7 45.8 49.4 57.2 65.0 68.6 71.4 75.1 *30–39 years . . . . . . . . . . . . 580 56.6 10.2 0.528 * 38.9 43.0 46.5 49.7 57.5 63.3 67.4 70.1 73.1 *40–49 years . . . . . . . . . . . . 411 55.5 9.7 0.598 * 38.8 43.0 45.0 49.8 56.1 62.3 65.3 67.6 70.3 *50–59 years . . . . . . . . . . . . 248 54.9 10.5 0.833 * 36.2 41.2 44.0 46.8 54.9 62.8 66.6 68.9 71.8 *60–69 years . . . . . . . . . . . . 269 55.2 10.0 0.758 * 38.9 43.3 45.3 47.8 55.9 62.8 66.1 68.0 70.5 *70 years and over . . . . . . . . 248 58.6 11.5 0.911 * 38.3 43.5 46.1 50.7 59.0 66.6 70.0 72.3 75.8 *
Mexican American
1 year and over . . . . . . . . . . . 3,916 60.6 10.4 0.322 37.1 41.5 47.2 50.4 54.7 61.3 67.4 71.0 72.9 76.1 78.81–2 years . . . . . . . . . . . . . 280 42.9 11.2 0.874 * * 28.0 30.1 35.0 43.1 50.7 54.3 57.3 * *3–5 years . . . . . . . . . . . . . 496 51.2 11.4 0.671 * 34.0 36.8 38.7 42.7 50.0 60.1 63.8 65.7 70.6 *6–8 years . . . . . . . . . . . . . 252 55.6 10.6 0.869 * * 41.9 44.6 47.9 57.3 63.2 65.9 67.6 * *9–11 years . . . . . . . . . . . . . 262 57.0 9.1 0.733 * * 45.4 48.1 50.2 57.3 63.7 65.5 68.6 * *12–14 years . . . . . . . . . . . . 216 60.7 8.0 0.711 * * 51.6 53.0 56.3 60.3 66.0 68.7 72.2 * *15–19 years . . . . . . . . . . . . 293 65.6 7.9 0.602 * 52.1 55.6 57.2 60.0 65.1 71.9 74.2 75.9 77.6 *20–29 years . . . . . . . . . . . . 623 63.0 9.0 0.469 * 48.0 51.5 53.8 57.2 63.1 69.1 72.4 74.1 77.8 *30–39 years . . . . . . . . . . . . 488 63.9 8.1 0.477 * 51.0 53.3 55.3 58.9 63.7 68.6 72.3 74.6 77.3 *40–49 years . . . . . . . . . . . . 350 62.7 8.3 0.579 * 49.9 52.2 54.1 57.1 62.8 67.7 71.4 73.1 75.7 *50–59 years . . . . . . . . . . . . 181 61.4 7.7 0.747 * * 51.5 53.8 56.3 61.1 67.6 70.0 71.9 * *60–69 years . . . . . . . . . . . . 309 62.0 8.2 0.612 * 49.3 52.2 54.2 57.4 62.3 67.2 70.5 71.8 74.6 *70 years and over . . . . . . . . 166 64.4 8.9 0.908 * * 52.8 55.6 59.6 65.1 70.5 72.7 75.2 * *
* Does not meet standards for reliability or precision.1Includes all other race/ethnic groups not listed separately.
Page 60 [ Series 11, No. 247

Table 43. Lymphocytes as 109 cells per liter, measured electronically (CoulterTM 3-part differential) for persons 1 year and over, number ofexamined persons, mean, standard deviation, standard error of the mean, and selected percentiles, by race/ethnicity and age:United States, 1988–94
Race/ethnicity and age
Number ofexaminedpersons Mean
Standarddeviation
Standarderror ofmean
Percentile
2.5th 5th 10th 15th 25th 50th 75th 85th 90th 95th 97.5th
All race/ethnic groups1
1 year and over . . . . . . . . . . . 26,370 2.43 1.03 0.012 1.20 1.35 1.50 1.65 1.85 2.25 2.80 3.15 3.45 4.00 4.551–2 years . . . . . . . . . . . . . 1,789 4.66 1.53 0.061 2.15 2.50 2.85 3.15 3.60 4.45 5.50 6.16 6.55 7.51 8.313–5 years . . . . . . . . . . . . . 2,618 3.37 1.01 0.033 1.75 1.95 2.25 2.40 2.70 3.25 3.95 4.40 4.65 5.05 5.556–8 years . . . . . . . . . . . . . 1,384 2.92 0.82 0.037 1.50 1.80 2.00 2.10 2.35 2.80 3.40 3.75 4.05 4.40 4.709–11 years . . . . . . . . . . . . . 1,507 2.69 0.73 0.032 1.45 1.70 1.85 2.00 2.15 2.60 3.15 3.45 3.65 4.00 4.2512–14 years . . . . . . . . . . . . 1,161 2.56 0.70 0.035 1.45 1.60 1.75 1.90 2.05 2.50 2.95 3.25 3.55 3.85 4.2515–19 years . . . . . . . . . . . . 1,786 2.28 0.61 0.024 1.25 1.40 1.55 1.70 1.85 2.20 2.60 2.90 3.05 3.35 3.6520–29 years . . . . . . . . . . . . 3,331 2.28 0.67 0.020 1.25 1.40 1.55 1.65 1.80 2.20 2.65 2.90 3.10 3.45 3.8530–39 years . . . . . . . . . . . . 3,156 2.29 0.66 0.020 1.30 1.40 1.50 1.65 1.80 2.20 2.65 2.95 3.15 3.50 3.8040–49 years . . . . . . . . . . . . 2,467 2.26 0.72 0.024 1.15 1.30 1.50 1.60 1.75 2.15 2.60 2.95 3.15 3.50 3.8550–59 years . . . . . . . . . . . . 1,803 2.29 0.71 0.028 1.15 1.30 1.45 1.65 1.80 2.20 2.65 2.95 3.10 3.55 4.0560–69 years . . . . . . . . . . . . 2,241 2.29 1.54 0.055 1.05 1.25 1.40 1.50 1.70 2.10 2.60 2.95 3.20 3.55 3.9070 years and over . . . . . . . . 3,127 2.14 1.57 0.047 0.95 1.10 1.30 1.40 1.55 1.95 2.40 2.75 3.00 3.35 3.85
Non-Hispanic white
1 year and over . . . . . . . . . . . 9,519 2.37 1.05 0.013 1.20 1.30 1.50 1.60 1.80 2.20 2.75 3.10 3.35 3.90 4.451–2 years . . . . . . . . . . . . . 567 4.71 1.49 0.079 * 2.60 3.00 3.20 3.70 4.50 5.55 6.20 6.60 7.55 *3–5 years . . . . . . . . . . . . . 655 3.38 0.99 0.049 * 2.00 2.25 2.35 2.70 3.30 4.00 4.35 4.55 5.01 *6–8 years . . . . . . . . . . . . . 365 2.92 0.79 0.052 * 1.85 2.00 2.15 2.35 2.80 3.35 3.75 4.05 4.30 *9–11 years . . . . . . . . . . . . . 386 2.69 0.71 0.046 * 1.65 1.85 2.00 2.20 2.60 3.15 3.45 3.70 4.00 *12–14 years . . . . . . . . . . . . 293 2.57 0.72 0.053 * * 1.75 1.90 2.05 2.50 2.95 3.30 3.65 * *15–19 years . . . . . . . . . . . . 465 2.26 0.58 0.034 * 1.40 1.55 1.70 1.80 2.20 2.60 2.85 3.05 3.25 *20–29 years . . . . . . . . . . . . 858 2.23 0.65 0.028 * 1.35 1.50 1.60 1.80 2.15 2.60 2.90 3.05 3.35 *30–39 years . . . . . . . . . . . . 1,005 2.23 0.63 0.025 * 1.35 1.50 1.60 1.80 2.15 2.60 2.85 3.05 3.35 *40–49 years . . . . . . . . . . . . 871 2.21 0.70 0.030 * 1.25 1.50 1.60 1.70 2.10 2.60 2.85 3.10 3.45 *50–59 years . . . . . . . . . . . . 883 2.25 0.66 0.028 * 1.30 1.45 1.65 1.80 2.15 2.65 2.90 3.05 3.40 *60–69 years . . . . . . . . . . . . 966 2.25 1.59 0.064 * 1.20 1.40 1.50 1.70 2.10 2.55 2.90 3.10 3.50 *70 years and over . . . . . . . . 2,205 2.14 1.65 0.044 * 1.10 1.30 1.40 1.55 1.95 2.40 2.70 2.95 3.35 *
Non-Hispanic black
1 year and over . . . . . . . . . . . 7,749 2.55 0.94 0.017 1.25 1.40 1.60 1.70 1.90 2.40 3.00 3.35 3.70 4.25 4.801–2 years . . . . . . . . . . . . . 540 4.40 1.46 0.077 * 2.35 2.70 2.95 3.40 4.25 5.30 5.80 6.15 6.90 *3–5 years . . . . . . . . . . . . . 852 3.32 1.07 0.045 * 1.85 2.10 2.25 2.55 3.20 3.95 4.45 4.80 5.20 *6–8 years . . . . . . . . . . . . . 449 2.86 0.84 0.049 * 1.70 1.90 2.05 2.20 2.70 3.40 3.80 4.05 4.35 *9–11 years . . . . . . . . . . . . . 519 2.70 0.80 0.043 * 1.65 1.85 1.90 2.10 2.60 3.15 3.50 3.80 4.15 *12–14 years . . . . . . . . . . . . 404 2.47 0.65 0.040 * 1.60 1.75 1.80 2.00 2.35 2.85 3.15 3.45 3.65 *15–19 years . . . . . . . . . . . . 624 2.30 0.63 0.031 * 1.40 1.55 1.60 1.80 2.25 2.75 2.95 3.15 3.45 *20–29 years . . . . . . . . . . . . 1,052 2.38 0.73 0.027 * 1.40 1.55 1.70 1.90 2.30 2.80 3.05 3.25 3.65 *30–39 years . . . . . . . . . . . . 1,063 2.39 0.77 0.029 * 1.35 1.55 1.65 1.80 2.30 2.85 3.10 3.40 3.80 *40–49 years . . . . . . . . . . . . 761 2.45 0.77 0.034 * 1.40 1.55 1.70 1.90 2.40 2.85 3.15 3.45 3.85 *50–59 years . . . . . . . . . . . . 463 2.48 0.83 0.047 * 1.40 1.50 1.65 1.90 2.40 2.90 3.30 3.50 3.95 *60–69 years . . . . . . . . . . . . 550 2.43 1.16 0.061 * 1.35 1.50 1.60 1.85 2.25 2.85 3.15 3.45 3.90 *70 years and over . . . . . . . . 472 2.15 0.71 0.040 * 1.10 1.25 1.40 1.65 2.10 2.60 2.90 3.05 3.35 *
Mexican American
1 year and over . . . . . . . . . . . 7,946 2.61 0.98 0.022 1.30 1.45 1.65 1.75 1.95 2.45 3.05 3.40 3.70 4.35 5.011–2 years . . . . . . . . . . . . . 583 4.68 1.60 0.090 * 2.50 2.90 3.20 3.55 4.45 5.45 6.20 6.55 7.26 *3–5 years . . . . . . . . . . . . . 972 3.40 1.01 0.044 * 1.95 2.25 2.45 2.70 3.30 3.90 4.45 4.84 5.20 *6–8 years . . . . . . . . . . . . . 507 3.00 0.92 0.055 * 1.80 2.00 2.15 2.35 2.90 3.50 3.90 4.15 4.55 *9–11 years . . . . . . . . . . . . . 537 2.79 0.76 0.044 * 1.75 1.85 2.00 2.25 2.75 3.20 3.50 3.75 4.15 *12–14 years . . . . . . . . . . . . 409 2.57 0.69 0.046 * 1.60 1.80 1.90 2.05 2.50 2.95 3.25 3.45 3.85 *15–19 years . . . . . . . . . . . . 601 2.33 0.62 0.034 * 1.50 1.65 1.75 1.90 2.25 2.70 2.95 3.15 3.45 *20–29 years . . . . . . . . . . . . 1,279 2.34 0.67 0.025 * 1.40 1.55 1.70 1.85 2.25 2.75 3.00 3.20 3.55 *30–39 years . . . . . . . . . . . . 954 2.40 0.70 0.031 * 1.45 1.60 1.70 1.90 2.30 2.80 3.15 3.40 3.70 *40–49 years . . . . . . . . . . . . 725 2.40 0.69 0.035 * 1.40 1.60 1.70 1.90 2.35 2.80 3.05 3.30 3.60 *50–59 years . . . . . . . . . . . . 361 2.37 0.81 0.058 * 1.35 1.40 1.50 1.80 2.25 2.80 3.10 3.30 3.95 *60–69 years . . . . . . . . . . . . 647 2.35 1.00 0.053 * 1.40 1.60 1.70 1.85 2.25 2.70 3.00 3.10 3.55 *70 years and over . . . . . . . . 371 2.16 1.40 0.099 * 1.10 1.20 1.35 1.60 2.00 2.50 2.85 3.05 3.60 *
* Does not meet standards for reliability or precision.1Includes all other race/ethnic groups not listed separately.
Series 11, No. 247 [ Page 61

Table 44. Lymphocytes as 109 cells per liter, measured electronically (CoulterTM 3-part differential) for males 1 year and over, number ofexamined persons, mean, standard deviation, standard error of the mean, and selected percentiles, by race/ethnicity and age:United States, 1988–94
Race/ethnicity and age
Number ofexaminedpersons Mean
Standarddeviation
Standarderror ofmean
Percentile
2.5th 5th 10th 15th 25th 50th 75th 85th 90th 95th 97.5th
All race/ethnic groups1
1 year and over . . . . . . . . . . . 12,623 2.42 1.11 0.019 1.20 1.35 1.50 1.65 1.80 2.25 2.80 3.15 3.45 3.95 4.601–2 years . . . . . . . . . . . . . 931 4.64 1.53 0.082 2.10 2.40 2.90 3.20 3.55 4.45 5.50 6.15 6.51 7.30 7.803–5 years . . . . . . . . . . . . . 1,281 3.32 1.02 0.046 1.50 1.90 2.15 2.35 2.65 3.20 3.90 4.30 4.60 5.05 5.556–8 years . . . . . . . . . . . . . 709 2.88 0.82 0.051 1.50 1.70 1.95 2.10 2.30 2.75 3.30 3.70 3.90 4.40 4.809–11 years . . . . . . . . . . . . . 773 2.67 0.75 0.044 1.40 1.65 1.80 1.95 2.10 2.60 3.15 3.45 3.70 4.00 4.3512–14 years . . . . . . . . . . . . 540 2.57 0.73 0.052 1.45 1.60 1.80 1.90 2.00 2.50 2.95 3.30 3.55 3.90 4.4515–19 years . . . . . . . . . . . . 836 2.27 0.61 0.035 1.25 1.35 1.55 1.70 1.80 2.20 2.60 2.85 3.05 3.40 3.6520–29 years . . . . . . . . . . . . 1,562 2.20 0.64 0.027 1.25 1.40 1.50 1.60 1.75 2.10 2.60 2.85 2.95 3.20 3.6030–39 years . . . . . . . . . . . . 1,400 2.28 0.65 0.028 1.25 1.35 1.50 1.65 1.85 2.20 2.65 2.90 3.15 3.50 3.8040–49 years . . . . . . . . . . . . 1,164 2.28 0.72 0.035 1.20 1.35 1.50 1.60 1.75 2.15 2.70 3.00 3.20 3.60 3.9550–59 years . . . . . . . . . . . . 834 2.26 0.68 0.038 1.15 1.30 1.45 1.60 1.80 2.20 2.70 2.95 3.05 3.35 3.8060–69 years . . . . . . . . . . . . 1,130 2.31 2.07 0.101 1.00 1.20 1.45 1.55 1.70 2.10 2.55 2.90 3.10 3.45 3.7570 years and over . . . . . . . . 1,463 2.12 1.78 0.076 0.90 1.05 1.20 1.30 1.50 1.90 2.40 2.70 2.90 3.35 3.65
Non-Hispanic white
1 year and over . . . . . . . . . . . 4,490 2.38 1.15 0.021 1.20 1.30 1.50 1.60 1.80 2.20 2.75 3.10 3.35 3.85 4.501–2 years . . . . . . . . . . . . . 297 4.68 1.49 0.103 * 2.50 3.05 3.30 3.65 4.50 5.55 6.15 6.55 7.30 *3–5 years . . . . . . . . . . . . . 323 3.33 1.02 0.068 * 2.00 2.20 2.35 2.70 3.25 3.90 4.25 4.50 4.95 *6–8 years . . . . . . . . . . . . . 190 2.86 0.77 0.067 * * 1.95 2.10 2.35 2.75 3.30 3.55 3.80 * *9–11 years . . . . . . . . . . . . . 200 2.69 0.74 0.062 * * 1.75 1.95 2.20 2.65 3.15 3.45 3.75 * *12–14 years . . . . . . . . . . . . 139 2.58 0.74 0.074 * * 1.80 1.90 2.05 2.50 2.95 3.30 3.50 * *15–19 years . . . . . . . . . . . . 195 2.29 0.63 0.054 * * 1.55 1.70 1.80 2.20 2.65 2.95 3.10 * *20–29 years . . . . . . . . . . . . 381 2.15 0.62 0.038 * 1.35 1.50 1.55 1.70 2.05 2.50 2.80 2.90 3.20 *30–39 years . . . . . . . . . . . . 434 2.23 0.63 0.036 * 1.35 1.50 1.65 1.80 2.20 2.55 2.80 3.05 3.35 *40–49 years . . . . . . . . . . . . 414 2.24 0.72 0.042 * 1.30 1.50 1.60 1.75 2.10 2.60 3.00 3.20 3.50 *50–59 years . . . . . . . . . . . . 410 2.23 0.64 0.037 * 1.30 1.45 1.65 1.80 2.15 2.65 2.90 3.00 3.25 *60–69 years . . . . . . . . . . . . 493 2.29 2.18 0.117 * 1.15 1.40 1.50 1.70 2.00 2.55 2.80 3.10 3.40 *70 years and over . . . . . . . . 1,014 2.14 1.89 0.070 * 1.05 1.20 1.30 1.50 1.90 2.35 2.65 2.90 3.35 *
Non-Hispanic black
1 year and over . . . . . . . . . . . 3,633 2.50 0.91 0.025 1.25 1.40 1.55 1.65 1.85 2.30 2.95 3.35 3.65 4.20 4.761–2 years . . . . . . . . . . . . . 275 4.37 1.47 0.106 * 2.25 2.55 2.90 3.40 4.10 5.30 5.95 6.16 6.90 *3–5 years . . . . . . . . . . . . . 419 3.21 1.03 0.060 * 1.75 2.05 2.20 2.45 3.05 3.75 4.35 4.75 5.10 *6–8 years . . . . . . . . . . . . . 229 2.86 0.87 0.069 * 1.70 1.90 2.10 2.20 2.60 3.45 3.85 4.15 4.50 *9–11 years . . . . . . . . . . . . . 267 2.67 0.82 0.060 * 1.60 1.75 1.85 2.05 2.55 3.15 3.50 3.80 4.10 *12–14 years . . . . . . . . . . . . 184 2.44 0.71 0.062 * * 1.75 1.80 1.95 2.30 2.80 3.15 3.35 * *15–19 years . . . . . . . . . . . . 298 2.17 0.62 0.043 * 1.30 1.50 1.55 1.70 2.05 2.55 2.85 3.05 3.35 *20–29 years . . . . . . . . . . . . 463 2.29 0.67 0.037 * 1.40 1.55 1.65 1.80 2.20 2.65 3.00 3.10 3.45 *30–39 years . . . . . . . . . . . . 461 2.32 0.71 0.039 * 1.35 1.50 1.60 1.75 2.20 2.80 3.05 3.35 3.70 *40–49 years . . . . . . . . . . . . 336 2.44 0.78 0.051 * 1.40 1.55 1.70 1.85 2.35 2.90 3.20 3.40 3.75 *50–59 years . . . . . . . . . . . . 207 2.40 0.77 0.064 * * 1.45 1.65 1.85 2.35 2.90 3.25 3.50 * *60–69 years . . . . . . . . . . . . 274 2.30 0.80 0.057 * 1.30 1.45 1.55 1.80 2.15 2.80 3.00 3.20 3.65 *70 years and over . . . . . . . . 220 2.03 0.66 0.053 * * 1.15 1.40 1.60 2.00 2.45 2.80 2.95 * *
Mexican American
1 year and over . . . . . . . . . . . 3,952 2.57 0.96 0.030 1.30 1.45 1.60 1.75 1.95 2.40 3.00 3.35 3.65 4.30 4.951–2 years . . . . . . . . . . . . . 298 4.80 1.77 0.133 * * 2.95 3.20 3.60 4.45 5.55 6.26 6.70 * *3–5 years . . . . . . . . . . . . . 466 3.31 0.94 0.056 * 1.85 2.20 2.40 2.65 3.25 3.85 4.25 4.50 5.05 *6–8 years . . . . . . . . . . . . . 250 2.92 0.84 0.068 * * 1.90 2.00 2.25 2.85 3.40 3.75 4.15 * *9–11 years . . . . . . . . . . . . . 272 2.75 0.71 0.056 * * 1.80 2.00 2.28 2.75 3.20 3.40 3.65 * *12–14 years . . . . . . . . . . . . 191 2.67 0.77 0.072 * * 1.80 1.95 2.15 2.60 3.10 3.40 3.55 * *15–19 years . . . . . . . . . . . . 304 2.30 0.56 0.042 * 1.50 1.70 1.80 1.90 2.25 2.60 2.75 3.05 3.30 *20–29 years . . . . . . . . . . . . 647 2.27 0.65 0.033 * 1.40 1.55 1.65 1.80 2.20 2.70 2.95 3.15 3.45 *30–39 years . . . . . . . . . . . . 450 2.39 0.70 0.043 * 1.40 1.60 1.70 1.90 2.25 2.80 3.10 3.30 3.75 *40–49 years . . . . . . . . . . . . 369 2.39 0.70 0.047 * 1.40 1.55 1.75 1.90 2.35 2.80 3.00 3.25 3.45 *50–59 years . . . . . . . . . . . . 176 2.26 0.76 0.074 * * 1.40 1.50 1.70 2.10 2.70 3.00 3.20 * *60–69 years . . . . . . . . . . . . 330 2.29 0.66 0.047 * 1.35 1.55 1.70 1.85 2.20 2.60 2.90 3.10 3.45 *70 years and over . . . . . . . . 199 2.00 0.73 0.067 * * 1.20 1.30 1.55 1.95 2.30 2.70 2.85 * *
* Does not meet standards for reliability or precision.1Includes all other race/ethnic groups not listed separately.
Page 62 [ Series 11, No. 247

Table 45. Lymphocytes as 109 cells per liter, measured electronically (CoulterTM 3-part differential) for females 1 year and over, number ofexamined persons, mean, standard deviation, standard error of the mean, and selected percentiles, by race/ethnicity and age:United States, 1988–94
Race/ethnicity and age
Number ofexaminedpersons Mean
Standarddeviation
Standarderror ofmean
Percentile
2.5th 5th 10th 15th 25th 50th 75th 85th 90th 95th 97.5th
All race/ethnic groups1
1 year and over . . . . . . . . . . . 13,747 2.43 0.95 0.015 1.20 1.35 1.50 1.65 1.85 2.30 2.80 3.15 3.45 4.05 4.551–2 years . . . . . . . . . . . . . 858 4.69 1.53 0.080 2.30 2.55 2.85 3.10 3.60 4.50 5.50 6.30 6.75 7.70 8.403–5 years . . . . . . . . . . . . . 1,337 3.42 0.99 0.041 1.85 2.05 2.25 2.40 2.70 3.30 4.09 4.45 4.70 5.15 5.606–8 years . . . . . . . . . . . . . 675 2.96 0.80 0.047 1.70 1.85 2.05 2.15 2.40 2.85 3.40 3.90 4.10 4.35 4.609–11 years . . . . . . . . . . . . . 734 2.71 0.70 0.039 1.60 1.75 1.90 2.05 2.20 2.60 3.15 3.45 3.60 4.00 4.1612–14 years . . . . . . . . . . . . 621 2.55 0.66 0.040 1.45 1.60 1.75 1.90 2.10 2.50 2.95 3.25 3.55 3.70 3.9515–19 years . . . . . . . . . . . . 950 2.28 0.61 0.030 1.25 1.45 1.60 1.70 1.85 2.25 2.60 2.90 3.05 3.25 3.6020–29 years . . . . . . . . . . . . 1,769 2.35 0.69 0.025 1.20 1.35 1.60 1.70 1.90 2.25 2.75 3.00 3.20 3.65 3.9030–39 years . . . . . . . . . . . . 1,756 2.29 0.67 0.024 1.30 1.40 1.50 1.60 1.80 2.20 2.70 3.00 3.15 3.50 3.8540–49 years . . . . . . . . . . . . 1,303 2.23 0.71 0.030 1.10 1.25 1.50 1.60 1.75 2.15 2.60 2.80 3.05 3.45 3.7550–59 years . . . . . . . . . . . . 969 2.31 0.73 0.036 1.15 1.35 1.50 1.65 1.80 2.20 2.65 3.00 3.20 3.70 4.2060–69 years . . . . . . . . . . . . 1,111 2.27 0.86 0.039 1.10 1.25 1.40 1.50 1.75 2.15 2.65 3.00 3.25 3.65 4.0570 years and over . . . . . . . . 1,664 2.15 1.42 0.053 1.00 1.15 1.30 1.40 1.60 2.00 2.45 2.75 3.00 3.35 3.90
Non-Hispanic white
1 year and over . . . . . . . . . . . 5,029 2.37 0.94 0.016 1.20 1.30 1.50 1.60 1.80 2.20 2.75 3.10 3.35 3.90 4.451–2 years . . . . . . . . . . . . . 270 4.74 1.49 0.101 * 2.65 2.85 3.10 3.80 4.51 5.51 6.30 6.75 7.70 *3–5 years . . . . . . . . . . . . . 332 3.44 0.95 0.058 * 2.05 2.30 2.40 2.70 3.35 4.15 4.45 4.65 5.05 *6–8 years . . . . . . . . . . . . . 175 3.00 0.79 0.067 * * 2.05 2.15 2.40 2.95 3.50 4.05 4.15 * *9–11 years . . . . . . . . . . . . . 186 2.69 0.69 0.056 * * 1.90 2.05 2.20 2.60 3.10 3.45 3.65 * *12–14 years . . . . . . . . . . . . 154 2.57 0.70 0.063 * * 1.75 1.90 2.10 2.50 3.00 3.30 3.70 * *15–19 years . . . . . . . . . . . . 270 2.22 0.53 0.036 * 1.40 1.55 1.70 1.80 2.20 2.55 2.85 3.00 3.15 *20–29 years . . . . . . . . . . . . 477 2.31 0.67 0.034 * 1.30 1.55 1.70 1.85 2.20 2.70 3.00 3.20 3.65 *30–39 years . . . . . . . . . . . . 571 2.23 0.63 0.030 * 1.40 1.50 1.60 1.75 2.15 2.60 2.95 3.05 3.35 *40–49 years . . . . . . . . . . . . 457 2.18 0.69 0.036 * 1.20 1.45 1.55 1.70 2.10 2.55 2.75 3.00 3.30 *50–59 years . . . . . . . . . . . . 473 2.26 0.68 0.035 * 1.40 1.50 1.65 1.80 2.20 2.60 2.90 3.10 3.60 *60–69 years . . . . . . . . . . . . 473 2.22 0.76 0.039 * 1.25 1.40 1.50 1.70 2.15 2.60 2.90 3.15 3.55 *70 years and over . . . . . . . . 1,191 2.14 1.47 0.047 * 1.15 1.30 1.40 1.60 1.95 2.40 2.75 3.00 3.30 *
Non-Hispanic black
1 year and over . . . . . . . . . . . 4,116 2.60 0.96 0.024 1.30 1.45 1.65 1.75 2.00 2.45 3.00 3.40 3.75 4.26 4.801–2 years . . . . . . . . . . . . . 265 4.43 1.44 0.103 * 2.45 2.75 2.95 3.45 4.40 5.30 5.70 6.00 6.85 *3–5 years . . . . . . . . . . . . . 433 3.44 1.11 0.062 * 1.90 2.20 2.35 2.60 3.35 4.05 4.55 4.80 5.25 *6–8 years . . . . . . . . . . . . . 220 2.85 0.81 0.064 * * 1.85 2.00 2.20 2.75 3.30 3.75 3.90 * *9–11 years . . . . . . . . . . . . . 252 2.73 0.77 0.057 * 1.70 1.90 2.00 2.15 2.70 3.20 3.45 3.70 4.16 *12–14 years . . . . . . . . . . . . 220 2.49 0.61 0.048 * * 1.80 1.90 2.05 2.35 2.85 3.10 3.45 * *15–19 years . . . . . . . . . . . . 326 2.43 0.61 0.040 * 1.50 1.65 1.75 1.95 2.35 2.85 3.05 3.25 3.50 *20–29 years . . . . . . . . . . . . 589 2.45 0.76 0.037 * 1.40 1.60 1.75 1.95 2.35 2.80 3.15 3.30 3.85 *30–39 years . . . . . . . . . . . . 602 2.45 0.82 0.039 * 1.40 1.60 1.70 1.90 2.30 2.85 3.20 3.50 4.00 *40–49 years . . . . . . . . . . . . 425 2.46 0.76 0.043 * 1.40 1.60 1.70 1.90 2.45 2.80 3.10 3.45 3.85 *50–59 years . . . . . . . . . . . . 256 2.54 0.87 0.063 * 1.40 1.55 1.70 1.95 2.45 2.95 3.30 3.60 4.30 *60–69 years . . . . . . . . . . . . 276 2.52 1.36 0.095 * 1.40 1.50 1.70 1.85 2.35 2.85 3.25 3.55 4.01 *70 years and over . . . . . . . . 252 2.22 0.73 0.054 * 1.10 1.25 1.45 1.70 2.20 2.70 2.95 3.15 3.50 *
Mexican American
1 year and over . . . . . . . . . . . 3,994 2.65 1.00 0.031 1.35 1.50 1.70 1.80 2.00 2.50 3.10 3.50 3.75 4.40 5.101–2 years . . . . . . . . . . . . . 285 4.56 1.39 0.113 * * 2.90 3.15 3.50 4.40 5.40 6.05 6.30 * *3–5 years . . . . . . . . . . . . . 506 3.49 1.06 0.065 * 2.10 2.30 2.45 2.70 3.40 4.05 4.70 5.05 5.51 *6–8 years . . . . . . . . . . . . . 257 3.08 0.98 0.084 * * 2.15 2.20 2.40 2.95 3.55 4.00 4.15 * *9–11 years . . . . . . . . . . . . . 265 2.84 0.80 0.067 * * 1.90 2.05 2.20 2.75 3.30 3.60 4.00 * *12–14 years . . . . . . . . . . . . 218 2.49 0.59 0.055 * * 1.80 1.90 2.05 2.45 2.80 3.00 3.25 * *15–19 years . . . . . . . . . . . . 297 2.36 0.68 0.054 * 1.50 1.65 1.70 1.90 2.20 2.75 3.05 3.15 3.55 *20–29 years . . . . . . . . . . . . 632 2.42 0.68 0.037 * 1.45 1.62 1.74 1.95 2.35 2.80 3.10 3.35 3.65 *30–39 years . . . . . . . . . . . . 504 2.42 0.70 0.043 * 1.45 1.65 1.75 1.90 2.30 2.80 3.20 3.45 3.70 *40–49 years . . . . . . . . . . . . 356 2.42 0.68 0.049 * 1.45 1.60 1.70 1.90 2.40 2.85 3.10 3.30 3.60 *50–59 years . . . . . . . . . . . . 185 2.47 0.83 0.084 * * 1.50 1.60 1.95 2.35 2.95 3.15 3.45 * *60–69 years . . . . . . . . . . . . 317 2.40 1.20 0.093 * 1.45 1.60 1.70 1.90 2.25 2.74 3.00 3.10 3.60 *70 years and over . . . . . . . . 172 2.32 1.82 0.190 * * 1.25 1.40 1.60 2.05 2.65 3.05 3.35 * *
* Does not meet standards for reliability or precision.1Includes all other race/ethnic groups not listed separately.
Series 11, No. 247 [ Page 63
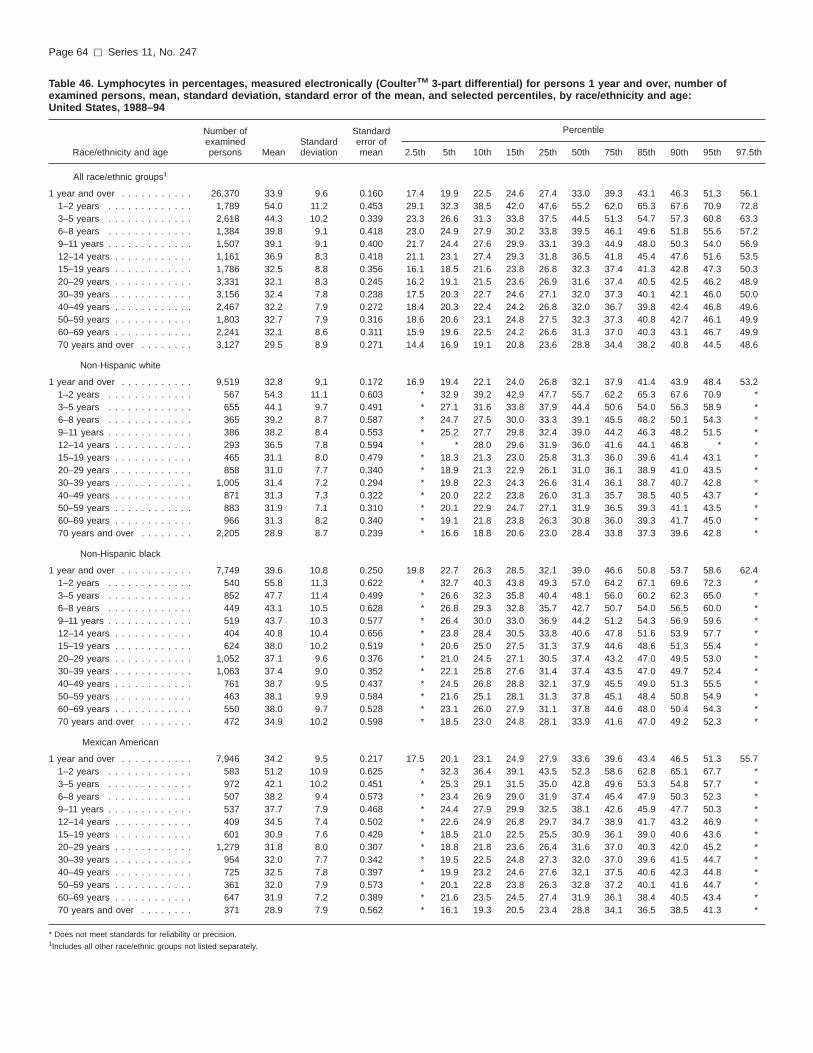
Table 46. Lymphocytes in percentages, measured electronically (CoulterTM 3-part differential) for persons 1 year and over, number ofexamined persons, mean, standard deviation, standard error of the mean, and selected percentiles, by race/ethnicity and age:United States, 1988–94
Race/ethnicity and age
Number ofexaminedpersons Mean
Standarddeviation
Standarderror ofmean
Percentile
2.5th 5th 10th 15th 25th 50th 75th 85th 90th 95th 97.5th
All race/ethnic groups1
1 year and over . . . . . . . . . . . 26,370 33.9 9.6 0.160 17.4 19.9 22.5 24.6 27.4 33.0 39.3 43.1 46.3 51.3 56.11–2 years . . . . . . . . . . . . . 1,789 54.0 11.2 0.453 29.1 32.3 38.5 42.0 47.6 55.2 62.0 65.3 67.6 70.9 72.83–5 years . . . . . . . . . . . . . 2,618 44.3 10.2 0.339 23.3 26.6 31.3 33.8 37.5 44.5 51.3 54.7 57.3 60.8 63.36–8 years . . . . . . . . . . . . . 1,384 39.8 9.1 0.418 23.0 24.9 27.9 30.2 33.8 39.5 46.1 49.6 51.8 55.6 57.29–11 years . . . . . . . . . . . . . 1,507 39.1 9.1 0.400 21.7 24.4 27.6 29.9 33.1 39.3 44.9 48.0 50.3 54.0 56.912–14 years . . . . . . . . . . . . 1,161 36.9 8.3 0.418 21.1 23.1 27.4 29.3 31.8 36.5 41.8 45.4 47.6 51.6 53.515–19 years . . . . . . . . . . . . 1,786 32.5 8.8 0.356 16.1 18.5 21.6 23.8 26.8 32.3 37.4 41.3 42.8 47.3 50.320–29 years . . . . . . . . . . . . 3,331 32.1 8.3 0.245 16.2 19.1 21.5 23.6 26.9 31.6 37.4 40.5 42.5 46.2 48.930–39 years . . . . . . . . . . . . 3,156 32.4 7.8 0.238 17.5 20.3 22.7 24.6 27.1 32.0 37.3 40.1 42.1 46.0 50.040–49 years . . . . . . . . . . . . 2,467 32.2 7.9 0.272 18.4 20.3 22.4 24.2 26.8 32.0 36.7 39.8 42.4 46.8 49.650–59 years . . . . . . . . . . . . 1,803 32.7 7.9 0.316 18.6 20.6 23.1 24.8 27.5 32.3 37.3 40.8 42.7 46.1 49.960–69 years . . . . . . . . . . . . 2,241 32.1 8.6 0.311 15.9 19.6 22.5 24.2 26.6 31.3 37.0 40.3 43.1 46.7 49.970 years and over . . . . . . . . 3,127 29.5 8.9 0.271 14.4 16.9 19.1 20.8 23.6 28.8 34.4 38.2 40.8 44.5 48.6
Non-Hispanic white
1 year and over . . . . . . . . . . . 9,519 32.8 9.1 0.172 16.9 19.4 22.1 24.0 26.8 32.1 37.9 41.4 43.9 48.4 53.21–2 years . . . . . . . . . . . . . 567 54.3 11.1 0.603 * 32.9 39.2 42.9 47.7 55.7 62.2 65.3 67.6 70.9 *3–5 years . . . . . . . . . . . . . 655 44.1 9.7 0.491 * 27.1 31.6 33.8 37.9 44.4 50.6 54.0 56.3 58.9 *6–8 years . . . . . . . . . . . . . 365 39.2 8.7 0.587 * 24.7 27.5 30.0 33.3 39.1 45.5 48.2 50.1 54.3 *9–11 years . . . . . . . . . . . . . 386 38.2 8.4 0.553 * 25.2 27.7 29.8 32.4 39.0 44.2 46.3 48.2 51.5 *12–14 years . . . . . . . . . . . . 293 36.5 7.8 0.594 * * 28.0 29.6 31.9 36.0 41.6 44.1 46.8 * *15–19 years . . . . . . . . . . . . 465 31.1 8.0 0.479 * 18.3 21.3 23.0 25.8 31.3 36.0 39.6 41.4 43.1 *20–29 years . . . . . . . . . . . . 858 31.0 7.7 0.340 * 18.9 21.3 22.9 26.1 31.0 36.1 38.9 41.0 43.5 *30–39 years . . . . . . . . . . . . 1,005 31.4 7.2 0.294 * 19.8 22.3 24.3 26.6 31.4 36.1 38.7 40.7 42.8 *40–49 years . . . . . . . . . . . . 871 31.3 7.3 0.322 * 20.0 22.2 23.8 26.0 31.3 35.7 38.5 40.5 43.7 *50–59 years . . . . . . . . . . . . 883 31.9 7.1 0.310 * 20.1 22.9 24.7 27.1 31.9 36.5 39.3 41.1 43.5 *60–69 years . . . . . . . . . . . . 966 31.3 8.2 0.340 * 19.1 21.8 23.8 26.3 30.8 36.0 39.3 41.7 45.0 *70 years and over . . . . . . . . 2,205 28.9 8.7 0.239 * 16.6 18.8 20.6 23.0 28.4 33.8 37.3 39.6 42.8 *
Non-Hispanic black
1 year and over . . . . . . . . . . . 7,749 39.6 10.8 0.250 19.8 22.7 26.3 28.5 32.1 39.0 46.6 50.8 53.7 58.6 62.41–2 years . . . . . . . . . . . . . 540 55.8 11.3 0.622 * 32.7 40.3 43.8 49.3 57.0 64.2 67.1 69.6 72.3 *3–5 years . . . . . . . . . . . . . 852 47.7 11.4 0.499 * 26.6 32.3 35.8 40.4 48.1 56.0 60.2 62.3 65.0 *6–8 years . . . . . . . . . . . . . 449 43.1 10.5 0.628 * 26.8 29.3 32.8 35.7 42.7 50.7 54.0 56.5 60.0 *9–11 years . . . . . . . . . . . . . 519 43.7 10.3 0.577 * 26.4 30.0 33.0 36.9 44.2 51.2 54.3 56.9 59.6 *12–14 years . . . . . . . . . . . . 404 40.8 10.4 0.656 * 23.8 28.4 30.5 33.8 40.6 47.8 51.6 53.9 57.7 *15–19 years . . . . . . . . . . . . 624 38.0 10.2 0.519 * 20.6 25.0 27.5 31.3 37.9 44.6 48.6 51.3 55.4 *20–29 years . . . . . . . . . . . . 1,052 37.1 9.6 0.376 * 21.0 24.5 27.1 30.5 37.4 43.2 47.0 49.5 53.0 *30–39 years . . . . . . . . . . . . 1,063 37.4 9.0 0.352 * 22.1 25.8 27.6 31.4 37.4 43.5 47.0 49.7 52.4 *40–49 years . . . . . . . . . . . . 761 38.7 9.5 0.437 * 24.5 26.8 28.8 32.1 37.9 45.5 49.0 51.3 55.5 *50–59 years . . . . . . . . . . . . 463 38.1 9.9 0.584 * 21.6 25.1 28.1 31.3 37.8 45.1 48.4 50.8 54.9 *60–69 years . . . . . . . . . . . . 550 38.0 9.7 0.528 * 23.1 26.0 27.9 31.1 37.8 44.6 48.0 50.4 54.3 *70 years and over . . . . . . . . 472 34.9 10.2 0.598 * 18.5 23.0 24.8 28.1 33.9 41.6 47.0 49.2 52.3 *
Mexican American
1 year and over . . . . . . . . . . . 7,946 34.2 9.5 0.217 17.5 20.1 23.1 24.9 27.9 33.6 39.6 43.4 46.5 51.3 55.71–2 years . . . . . . . . . . . . . 583 51.2 10.9 0.625 * 32.3 36.4 39.1 43.5 52.3 58.6 62.8 65.1 67.7 *3–5 years . . . . . . . . . . . . . 972 42.1 10.2 0.451 * 25.3 29.1 31.5 35.0 42.8 49.6 53.3 54.8 57.7 *6–8 years . . . . . . . . . . . . . 507 38.2 9.4 0.573 * 23.4 26.9 29.0 31.9 37.4 45.4 47.9 50.3 52.3 *9–11 years . . . . . . . . . . . . . 537 37.7 7.9 0.468 * 24.4 27.9 29.9 32.5 38.1 42.6 45.9 47.7 50.3 *12–14 years . . . . . . . . . . . . 409 34.5 7.4 0.502 * 22.6 24.9 26.8 29.7 34.7 38.9 41.7 43.2 46.9 *15–19 years . . . . . . . . . . . . 601 30.9 7.6 0.429 * 18.5 21.0 22.5 25.5 30.9 36.1 39.0 40.6 43.6 *20–29 years . . . . . . . . . . . . 1,279 31.8 8.0 0.307 * 18.8 21.8 23.6 26.4 31.6 37.0 40.3 42.0 45.2 *30–39 years . . . . . . . . . . . . 954 32.0 7.7 0.342 * 19.5 22.5 24.8 27.3 32.0 37.0 39.6 41.5 44.7 *40–49 years . . . . . . . . . . . . 725 32.5 7.8 0.397 * 19.9 23.2 24.6 27.6 32.1 37.5 40.6 42.3 44.8 *50–59 years . . . . . . . . . . . . 361 32.0 7.9 0.573 * 20.1 22.8 23.8 26.3 32.8 37.2 40.1 41.6 44.7 *60–69 years . . . . . . . . . . . . 647 31.9 7.2 0.389 * 21.6 23.5 24.5 27.4 31.9 36.1 38.4 40.5 43.4 *70 years and over . . . . . . . . 371 28.9 7.9 0.562 * 16.1 19.3 20.5 23.4 28.8 34.1 36.5 38.5 41.3 *
* Does not meet standards for reliability or precision.1Includes all other race/ethnic groups not listed separately.
Page 64 [ Series 11, No. 247

Table 47. Lymphocytes in percentages, measured electronically (CoulterTM 3-part differential) for males 1 year and over, number ofexamined persons, mean, standard deviation, standard error of the mean, and selected percentiles, by race/ethnicityand age: United States,1988–94
Race/ethnicity and age
Number ofexaminedpersons Mean
Standarddeviation
Standarderror ofmean
Percentile
2.5th 5th 10th 15th 25th 50th 75th 85th 90th 95th 97.5th
All race/ethnic groups1
1 year and over . . . . . . . . . . . 12,623 33.9 9.6 0.231 17.5 19.7 22.7 24.9 27.5 32.8 39.2 43.0 46.5 51.3 56.11–2 years . . . . . . . . . . . . . 931 53.6 11.2 0.581 29.0 31.9 39.1 41.9 47.2 54.7 61.3 65.4 66.9 69.9 72.13–5 years . . . . . . . . . . . . . 1,281 44.3 10.2 0.448 22.8 26.3 30.9 33.8 37.8 44.6 51.0 54.1 56.5 60.4 63.16–8 years . . . . . . . . . . . . . 709 39.5 9.0 0.533 23.3 24.9 27.9 30.0 33.2 39.4 45.6 49.0 51.3 55.6 56.89–11 years . . . . . . . . . . . . . 773 39.2 8.6 0.489 22.9 25.8 28.3 30.1 33.1 39.3 44.9 48.0 51.1 53.0 56.512–14 years . . . . . . . . . . . . 540 37.8 8.7 0.588 21.1 23.1 28.1 29.9 32.3 37.7 42.3 46.8 49.3 52.3 55.815–19 years . . . . . . . . . . . . 836 33.0 8.3 0.451 17.4 19.4 22.8 25.0 27.3 32.8 38.5 41.4 43.1 47.2 49.220–29 years . . . . . . . . . . . . 1,562 31.9 7.8 0.310 17.3 19.1 22.0 24.1 27.1 31.4 36.7 39.7 41.7 44.4 48.530–39 years . . . . . . . . . . . . 1,400 32.5 7.7 0.327 17.9 19.9 23.3 25.1 27.3 32.3 37.3 39.8 42.0 46.4 50.340–49 years . . . . . . . . . . . . 1,164 32.2 7.8 0.362 18.5 20.6 22.6 24.6 27.1 31.8 36.4 39.6 42.5 46.7 49.550–59 years . . . . . . . . . . . . 834 31.6 7.7 0.418 18.6 19.1 21.8 24.2 26.7 31.3 35.9 40.0 41.5 44.8 48.260–69 years . . . . . . . . . . . . 1,130 31.0 8.8 0.412 15.4 18.4 21.8 23.3 25.9 30.1 35.2 38.6 41.0 45.4 49.270 years and over . . . . . . . . 1,463 28.5 9.2 0.378 12.8 15.1 17.9 19.6 22.4 27.8 33.8 37.4 39.5 42.3 46.8
Non-Hispanic white
1 year and over . . . . . . . . . . . 4,490 32.8 9.1 0.251 17.4 19.3 22.2 24.3 26.9 31.9 37.8 41.1 43.9 48.7 53.51–2 years . . . . . . . . . . . . . 297 54.0 10.9 0.737 * 36.5 39.5 43.2 47.2 55.2 61.0 65.5 67.3 70.0 *3–5 years . . . . . . . . . . . . . 323 44.3 9.4 0.613 * 26.6 32.2 34.0 39.1 44.7 50.8 53.6 55.6 58.0 *6–8 years . . . . . . . . . . . . . 190 38.6 8.1 0.689 * * 28.1 30.0 32.8 38.9 44.4 46.5 49.1 * *9–11 years . . . . . . . . . . . . . 200 38.5 7.8 0.647 * * 29.0 30.1 32.5 38.3 43.7 46.9 48.2 * *12–14 years . . . . . . . . . . . . 139 37.7 8.3 0.817 * * 28.2 30.1 32.7 37.8 42.2 46.8 48.6 * *15–19 years . . . . . . . . . . . . 195 31.8 7.6 0.633 * * 22.4 24.9 26.7 31.8 36.5 40.1 41.5 * *20–29 years . . . . . . . . . . . . 381 31.0 7.0 0.420 * 19.0 21.5 23.1 26.7 30.9 35.5 38.1 40.2 42.4 *30–39 years . . . . . . . . . . . . 434 31.6 7.1 0.398 * 19.8 22.7 24.6 26.8 31.6 36.1 38.6 40.0 42.1 *40–49 years . . . . . . . . . . . . 414 31.2 7.2 0.413 * 20.6 22.2 24.0 26.2 31.1 35.1 38.1 40.2 45.3 *50–59 years . . . . . . . . . . . . 410 30.9 6.9 0.399 * 19.1 21.4 24.2 26.5 31.0 35.2 38.4 40.3 42.0 *60–69 years . . . . . . . . . . . . 493 30.3 8.4 0.440 * 17.7 21.0 22.8 25.4 29.8 34.4 37.6 39.8 44.0 *70 years and over . . . . . . . . 1,014 27.9 9.0 0.331 * 14.9 17.5 19.0 22.0 27.1 32.7 36.5 38.5 41.4 *
Non-Hispanic black
1 year and over . . . . . . . . . . . 3,633 39.7 10.7 0.363 19.9 23.0 26.3 28.5 32.4 39.1 46.6 50.9 53.7 58.3 62.31–2 years . . . . . . . . . . . . . 275 55.2 11.5 0.822 * 32.2 39.7 42.8 49.3 56.8 62.8 66.5 68.6 72.1 *3–5 years . . . . . . . . . . . . . 419 46.8 11.7 0.676 * 26.5 30.5 34.4 39.3 47.0 55.1 59.5 61.8 64.6 *6–8 years . . . . . . . . . . . . . 229 43.8 10.6 0.828 * 27.5 29.3 33.0 36.1 43.7 51.6 54.6 56.6 60.0 *9–11 years . . . . . . . . . . . . . 267 44.0 9.4 0.686 * 28.0 30.7 34.0 38.6 44.4 50.4 52.8 54.8 58.4 *12–14 years . . . . . . . . . . . . 184 41.3 10.5 0.922 * * 28.3 30.5 34.2 40.7 48.7 52.8 54.9 * *15–19 years . . . . . . . . . . . . 298 38.3 9.4 0.648 * 22.4 26.8 28.6 32.8 38.0 43.9 47.2 51.3 54.4 *20–29 years . . . . . . . . . . . . 463 37.0 9.1 0.503 * 21.4 25.3 27.4 31.1 37.4 42.0 46.8 49.3 52.4 *30–39 years . . . . . . . . . . . . 461 37.8 9.1 0.501 * 22.1 26.1 28.1 32.0 38.0 43.8 47.9 50.3 52.4 *40–49 years . . . . . . . . . . . . 336 39.0 9.8 0.634 * 23.9 26.4 28.4 32.5 38.3 46.2 49.7 51.3 55.7 *50–59 years . . . . . . . . . . . . 207 36.4 9.6 0.791 * * 24.3 25.6 29.5 36.3 42.5 47.0 48.8 * *60–69 years . . . . . . . . . . . . 274 36.9 10.0 0.719 * 22.6 24.3 26.2 29.8 36.3 43.5 47.2 49.9 54.8 *70 years and over . . . . . . . . 220 34.0 9.9 0.792 * * 22.3 24.1 27.3 33.8 41.2 45.3 47.1 * *
Mexican American
1 year and over . . . . . . . . . . . 3,952 34.4 9.4 0.304 17.7 20.5 23.4 25.3 28.1 33.8 39.9 43.8 46.5 51.1 55.11–2 years . . . . . . . . . . . . . 298 51.7 11.0 0.906 * * 35.8 39.5 45.1 52.7 58.9 62.3 65.0 * *3–5 years . . . . . . . . . . . . . 466 41.4 9.8 0.650 * * 29.0 31.6 35.0 41.4 48.3 51.6 53.5 56.8 *6–8 years . . . . . . . . . . . . . 250 37.9 9.4 0.847 * * 24.4 27.1 31.1 39.0 45.3 47.2 49.0 * *9–11 years . . . . . . . . . . . . . 272 38.0 7.6 0.662 * * 28.9 30.6 33.8 38.6 43.2 46.1 47.7 * *12–14 years . . . . . . . . . . . . 191 35.3 7.4 0.761 * * 25.7 27.8 31.0 35.1 39.9 42.5 44.0 * *15–19 years . . . . . . . . . . . . 304 32.4 7.7 0.630 * 20.1 23.0 24.2 26.8 32.6 37.6 40.5 41.9 44.1 *20–29 years . . . . . . . . . . . . 647 31.8 7.7 0.434 * 19.3 22.1 23.8 26.7 31.5 37.1 39.9 41.5 45.0 *30–39 years . . . . . . . . . . . . 450 32.9 7.7 0.520 * 21.1 24.1 25.6 28.5 32.4 38.0 40.4 43.1 46.3 *40–49 years . . . . . . . . . . . . 369 33.0 7.8 0.580 * 20.8 23.5 25.2 27.8 32.2 38.5 41.1 42.8 44.8 *50–59 years . . . . . . . . . . . . 176 30.8 8.4 0.909 * * 21.0 22.8 24.8 31.0 36.5 38.9 41.6 * *60–69 years . . . . . . . . . . . . 330 31.1 6.6 0.518 * 20.7 23.5 24.4 27.3 31.0 35.0 37.3 38.5 41.8 *70 years and over . . . . . . . . 199 27.7 7.3 0.739 * * 17.6 19.3 21.1 28.6 33.8 35.4 36.8 * *
* Does not meet standards for reliability or precision.1Includes all other race/ethnic groups not listed separately.
Series 11, No. 247 [ Page 65

Table 48. Lymphocytes in percentages, measured electronically (CoulterTM 3-part differential) for females 1 year and over, number ofexamined persons, mean, standard deviation, standard error of the mean, and selected percentiles, by race/ethnicity and age:United States, 1988–94
Race/ethnicity and age
Number ofexaminedpersons Mean
Standarddeviation
Standarderror ofmean
Percentile
2.5th 5th 10th 15th 25th 50th 75th 85th 90th 95th 97.5th
All race/ethnic groups1
1 year and over . . . . . . . . . . . 13,747 33.9 9.6 0.222 17.2 20.0 22.5 24.4 27.4 33.1 39.4 43.1 46.2 51.2 56.11–2 years . . . . . . . . . . . . . 858 54.4 11.2 0.611 30.1 33.0 38.1 42.1 48.4 55.7 62.6 65.3 68.2 71.3 74.33–5 years . . . . . . . . . . . . . 1,337 44.4 10.2 0.446 23.3 27.8 31.6 33.8 37.3 44.3 51.5 55.5 57.5 61.0 64.26–8 years . . . . . . . . . . . . . 675 40.0 9.2 0.569 20.9 24.5 27.9 30.3 34.3 39.5 46.8 50.0 52.4 55.2 57.59–11 years . . . . . . . . . . . . . 734 39.0 9.6 0.565 20.8 23.4 26.8 29.0 32.8 39.3 44.9 48.0 49.6 54.0 58.612–14 years . . . . . . . . . . . . 621 35.9 7.9 0.505 21.0 22.8 25.9 28.6 31.3 35.1 41.5 44.0 45.6 48.3 52.715–19 years . . . . . . . . . . . . 950 31.9 9.3 0.482 13.6 18.3 20.5 22.6 26.0 31.8 36.6 40.7 42.7 47.3 51.920–29 years . . . . . . . . . . . . 1,769 32.3 8.8 0.334 16.0 19.0 21.4 23.3 26.4 32.0 38.0 41.4 43.6 46.5 49.730–39 years . . . . . . . . . . . . 1,756 32.2 7.9 0.302 16.9 20.4 22.3 24.3 26.9 31.9 37.2 40.3 42.3 45.5 49.740–49 years . . . . . . . . . . . . 1,303 32.2 8.0 0.356 17.9 20.0 22.3 24.0 26.2 32.3 37.4 40.1 42.4 47.1 49.750–59 years . . . . . . . . . . . . 969 33.8 7.9 0.407 19.3 22.1 23.7 25.8 28.6 33.2 38.5 41.7 43.7 47.8 51.560–69 years . . . . . . . . . . . . 1,111 33.1 8.4 0.402 17.3 20.8 23.3 24.9 27.5 32.3 38.2 42.0 44.1 47.2 50.370 years and over . . . . . . . . 1,664 30.2 8.6 0.339 15.8 17.9 19.9 21.6 24.4 29.7 34.8 38.7 41.5 44.9 49.7
Non-Hispanic white
1 year and over . . . . . . . . . . . 5,029 32.8 9.1 0.236 16.5 19.4 22.0 23.8 26.7 32.3 38.0 41.5 43.8 48.3 52.71–2 years . . . . . . . . . . . . . 270 54.6 11.3 0.852 * 31.8 37.5 42.4 48.5 56.1 62.7 64.9 67.9 71.3 *3–5 years . . . . . . . . . . . . . 332 43.9 9.9 0.677 * 27.5 31.1 33.2 37.3 43.8 50.5 54.6 57.3 60.3 *6–8 years . . . . . . . . . . . . . 175 39.8 9.2 0.861 * * 27.1 29.6 34.3 39.5 46.9 50.0 52.5 * *9–11 years . . . . . . . . . . . . . 186 38.0 8.9 0.806 * * 26.5 29.0 32.2 39.0 44.6 45.9 48.3 * *12–14 years . . . . . . . . . . . . 154 35.0 7.0 0.702 * * 26.0 28.6 31.3 34.5 40.2 43.2 44.8 * *15–19 years . . . . . . . . . . . . 270 30.5 8.3 0.626 * 17.5 19.9 22.0 25.3 31.0 35.5 39.1 40.9 42.7 *20–29 years . . . . . . . . . . . . 477 31.1 8.3 0.469 * 17.4 20.8 22.4 25.5 31.3 36.7 40.0 41.6 44.6 *30–39 years . . . . . . . . . . . . 571 31.2 7.3 0.378 * 19.7 22.1 23.9 26.4 31.2 36.2 38.8 41.1 42.8 *40–49 years . . . . . . . . . . . . 457 31.3 7.4 0.432 * 19.4 22.0 23.6 25.4 31.5 36.4 38.7 40.8 43.3 *50–59 years . . . . . . . . . . . . 473 32.8 7.2 0.409 * 22.2 23.7 25.6 28.1 32.7 37.4 40.4 42.1 44.3 *60–69 years . . . . . . . . . . . . 473 32.1 7.8 0.448 * 20.1 22.8 24.5 26.9 31.6 37.1 40.3 42.8 45.0 *70 years and over . . . . . . . . 1,191 29.7 8.3 0.300 * 17.8 19.9 21.3 23.9 29.0 34.2 38.0 40.5 44.1 *
Non-Hispanic black
1 year and over . . . . . . . . . . . 4,116 39.5 10.9 0.345 19.6 22.6 26.2 28.5 31.8 39.0 46.6 50.8 53.7 58.8 62.71–2 years . . . . . . . . . . . . . 265 56.4 11.2 0.861 * 33.6 41.5 44.4 49.3 57.8 64.6 68.0 70.1 73.3 *3–5 years . . . . . . . . . . . . . 433 48.6 11.1 0.671 * 29.9 34.3 36.8 41.1 49.3 56.8 60.8 62.8 65.7 *6–8 years . . . . . . . . . . . . . 220 42.3 10.3 0.872 * * 28.2 31.7 34.9 41.9 49.5 52.7 56.0 * *9–11 years . . . . . . . . . . . . . 252 43.5 11.1 0.880 * 26.0 28.8 31.5 36.4 43.1 52.4 55.7 58.0 61.0 *12–14 years . . . . . . . . . . . . 220 40.4 10.2 0.862 * * 28.5 30.6 33.5 40.5 47.0 50.7 52.7 * *15–19 years . . . . . . . . . . . . 326 37.6 10.9 0.757 * 19.5 23.2 26.1 30.3 37.7 45.5 49.0 51.2 55.5 *20–29 years . . . . . . . . . . . . 589 37.1 10.0 0.514 * 20.5 24.4 26.7 30.0 37.5 43.9 47.3 49.5 53.1 *30–39 years . . . . . . . . . . . . 602 37.0 9.0 0.457 * 21.8 25.7 27.5 31.0 36.5 42.8 46.6 48.8 52.4 *40–49 years . . . . . . . . . . . . 425 38.6 9.2 0.561 * 24.6 27.1 29.1 31.8 37.6 44.3 48.5 51.5 54.3 *50–59 years . . . . . . . . . . . . 256 39.6 9.9 0.772 * 21.6 26.6 29.9 32.3 39.7 46.5 50.4 52.8 55.7 *60–69 years . . . . . . . . . . . . 276 38.8 9.4 0.711 * 24.0 26.6 29.1 32.1 38.7 45.1 48.5 50.8 54.1 *70 years and over . . . . . . . . 252 35.6 10.4 0.817 * 19.1 24.1 25.3 28.6 34.0 43.1 47.9 50.1 53.3 *
Mexican American
1 year and over . . . . . . . . . . . 3,994 34.0 9.6 0.309 17.2 19.7 22.8 24.6 27.6 33.4 39.2 43.1 46.5 51.7 56.01–2 years . . . . . . . . . . . . . 285 50.7 10.9 0.823 * * 36.7 38.5 41.6 50.8 57.8 62.9 65.1 * *3–5 years . . . . . . . . . . . . . 506 42.8 10.5 0.595 * 25.6 29.2 31.1 35.0 43.5 50.2 54.5 55.7 58.2 *6–8 years . . . . . . . . . . . . . 257 38.6 9.3 0.741 * * 28.7 30.0 32.3 36.6 45.5 49.2 51.8 * *9–11 years . . . . . . . . . . . . . 265 37.3 8.1 0.633 * * 27.7 28.8 31.7 38.1 42.5 45.6 47.7 * *12–14 years . . . . . . . . . . . . 218 33.9 7.3 0.630 * * 24.1 25.9 29.0 34.4 38.3 40.6 42.3 * *15–19 years . . . . . . . . . . . . 297 29.3 7.2 0.532 * 17.6 19.6 21.0 23.5 30.0 34.1 36.7 38.0 40.8 *20–29 years . . . . . . . . . . . . 632 31.9 8.3 0.418 * 18.3 21.0 23.3 26.0 31.9 37.0 40.5 42.8 46.0 *30–39 years . . . . . . . . . . . . 504 31.0 7.4 0.422 * 17.7 21.2 23.3 26.4 31.3 35.8 39.0 40.5 43.0 *40–49 years . . . . . . . . . . . . 356 32.1 7.7 0.518 * 19.9 22.9 24.1 27.2 32.0 36.4 39.8 41.5 44.6 *50–59 years . . . . . . . . . . . . 185 33.1 7.2 0.669 * * 23.3 25.3 27.3 33.5 38.1 40.8 41.6 * *60–69 years . . . . . . . . . . . . 317 32.6 7.5 0.538 * 22.4 23.5 24.5 27.7 32.5 37.1 40.1 41.3 43.8 *70 years and over . . . . . . . . 172 30.0 8.2 0.797 * * 20.3 22.9 24.6 28.9 34.8 38.1 39.6 * *
* Does not meet standards for reliability or precision.1Includes all other race/ethnic groups not listed separately.
Page 66 [ Series 11, No. 247

Table 49. Mononuclear cells as 109 cells per liter, measured electronically (CoulterTM 3-part differential) for persons 1 year and over, numberof examined persons, mean, standard deviation, standard error of the mean, and selected percentiles, by race/ethnicity and age:United States, 1988–94
Race/ethnicity and age
Number ofexaminedpersons Mean
Standarddeviation
Standarderror ofmean
Percentile
2.5th 5th 10th 15th 25th 50th 75th 85th 90th 95th 97.5th
All race/ethnic groups1
1 year and over . . . . . . . . . . . 25,924 0.43 0.23 0.006 0.10 0.15 0.20 0.25 0.30 0.40 0.55 0.60 0.70 0.80 0.951–2 years . . . . . . . . . . . . . 1,775 0.60 0.31 0.016 0.20 0.20 0.30 0.30 0.40 0.55 0.75 0.85 0.95 1.15 1.403–5 years . . . . . . . . . . . . . 2,579 0.49 0.27 0.012 0.10 0.15 0.20 0.25 0.30 0.45 0.60 0.70 0.80 1.00 1.106–8 years . . . . . . . . . . . . . 1,356 0.47 0.28 0.016 0.10 0.15 0.20 0.25 0.30 0.40 0.60 0.70 0.80 0.95 1.159–11 years . . . . . . . . . . . . . 1,492 0.45 0.24 0.013 0.10 0.15 0.20 0.25 0.30 0.40 0.55 0.65 0.70 0.85 1.0512–14 years . . . . . . . . . . . . 1,144 0.43 0.22 0.014 0.10 0.15 0.20 0.20 0.30 0.40 0.50 0.60 0.70 0.80 1.0015–19 years . . . . . . . . . . . . 1,762 0.42 0.21 0.011 0.10 0.15 0.20 0.20 0.30 0.40 0.50 0.60 0.65 0.75 0.9020–29 years . . . . . . . . . . . . 3,262 0.42 0.23 0.009 0.10 0.15 0.20 0.25 0.30 0.40 0.50 0.60 0.65 0.75 0.9030–39 years . . . . . . . . . . . . 3,088 0.41 0.22 0.009 0.10 0.15 0.20 0.20 0.30 0.40 0.50 0.60 0.65 0.75 0.9540–49 years . . . . . . . . . . . . 2,428 0.41 0.18 0.008 0.10 0.15 0.20 0.25 0.30 0.40 0.50 0.60 0.65 0.75 0.8050–59 years . . . . . . . . . . . . 1,771 0.43 0.21 0.011 0.10 0.15 0.20 0.25 0.30 0.40 0.55 0.60 0.70 0.80 0.9060–69 years . . . . . . . . . . . . 2,200 0.44 0.23 0.010 0.10 0.15 0.20 0.25 0.30 0.40 0.55 0.60 0.70 0.80 0.9570 years and over . . . . . . . . 3,067 0.44 0.26 0.010 0.10 0.15 0.20 0.20 0.30 0.40 0.55 0.65 0.70 0.85 1.00
Non-Hispanic white
1 year and over . . . . . . . . . . . 9,398 0.43 0.22 0.007 0.10 0.15 0.20 0.25 0.30 0.40 0.55 0.60 0.70 0.80 0.951–2 years . . . . . . . . . . . . . 564 0.60 0.29 0.020 * 0.25 0.30 0.30 0.40 0.55 0.70 0.85 0.95 1.15 *3–5 years . . . . . . . . . . . . . 652 0.50 0.26 0.016 * 0.20 0.25 0.25 0.30 0.45 0.60 0.70 0.80 1.00 *6–8 years . . . . . . . . . . . . . 359 0.47 0.26 0.022 * 0.15 0.20 0.25 0.30 0.45 0.55 0.70 0.80 0.95 *9–11 years . . . . . . . . . . . . . 384 0.47 0.23 0.018 * 0.20 0.25 0.25 0.30 0.40 0.60 0.70 0.75 0.85 *12–14 years . . . . . . . . . . . . 289 0.43 0.20 0.018 * * 0.20 0.25 0.30 0.40 0.55 0.60 0.70 * *15–19 years . . . . . . . . . . . . 461 0.43 0.21 0.015 * 0.15 0.20 0.20 0.30 0.40 0.55 0.60 0.65 0.75 *20–29 years . . . . . . . . . . . . 833 0.43 0.22 0.012 * 0.15 0.20 0.25 0.30 0.40 0.50 0.60 0.65 0.75 *30–39 years . . . . . . . . . . . . 994 0.41 0.20 0.010 * 0.15 0.20 0.20 0.30 0.40 0.50 0.60 0.65 0.71 *40–49 years . . . . . . . . . . . . 866 0.40 0.18 0.010 * 0.15 0.20 0.25 0.30 0.40 0.50 0.60 0.65 0.75 *50–59 years . . . . . . . . . . . . 874 0.43 0.21 0.011 * 0.20 0.20 0.25 0.30 0.40 0.50 0.60 0.70 0.75 *60–69 years . . . . . . . . . . . . 956 0.45 0.23 0.012 * 0.15 0.20 0.25 0.30 0.40 0.55 0.65 0.70 0.80 *70 years and over . . . . . . . . 2,166 0.45 0.27 0.009 * 0.15 0.20 0.25 0.30 0.40 0.55 0.65 0.70 0.85 *
Non-Hispanic black
1 year and over . . . . . . . . . . . 7,561 0.42 0.28 0.006 0.10 0.10 0.19 0.20 0.25 0.35 0.50 0.60 0.70 0.85 1.091–2 years . . . . . . . . . . . . . 536 0.61 0.37 0.020 * 0.20 0.25 0.30 0.35 0.55 0.75 0.90 1.00 1.25 *3–5 years . . . . . . . . . . . . . 837 0.50 0.32 0.014 * 0.15 0.20 0.20 0.30 0.45 0.65 0.75 0.85 1.05 *6–8 years . . . . . . . . . . . . . 435 0.47 0.35 0.021 * 0.10 0.15 0.20 0.25 0.40 0.60 0.70 0.85 1.20 *9–11 years . . . . . . . . . . . . . 510 0.43 0.28 0.016 * 0.10 0.15 0.20 0.25 0.40 0.50 0.60 0.75 0.95 *12–14 years . . . . . . . . . . . . 395 0.40 0.29 0.019 * 0.10 0.15 0.20 0.25 0.35 0.45 0.55 0.60 0.75 *15–19 years . . . . . . . . . . . . 614 0.39 0.22 0.011 * 0.10 0.20 0.20 0.25 0.35 0.50 0.55 0.60 0.80 *20–29 years . . . . . . . . . . . . 1,022 0.39 0.29 0.012 * 0.15 0.15 0.20 0.25 0.35 0.50 0.55 0.63 0.75 *30–39 years . . . . . . . . . . . . 1,025 0.42 0.28 0.011 * 0.10 0.20 0.20 0.25 0.40 0.50 0.60 0.70 0.88 *40–49 years . . . . . . . . . . . . 740 0.40 0.23 0.011 * 0.15 0.20 0.20 0.25 0.35 0.50 0.60 0.65 0.80 *50–59 years . . . . . . . . . . . . 449 0.41 0.24 0.014 * 0.10 0.15 0.20 0.25 0.35 0.50 0.60 0.70 0.85 *60–69 years . . . . . . . . . . . . 534 0.39 0.19 0.011 * 0.14 0.20 0.20 0.25 0.35 0.50 0.60 0.64 0.70 *70 years and over . . . . . . . . 464 0.36 0.23 0.014 * 0.10 0.10 0.15 0.20 0.35 0.45 0.55 0.60 0.75 *
Mexican American
1 year and over . . . . . . . . . . . 7,818 0.44 0.22 0.008 0.10 0.15 0.20 0.25 0.30 0.40 0.55 0.60 0.70 0.80 0.951–2 years . . . . . . . . . . . . . 577 0.61 0.32 0.021 * 0.20 0.30 0.33 0.40 0.55 0.75 0.85 0.95 1.20 *3–5 years . . . . . . . . . . . . . 954 0.51 0.25 0.013 * 0.20 0.20 0.25 0.35 0.45 0.65 0.75 0.80 0.95 *6–8 years . . . . . . . . . . . . . 500 0.47 0.24 0.017 * 0.15 0.20 0.25 0.30 0.45 0.60 0.70 0.75 0.90 *9–11 years . . . . . . . . . . . . . 533 0.44 0.21 0.015 * 0.15 0.20 0.25 0.30 0.40 0.55 0.60 0.65 0.80 *12–14 years . . . . . . . . . . . . 405 0.45 0.21 0.016 * 0.20 0.25 0.25 0.30 0.40 0.55 0.65 0.70 0.80 *15–19 years . . . . . . . . . . . . 592 0.42 0.21 0.014 * 0.15 0.20 0.20 0.30 0.40 0.55 0.60 0.65 0.75 *20–29 years . . . . . . . . . . . . 1,266 0.42 0.20 0.009 * 0.15 0.20 0.25 0.30 0.40 0.50 0.60 0.65 0.80 *30–39 years . . . . . . . . . . . . 935 0.41 0.20 0.010 * 0.15 0.20 0.20 0.30 0.40 0.50 0.60 0.65 0.80 *40–49 years . . . . . . . . . . . . 713 0.42 0.19 0.011 * 0.20 0.20 0.25 0.30 0.40 0.50 0.60 0.65 0.70 *50–59 years . . . . . . . . . . . . 352 0.42 0.20 0.017 * 0.15 0.20 0.25 0.30 0.40 0.50 0.60 0.65 0.75 *60–69 years . . . . . . . . . . . . 632 0.43 0.20 0.013 * 0.15 0.20 0.25 0.30 0.40 0.50 0.60 0.65 0.75 *70 years and over . . . . . . . . 359 0.42 0.21 0.017 * 0.15 0.20 0.25 0.30 0.40 0.50 0.60 0.65 0.75 *
* Does not meet standards for reliability or precision.1Includes all other race/ethnic groups not listed separately.
Series 11, No. 247 [ Page 67

Table 50. Mononuclear cells as 109 cells per liter, measured electronically (CoulterTM 3-part differential) for males 1 year and over, numberof examined persons, mean, standard deviation, standard error of the mean, and selected percentiles, by race/ethnicity and age:United States, 1988–94
Race/ethnicity and age
Number ofexaminedpersons Mean
Standarddeviation
Standarderror ofmean
Percentile
2.5th 5th 10th 15th 25th 50th 75th 85th 90th 95th 97.5th
All race/ethnic groups1
1 year and over . . . . . . . . . . . 12,456 0.46 0.23 0.009 0.10 0.15 0.20 0.25 0.30 0.40 0.55 0.65 0.70 0.85 1.001–2 years . . . . . . . . . . . . . 926 0.63 0.33 0.021 0.20 0.25 0.30 0.35 0.45 0.60 0.75 0.90 1.00 1.21 1.453–5 years . . . . . . . . . . . . . 1,268 0.50 0.28 0.015 0.10 0.15 0.20 0.25 0.30 0.45 0.65 0.75 0.80 1.00 1.156–8 years . . . . . . . . . . . . . 698 0.50 0.28 0.020 0.10 0.15 0.20 0.25 0.30 0.45 0.60 0.70 0.80 1.00 1.259–11 years . . . . . . . . . . . . . 770 0.45 0.23 0.016 0.15 0.20 0.20 0.25 0.30 0.40 0.55 0.65 0.70 0.85 1.0512–14 years . . . . . . . . . . . . 533 0.45 0.23 0.019 0.15 0.20 0.20 0.20 0.30 0.40 0.55 0.65 0.75 0.90 1.0515–19 years . . . . . . . . . . . . 829 0.44 0.22 0.015 0.10 0.15 0.20 0.25 0.30 0.40 0.55 0.60 0.70 0.80 0.9520–29 years . . . . . . . . . . . . 1,538 0.44 0.19 0.009 0.10 0.20 0.20 0.25 0.30 0.40 0.55 0.60 0.70 0.80 0.9030–39 years . . . . . . . . . . . . 1,378 0.44 0.21 0.011 0.10 0.15 0.20 0.25 0.30 0.40 0.55 0.60 0.65 0.75 0.8540–49 years . . . . . . . . . . . . 1,149 0.44 0.19 0.011 0.15 0.20 0.25 0.25 0.30 0.40 0.55 0.60 0.70 0.75 0.9050–59 years . . . . . . . . . . . . 820 0.47 0.22 0.014 0.15 0.20 0.20 0.25 0.30 0.45 0.60 0.70 0.75 0.85 0.9560–69 years . . . . . . . . . . . . 1,111 0.48 0.25 0.015 0.15 0.15 0.20 0.25 0.30 0.45 0.60 0.65 0.75 0.85 1.0070 years and over . . . . . . . . 1,436 0.47 0.26 0.013 0.10 0.15 0.20 0.25 0.30 0.45 0.60 0.70 0.75 0.90 1.00
Non-Hispanic white
1 year and over . . . . . . . . . . . 4,449 0.46 0.22 0.010 0.15 0.20 0.20 0.25 0.30 0.45 0.55 0.65 0.70 0.80 0.951–2 years . . . . . . . . . . . . . 296 0.62 0.30 0.025 * 0.25 0.30 0.35 0.45 0.60 0.75 0.85 1.00 1.20 *3–5 years . . . . . . . . . . . . . 323 0.51 0.26 0.021 * 0.20 0.25 0.25 0.30 0.45 0.60 0.75 0.80 1.00 *6–8 years . . . . . . . . . . . . . 187 0.51 0.27 0.028 * * 0.20 0.30 0.35 0.45 0.60 0.70 0.80 * *9–11 years . . . . . . . . . . . . . 200 0.46 0.20 0.020 * * 0.25 0.30 0.30 0.40 0.55 0.70 0.70 * *12–14 years . . . . . . . . . . . . 138 0.46 0.21 0.026 * * 0.20 0.25 0.30 0.40 0.55 0.65 0.75 * *15–19 years . . . . . . . . . . . . 195 0.45 0.23 0.023 * * 0.20 0.25 0.30 0.45 0.55 0.60 0.70 * *20–29 years . . . . . . . . . . . . 371 0.45 0.19 0.014 * 0.20 0.20 0.25 0.30 0.40 0.55 0.60 0.70 0.80 *30–39 years . . . . . . . . . . . . 431 0.43 0.19 0.013 * 0.15 0.20 0.25 0.30 0.40 0.55 0.60 0.65 0.70 *40–49 years . . . . . . . . . . . . 413 0.44 0.18 0.012 * 0.20 0.25 0.25 0.30 0.40 0.55 0.60 0.65 0.75 *50–59 years . . . . . . . . . . . . 407 0.46 0.21 0.015 * 0.20 0.25 0.25 0.30 0.45 0.60 0.65 0.75 0.80 *60–69 years . . . . . . . . . . . . 490 0.48 0.26 0.017 * 0.15 0.20 0.25 0.30 0.45 0.60 0.65 0.75 0.90 *70 years and over . . . . . . . . 998 0.49 0.27 0.012 * 0.15 0.20 0.25 0.30 0.45 0.60 0.70 0.75 0.90 *
Non-Hispanic black
1 year and over . . . . . . . . . . . 3,564 0.44 0.27 0.008 0.10 0.15 0.20 0.20 0.30 0.40 0.55 0.65 0.72 0.90 1.101–2 years . . . . . . . . . . . . . 273 0.65 0.44 0.030 * 0.20 0.25 0.30 0.35 0.55 0.85 0.95 1.10 1.35 *3–5 years . . . . . . . . . . . . . 415 0.50 0.32 0.018 * 0.15 0.20 0.20 0.30 0.45 0.65 0.80 0.90 1.10 *6–8 years . . . . . . . . . . . . . 224 0.48 0.36 0.027 * 0.10 0.20 0.20 0.25 0.40 0.60 0.75 0.85 1.25 *9–11 years . . . . . . . . . . . . . 265 0.46 0.31 0.021 * 0.10 0.20 0.20 0.30 0.40 0.55 0.70 0.80 1.05 *12–14 years . . . . . . . . . . . . 180 0.42 0.34 0.028 * * 0.15 0.20 0.25 0.35 0.50 0.60 0.70 * *15–19 years . . . . . . . . . . . . 297 0.40 0.21 0.013 * 0.15 0.20 0.20 0.25 0.40 0.50 0.60 0.60 0.80 *20–29 years . . . . . . . . . . . . 454 0.40 0.20 0.010 * 0.15 0.20 0.20 0.25 0.35 0.50 0.60 0.65 0.75 *30–39 years . . . . . . . . . . . . 445 0.42 0.24 0.013 * 0.15 0.20 0.20 0.30 0.40 0.50 0.60 0.70 0.80 *40–49 years . . . . . . . . . . . . 329 0.43 0.24 0.014 * 0.15 0.20 0.25 0.30 0.40 0.55 0.60 0.70 0.90 *50–59 years . . . . . . . . . . . . 201 0.46 0.24 0.019 * * 0.20 0.25 0.30 0.40 0.60 0.70 0.75 * *60–69 years . . . . . . . . . . . . 265 0.43 0.20 0.014 * 0.20 0.20 0.25 0.30 0.40 0.55 0.60 0.65 0.75 *70 years and over . . . . . . . . 216 0.36 0.21 0.016 * * 0.15 0.20 0.20 0.30 0.50 0.55 0.60 * *
Mexican American
1 year and over . . . . . . . . . . . 3,902 0.46 0.22 0.011 0.10 0.15 0.20 0.25 0.30 0.40 0.55 0.65 0.70 0.85 0.951–2 years . . . . . . . . . . . . . 297 0.65 0.36 0.029 * * 0.30 0.35 0.40 0.60 0.80 0.90 1.10 * *3–5 years . . . . . . . . . . . . . 458 0.52 0.26 0.017 * 0.20 0.20 0.25 0.35 0.50 0.70 0.75 0.88 1.00 *6–8 years . . . . . . . . . . . . . 248 0.48 0.25 0.022 * * 0.20 0.25 0.30 0.45 0.60 0.70 0.85 * *9–11 years . . . . . . . . . . . . . 271 0.45 0.22 0.018 * * 0.20 0.25 0.30 0.41 0.55 0.60 0.70 * *12–14 years . . . . . . . . . . . . 189 0.49 0.21 0.021 * * 0.25 0.30 0.35 0.45 0.60 0.70 0.75 * *15–19 years . . . . . . . . . . . . 299 0.43 0.19 0.015 * * 0.20 0.25 0.30 0.40 0.55 0.60 0.65 * *20–29 years . . . . . . . . . . . . 643 0.45 0.20 0.011 * 0.20 0.25 0.25 0.30 0.40 0.55 0.65 0.70 0.80 *30–39 years . . . . . . . . . . . . 447 0.42 0.19 0.012 * 0.15 0.20 0.20 0.30 0.40 0.50 0.60 0.65 0.80 *40–49 years . . . . . . . . . . . . 363 0.43 0.17 0.012 * 0.20 0.25 0.25 0.30 0.40 0.55 0.60 0.65 0.70 *50–59 years . . . . . . . . . . . . 171 0.43 0.21 0.022 * * 0.20 0.25 0.30 0.40 0.50 0.60 0.70 * *60–69 years . . . . . . . . . . . . 323 0.46 0.21 0.016 * 0.20 0.20 0.25 0.35 0.45 0.55 0.65 0.70 0.85 *70 years and over . . . . . . . . 193 0.43 0.19 0.019 * * 0.20 0.25 0.30 0.40 0.50 0.60 0.60 * *
* Does not meet standards for reliability or precision.1Includes all other race/ethnic groups not listed separately.
Page 68 [ Series 11, No. 247

Table 51. Mononuclear cells as 109 cells per liter, measured electronically (CoulterTM 3-part differential) for females 1 year and over, numberof examined persons, mean, standard deviation, standard error of the mean, and selected percentiles, by race/ethnicity and age:United States, 1988–94
Race/ethnicity and age
Number ofexaminedpersons Mean
Standarddeviation
Standarderror ofmean
Percentile
2.5th 5th 10th 15th 25th 50th 75th 85th 90th 95th 97.5th
All race/ethnic groups1
1 year and over . . . . . . . . . . . 13,468 0.41 0.23 0.008 0.10 0.15 0.20 0.20 0.30 0.40 0.50 0.60 0.65 0.80 0.951–2 years . . . . . . . . . . . . . 849 0.57 0.28 0.017 0.15 0.20 0.25 0.30 0.40 0.50 0.70 0.80 0.90 1.05 1.303–5 years . . . . . . . . . . . . . 1,311 0.48 0.26 0.013 0.10 0.15 0.20 0.25 0.30 0.45 0.60 0.70 0.80 0.95 1.106–8 years . . . . . . . . . . . . . 658 0.45 0.27 0.019 0.10 0.15 0.20 0.25 0.30 0.40 0.55 0.65 0.80 0.90 1.159–11 years . . . . . . . . . . . . . 722 0.46 0.24 0.016 0.10 0.15 0.20 0.25 0.30 0.40 0.60 0.65 0.75 0.85 1.0512–14 years . . . . . . . . . . . . 611 0.39 0.19 0.014 0.10 0.10 0.20 0.20 0.30 0.40 0.45 0.60 0.65 0.75 0.8015–19 years . . . . . . . . . . . . 933 0.40 0.19 0.011 0.10 0.15 0.20 0.20 0.30 0.40 0.50 0.55 0.65 0.75 0.8520–29 years . . . . . . . . . . . . 1,724 0.40 0.26 0.011 0.10 0.15 0.20 0.20 0.25 0.35 0.50 0.55 0.60 0.75 0.9030–39 years . . . . . . . . . . . . 1,710 0.39 0.23 0.010 0.10 0.10 0.15 0.20 0.25 0.35 0.50 0.55 0.60 0.75 1.0040–49 years . . . . . . . . . . . . 1,279 0.37 0.18 0.009 0.10 0.12 0.20 0.20 0.25 0.35 0.45 0.55 0.60 0.70 0.7550–59 years . . . . . . . . . . . . 951 0.40 0.21 0.012 0.10 0.15 0.20 0.25 0.30 0.35 0.50 0.55 0.60 0.75 0.9060–69 years . . . . . . . . . . . . 1,089 0.41 0.19 0.010 0.10 0.15 0.20 0.20 0.30 0.40 0.50 0.60 0.65 0.80 0.9070 years and over . . . . . . . . 1,631 0.43 0.26 0.012 0.10 0.15 0.20 0.20 0.25 0.40 0.50 0.60 0.70 0.85 1.00
Non-Hispanic white
1 year and over . . . . . . . . . . . 4,949 0.41 0.22 0.010 0.10 0.15 0.20 0.20 0.30 0.40 0.50 0.60 0.65 0.80 0.951–2 years . . . . . . . . . . . . . 268 0.57 0.28 0.023 * 0.20 0.25 0.30 0.40 0.50 0.70 0.80 0.90 1.05 *3–5 years . . . . . . . . . . . . . 329 0.49 0.25 0.018 * 0.15 0.25 0.25 0.30 0.45 0.60 0.70 0.80 0.95 *6–8 years . . . . . . . . . . . . . 172 0.44 0.24 0.025 * * 0.20 0.25 0.30 0.40 0.50 0.65 0.75 * *9–11 years . . . . . . . . . . . . . 184 0.48 0.25 0.024 * * 0.25 0.25 0.30 0.45 0.60 0.70 0.75 * *12–14 years . . . . . . . . . . . . 151 0.40 0.17 0.019 * * 0.20 0.25 0.30 0.40 0.45 0.55 0.65 * *15–19 years . . . . . . . . . . . . 266 0.40 0.18 0.015 * 0.15 0.20 0.20 0.30 0.40 0.50 0.55 0.60 0.70 *20–29 years . . . . . . . . . . . . 462 0.41 0.25 0.015 * 0.15 0.20 0.20 0.25 0.35 0.50 0.55 0.65 0.75 *30–39 years . . . . . . . . . . . . 563 0.39 0.21 0.012 * 0.10 0.20 0.20 0.25 0.35 0.50 0.55 0.60 0.75 *40–49 years . . . . . . . . . . . . 453 0.37 0.17 0.010 * 0.10 0.15 0.20 0.25 0.35 0.45 0.55 0.60 0.70 *50–59 years . . . . . . . . . . . . 467 0.40 0.21 0.013 * 0.15 0.20 0.22 0.30 0.35 0.50 0.55 0.60 0.70 *60–69 years . . . . . . . . . . . . 466 0.42 0.19 0.012 * 0.15 0.20 0.25 0.30 0.40 0.50 0.60 0.65 0.80 *70 years and over . . . . . . . . 1,168 0.43 0.26 0.010 * 0.15 0.20 0.20 0.30 0.40 0.55 0.60 0.70 0.85 *
Non-Hispanic black
1 year and over . . . . . . . . . . . 3,997 0.40 0.28 0.008 0.10 0.10 0.15 0.20 0.25 0.35 0.50 0.60 0.70 0.85 1.001–2 years . . . . . . . . . . . . . 263 0.57 0.28 0.021 * 0.20 0.25 0.30 0.35 0.50 0.70 0.85 0.95 1.10 *3–5 years . . . . . . . . . . . . . 422 0.49 0.33 0.020 * 0.15 0.20 0.20 0.30 0.40 0.65 0.75 0.80 1.05 *6–8 years . . . . . . . . . . . . . 211 0.46 0.34 0.029 * * 0.15 0.20 0.25 0.40 0.60 0.70 0.80 * *9–11 years . . . . . . . . . . . . . 245 0.41 0.26 0.020 * 0.10 0.15 0.20 0.25 0.35 0.50 0.60 0.65 0.80 *12–14 years . . . . . . . . . . . . 215 0.37 0.24 0.020 * * 0.15 0.20 0.25 0.35 0.45 0.50 0.55 * *15–19 years . . . . . . . . . . . . 317 0.37 0.23 0.016 * 0.10 0.15 0.20 0.25 0.30 0.45 0.55 0.60 0.80 *20–29 years . . . . . . . . . . . . 568 0.38 0.35 0.018 * 0.10 0.15 0.20 0.25 0.35 0.45 0.55 0.60 0.75 *30–39 years . . . . . . . . . . . . 580 0.42 0.31 0.016 * 0.10 0.15 0.20 0.25 0.35 0.50 0.60 0.75 0.90 *40–49 years . . . . . . . . . . . . 411 0.38 0.22 0.014 * 0.10 0.15 0.20 0.25 0.35 0.45 0.50 0.60 0.73 *50–59 years . . . . . . . . . . . . 248 0.37 0.22 0.017 * 0.10 0.10 0.20 0.25 0.35 0.45 0.50 0.60 0.80 *60–69 years . . . . . . . . . . . . 269 0.36 0.18 0.014 * 0.10 0.15 0.20 0.20 0.30 0.45 0.55 0.60 0.65 *70 years and over . . . . . . . . 248 0.36 0.24 0.019 * 0.10 0.10 0.15 0.20 0.35 0.45 0.55 0.60 0.75 *
Mexican American
1 year and over . . . . . . . . . . . 3,916 0.42 0.22 0.011 0.10 0.15 0.20 0.25 0.30 0.40 0.50 0.60 0.65 0.75 0.901–2 years . . . . . . . . . . . . . 280 0.56 0.27 0.022 * * 0.25 0.30 0.35 0.50 0.70 0.80 0.90 * *3–5 years . . . . . . . . . . . . . 496 0.49 0.24 0.015 * 0.15 0.20 0.30 0.35 0.45 0.65 0.75 0.80 0.85 *6–8 years . . . . . . . . . . . . . 252 0.45 0.22 0.020 * * 0.20 0.25 0.30 0.45 0.55 0.65 0.75 * *9–11 years . . . . . . . . . . . . . 262 0.42 0.21 0.018 * * 0.20 0.25 0.30 0.40 0.50 0.60 0.65 * *12–14 years . . . . . . . . . . . . 216 0.41 0.20 0.019 * * 0.20 0.25 0.30 0.40 0.50 0.60 0.65 * *15–19 years . . . . . . . . . . . . 293 0.41 0.23 0.019 * 0.15 0.20 0.20 0.30 0.40 0.50 0.60 0.65 0.80 *20–29 years . . . . . . . . . . . . 623 0.39 0.20 0.011 * 0.15 0.20 0.20 0.25 0.35 0.45 0.55 0.60 0.65 *30–39 years . . . . . . . . . . . . 488 0.41 0.20 0.013 * 0.15 0.20 0.20 0.25 0.40 0.50 0.60 0.65 0.75 *40–49 years . . . . . . . . . . . . 350 0.40 0.20 0.015 * 0.15 0.20 0.25 0.30 0.35 0.50 0.55 0.60 0.70 *50–59 years . . . . . . . . . . . . 181 0.41 0.19 0.020 * * 0.20 0.20 0.30 0.40 0.50 0.60 0.65 * *60–69 years . . . . . . . . . . . . 309 0.40 0.20 0.016 * 0.15 0.20 0.20 0.30 0.35 0.50 0.55 0.60 0.70 *70 years and over . . . . . . . . 166 0.41 0.22 0.024 * * 0.20 0.20 0.25 0.35 0.50 0.60 0.65 * *
* Does not meet standards for reliability or precision.1Includes all other race/ethnic groups not listed separately.
Series 11, No. 247 [ Page 69

Table 52. Mononuclear cells in percentages, measured electronically (CoulterTM 3-part differential) for persons 1 year and over, number ofexamined persons, mean, standard deviation, standard error of the mean, and selected percentiles, by race/ethnicity and age:United States, 1988–94
Race/ethnicity and age
Number ofexaminedpersons Mean
Standarddeviation
Standarderror ofmean
Percentile
2.5th 5th 10th 15th 25th 50th 75th 85th 90th 95th 97.5th
All race/ethnic groups1
1 year and over . . . . . . . . . . . 25,924 6.0 2.6 0.074 1.8 2.3 3.0 3.5 4.3 5.9 7.4 8.3 9.0 10.3 11.61–2 years . . . . . . . . . . . . . 1,775 7.0 3.1 0.165 2.3 2.8 3.6 4.2 5.1 6.7 8.6 9.7 10.7 11.9 14.13–5 years . . . . . . . . . . . . . 2,579 6.5 3.2 0.143 1.6 2.1 2.7 3.3 4.4 6.2 8.1 9.2 9.9 11.9 13.76–8 years . . . . . . . . . . . . . 1,356 6.5 3.4 0.209 1.5 1.9 2.5 3.1 4.4 6.2 7.8 9.2 10.4 11.6 15.39–11 years . . . . . . . . . . . . . 1,492 6.5 2.9 0.169 1.8 2.3 3.0 3.6 4.7 6.4 8.1 9.2 9.9 11.4 12.612–14 years . . . . . . . . . . . . 1,144 6.1 2.8 0.186 1.7 2.1 2.8 3.4 4.3 5.9 7.6 8.6 9.4 10.6 11.915–19 years . . . . . . . . . . . . 1,762 5.9 2.6 0.137 1.8 2.1 2.8 3.3 4.2 5.7 7.3 8.2 8.7 9.6 11.420–29 years . . . . . . . . . . . . 3,262 5.8 2.4 0.096 1.8 2.3 3.0 3.4 4.3 5.7 7.1 7.9 8.7 9.6 11.030–39 years . . . . . . . . . . . . 3,088 5.8 2.6 0.103 1.5 2.0 2.9 3.4 4.1 5.6 7.1 8.0 8.7 9.8 11.140–49 years . . . . . . . . . . . . 2,428 5.8 2.2 0.102 1.9 2.3 3.0 3.5 4.3 5.7 7.0 7.9 8.4 9.6 10.450–59 years . . . . . . . . . . . . 1,771 6.1 2.5 0.133 2.0 2.5 3.3 3.8 4.6 6.0 7.4 8.2 8.9 10.3 11.360–69 years . . . . . . . . . . . . 2,200 6.3 2.6 0.122 2.0 2.6 3.3 3.8 4.7 6.1 7.6 8.4 9.0 10.1 11.670 years and over . . . . . . . . 3,067 6.2 2.7 0.111 1.8 2.4 3.0 3.5 4.4 6.0 7.6 8.6 9.3 10.4 12.2
Non-Hispanic white
1 year and over . . . . . . . . . . . 9,398 6.0 2.5 0.081 1.8 2.3 3.0 3.5 4.3 5.9 7.3 8.3 8.9 10.0 11.31–2 years . . . . . . . . . . . . . 564 7.0 3.0 0.215 * 2.8 3.7 4.3 5.2 6.6 8.4 9.6 10.6 11.6 *3–5 years . . . . . . . . . . . . . 652 6.5 3.0 0.197 * 2.2 2.8 3.5 4.7 6.3 8.2 9.1 9.9 11.6 *6–8 years . . . . . . . . . . . . . 359 6.4 3.2 0.290 * 1.8 2.5 3.0 4.3 6.2 7.7 9.3 10.3 11.3 *9–11 years . . . . . . . . . . . . . 384 6.6 2.5 0.219 * 2.8 3.4 4.0 4.8 6.4 8.2 9.2 10.0 11.3 *12–14 years . . . . . . . . . . . . 289 6.2 2.6 0.264 * * 2.8 3.4 4.4 6.1 7.7 8.8 9.4 * *15–19 years . . . . . . . . . . . . 461 5.7 2.4 0.190 * 2.1 2.8 3.2 4.1 5.6 7.2 8.2 8.7 9.1 *20–29 years . . . . . . . . . . . . 833 5.8 2.3 0.137 * 2.2 2.9 3.4 4.3 5.8 7.2 7.8 8.6 9.3 *30–39 years . . . . . . . . . . . . 994 5.7 2.3 0.125 * 2.1 3.0 3.4 4.1 5.6 7.1 7.8 8.4 9.5 *40–49 years . . . . . . . . . . . . 866 5.7 2.1 0.123 * 2.2 2.9 3.5 4.3 5.7 6.9 7.9 8.4 9.4 *50–59 years . . . . . . . . . . . . 874 6.1 2.4 0.141 * 2.6 3.3 3.7 4.5 5.9 7.3 8.1 8.8 10.0 *60–69 years . . . . . . . . . . . . 956 6.3 2.5 0.139 * 2.7 3.3 3.9 4.8 6.1 7.5 8.4 9.0 9.9 *70 years and over . . . . . . . . 2,166 6.2 2.7 0.098 * 2.5 3.1 3.5 4.4 6.0 7.6 8.6 9.3 10.4 *
Non-Hispanic black
1 year and over . . . . . . . . . . . 7,561 6.4 3.5 0.084 1.5 2.0 2.8 3.3 4.3 6.0 7.9 9.1 10.2 12.6 15.31–2 years . . . . . . . . . . . . . 536 7.7 3.7 0.212 * 2.9 3.5 4.2 5.2 7.3 9.4 11.0 12.6 14.8 *3–5 years . . . . . . . . . . . . . 837 7.2 4.1 0.189 * 2.2 2.8 3.3 4.4 6.5 9.1 10.4 12.2 15.1 *6–8 years . . . . . . . . . . . . . 435 7.0 4.6 0.292 * 1.8 2.5 3.1 4.1 6.0 8.3 10.3 12.7 16.5 *9–11 years . . . . . . . . . . . . . 510 7.0 4.2 0.245 * 2.0 2.8 3.4 4.4 6.3 8.5 10.2 11.4 14.6 *12–14 years . . . . . . . . . . . . 395 6.4 3.8 0.249 * 1.8 2.6 3.3 4.3 5.9 7.8 9.3 10.1 11.6 *15–19 years . . . . . . . . . . . . 614 6.3 3.4 0.182 * 2.1 2.6 3.2 4.2 5.8 7.8 9.1 10.4 12.3 *20–29 years . . . . . . . . . . . . 1,022 6.0 3.2 0.130 * 2.0 2.7 3.2 4.0 5.7 7.6 8.5 9.0 10.6 *30–39 years . . . . . . . . . . . . 1,025 6.5 3.6 0.150 * 2.0 2.7 3.4 4.3 6.0 8.0 9.1 10.3 12.8 *40–49 years . . . . . . . . . . . . 740 6.3 3.1 0.152 * 2.4 3.1 3.6 4.3 5.9 7.5 8.7 9.8 12.1 *50–59 years . . . . . . . . . . . . 449 6.2 2.9 0.183 * 1.8 2.8 3.5 4.3 6.0 7.8 9.0 9.6 11.0 *60–69 years . . . . . . . . . . . . 534 6.3 3.0 0.169 * 2.1 2.8 3.4 4.4 6.1 7.6 8.8 9.8 12.3 *70 years and over . . . . . . . . 464 5.9 3.4 0.208 * 1.6 2.2 2.8 3.7 5.4 7.6 8.7 9.6 10.8 *
Mexican American
1 year and over . . . . . . . . . . . 7,818 5.7 2.5 0.106 1.6 2.2 2.9 3.4 4.2 5.6 7.0 7.9 8.6 9.7 10.81–2 years . . . . . . . . . . . . . 577 6.6 2.8 0.203 * 2.6 3.2 3.9 4.8 6.4 8.0 9.1 9.9 11.4 *3–5 years . . . . . . . . . . . . . 954 6.2 2.7 0.151 * 2.3 3.0 3.4 4.3 6.0 7.8 8.7 9.4 10.6 *6–8 years . . . . . . . . . . . . . 500 5.9 2.8 0.222 * 1.9 2.5 3.2 4.0 5.8 7.4 8.7 9.6 10.5 *9–11 years . . . . . . . . . . . . . 533 6.0 2.6 0.201 * 2.3 2.8 3.2 4.3 5.8 7.3 8.2 9.0 10.0 *12–14 years . . . . . . . . . . . . 405 5.9 2.5 0.217 * 2.4 2.8 3.3 4.4 5.8 7.4 8.1 8.9 9.5 *15–19 years . . . . . . . . . . . . 592 5.5 2.4 0.173 * 2.1 2.7 3.1 3.8 5.4 6.9 7.8 8.4 9.3 *20–29 years . . . . . . . . . . . . 1,266 5.7 2.5 0.124 * 2.2 3.0 3.4 4.2 5.5 6.8 7.8 8.5 9.3 *30–39 years . . . . . . . . . . . . 935 5.4 2.2 0.124 * 2.0 2.8 3.3 4.0 5.3 6.7 7.4 7.8 8.8 *40–49 years . . . . . . . . . . . . 713 5.6 2.0 0.131 * 2.5 3.0 3.6 4.3 5.6 6.8 7.6 8.0 8.8 *50–59 years . . . . . . . . . . . . 352 5.6 2.5 0.238 * 1.8 3.0 3.4 4.1 5.6 6.8 7.5 8.1 9.9 *60–69 years . . . . . . . . . . . . 632 5.8 2.3 0.164 * 2.2 3.1 3.6 4.3 5.6 6.9 7.8 8.3 9.7 *70 years and over . . . . . . . . 359 5.7 2.4 0.222 * 2.3 2.8 3.2 4.3 5.7 7.0 8.1 8.6 9.5 *
* Does not meet standards for reliability or precision.1Includes all other race/ethnic groups not listed separately.
Page 70 [ Series 11, No. 247
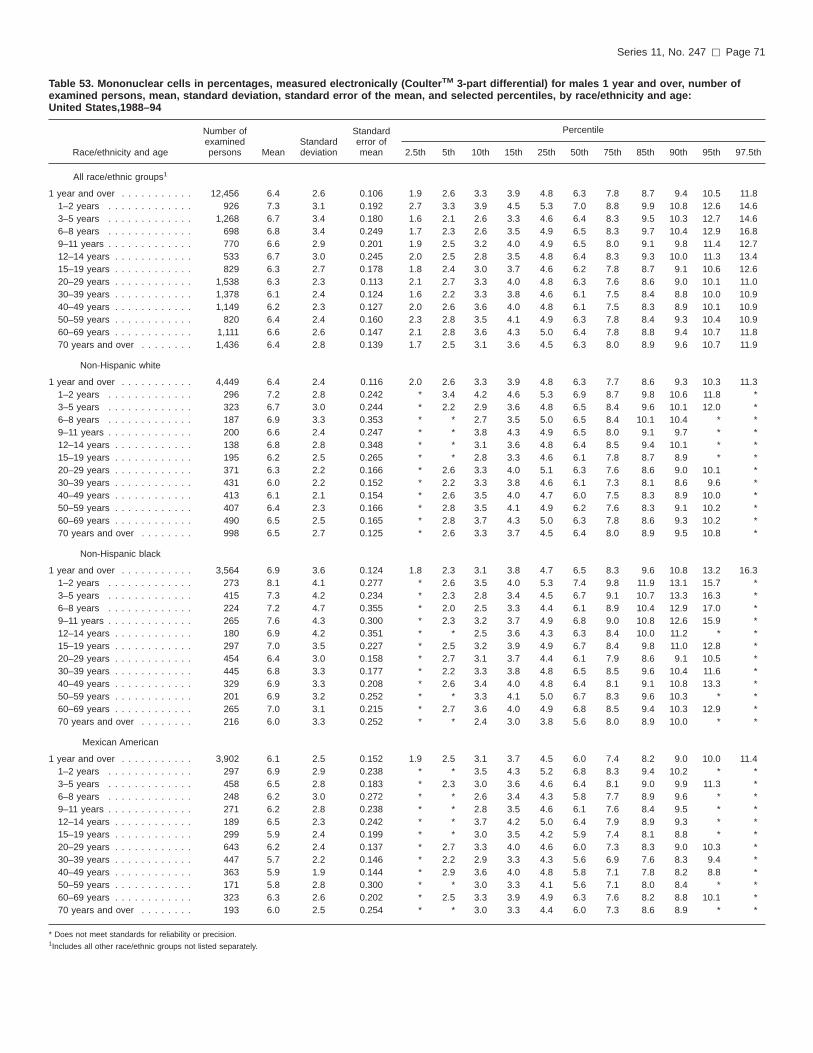
Table 53. Mononuclear cells in percentages, measured electronically (CoulterTM 3-part differential) for males 1 year and over, number ofexamined persons, mean, standard deviation, standard error of the mean, and selected percentiles, by race/ethnicity and age:United States,1988–94
Race/ethnicity and age
Number ofexaminedpersons Mean
Standarddeviation
Standarderror ofmean
Percentile
2.5th 5th 10th 15th 25th 50th 75th 85th 90th 95th 97.5th
All race/ethnic groups1
1 year and over . . . . . . . . . . . 12,456 6.4 2.6 0.106 1.9 2.6 3.3 3.9 4.8 6.3 7.8 8.7 9.4 10.5 11.81–2 years . . . . . . . . . . . . . 926 7.3 3.1 0.192 2.7 3.3 3.9 4.5 5.3 7.0 8.8 9.9 10.8 12.6 14.63–5 years . . . . . . . . . . . . . 1,268 6.7 3.4 0.180 1.6 2.1 2.6 3.3 4.6 6.4 8.3 9.5 10.3 12.7 14.66–8 years . . . . . . . . . . . . . 698 6.8 3.4 0.249 1.7 2.3 2.6 3.5 4.9 6.5 8.3 9.7 10.4 12.9 16.89–11 years . . . . . . . . . . . . . 770 6.6 2.9 0.201 1.9 2.5 3.2 4.0 4.9 6.5 8.0 9.1 9.8 11.4 12.712–14 years . . . . . . . . . . . . 533 6.7 3.0 0.245 2.0 2.5 2.8 3.5 4.8 6.4 8.3 9.3 10.0 11.3 13.415–19 years . . . . . . . . . . . . 829 6.3 2.7 0.178 1.8 2.4 3.0 3.7 4.6 6.2 7.8 8.7 9.1 10.6 12.620–29 years . . . . . . . . . . . . 1,538 6.3 2.3 0.113 2.1 2.7 3.3 4.0 4.8 6.3 7.6 8.6 9.0 10.1 11.030–39 years . . . . . . . . . . . . 1,378 6.1 2.4 0.124 1.6 2.2 3.3 3.8 4.6 6.1 7.5 8.4 8.8 10.0 10.940–49 years . . . . . . . . . . . . 1,149 6.2 2.3 0.127 2.0 2.6 3.6 4.0 4.8 6.1 7.5 8.3 8.9 10.1 10.950–59 years . . . . . . . . . . . . 820 6.4 2.4 0.160 2.3 2.8 3.5 4.1 4.9 6.3 7.8 8.4 9.3 10.4 10.960–69 years . . . . . . . . . . . . 1,111 6.6 2.6 0.147 2.1 2.8 3.6 4.3 5.0 6.4 7.8 8.8 9.4 10.7 11.870 years and over . . . . . . . . 1,436 6.4 2.8 0.139 1.7 2.5 3.1 3.6 4.5 6.3 8.0 8.9 9.6 10.7 11.9
Non-Hispanic white
1 year and over . . . . . . . . . . . 4,449 6.4 2.4 0.116 2.0 2.6 3.3 3.9 4.8 6.3 7.7 8.6 9.3 10.3 11.31–2 years . . . . . . . . . . . . . 296 7.2 2.8 0.242 * 3.4 4.2 4.6 5.3 6.9 8.7 9.8 10.6 11.8 *3–5 years . . . . . . . . . . . . . 323 6.7 3.0 0.244 * 2.2 2.9 3.6 4.8 6.5 8.4 9.6 10.1 12.0 *6–8 years . . . . . . . . . . . . . 187 6.9 3.3 0.353 * * 2.7 3.5 5.0 6.5 8.4 10.1 10.4 * *9–11 years . . . . . . . . . . . . . 200 6.6 2.4 0.247 * * 3.8 4.3 4.9 6.5 8.0 9.1 9.7 * *12–14 years . . . . . . . . . . . . 138 6.8 2.8 0.348 * * 3.1 3.6 4.8 6.4 8.5 9.4 10.1 * *15–19 years . . . . . . . . . . . . 195 6.2 2.5 0.265 * * 2.8 3.3 4.6 6.1 7.8 8.7 8.9 * *20–29 years . . . . . . . . . . . . 371 6.3 2.2 0.166 * 2.6 3.3 4.0 5.1 6.3 7.6 8.6 9.0 10.1 *30–39 years . . . . . . . . . . . . 431 6.0 2.2 0.152 * 2.2 3.3 3.8 4.6 6.1 7.3 8.1 8.6 9.6 *40–49 years . . . . . . . . . . . . 413 6.1 2.1 0.154 * 2.6 3.5 4.0 4.7 6.0 7.5 8.3 8.9 10.0 *50–59 years . . . . . . . . . . . . 407 6.4 2.3 0.166 * 2.8 3.5 4.1 4.9 6.2 7.6 8.3 9.1 10.2 *60–69 years . . . . . . . . . . . . 490 6.5 2.5 0.165 * 2.8 3.7 4.3 5.0 6.3 7.8 8.6 9.3 10.2 *70 years and over . . . . . . . . 998 6.5 2.7 0.125 * 2.6 3.3 3.7 4.5 6.4 8.0 8.9 9.5 10.8 *
Non-Hispanic black
1 year and over . . . . . . . . . . . 3,564 6.9 3.6 0.124 1.8 2.3 3.1 3.8 4.7 6.5 8.3 9.6 10.8 13.2 16.31–2 years . . . . . . . . . . . . . 273 8.1 4.1 0.277 * 2.6 3.5 4.0 5.3 7.4 9.8 11.9 13.1 15.7 *3–5 years . . . . . . . . . . . . . 415 7.3 4.2 0.234 * 2.3 2.8 3.4 4.5 6.7 9.1 10.7 13.3 16.3 *6–8 years . . . . . . . . . . . . . 224 7.2 4.7 0.355 * 2.0 2.5 3.3 4.4 6.1 8.9 10.4 12.9 17.0 *9–11 years . . . . . . . . . . . . . 265 7.6 4.3 0.300 * 2.3 3.2 3.7 4.9 6.8 9.0 10.8 12.6 15.9 *12–14 years . . . . . . . . . . . . 180 6.9 4.2 0.351 * * 2.5 3.6 4.3 6.3 8.4 10.0 11.2 * *15–19 years . . . . . . . . . . . . 297 7.0 3.5 0.227 * 2.5 3.2 3.9 4.9 6.7 8.4 9.8 11.0 12.8 *20–29 years . . . . . . . . . . . . 454 6.4 3.0 0.158 * 2.7 3.1 3.7 4.4 6.1 7.9 8.6 9.1 10.5 *30–39 years . . . . . . . . . . . . 445 6.8 3.3 0.177 * 2.2 3.3 3.8 4.8 6.5 8.5 9.6 10.4 11.6 *40–49 years . . . . . . . . . . . . 329 6.9 3.3 0.208 * 2.6 3.4 4.0 4.8 6.4 8.1 9.1 10.8 13.3 *50–59 years . . . . . . . . . . . . 201 6.9 3.2 0.252 * * 3.3 4.1 5.0 6.7 8.3 9.6 10.3 * *60–69 years . . . . . . . . . . . . 265 7.0 3.1 0.215 * 2.7 3.6 4.0 4.9 6.8 8.5 9.4 10.3 12.9 *70 years and over . . . . . . . . 216 6.0 3.3 0.252 * * 2.4 3.0 3.8 5.6 8.0 8.9 10.0 * *
Mexican American
1 year and over . . . . . . . . . . . 3,902 6.1 2.5 0.152 1.9 2.5 3.1 3.7 4.5 6.0 7.4 8.2 9.0 10.0 11.41–2 years . . . . . . . . . . . . . 297 6.9 2.9 0.238 * * 3.5 4.3 5.2 6.8 8.3 9.4 10.2 * *3–5 years . . . . . . . . . . . . . 458 6.5 2.8 0.183 * 2.3 3.0 3.6 4.6 6.4 8.1 9.0 9.9 11.3 *6–8 years . . . . . . . . . . . . . 248 6.2 3.0 0.272 * * 2.6 3.4 4.3 5.8 7.7 8.9 9.6 * *9–11 years . . . . . . . . . . . . . 271 6.2 2.8 0.238 * * 2.8 3.5 4.6 6.1 7.6 8.4 9.5 * *12–14 years . . . . . . . . . . . . 189 6.5 2.3 0.242 * * 3.7 4.2 5.0 6.4 7.9 8.9 9.3 * *15–19 years . . . . . . . . . . . . 299 5.9 2.4 0.199 * * 3.0 3.5 4.2 5.9 7.4 8.1 8.8 * *20–29 years . . . . . . . . . . . . 643 6.2 2.4 0.137 * 2.7 3.3 4.0 4.6 6.0 7.3 8.3 9.0 10.3 *30–39 years . . . . . . . . . . . . 447 5.7 2.2 0.146 * 2.2 2.9 3.3 4.3 5.6 6.9 7.6 8.3 9.4 *40–49 years . . . . . . . . . . . . 363 5.9 1.9 0.144 * 2.9 3.6 4.0 4.8 5.8 7.1 7.8 8.2 8.8 *50–59 years . . . . . . . . . . . . 171 5.8 2.8 0.300 * * 3.0 3.3 4.1 5.6 7.1 8.0 8.4 * *60–69 years . . . . . . . . . . . . 323 6.3 2.6 0.202 * 2.5 3.3 3.9 4.9 6.3 7.6 8.2 8.8 10.1 *70 years and over . . . . . . . . 193 6.0 2.5 0.254 * * 3.0 3.3 4.4 6.0 7.3 8.6 8.9 * *
* Does not meet standards for reliability or precision.1Includes all other race/ethnic groups not listed separately.
Series 11, No. 247 [ Page 71

Table 54. Mononuclear cells in percentages, measured electronically (CoulterTM 3-part differential) for females 1 year and over, number ofexamined persons, mean, standard deviation, standard error of the mean, and selected percentiles, by race/ethnicity and age:United States, 1988–94
Race/ethnicity and age
Number ofexaminedpersons Mean
Standarddeviation
Standarderror ofmean
Percentile
2.5th 5th 10th 15th 25th 50th 75th 85th 90th 95th 97.5th
All race/ethnic groups1
1 year and over . . . . . . . . . . . 13,468 5.7 2.6 0.101 1.6 2.0 2.8 3.3 4.0 5.5 6.9 7.8 8.6 9.8 11.41–2 years . . . . . . . . . . . . . 849 6.7 3.1 0.192 1.8 2.5 3.2 3.7 4.8 6.4 8.3 9.3 10.3 11.3 14.13–5 years . . . . . . . . . . . . . 1,311 6.3 3.1 0.153 1.7 2.1 2.8 3.4 4.3 6.0 7.8 9.0 9.6 11.0 12.76–8 years . . . . . . . . . . . . 658 6.1 3.4 0.237 1.5 1.6 2.2 2.9 4.0 5.8 7.4 8.6 9.9 11.3 13.79–11 years . . . . . . . . . . . . . 722 6.4 2.9 0.194 1.7 2.2 2.8 3.4 4.3 6.4 8.1 9.2 10.0 10.9 12.312–14 years . . . . . . . . . . . . 611 5.6 2.5 0.180 1.6 1.9 2.6 3.1 4.0 5.4 6.8 7.7 8.2 9.4 10.215–19 years . . . . . . . . . . . . 933 5.4 2.3 0.138 1.6 2.0 2.6 3.0 3.8 5.2 6.7 7.4 8.0 8.6 10.420–29 years . . . . . . . . . . . . 1,724 5.4 2.5 0.108 1.5 1.9 2.7 3.2 3.8 5.2 6.5 7.3 8.0 9.0 10.030–39 years . . . . . . . . . . . . 1,710 5.5 2.6 0.116 1.5 1.9 2.5 3.0 3.8 5.3 6.7 7.6 8.4 9.6 11.340–49 years . . . . . . . . . . . . 1,279 5.3 2.1 0.107 1.8 2.1 2.7 3.0 3.9 5.3 6.5 7.3 7.9 8.9 10.050–59 years . . . . . . . . . . . . 951 5.8 2.6 0.150 1.8 2.4 3.0 3.5 4.2 5.7 6.9 7.9 8.6 10.1 11.660–69 years . . . . . . . . . . . . 1,089 6.0 2.5 0.138 1.9 2.5 3.1 3.5 4.4 5.9 7.3 8.1 8.6 9.7 11.370 years and over . . . . . . . . 1,631 6.0 2.7 0.121 1.9 2.4 3.0 3.5 4.3 5.8 7.3 8.2 9.1 10.2 12.4
Non-Hispanic white
1 year and over . . . . . . . . . . . 4,949 5.6 2.5 0.111 1.7 2.1 2.8 3.3 4.0 5.4 6.9 7.8 8.4 9.6 10.91–2 years . . . . . . . . . . . . . 268 6.8 3.1 0.263 * 2.5 3.3 3.8 4.9 6.4 8.3 9.3 10.6 11.3 *3–5 years . . . . . . . . . . . . . 329 6.2 2.9 0.217 * 2.2 2.7 3.5 4.5 6.0 7.8 8.8 9.2 10.7 *6–8 years . . . . . . . . . . . . 172 5.8 3.0 0.316 * * 2.1 2.6 3.6 5.6 7.3 8.3 9.3 * *9–11 years . . . . . . . . . . . . . 184 6.5 2.6 0.267 * * 3.2 3.6 4.4 6.4 8.2 9.3 10.1 * *12–14 years . . . . . . . . . . . . 151 5.5 2.2 0.249 * * 2.6 3.3 4.0 5.5 6.7 7.7 8.1 * *15–19 years . . . . . . . . . . . . 266 5.3 2.2 0.181 * 2.0 2.6 3.0 3.9 5.2 6.6 7.3 7.9 8.6 *20–29 years . . . . . . . . . . . . 462 5.3 2.3 0.149 * 1.9 2.7 3.2 3.8 5.2 6.6 7.3 7.9 8.8 *30–39 years . . . . . . . . . . . . 563 5.4 2.4 0.139 * 2.0 2.6 3.2 3.8 5.3 6.7 7.4 8.2 9.3 *40–49 years . . . . . . . . . . . . 453 5.2 2.0 0.130 * 2.0 2.6 3.0 3.8 5.2 6.4 7.3 7.8 8.8 *50–59 years . . . . . . . . . . . . 467 5.8 2.5 0.161 * 2.4 3.0 3.5 4.1 5.7 6.9 7.7 8.3 9.8 *60–69 years . . . . . . . . . . . . 466 6.0 2.5 0.161 * 2.5 3.1 3.6 4.5 5.9 7.3 8.1 8.8 9.6 *70 years and over . . . . . . . . 1,168 6.0 2.6 0.105 * 2.4 3.0 3.5 4.3 5.8 7.3 8.2 9.0 10.1 *
Non-Hispanic black
1 year and over . . . . . . . . . . . 3,997 6.1 3.5 0.112 1.4 1.9 2.5 3.0 3.9 5.6 7.4 8.6 9.6 11.9 14.81–2 years . . . . . . . . . . . . . 263 7.4 3.3 0.264 * 3.0 3.6 4.3 5.2 7.0 9.1 9.9 11.0 14.2 *3–5 years . . . . . . . . . . . . . 422 7.0 4.1 0.253 * 2.1 2.8 3.3 4.3 6.4 9.1 10.2 11.4 13.8 *6–8 years . . . . . . . . . . . . 211 6.8 4.5 0.399 * * 2.1 3.0 3.9 6.0 8.0 9.8 12.6 * *9–11 years . . . . . . . . . . . . . 245 6.4 4.0 0.324 * 1.9 2.7 3.1 3.9 5.9 7.6 9.3 10.3 14.2 *12–14 years . . . . . . . . . . . . 215 6.0 3.3 0.288 * * 2.6 3.0 4.2 5.8 7.2 8.4 9.4 * *15–19 years . . . . . . . . . . . . 317 5.7 3.2 0.234 * 1.8 2.3 2.7 3.6 5.1 7.0 7.9 9.1 11.8 *20–29 years . . . . . . . . . . . . 568 5.7 3.2 0.175 * 1.7 2.4 2.8 3.6 5.2 7.0 8.3 8.9 10.8 *30–39 years . . . . . . . . . . . . 580 6.3 3.9 0.206 * 1.9 2.5 3.1 4.0 5.6 7.4 8.6 10.0 13.7 *40–49 years . . . . . . . . . . . . 411 5.9 2.9 0.182 * 2.2 2.9 3.5 4.0 5.5 7.2 8.0 9.0 11.4 *50–59 years . . . . . . . . . . . . 248 5.6 2.6 0.211 * 1.5 2.5 3.0 3.9 5.6 7.3 8.3 9.1 10.3 *60–69 years . . . . . . . . . . . . 269 5.8 2.8 0.216 * 1.9 2.4 3.0 4.0 5.5 7.2 8.0 8.8 11.0 *70 years and over . . . . . . . . 248 5.8 3.5 0.283 * 1.6 2.1 2.5 3.5 5.2 7.3 8.4 9.6 10.6 *
Mexican American
1 year and over . . . . . . . . . . . 3,916 5.4 2.4 0.145 1.5 2.0 2.6 3.1 3.9 5.2 6.6 7.4 8.0 9.1 10.31–2 years . . . . . . . . . . . . . 280 6.2 2.6 0.243 * * 3.2 3.7 4.3 6.1 7.8 8.7 9.6 * *3–5 years . . . . . . . . . . . . . 496 5.9 2.5 0.177 * 2.3 3.0 3.3 4.2 5.8 7.3 8.4 9.0 9.8 *6–8 years . . . . . . . . . . . . 252 5.7 2.6 0.257 * * 2.5 3.0 3.8 5.6 7.2 8.3 9.6 * *9–11 years . . . . . . . . . . . . . 262 5.7 2.5 0.238 * * 2.5 3.1 4.0 5.4 6.8 7.8 8.4 * *12–14 years . . . . . . . . . . . . 216 5.5 2.5 0.265 * * 2.4 3.0 3.9 5.4 6.8 7.8 8.1 * *15–19 years . . . . . . . . . . . . 293 5.1 2.3 0.210 * 2.1 2.5 2.8 3.5 4.9 6.3 7.1 8.1 8.7 *20–29 years . . . . . . . . . . . . 623 5.1 2.5 0.155 * 1.9 2.5 3.1 3.7 4.8 6.2 6.8 7.5 8.8 *30–39 years . . . . . . . . . . . . 488 5.1 2.1 0.149 * 1.8 2.7 3.1 3.8 5.1 6.1 6.9 7.5 8.1 *40–49 years . . . . . . . . . . . . 350 5.3 2.0 0.168 * 2.3 2.8 3.2 3.9 5.1 6.5 7.1 7.6 8.7 *50–59 years . . . . . . . . . . . . 181 5.5 2.3 0.268 * * 2.7 3.6 4.2 5.6 6.6 7.2 7.5 * *60–69 years . . . . . . . . . . . . 309 5.4 2.1 0.184 * 2.0 3.0 3.5 4.1 5.3 6.3 7.1 7.6 9.2 *70 years and over . . . . . . . . 166 5.5 2.3 0.277 * * 2.5 3.2 3.9 5.2 6.7 8.0 8.2 * *
* Does not meet standards for reliability or precision.1Includes all other race/ethnic groups not listed separately.
Page 72 [ Series 11, No. 247

Table 55. Percent distribution of hemoglobin in gram per liter for persons 1 year and over, by race/ethnicity and age: United States,1988–94
Race/ethnicity andselected hemoglobin
cutoffs1 year
and over1–2
years3–5
years6–8
years9–11years
12–14years
15–19years
20–29years
30–39years
40–49years
50–59years
60–69years
70 yearsand over
All race/ethnic groups1
Total . . . . . . . . . . . . . . . . . . 100.0 100.0 100.0 100.0 100.0 100.0 100.0 100.0 100.0 100.0 100.0 100.0 100.0
Less than 100.0 . . . . . . . . . . . 0.4 0.8 0.3 0.1 0.1 0.0 0.2 0.3 0.6 0.8 0.3 0.4 0.8100.0–104.0 . . . . . . . . . . . . . 0.4 1.7 0.7 0.3 0.1 0.0 0.2 0.2 0.3 0.6 0.3 0.2 0.8105.0–109.0 . . . . . . . . . . . . . 0.8 7.2 2.4 0.7 0.1 0.4 0.2 0.7 0.6 0.4 0.0 0.4 1.2110.0–114.0 . . . . . . . . . . . . . 2.2 14.4 8.2 3.4 0.7 1.6 2.0 1.7 1.6 1.3 1.0 1.2 2.3115.0–119.0 . . . . . . . . . . . . . 4.6 24.4 19.0 9.5 5.0 3.0 3.3 3.3 3.2 3.0 2.3 2.8 3.7120.0–124.0 . . . . . . . . . . . . . 7.5 23.6 26.1 14.7 11.7 7.0 6.6 6.8 4.7 5.0 4.2 5.2 6.8125.0–129.0 . . . . . . . . . . . . . 11.2 16.2 21.6 26.9 23.5 13.1 9.6 8.0 8.9 8.8 9.0 9.4 10.1130.0–134.0 . . . . . . . . . . . . . 12.8 8.3 13.8 23.2 22.5 17.6 12.1 9.6 10.8 12.4 12.4 11.5 14.2135.0–139.0 . . . . . . . . . . . . . 12.8 2.8 6.3 14.7 18.0 13.8 13.3 11.7 12.1 12.0 13.0 16.2 15.9140.0–144.0 . . . . . . . . . . . . . 11.7 0.4 1.5 4.5 12.9 16.7 11.7 10.4 11.9 12.2 13.6 15.4 14.9145.0–149.0 . . . . . . . . . . . . . 10.8 0.2 0.2 1.8 4.4 12.5 12.6 11.8 11.5 13.6 12.8 13.5 11.4150.0–154.0 . . . . . . . . . . . . . 9.6 0.0 0.0 0.2 0.7 8.6 11.2 10.7 13.4 10.3 12.9 11.6 8.4155.0–159.0 . . . . . . . . . . . . . 7.1 0.0 0.0 0.0 0.3 2.9 8.7 10.8 8.0 11.2 8.7 5.5 4.8160.0–164.0 . . . . . . . . . . . . . 4.7 0.0 0.0 0.0 0.0 2.1 4.6 8.8 7.0 4.2 5.7 3.4 2.6165.0–169.0 . . . . . . . . . . . . . 2.0 0.0 0.0 0.0 0.0 0.6 1.9 3.1 3.3 2.6 1.9 1.8 1.2170.0–174.0 . . . . . . . . . . . . . 1.0 0.0 0.0 0.0 0.0 0.0 1.2 1.5 1.8 0.9 1.5 0.9 0.6175.0–179.0 . . . . . . . . . . . . . 0.2 0.0 0.0 0.0 0.0 0.0 0.3 0.2 0.2 0.5 0.4 0.2 0.1180.0 and more . . . . . . . . . . . 0.2 0.0 0.0 0.0 0.0 0.0 0.4 0.3 0.1 0.1 0.1 0.4 0.1
Non-Hispanic white
Total . . . . . . . . . . . . . . . . . . 100.0 100.0 100.0 100.0 100.0 100.0 100.0 100.0 100.0 100.0 100.0 100.0 100.0
Less than 100.0 . . . . . . . . . . . 0.2 0.5 0.0 0.1 0.0 0.0 0.0 0.2 0.1 0.2 0.1 0.3 0.5100.0–104.0 . . . . . . . . . . . . . 0.3 0.7 0.1 0.4 0.2 0.0 0.1 0.2 0.0 0.6 0.3 0.1 0.6105.0–109.0 . . . . . . . . . . . . . 0.4 6.1 1.3 0.0 0.0 0.2 0.0 0.5 0.2 0.1 0.0 0.2 0.9110.0–114.0 . . . . . . . . . . . . . 1.7 14.7 7.1 2.6 0.1 1.3 1.2 1.2 1.3 0.9 0.9 1.1 2.0115.0–119.0 . . . . . . . . . . . . . 3.5 25.6 18.3 7.1 3.7 1.8 2.5 2.4 2.0 2.2 1.5 2.5 3.3120.0–124.0 . . . . . . . . . . . . . 6.3 25.2 27.8 11.8 9.2 5.5 4.9 5.6 3.8 4.3 3.6 4.4 6.1125.0–129.0 . . . . . . . . . . . . . 10.7 16.1 21.4 28.9 23.4 11.9 9.5 7.7 8.6 8.2 8.7 9.3 10.1130.0–134.0 . . . . . . . . . . . . . 12.9 8.7 14.7 26.0 22.0 18.2 11.7 9.7 11.2 12.1 12.0 11.3 14.4135.0–139.0 . . . . . . . . . . . . . 13.1 1.9 7.5 15.5 19.7 13.0 13.4 12.3 11.9 12.2 13.3 15.8 16.2140.0–144.0 . . . . . . . . . . . . . 12.4 0.3 1.6 5.4 15.5 18.7 12.4 11.0 12.5 12.0 13.4 15.8 15.3145.0–149.0 . . . . . . . . . . . . . 11.6 0.2 0.3 2.2 5.3 12.6 13.1 12.4 12.2 14.8 12.5 14.1 11.7150.0–154.0 . . . . . . . . . . . . . 10.4 0.0 0.0 0.1 0.5 10.4 12.8 10.4 14.2 11.2 13.9 12.3 8.9155.0–159.0 . . . . . . . . . . . . . 7.9 0.0 0.0 0.0 0.4 3.1 10.2 11.6 8.8 11.9 9.9 5.5 5.2160.0–164.0 . . . . . . . . . . . . . 4.9 0.0 0.0 0.0 0.0 2.9 4.5 9.0 7.6 4.5 5.6 3.5 2.6165.0–169.0 . . . . . . . . . . . . . 2.2 0.0 0.0 0.0 0.0 0.3 1.9 3.4 3.3 3.1 2.0 2.0 1.3170.0–174.0 . . . . . . . . . . . . . 1.2 0.0 0.0 0.0 0.0 0.0 1.8 1.8 1.8 1.0 1.7 1.0 0.7175.0–179.0 . . . . . . . . . . . . . 0.2 0.0 0.0 0.0 0.0 0.0 0.0 0.2 0.3 0.5 0.5 0.2 0.1180.0 and more . . . . . . . . . . . 0.1 0.0 0.0 0.0 0.0 0.0 0.0 0.2 0.1 0.2 0.1 0.4 0.1
Non-Hispanic black
Total . . . . . . . . . . . . . . . . . . 100.0 100.0 100.0 100.0 100.0 100.0 100.0 100.0 100.0 100.0 100.0 100.0 100.0
Less than 100.0 . . . . . . . . . . . 1.6 1.8 1.0 0.2 0.7 0.2 1.3 1.4 2.1 2.7 1.6 1.1 4.4100.0–104.0 . . . . . . . . . . . . . 1.0 4.1 1.8 0.3 0.0 0.2 0.5 0.7 1.1 1.3 0.6 1.1 1.6105.0–109.0 . . . . . . . . . . . . . 2.4 11.0 6.0 2.0 0.5 2.0 1.1 2.0 2.2 1.9 0.5 1.4 4.2110.0–114.0 . . . . . . . . . . . . . 5.8 17.9 12.6 9.0 3.8 5.0 5.2 4.7 4.5 5.6 2.6 3.6 6.1115.0–119.0 . . . . . . . . . . . . . 10.0 24.6 25.1 16.7 13.0 10.5 7.4 7.4 9.0 6.5 5.4 7.3 8.6120.0–124.0 . . . . . . . . . . . . . 13.5 20.0 23.3 24.9 21.3 16.6 13.7 11.8 9.8 9.0 9.1 12.6 11.1125.0–129.0 . . . . . . . . . . . . . 14.2 12.7 19.0 22.1 28.3 19.6 11.9 11.4 10.6 11.8 15.0 11.3 14.4130.0–134.0 . . . . . . . . . . . . . 12.4 5.9 7.6 13.7 16.9 17.6 10.5 8.7 11.4 14.2 15.7 16.9 15.1135.0–139.0 . . . . . . . . . . . . . 10.2 1.8 3.3 8.4 10.0 12.7 10.4 10.0 10.3 10.9 12.9 14.7 12.1140.0–144.0 . . . . . . . . . . . . . 9.2 0.3 0.2 1.7 3.9 8.7 9.7 11.4 12.2 10.6 12.9 11.4 9.7145.0–149.0 . . . . . . . . . . . . . 7.5 0.0 0.1 0.8 1.3 4.6 12.1 9.6 10.2 9.0 8.6 9.4 6.7150.0–154.0 . . . . . . . . . . . . . 5.7 0.0 0.1 0.2 0.2 1.4 7.5 10.3 6.8 7.6 6.6 5.2 3.8155.0–159.0 . . . . . . . . . . . . . 3.3 0.0 0.0 0.0 0.0 0.8 5.6 4.6 5.3 4.8 3.7 2.1 1.0160.0–164.0 . . . . . . . . . . . . . 2.2 0.0 0.0 0.0 0.0 0.1 2.1 4.1 2.7 3.2 3.1 1.7 1.1165.0–169.0 . . . . . . . . . . . . . 0.6 0.0 0.0 0.0 0.0 0.0 0.8 1.6 0.9 0.0 1.1 0.1 0.0170.0–174.0 . . . . . . . . . . . . . 0.3 0.0 0.0 0.0 0.0 0.0 0.1 0.3 0.6 0.6 0.5 0.1 0.0175.0–179.0 . . . . . . . . . . . . . 0.1 0.0 0.0 0.0 0.0 0.0 0.3 0.0 0.1 0.3 0.0 0.0 0.0180.0 and more . . . . . . . . . . . 0.0 0.0 0.0 0.0 0.0 0.0 0.0 0.0 0.2 0.0 0.2 0.0 0.1
See footnotes at end of table.
Series 11, No. 247 [ Page 73

Table 55. Percent distribution of hemoglobin in gram per liter for persons 1 year and over, by race/ethnicity and age: United States,1988–94—Con.
Race/ethnicity andselected hemoglobin
cutoffs1 year
and over1–2
years3–5
years6–8
years9–11years
12–14years
15–19years
20–29years
30–39years
40–49years
50–59years
60–69years
70 yearsand over
Mexican American
Total . . . . . . . . . . . . . . . . . . 100.0 100.0 100.0 100.0 100.0 100.0 100.0 100.0 100.0 100.0 100.0 100.0 100.0
Less than 100.0 . . . . . . . . . . . 0.7 2.0 0.5 0.1 0.0 0.0 0.6 0.1 0.6 2.5 1.5 0.4 1.8100.0–104.0 . . . . . . . . . . . . . 0.6 3.0 0.1 0.5 0.0 0.0 0.9 0.4 0.9 0.9 0.0 0.3 0.1105.0–109.0 . . . . . . . . . . . . . 1.1 4.9 2.6 0.7 0.0 0.2 0.1 1.0 1.3 1.0 0.2 0.9 0.9110.0–114.0 . . . . . . . . . . . . . 2.3 14.6 5.3 2.4 1.2 0.4 1.7 1.9 1.0 1.5 0.9 1.3 1.2115.0–119.0 . . . . . . . . . . . . . 5.1 20.1 18.6 6.7 3.4 1.8 4.5 3.2 3.0 3.9 1.5 1.9 4.0120.0–124.0 . . . . . . . . . . . . . 9.1 23.7 21.9 20.4 12.6 7.5 5.9 5.5 7.1 4.6 3.9 6.7 7.5125.0–129.0 . . . . . . . . . . . . . 11.4 18.5 26.3 22.9 18.8 12.2 8.2 8.1 7.4 7.7 6.0 9.8 8.0130.0–134.0 . . . . . . . . . . . . . 12.1 8.9 14.8 20.7 22.0 20.5 9.3 8.7 10.1 8.6 11.4 12.1 12.0135.0–139.0 . . . . . . . . . . . . . 12.1 2.4 7.4 17.7 21.1 21.0 11.7 9.7 9.5 12.2 12.6 13.5 18.1140.0–144.0 . . . . . . . . . . . . . 9.9 1.7 1.9 4.6 12.7 17.4 11.1 9.3 10.9 10.3 14.7 13.2 10.4145.0–149.0 . . . . . . . . . . . . . 9.3 0.2 0.5 2.4 4.1 10.2 13.3 9.6 10.3 12.1 17.2 15.7 13.5150.0–154.0 . . . . . . . . . . . . . 8.5 0.1 0.0 1.0 4.1 5.2 11.0 11.5 12.2 10.0 10.8 10.3 7.3155.0–159.0 . . . . . . . . . . . . . 7.6 0.0 0.0 0.0 0.0 2.7 7.8 12.8 10.8 12.4 7.6 5.7 6.4160.0–164.0 . . . . . . . . . . . . . 6.2 0.0 0.0 0.0 0.0 0.4 8.9 10.9 9.0 6.2 7.4 5.6 6.7165.0–169.0 . . . . . . . . . . . . . 2.7 0.0 0.0 0.0 0.0 0.2 3.4 4.5 4.1 3.8 3.5 1.4 2.1170.0–174.0 . . . . . . . . . . . . . 1.0 0.0 0.0 0.0 0.0 0.3 0.6 2.1 1.5 1.8 0.5 0.7 0.0175.0–179.0 . . . . . . . . . . . . . 0.2 0.0 0.0 0.0 0.0 0.0 0.5 0.4 0.1 0.3 0.3 0.2 0.0180.0 and more . . . . . . . . . . . 0.1 0.0 0.0 0.0 0.0 0.0 0.4 0.1 0.1 0.2 0.0 0.2 0.0
0.0 Quantity more than zero but less than 0.05.1Includes all other race/ethnic groups not listed separately.
NOTE: Numbers may not add to totals because of rounding.
Page 74 [ Series 11, No. 247

Table 56. Percent distribution of hemoglobin in gram per liter for males 1 year and over, by race/ethnicity and age: United States,1988–94
Race/ethnicity andselected hemoglobin
cutoffs1 year
and over1–2
years3–5
years6–8
years9–11years
12–14years
15–19years
20–29years
30–39years
40–49years
50–59years
60–69years
70 yearsand over
All race/ethnic groups1
Total . . . . . . . . . . . . . . . . . . 100.0 100.0 100.0 100.0 100.0 100.0 100.0 100.0 100.0 100.0 100.0 100.0 100.0
Less than 100.0 . . . . . . . . . . . 0.1 0.9 0.2 0.2 0.1 0.1 0.1 0.1 0.1 0.1 0.2 0.1 0.7100.0–104.0 . . . . . . . . . . . . . 0.2 1.8 0.8 0.6 0.1 0.1 0.1 0.1 0.1 0.1 0.1 0.1 0.7105.0–109.0 . . . . . . . . . . . . . 0.4 8.0 2.5 0.7 0.1 0.1 0.1 0.1 0.1 0.1 0.1 0.2 0.9110.0–114.0 . . . . . . . . . . . . . 1.1 14.3 8.0 2.9 0.8 0.5 0.1 0.1 0.1 0.1 0.4 0.2 1.6115.0–119.0 . . . . . . . . . . . . . 2.4 24.1 19.1 7.5 4.2 1.3 0.1 0.1 0.4 0.7 0.3 0.8 2.0120.0–124.0 . . . . . . . . . . . . . 3.8 21.8 28.4 15.6 11.4 3.2 0.6 0.4 0.1 0.7 0.9 1.8 3.5125.0–129.0 . . . . . . . . . . . . . 5.1 17.6 20.5 27.8 20.7 8.9 1.6 0.3 0.9 1.2 2.1 2.8 4.4130.0–134.0 . . . . . . . . . . . . . 5.9 8.4 12.0 21.8 21.0 15.1 3.5 1.0 2.7 2.5 3.1 5.6 7.8135.0–139.0 . . . . . . . . . . . . . 8.0 2.6 6.4 15.5 18.4 11.9 8.7 3.8 5.4 6.7 7.9 10.6 13.0140.0–144.0 . . . . . . . . . . . . . 11.7 0.2 1.9 4.7 17.0 19.4 12.0 9.5 11.1 11.3 14.6 16.5 16.1145.0–149.0 . . . . . . . . . . . . . 14.9 0.2 0.1 2.5 5.3 15.9 18.1 16.4 17.1 20.7 15.2 18.0 15.1150.0–154.0 . . . . . . . . . . . . . 16.6 0.1 0.1 0.2 1.1 14.3 21.4 19.9 22.7 18.7 20.2 19.3 15.3155.0–159.0 . . . . . . . . . . . . . 13.4 0.1 0.1 0.1 0.1 4.5 16.9 20.8 15.1 21.1 16.1 10.8 8.7160.0–164.0 . . . . . . . . . . . . . 9.2 0.1 0.1 0.1 0.1 3.6 9.3 17.6 13.8 7.9 10.9 6.7 5.5165.0–169.0 . . . . . . . . . . . . . 4.1 0.1 0.1 0.1 0.1 1.2 3.8 6.2 6.5 5.4 3.8 3.8 2.7170.0–174.0 . . . . . . . . . . . . . 2.1 0.1 0.1 0.1 0.1 0.1 2.5 3.1 3.5 1.9 3.0 1.5 1.4175.0–179.0 . . . . . . . . . . . . . 0.5 0.1 0.1 0.1 0.1 0.1 0.6 0.4 0.4 1.0 0.8 0.4 0.3180.0 and more . . . . . . . . . . . 0.4 0.1 0.1 0.1 0.1 0.1 0.7 0.7 0.3 0.3 0.2 0.7 0.4
Non-Hispanic white
Total . . . . . . . . . . . . . . . . . . 100.0 100.0 100.0 100.0 100.0 100.0 100.0 100.0 100.0 100.0 100.0 100.0 100.0
Less than 100.0 . . . . . . . . . . . 0.1 0.5 0.1 0.3 0.1 0.1 0.1 0.1 0.1 0.1 0.1 0.1 0.5100.0–104.0 . . . . . . . . . . . . . 0.1 0.8 0.1 0.7 0.1 0.1 0.1 0.1 0.1 0.1 0.1 0.1 0.2105.0–109.0 . . . . . . . . . . . . . 0.3 6.5 1.2 0.1 0.1 0.1 0.1 0.1 0.1 0.1 0.1 0.2 0.9110.0–114.0 . . . . . . . . . . . . . 0.9 15.7 8.5 2.6 0.1 0.5 0.1 0.1 0.1 0.1 0.4 0.1 1.5115.0–119.0 . . . . . . . . . . . . . 1.9 25.6 18.6 5.2 2.8 0.6 0.1 0.1 0.3 0.7 0.1 0.6 1.8120.0–124.0 . . . . . . . . . . . . . 3.0 21.9 29.1 12.5 9.0 2.6 0.1 0.3 0.1 0.4 0.5 1.8 2.7125.0–129.0 . . . . . . . . . . . . . 4.5 17.8 19.5 28.6 21.2 7.8 1.7 0.1 0.7 0.7 2.0 2.7 3.7130.0–134.0 . . . . . . . . . . . . . 5.5 8.9 13.3 24.9 21.3 15.1 1.9 0.6 2.5 1.9 2.3 5.4 7.5135.0–139.0 . . . . . . . . . . . . . 7.4 2.3 7.1 16.8 18.5 11.5 7.6 3.0 4.3 5.5 7.5 9.0 12.7140.0–144.0 . . . . . . . . . . . . . 11.6 0.1 2.5 5.4 20.3 19.9 9.8 8.8 10.5 10.1 13.9 17.4 16.1145.0–149.0 . . . . . . . . . . . . . 15.3 0.1 0.2 3.0 6.1 16.0 18.7 15.7 17.4 21.3 13.8 18.5 16.0150.0–154.0 . . . . . . . . . . . . . 17.5 0.1 0.1 0.1 1.0 16.3 24.1 19.4 22.7 19.7 21.4 19.7 16.3155.0–159.0 . . . . . . . . . . . . . 14.6 0.1 0.1 0.1 0.1 4.3 19.6 22.5 16.2 21.8 18.3 10.5 9.3160.0–164.0 . . . . . . . . . . . . . 9.7 0.1 0.1 0.1 0.1 4.9 9.1 18.4 14.6 8.3 10.6 7.1 5.5165.0–169.0 . . . . . . . . . . . . . 4.4 0.1 0.1 0.1 0.1 0.5 3.8 6.9 6.5 6.1 4.2 4.1 3.1170.0–174.0 . . . . . . . . . . . . . 2.3 0.1 0.1 0.1 0.1 0.1 3.6 3.7 3.5 2.0 3.4 1.7 1.5175.0–179.0 . . . . . . . . . . . . . 0.5 0.1 0.1 0.1 0.1 0.1 0.1 0.5 0.5 1.0 1.1 0.5 0.3180.0 and more . . . . . . . . . . . 0.3 0.1 0.1 0.1 0.1 0.1 0.1 0.4 0.3 0.3 0.2 0.8 0.3
Non-Hispanic black
Total . . . . . . . . . . . . . . . . . . 100.0 100.0 100.0 100.0 100.0 100.0 100.0 100.0 100.0 100.0 100.0 100.0 100.0
Less than 100.0 . . . . . . . . . . . 0.6 2.2 1.2 0.3 0.9 0.5 0.1 0.1 0.6 0.1 0.4 1.7 2.2100.0–104.0 . . . . . . . . . . . . . 0.6 3.9 2.6 0.7 0.1 0.3 0.1 0.1 0.1 0.1 0.5 1.1 2.1105.0–109.0 . . . . . . . . . . . . . 1.2 12.8 7.6 1.7 0.7 0.1 0.1 0.1 0.2 0.1 0.3 0.3 0.7110.0–114.0 . . . . . . . . . . . . . 2.5 17.4 9.8 6.6 3.9 1.3 0.5 0.1 0.4 0.3 0.3 2.7 4.4115.0–119.0 . . . . . . . . . . . . . 5.4 24.6 25.6 13.1 10.9 7.1 0.3 0.1 1.4 1.4 3.0 3.0 4.9120.0–124.0 . . . . . . . . . . . . . 7.3 21.0 25.4 26.1 21.5 8.8 1.8 0.4 1.1 2.0 5.9 4.3 7.3125.0–129.0 . . . . . . . . . . . . . 8.4 11.2 17.2 24.6 27.4 19.2 2.6 2.1 2.9 4.6 5.2 6.7 9.3130.0–134.0 . . . . . . . . . . . . . 9.0 4.5 5.9 13.4 18.5 18.9 9.4 3.7 6.4 9.2 7.4 10.7 15.0135.0–139.0 . . . . . . . . . . . . . 11.6 2.4 4.7 8.9 11.0 15.4 13.8 10.0 11.0 11.9 15.3 19.4 16.4140.0–144.0 . . . . . . . . . . . . . 14.5 0.1 0.1 2.6 3.6 16.7 17.0 19.2 20.6 18.7 16.5 13.9 14.3145.0–149.0 . . . . . . . . . . . . . 13.9 0.1 0.1 1.5 1.4 6.8 22.3 19.4 19.8 17.9 14.0 16.1 11.0150.0–154.0 . . . . . . . . . . . . . 11.5 0.1 0.1 0.3 0.1 3.0 15.0 21.9 14.7 15.3 12.6 10.3 7.5155.0–159.0 . . . . . . . . . . . . . 7.1 0.1 0.1 0.1 0.1 1.7 11.1 10.1 11.5 10.4 8.2 5.1 2.5160.0–164.0 . . . . . . . . . . . . . 4.6 0.1 0.1 0.1 0.1 0.3 4.1 9.0 6.0 6.4 6.8 4.1 2.1165.0–169.0 . . . . . . . . . . . . . 1.2 0.1 0.1 0.1 0.1 0.1 1.5 3.5 1.9 0.1 2.1 0.4 0.1170.0–174.0 . . . . . . . . . . . . . 0.6 0.1 0.1 0.1 0.1 0.1 0.2 0.7 1.2 1.3 1.1 0.2 0.1175.0–179.0 . . . . . . . . . . . . . 0.1 0.1 0.1 0.1 0.1 0.1 0.5 0.1 0.1 0.6 0.1 0.1 0.1180.0 and more . . . . . . . . . . . 0.1 0.1 0.1 0.1 0.1 0.1 0.1 0.1 0.4 0.1 0.4 0.1 0.3
See footnotes at end of table.
Series 11, No. 247 [ Page 75
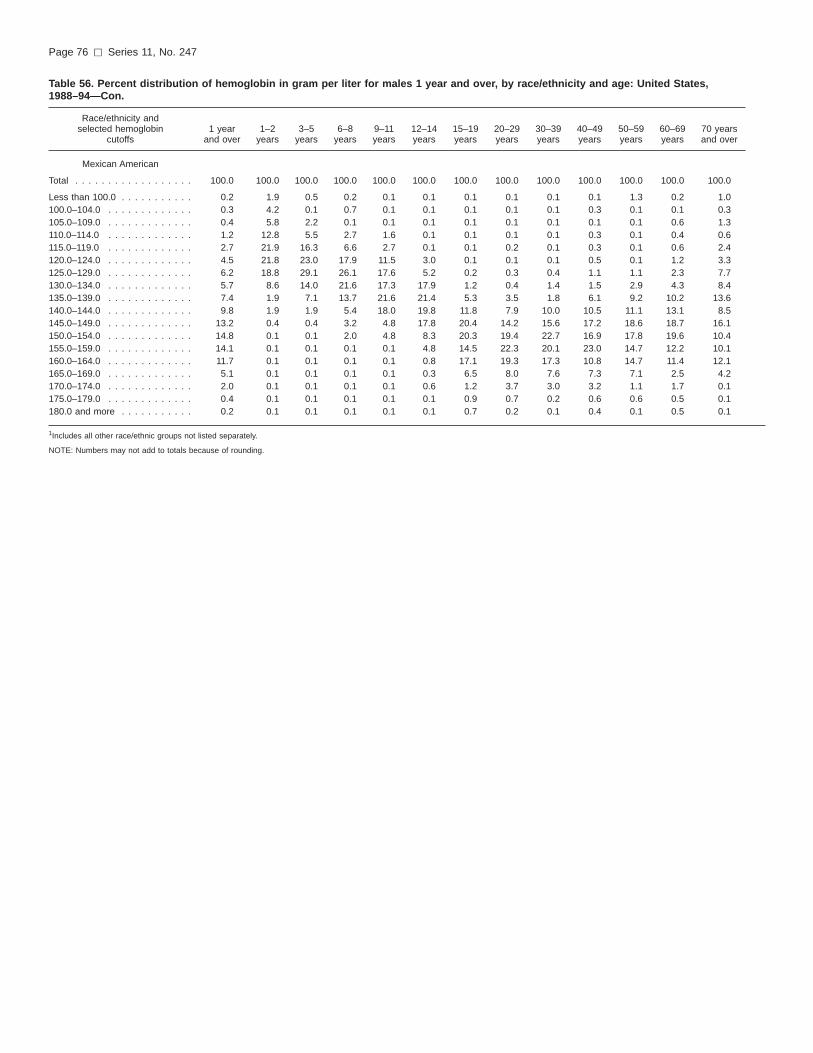
Table 56. Percent distribution of hemoglobin in gram per liter for males 1 year and over, by race/ethnicity and age: United States,1988–94—Con.
Race/ethnicity andselected hemoglobin
cutoffs1 year
and over1–2
years3–5
years6–8
years9–11years
12–14years
15–19years
20–29years
30–39years
40–49years
50–59years
60–69years
70 yearsand over
Mexican American
Total . . . . . . . . . . . . . . . . . . 100.0 100.0 100.0 100.0 100.0 100.0 100.0 100.0 100.0 100.0 100.0 100.0 100.0
Less than 100.0 . . . . . . . . . . . 0.2 1.9 0.5 0.2 0.1 0.1 0.1 0.1 0.1 0.1 1.3 0.2 1.0100.0–104.0 . . . . . . . . . . . . . 0.3 4.2 0.1 0.7 0.1 0.1 0.1 0.1 0.1 0.3 0.1 0.1 0.3105.0–109.0 . . . . . . . . . . . . . 0.4 5.8 2.2 0.1 0.1 0.1 0.1 0.1 0.1 0.1 0.1 0.6 1.3110.0–114.0 . . . . . . . . . . . . . 1.2 12.8 5.5 2.7 1.6 0.1 0.1 0.1 0.1 0.3 0.1 0.4 0.6115.0–119.0 . . . . . . . . . . . . . 2.7 21.9 16.3 6.6 2.7 0.1 0.1 0.2 0.1 0.3 0.1 0.6 2.4120.0–124.0 . . . . . . . . . . . . . 4.5 21.8 23.0 17.9 11.5 3.0 0.1 0.1 0.1 0.5 0.1 1.2 3.3125.0–129.0 . . . . . . . . . . . . . 6.2 18.8 29.1 26.1 17.6 5.2 0.2 0.3 0.4 1.1 1.1 2.3 7.7130.0–134.0 . . . . . . . . . . . . . 5.7 8.6 14.0 21.6 17.3 17.9 1.2 0.4 1.4 1.5 2.9 4.3 8.4135.0–139.0 . . . . . . . . . . . . . 7.4 1.9 7.1 13.7 21.6 21.4 5.3 3.5 1.8 6.1 9.2 10.2 13.6140.0–144.0 . . . . . . . . . . . . . 9.8 1.9 1.9 5.4 18.0 19.8 11.8 7.9 10.0 10.5 11.1 13.1 8.5145.0–149.0 . . . . . . . . . . . . . 13.2 0.4 0.4 3.2 4.8 17.8 20.4 14.2 15.6 17.2 18.6 18.7 16.1150.0–154.0 . . . . . . . . . . . . . 14.8 0.1 0.1 2.0 4.8 8.3 20.3 19.4 22.7 16.9 17.8 19.6 10.4155.0–159.0 . . . . . . . . . . . . . 14.1 0.1 0.1 0.1 0.1 4.8 14.5 22.3 20.1 23.0 14.7 12.2 10.1160.0–164.0 . . . . . . . . . . . . . 11.7 0.1 0.1 0.1 0.1 0.8 17.1 19.3 17.3 10.8 14.7 11.4 12.1165.0–169.0 . . . . . . . . . . . . . 5.1 0.1 0.1 0.1 0.1 0.3 6.5 8.0 7.6 7.3 7.1 2.5 4.2170.0–174.0 . . . . . . . . . . . . . 2.0 0.1 0.1 0.1 0.1 0.6 1.2 3.7 3.0 3.2 1.1 1.7 0.1175.0–179.0 . . . . . . . . . . . . . 0.4 0.1 0.1 0.1 0.1 0.1 0.9 0.7 0.2 0.6 0.6 0.5 0.1180.0 and more . . . . . . . . . . . 0.2 0.1 0.1 0.1 0.1 0.1 0.7 0.2 0.1 0.4 0.1 0.5 0.1
1Includes all other race/ethnic groups not listed separately.
NOTE: Numbers may not add to totals because of rounding.
Page 76 [ Series 11, No. 247

Table 57. Percent distribution of hemoglobin in gram per liter for females 1 year and over, by race/ethnicity and age: United States,1988–94
Race/ethnicity andselected hemoglobin
cutoffs1 year
and over1–2
years3–5
years6–8
years9–11years
12–14years
15–19years
20–29years
30–39years
40–49years
50–59years
60–69years
70 yearsand over
All race/ethnic groups1
Total . . . . . . . . . . . . . . . . . . 100.0 100.0 100.0 100.0 100.0 100.0 100.0 100.0 100.0 100.0 100.0 100.0 100.0
Less than 100.0 . . . . . . . . . . . 0.7 0.8 0.3 0.0 0.1 0.0 0.5 0.7 1.1 1.5 0.5 0.6 0.8100.0–104.0 . . . . . . . . . . . . . 0.6 1.6 0.7 0.0 0.3 0.0 0.4 0.5 0.6 1.2 0.4 0.3 0.8105.0–109.0 . . . . . . . . . . . . . 1.1 6.3 2.3 0.6 0.0 0.9 0.3 1.5 1.2 0.8 0.1 0.5 1.4110.0–114.0 . . . . . . . . . . . . . 3.3 14.4 8.4 3.9 0.7 2.9 3.8 3.4 3.2 2.6 1.6 2.1 2.8115.0–119.0 . . . . . . . . . . . . . 6.7 24.8 18.9 11.8 5.8 4.9 6.4 6.6 6.1 5.2 4.1 4.5 4.8120.0–124.0 . . . . . . . . . . . . . 11.1 25.6 23.6 13.7 12.1 11.1 12.5 13.1 9.3 9.2 7.3 8.0 8.9125.0–129.0 . . . . . . . . . . . . . 17.0 14.5 22.8 25.9 26.3 17.7 17.3 15.7 16.8 16.2 15.5 15.0 14.0130.0–134.0 . . . . . . . . . . . . . 19.4 8.1 15.6 25.0 23.9 20.3 20.5 18.0 18.9 21.9 21.2 16.6 18.4135.0–139.0 . . . . . . . . . . . . . 17.4 2.9 6.2 13.7 17.6 15.9 17.7 19.4 18.6 17.2 17.8 21.1 17.9140.0–144.0 . . . . . . . . . . . . . 11.6 0.7 1.0 4.2 8.8 13.8 11.5 11.3 12.7 13.1 12.5 14.4 14.2145.0–149.0 . . . . . . . . . . . . . 6.9 0.2 0.3 1.0 3.5 8.7 7.2 7.2 5.9 6.7 10.5 9.5 8.9150.0–154.0 . . . . . . . . . . . . . 2.9 0.0 0.0 0.2 0.3 2.3 1.2 1.6 4.2 2.1 6.0 5.1 3.8155.0–159.0 . . . . . . . . . . . . . 1.1 0.0 0.0 0.0 0.5 1.1 0.7 0.9 1.0 1.6 1.7 0.9 2.2160.0–164.0 . . . . . . . . . . . . . 0.3 0.0 0.0 0.0 0.0 0.4 0.0 0.1 0.3 0.6 0.7 0.6 0.7165.0–169.0 . . . . . . . . . . . . . 0.0 0.0 0.0 0.0 0.0 0.0 0.0 0.0 0.1 0.0 0.0 0.2 0.2170.0–174.0 . . . . . . . . . . . . . 0.1 0.0 0.0 0.0 0.0 0.0 0.0 0.0 0.0 0.0 0.1 0.4 0.1175.0–179.0 . . . . . . . . . . . . . 0.0 0.0 0.0 0.0 0.0 0.0 0.0 0.0 0.0 0.0 0.0 0.0 0.0180.0 and more . . . . . . . . . . . 0.0 0.0 0.0 0.0 0.0 0.0 0.0 0.0 0.0 0.0 0.0 0.2 0.0
Non-Hispanic white
Total . . . . . . . . . . . . . . . . . . 100.0 100.0 100.0 100.0 100.0 100.0 100.0 100.0 100.0 100.0 100.0 100.0 100.0
Less than 100.0 . . . . . . . . . . . 0.3 0.6 0.0 0.0 0.0 0.0 0.0 0.4 0.3 0.4 0.2 0.6 0.4100.0–104.0 . . . . . . . . . . . . . 0.4 0.5 0.0 0.0 0.4 0.0 0.2 0.3 0.0 1.2 0.4 0.2 0.9105.0–109.0 . . . . . . . . . . . . . 0.6 5.7 1.4 0.0 0.0 0.4 0.0 1.1 0.5 0.2 0.0 0.3 0.9110.0–114.0 . . . . . . . . . . . . . 2.4 13.4 5.5 2.5 0.2 2.2 2.4 2.4 2.6 1.7 1.3 2.0 2.4115.0–119.0 . . . . . . . . . . . . . 5.1 25.6 18.1 9.4 4.6 3.3 5.0 4.7 3.8 3.8 2.8 4.1 4.3120.0–124.0 . . . . . . . . . . . . . 9.4 29.0 26.3 11.1 9.4 9.1 9.7 10.7 7.7 8.3 6.4 6.7 8.3125.0–129.0 . . . . . . . . . . . . . 16.7 14.2 23.5 29.1 25.6 17.0 17.2 15.2 16.8 15.9 14.9 15.1 14.3130.0–134.0 . . . . . . . . . . . . . 19.9 8.6 16.3 27.2 22.7 22.0 21.2 18.5 20.0 22.6 21.0 16.4 18.9135.0–139.0 . . . . . . . . . . . . . 18.7 1.3 7.9 13.9 20.9 14.9 19.1 21.2 19.7 18.9 18.6 21.9 18.5140.0–144.0 . . . . . . . . . . . . . 13.1 0.7 0.6 5.3 10.8 17.3 14.9 13.2 14.5 14.0 13.0 14.4 14.8145.0–149.0 . . . . . . . . . . . . . 7.9 0.4 0.4 1.2 4.6 8.3 7.5 9.2 7.0 8.1 11.2 10.2 8.8150.0–154.0 . . . . . . . . . . . . . 3.5 0.0 0.0 0.3 0.0 3.1 1.7 1.8 5.6 2.5 6.9 5.8 4.0155.0–159.0 . . . . . . . . . . . . . 1.4 0.0 0.0 0.0 0.8 1.6 1.0 1.2 1.2 1.8 2.1 1.1 2.4160.0–164.0 . . . . . . . . . . . . . 0.4 0.0 0.0 0.0 0.0 0.6 0.0 0.0 0.4 0.7 0.9 0.4 0.6165.0–169.0 . . . . . . . . . . . . . 0.1 0.0 0.0 0.0 0.0 0.0 0.0 0.0 0.1 0.0 0.0 0.2 0.2170.0–174.0 . . . . . . . . . . . . . 0.1 0.0 0.0 0.0 0.0 0.0 0.0 0.0 0.0 0.0 0.2 0.4 0.1180.0 and more . . . . . . . . . . . 0.0 0.0 0.0 0.0 0.0 0.0 0.0 0.0 0.0 0.0 0.0 0.1 0.0
Non-Hispanic black
Total . . . . . . . . . . . . . . . . . . 100.0 100.0 100.0 100.0 100.0 100.0 100.0 100.0 100.0 100.0 100.0 100.0 100.0
Less than 100.0 . . . . . . . . . . . 2.6 1.3 0.7 0.0 0.4 0.0 2.6 2.6 3.4 4.9 2.6 0.7 5.8100.0–104.0 . . . . . . . . . . . . . 1.4 4.3 1.0 0.0 0.0 0.1 1.0 1.4 2.0 2.3 0.6 1.1 1.2105.0–109.0 . . . . . . . . . . . . . 3.4 9.1 4.4 2.3 0.3 3.7 2.1 3.7 3.9 3.4 0.5 2.2 6.4110.0–114.0 . . . . . . . . . . . . . 8.6 18.3 15.5 11.4 3.7 8.1 10.0 8.6 7.8 9.8 4.5 4.3 7.3115.0–119.0 . . . . . . . . . . . . . 14.1 24.6 24.6 20.2 15.2 13.5 14.5 13.5 15.2 10.5 7.4 10.3 11.0120.0–124.0 . . . . . . . . . . . . . 18.9 19.0 21.1 23.7 21.2 23.4 25.8 21.5 17.0 14.6 11.8 18.4 13.6125.0–129.0 . . . . . . . . . . . . . 19.2 14.1 20.8 19.6 29.2 19.9 21.3 19.2 17.0 17.6 22.9 14.6 17.6130.0–134.0 . . . . . . . . . . . . . 15.4 7.4 9.4 14.0 15.3 16.4 11.7 13.0 15.6 18.2 22.5 21.2 15.1135.0–139.0 . . . . . . . . . . . . . 9.0 1.2 1.9 7.9 9.0 10.4 6.9 10.0 9.7 10.1 10.9 11.4 9.3140.0–144.0 . . . . . . . . . . . . . 4.7 0.5 0.2 0.9 4.2 1.8 2.2 4.9 5.2 4.2 10.0 9.6 6.7145.0–149.0 . . . . . . . . . . . . . 2.1 0.0 0.1 0.0 1.2 2.6 1.8 1.3 2.2 1.8 4.2 4.6 4.0150.0–154.0 . . . . . . . . . . . . . 0.7 0.0 0.2 0.0 0.4 0.0 0.0 0.5 0.3 1.5 1.7 1.6 1.4155.0–159.0 . . . . . . . . . . . . . 0.1 0.0 0.0 0.0 0.0 0.0 0.0 0.0 0.2 0.3 0.0 0.0 0.0160.0–164.0 . . . . . . . . . . . . . 0.1 0.0 0.0 0.0 0.0 0.0 0.0 0.0 0.0 0.6 0.0 0.0 0.5165.0–169.0 . . . . . . . . . . . . . 0.0 0.0 0.0 0.0 0.0 0.0 0.0 0.0 0.0 0.0 0.2 0.0 0.0170.0–174.0 . . . . . . . . . . . . . 0.0 0.0 0.0 0.0 0.0 0.0 0.0 0.0 0.1 0.0 0.0 0.0 0.0175.0–179.0 . . . . . . . . . . . . . 0.0 0.0 0.0 0.0 0.0 0.0 0.0 0.0 0.1 0.0 0.0 0.0 0.0
See footnotes at end of table.
Series 11, No. 247 [ Page 77

Table 57. Percent distribution of hemoglobin in gram per liter for females 1 year and over, by race/ethnicity and age: United States,1988–94—Con.
Race/ethnicity andselected hemoglobin
cutoffs1 year
and over1–2
years3–5
years6–8
years9–11years
12–14years
15–19years
20–29years
30–39years
40–49years
50–59years
60–69years
70 yearsand over
Mexican American
Total . . . . . . . . . . . . . . . . . . 100.0 100.0 100.0 100.0 100.0 100.0 100.0 100.0 100.0 100.0 100.0 100.0 100.0
Less than 100.0 . . . . . . . . . . . 1.2 2.2 0.5 0.0 0.0 0.0 1.3 0.3 1.4 5.1 1.7 0.5 2.5100.0–104.0 . . . . . . . . . . . . . 1.0 1.7 0.2 0.3 0.0 0.0 1.8 0.9 2.0 1.6 0.0 0.5 0.0105.0–109.0 . . . . . . . . . . . . . 1.7 3.9 3.1 1.3 0.0 0.3 0.2 2.4 2.7 2.0 0.3 1.2 0.6110.0–114.0 . . . . . . . . . . . . . 3.4 16.6 5.2 2.1 0.6 0.8 3.5 4.4 2.1 2.8 1.7 2.0 1.8115.0–119.0 . . . . . . . . . . . . . 7.8 18.1 21.0 6.8 4.3 3.3 9.5 7.1 6.3 7.6 3.0 3.0 5.5120.0–124.0 . . . . . . . . . . . . . 13.9 25.7 20.7 22.8 13.9 11.4 12.4 12.4 14.8 9.0 7.6 11.0 11.5125.0–129.0 . . . . . . . . . . . . . 17.0 18.1 23.6 19.8 20.2 18.2 17.0 18.1 15.1 14.7 10.7 15.6 8.4130.0–134.0 . . . . . . . . . . . . . 18.9 9.2 15.5 19.8 27.6 22.7 18.3 19.3 19.6 16.1 19.5 18.2 15.6135.0–139.0 . . . . . . . . . . . . . 17.1 2.9 7.7 21.6 20.5 20.7 18.7 17.6 17.9 18.7 15.9 16.0 22.5140.0–144.0 . . . . . . . . . . . . . 10.1 1.5 1.9 3.8 6.4 15.3 10.4 11.1 11.8 10.1 18.2 13.3 12.2145.0–149.0 . . . . . . . . . . . . . 5.2 0.0 0.6 1.7 3.2 3.8 5.5 3.9 4.5 6.8 15.9 13.4 11.0150.0–154.0 . . . . . . . . . . . . . 1.7 0.1 0.0 0.0 3.2 2.6 0.7 1.5 0.9 2.7 4.1 3.1 4.2155.0–159.0 . . . . . . . . . . . . . 0.6 0.0 0.0 0.0 0.0 0.9 0.6 0.7 0.7 1.2 0.9 0.5 2.7160.0–164.0 . . . . . . . . . . . . . 0.3 0.0 0.0 0.0 0.0 0.0 0.0 0.3 0.0 1.4 0.5 1.2 1.5165.0–169.0 . . . . . . . . . . . . . 0.1 0.0 0.0 0.0 0.0 0.0 0.0 0.1 0.3 0.0 0.0 0.6 0.0170.0–174.0 . . . . . . . . . . . . . 0.0 0.0 0.0 0.0 0.0 0.0 0.0 0.0 0.0 0.4 0.0 0.0 0.0
0.0 Quantity more than zero but less than 0.05.1Includes all other race/ethnic groups not listed separately.
NOTE: Numbers may not add to totals because of rounding.
Page 78 [ Series 11, No. 247

Table 58. Percent distribution of hematocrit as fractions (liter per liter) for persons 1 year and over, by race/ethnicity and age:United States, 1988–94
Race/ethnicity andselected hematocrit
cutoffs1 year
and over1–2
years3–5
years6–8
years9–11years
12–14years
15–19years
20–29years
30–39years
40–49years
50–59years
60–69years
70 yearsand over
All race/ethnic groups1
Total . . . . . . . . . . . . . . . . . . 100.0 100.0 100.0 100.0 100.0 100.0 100.0 100.0 100.0 100.0 100.0 100.0 100.0
Less than 0.30 . . . . . . . . . . . . 0.3 0.6 0.2 0.0 0.1 0.0 0.2 0.3 0.2 0.5 0.2 0.3 0.60.30–0.31 . . . . . . . . . . . . . . . 0.5 3.4 1.1 0.5 0.1 0.1 0.3 0.3 0.6 0.4 0.2 0.1 1.10.32–0.33 . . . . . . . . . . . . . . . 2.0 15.7 7.7 3.4 0.6 1.4 1.5 1.6 1.2 1.3 0.8 1.0 2.00.34–0.35 . . . . . . . . . . . . . . . 6.0 32.4 26.5 12.6 6.1 3.3 3.3 5.1 4.1 3.5 2.8 3.4 4.50.36–0.37 . . . . . . . . . . . . . . . 13.7 31.7 37.7 31.0 26.8 12.3 11.5 11.0 9.3 11.4 8.3 10.2 11.50.38–0.39 . . . . . . . . . . . . . . . 18.2 12.7 18.5 33.9 32.4 24.6 17.2 14.3 15.9 15.8 18.3 16.6 20.10.40–0.41 . . . . . . . . . . . . . . . 16.8 3.2 7.5 14.5 22.9 21.6 17.8 14.6 17.0 16.7 17.8 20.4 19.50.42–0.44 . . . . . . . . . . . . . . . 24.0 0.5 0.8 4.1 10.6 28.0 26.2 25.2 27.9 28.0 29.0 29.7 26.70.45–0.46 . . . . . . . . . . . . . . . 10.2 0.0 0.0 0.0 0.4 5.9 12.6 13.2 12.3 13.8 13.5 10.6 8.20.47–0.48 . . . . . . . . . . . . . . . 5.6 0.0 0.0 0.0 0.0 2.6 6.2 11.0 7.4 5.4 5.7 4.5 3.70.49–0.50 . . . . . . . . . . . . . . . 2.2 0.0 0.0 0.0 0.0 0.2 2.3 2.7 3.5 2.5 2.9 2.0 1.50.51–0.52 . . . . . . . . . . . . . . . 0.4 0.0 0.0 0.0 0.0 0.0 0.9 0.6 0.5 0.4 0.3 0.5 0.50.53–0.54 . . . . . . . . . . . . . . . 0.1 0.0 0.0 0.0 0.0 0.0 0.0 0.1 0.1 0.2 0.1 0.3 0.00.55 and more . . . . . . . . . . . . 0.0 0.0 0.0 0.0 0.0 0.0 0.0 0.0 0.1 0.0 0.0 0.3 0.1
Non-Hispanic white
Total . . . . . . . . . . . . . . . . . . 100.0 100.0 100.0 100.0 100.0 100.0 100.0 100.0 100.0 100.0 100.0 100.0 100.0
Less than 0.30 . . . . . . . . . . . . 0.1 0.4 0.1 0.0 0.0 0.0 0.0 0.1 0.1 0.1 0.0 0.3 0.30.30–0.31 . . . . . . . . . . . . . . . 0.3 2.6 0.7 0.5 0.2 0.0 0.1 0.2 0.1 0.2 0.2 0.0 0.80.32–0.33 . . . . . . . . . . . . . . . 1.6 16.2 6.8 3.2 0.1 0.9 0.8 1.3 0.6 1.0 0.8 1.0 1.80.34–0.35 . . . . . . . . . . . . . . . 5.1 33.7 26.7 10.2 5.3 2.4 3.1 4.6 3.4 2.6 2.5 3.0 4.20.36–0.37 . . . . . . . . . . . . . . . 12.1 32.6 38.5 30.1 24.6 10.0 9.5 9.5 7.7 10.8 7.4 9.6 10.90.38–0.39 . . . . . . . . . . . . . . . 18.2 11.7 17.4 36.1 30.9 25.3 17.6 14.9 16.4 15.3 17.8 16.5 20.30.40–0.41 . . . . . . . . . . . . . . . 17.5 2.6 9.2 15.1 26.0 21.3 17.8 15.4 17.6 16.8 18.4 19.6 19.90.42–0.44 . . . . . . . . . . . . . . . 25.7 0.2 0.7 4.9 12.5 30.3 28.6 26.1 29.6 29.6 28.9 30.9 27.10.45–0.46 . . . . . . . . . . . . . . . 10.8 0.0 0.0 0.0 0.4 7.3 13.0 12.8 12.9 14.7 14.7 10.8 8.80.47–0.48 . . . . . . . . . . . . . . . 5.8 0.0 0.0 0.0 0.0 2.3 6.3 11.9 7.6 5.7 5.6 4.7 3.70.49–0.50 . . . . . . . . . . . . . . . 2.3 0.0 0.0 0.0 0.0 0.2 2.8 2.6 3.5 2.7 3.2 2.3 1.70.51–0.52 . . . . . . . . . . . . . . . 0.4 0.0 0.0 0.0 0.0 0.0 0.5 0.7 0.4 0.3 0.3 0.5 0.60.53–0.54 . . . . . . . . . . . . . . . 0.1 0.0 0.0 0.0 0.0 0.0 0.0 0.0 0.1 0.3 0.1 0.4 0.00.55 and more . . . . . . . . . . . . 0.0 0.0 0.0 0.0 0.0 0.0 0.0 0.0 0.1 0.0 0.0 0.3 0.1
Non-Hispanic black
Total . . . . . . . . . . . . . . . . . . 100.0 100.0 100.0 100.0 100.0 100.0 100.0 100.0 100.0 100.0 100.0 100.0 100.0
Less than 0.30 . . . . . . . . . . . . 1.2 1.2 0.3 0.2 0.7 0.2 1.1 1.3 1.2 1.9 0.9 0.9 3.90.30–0.31 . . . . . . . . . . . . . . . 1.5 3.7 3.0 0.5 0.0 0.4 1.4 1.0 1.9 1.6 0.7 1.5 3.00.32–0.33 . . . . . . . . . . . . . . . 4.5 19.9 11.3 4.7 2.0 3.6 3.6 3.7 3.4 3.8 1.9 2.1 5.50.34–0.35 . . . . . . . . . . . . . . . 10.9 33.4 30.3 19.5 12.9 8.8 6.1 7.7 9.5 8.6 5.1 7.1 8.50.36–0.37 . . . . . . . . . . . . . . . 21.0 27.0 35.0 36.7 36.2 26.0 20.1 18.1 15.8 15.0 17.1 17.1 17.20.38–0.39 . . . . . . . . . . . . . . . 18.6 12.3 16.1 28.0 30.1 29.8 15.2 13.3 16.4 16.8 21.6 20.7 20.50.40–0.41 . . . . . . . . . . . . . . . 13.3 1.7 3.5 8.1 13.8 16.6 12.7 12.5 13.5 16.6 16.1 20.4 15.40.42–0.44 . . . . . . . . . . . . . . . 18.0 0.9 0.2 2.2 4.2 12.1 22.5 23.9 24.1 21.7 21.9 20.8 20.50.45–0.46 . . . . . . . . . . . . . . . 6.4 0.0 0.2 0.2 0.0 1.7 11.6 10.5 7.5 8.3 8.2 6.4 3.10.47–0.48 . . . . . . . . . . . . . . . 3.2 0.0 0.0 0.0 0.0 0.6 4.2 4.9 5.0 4.6 4.4 1.8 1.50.49–0.50 . . . . . . . . . . . . . . . 1.1 0.0 0.0 0.0 0.0 0.2 1.2 2.9 1.0 0.7 1.5 1.2 0.70.51–0.52 . . . . . . . . . . . . . . . 0.2 0.0 0.0 0.0 0.0 0.0 0.2 0.2 0.5 0.5 0.4 0.1 0.00.53–0.54 . . . . . . . . . . . . . . . 0.0 0.0 0.0 0.0 0.0 0.0 0.0 0.0 0.1 0.0 0.0 0.0 0.10.55 and more . . . . . . . . . . . . 0.0 0.0 0.0 0.0 0.0 0.0 0.0 0.0 0.1 0.0 0.2 0.0 0.0
Mexican American
Total . . . . . . . . . . . . . . . . . . 100.0 100.0 100.0 100.0 100.0 100.0 100.0 100.0 100.0 100.0 100.0 100.0 100.0
Less than 0.30 . . . . . . . . . . . . 0.5 1.1 0.5 0.1 0.0 0.0 0.3 0.2 0.5 1.2 1.5 0.4 1.40.30–0.31 . . . . . . . . . . . . . . . 0.7 3.6 1.0 0.5 0.0 0.0 0.8 0.3 0.9 1.5 0.0 0.1 0.40.32–0.33 . . . . . . . . . . . . . . . 2.6 12.0 7.0 2.9 0.3 0.7 1.8 2.3 2.2 1.9 0.4 1.4 1.90.34–0.35 . . . . . . . . . . . . . . . 6.8 30.1 21.9 10.8 5.4 3.9 3.9 4.1 4.2 4.7 2.8 3.6 3.30.36–0.37 . . . . . . . . . . . . . . . 15.6 32.0 38.8 31.5 25.9 13.8 11.0 9.7 11.7 9.9 6.9 10.8 11.30.38–0.39 . . . . . . . . . . . . . . . 17.1 16.5 21.7 34.9 31.4 25.2 14.2 13.7 11.1 12.5 12.9 16.2 16.30.40–0.41 . . . . . . . . . . . . . . . 15.3 3.7 7.2 15.5 25.0 27.7 15.9 12.5 15.9 13.3 17.5 16.9 19.1
See footnotes at end of table.
Series 11, No. 247 [ Page 79

Table 58. Percent distribution of hematocrit as fractions (liter per liter) for persons 1 year and over, by race/ethnicity and age:United States, 1988–94—Con.
Race/ethnicity andselected hematocrit
cutoffs1 year
and over1–2
years3–5
years6–8
years9–11years
12–14years
15–19years
20–29years
30–39years
40–49years
50–59years
60–69years
70 yearsand over
Mexican American—Con.
0.42–0.44 . . . . . . . . . . . . . . . 19.5 1.0 2.0 3.9 10.6 23.2 23.9 21.9 21.5 25.9 33.3 30.6 25.50.45–0.46 . . . . . . . . . . . . . . . 11.1 0.0 0.0 0.0 1.3 3.7 15.6 17.4 15.6 15.7 12.8 8.6 9.80.47–0.48 . . . . . . . . . . . . . . . 7.5 0.0 0.0 0.0 0.0 1.4 8.0 12.6 11.7 9.1 9.3 8.6 7.70.49–0.50 . . . . . . . . . . . . . . . 2.6 0.0 0.0 0.0 0.0 0.3 3.8 4.6 4.0 3.0 1.9 2.2 2.10.51–0.52 . . . . . . . . . . . . . . . 0.4 0.0 0.0 0.0 0.0 0.3 0.4 0.5 0.6 1.0 0.5 0.3 1.20.53–0.54 . . . . . . . . . . . . . . . 0.1 0.0 0.0 0.0 0.0 0.0 0.3 0.2 0.1 0.0 0.2 0.2 0.00.55 and more . . . . . . . . . . . . 0.0 0.0 0.0 0.0 0.0 0.0 0.0 0.0 0.0 0.1 0.0 0.0 0.0
0.0 Quantity more than zero but less than 0.05.1Includes all other race/ethnic groups not listed separately.
NOTE: Numbers may not add to totals because of rounding.
Page 80 [ Series 11, No. 247

Table 59. Percent distribution of hematocrit as fractions (liter per liter) for males 1 year and over, by race/ethnicity and age:United States, 1988–94
Race/ethnicity andselected hematocrit
cutoffs1 year
and over1–2
years3–5
years6–8
years9–11years
12–14years
15–19years
20–29years
30–39years
40–49years
50–59years
60–69years
70 yearsand over
All race/ethnic groups1
Total . . . . . . . . . . . . . . . . . . 100.0 100.0 100.0 100.0 100.0 100.0 100.0 100.0 100.0 100.0 100.0 100.0 100.0
Less than 0.30 . . . . . . . . . . . . 0.1 0.7 0.1 0.1 0.1 0.1 0.0 0.0 0.0 0.0 0.0 0.1 0.60.30–0.31 . . . . . . . . . . . . . . . 0.3 3.5 1.1 0.8 0.0 0.0 0.0 0.0 0.0 0.0 0.2 0.2 1.00.32–0.33 . . . . . . . . . . . . . . . 1.0 16.0 7.6 2.9 0.5 0.2 0.0 0.0 0.0 0.0 0.2 0.2 1.40.34–0.35 . . . . . . . . . . . . . . . 3.0 28.6 26.5 12.0 4.5 1.3 0.0 0.1 0.1 0.6 0.4 0.7 2.20.36–0.37 . . . . . . . . . . . . . . . 6.7 35.1 39.3 30.4 24.5 6.5 1.4 0.5 0.8 1.1 1.9 3.8 5.70.38–0.39 . . . . . . . . . . . . . . . 7.8 12.6 15.5 32.0 29.5 18.1 4.6 0.6 2.5 3.3 5.4 6.7 11.30.40–0.41 . . . . . . . . . . . . . . . 12.2 2.8 8.9 17.3 26.5 20.9 11.6 7.1 10.2 11.1 12.3 15.1 15.70.42–0.44 . . . . . . . . . . . . . . . 33.6 0.5 0.9 4.4 14.1 37.0 38.6 36.6 40.6 41.8 38.9 39.1 35.60.45–0.46 . . . . . . . . . . . . . . . 18.7 0.0 0.0 0.0 0.2 11.0 24.5 25.8 22.6 25.5 23.1 19.0 13.50.47–0.48 . . . . . . . . . . . . . . . 11.1 0.0 0.0 0.0 0.0 4.6 12.5 22.1 14.7 10.5 11.0 9.0 7.70.49–0.50 . . . . . . . . . . . . . . . 4.4 0.0 0.0 0.0 0.0 0.4 4.7 5.5 7.1 5.0 5.9 4.4 3.60.51–0.52 . . . . . . . . . . . . . . . 0.8 0.0 0.0 0.0 0.0 0.0 1.9 1.2 1.0 0.7 0.5 1.0 1.20.53–0.54 . . . . . . . . . . . . . . . 0.2 0.0 0.0 0.0 0.0 0.0 0.1 0.3 0.1 0.4 0.2 0.4 0.00.55 and more . . . . . . . . . . . . 0.1 0.0 0.0 0.0 0.0 0.0 0.0 0.0 0.2 0.0 0.0 0.3 0.3
Non-Hispanic white
Total . . . . . . . . . . . . . . . . . . 100.0 100.0 100.0 100.0 100.0 100.0 100.0 100.0 100.0 100.0 100.0 100.0 100.0
Less than 0.30 . . . . . . . . . . . . 0.0 0.5 0.0 0.0 0.0 0.0 0.0 0.0 0.0 0.0 0.0 0.0 0.40.30–0.31 . . . . . . . . . . . . . . . 0.2 2.4 0.7 0.9 0.0 0.0 0.0 0.0 0.0 0.0 0.2 0.0 0.60.32–0.33 . . . . . . . . . . . . . . . 0.9 17.0 6.8 2.5 0.0 0.0 0.0 0.0 0.0 0.0 0.1 0.2 1.40.34–0.35 . . . . . . . . . . . . . . . 2.6 29.1 26.7 10.7 4.2 1.1 0.0 0.0 0.0 0.6 0.4 0.6 2.10.36–0.37 . . . . . . . . . . . . . . . 5.7 36.1 40.6 28.5 20.7 4.4 0.8 0.6 0.8 0.5 1.5 3.6 4.90.38–0.39 . . . . . . . . . . . . . . . 7.2 12.1 14.3 32.5 30.0 18.1 4.8 0.2 2.2 2.8 4.6 6.8 10.70.40–0.41 . . . . . . . . . . . . . . . 12.0 2.8 9.8 19.9 28.0 21.0 10.1 6.9 10.1 10.4 12.7 13.1 15.40.42–0.44 . . . . . . . . . . . . . . . 34.9 0.0 1.1 5.0 17.0 38.4 40.2 36.1 41.3 42.6 37.6 40.7 37.00.45–0.46 . . . . . . . . . . . . . . . 19.4 0.0 0.0 0.0 0.0 13.0 24.8 25.4 22.8 26.1 24.9 18.7 14.40.47–0.48 . . . . . . . . . . . . . . . 11.5 0.0 0.0 0.0 0.0 3.6 12.6 24.2 14.8 10.7 10.6 9.6 7.70.49–0.50 . . . . . . . . . . . . . . . 4.6 0.0 0.0 0.0 0.0 0.4 5.7 5.3 7.0 5.1 6.5 4.9 3.90.51–0.52 . . . . . . . . . . . . . . . 0.7 0.0 0.0 0.0 0.0 0.0 1.0 1.4 0.7 0.5 0.5 1.0 1.20.53–0.54 . . . . . . . . . . . . . . . 0.2 0.0 0.0 0.0 0.0 0.0 0.0 0.0 0.1 0.6 0.2 0.5 0.00.55 and more . . . . . . . . . . . . 0.1 0.0 0.0 0.0 0.0 0.0 0.0 0.0 0.1 0.0 0.0 0.3 0.2
Non-Hispanic black
Total . . . . . . . . . . . . . . . . . . 100.0 100.0 100.0 100.0 100.0 100.0 100.0 100.0 100.0 100.0 100.0 100.0 100.0
Less than 0.30 . . . . . . . . . . . . 0.4 1.6 0.2 0.3 0.9 0.5 0.0 0.0 0.4 0.0 0.0 0.7 2.70.30–0.31 . . . . . . . . . . . . . . . 0.7 4.2 3.7 1.1 0.0 0.0 0.0 0.0 0.2 0.0 0.5 2.1 1.90.32–0.33 . . . . . . . . . . . . . . . 2.3 20.1 12.8 3.6 3.0 1.3 0.2 0.0 0.2 0.0 0.7 1.4 2.90.34–0.35 . . . . . . . . . . . . . . . 5.4 34.7 27.8 15.7 9.3 4.1 0.0 0.0 0.9 1.4 1.2 2.8 3.90.36–0.37 . . . . . . . . . . . . . . . 11.2 27.8 37.5 36.1 35.3 18.0 3.3 0.7 1.8 3.5 7.8 8.0 10.80.38–0.39 . . . . . . . . . . . . . . . 11.8 9.1 12.6 28.9 30.0 27.4 7.9 3.6 7.5 7.7 11.5 10.6 17.50.40–0.41 . . . . . . . . . . . . . . . 13.5 1.3 5.2 10.2 16.6 21.0 12.7 11.3 12.7 16.6 14.4 23.8 17.80.42–0.44 . . . . . . . . . . . . . . . 31.5 1.2 0.1 3.8 4.9 22.6 41.6 44.1 45.9 41.3 34.1 29.3 30.10.45–0.46 . . . . . . . . . . . . . . . 13.3 0.0 0.0 0.3 0.0 3.6 22.9 22.6 16.1 17.3 15.6 14.3 7.30.47–0.48 . . . . . . . . . . . . . . . 6.8 0.0 0.0 0.0 0.0 1.2 8.4 10.8 11.0 9.8 9.9 4.0 2.90.49–0.50 . . . . . . . . . . . . . . . 2.3 0.0 0.0 0.0 0.0 0.4 2.5 6.3 2.0 1.3 3.3 2.8 1.90.51–0.52 . . . . . . . . . . . . . . . 0.5 0.0 0.0 0.0 0.0 0.0 0.3 0.5 0.9 1.0 0.6 0.2 0.00.53–0.54 . . . . . . . . . . . . . . . 0.1 0.0 0.0 0.0 0.0 0.0 0.2 0.0 0.2 0.0 0.0 0.0 0.30.55 and more . . . . . . . . . . . . 0.0 0.0 0.0 0.0 0.0 0.0 0.0 0.0 0.1 0.0 0.4 0.0 0.0
Mexican American
Total . . . . . . . . . . . . . . . . . . 100.0 100.0 100.0 100.0 100.0 100.0 100.0 100.0 100.0 100.0 100.0 100.0 100.0
Less than 0.30 . . . . . . . . . . . . 0.2 1.0 0.5 0.2 0.0 0.0 0.0 0.0 0.0 0.0 1.3 0.2 1.00.30–0.31 . . . . . . . . . . . . . . . 0.3 4.7 0.6 0.7 0.0 0.0 0.0 0.0 0.0 0.0 0.0 0.0 0.50.32–0.33 . . . . . . . . . . . . . . . 1.2 12.2 6.3 2.6 0.6 0.0 0.0 0.0 0.0 0.3 0.0 0.5 1.40.34–0.35 . . . . . . . . . . . . . . . 3.5 29.7 21.9 7.7 3.3 0.0 0.0 0.2 0.0 0.3 0.0 1.6 1.90.36–0.37 . . . . . . . . . . . . . . . 8.1 29.2 40.0 33.8 23.5 6.1 0.0 0.0 0.0 1.8 0.0 1.3 10.00.38–0.39 . . . . . . . . . . . . . . . 8.6 18.3 20.1 35.8 28.3 20.7 2.5 0.8 1.1 2.1 4.3 5.5 8.30.40–0.41 . . . . . . . . . . . . . . . 10.3 3.5 8.1 13.4 28.7 30.6 7.6 6.2 6.9 6.4 7.7 12.6 16.30.42–0.44 . . . . . . . . . . . . . . . 27.0 1.4 2.4 5.8 13.4 30.8 36.8 30.9 31.3 36.1 40.3 39.0 26.2
See footnotes at end of table.
Series 11, No. 247 [ Page 81
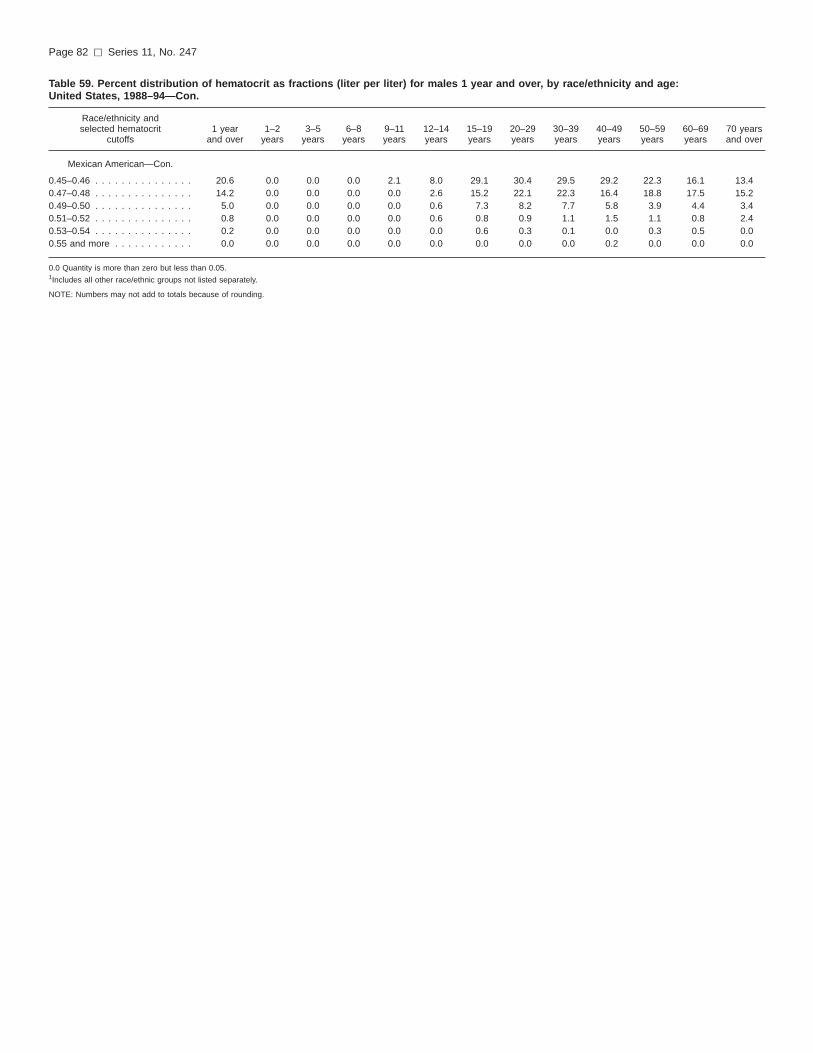
Table 59. Percent distribution of hematocrit as fractions (liter per liter) for males 1 year and over, by race/ethnicity and age:United States, 1988–94—Con.
Race/ethnicity andselected hematocrit
cutoffs1 year
and over1–2
years3–5
years6–8
years9–11years
12–14years
15–19years
20–29years
30–39years
40–49years
50–59years
60–69years
70 yearsand over
Mexican American—Con.
0.45–0.46 . . . . . . . . . . . . . . . 20.6 0.0 0.0 0.0 2.1 8.0 29.1 30.4 29.5 29.2 22.3 16.1 13.40.47–0.48 . . . . . . . . . . . . . . . 14.2 0.0 0.0 0.0 0.0 2.6 15.2 22.1 22.3 16.4 18.8 17.5 15.20.49–0.50 . . . . . . . . . . . . . . . 5.0 0.0 0.0 0.0 0.0 0.6 7.3 8.2 7.7 5.8 3.9 4.4 3.40.51–0.52 . . . . . . . . . . . . . . . 0.8 0.0 0.0 0.0 0.0 0.6 0.8 0.9 1.1 1.5 1.1 0.8 2.40.53–0.54 . . . . . . . . . . . . . . . 0.2 0.0 0.0 0.0 0.0 0.0 0.6 0.3 0.1 0.0 0.3 0.5 0.00.55 and more . . . . . . . . . . . . 0.0 0.0 0.0 0.0 0.0 0.0 0.0 0.0 0.0 0.2 0.0 0.0 0.0
0.0 Quantity is more than zero but less than 0.05.1Includes all other race/ethnic groups not listed separately.
NOTE: Numbers may not add to totals because of rounding.
Page 82 [ Series 11, No. 247

Table 60. Percent distribution of hematocrit as fractions (liter per liter) for females 1 year and over, by race/ethnicity and age:United States, 1988–94
Race/ethnicity andselected hematocrit
cutoffs1 year
and over1–2
years3–5
years6–8
years9–11years
12–14years
15–19years
20–29years
30–39years
40–49years
50–59years
60–69years
70 yearsand over
All race/ethnic groups1
Total . . . . . . . . . . . . . . . . . . 100.0 100.0 100.0 100.0 100.0 100.0 100.0 100.0 100.0 100.0 100.0 100.0 100.0
Less than 0.30 . . . . . . . . . . . . 0.5 0.5 0.3 0.0 0.1 0.0 0.4 0.6 0.4 0.9 0.3 0.6 0.60.30–0.31 . . . . . . . . . . . . . . . 0.7 3.2 1.0 0.0 0.3 0.1 0.7 0.5 1.1 0.9 0.2 0.1 1.20.32–0.33 . . . . . . . . . . . . . . . 2.9 15.4 7.8 4.0 0.7 2.7 2.9 3.2 2.4 2.6 1.4 1.7 2.50.34–0.35 . . . . . . . . . . . . . . . 8.7 36.6 26.6 13.3 7.6 5.5 6.5 9.9 8.1 6.3 5.0 5.6 6.00.36–0.37 . . . . . . . . . . . . . . . 20.3 27.7 36.1 31.8 29.2 18.8 21.3 21.5 17.7 21.3 14.4 15.7 15.30.38–0.39 . . . . . . . . . . . . . . . 28.2 12.7 21.7 36.1 35.2 31.9 29.4 27.8 29.1 28.0 30.5 25.1 25.90.40–0.41 . . . . . . . . . . . . . . . 21.3 3.6 6.0 11.1 19.4 22.5 23.9 21.9 23.7 22.0 23.1 24.9 22.00.42–0.44 . . . . . . . . . . . . . . . 14.8 0.4 0.6 3.7 7.0 18.0 14.0 13.8 15.2 14.7 19.6 21.7 20.70.45–0.46 . . . . . . . . . . . . . . . 2.1 0.0 0.1 0.0 0.5 0.1 0.9 0.7 2.0 2.6 4.5 3.4 4.60.47–0.48 . . . . . . . . . . . . . . . 0.3 0.0 0.0 0.0 0.0 0.4 0.0 0.1 0.1 0.5 0.7 0.6 1.00.49–0.50 . . . . . . . . . . . . . . . 0.1 0.0 0.0 0.0 0.0 0.0 0.0 0.0 0.0 0.2 0.1 0.0 0.20.51–0.52 . . . . . . . . . . . . . . . 0.0 0.0 0.0 0.0 0.0 0.0 0.0 0.0 0.0 0.0 0.2 0.0 0.10.53–0.54 . . . . . . . . . . . . . . . 0.0 0.0 0.0 0.0 0.0 0.0 0.0 0.0 0.0 0.0 0.0 0.2 0.00.55 and more . . . . . . . . . . . . 0.0 0.0 0.0 0.0 0.0 0.0 0.0 0.0 0.0 0.0 0.0 0.3 0.0
Non-Hispanic white
Total . . . . . . . . . . . . . . . . . . 100.0 100.0 100.0 100.0 100.0 100.0 100.0 100.0 100.0 100.0 100.0 100.0 100.0
Less than 0.30 . . . . . . . . . . . . 0.2 0.3 0.3 0.0 0.0 0.0 0.0 0.3 0.1 0.2 0.0 0.6 0.30.30–0.31 . . . . . . . . . . . . . . . 0.4 2.8 0.6 0.0 0.4 0.0 0.2 0.3 0.2 0.3 0.2 0.9 0.00.32–0.33 . . . . . . . . . . . . . . . 2.3 15.3 6.9 4.0 0.2 2.0 1.6 2.5 1.2 2.1 1.3 1.8 2.10.34–0.35 . . . . . . . . . . . . . . . 7.5 39.1 26.6 9.5 6.3 4.1 6.2 9.0 6.9 4.7 4.5 5.2 5.50.36–0.37 . . . . . . . . . . . . . . . 18.3 28.6 36.1 31.9 28.4 16.8 17.9 18.1 14.8 21.3 12.9 15.0 14.90.38–0.39 . . . . . . . . . . . . . . . 28.8 11.3 20.8 40.4 31.9 34.0 30.2 29.0 31.0 27.9 30.2 25.1 26.60.40–0.41 . . . . . . . . . . . . . . . 22.7 2.3 8.5 9.4 23.9 21.7 25.4 23.6 25.3 23.4 23.7 25.3 22.80.42–0.44 . . . . . . . . . . . . . . . 16.8 0.4 0.2 4.8 8.0 20.5 17.1 16.4 17.6 16.3 20.9 22.3 20.60.45–0.46 . . . . . . . . . . . . . . . 2.6 0.0 0.0 0.0 0.8 0.2 1.3 0.7 2.7 3.1 5.2 3.9 5.10.47–0.48 . . . . . . . . . . . . . . . 0.4 0.0 0.0 0.0 0.0 0.0 0.0 0.0 0.2 0.5 0.9 0.4 1.00.49–0.50 . . . . . . . . . . . . . . . 0.1 0.0 0.0 0.0 0.0 0.0 0.0 0.0 0.0 0.2 0.2 0.0 0.20.51–0.52 . . . . . . . . . . . . . . . 0.0 0.0 0.0 0.0 0.0 0.0 0.0 0.0 0.0 0.0 0.2 0.0 0.10.53–0.54 . . . . . . . . . . . . . . . 0.0 0.0 0.0 0.0 0.0 0.0 0.0 0.0 0.0 0.0 0.0 0.3 0.00.55 and more . . . . . . . . . . . . 0.0 0.0 0.0 0.0 0.0 0.0 0.0 0.0 0.0 0.0 0.0 0.2 0.0
Non-Hispanic black
Total . . . . . . . . . . . . . . . . . . 100.0 100.0 100.0 100.0 100.0 100.0 100.0 100.0 100.0 100.0 100.0 100.0 100.0
Less than 0.30 . . . . . . . . . . . . 1.9 0.8 0.4 0.0 0.4 0.0 2.1 2.4 1.9 3.5 1.7 1.0 4.70.30–0.31 . . . . . . . . . . . . . . . 2.1 3.2 2.3 0.0 0.0 0.8 2.8 1.9 3.3 2.8 0.9 1.1 3.70.32–0.33 . . . . . . . . . . . . . . . 6.3 19.6 9.9 5.8 1.1 5.6 7.1 6.9 6.2 6.9 2.9 2.6 7.20.34–0.35 . . . . . . . . . . . . . . . 15.6 32.1 32.9 23.2 16.5 12.8 12.2 14.2 16.5 14.3 8.3 10.1 11.50.36–0.37 . . . . . . . . . . . . . . . 29.5 26.1 32.4 37.2 37.2 33.0 37.3 32.7 27.4 24.3 24.7 23.6 21.20.38–0.39 . . . . . . . . . . . . . . . 24.4 15.5 19.7 27.2 30.3 31.9 22.7 21.4 23.8 24.0 29.8 27.8 22.50.40–0.41 . . . . . . . . . . . . . . . 13.0 2.1 1.8 6.0 11.0 12.8 12.8 13.5 14.1 16.5 17.5 18.0 13.80.42–0.44 . . . . . . . . . . . . . . . 6.4 0.5 0.2 0.6 3.5 3.1 3.0 6.8 6.1 6.0 11.8 14.8 14.30.45–0.46 . . . . . . . . . . . . . . . 0.5 0.0 0.3 0.0 0.0 0.0 0.0 0.4 0.3 1.1 2.1 0.7 0.40.47–0.48 . . . . . . . . . . . . . . . 0.1 0.0 0.0 0.0 0.0 0.0 0.0 0.0 0.0 0.5 0.0 0.3 0.70.49–0.50 . . . . . . . . . . . . . . . 0.0 0.0 0.0 0.0 0.0 0.0 0.0 0.0 0.1 0.2 0.0 0.0 0.00.51–0.52 . . . . . . . . . . . . . . . 0.0 0.0 0.0 0.0 0.0 0.0 0.0 0.0 0.1 0.0 0.2 0.0 0.00.53–0.54 . . . . . . . . . . . . . . . 0.0 0.0 0.0 0.0 0.0 0.0 0.0 0.0 0.0 0.0 0.0 0.0 0.00.55 and more . . . . . . . . . . . . 0.0 0.0 0.0 0.0 0.0 0.0 0.0 0.0 0.0 0.0 0.0 0.0 0.0
Mexican American
Total . . . . . . . . . . . . . . . . . . 100.0 100.0 100.0 100.0 100.0 100.0 100.0 100.0 100.0 100.0 100.0 100.0 100.0
Less than 0.30 . . . . . . . . . . . . 0.8 1.2 0.5 0.0 0.0 0.0 0.7 0.5 1.0 2.6 1.7 0.5 1.80.30–0.31 . . . . . . . . . . . . . . . 1.2 2.5 1.5 0.3 0.0 0.0 1.7 0.7 2.0 3.0 0.0 0.2 0.30.32–0.33 . . . . . . . . . . . . . . . 4.1 11.7 7.6 3.2 0.0 1.2 3.8 5.2 4.6 3.7 0.8 2.2 2.50.34–0.35 . . . . . . . . . . . . . . . 10.4 30.6 21.9 13.8 7.9 7.1 8.2 9.1 8.9 9.4 5.5 5.2 4.60.36–0.37 . . . . . . . . . . . . . . . 23.6 35.1 37.5 29.3 28.7 20.2 23.1 22.0 24.3 18.5 13.5 18.3 12.60.38–0.39 . . . . . . . . . . . . . . . 26.2 14.6 23.3 34.0 35.1 29.0 27.1 30.1 22.0 23.6 21.1 24.6 24.20.40–0.41 . . . . . . . . . . . . . . . 20.6 3.8 6.2 17.4 20.7 25.2 25.0 20.4 25.7 20.6 27.0 20.3 21.90.42–0.44 . . . . . . . . . . . . . . . 11.6 0.5 1.5 2.0 7.4 16.9 9.7 10.6 10.9 15.3 26.7 23.9 24.8
See footnotes at end of table.
Series 11, No. 247 [ Page 83

Table 60. Percent distribution of hematocrit as fractions (liter per liter) for females 1 year and over, by race/ethnicity and age:United States, 1988–94—Con.
Race/ethnicity andselected hematocrit
cutoffs1 year
and over1–2
years3–5
years6–8
years9–11years
12–14years
15–19years
20–29years
30–39years
40–49years
50–59years
60–69years
70 yearsand over
Mexican American—Con.
0.45–0.46 . . . . . . . . . . . . . . . 1.0 0.0 0.0 0.0 0.3 0.0 0.8 0.9 0.4 1.5 3.6 2.7 6.20.47–0.48 . . . . . . . . . . . . . . . 0.4 0.0 0.0 0.0 0.0 0.3 0.0 0.5 0.2 1.4 0.2 1.5 0.40.49–0.50 . . . . . . . . . . . . . . . 0.1 0.0 0.0 0.0 0.0 0.0 0.0 0.0 0.1 0.0 0.0 0.6 0.80.51–0.52 . . . . . . . . . . . . . . . 0.0 0.0 0.0 0.0 0.0 0.0 0.0 0.0 0.0 0.0 0.0 0.0 0.00.53–0.54 . . . . . . . . . . . . . . . 0.0 0.0 0.0 0.0 0.0 0.0 0.0 0.0 0.0 0.0 0.0 0.0 0.00.55 and more . . . . . . . . . . . . 0.0 0.0 0.0 0.0 0.0 0.0 0.0 0.0 0.0 0.0 0.0 0.0 0.0
0.0 Quantity is more than zero but less than 0.05.1Includes all other race/ethnic groups not listed separately.
NOTE: Numbers may not add to totals because of rounding.
Page 84 [ Series 11, No. 247

Table 61. Percent distribution of red blood cell count as 1012 cells per liter for persons 1 year and over, by race/ethnicity and age:United States, 1988–94
Race/ethnicity andselected red bloodcell count cutoffs
1 yearand over
1–2years
3–5years
6–8years
9–11years
12–14years
15–19years
20–29years
30–39years
40–49years
50–59years
60–69years
70 yearsand over
All race/ethnic groups1
Total . . . . . . . . . . . . . . . . . . 100.0 100.0 100.0 100.0 100.0 100.0 100.0 100.0 100.0 100.0 100.0 100.0 100.0
Less than 3.80 . . . . . . . . . . . . 2.0 1.0 0.8 0.7 0.4 0.2 1.6 2.3 1.8 1.6 1.6 2.9 5.33.80–3.99 . . . . . . . . . . . . . . . 3.8 3.0 2.7 2.3 0.9 1.5 2.1 3.9 3.9 5.6 4.2 3.6 6.34.00–4.19 . . . . . . . . . . . . . . . 8.8 12.0 13.7 6.4 4.2 4.2 7.4 9.6 7.6 8.9 7.9 10.8 12.34.20–4.39 . . . . . . . . . . . . . . . 14.3 20.5 22.6 17.4 13.2 10.6 11.4 11.6 14.9 13.1 14.0 16.3 16.14.40–4.59 . . . . . . . . . . . . . . . 16.6 23.6 25.7 24.7 22.7 18.1 16.0 13.2 14.4 14.7 14.9 16.6 19.04.60–4.79 . . . . . . . . . . . . . . . 16.5 20.6 17.9 25.2 25.0 20.6 15.3 11.2 14.1 17.3 19.2 16.2 15.64.80–4.99 . . . . . . . . . . . . . . . 15.5 10.5 10.5 15.7 19.4 17.9 17.3 16.2 15.6 15.0 17.3 15.2 11.35.00–5.19 . . . . . . . . . . . . . . . 10.5 5.3 3.7 6.1 9.4 15.0 10.4 12.5 12.2 11.8 9.8 9.7 7.85.20–5.39 . . . . . . . . . . . . . . . 6.5 1.8 1.3 0.8 3.8 4.9 10.3 9.6 8.6 7.0 6.1 4.2 3.55.40–5.59 . . . . . . . . . . . . . . . 3.2 1.1 0.5 0.5 0.7 4.3 4.1 5.4 3.9 3.5 2.5 2.4 1.55.60–5.79 . . . . . . . . . . . . . . . 1.5 0.4 0.2 0.1 0.4 1.5 2.5 2.7 2.0 0.9 1.4 1.1 0.75.80–5.99 . . . . . . . . . . . . . . . 0.6 0.2 0.0 0.0 0.0 1.0 0.7 1.3 0.7 0.1 0.6 0.4 0.36.00 and more . . . . . . . . . . . . 0.3 0.0 0.4 0.0 0.0 0.3 0.7 0.6 0.2 0.2 0.4 0.5 0.3
Non-Hispanic whiteTotal . . . . . . . . . . . . . . . . . . 100.0 100.0 100.0 100.0 100.0 100.0 100.0 100.0 100.0 100.0 100.0 100.0 100.0
Less than 3.80 . . . . . . . . . . . . 1.8 1.3 0.7 0.5 0.0 0.1 1.3 2.1 1.5 1.2 1.7 2.6 4.63.80–3.99 . . . . . . . . . . . . . . . 3.8 2.9 2.9 2.6 0.9 0.8 1.8 3.7 4.0 5.3 4.0 3.4 6.24.00–4.19 . . . . . . . . . . . . . . . 9.0 13.5 15.7 6.5 3.6 3.7 7.9 10.3 7.4 8.5 7.8 11.1 12.44.20–4.39 . . . . . . . . . . . . . . . 14.5 23.6 24.7 16.9 12.3 10.7 11.8 11.4 14.8 13.6 14.5 16.7 16.14.40–4.59 . . . . . . . . . . . . . . . 16.6 25.3 26.0 26.0 22.3 16.9 16.5 13.3 15.1 14.0 14.6 17.0 19.34.60–4.79 . . . . . . . . . . . . . . . 16.3 20.9 16.8 25.8 25.9 20.9 13.6 10.7 13.6 17.6 19.7 15.6 15.74.80–4.99 . . . . . . . . . . . . . . . 15.9 8.2 9.6 15.3 19.9 19.8 18.2 17.2 16.5 15.4 17.9 15.0 11.65.00–5.19 . . . . . . . . . . . . . . . 10.9 2.9 2.8 5.7 10.4 14.9 11.2 13.0 12.5 12.8 9.8 10.4 7.95.20–5.39 . . . . . . . . . . . . . . . 6.2 0.5 0.7 0.4 4.0 5.1 10.7 8.6 8.5 7.1 6.1 3.8 3.45.40–5.59 . . . . . . . . . . . . . . . 3.2 0.6 0.0 0.3 0.6 4.9 4.2 5.6 3.7 3.7 2.1 2.5 1.55.60–5.79 . . . . . . . . . . . . . . . 1.3 0.1 0.1 0.0 0.2 0.6 2.3 2.6 1.9 0.7 1.3 1.1 0.75.80–5.99 . . . . . . . . . . . . . . . 0.5 0.2 0.0 0.0 0.0 1.4 0.2 1.2 0.5 0.1 0.5 0.4 0.36.00 and more . . . . . . . . . . . . 0.2 0.0 0.0 0.0 0.0 0.2 0.2 0.5 0.1 0.0 0.1 0.4 0.3
Non-Hispanic blackTotal . . . . . . . . . . . . . . . . . . 100.0 100.0 100.0 100.0 100.0 100.0 100.0 100.0 100.0 100.0 100.0 100.0 100.0
Less than 3.80 . . . . . . . . . . . . 3.8 1.1 0.8 1.2 1.3 0.5 2.7 3.9 4.9 4.7 2.2 6.2 12.13.80–3.99 . . . . . . . . . . . . . . . 5.4 3.4 3.3 2.2 1.1 4.0 3.9 6.4 5.8 8.3 6.3 5.2 8.14.00–4.19 . . . . . . . . . . . . . . . 9.4 10.3 13.5 7.6 6.4 7.9 8.5 8.7 9.2 9.3 10.8 11.7 10.84.20–4.39 . . . . . . . . . . . . . . . 14.6 14.8 20.7 14.2 17.3 14.8 12.8 11.4 15.9 14.7 13.9 14.7 15.54.40–4.59 . . . . . . . . . . . . . . . 16.7 23.5 22.9 24.4 24.8 20.9 13.3 14.8 13.2 14.5 16.4 15.1 15.64.60–4.79 . . . . . . . . . . . . . . . 15.9 18.4 17.6 22.7 21.4 20.4 14.1 12.4 15.1 13.2 17.0 17.5 15.44.80–4.99 . . . . . . . . . . . . . . . 12.5 10.7 11.7 16.5 16.6 11.1 16.0 11.5 11.5 12.9 11.3 12.0 9.65.00–5.19 . . . . . . . . . . . . . . . 9.1 10.5 5.5 6.7 6.8 10.1 9.7 11.1 9.7 9.2 9.1 7.6 7.25.20–5.39 . . . . . . . . . . . . . . . 6.4 4.9 2.5 2.3 3.2 5.9 9.0 10.5 7.0 6.0 5.8 4.6 3.15.40–5.59 . . . . . . . . . . . . . . . 3.2 1.5 1.1 1.7 0.7 2.5 4.7 4.2 3.9 4.2 3.4 2.4 1.15.60–5.79 . . . . . . . . . . . . . . . 1.7 1.0 0.1 0.5 0.4 0.9 2.9 2.3 2.4 2.1 1.3 1.5 0.65.80–5.99 . . . . . . . . . . . . . . . 0.7 0.0 0.2 0.0 0.0 0.2 1.3 1.4 0.8 0.3 1.7 0.5 0.26.00 and more . . . . . . . . . . . . 0.8 0.0 0.1 0.0 0.0 0.7 1.1 1.4 0.7 0.7 0.9 1.1 0.8
Mexican AmericanTotal . . . . . . . . . . . . . . . . . . 100.0 100.0 100.0 100.0 100.0 100.0 100.0 100.0 100.0 100.0 100.0 100.0 100.0
Less than 3.80 . . . . . . . . . . . . 1.7 0.3 2.1 1.3 0.3 0.3 1.7 2.2 2.1 1.4 1.3 3.4 2.93.80–3.99 . . . . . . . . . . . . . . . 3.3 2.8 1.8 1.8 0.5 2.3 2.8 3.7 4.7 3.5 3.5 4.5 6.44.00–4.19 . . . . . . . . . . . . . . . 7.3 12.2 11.0 7.3 5.1 6.3 6.6 6.2 8.5 6.8 6.2 7.5 6.04.20–4.39 . . . . . . . . . . . . . . . 12.4 16.8 22.1 20.7 16.1 11.3 8.5 10.2 9.4 10.3 10.3 13.9 17.54.40–4.59 . . . . . . . . . . . . . . . 15.8 17.4 26.9 24.2 21.3 18.4 13.9 11.8 11.6 15.8 11.7 17.6 17.14.60–4.79 . . . . . . . . . . . . . . . 17.4 23.1 19.8 20.9 21.4 18.5 16.3 13.2 16.5 17.3 20.1 18.8 17.34.80–4.99 . . . . . . . . . . . . . . . 15.6 15.9 10.5 16.1 19.3 22.8 12.0 15.6 13.7 16.1 19.8 15.8 13.55.00–5.19 . . . . . . . . . . . . . . . 11.1 6.5 3.5 4.8 8.6 11.0 12.8 14.3 13.3 12.0 12.1 9.1 8.35.20–5.39 . . . . . . . . . . . . . . . 8.5 2.3 1.3 2.2 4.4 6.1 13.5 11.4 11.1 10.7 9.1 4.4 4.35.40–5.59 . . . . . . . . . . . . . . . 4.2 2.1 0.6 0.7 0.8 1.9 5.4 6.7 6.7 3.3 3.2 3.7 4.15.60–5.79 . . . . . . . . . . . . . . . 2.0 0.2 0.2 0.1 1.6 0.9 3.6 3.7 1.0 2.4 2.3 0.8 2.05.80–5.99 . . . . . . . . . . . . . . . 0.6 0.2 0.0 0.0 0.5 0.2 2.1 0.7 0.7 0.6 0.3 0.4 0.66.00 and more . . . . . . . . . . . . 0.3 0.1 0.1 0.0 0.0 0.0 0.8 0.3 0.7 0.0 0.0 0.1 0.1
0.0 Quantity is more than zero but less than 0.05.1Includes all other race/ethnic groups not listed separately.
NOTE: Numbers may not add to totals because of rounding.
Series 11, No. 247 [ Page 85

Table 62. Percent distribution of red blood cell count as 1012 cells per liter for males 1 year and over, by race/ethnicity and age:United States, 1988–94
Race/ethnicity andselected red bloodcell count cutoffs
1 yearand over
1–2years
3–5years
6–8years
9–11years
12–14years
15–19years
20–29years
30–39years
40–49years
50–59years
60–69years
70 yearsand over
All race/ethnic groups1
Total . . . . . . . . . . . . . . . . . . 100.0 100.0 100.0 100.0 100.0 100.0 100.0 100.0 100.0 100.0 100.0 100.0 100.0
Less than 3.80 . . . . . . . . . . . . 0.8 1.1 0.4 0.7 0.2 0.1 0.0 0.0 0.3 0.7 1.3 1.6 4.53.80–3.99 . . . . . . . . . . . . . . . 0.9 2.4 2.3 1.9 0.4 0.3 0.0 0.0 0.1 1.2 0.8 2.5 2.94.00–4.19 . . . . . . . . . . . . . . . 2.6 10.8 13.6 4.9 3.2 1.0 0.1 0.3 0.7 1.4 1.8 3.6 7.24.20–4.39 . . . . . . . . . . . . . . . 6.3 18.3 23.4 14.8 11.5 4.7 3.3 1.4 2.7 2.8 6.3 9.2 11.04.40–4.59 . . . . . . . . . . . . . . . 11.5 24.8 25.7 27.4 19.6 11.9 5.3 5.4 7.7 8.4 8.6 16.7 16.94.60–4.79 . . . . . . . . . . . . . . . 16.3 21.3 16.7 25.6 23.9 21.6 15.6 8.0 13.5 19.1 21.3 14.1 17.24.80–4.99 . . . . . . . . . . . . . . . 21.4 11.7 10.6 16.9 21.8 20.3 23.4 24.0 24.2 22.6 24.2 20.1 14.75.00–5.19 . . . . . . . . . . . . . . . 17.6 6.2 4.4 6.4 12.9 18.8 17.0 22.6 21.8 21.2 15.9 17.0 12.75.20–5.39 . . . . . . . . . . . . . . . 11.9 1.9 1.3 0.9 5.6 8.8 19.3 18.1 16.1 13.3 10.6 7.0 7.15.40–5.59 . . . . . . . . . . . . . . . 6.2 1.0 0.8 0.5 0.6 7.7 8.2 10.9 7.3 6.9 4.8 5.0 3.15.60–5.79 . . . . . . . . . . . . . . . 2.8 0.2 0.0 0.0 0.2 2.4 5.0 5.4 3.8 1.8 2.6 1.9 1.65.80–5.99 . . . . . . . . . . . . . . . 1.1 0.3 0.0 0.0 0.1 1.9 1.5 2.7 1.4 0.2 1.2 0.6 0.56.00 and more . . . . . . . . . . . . 0.6 0.0 0.7 0.0 0.0 0.5 1.4 1.1 0.3 0.5 0.6 0.7 0.7
Non-Hispanic whiteTotal . . . . . . . . . . . . . . . . . . 100.0 100.0 100.0 100.0 100.0 100.0 100.0 100.0 100.0 100.0 100.0 100.0 100.0
Less than 3.80 . . . . . . . . . . . . 0.8 1.4 0.5 0.6 0.0 0.0 0.0 0.0 0.2 0.5 1.5 1.5 4.13.80–3.99 . . . . . . . . . . . . . . . 0.8 2.0 2.8 1.7 0.2 0.0 0.0 0.0 0.0 1.2 0.5 2.4 2.34.00–4.19 . . . . . . . . . . . . . . . 2.3 12.2 14.8 4.3 2.5 0.8 0.0 0.0 0.6 0.7 1.5 3.2 6.74.20–4.39 . . . . . . . . . . . . . . . 6.4 20.0 26.0 14.5 10.1 4.6 3.8 1.3 3.2 2.7 6.5 9.5 11.14.40–4.59 . . . . . . . . . . . . . . . 11.6 28.1 26.5 30.0 20.5 11.5 4.1 5.8 8.1 8.2 7.2 17.7 17.04.60–4.79 . . . . . . . . . . . . . . . 16.1 22.1 15.7 25.4 23.6 21.9 14.4 6.4 13.0 19.6 23.3 13.9 17.44.80–4.99 . . . . . . . . . . . . . . . 22.1 8.7 9.7 16.5 22.3 20.8 25.0 25.8 25.7 22.8 25.3 18.9 15.55.00–5.19 . . . . . . . . . . . . . . . 18.4 3.9 3.7 6.5 14.7 18.9 18.7 24.2 21.8 22.4 16.0 18.4 13.45.20–5.39 . . . . . . . . . . . . . . . 11.6 0.6 0.3 0.6 5.9 9.2 20.2 16.3 15.9 13.5 10.8 6.3 6.85.40–5.59 . . . . . . . . . . . . . . . 6.1 0.5 0.0 0.0 0.2 8.5 8.6 11.5 6.9 7.0 4.0 5.3 3.15.60–5.79 . . . . . . . . . . . . . . . 2.5 0.1 0.0 0.0 0.0 0.6 4.6 5.2 3.6 1.2 2.5 1.8 1.65.80–5.99 . . . . . . . . . . . . . . . 0.9 0.5 0.0 0.0 0.0 2.6 0.3 2.4 1.0 0.2 0.9 0.6 0.46.00 and more . . . . . . . . . . . . 0.3 0.0 0.0 0.0 0.0 0.4 0.5 1.1 0.1 0.0 0.0 0.5 0.6
Non-Hispanic blackTotal . . . . . . . . . . . . . . . . . . 100.0 100.0 100.0 100.0 100.0 100.0 100.0 100.0 100.0 100.0 100.0 100.0 100.0
Less than 3.80 . . . . . . . . . . . . 1.4 1.2 0.5 1.2 1.6 0.5 0.2 0.2 1.3 1.6 1.0 4.8 7.73.80–3.99 . . . . . . . . . . . . . . . 1.7 3.1 2.5 1.7 1.6 2.1 0.1 0.0 1.0 0.9 4.1 4.3 6.14.00–4.19 . . . . . . . . . . . . . . . 4.5 10.4 13.7 8.7 6.2 2.4 0.9 0.9 1.8 4.2 6.0 6.2 9.34.20–4.39 . . . . . . . . . . . . . . . 7.3 15.5 19.1 11.7 17.4 8.8 2.4 2.5 2.4 5.7 6.7 11.2 10.04.40–4.59 . . . . . . . . . . . . . . . 13.1 21.8 22.7 23.7 21.1 18.0 8.3 8.4 8.1 12.0 12.9 12.8 12.24.60–4.79 . . . . . . . . . . . . . . . 16.8 19.4 19.2 22.4 21.6 19.2 13.7 12.4 18.7 14.5 15.8 14.1 22.44.80–4.99 . . . . . . . . . . . . . . . 17.0 11.2 14.2 18.0 16.7 14.0 24.1 17.1 18.0 18.3 14.5 15.5 10.75.00–5.19 . . . . . . . . . . . . . . . 14.4 10.0 4.7 5.9 8.2 17.6 16.0 18.7 18.9 16.0 13.1 12.3 9.85.20–5.39 . . . . . . . . . . . . . . . 11.4 5.3 2.0 3.2 4.7 9.5 14.9 19.9 14.0 11.0 10.9 7.9 6.95.40–5.59 . . . . . . . . . . . . . . . 6.2 1.1 1.2 3.4 0.8 4.3 8.8 8.9 7.7 9.2 7.3 5.2 1.75.60–5.79 . . . . . . . . . . . . . . . 3.3 0.9 0.0 0.0 0.0 1.7 5.8 4.9 4.8 4.6 2.5 2.1 1.55.80–5.99 . . . . . . . . . . . . . . . 1.5 0.0 0.0 0.0 0.0 0.4 2.6 3.0 1.7 0.5 3.4 1.2 0.56.00 and more . . . . . . . . . . . . 1.6 0.0 0.2 0.0 0.0 1.6 2.1 3.0 1.5 1.5 1.8 2.5 1.3
Mexican AmericanTotal . . . . . . . . . . . . . . . . . . 100.0 100.0 100.0 100.0 100.0 100.0 100.0 100.0 100.0 100.0 100.0 100.0 100.0
Less than 3.80 . . . . . . . . . . . . 0.3 0.4 0.8 0.9 0.0 0.0 0.0 0.0 0.2 0.0 1.3 0.5 2.73.80–3.99 . . . . . . . . . . . . . . . 0.6 2.3 1.8 3.0 0.3 0.0 0.0 0.2 0.0 0.4 0.0 1.6 3.34.00–4.19 . . . . . . . . . . . . . . . 2.4 11.6 9.1 4.1 4.6 1.0 0.0 0.4 0.5 2.2 1.9 3.2 4.54.20–4.39 . . . . . . . . . . . . . . . 5.9 18.2 22.9 20.9 10.7 4.1 0.7 0.7 1.0 3.1 3.1 6.9 15.54.40–4.59 . . . . . . . . . . . . . . . 9.0 14.4 27.5 24.3 18.0 11.4 4.0 3.2 4.1 6.0 6.3 12.4 9.84.60–4.79 . . . . . . . . . . . . . . . 15.1 21.7 20.2 20.5 20.2 16.2 13.0 11.5 13.9 13.7 15.7 17.0 17.44.80–4.99 . . . . . . . . . . . . . . . 20.7 17.4 9.7 18.1 26.4 33.0 16.6 20.4 19.3 24.3 24.8 24.1 16.45.00–5.19 . . . . . . . . . . . . . . . 17.9 8.0 4.7 6.7 7.7 16.7 20.1 23.6 23.6 20.0 19.4 17.3 12.25.20–5.39 . . . . . . . . . . . . . . . 14.8 2.0 1.6 0.8 7.2 11.0 23.1 19.8 20.7 18.7 15.8 7.0 5.55.40–5.59 . . . . . . . . . . . . . . . 7.8 3.5 1.0 0.6 1.5 4.1 10.1 12.0 12.2 6.0 6.5 7.3 7.45.60–5.79 . . . . . . . . . . . . . . . 3.7 0.0 0.4 0.1 2.4 2.0 6.8 6.5 1.8 4.6 4.7 1.6 4.05.80–5.99 . . . . . . . . . . . . . . . 1.2 0.4 0.0 0.0 0.9 0.5 4.0 1.2 1.2 1.1 0.5 0.9 1.26.00 and more . . . . . . . . . . . . 0.5 0.0 0.2 0.0 0.0 0.0 1.5 0.6 1.4 0.0 0.0 0.2 0.2
0.0 Quantity is more than zero but less than 0.05.1Includes all other race/ethnic groups not listed separately.
NOTE: Numbers may not add to totals because of rounding.
Page 86 [ Series 11, No. 247

Table 63. Percent distribution of red blood cell count as 1012 cells per liter for females 1 year, and over by race/ethnicity and age:United States, 1988–94
Race/ethnicity andselected red bloodcell count cutoffs
1 yearand over
1–2years
3–5years
6–8years
9–11years
12–14years
15–19years
20–29years
30–39years
40–49years
50–59years
60–69years
70 yearsand over
All race/ethnic groups1
Total . . . . . . . . . . . . . . . . . . 100.0 100.0 100.0 100.0 100.0 100.0 100.0 100.0 100.0 100.0 100.0 100.0 100.0
Less than 3.80 . . . . . . . . . . . . 3.1 0.9 1.1 0.7 0.6 0.3 3.2 4.5 3.4 2.5 2.0 4.0 5.83.80–3.99 . . . . . . . . . . . . . . . 6.6 3.7 3.0 2.9 1.3 2.8 4.2 7.7 7.7 9.9 7.4 4.5 8.64.00–4.19 . . . . . . . . . . . . . . . 14.7 13.3 13.9 8.1 5.2 7.9 14.6 18.9 14.5 16.1 13.7 16.9 15.74.20–4.39 . . . . . . . . . . . . . . . 22.0 22.9 21.8 20.4 14.9 17.2 19.4 21.7 27.1 23.1 21.2 22.5 19.44.40–4.59 . . . . . . . . . . . . . . . 21.5 22.2 25.6 21.7 25.8 25.0 26.4 20.8 21.1 20.7 21.0 16.5 20.54.60–4.79 . . . . . . . . . . . . . . . 16.6 19.8 19.2 24.7 26.1 19.4 15.0 14.4 14.6 15.6 17.2 18.1 14.54.80–4.99 . . . . . . . . . . . . . . . 9.8 9.1 10.3 14.2 17.0 15.2 11.4 8.4 7.2 7.7 10.8 11.0 9.15.00–5.19 . . . . . . . . . . . . . . . 3.8 4.3 3.1 5.7 5.8 10.8 4.0 2.4 2.7 2.8 4.1 3.5 4.55.20–5.39 . . . . . . . . . . . . . . . 1.3 1.8 1.4 0.8 2.0 0.6 1.6 1.2 1.1 1.0 1.9 1.8 1.25.40–5.59 . . . . . . . . . . . . . . . 0.3 1.2 0.2 0.6 0.7 0.5 0.1 0.0 0.5 0.2 0.2 0.1 0.55.60–5.79 . . . . . . . . . . . . . . . 0.2 0.6 0.3 0.2 0.5 0.4 0.0 0.0 0.2 0.1 0.2 0.5 0.15.80–5.99 . . . . . . . . . . . . . . . 0.1 0.0 0.1 0.0 0.0 0.0 0.0 0.0 0.1 0.0 0.1 0.2 0.16.00 and more . . . . . . . . . . . . 0.1 0.0 0.0 0.0 0.0 0.0 0.0 0.0 0.0 0.0 0.2 0.4 0.1
Non-Hispanic whiteTotal . . . . . . . . . . . . . . . . . . 100.0 100.0 100.0 100.0 100.0 100.0 100.0 100.0 100.0 100.0 100.0 100.0 100.0
Less than 3.80 . . . . . . . . . . . . 2.8 1.3 1.0 0.3 0.0 0.2 2.6 4.2 2.8 1.9 1.9 3.6 5.03.80–3.99 . . . . . . . . . . . . . . . 6.6 3.9 3.1 3.7 1.5 1.7 3.6 7.2 8.0 9.5 7.2 4.3 8.84.00–4.19 . . . . . . . . . . . . . . . 15.4 15.0 16.7 9.1 4.6 7.3 15.6 20.1 14.5 16.5 13.6 18.1 16.24.20–4.39 . . . . . . . . . . . . . . . 22.3 27.7 23.2 19.7 14.4 18.1 19.7 21.0 26.6 24.7 22.0 23.0 19.44.40–4.59 . . . . . . . . . . . . . . . 21.4 22.0 25.4 21.2 24.2 23.5 28.8 20.5 22.4 19.9 21.5 16.4 20.74.60–4.79 . . . . . . . . . . . . . . . 16.4 19.7 18.1 26.3 28.1 19.7 12.9 14.8 14.4 15.6 16.4 17.2 14.64.80–4.99 . . . . . . . . . . . . . . . 9.9 7.6 9.5 13.8 17.5 18.4 11.6 8.9 7.0 7.8 11.0 11.5 9.05.00–5.19 . . . . . . . . . . . . . . . 3.6 1.8 1.8 4.8 6.3 9.9 3.8 2.2 3.0 3.0 3.9 3.2 4.35.20–5.39 . . . . . . . . . . . . . . . 1.1 0.3 1.1 0.3 2.2 0.0 1.4 1.1 0.8 0.6 1.7 1.6 1.15.40–5.59 . . . . . . . . . . . . . . . 0.3 0.7 0.0 0.7 0.9 0.5 0.0 0.0 0.3 0.3 0.3 0.0 0.55.60–5.79 . . . . . . . . . . . . . . . 0.2 0.0 0.2 0.0 0.4 0.6 0.0 0.0 0.1 0.1 0.2 0.5 0.15.80–5.99 . . . . . . . . . . . . . . . 0.1 0.0 0.0 0.0 0.0 0.0 0.0 0.0 0.0 0.0 0.1 0.3 0.26.00 and more . . . . . . . . . . . . 0.1 0.0 0.0 0.0 0.0 0.0 0.0 0.0 0.0 0.0 0.2 0.3 0.1
Non-Hispanic blackTotal . . . . . . . . . . . . . . . . . . 100.0 100.0 100.0 100.0 100.0 100.0 100.0 100.0 100.0 100.0 100.0 100.0 100.0
Less than 3.80 . . . . . . . . . . . . 5.8 0.9 1.0 1.3 1.0 0.6 5.3 7.0 7.9 7.2 3.1 7.2 14.93.80–3.99 . . . . . . . . . . . . . . . 8.6 3.7 4.1 2.6 0.6 5.6 7.8 11.8 9.8 14.2 8.0 5.8 9.44.00–4.19 . . . . . . . . . . . . . . . 13.6 10.3 13.3 6.4 6.6 12.8 16.2 15.3 15.4 13.4 14.8 15.7 11.74.20–4.39 . . . . . . . . . . . . . . . 21.0 14.1 22.3 16.7 17.2 20.0 23.5 19.0 27.0 21.9 19.8 17.1 19.04.40–4.59 . . . . . . . . . . . . . . . 19.8 25.1 23.1 25.1 28.4 23.4 18.2 20.1 17.4 16.6 19.3 16.8 17.84.60–4.79 . . . . . . . . . . . . . . . 15.1 17.3 16.0 23.0 21.2 21.4 14.4 12.3 12.0 12.1 17.9 19.8 11.04.80–4.99 . . . . . . . . . . . . . . . 8.6 10.2 9.1 14.9 16.4 8.6 7.8 6.8 6.1 8.5 8.6 9.4 9.05.00–5.19 . . . . . . . . . . . . . . . 4.5 10.9 6.3 7.5 5.4 3.7 3.3 4.6 2.1 3.7 5.8 4.3 5.55.20–5.39 . . . . . . . . . . . . . . . 2.1 4.5 3.0 1.4 1.6 2.7 3.0 2.6 1.2 2.0 1.7 2.3 0.65.40–5.59 . . . . . . . . . . . . . . . 0.5 2.0 1.1 0.0 0.7 1.0 0.5 0.2 0.7 0.2 0.2 0.4 0.75.60–5.79 . . . . . . . . . . . . . . . 0.4 1.0 0.2 1.1 0.9 0.3 0.0 0.2 0.4 0.0 0.4 1.1 0.05.80–5.99 . . . . . . . . . . . . . . . 0.1 0.0 0.4 0.0 0.0 0.0 0.0 0.0 0.0 0.2 0.2 0.0 0.06.00 and more . . . . . . . . . . . . 0.0 0.0 0.0 0.0 0.0 0.0 0.0 0.0 0.0 0.0 0.2 0.0 0.4
Mexican AmericanTotal . . . . . . . . . . . . . . . . . . 100.0 100.0 100.0 100.0 100.0 100.0 100.0 100.0 100.0 100.0 100.0 100.0 100.0
Less than 3.80 . . . . . . . . . . . . 3.2 0.2 3.3 1.7 0.7 0.5 3.5 5.1 4.2 2.8 1.4 5.6 3.03.80–3.99 . . . . . . . . . . . . . . . 6.1 3.3 1.9 0.6 0.8 4.2 5.8 8.2 9.7 6.8 6.9 6.8 9.54.00–4.19 . . . . . . . . . . . . . . . 12.5 12.8 12.8 10.3 5.6 10.8 13.9 13.5 17.1 11.6 10.3 10.9 7.54.20–4.39 . . . . . . . . . . . . . . . 19.4 15.2 21.3 20.5 22.3 17.3 17.1 22.2 18.6 17.9 17.2 19.4 19.54.40–4.59 . . . . . . . . . . . . . . . 23.0 20.8 26.4 24.2 25.2 24.4 24.6 22.7 19.8 26.1 17.0 21.6 24.34.60–4.79 . . . . . . . . . . . . . . . 19.7 24.7 19.4 21.2 22.8 20.5 20.0 15.4 19.4 21.0 24.4 20.2 17.24.80–4.99 . . . . . . . . . . . . . . . 10.1 14.3 11.2 14.2 11.1 14.2 6.9 9.6 7.5 7.5 14.9 9.4 10.65.00–5.19 . . . . . . . . . . . . . . . 3.8 4.8 2.3 3.1 9.7 6.1 4.9 2.5 2.1 3.5 5.1 2.6 4.65.20–5.39 . . . . . . . . . . . . . . . 1.7 2.6 1.0 3.5 1.0 1.9 3.1 0.7 0.7 2.3 2.7 2.3 3.05.40–5.59 . . . . . . . . . . . . . . . 0.3 0.6 0.2 0.7 0.0 0.0 0.2 0.0 0.7 0.5 0.0 1.0 0.85.60–5.79 . . . . . . . . . . . . . . . 0.1 0.5 0.1 0.0 0.8 0.0 0.0 0.0 0.1 0.2 0.0 0.3 0.05.80–5.99 . . . . . . . . . . . . . . . 0.0 0.0 0.1 0.0 0.0 0.0 0.0 0.0 0.1 0.0 0.0 0.0 0.06.00 and more . . . . . . . . . . . . 0.0 0.3 0.0 0.0 0.0 0.0 0.0 0.0 0.0 0.0 0.0 0.0 0.0
0.0 Quantity is more than zero but less than 0.05.1Includes all other race/ethnic groups not listed separately.
NOTE: Numbers may not add to totals because of rounding.
Series 11, No. 247 [ Page 87

Table 64. Percent distribution of mean cell volume in femtoliter for persons 1 year and over, by race/ethnicity and age: United States,1988–94
Race/ethnicity andselected red
cell volume cutoffs1 year
and over1–2
years3–5
years6–8
years9–11years
12–14years
15–19years
20–29years
30–39years
40–49years
50–59years
60–69years
70 yearsand over
All race/ethnic groups1
Total . . . . . . . . . . . . . . . . . . 100.0 100.0 100.0 100.0 100.0 100.0 100.0 100.0 100.0 100.0 100.0 100.0 100.0
Less than 65.0 . . . . . . . . . . . . 0.2 1.4 0.9 0.1 0.1 0.0 0.1 0.0 0.3 0.1 0.0 0.2 0.265.0–69.9 . . . . . . . . . . . . . . . 0.4 2.0 0.7 0.6 0.5 0.5 0.1 0.2 0.4 0.5 0.3 0.2 0.070.0–74.9 . . . . . . . . . . . . . . . 1.1 10.4 2.5 1.9 1.8 0.7 0.6 0.5 0.7 0.9 0.5 0.6 0.675.0–79.9 . . . . . . . . . . . . . . . 4.0 33.8 18.7 11.8 8.3 6.6 2.5 1.4 1.6 1.8 1.5 1.2 1.180.0–84.9 . . . . . . . . . . . . . . . 16.9 44.6 55.2 50.4 50.0 30.5 18.8 11.7 10.1 8.3 7.6 7.2 6.585.0–89.9 . . . . . . . . . . . . . . . 36.1 6.8 19.2 32.0 34.1 48.5 43.1 45.9 36.9 35.4 35.4 30.8 29.690.0–94.9 . . . . . . . . . . . . . . . 30.9 0.4 1.4 2.1 4.6 11.2 29.1 32.8 39.8 37.8 38.9 41.4 40.495.0–99.9 . . . . . . . . . . . . . . . 8.3 0.0 0.1 0.0 0.1 0.9 4.3 5.9 8.3 13.1 12.3 14.7 16.7100.0–104.9 . . . . . . . . . . . . . 1.1 0.0 0.0 0.0 0.0 0.1 0.2 0.7 0.7 1.4 2.2 2.7 3.1105.0 and more . . . . . . . . . . . 0.2 0.0 0.0 0.0 0.0 0.0 0.1 0.0 0.2 0.3 0.5 0.5 0.6
Non-Hispanic white
Total . . . . . . . . . . . . . . . . . . 100.0 100.0 100.0 100.0 100.0 100.0 100.0 100.0 100.0 100.0 100.0 100.0 100.0
Less than 65.0 . . . . . . . . . . . . 0.1 0.2 0.0 0.1 0.0 0.0 0.0 0.0 0.1 0.0 0.0 0.2 0.265.0–69.9 . . . . . . . . . . . . . . . 0.1 1.1 0.0 0.0 0.2 0.3 0.0 0.1 0.1 0.2 0.0 0.2 0.070.0–74.9 . . . . . . . . . . . . . . . 0.4 7.6 0.4 1.1 1.1 0.0 0.0 0.0 0.1 0.4 0.2 0.4 0.575.0–79.9 . . . . . . . . . . . . . . . 2.7 33.3 15.1 8.8 6.4 6.5 1.0 0.6 0.9 0.9 1.1 0.8 0.880.0–84.9 . . . . . . . . . . . . . . . 14.5 49.0 60.5 53.2 52.9 28.1 15.5 8.8 7.4 6.4 6.0 6.0 5.485.0–89.9 . . . . . . . . . . . . . . . 37.0 8.1 21.5 33.5 34.5 52.2 45.5 48.3 37.8 36.0 35.3 30.2 29.390.0–94.9 . . . . . . . . . . . . . . . 33.6 0.2 1.7 2.3 4.7 11.3 31.8 34.2 43.1 40.9 40.1 42.7 41.695.0–99.9 . . . . . . . . . . . . . . . 9.2 0.0 0.1 0.0 0.0 0.7 4.5 6.3 8.6 13.1 13.3 15.8 17.3100.0–104.9 . . . . . . . . . . . . . 1.3 0.0 0.0 0.0 0.0 0.1 0.2 0.8 0.7 1.4 2.7 2.8 3.1105.0 and more . . . . . . . . . . . 0.3 0.0 0.0 0.0 0.0 0.0 0.1 0.0 0.3 0.3 0.4 0.6 0.7
Non-Hispanic black
Total . . . . . . . . . . . . . . . . . . 100.0 100.0 100.0 100.0 100.0 100.0 100.0 100.0 100.0 100.0 100.0 100.0 100.0
Less than 65.0 . . . . . . . . . . . . 0.4 3.2 1.4 0.3 0.0 0.2 0.6 0.3 0.2 0.5 0.1 0.0 0.265.0–69.9 . . . . . . . . . . . . . . . 1.4 5.5 3.9 2.7 1.4 1.6 0.1 0.9 1.4 1.3 0.9 0.3 0.270.0–74.9 . . . . . . . . . . . . . . . 4.0 19.4 6.8 4.4 4.2 4.8 3.5 2.4 3.4 3.6 2.2 2.9 2.975.0–79.9 . . . . . . . . . . . . . . . 10.4 34.7 27.9 26.8 18.4 11.0 8.7 6.2 6.3 5.9 4.1 5.5 4.980.0–84.9 . . . . . . . . . . . . . . . 25.5 29.6 41.8 39.3 42.9 37.7 26.1 23.2 20.2 19.0 19.1 16.8 18.085.0–89.9 . . . . . . . . . . . . . . . 30.5 5.8 16.4 23.5 28.5 31.8 37.3 36.2 31.1 29.7 31.9 33.9 32.490.0–94.9 . . . . . . . . . . . . . . . 20.3 0.6 0.8 2.3 3.5 10.9 19.6 23.9 27.9 25.7 29.8 29.7 28.595.0–99.9 . . . . . . . . . . . . . . . 5.7 0.0 0.0 0.0 0.4 1.8 3.0 4.9 7.2 12.1 9.8 8.4 8.9100.0–104.9 . . . . . . . . . . . . . 0.8 0.0 0.0 0.0 0.0 0.0 0.3 0.8 1.2 1.4 0.4 1.5 2.4105.0 and more . . . . . . . . . . . 0.1 0.0 0.0 0.0 0.0 0.0 0.0 0.1 0.1 0.4 0.3 0.5 0.2
Mexican American
Total . . . . . . . . . . . . . . . . . . 100.0 100.0 100.0 100.0 100.0 100.0 100.0 100.0 100.0 100.0 100.0 100.0 100.0
Less than 65.0 . . . . . . . . . . . . 0.4 3.7 0.1 0.0 0.8 0.0 0.2 0.1 0.2 1.1 0.0 0.0 0.565.0–69.9 . . . . . . . . . . . . . . . 0.5 2.3 0.5 0.4 0.2 0.2 0.5 0.2 0.9 1.1 0.2 0.2 0.270.0–74.9 . . . . . . . . . . . . . . . 1.4 8.5 2.3 1.1 1.3 0.1 1.0 0.9 1.0 1.5 1.2 0.3 0.675.0–79.9 . . . . . . . . . . . . . . . 5.6 33.8 17.5 8.6 9.6 5.7 4.7 1.3 2.0 2.5 1.7 1.6 1.580.0–84.9 . . . . . . . . . . . . . . . 21.6 43.9 53.7 48.3 39.8 31.7 19.8 12.1 11.6 11.4 9.4 7.9 6.785.0–89.9 . . . . . . . . . . . . . . . 36.9 5.9 22.6 37.3 39.6 42.7 41.1 41.9 37.2 39.1 39.5 32.7 33.690.0–94.9 . . . . . . . . . . . . . . . 26.6 0.5 1.8 2.8 6.7 16.7 28.4 36.2 37.3 30.0 39.7 42.2 42.695.0–99.9 . . . . . . . . . . . . . . . 5.4 0.0 0.0 0.0 0.0 1.7 3.7 6.0 7.6 11.4 7.1 12.6 12.7100.0–104.9 . . . . . . . . . . . . . 0.4 0.0 0.0 0.0 0.0 0.4 0.1 0.2 0.4 0.8 1.0 1.7 1.1105.0 and more . . . . . . . . . . . 0.1 0.0 0.2 0.0 0.0 0.0 0.0 0.1 0.1 0.0 0.0 0.2 0.0
0.0 Quantity more than zero but less than 0.05.1Includes all other race/ethnic groups not listed separately.
NOTE: Numbers may not add to totals because of rounding.
Page 88 [ Series 11, No. 247

Table 65. Percent distribution of mean cell volume in femtoliter for males 1 year and over, by race/ethnicity and age: United States, 1988–94
Race/ethnicity andselected red
cell volume cutoffs1 year
and over1–2
years3–5
years6–8
years9–11years
12–14years
15–19years
20–29years
30–39years
40–49years
50–59years
60–69years
70 yearsand over
All race/ethnic groups1
Total . . . . . . . . . . . . . . . . . . 100.0 100.0 100.0 100.0 100.0 100.0 100.0 100.0 100.0 100.0 100.0 100.0 100.0
Less than 65.0 . . . . . . . . . . . . 0.1 1.3 1.4 0.2 0.1 0.0 0.0 0.0 0.0 0.0 0.0 0.0 0.465.0–69.9 . . . . . . . . . . . . . . . 0.3 2.6 0.5 0.8 0.4 0.7 0.0 0.0 0.1 0.0 0.5 0.3 0.070.0–74.9 . . . . . . . . . . . . . . . 1.0 11.7 2.6 2.1 2.2 0.8 0.3 0.3 0.4 0.7 0.2 0.4 1.075.0–79.9 . . . . . . . . . . . . . . . 3.8 35.1 19.3 12.1 8.2 7.6 1.5 0.9 1.0 1.0 0.7 0.8 1.280.0–84.9 . . . . . . . . . . . . . . . 17.1 42.9 57.5 50.5 53.1 34.1 17.1 11.9 10.2 5.7 5.9 6.9 5.285.0–89.9 . . . . . . . . . . . . . . . 37.0 5.4 16.3 31.1 30.6 46.6 45.5 50.3 40.7 36.9 35.4 28.1 25.090.0–94.9 . . . . . . . . . . . . . . . 30.0 0.0 1.4 1.9 4.2 8.3 30.6 29.6 38.5 41.6 40.0 39.3 40.295.0–99.9 . . . . . . . . . . . . . . . 8.4 0.0 0.1 0.0 0.1 0.3 3.4 5.8 7.3 11.8 13.6 20.1 21.0100.0–104.9 . . . . . . . . . . . . . 1.1 0.0 0.0 0.0 0.0 0.0 0.4 0.5 0.8 1.4 2.1 2.9 3.7105.0 and more . . . . . . . . . . . 0.3 0.0 0.0 0.0 0.0 0.0 0.2 0.0 0.1 0.5 0.6 0.6 1.3
Non-Hispanic white
Total . . . . . . . . . . . . . . . . . . 100.0 100.0 100.0 100.0 100.0 100.0 100.0 100.0 100.0 100.0 100.0 100.0 100.0
Less than 65.0 . . . . . . . . . . . . 0.1 0.5 0.0 0.3 0.0 0.0 0.0 0.0 0.0 0.0 0.0 0.0 0.465.0–69.9 . . . . . . . . . . . . . . . 0.1 1.8 0.0 0.0 0.0 0.5 0.0 0.0 0.0 0.0 0.0 0.3 0.070.0–74.9 . . . . . . . . . . . . . . . 0.5 9.0 0.2 1.2 1.3 0.0 0.0 0.0 0.0 0.5 0.0 0.2 0.975.0–79.9 . . . . . . . . . . . . . . . 2.6 33.7 15.6 9.8 6.7 7.5 0.0 0.3 0.4 0.4 0.4 0.6 0.880.0–84.9 . . . . . . . . . . . . . . . 15.5 48.5 63.6 53.6 58.6 32.4 15.0 10.2 8.7 4.1 4.9 6.2 4.685.0–89.9 . . . . . . . . . . . . . . . 38.1 5.7 18.2 31.9 28.7 50.8 48.1 54.0 43.0 37.4 34.5 27.5 24.690.0–94.9 . . . . . . . . . . . . . . . 31.8 0.0 1.7 2.1 4.2 7.7 32.3 28.5 39.3 44.5 41.5 39.9 41.195.0–99.9 . . . . . . . . . . . . . . . 9.1 0.0 0.2 0.0 0.0 0.0 2.6 5.9 6.9 11.2 14.4 21.5 21.7100.0–104.9 . . . . . . . . . . . . . 1.2 0.0 0.0 0.0 0.0 0.0 0.5 0.5 0.7 1.3 2.5 2.7 3.4105.0 and more . . . . . . . . . . . 0.4 0.0 0.0 0.0 0.0 0.0 0.2 0.0 0.2 0.5 0.6 0.7 1.5
Non-Hispanic black
Total . . . . . . . . . . . . . . . . . . 100.0 100.0 100.0 100.0 100.0 100.0 100.0 100.0 100.0 100.0 100.0 100.0 100.0
Less than 65.0 . . . . . . . . . . . . 0.3 2.7 2.1 0.3 0.0 0.0 0.1 0.0 0.0 0.0 0.0 0.0 0.565.0–69.9 . . . . . . . . . . . . . . . 1.2 6.4 3.2 3.5 1.7 1.8 0.0 0.3 0.9 0.5 0.4 0.8 0.070.0–74.9 . . . . . . . . . . . . . . . 4.1 20.9 7.6 3.8 5.3 5.8 1.9 2.1 3.2 3.4 2.4 3.2 3.075.0–79.9 . . . . . . . . . . . . . . . 9.9 36.4 30.7 23.7 15.8 12.7 7.2 5.4 5.5 3.2 4.0 4.0 5.280.0–84.9 . . . . . . . . . . . . . . . 23.5 24.8 40.1 37.1 42.9 40.9 22.8 18.7 19.6 17.5 12.6 15.2 13.285.0–89.9 . . . . . . . . . . . . . . . 31.5 7.2 14.4 27.5 29.8 24.9 42.4 39.4 29.8 31.7 35.8 32.8 33.490.0–94.9 . . . . . . . . . . . . . . . 20.9 0.0 0.6 2.7 3.6 12.0 20.8 26.3 31.0 25.7 29.7 27.2 30.495.0–99.9 . . . . . . . . . . . . . . . 6.2 0.0 0.0 0.0 0.6 1.2 3.8 5.0 6.8 14.6 11.7 12.4 11.6100.0–104.9 . . . . . . . . . . . . . 1.1 0.0 0.0 0.0 0.0 0.0 0.3 1.0 2.0 2.3 0.9 3.1 1.6105.0 and more . . . . . . . . . . . 0.2 0.0 0.0 0.0 0.0 0.0 0.0 0.2 0.0 0.9 0.5 0.7 0.0
Mexican American
Total . . . . . . . . . . . . . . . . . . 100.0 100.0 100.0 100.0 100.0 100.0 100.0 100.0 100.0 100.0 100.0 100.0 100.0
Less than 65.0 . . . . . . . . . . . . 0.3 4.7 0.2 0.0 1.5 0.0 0.0 0.0 0.0 0.3 0.0 0.0 0.065.0–69.9 . . . . . . . . . . . . . . . 0.2 2.4 0.3 0.0 0.0 0.5 0.2 0.0 0.0 0.0 0.0 0.2 0.070.0–74.9 . . . . . . . . . . . . . . . 1.0 9.9 2.5 0.7 1.6 0.3 0.0 0.3 0.8 0.6 0.0 0.4 0.075.0–79.9 . . . . . . . . . . . . . . . 5.8 36.5 20.5 10.9 13.2 7.1 3.9 0.6 1.2 0.4 2.3 1.0 3.080.0–84.9 . . . . . . . . . . . . . . . 20.5 39.6 53.9 46.4 39.5 41.0 19.2 10.9 8.7 9.0 9.6 8.2 6.785.0–89.9 . . . . . . . . . . . . . . . 36.0 5.4 19.0 37.5 33.9 36.3 41.3 42.8 38.5 38.4 37.8 27.1 29.590.0–94.9 . . . . . . . . . . . . . . . 28.0 0.4 2.4 2.1 6.6 11.5 30.3 38.5 38.2 36.0 39.3 41.5 45.895.0–99.9 . . . . . . . . . . . . . . . 6.4 0.0 0.0 0.0 0.0 2.4 4.3 6.0 9.9 13.7 8.9 17.7 12.7100.0–104.9 . . . . . . . . . . . . . 0.4 0.0 0.0 0.0 0.0 0.0 0.0 0.3 0.4 1.0 1.3 2.2 1.9105.0 and more . . . . . . . . . . . 0.1 0.0 0.0 0.0 0.0 0.0 0.0 0.0 0.2 0.0 0.0 0.5 0.0
0.0 Quantity is more than zero but less than 0.05.1Includes all other race/ethnic groups not listed separately.
NOTE: Numbers may not add to totals because of rounding.
Series 11, No. 247 [ Page 89

Table 66. Percent distribution of mean cell volume in femtoliter for females 1 year and over, by race/ethnicity and age: United States,1988–94
Race/ethnicity andselected red
cell volume cutoffs1 year
and over1–2
years3–5
years6–8
years9–11years
12–14years
15–19years
20–29years
30–39years
40–49years
50–59years
60–69years
70 yearsand over
All race/ethnic groups1
Total . . . . . . . . . . . . . . . . . . 100.0 100.0 100.0 100.0 100.0 100.0 100.0 100.0 100.0 100.0 100.0 100.0 100.0
Less than 65.0 . . . . . . . . . . . . 0.2 1.6 0.3 0.0 0.0 0.0 0.2 0.1 0.6 0.2 0.0 0.3 0.165.0–69.9 . . . . . . . . . . . . . . . 0.4 1.3 0.9 0.4 0.5 0.2 0.1 0.3 0.6 1.0 0.2 0.1 0.070.0–74.9 . . . . . . . . . . . . . . . 1.1 8.9 2.4 1.7 1.4 0.6 0.9 0.7 1.1 1.0 0.8 0.7 0.475.0–79.9 . . . . . . . . . . . . . . . 4.2 32.5 18.0 11.5 8.5 5.5 3.5 1.8 2.3 2.6 2.1 1.5 1.180.0–84.9 . . . . . . . . . . . . . . . 16.8 46.4 52.6 50.3 46.8 26.6 20.5 11.5 10.1 10.8 9.2 7.5 7.485.0–89.9 . . . . . . . . . . . . . . . 35.2 8.3 22.3 33.2 37.5 50.6 40.9 41.6 33.0 33.9 35.5 33.1 32.690.0–94.9 . . . . . . . . . . . . . . . 31.7 0.8 1.5 2.3 5.0 14.3 27.6 35.9 41.0 34.1 37.9 43.2 40.595.0–99.9 . . . . . . . . . . . . . . . 8.2 0.0 0.0 0.0 0.0 1.5 5.2 6.0 9.3 14.3 11.1 10.1 13.8100.0–104.9 . . . . . . . . . . . . . 1.1 0.0 0.0 0.0 0.0 0.2 0.1 0.8 0.6 1.3 2.3 2.6 2.8105.0 and more . . . . . . . . . . . 0.1 0.0 0.0 0.0 0.0 0.0 0.0 0.0 0.3 0.0 0.4 0.4 0.2
Non-Hispanic white
Total . . . . . . . . . . . . . . . . . . 100.0 100.0 100.0 100.0 100.0 100.0 100.0 100.0 100.0 100.0 100.0 100.0 100.0
Less than 65.0 . . . . . . . . . . . . 0.1 0.0 0.0 0.0 0.0 0.0 0.0 0.0 0.2 0.0 0.0 0.4 0.165.0–69.9 . . . . . . . . . . . . . . . 0.1 0.3 0.0 0.0 0.4 0.0 0.0 0.1 0.3 0.4 0.0 0.0 0.070.0–74.9 . . . . . . . . . . . . . . . 0.4 6.1 0.6 1.0 1.0 0.0 0.0 0.0 0.2 0.4 0.4 0.6 0.275.0–79.9 . . . . . . . . . . . . . . . 2.8 32.8 14.4 7.6 6.1 5.4 2.0 1.0 1.4 1.5 1.8 1.0 0.880.0–84.9 . . . . . . . . . . . . . . . 13.5 49.7 57.1 52.7 47.3 22.8 16.1 7.4 6.0 8.7 7.1 5.9 5.985.0–89.9 . . . . . . . . . . . . . . . 35.9 10.8 25.2 35.5 40.2 53.8 43.0 42.9 32.5 34.5 36.0 32.5 32.490.0–94.9 . . . . . . . . . . . . . . . 35.4 0.3 1.8 2.5 5.1 15.7 31.4 39.6 47.0 37.2 38.7 45.1 41.995.0–99.9 . . . . . . . . . . . . . . . 9.3 0.0 0.0 0.0 0.0 1.6 6.4 6.6 10.3 15.0 12.2 10.8 14.4100.0–104.9 . . . . . . . . . . . . . 1.4 0.0 0.0 0.0 0.0 0.2 0.0 1.1 0.8 1.6 2.8 2.9 2.9105.0 and more . . . . . . . . . . . 0.2 0.0 0.0 0.0 0.0 0.0 0.0 0.0 0.4 0.0 0.3 0.5 0.2
Non-Hispanic black
Total . . . . . . . . . . . . . . . . . . 100.0 100.0 100.0 100.0 100.0 100.0 100.0 100.0 100.0 100.0 100.0 100.0 100.0
Less than 65.0 . . . . . . . . . . . . 0.6 3.7 0.8 0.3 0.0 0.3 1.0 0.6 0.4 0.9 0.2 0.0 0.065.0–69.9 . . . . . . . . . . . . . . . 1.6 4.6 4.6 1.8 1.2 1.5 0.3 1.3 1.8 2.0 1.3 0.0 0.370.0–74.9 . . . . . . . . . . . . . . . 4.0 17.8 5.9 5.0 3.1 4.0 5.1 2.7 3.5 3.8 2.1 2.7 2.975.0–79.9 . . . . . . . . . . . . . . . 10.8 33.0 25.1 29.8 21.0 9.5 10.2 6.9 7.0 8.1 4.2 6.5 4.780.0–84.9 . . . . . . . . . . . . . . . 27.2 34.3 43.4 41.5 43.0 34.9 29.5 27.0 20.7 20.2 24.3 17.9 21.185.0–89.9 . . . . . . . . . . . . . . . 29.6 4.4 18.5 19.6 27.2 37.8 32.1 33.5 32.1 28.1 28.8 34.6 31.890.0–94.9 . . . . . . . . . . . . . . . 19.9 1.2 1.1 1.9 3.5 9.9 18.5 21.8 25.4 25.6 29.9 31.4 27.395.0–99.9 . . . . . . . . . . . . . . . 5.2 0.0 0.0 0.0 0.2 2.3 2.1 4.8 7.5 10.1 8.3 5.6 7.2100.0–104.9 . . . . . . . . . . . . . 0.5 0.0 0.0 0.0 0.0 0.0 0.2 0.6 0.5 0.6 0.0 0.3 2.8105.0 and more . . . . . . . . . . . 0.1 0.0 0.0 0.0 0.0 0.0 0.0 0.0 0.2 0.0 0.2 0.4 0.3
Mexican American
Total . . . . . . . . . . . . . . . . . . 100.0 100.0 100.0 100.0 100.0 100.0 100.0 100.0 100.0 100.0 100.0 100.0 100.0
Less than 65.0 . . . . . . . . . . . . 0.5 2.7 0.1 0.0 0.0 0.0 0.4 0.2 0.5 2.0 0.0 0.0 1.065.0–69.9 . . . . . . . . . . . . . . . 0.9 2.2 0.7 0.7 0.3 0.0 0.8 0.4 1.9 2.2 0.3 0.3 0.370.0–74.9 . . . . . . . . . . . . . . . 1.7 7.0 2.2 1.6 0.8 0.0 2.1 1.5 1.3 2.5 2.3 0.2 1.175.0–79.9 . . . . . . . . . . . . . . . 5.5 30.9 14.5 6.5 5.4 4.4 5.7 2.3 2.9 4.7 1.2 2.0 0.080.0–84.9 . . . . . . . . . . . . . . . 22.7 48.6 53.5 50.2 40.1 23.8 20.4 13.7 14.7 13.9 9.1 7.6 6.885.0–89.9 . . . . . . . . . . . . . . . 37.8 6.4 26.2 37.1 46.3 48.2 40.8 40.8 35.8 39.8 41.0 37.1 37.690.0–94.9 . . . . . . . . . . . . . . . 25.1 0.6 1.3 3.6 6.9 21.1 26.3 33.3 36.4 23.7 40.1 42.8 39.495.0–99.9 . . . . . . . . . . . . . . . 4.4 0.0 0.1 0.0 0.0 1.1 3.1 6.1 5.2 9.0 5.3 8.6 12.7100.0–104.9 . . . . . . . . . . . . . 0.3 0.0 0.0 0.0 0.0 0.8 0.3 0.1 0.4 0.5 0.7 1.4 0.3105.0 and more . . . . . . . . . . . 0.1 0.0 0.4 0.0 0.0 0.0 0.0 0.2 0.0 0.0 0.0 0.0 0.0
0.0 Quantity is more than zero but less than 0.05.1Includes all other race/ethnic groups not listed separately.
NOTE: Numbers may not add to totals because of rounding.
Page 90 [ Series 11, No. 247

Table 67. Percent distribution of mean cell hemoglobin in picogram for persons 1 year and over, by race/ethnicity and age:United States, 1988–94
Race/ethnicity andselected mean
cell hemoglobin cutoffs1 year
and over1–2
years3–5
years6–8
years9–11years
12–14years
15–19years
20–29years
30–39years
40–49years
50–59years
60–69years
70 yearsand over
All race/ethnic groups1
Total . . . . . . . . . . . . . . . . . . 100.0 100.0 100.0 100.0 100.0 100.0 100.0 100.0 100.0 100.0 100.0 100.0 100.0
Less than 22.0 . . . . . . . . . . . . 0.5 2.1 1.3 0.5 0.3 0.4 0.1 0.2 0.6 0.6 0.3 0.3 0.222.0–23.9 . . . . . . . . . . . . . . . 0.8 5.0 1.8 0.8 1.0 0.5 0.4 0.5 0.7 1.0 0.5 0.5 0.324.0–25.9 . . . . . . . . . . . . . . . 2.3 19.1 8.1 6.0 4.1 3.5 2.1 1.0 1.2 0.9 1.2 1.0 1.326.0–27.9 . . . . . . . . . . . . . . . 11.1 51.6 45.1 31.6 27.2 18.4 10.2 6.0 5.9 5.8 4.5 4.5 4.528.0–29.9 . . . . . . . . . . . . . . . 32.3 19.5 39.0 51.5 54.1 47.7 39.9 35.7 28.3 25.1 24.9 26.1 26.030.0–31.9 . . . . . . . . . . . . . . . 37.6 0.8 3.1 7.2 9.3 25.9 37.7 43.3 46.2 44.6 45.9 44.9 43.832.0–33.9 . . . . . . . . . . . . . . . 11.4 0.1 0.1 0.3 0.7 1.2 6.4 10.3 12.6 17.0 17.4 17.7 18.234.0 and more . . . . . . . . . . . . 1.6 0.0 0.0 0.5 0.3 0.1 0.4 0.9 1.6 2.2 3.2 2.8 3.2
Non-Hispanic white
Total . . . . . . . . . . . . . . . . . . 100.0 100.0 100.0 100.0 100.0 100.0 100.0 100.0 100.0 100.0 100.0 100.0 100.0
Less than 22.0 . . . . . . . . . . . . 0.2 0.6 0.0 0.1 0.2 0.3 0.0 0.1 0.2 0.2 0.0 0.4 0.222.0–23.9 . . . . . . . . . . . . . . . 0.3 2.3 0.2 0.5 0.4 0.0 0.0 0.1 0.0 0.6 0.2 0.2 0.124.0–25.9 . . . . . . . . . . . . . . . 1.1 14.9 2.9 2.2 1.7 2.2 0.8 0.3 0.5 0.2 1.0 0.6 1.126.0–27.9 . . . . . . . . . . . . . . . 8.5 56.0 47.1 29.2 27.3 17.8 6.3 2.9 3.3 4.0 2.8 3.3 3.428.0–29.9 . . . . . . . . . . . . . . . 31.6 23.4 44.6 57.8 56.5 47.9 40.5 36.2 27.0 23.4 23.4 24.9 25.130.0–31.9 . . . . . . . . . . . . . . . 40.9 0.7 3.7 7.7 10.2 28.3 41.8 45.2 50.2 48.2 47.6 46.4 45.232.0–33.9 . . . . . . . . . . . . . . . 13.1 0.1 0.1 0.4 0.7 1.4 7.9 11.8 13.9 18.5 19.2 19.1 19.334.0 and more . . . . . . . . . . . . 1.9 0.0 0.0 0.8 0.0 0.1 0.5 1.2 1.8 2.3 3.8 2.9 3.2
Non-Hispanic black
Total . . . . . . . . . . . . . . . . . . 100.0 100.0 100.0 100.0 100.0 100.0 100.0 100.0 100.0 100.0 100.0 100.0 100.0
Less than 22.0 . . . . . . . . . . . . 1.4 5.4 3.8 2.0 0.6 1.1 0.7 0.9 1.5 1.7 1.0 0.3 0.422.0–23.9 . . . . . . . . . . . . . . . 3.4 13.7 5.0 2.0 2.8 3.6 2.5 2.7 3.5 3.7 2.1 2.9 2.724.0–25.9 . . . . . . . . . . . . . . . 8.6 29.1 19.9 22.4 13.4 11.4 8.1 5.1 5.4 4.0 3.8 5.6 4.526.0–27.9 . . . . . . . . . . . . . . . 23.2 37.3 41.5 35.5 32.7 28.9 25.6 20.9 17.3 19.0 16.8 14.3 17.228.0–29.9 . . . . . . . . . . . . . . . 31.7 11.3 26.4 30.6 40.8 36.0 35.9 31.8 31.6 28.4 31.1 34.2 35.430.0–31.9 . . . . . . . . . . . . . . . 22.9 0.9 1.9 5.7 5.6 14.9 21.7 30.5 28.4 27.5 33.3 31.0 28.132.0–33.9 . . . . . . . . . . . . . . . 5.4 0.0 0.0 0.0 0.6 0.5 2.4 5.3 8.2 11.1 8.6 6.7 7.434.0 and more . . . . . . . . . . . . 0.8 0.1 0.0 0.0 0.5 0.0 0.5 0.3 1.3 1.8 0.3 2.6 1.6
Mexican American
Total . . . . . . . . . . . . . . . . . . 100.0 100.0 100.0 100.0 100.0 100.0 100.0 100.0 100.0 100.0 100.0 100.0 100.0
Less than 22.0 . . . . . . . . . . . . 0.8 4.4 0.2 0.0 0.9 0.0 0.5 0.2 1.1 2.0 0.2 0.2 0.722.0–23.9 . . . . . . . . . . . . . . . 1.1 7.0 1.3 1.2 0.0 0.2 0.7 0.7 0.8 1.4 1.3 0.3 0.624.0–25.9 . . . . . . . . . . . . . . . 3.1 17.8 6.4 1.9 4.7 2.7 3.5 1.3 1.4 2.9 1.4 1.0 1.626.0–27.9 . . . . . . . . . . . . . . . 14.7 52.5 44.1 31.5 26.8 17.2 12.1 6.0 6.5 5.9 5.8 6.1 4.028.0–29.9 . . . . . . . . . . . . . . . 36.1 15.0 42.6 54.7 48.1 49.2 35.8 32.8 34.1 31.9 30.0 29.4 29.330.0–31.9 . . . . . . . . . . . . . . . 33.7 1.1 3.8 7.3 16.0 26.1 38.8 48.1 42.5 35.9 44.2 42.5 47.632.0–33.9 . . . . . . . . . . . . . . . 7.5 0.0 0.2 0.9 1.6 1.8 5.0 8.7 10.4 14.3 13.2 14.8 13.234.0 and more . . . . . . . . . . . . 0.8 0.0 0.2 0.0 0.3 0.0 0.2 0.7 1.1 2.5 0.4 3.1 0.4
0.0 Quantity is more than zero but less than 0.05.1Includes all other race/ethnic groups not listed separately.
NOTE: Numbers may not add to totals because of rounding.
Series 11, No. 247 [ Page 91

Table 68. Percent distribution of mean cell hemoglobin in picogram for males 1 year and over, by race/ethnicity and age: United States,1988–94
Race/ethnicity andselected mean
cell hemoglobin cutoffs1 year
and over1–2
years3–5
years6–8
years9–11years
12–14years
15–19years
20–29years
30–39years
40–49years
50–59years
60–69years
70 yearsand over
All race/ethnic groups1
Total . . . . . . . . . . . . . . . . . . 100.0 100.0 100.0 100.0 100.0 100.0 100.0 100.0 100.0 100.0 100.0 100.0 100.0
Less than 22.0 . . . . . . . . . . . . 0.3 2.3 1.9 0.8 0.3 0.5 0.0 0.0 0.1 0.0 0.5 0.3 0.422.0–23.9 . . . . . . . . . . . . . . . 0.6 6.3 1.4 0.8 1.1 0.5 0.3 0.3 0.3 0.7 0.2 0.3 0.424.0–25.9 . . . . . . . . . . . . . . . 2.1 19.3 8.8 5.9 3.7 2.7 1.3 0.7 0.6 0.7 0.5 0.8 1.826.0–27.9 . . . . . . . . . . . . . . . 10.7 52.3 47.9 34.2 30.6 21.4 8.3 4.7 4.6 3.1 3.0 2.9 3.628.0–29.9 . . . . . . . . . . . . . . . 31.4 16.9 36.4 47.4 52.2 47.2 38.9 37.4 28.4 24.0 22.8 22.8 21.330.0–31.9 . . . . . . . . . . . . . . . 38.4 0.4 2.6 7.0 7.6 24.2 42.2 43.0 49.5 47.9 47.3 45.2 43.432.0–33.9 . . . . . . . . . . . . . . . 11.7 0.2 0.0 0.6 0.5 0.7 6.3 10.3 11.4 17.2 20.6 20.9 22.134.0 and more . . . . . . . . . . . . 2.0 0.0 0.0 1.0 0.1 0.0 0.3 1.1 2.0 3.1 3.8 3.8 4.8
Non-Hispanic white
Total . . . . . . . . . . . . . . . . . . 100.0 100.0 100.0 100.0 100.0 100.0 100.0 100.0 100.0 100.0 100.0 100.0 100.0
Less than 22.0 . . . . . . . . . . . . 0.1 1.1 0.0 0.3 0.0 0.5 0.0 0.0 0.0 0.0 0.0 0.3 0.422.0–23.9 . . . . . . . . . . . . . . . 0.2 3.3 0.2 0.7 0.0 0.0 0.0 0.0 0.0 0.5 0.0 0.0 0.224.0–25.9 . . . . . . . . . . . . . . . 1.0 15.7 3.4 2.9 2.3 1.2 0.0 0.3 0.2 0.0 0.1 0.5 1.726.0–27.9 . . . . . . . . . . . . . . . 8.7 56.6 50.6 32.5 30.7 21.4 4.8 2.5 2.8 1.7 2.3 2.0 2.828.0–29.9 . . . . . . . . . . . . . . . 30.9 20.0 42.2 52.4 53.8 47.2 39.7 38.6 28.1 22.6 20.3 21.7 20.130.0–31.9 . . . . . . . . . . . . . . . 41.1 0.4 3.0 6.6 8.4 27.0 45.5 42.4 52.3 51.7 49.5 46.3 44.332.0–33.9 . . . . . . . . . . . . . . . 13.1 0.3 0.0 0.7 0.0 0.9 7.5 11.6 11.3 17.6 22.3 22.7 23.534.0 and more . . . . . . . . . . . . 2.3 0.0 0.0 1.5 0.0 0.0 0.2 1.5 2.2 3.2 4.7 3.8 4.6
Non-Hispanic black
Total . . . . . . . . . . . . . . . . . . 100.0 100.0 100.0 100.0 100.0 100.0 100.0 100.0 100.0 100.0 100.0 100.0 100.0
Less than 22.0 . . . . . . . . . . . . 1.1 5.6 5.0 2.6 0.8 1.1 0.1 0.2 0.9 0.2 0.4 0.8 0.522.0–23.9 . . . . . . . . . . . . . . . 3.3 15.9 4.5 2.3 3.5 3.5 1.7 2.1 3.0 2.9 1.8 3.2 3.024.0–25.9 . . . . . . . . . . . . . . . 7.8 28.5 22.0 19.1 10.2 12.0 7.0 3.5 4.0 3.1 3.9 4.3 3.526.0–27.9 . . . . . . . . . . . . . . . 21.3 34.8 40.7 35.0 37.0 29.7 23.1 15.8 15.8 14.9 12.6 13.8 13.228.0–29.9 . . . . . . . . . . . . . . . 32.0 12.0 25.4 32.4 37.9 34.8 36.1 34.0 30.9 30.5 32.2 31.7 37.230.0–31.9 . . . . . . . . . . . . . . . 24.5 0.6 1.5 6.9 4.6 12.8 25.8 36.0 34.0 26.9 33.9 29.1 29.932.0–33.9 . . . . . . . . . . . . . . . 6.1 0.0 0.0 0.0 1.1 0.2 2.8 6.1 7.2 15.2 10.9 9.4 9.034.0 and more . . . . . . . . . . . . 1.2 0.0 0.0 0.0 0.9 0.0 1.0 0.2 1.8 3.3 0.5 4.1 1.6
Mexican American
Total . . . . . . . . . . . . . . . . . . 100.0 100.0 100.0 100.0 100.0 100.0 100.0 100.0 100.0 100.0 100.0 100.0 100.0
Less than 22.0 . . . . . . . . . . . . 0.4 5.5 0.2 0.0 1.5 0.0 0.2 0.0 0.0 0.3 0.0 0.0 0.022.0–23.9 . . . . . . . . . . . . . . . 0.7 7.4 1.7 0.0 0.0 0.5 0.0 0.3 0.4 0.8 0.6 0.6 0.024.0–25.9 . . . . . . . . . . . . . . . 2.7 18.9 7.0 2.1 6.8 2.3 1.3 0.6 1.4 0.1 2.3 1.7 3.226.0–27.9 . . . . . . . . . . . . . . . 14.3 54.6 48.6 36.3 30.2 26.8 13.0 2.9 2.8 4.3 4.1 3.3 4.628.0–29.9 . . . . . . . . . . . . . . . 33.6 11.6 38.3 51.2 47.2 48.3 31.2 31.1 32.5 29.1 29.1 27.9 22.730.0–31.9 . . . . . . . . . . . . . . . 35.9 0.5 2.5 6.0 10.3 18.3 44.9 54.2 45.7 41.0 41.3 40.7 47.932.0–33.9 . . . . . . . . . . . . . . . 9.1 0.0 0.4 1.6 3.0 1.1 5.1 9.0 13.8 17.7 17.9 18.4 16.934.0 and more . . . . . . . . . . . . 0.9 0.0 0.0 0.0 0.0 0.0 0.0 0.7 0.9 3.1 0.8 5.6 0.2
0.0 Quantity is more than zero but less than 0.05.1Includes all other race/ethnic groups not listed separately.
NOTE: Numbers may not add to totals because of rounding.
Page 92 [ Series 11, No. 247
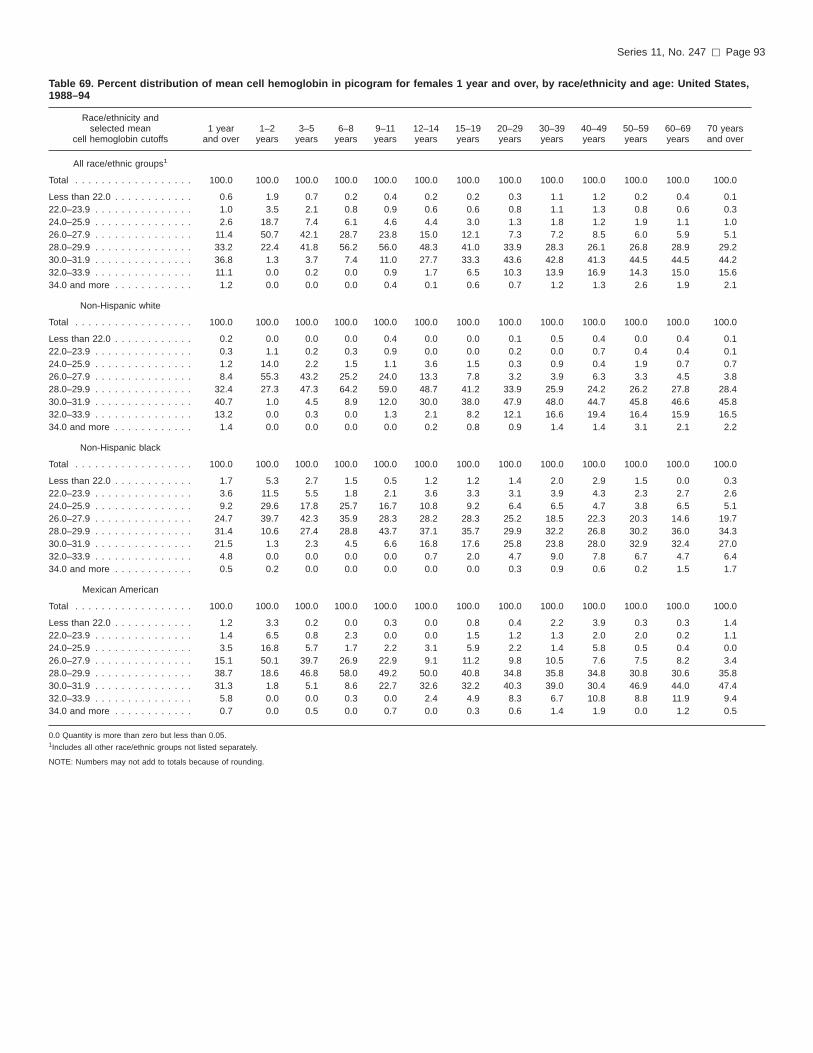
Table 69. Percent distribution of mean cell hemoglobin in picogram for females 1 year and over, by race/ethnicity and age: United States,1988–94
Race/ethnicity andselected mean
cell hemoglobin cutoffs1 year
and over1–2
years3–5
years6–8
years9–11years
12–14years
15–19years
20–29years
30–39years
40–49years
50–59years
60–69years
70 yearsand over
All race/ethnic groups1
Total . . . . . . . . . . . . . . . . . . 100.0 100.0 100.0 100.0 100.0 100.0 100.0 100.0 100.0 100.0 100.0 100.0 100.0
Less than 22.0 . . . . . . . . . . . . 0.6 1.9 0.7 0.2 0.4 0.2 0.2 0.3 1.1 1.2 0.2 0.4 0.122.0–23.9 . . . . . . . . . . . . . . . 1.0 3.5 2.1 0.8 0.9 0.6 0.6 0.8 1.1 1.3 0.8 0.6 0.324.0–25.9 . . . . . . . . . . . . . . . 2.6 18.7 7.4 6.1 4.6 4.4 3.0 1.3 1.8 1.2 1.9 1.1 1.026.0–27.9 . . . . . . . . . . . . . . . 11.4 50.7 42.1 28.7 23.8 15.0 12.1 7.3 7.2 8.5 6.0 5.9 5.128.0–29.9 . . . . . . . . . . . . . . . 33.2 22.4 41.8 56.2 56.0 48.3 41.0 33.9 28.3 26.1 26.8 28.9 29.230.0–31.9 . . . . . . . . . . . . . . . 36.8 1.3 3.7 7.4 11.0 27.7 33.3 43.6 42.8 41.3 44.5 44.5 44.232.0–33.9 . . . . . . . . . . . . . . . 11.1 0.0 0.2 0.0 0.9 1.7 6.5 10.3 13.9 16.9 14.3 15.0 15.634.0 and more . . . . . . . . . . . . 1.2 0.0 0.0 0.0 0.4 0.1 0.6 0.7 1.2 1.3 2.6 1.9 2.1
Non-Hispanic white
Total . . . . . . . . . . . . . . . . . . 100.0 100.0 100.0 100.0 100.0 100.0 100.0 100.0 100.0 100.0 100.0 100.0 100.0
Less than 22.0 . . . . . . . . . . . . 0.2 0.0 0.0 0.0 0.4 0.0 0.0 0.1 0.5 0.4 0.0 0.4 0.122.0–23.9 . . . . . . . . . . . . . . . 0.3 1.1 0.2 0.3 0.9 0.0 0.0 0.2 0.0 0.7 0.4 0.4 0.124.0–25.9 . . . . . . . . . . . . . . . 1.2 14.0 2.2 1.5 1.1 3.6 1.5 0.3 0.9 0.4 1.9 0.7 0.726.0–27.9 . . . . . . . . . . . . . . . 8.4 55.3 43.2 25.2 24.0 13.3 7.8 3.2 3.9 6.3 3.3 4.5 3.828.0–29.9 . . . . . . . . . . . . . . . 32.4 27.3 47.3 64.2 59.0 48.7 41.2 33.9 25.9 24.2 26.2 27.8 28.430.0–31.9 . . . . . . . . . . . . . . . 40.7 1.0 4.5 8.9 12.0 30.0 38.0 47.9 48.0 44.7 45.8 46.6 45.832.0–33.9 . . . . . . . . . . . . . . . 13.2 0.0 0.3 0.0 1.3 2.1 8.2 12.1 16.6 19.4 16.4 15.9 16.534.0 and more . . . . . . . . . . . . 1.4 0.0 0.0 0.0 0.0 0.2 0.8 0.9 1.4 1.4 3.1 2.1 2.2
Non-Hispanic black
Total . . . . . . . . . . . . . . . . . . 100.0 100.0 100.0 100.0 100.0 100.0 100.0 100.0 100.0 100.0 100.0 100.0 100.0
Less than 22.0 . . . . . . . . . . . . 1.7 5.3 2.7 1.5 0.5 1.2 1.2 1.4 2.0 2.9 1.5 0.0 0.322.0–23.9 . . . . . . . . . . . . . . . 3.6 11.5 5.5 1.8 2.1 3.6 3.3 3.1 3.9 4.3 2.3 2.7 2.624.0–25.9 . . . . . . . . . . . . . . . 9.2 29.6 17.8 25.7 16.7 10.8 9.2 6.4 6.5 4.7 3.8 6.5 5.126.0–27.9 . . . . . . . . . . . . . . . 24.7 39.7 42.3 35.9 28.3 28.2 28.3 25.2 18.5 22.3 20.3 14.6 19.728.0–29.9 . . . . . . . . . . . . . . . 31.4 10.6 27.4 28.8 43.7 37.1 35.7 29.9 32.2 26.8 30.2 36.0 34.330.0–31.9 . . . . . . . . . . . . . . . 21.5 1.3 2.3 4.5 6.6 16.8 17.6 25.8 23.8 28.0 32.9 32.4 27.032.0–33.9 . . . . . . . . . . . . . . . 4.8 0.0 0.0 0.0 0.0 0.7 2.0 4.7 9.0 7.8 6.7 4.7 6.434.0 and more . . . . . . . . . . . . 0.5 0.2 0.0 0.0 0.0 0.0 0.0 0.3 0.9 0.6 0.2 1.5 1.7
Mexican American
Total . . . . . . . . . . . . . . . . . . 100.0 100.0 100.0 100.0 100.0 100.0 100.0 100.0 100.0 100.0 100.0 100.0 100.0
Less than 22.0 . . . . . . . . . . . . 1.2 3.3 0.2 0.0 0.3 0.0 0.8 0.4 2.2 3.9 0.3 0.3 1.422.0–23.9 . . . . . . . . . . . . . . . 1.4 6.5 0.8 2.3 0.0 0.0 1.5 1.2 1.3 2.0 2.0 0.2 1.124.0–25.9 . . . . . . . . . . . . . . . 3.5 16.8 5.7 1.7 2.2 3.1 5.9 2.2 1.4 5.8 0.5 0.4 0.026.0–27.9 . . . . . . . . . . . . . . . 15.1 50.1 39.7 26.9 22.9 9.1 11.2 9.8 10.5 7.6 7.5 8.2 3.428.0–29.9 . . . . . . . . . . . . . . . 38.7 18.6 46.8 58.0 49.2 50.0 40.8 34.8 35.8 34.8 30.8 30.6 35.830.0–31.9 . . . . . . . . . . . . . . . 31.3 1.8 5.1 8.6 22.7 32.6 32.2 40.3 39.0 30.4 46.9 44.0 47.432.0–33.9 . . . . . . . . . . . . . . . 5.8 0.0 0.0 0.3 0.0 2.4 4.9 8.3 6.7 10.8 8.8 11.9 9.434.0 and more . . . . . . . . . . . . 0.7 0.0 0.5 0.0 0.7 0.0 0.3 0.6 1.4 1.9 0.0 1.2 0.5
0.0 Quantity is more than zero but less than 0.05.1Includes all other race/ethnic groups not listed separately.
NOTE: Numbers may not add to totals because of rounding.
Series 11, No. 247 [ Page 93

Table 70. Percent distribution of mean cell hemoglobin concentration in gram per liter for persons 1 year and over, by race/ethnicity andage: United States, 1988–94
Race/ethnicity andselected mean
cell hemoglobin cutoffs1 year
and over1–2
years3–5
years6–8
years9–11years
12–14years
15–19years
20–29years
30–39years
40–49years
50–59years
60–69years
70 yearsand over
All race/ethnic groups1
Total . . . . . . . . . . . . . . . . . . 100.0 100.0 100.0 100.0 100.0 100.0 100.0 100.0 100.0 100.0 100.0 100.0 100.0
Less than 280.0 . . . . . . . . . . . 0.0 0.0 0.0 0.0 0.0 0.0 0.0 0.0 0.0 0.0 0.0 0.0 0.0280.0–289.9 . . . . . . . . . . . . . 0.0 0.0 0.0 0.0 0.0 0.0 0.0 0.0 0.0 0.0 0.0 0.0 0.0290.0–299.9 . . . . . . . . . . . . . 0.1 0.0 0.0 0.0 0.0 0.0 0.1 0.2 0.1 0.2 0.0 0.0 0.1300.0–309.9 . . . . . . . . . . . . . 0.3 0.4 0.2 0.1 0.1 0.2 0.1 0.2 0.2 0.6 0.2 0.3 0.3310.0–319.9 . . . . . . . . . . . . . 2.1 3.0 3.3 1.7 1.5 2.4 1.8 1.5 2.1 1.7 2.0 2.2 3.7320.0–329.9 . . . . . . . . . . . . . 14.1 19.4 16.4 16.4 15.0 17.8 16.6 11.6 11.7 12.5 12.0 16.1 18.4330.0–339.9 . . . . . . . . . . . . . 43.5 51.4 47.4 42.2 45.3 40.7 43.3 41.8 42.1 42.3 41.6 46.9 47.5340.0–349.9 . . . . . . . . . . . . . 34.3 22.9 27.9 33.4 34.5 34.9 32.8 37.8 37.8 36.3 37.1 29.1 26.5350.0–359.9 . . . . . . . . . . . . . 5.3 2.4 4.0 5.8 3.2 3.7 5.1 6.4 5.9 5.8 6.9 4.7 3.1360.0–369.9 . . . . . . . . . . . . . 0.3 0.2 0.5 0.1 0.3 0.3 0.2 0.4 0.2 0.6 0.1 0.1 0.3370.0 and more . . . . . . . . . . . 0.1 0.2 0.2 0.3 0.0 0.0 0.1 0.1 0.0 0.2 0.1 0.5 0.1
Non-Hispanic white
Total . . . . . . . . . . . . . . . . . . 100.0 100.0 100.0 100.0 100.0 100.0 100.0 100.0 100.0 100.0 100.0 100.0 100.0
Less than 280.0 . . . . . . . . . . . 0.0 0.0 0.0 0.0 0.0 0.0 0.0 0.0 0.0 0.0 0.0 0.0 0.0280.0–289.9 . . . . . . . . . . . . . 0.0 0.0 0.0 0.0 0.0 0.0 0.0 0.0 0.0 0.0 0.0 0.0 0.0290.0–299.9 . . . . . . . . . . . . . 0.1 0.0 0.0 0.0 0.0 0.0 0.0 0.3 0.1 0.1 0.0 0.0 0.1300.0–309.9 . . . . . . . . . . . . . 0.1 0.3 0.1 0.0 0.0 0.0 0.0 0.1 0.0 0.3 0.0 0.3 0.2310.0–319.9 . . . . . . . . . . . . . 1.3 1.6 1.9 1.0 0.7 1.7 0.8 0.8 1.1 1.0 1.0 2.0 3.2320.0–329.9 . . . . . . . . . . . . . 11.2 14.1 12.4 13.5 11.5 14.0 12.5 8.5 8.7 9.9 9.7 13.9 17.2330.0–339.9 . . . . . . . . . . . . . 42.8 53.4 47.7 39.3 46.4 41.7 41.2 39.8 40.9 41.0 41.7 47.8 47.3340.0–349.9 . . . . . . . . . . . . . 37.9 27.3 32.3 37.9 38.1 37.8 39.0 42.3 42.3 40.4 39.7 30.3 28.1350.0–359.9 . . . . . . . . . . . . . 6.1 2.7 4.7 8.0 3.2 4.7 6.1 7.7 6.7 6.4 7.8 5.2 3.5360.0–369.9 . . . . . . . . . . . . . 0.3 0.3 0.6 0.0 0.0 0.1 0.2 0.5 0.2 0.7 0.1 0.1 0.3370.0 and more . . . . . . . . . . . 0.1 0.3 0.3 0.3 0.0 0.0 0.2 0.1 0.0 0.2 0.0 0.5 0.1
Non-Hispanic black
Total . . . . . . . . . . . . . . . . . . 100.0 100.0 100.0 100.0 100.0 100.0 100.0 100.0 100.0 100.0 100.0 100.0 100.0
Less than 280.0 . . . . . . . . . . . 0.0 0.0 0.0 0.0 0.0 0.0 0.0 0.0 0.1 0.2 0.0 0.0 0.0280.0–289.9 . . . . . . . . . . . . . 0.0 0.3 0.0 0.0 0.0 0.0 0.0 0.1 0.0 0.0 0.0 0.0 0.0290.0–299.9 . . . . . . . . . . . . . 0.2 0.0 0.2 0.0 0.0 0.0 0.4 0.1 0.1 0.7 0.2 0.0 0.2300.0–309.9 . . . . . . . . . . . . . 1.0 0.7 0.5 0.8 0.7 1.6 0.7 0.7 1.3 1.2 1.6 1.1 0.8310.0–319.9 . . . . . . . . . . . . . 6.9 7.2 7.7 5.4 4.2 8.1 6.8 6.4 7.2 6.9 6.9 6.5 9.7320.0–329.9 . . . . . . . . . . . . . 29.1 33.9 26.8 31.5 27.8 31.9 32.1 28.1 24.3 29.5 28.2 31.9 36.5330.0–339.9 . . . . . . . . . . . . . 44.8 44.7 46.3 39.3 44.8 39.1 45.7 46.1 47.4 42.8 47.4 44.0 41.4340.0–349.9 . . . . . . . . . . . . . 16.2 11.9 16.4 20.5 20.2 18.7 12.6 17.5 17.1 16.5 14.1 14.1 11.2350.0–359.9 . . . . . . . . . . . . . 1.6 1.2 2.0 1.9 1.5 0.7 1.4 1.0 2.5 2.1 1.2 1.9 0.2360.0–369.9 . . . . . . . . . . . . . 0.1 0.0 0.1 0.3 0.8 0.0 0.3 0.0 0.0 0.1 0.4 0.0 0.0370.0 and more . . . . . . . . . . . 0.1 0.2 0.0 0.3 0.0 0.0 0.0 0.1 0.0 0.0 0.0 0.5 0.0
Mexican American
Total . . . . . . . . . . . . . . . . . . 100.0 100.0 100.0 100.0 100.0 100.0 100.0 100.0 100.0 100.0 100.0 100.0 100.0
Less than 280.0 . . . . . . . . . . . 0.0 0.0 0.0 0.0 0.0 0.0 0.0 0.0 0.0 0.0 0.0 0.0 0.0280.0–289.9 . . . . . . . . . . . . . 0.0 0.0 0.0 0.0 0.0 0.0 0.0 0.0 0.0 0.2 0.0 0.0 0.3290.0–299.9 . . . . . . . . . . . . . 0.1 0.2 0.0 0.0 0.0 0.0 0.0 0.0 0.0 0.6 0.0 0.0 0.5300.0–309.9 . . . . . . . . . . . . . 0.5 1.2 0.1 0.0 0.4 0.0 0.5 0.4 0.6 1.3 0.7 0.1 1.0310.0–319.9 . . . . . . . . . . . . . 2.0 4.4 2.6 1.4 1.6 0.9 2.1 1.3 2.2 2.7 2.0 1.8 1.8320.0–329.9 . . . . . . . . . . . . . 15.6 24.0 15.6 17.1 14.2 15.5 17.5 13.0 13.3 14.2 19.0 20.6 22.7330.0–339.9 . . . . . . . . . . . . . 43.1 45.7 48.0 38.9 39.1 44.6 41.3 43.9 44.5 40.0 41.0 43.4 50.6340.0–349.9 . . . . . . . . . . . . . 32.8 23.0 29.2 40.4 37.9 33.5 32.2 33.6 33.7 34.1 28.4 31.2 21.6350.0–359.9 . . . . . . . . . . . . . 5.5 1.4 4.1 1.7 6.4 5.3 6.0 7.2 5.3 5.9 8.9 2.6 1.3360.0–369.9 . . . . . . . . . . . . . 0.4 0.0 0.4 0.5 0.1 0.3 0.4 0.6 0.1 0.9 0.0 0.4 0.3370.0 and more . . . . . . . . . . . 0.1 0.1 0.0 0.0 0.3 0.0 0.0 0.0 0.1 0.1 0.0 0.0 0.0
0.0 Quantity more than zero but less than 0.05.1Includes all other race/ethnic groups not listed separately
NOTE: Numbers may not add to totals because of rounding.
Page 94 [ Series 11, No. 247
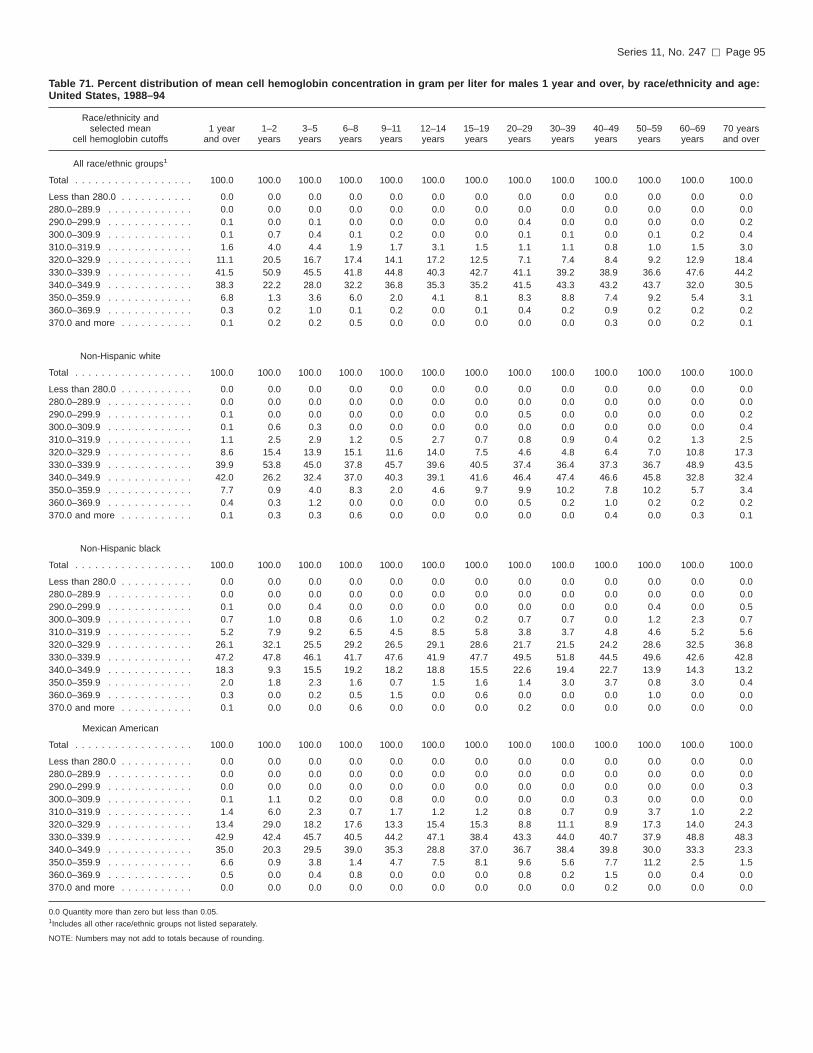
Table 71. Percent distribution of mean cell hemoglobin concentration in gram per liter for males 1 year and over, by race/ethnicity and age:United States, 1988–94
Race/ethnicity andselected mean
cell hemoglobin cutoffs1 year
and over1–2
years3–5
years6–8
years9–11years
12–14years
15–19years
20–29years
30–39years
40–49years
50–59years
60–69years
70 yearsand over
All race/ethnic groups1
Total . . . . . . . . . . . . . . . . . . 100.0 100.0 100.0 100.0 100.0 100.0 100.0 100.0 100.0 100.0 100.0 100.0 100.0
Less than 280.0 . . . . . . . . . . . 0.0 0.0 0.0 0.0 0.0 0.0 0.0 0.0 0.0 0.0 0.0 0.0 0.0280.0–289.9 . . . . . . . . . . . . . 0.0 0.0 0.0 0.0 0.0 0.0 0.0 0.0 0.0 0.0 0.0 0.0 0.0290.0–299.9 . . . . . . . . . . . . . 0.1 0.0 0.1 0.0 0.0 0.0 0.0 0.4 0.0 0.0 0.0 0.0 0.2300.0–309.9 . . . . . . . . . . . . . 0.1 0.7 0.4 0.1 0.2 0.0 0.0 0.1 0.1 0.0 0.1 0.2 0.4310.0–319.9 . . . . . . . . . . . . . 1.6 4.0 4.4 1.9 1.7 3.1 1.5 1.1 1.1 0.8 1.0 1.5 3.0320.0–329.9 . . . . . . . . . . . . . 11.1 20.5 16.7 17.4 14.1 17.2 12.5 7.1 7.4 8.4 9.2 12.9 18.4330.0–339.9 . . . . . . . . . . . . . 41.5 50.9 45.5 41.8 44.8 40.3 42.7 41.1 39.2 38.9 36.6 47.6 44.2340.0–349.9 . . . . . . . . . . . . . 38.3 22.2 28.0 32.2 36.8 35.3 35.2 41.5 43.3 43.2 43.7 32.0 30.5350.0–359.9 . . . . . . . . . . . . . 6.8 1.3 3.6 6.0 2.0 4.1 8.1 8.3 8.8 7.4 9.2 5.4 3.1360.0–369.9 . . . . . . . . . . . . . 0.3 0.2 1.0 0.1 0.2 0.0 0.1 0.4 0.2 0.9 0.2 0.2 0.2370.0 and more . . . . . . . . . . . 0.1 0.2 0.2 0.5 0.0 0.0 0.0 0.0 0.0 0.3 0.0 0.2 0.1
Non-Hispanic white
Total . . . . . . . . . . . . . . . . . . 100.0 100.0 100.0 100.0 100.0 100.0 100.0 100.0 100.0 100.0 100.0 100.0 100.0
Less than 280.0 . . . . . . . . . . . 0.0 0.0 0.0 0.0 0.0 0.0 0.0 0.0 0.0 0.0 0.0 0.0 0.0280.0–289.9 . . . . . . . . . . . . . 0.0 0.0 0.0 0.0 0.0 0.0 0.0 0.0 0.0 0.0 0.0 0.0 0.0290.0–299.9 . . . . . . . . . . . . . 0.1 0.0 0.0 0.0 0.0 0.0 0.0 0.5 0.0 0.0 0.0 0.0 0.2300.0–309.9 . . . . . . . . . . . . . 0.1 0.6 0.3 0.0 0.0 0.0 0.0 0.0 0.0 0.0 0.0 0.0 0.4310.0–319.9 . . . . . . . . . . . . . 1.1 2.5 2.9 1.2 0.5 2.7 0.7 0.8 0.9 0.4 0.2 1.3 2.5320.0–329.9 . . . . . . . . . . . . . 8.6 15.4 13.9 15.1 11.6 14.0 7.5 4.6 4.8 6.4 7.0 10.8 17.3330.0–339.9 . . . . . . . . . . . . . 39.9 53.8 45.0 37.8 45.7 39.6 40.5 37.4 36.4 37.3 36.7 48.9 43.5340.0–349.9 . . . . . . . . . . . . . 42.0 26.2 32.4 37.0 40.3 39.1 41.6 46.4 47.4 46.6 45.8 32.8 32.4350.0–359.9 . . . . . . . . . . . . . 7.7 0.9 4.0 8.3 2.0 4.6 9.7 9.9 10.2 7.8 10.2 5.7 3.4360.0–369.9 . . . . . . . . . . . . . 0.4 0.3 1.2 0.0 0.0 0.0 0.0 0.5 0.2 1.0 0.2 0.2 0.2370.0 and more . . . . . . . . . . . 0.1 0.3 0.3 0.6 0.0 0.0 0.0 0.0 0.0 0.4 0.0 0.3 0.1
Non-Hispanic black
Total . . . . . . . . . . . . . . . . . . 100.0 100.0 100.0 100.0 100.0 100.0 100.0 100.0 100.0 100.0 100.0 100.0 100.0
Less than 280.0 . . . . . . . . . . . 0.0 0.0 0.0 0.0 0.0 0.0 0.0 0.0 0.0 0.0 0.0 0.0 0.0280.0–289.9 . . . . . . . . . . . . . 0.0 0.0 0.0 0.0 0.0 0.0 0.0 0.0 0.0 0.0 0.0 0.0 0.0290.0–299.9 . . . . . . . . . . . . . 0.1 0.0 0.4 0.0 0.0 0.0 0.0 0.0 0.0 0.0 0.4 0.0 0.5300.0–309.9 . . . . . . . . . . . . . 0.7 1.0 0.8 0.6 1.0 0.2 0.2 0.7 0.7 0.0 1.2 2.3 0.7310.0–319.9 . . . . . . . . . . . . . 5.2 7.9 9.2 6.5 4.5 8.5 5.8 3.8 3.7 4.8 4.6 5.2 5.6320.0–329.9 . . . . . . . . . . . . . 26.1 32.1 25.5 29.2 26.5 29.1 28.6 21.7 21.5 24.2 28.6 32.5 36.8330.0–339.9 . . . . . . . . . . . . . 47.2 47.8 46.1 41.7 47.6 41.9 47.7 49.5 51.8 44.5 49.6 42.6 42.8340.0–349.9 . . . . . . . . . . . . . 18.3 9.3 15.5 19.2 18.2 18.8 15.5 22.6 19.4 22.7 13.9 14.3 13.2350.0–359.9 . . . . . . . . . . . . . 2.0 1.8 2.3 1.6 0.7 1.5 1.6 1.4 3.0 3.7 0.8 3.0 0.4360.0–369.9 . . . . . . . . . . . . . 0.3 0.0 0.2 0.5 1.5 0.0 0.6 0.0 0.0 0.0 1.0 0.0 0.0370.0 and more . . . . . . . . . . . 0.1 0.0 0.0 0.6 0.0 0.0 0.0 0.2 0.0 0.0 0.0 0.0 0.0
Mexican American
Total . . . . . . . . . . . . . . . . . . 100.0 100.0 100.0 100.0 100.0 100.0 100.0 100.0 100.0 100.0 100.0 100.0 100.0
Less than 280.0 . . . . . . . . . . . 0.0 0.0 0.0 0.0 0.0 0.0 0.0 0.0 0.0 0.0 0.0 0.0 0.0280.0–289.9 . . . . . . . . . . . . . 0.0 0.0 0.0 0.0 0.0 0.0 0.0 0.0 0.0 0.0 0.0 0.0 0.0290.0–299.9 . . . . . . . . . . . . . 0.0 0.0 0.0 0.0 0.0 0.0 0.0 0.0 0.0 0.0 0.0 0.0 0.3300.0–309.9 . . . . . . . . . . . . . 0.1 1.1 0.2 0.0 0.8 0.0 0.0 0.0 0.0 0.3 0.0 0.0 0.0310.0–319.9 . . . . . . . . . . . . . 1.4 6.0 2.3 0.7 1.7 1.2 1.2 0.8 0.7 0.9 3.7 1.0 2.2320.0–329.9 . . . . . . . . . . . . . 13.4 29.0 18.2 17.6 13.3 15.4 15.3 8.8 11.1 8.9 17.3 14.0 24.3330.0–339.9 . . . . . . . . . . . . . 42.9 42.4 45.7 40.5 44.2 47.1 38.4 43.3 44.0 40.7 37.9 48.8 48.3340.0–349.9 . . . . . . . . . . . . . 35.0 20.3 29.5 39.0 35.3 28.8 37.0 36.7 38.4 39.8 30.0 33.3 23.3350.0–359.9 . . . . . . . . . . . . . 6.6 0.9 3.8 1.4 4.7 7.5 8.1 9.6 5.6 7.7 11.2 2.5 1.5360.0–369.9 . . . . . . . . . . . . . 0.5 0.0 0.4 0.8 0.0 0.0 0.0 0.8 0.2 1.5 0.0 0.4 0.0370.0 and more . . . . . . . . . . . 0.0 0.0 0.0 0.0 0.0 0.0 0.0 0.0 0.0 0.2 0.0 0.0 0.0
0.0 Quantity more than zero but less than 0.05.1Includes all other race/ethnic groups not listed separately.
NOTE: Numbers may not add to totals because of rounding.
Series 11, No. 247 [ Page 95

Table 72. Percent distribution of mean cell hemoglobin concentration in gram per liter for females 1 year and over, by race/ethnicity andage: United States, 1988–94
Race/ethnicity andselected mean
cell hemoglobin cutoffs1 year
and over1–2
years3–5
years6–8
years9–11years
12–14years
15–19years
20–29years
30–39years
40–49years
50–59years
60–69years
70 yearsand over
All race/ethnic groups1
Total . . . . . . . . . . . . . . . . . . 100.0 100.0 100.0 100.0 100.0 100.0 100.0 100.0 100.0 100.0 100.0 100.0 100.0
Less than 280.0 . . . . . . . . . . . 0.0 0.0 0.0 0.0 0.0 0.0 0.0 0.0 0.0 0.0 0.0 0.0 0.0280.0–289.9 . . . . . . . . . . . . . 0.0 0.1 0.0 0.0 0.0 0.0 0.0 0.0 0.0 0.0 0.0 0.0 0.0290.0–299.9 . . . . . . . . . . . . . 0.1 0.1 0.0 0.0 0.0 0.0 0.1 0.0 0.1 0.3 0.0 0.0 0.0300.0–309.9 . . . . . . . . . . . . . 0.4 0.2 0.0 0.2 0.1 0.4 0.3 0.3 0.3 1.1 0.3 0.5 0.2310.0–319.9 . . . . . . . . . . . . . 2.5 1.9 2.0 1.5 1.3 1.6 2.1 2.0 3.0 2.5 2.9 2.9 4.2320.0–329.9 . . . . . . . . . . . . . 16.9 18.2 16.2 15.3 15.8 18.6 20.6 16.0 16.0 16.4 14.6 18.9 18.5330.0–339.9 . . . . . . . . . . . . . 45.4 51.8 49.5 42.6 45.8 41.1 43.9 42.4 45.0 45.5 46.4 46.4 49.7340.0–349.9 . . . . . . . . . . . . . 30.5 23.6 27.8 34.8 32.2 34.4 30.5 34.1 32.4 29.6 31.0 26.6 23.9350.0–359.9 . . . . . . . . . . . . . 3.9 3.6 4.3 5.7 4.4 3.3 2.2 4.6 3.0 4.2 4.8 4.1 3.1360.0–369.9 . . . . . . . . . . . . . 0.2 0.2 0.0 0.0 0.4 0.5 0.3 0.5 0.1 0.3 0.0 0.0 0.4370.0 and more . . . . . . . . . . . 0.1 0.3 0.2 0.0 0.1 0.0 0.2 0.2 0.0 0.0 0.1 0.7 0.1
Non-Hispanic white
Total . . . . . . . . . . . . . . . . . . 100.0 100.0 100.0 100.0 100.0 100.0 100.0 100.0 100.0 100.0 100.0 100.0 100.0
Less than 280.0 . . . . . . . . . . . 0.0 0.0 0.0 0.0 0.0 0.0 0.0 0.0 0.0 0.0 0.0 0.0 0.0280.0–289.9 . . . . . . . . . . . . . 0.0 0.0 0.0 0.0 0.0 0.0 0.0 0.0 0.0 0.0 0.0 0.0 0.0290.0–299.9 . . . . . . . . . . . . . 0.0 0.0 0.0 0.0 0.0 0.0 0.0 0.0 0.1 0.2 0.0 0.0 0.0300.0–309.9 . . . . . . . . . . . . . 0.2 0.0 0.0 0.0 0.0 0.0 0.0 0.1 0.0 0.6 0.0 0.5 0.1310.0–319.9 . . . . . . . . . . . . . 1.6 0.5 0.8 0.7 0.8 0.4 1.0 0.9 1.3 1.6 1.7 2.6 3.6320.0–329.9 . . . . . . . . . . . . . 13.8 12.6 10.7 11.6 11.5 14.1 17.5 12.2 12.7 13.5 12.3 16.7 17.1330.0–339.9 . . . . . . . . . . . . . 45.5 53.0 50.7 41.1 47.1 44.3 41.8 42.1 45.5 44.8 46.4 46.7 49.8340.0–349.9 . . . . . . . . . . . . . 34.0 28.5 32.1 39.0 36.1 36.2 36.5 38.3 37.1 34.1 34.0 28.1 25.3350.0–359.9 . . . . . . . . . . . . . 4.5 4.8 5.4 7.5 4.5 4.7 2.6 5.6 3.2 5.0 5.5 4.7 3.5360.0–369.9 . . . . . . . . . . . . . 0.2 0.3 0.0 0.0 0.0 0.3 0.3 0.4 0.2 0.4 0.0 0.0 0.4370.0 and more . . . . . . . . . . . 0.1 0.3 0.3 0.0 0.0 0.0 0.3 0.2 0.0 0.0 0.0 0.7 0.1
Non-Hispanic black
Total . . . . . . . . . . . . . . . . . . 100.0 100.0 100.0 100.0 100.0 100.0 100.0 100.0 100.0 100.0 100.0 100.0 100.0
Less than 280.0 . . . . . . . . . . . 0.1 0.0 0.0 0.0 0.0 0.0 0.0 0.0 0.1 0.3 0.0 0.0 0.0280.0–289.9 . . . . . . . . . . . . . 0.0 0.5 0.0 0.0 0.0 0.0 0.0 0.1 0.0 0.0 0.0 0.0 0.0290.0–299.9 . . . . . . . . . . . . . 0.3 0.0 0.1 0.0 0.0 0.0 0.9 0.3 0.2 1.2 0.0 0.0 0.0300.0–309.9 . . . . . . . . . . . . . 1.3 0.3 0.1 1.0 0.4 2.7 1.2 0.7 1.8 2.2 1.9 0.2 0.9310.0–319.9 . . . . . . . . . . . . . 8.3 6.5 6.3 4.3 4.0 7.7 7.9 8.5 10.1 8.6 8.8 7.5 12.2320.0–329.9 . . . . . . . . . . . . . 31.7 35.6 28.2 33.7 29.1 34.3 35.5 33.4 26.7 33.7 27.9 31.5 36.3330.0–339.9 . . . . . . . . . . . . . 42.6 41.5 46.4 37.0 42.0 36.6 43.6 43.1 43.7 41.5 45.6 44.9 40.5340.0–349.9 . . . . . . . . . . . . . 14.4 14.4 17.3 21.8 22.2 18.6 9.6 13.2 15.2 11.5 14.2 14.1 10.0350.0–359.9 . . . . . . . . . . . . . 1.2 0.7 1.6 2.3 2.2 0.0 1.2 0.6 2.1 0.9 1.5 1.0 0.0360.0–369.9 . . . . . . . . . . . . . 0.0 0.0 0.0 0.0 0.0 0.0 0.0 0.0 0.0 0.1 0.0 0.0 0.0370.0 and more . . . . . . . . . . . 0.1 0.5 0.0 0.0 0.0 0.0 0.0 0.0 0.0 0.0 0.0 0.8 0.0
Mexican AmericanTotal . . . . . . . . . . . . . . . . . . 100.0 100.0 100.0 100.0 100.0 100.0 100.0 100.0 100.0 100.0 100.0 100.0 100.0
Less than 280.0 . . . . . . . . . . . 0.0 0.0 0.0 0.0 0.0 0.0 0.0 0.1 0.0 0.0 0.0 0.0 0.0280.0–289.9 . . . . . . . . . . . . . 0.1 0.0 0.1 0.0 0.0 0.0 0.0 0.0 0.0 0.4 0.0 0.0 0.7290.0–299.9 . . . . . . . . . . . . . 0.2 0.5 0.0 0.0 0.0 0.0 0.0 0.0 0.3 1.3 0.0 0.0 0.6300.0–309.9 . . . . . . . . . . . . . 0.9 1.2 0.1 0.0 0.0 0.0 1.0 0.8 1.2 2.4 1.4 0.1 1.9310.0–319.9 . . . . . . . . . . . . . 2.5 2.7 2.8 2.1 1.5 0.7 3.1 1.9 3.8 4.6 0.3 2.5 1.4320.0–329.9 . . . . . . . . . . . . . 17.9 18.5 13.1 16.6 15.2 15.5 19.9 18.3 15.8 19.8 20.6 25.7 21.1330.0–339.9 . . . . . . . . . . . . . 43.3 49.3 50.3 37.4 33.1 42.4 44.5 44.6 45.0 39.3 44.1 39.2 52.9340.0–349.9 . . . . . . . . . . . . . 30.5 26.0 28.9 41.7 40.9 37.5 27.0 29.6 28.7 28.1 26.8 29.5 19.9350.0–359.9 . . . . . . . . . . . . . 4.2 1.8 4.4 2.0 8.4 3.4 3.7 4.2 5.0 4.0 6.7 2.6 1.0360.0–369.9 . . . . . . . . . . . . . 0.3 0.0 0.4 0.3 0.3 0.5 0.9 0.4 0.0 0.2 0.0 0.4 0.6370.0 and more . . . . . . . . . . . 0.1 0.0 0.0 0.0 0.7 0.0 0.0 0.1 0.2 0.0 0.0 0.0 0.0
0.0 Quantity more than zero but less than 0.05.1Includes all other race/ethnic groups not listed separately.
NOTE: Numbers may not add to totals because of rounding.
Page 96 [ Series 11, No. 247
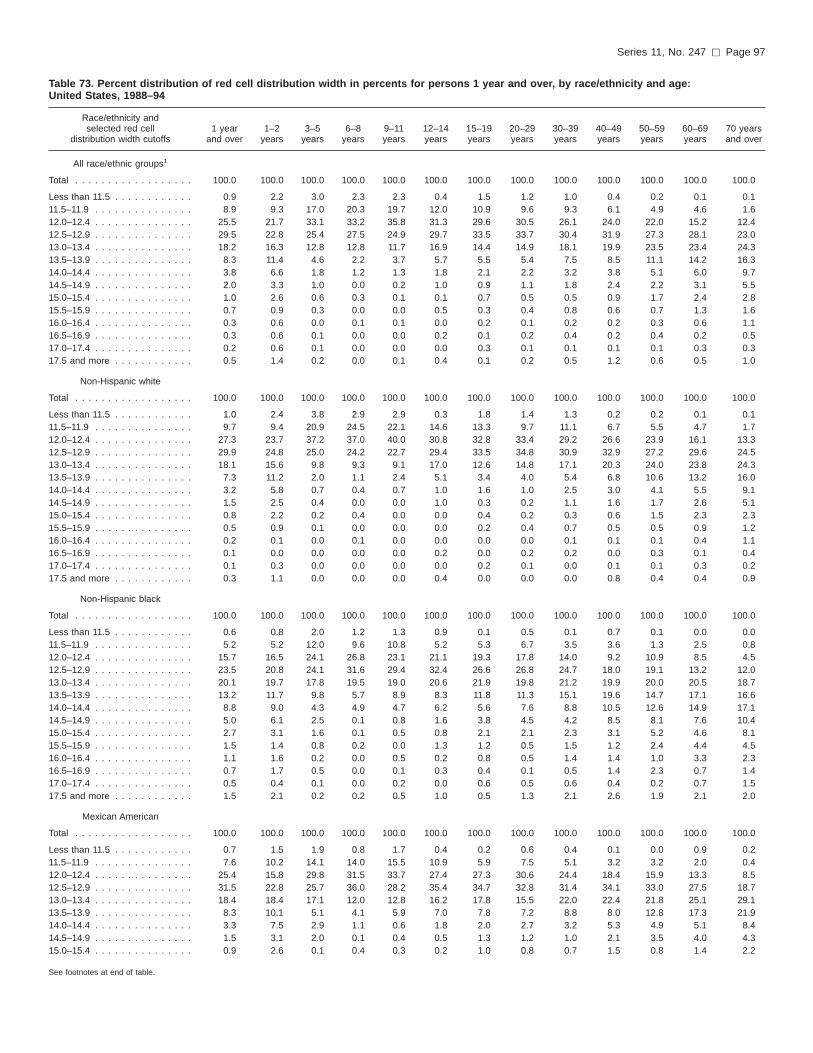
Table 73. Percent distribution of red cell distribution width in percents for persons 1 year and over, by race/ethnicity and age:United States, 1988–94
Race/ethnicity andselected red cell
distribution width cutoffs1 year
and over1–2
years3–5
years6–8
years9–11years
12–14years
15–19years
20–29years
30–39years
40–49years
50–59years
60–69years
70 yearsand over
All race/ethnic groups1
Total . . . . . . . . . . . . . . . . . . 100.0 100.0 100.0 100.0 100.0 100.0 100.0 100.0 100.0 100.0 100.0 100.0 100.0
Less than 11.5 . . . . . . . . . . . . 0.9 2.2 3.0 2.3 2.3 0.4 1.5 1.2 1.0 0.4 0.2 0.1 0.111.5–11.9 . . . . . . . . . . . . . . . 8.9 9.3 17.0 20.3 19.7 12.0 10.9 9.6 9.3 6.1 4.9 4.6 1.612.0–12.4 . . . . . . . . . . . . . . . 25.5 21.7 33.1 33.2 35.8 31.3 29.6 30.5 26.1 24.0 22.0 15.2 12.412.5–12.9 . . . . . . . . . . . . . . . 29.5 22.8 25.4 27.5 24.9 29.7 33.5 33.7 30.4 31.9 27.3 28.1 23.013.0–13.4 . . . . . . . . . . . . . . . 18.2 16.3 12.8 12.8 11.7 16.9 14.4 14.9 18.1 19.9 23.5 23.4 24.313.5–13.9 . . . . . . . . . . . . . . . 8.3 11.4 4.6 2.2 3.7 5.7 5.5 5.4 7.5 8.5 11.1 14.2 16.314.0–14.4 . . . . . . . . . . . . . . . 3.8 6.6 1.8 1.2 1.3 1.8 2.1 2.2 3.2 3.8 5.1 6.0 9.714.5–14.9 . . . . . . . . . . . . . . . 2.0 3.3 1.0 0.0 0.2 1.0 0.9 1.1 1.8 2.4 2.2 3.1 5.515.0–15.4 . . . . . . . . . . . . . . . 1.0 2.6 0.6 0.3 0.1 0.1 0.7 0.5 0.5 0.9 1.7 2.4 2.815.5–15.9 . . . . . . . . . . . . . . . 0.7 0.9 0.3 0.0 0.0 0.5 0.3 0.4 0.8 0.6 0.7 1.3 1.616.0–16.4 . . . . . . . . . . . . . . . 0.3 0.6 0.0 0.1 0.1 0.0 0.2 0.1 0.2 0.2 0.3 0.6 1.116.5–16.9 . . . . . . . . . . . . . . . 0.3 0.6 0.1 0.0 0.0 0.2 0.1 0.2 0.4 0.2 0.4 0.2 0.517.0–17.4 . . . . . . . . . . . . . . . 0.2 0.6 0.1 0.0 0.0 0.0 0.3 0.1 0.1 0.1 0.1 0.3 0.317.5 and more . . . . . . . . . . . . 0.5 1.4 0.2 0.0 0.1 0.4 0.1 0.2 0.5 1.2 0.6 0.5 1.0
Non-Hispanic white
Total . . . . . . . . . . . . . . . . . . 100.0 100.0 100.0 100.0 100.0 100.0 100.0 100.0 100.0 100.0 100.0 100.0 100.0
Less than 11.5 . . . . . . . . . . . . 1.0 2.4 3.8 2.9 2.9 0.3 1.8 1.4 1.3 0.2 0.2 0.1 0.111.5–11.9 . . . . . . . . . . . . . . . 9.7 9.4 20.9 24.5 22.1 14.6 13.3 9.7 11.1 6.7 5.5 4.7 1.712.0–12.4 . . . . . . . . . . . . . . . 27.3 23.7 37.2 37.0 40.0 30.8 32.8 33.4 29.2 26.6 23.9 16.1 13.312.5–12.9 . . . . . . . . . . . . . . . 29.9 24.8 25.0 24.2 22.7 29.4 33.5 34.8 30.9 32.9 27.2 29.6 24.513.0–13.4 . . . . . . . . . . . . . . . 18.1 15.6 9.8 9.3 9.1 17.0 12.6 14.8 17.1 20.3 24.0 23.8 24.313.5–13.9 . . . . . . . . . . . . . . . 7.3 11.2 2.0 1.1 2.4 5.1 3.4 4.0 5.4 6.8 10.6 13.2 16.014.0–14.4 . . . . . . . . . . . . . . . 3.2 5.8 0.7 0.4 0.7 1.0 1.6 1.0 2.5 3.0 4.1 5.5 9.114.5–14.9 . . . . . . . . . . . . . . . 1.5 2.5 0.4 0.0 0.0 1.0 0.3 0.2 1.1 1.6 1.7 2.6 5.115.0–15.4 . . . . . . . . . . . . . . . 0.8 2.2 0.2 0.4 0.0 0.0 0.4 0.2 0.3 0.6 1.5 2.3 2.315.5–15.9 . . . . . . . . . . . . . . . 0.5 0.9 0.1 0.0 0.0 0.0 0.2 0.4 0.7 0.5 0.5 0.9 1.216.0–16.4 . . . . . . . . . . . . . . . 0.2 0.1 0.0 0.1 0.0 0.0 0.0 0.0 0.1 0.1 0.1 0.4 1.116.5–16.9 . . . . . . . . . . . . . . . 0.1 0.0 0.0 0.0 0.0 0.2 0.0 0.2 0.2 0.0 0.3 0.1 0.417.0–17.4 . . . . . . . . . . . . . . . 0.1 0.3 0.0 0.0 0.0 0.0 0.2 0.1 0.0 0.1 0.1 0.3 0.217.5 and more . . . . . . . . . . . . 0.3 1.1 0.0 0.0 0.0 0.4 0.0 0.0 0.0 0.8 0.4 0.4 0.9
Non-Hispanic black
Total . . . . . . . . . . . . . . . . . . 100.0 100.0 100.0 100.0 100.0 100.0 100.0 100.0 100.0 100.0 100.0 100.0 100.0
Less than 11.5 . . . . . . . . . . . . 0.6 0.8 2.0 1.2 1.3 0.9 0.1 0.5 0.1 0.7 0.1 0.0 0.011.5–11.9 . . . . . . . . . . . . . . . 5.2 5.2 12.0 9.6 10.8 5.2 5.3 6.7 3.5 3.6 1.3 2.5 0.812.0–12.4 . . . . . . . . . . . . . . . 15.7 16.5 24.1 26.8 23.1 21.1 19.3 17.8 14.0 9.2 10.9 8.5 4.512.5–12.9 . . . . . . . . . . . . . . . 23.5 20.8 24.1 31.6 29.4 32.4 26.6 26.8 24.7 18.0 19.1 13.2 12.013.0–13.4 . . . . . . . . . . . . . . . 20.1 19.7 17.8 19.5 19.0 20.6 21.9 19.8 21.2 19.9 20.0 20.5 18.713.5–13.9 . . . . . . . . . . . . . . . 13.2 11.7 9.8 5.7 8.9 8.3 11.8 11.3 15.1 19.6 14.7 17.1 16.614.0–14.4 . . . . . . . . . . . . . . . 8.8 9.0 4.3 4.9 4.7 6.2 5.6 7.6 8.8 10.5 12.6 14.9 17.114.5–14.9 . . . . . . . . . . . . . . . 5.0 6.1 2.5 0.1 0.8 1.6 3.8 4.5 4.2 8.5 8.1 7.6 10.415.0–15.4 . . . . . . . . . . . . . . . 2.7 3.1 1.6 0.1 0.5 0.8 2.1 2.1 2.3 3.1 5.2 4.6 8.115.5–15.9 . . . . . . . . . . . . . . . 1.5 1.4 0.8 0.2 0.0 1.3 1.2 0.5 1.5 1.2 2.4 4.4 4.516.0–16.4 . . . . . . . . . . . . . . . 1.1 1.6 0.2 0.0 0.5 0.2 0.8 0.5 1.4 1.4 1.0 3.3 2.316.5–16.9 . . . . . . . . . . . . . . . 0.7 1.7 0.5 0.0 0.1 0.3 0.4 0.1 0.5 1.4 2.3 0.7 1.417.0–17.4 . . . . . . . . . . . . . . . 0.5 0.4 0.1 0.0 0.2 0.0 0.6 0.5 0.6 0.4 0.2 0.7 1.517.5 and more . . . . . . . . . . . . 1.5 2.1 0.2 0.2 0.5 1.0 0.5 1.3 2.1 2.6 1.9 2.1 2.0
Mexican American
Total . . . . . . . . . . . . . . . . . . 100.0 100.0 100.0 100.0 100.0 100.0 100.0 100.0 100.0 100.0 100.0 100.0 100.0
Less than 11.5 . . . . . . . . . . . . 0.7 1.5 1.9 0.8 1.7 0.4 0.2 0.6 0.4 0.1 0.0 0.9 0.211.5–11.9 . . . . . . . . . . . . . . . 7.6 10.2 14.1 14.0 15.5 10.9 5.9 7.5 5.1 3.2 3.2 2.0 0.412.0–12.4 . . . . . . . . . . . . . . . 25.4 15.8 29.8 31.5 33.7 27.4 27.3 30.6 24.4 18.4 15.9 13.3 8.512.5–12.9 . . . . . . . . . . . . . . . 31.5 22.8 25.7 36.0 28.2 35.4 34.7 32.8 31.4 34.1 33.0 27.5 18.713.0–13.4 . . . . . . . . . . . . . . . 18.4 18.4 17.1 12.0 12.8 16.2 17.8 15.5 22.0 22.4 21.8 25.1 29.113.5–13.9 . . . . . . . . . . . . . . . 8.3 10.1 5.1 4.1 5.9 7.0 7.8 7.2 8.8 8.0 12.8 17.3 21.914.0–14.4 . . . . . . . . . . . . . . . 3.3 7.5 2.9 1.1 0.6 1.8 2.0 2.7 3.2 5.3 4.9 5.1 8.414.5–14.9 . . . . . . . . . . . . . . . 1.5 3.1 2.0 0.1 0.4 0.5 1.3 1.2 1.0 2.1 3.5 4.0 4.315.0–15.4 . . . . . . . . . . . . . . . 0.9 2.6 0.1 0.4 0.3 0.2 1.0 0.8 0.7 1.5 0.8 1.4 2.2
See footnotes at end of table.
Series 11, No. 247 [ Page 97
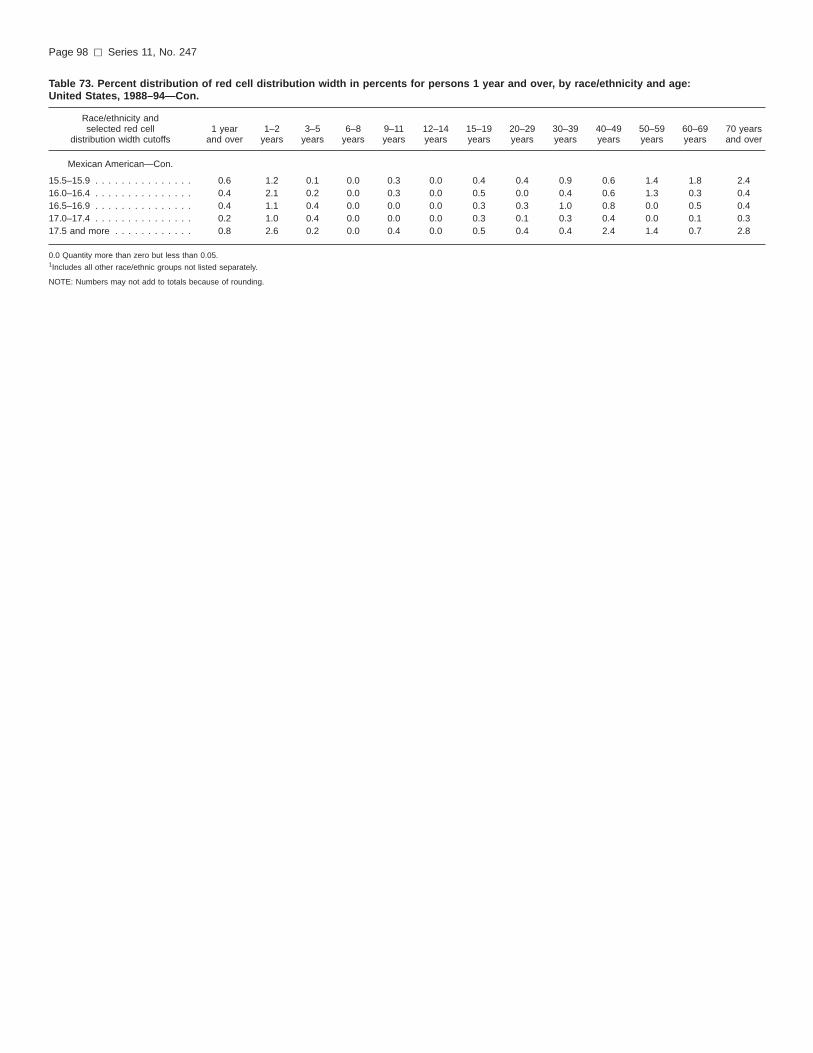
Table 73. Percent distribution of red cell distribution width in percents for persons 1 year and over, by race/ethnicity and age:United States, 1988–94—Con.
Race/ethnicity andselected red cell
distribution width cutoffs1 year
and over1–2
years3–5
years6–8
years9–11years
12–14years
15–19years
20–29years
30–39years
40–49years
50–59years
60–69years
70 yearsand over
Mexican American—Con.
15.5–15.9 . . . . . . . . . . . . . . . 0.6 1.2 0.1 0.0 0.3 0.0 0.4 0.4 0.9 0.6 1.4 1.8 2.416.0–16.4 . . . . . . . . . . . . . . . 0.4 2.1 0.2 0.0 0.3 0.0 0.5 0.0 0.4 0.6 1.3 0.3 0.416.5–16.9 . . . . . . . . . . . . . . . 0.4 1.1 0.4 0.0 0.0 0.0 0.3 0.3 1.0 0.8 0.0 0.5 0.417.0–17.4 . . . . . . . . . . . . . . . 0.2 1.0 0.4 0.0 0.0 0.0 0.3 0.1 0.3 0.4 0.0 0.1 0.317.5 and more . . . . . . . . . . . . 0.8 2.6 0.2 0.0 0.4 0.0 0.5 0.4 0.4 2.4 1.4 0.7 2.8
0.0 Quantity more than zero but less than 0.05.1Includes all other race/ethnic groups not listed separately.
NOTE: Numbers may not add to totals because of rounding.
Page 98 [ Series 11, No. 247

Table 74. Percent distribution of red cell distribution width in percents for males 1 year and over, by race/ethnicity and age:United States, 1988–94
Race/ethnicity andselected red cell
distribution width cutoffs1 year
and over1–2
years3–5
years6–8
years9–11years
12–14years
15–19years
20–29years
30–39years
40–49years
50–59years
60–69years
70 yearsand over
All race/ethnic groups1
Total . . . . . . . . . . . . . . . . . . 100.0 100.0 100.0 100.0 100.0 100.0 100.0 100.0 100.0 100.0 100.0 100.0 100.0
Less than 11.5 . . . . . . . . . . . . 0.7 1.0 0.9 1.0 0.8 0.1 2.0 0.8 1.4 0.1 0.0 0.1 0.011.5–11.9 . . . . . . . . . . . . . . . 8.0 7.3 12.0 14.2 15.5 7.9 8.6 9.6 9.5 6.1 5.0 3.3 2.012.0–12.4 . . . . . . . . . . . . . . . 25.5 18.3 32.0 31.2 36.7 27.1 28.4 33.2 26.5 24.6 22.1 12.9 8.612.5–12.9 . . . . . . . . . . . . . . . 31.8 24.5 28.1 34.5 29.4 35.0 40.1 33.7 31.9 34.1 27.9 30.0 23.513.0–13.4 . . . . . . . . . . . . . . . 18.7 16.2 15.5 14.5 11.0 18.9 14.9 16.2 19.5 20.4 22.8 23.2 22.713.5–13.9 . . . . . . . . . . . . . . . 8.0 12.7 6.9 2.3 4.6 7.3 3.3 4.0 6.2 8.1 11.9 16.5 17.014.0–14.4 . . . . . . . . . . . . . . . 3.2 7.3 2.1 1.7 1.3 1.7 2.1 1.3 2.2 3.8 3.6 6.2 9.514.5–14.9 . . . . . . . . . . . . . . . 1.9 4.2 1.1 0.0 0.3 0.7 0.5 0.8 1.6 1.6 2.9 2.9 7.615.0–15.4 . . . . . . . . . . . . . . . 0.9 2.9 0.7 0.5 0.1 0.2 0.0 0.1 0.5 0.4 2.1 1.9 3.415.5–15.9 . . . . . . . . . . . . . . . 0.5 1.2 0.2 0.0 0.0 0.6 0.1 0.0 0.2 0.1 0.8 1.1 2.316.0–16.4 . . . . . . . . . . . . . . . 0.3 0.9 0.0 0.2 0.1 0.0 0.0 0.0 0.1 0.1 0.2 0.9 1.416.5–16.9 . . . . . . . . . . . . . . . 0.2 0.5 0.2 0.0 0.0 0.0 0.0 0.2 0.2 0.1 0.3 0.3 0.417.0–17.4 . . . . . . . . . . . . . . . 0.1 0.9 0.1 0.0 0.0 0.0 0.0 0.0 0.0 0.0 0.0 0.5 0.417.5 and more . . . . . . . . . . . . 0.3 2.0 0.1 0.0 0.2 0.2 0.0 0.0 0.1 0.5 0.5 0.4 1.1
Non-Hispanic white
Total . . . . . . . . . . . . . . . . . . 100.0 100.0 100.0 100.0 100.0 100.0 100.0 100.0 100.0 100.0 100.0 100.0 100.0
Less than 11.5 . . . . . . . . . . . . 0.7 0.8 1.0 0.8 1.2 0.0 3.1 0.5 1.8 0.0 0.0 0.1 0.011.5–11.9 . . . . . . . . . . . . . . . 8.6 7.6 15.0 17.3 15.6 9.3 9.5 9.7 10.8 6.6 5.6 3.7 2.312.0–12.4 . . . . . . . . . . . . . . . 27.5 19.7 37.6 36.1 44.6 29.0 31.0 37.6 28.9 26.8 23.7 12.8 8.612.5–12.9 . . . . . . . . . . . . . . . 31.5 27.5 28.8 31.2 27.0 35.0 39.7 32.1 32.3 34.0 27.9 31.7 24.713.0–13.4 . . . . . . . . . . . . . . . 18.5 15.8 12.4 11.8 8.1 17.8 13.3 16.4 18.4 21.1 23.2 23.4 23.213.5–13.9 . . . . . . . . . . . . . . . 7.1 13.0 3.5 1.3 3.3 7.1 1.9 2.8 3.9 6.6 11.1 16.5 17.314.0–14.4 . . . . . . . . . . . . . . . 2.7 6.4 0.9 0.6 0.2 0.7 1.6 0.3 1.8 3.0 2.8 5.7 9.214.5–14.9 . . . . . . . . . . . . . . . 1.6 3.1 0.5 0.0 0.0 0.5 0.0 0.3 1.4 1.2 2.6 2.3 7.115.0–15.4 . . . . . . . . . . . . . . . 0.8 2.6 0.3 0.7 0.0 0.0 0.0 0.0 0.3 0.2 2.0 1.7 2.815.5–15.9 . . . . . . . . . . . . . . . 0.4 1.1 0.0 0.0 0.0 0.6 0.0 0.0 0.2 0.0 0.7 0.9 1.716.0–16.4 . . . . . . . . . . . . . . . 0.2 0.1 0.0 0.3 0.0 0.0 0.0 0.0 0.0 0.0 0.0 0.5 1.416.5–16.9 . . . . . . . . . . . . . . . 0.1 0.0 0.0 0.0 0.0 0.0 0.0 0.3 0.2 0.0 0.1 0.2 0.417.0–17.4 . . . . . . . . . . . . . . . 0.1 0.5 0.0 0.0 0.0 0.0 0.0 0.0 0.0 0.0 0.0 0.4 0.317.5 and more . . . . . . . . . . . . 0.2 1.8 0.0 0.0 0.0 0.0 0.0 0.0 0.0 0.5 0.3 0.0 1.0
Non-Hispanic black
Total . . . . . . . . . . . . . . . . . . 100.0 100.0 100.0 100.0 100.0 100.0 100.0 100.0 100.0 100.0 100.0 100.0 100.0
Less than 11.5 . . . . . . . . . . . . 0.6 0.3 1.2 1.3 0.5 1.2 0.1 0.9 0.0 1.2 0.0 0.0 0.011.5–11.9 . . . . . . . . . . . . . . . 5.6 4.5 9.6 8.5 10.5 3.7 6.6 7.9 4.3 4.4 1.5 2.6 0.612.0–12.4 . . . . . . . . . . . . . . . 15.2 14.4 22.0 21.7 19.6 14.1 22.9 19.3 13.3 7.5 10.4 7.3 4.312.5–12.9 . . . . . . . . . . . . . . . 25.6 18.1 21.8 35.2 28.9 31.2 29.4 31.2 26.3 22.3 19.6 12.2 15.113.0–13.4 . . . . . . . . . . . . . . . 21.1 18.0 19.8 21.6 22.3 24.4 24.2 21.5 23.2 20.8 16.8 18.9 13.113.5–13.9 . . . . . . . . . . . . . . . 12.5 13.3 14.3 4.6 10.1 9.5 7.9 8.0 15.5 19.4 16.8 15.5 14.514.0–14.4 . . . . . . . . . . . . . . . 8.4 10.1 4.5 6.6 5.4 7.7 5.0 5.9 7.4 12.0 12.7 14.8 15.714.5–14.9 . . . . . . . . . . . . . . . 4.6 8.8 3.3 0.0 0.8 2.9 2.8 3.7 3.8 6.1 8.5 8.7 12.315.0–15.4 . . . . . . . . . . . . . . . 2.3 2.1 1.2 0.2 0.4 1.6 0.0 0.8 2.5 2.6 5.6 4.9 11.215.5–15.9 . . . . . . . . . . . . . . . 1.2 1.6 1.0 0.0 0.0 1.4 0.9 0.3 0.9 1.4 1.9 3.4 4.416.0–16.4 . . . . . . . . . . . . . . . 1.0 2.4 0.0 0.0 0.5 0.4 0.2 0.2 1.0 0.9 1.6 5.7 3.316.5–16.9 . . . . . . . . . . . . . . . 0.6 1.9 0.9 0.0 0.2 0.3 0.0 0.0 0.2 0.7 2.2 1.2 1.417.0–17.4 . . . . . . . . . . . . . . . 0.3 0.6 0.0 0.0 0.0 0.0 0.0 0.0 0.3 0.2 0.0 1.4 1.817.5 and more . . . . . . . . . . . . 1.2 3.9 0.4 0.3 0.9 1.7 0.0 0.4 1.4 0.5 2.4 3.4 2.4
Mexican American
Total . . . . . . . . . . . . . . . . . . 100.0 100.0 100.0 100.0 100.0 100.0 100.0 100.0 100.0 100.0 100.0 100.0 100.0
Less than 11.5 . . . . . . . . . . . . 0.4 0.7 1.3 1.0 0.2 0.0 0.0 0.6 0.4 0.0 0.0 0.0 0.011.5–11.9 . . . . . . . . . . . . . . . 5.8 5.1 9.7 7.1 12.1 5.2 4.8 8.2 3.9 1.8 1.7 0.8 0.812.0–12.4 . . . . . . . . . . . . . . . 25.4 13.2 24.9 27.3 38.3 24.4 24.6 30.9 28.7 18.8 11.0 16.1 6.812.5–12.9 . . . . . . . . . . . . . . . 35.8 23.9 31.3 46.5 28.7 36.2 40.0 36.4 35.4 41.4 40.5 26.0 19.813.0–13.4 . . . . . . . . . . . . . . . 19.0 18.0 20.5 12.1 12.4 21.2 18.8 15.4 23.1 23.4 22.1 22.3 26.313.5–13.9 . . . . . . . . . . . . . . . 7.7 12.8 5.3 3.6 4.6 9.8 8.7 6.3 6.0 7.1 9.7 20.6 24.614.0–14.4 . . . . . . . . . . . . . . . 3.0 8.9 3.0 2.2 1.2 2.7 1.8 1.7 1.6 4.8 7.0 5.8 7.014.5–14.9 . . . . . . . . . . . . . . . 1.0 4.8 2.3 0.2 0.8 0.0 0.5 0.5 0.8 0.7 2.0 2.2 4.615.0–15.4 . . . . . . . . . . . . . . . 0.4 1.6 0.1 0.0 0.3 0.5 0.3 0.0 0.0 0.1 1.4 1.8 3.0
See footnotes at end of table.
Series 11, No. 247 [ Page 99

Table 74. Percent distribution of red cell distribution width in percents for males 1 year and over, by race/ethnicity and age:United States, 1988–94—Con.
Race/ethnicity andselected red cell
distribution width cutoffs1 year
and over1–2
years3–5
years6–8
years9–11years
12–14years
15–19years
20–29years
30–39years
40–49years
50–59years
60–69years
70 yearsand over
Mexican American—Con.
15.5–15.9 . . . . . . . . . . . . . . . 0.4 1.9 0.2 0.0 0.5 0.0 0.0 0.0 0.0 0.2 2.5 2.7 2.516.0–16.4 . . . . . . . . . . . . . . . 0.2 3.0 0.0 0.0 0.5 0.0 0.0 0.0 0.1 0.0 0.9 0.4 0.516.5–16.9 . . . . . . . . . . . . . . . 0.2 1.7 0.6 0.0 0.0 0.0 0.5 0.0 0.2 0.0 0.0 0.6 0.817.0–17.4 . . . . . . . . . . . . . . . 0.1 1.5 0.7 0.0 0.0 0.0 0.0 0.0 0.0 0.1 0.0 0.2 0.317.5 and more . . . . . . . . . . . . 0.5 2.9 0.3 0.0 0.5 0.0 0.0 0.0 0.0 1.6 1.1 0.6 2.9
0.0 Quantity more than zero but less than 0.05.1Includes all other race/ethnic groups not listed separately.
NOTE: Numbers may not add to totals because of rounding.
Page 100 [ Series 11, No. 247

Table 75. Percent distribution of red cell distribution width in percents for females 1 year and over, by race/ethnicity and age:United States, 1988–94
Race/ethnicity andselected red cell
distribution width cutoffs1 year
and over1–2
years3–5
years6–8
years9–11years
12–14years
15–19years
20–29years
30–39years
40–49years
50–59years
60–69years
70 yearsand over
All race/ethnic groups1
Total . . . . . . . . . . . . . . . . . . 100.0 100.0 100.0 100.0 100.0 100.0 100.0 100.0 100.0 100.0 100.0 100.0 100.0
Less than 11.5 . . . . . . . . . . . . 1.2 3.5 5.2 3.8 3.7 0.6 1.0 1.6 0.6 0.6 0.3 0.2 0.111.5–11.9 . . . . . . . . . . . . . . . 9.8 11.4 22.3 27.4 24.0 16.6 13.2 9.6 9.2 6.1 4.8 5.7 1.312.0–12.4 . . . . . . . . . . . . . . . 25.4 25.4 34.2 35.4 34.9 35.9 30.8 27.8 25.6 23.4 21.8 17.2 15.012.5–12.9 . . . . . . . . . . . . . . . 27.3 20.7 22.5 19.4 20.4 23.8 27.0 33.7 28.9 29.7 26.7 26.5 22.713.0–13.4 . . . . . . . . . . . . . . . 17.8 16.4 10.0 11.0 12.4 14.7 14.0 13.7 16.8 19.4 24.1 23.5 25.313.5–13.9 . . . . . . . . . . . . . . . 8.6 9.9 2.2 2.1 2.8 4.0 7.7 6.7 8.7 8.9 10.4 12.3 15.814.0–14.4 . . . . . . . . . . . . . . . 4.3 5.7 1.5 0.7 1.4 1.8 2.1 3.1 4.2 3.7 6.5 5.8 9.814.5–14.9 . . . . . . . . . . . . . . . 2.1 2.3 0.9 0.0 0.2 1.2 1.2 1.3 2.1 3.1 1.6 3.3 4.115.0–15.4 . . . . . . . . . . . . . . . 1.2 2.2 0.4 0.1 0.1 0.0 1.3 0.8 0.6 1.3 1.3 2.9 2.415.5–15.9 . . . . . . . . . . . . . . . 0.9 0.6 0.4 0.1 0.0 0.5 0.5 0.8 1.4 1.0 0.6 1.4 1.116.0–16.4 . . . . . . . . . . . . . . . 0.3 0.3 0.1 0.0 0.1 0.0 0.3 0.1 0.3 0.4 0.4 0.4 0.916.5–16.9 . . . . . . . . . . . . . . . 0.3 0.6 0.0 0.0 0.0 0.3 0.1 0.3 0.6 0.3 0.6 0.0 0.517.0–17.4 . . . . . . . . . . . . . . . 0.2 0.3 0.0 0.0 0.1 0.0 0.5 0.2 0.2 0.2 0.2 0.2 0.117.5 and more 0.7 0.6 0.2 0.0 0.0 0.6 0.2 0.4 0.8 1.8 0.7 0.7 0.9
Non-Hispanic white
Total . . . . . . . . . . . . . . . . . . 100.0 100.0 100.0 100.0 100.0 100.0 100.0 100.0 100.0 100.0 100.0 100.0 100.0
Less than 11.5 . . . . . . . . . . . . 1.3 4.3 7.0 5.4 4.6 0.6 0.6 2.2 0.7 0.4 0.4 0.1 0.111.5–11.9 . . . . . . . . . . . . . . . 10.7 11.6 27.5 33.0 28.5 21.1 17.0 9.6 11.5 6.7 5.5 5.6 1.312.0–12.4 . . . . . . . . . . . . . . . 27.1 28.3 36.7 38.1 35.6 33.0 34.6 29.3 29.4 26.5 24.0 19.0 16.412.5–12.9 . . . . . . . . . . . . . . . 28.3 21.8 20.8 16.0 18.6 22.4 27.3 37.3 29.5 31.7 26.5 27.8 24.413.0–13.4 . . . . . . . . . . . . . . . 17.7 15.3 6.8 6.4 10.1 16.1 11.8 13.3 15.9 19.4 24.7 24.1 25.013.5–13.9 . . . . . . . . . . . . . . . 7.4 9.2 0.3 0.9 1.6 2.6 5.0 5.1 7.0 6.9 10.1 10.4 15.114.0–14.4 . . . . . . . . . . . . . . . 3.6 5.1 0.5 0.3 1.1 1.4 1.6 1.7 3.2 3.0 5.3 5.3 9.014.5–14.9 . . . . . . . . . . . . . . . 1.4 1.9 0.2 0.0 0.0 1.6 0.5 0.1 0.8 2.0 0.8 3.0 3.815.0–15.4 . . . . . . . . . . . . . . . 0.9 1.7 0.0 0.0 0.0 0.0 0.8 0.3 0.3 1.1 1.0 2.8 2.015.5–15.9 . . . . . . . . . . . . . . . 0.7 0.6 0.2 0.0 0.0 0.0 0.3 0.7 1.2 1.0 0.3 1.0 0.816.0–16.4 . . . . . . . . . . . . . . . 0.2 0.0 0.0 0.0 0.0 0.0 0.0 0.0 0.1 0.1 0.2 0.3 0.816.5–16.9 . . . . . . . . . . . . . . . 0.2 0.0 0.0 0.0 0.0 0.4 0.0 0.2 0.2 0.0 0.4 0.0 0.417.0–17.4 . . . . . . . . . . . . . . . 0.1 0.0 0.0 0.0 0.0 0.0 0.4 0.1 0.1 0.2 0.2 0.2 0.117.5 and more . . . . . . . . . . . . 0.4 0.3 0.0 0.0 0.0 0.9 0.0 0.0 0.0 1.1 0.5 0.7 0.8
Non-Hispanic black
Total . . . . . . . . . . . . . . . . . . 100.0 100.0 100.0 100.0 100.0 100.0 100.0 100.0 100.0 100.0 100.0 100.0 100.0
Less than 11.5 . . . . . . . . . . . . 0.6 1.3 1.3 1.3 1.3 1.3 1.3 1.3 1.3 1.3 1.3 1.3 1.311.5–11.9 . . . . . . . . . . . . . . . 4.9 1.3 1.3 1.3 1.3 1.3 1.3 1.3 1.3 1.3 1.3 1.3 1.312.0–12.4 . . . . . . . . . . . . . . . 16.2 18.5 26.3 31.8 26.7 27.1 15.7 16.5 14.6 10.5 11.4 9.3 4.612.5–12.9 . . . . . . . . . . . . . . . 21.8 23.5 26.4 28.0 29.9 33.4 23.7 23.0 23.4 14.6 18.7 13.9 10.013.0–13.4 . . . . . . . . . . . . . . . 19.2 21.3 15.8 17.3 15.6 17.4 19.5 18.4 19.6 19.1 22.7 21.6 22.313.5–13.9 . . . . . . . . . . . . . . . 13.8 10.2 5.3 6.7 7.8 7.3 15.8 14.2 14.7 19.7 13.0 18.3 18.014.0–14.4 . . . . . . . . . . . . . . . 9.1 7.9 4.1 3.3 4.1 4.8 6.2 9.1 10.0 9.4 12.6 15.0 18.114.5–14.9 . . . . . . . . . . . . . . . 5.3 3.5 1.7 0.3 0.9 0.6 4.8 5.1 4.6 10.3 7.8 6.9 9.215.0–15.4 . . . . . . . . . . . . . . . 3.0 4.0 2.1 0.0 0.7 0.2 4.2 3.1 2.1 3.6 4.9 4.4 6.115.5–15.9 . . . . . . . . . . . . . . . 1.7 1.2 0.6 0.5 0.0 1.3 1.6 0.7 2.0 1.1 2.8 5.1 4.616.0–16.4 . . . . . . . . . . . . . . . 1.1 0.8 0.3 0.0 0.6 0.0 1.3 0.7 1.7 1.7 0.5 1.5 1.716.5–16.9 . . . . . . . . . . . . . . . 0.8 1.4 0.0 0.0 0.0 0.3 0.8 0.3 0.8 1.8 2.4 0.3 1.517.0–17.4 . . . . . . . . . . . . . . . 0.7 0.2 0.2 0.0 0.4 0.0 1.2 1.0 0.8 0.5 0.3 0.3 1.317.5 and more . . . . . . . . . . . . 1.8 0.4 0.0 0.0 0.0 0.5 1.1 2.1 2.6 4.3 1.5 1.1 1.7
Mexican American
Total . . . . . . . . . . . . . . . . . . 100.0 100.0 100.0 100.0 100.0 100.0 100.0 100.0 100.0 100.0 100.0 100.0 100.0
Less than 11.5 . . . . . . . . . . . . 1.0 2.5 2.5 0.6 3.5 0.7 0.5 0.7 0.5 0.2 0.0 1.7 0.311.5–11.9 . . . . . . . . . . . . . . . 9.5 15.7 18.6 20.7 19.4 15.8 7.0 6.6 6.4 4.6 4.7 3.0 0.012.0–12.4 . . . . . . . . . . . . . . . 25.3 18.6 34.7 35.5 28.4 30.0 30.3 30.2 19.7 18.0 20.6 11.1 10.212.5–12.9 . . . . . . . . . . . . . . . 26.9 21.6 20.0 26.0 27.5 34.7 28.8 28.1 27.1 26.3 25.7 28.7 17.613.0–13.4 . . . . . . . . . . . . . . . 17.8 18.8 13.8 11.9 13.3 12.0 16.8 15.6 20.9 21.3 21.5 27.3 31.813.5–13.9 . . . . . . . . . . . . . . . 9.0 7.3 4.9 4.6 7.5 4.7 6.8 8.4 11.9 8.9 15.6 14.7 19.214.0–14.4 . . . . . . . . . . . . . . . 3.6 5.9 2.9 0.0 0.0 1.1 2.2 3.9 5.0 5.9 2.9 4.6 9.714.5–14.9 . . . . . . . . . . . . . . . 2.1 1.2 1.7 0.0 0.0 0.9 2.2 2.1 1.2 3.7 5.0 5.3 4.115.0–15.4 . . . . . . . . . . . . . . . 1.4 3.6 0.1 0.7 0.2 0.0 1.7 1.8 1.4 3.0 0.3 1.1 1.5
See footnotes at end of table.
Series 11, No. 247 [ Page 101
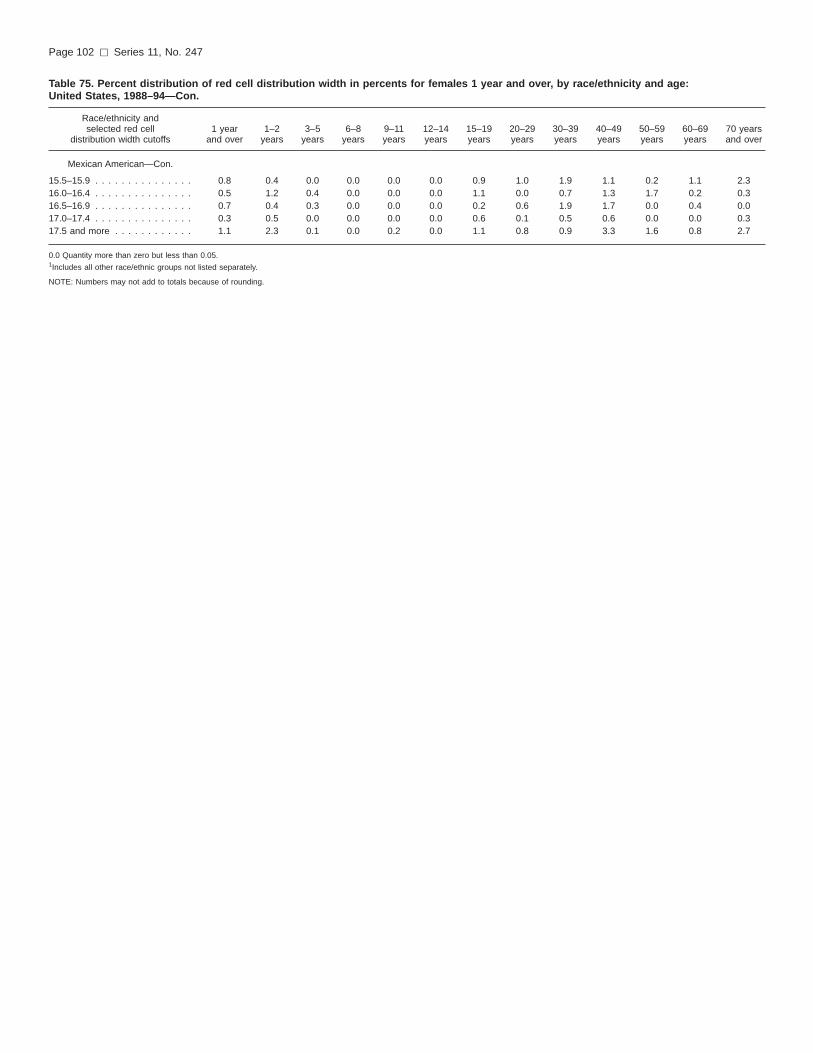
Table 75. Percent distribution of red cell distribution width in percents for females 1 year and over, by race/ethnicity and age:United States, 1988–94—Con.
Race/ethnicity andselected red cell
distribution width cutoffs1 year
and over1–2
years3–5
years6–8
years9–11years
12–14years
15–19years
20–29years
30–39years
40–49years
50–59years
60–69years
70 yearsand over
Mexican American—Con.
15.5–15.9 . . . . . . . . . . . . . . . 0.8 0.4 0.0 0.0 0.0 0.0 0.9 1.0 1.9 1.1 0.2 1.1 2.316.0–16.4 . . . . . . . . . . . . . . . 0.5 1.2 0.4 0.0 0.0 0.0 1.1 0.0 0.7 1.3 1.7 0.2 0.316.5–16.9 . . . . . . . . . . . . . . . 0.7 0.4 0.3 0.0 0.0 0.0 0.2 0.6 1.9 1.7 0.0 0.4 0.017.0–17.4 . . . . . . . . . . . . . . . 0.3 0.5 0.0 0.0 0.0 0.0 0.6 0.1 0.5 0.6 0.0 0.0 0.317.5 and more . . . . . . . . . . . . 1.1 2.3 0.1 0.0 0.2 0.0 1.1 0.8 0.9 3.3 1.6 0.8 2.7
0.0 Quantity more than zero but less than 0.05.1Includes all other race/ethnic groups not listed separately.
NOTE: Numbers may not add to totals because of rounding.
Page 102 [ Series 11, No. 247

Table 76. Percent distribution of platelet count as 109 cells per liter for persons 1 year and over, by race/ethnicity and age: United States,1988–94
Race/ethnicity andselected platelet
count cutoffs1 year
and over1–2
years3–5
years6–8
years9–11years
12–14years
15–19years
20–29years
30–39years
40–49years
50–59years
60–69years
70 yearsand over
All race/ethnic groups1
Total . . . . . . . . . . . . . . . . . . 100.0 100.0 100.0 100.0 100.0 100.0 100.0 100.0 100.0 100.0 100.0 100.0 100.0
Less than 150 . . . . . . . . . . . . 1.3 0.1 0.2 0.0 0.4 0.4 0.4 1.4 1.3 1.3 1.3 2.9 3.3150–199 . . . . . . . . . . . . . . . . 8.5 0.3 1.0 0.7 0.7 3.4 5.0 9.7 8.7 11.5 9.8 11.1 16.4200–249 . . . . . . . . . . . . . . . . 25.3 4.8 5.5 9.1 14.2 19.7 28.6 28.0 29.9 28.2 25.8 29.5 30.1250–299 . . . . . . . . . . . . . . . . 28.6 17.4 17.7 23.5 27.9 31.1 32.6 30.6 30.0 28.2 31.9 28.7 24.9300–349 . . . . . . . . . . . . . . . . 19.3 21.8 28.4 28.6 30.6 26.0 20.2 19.0 16.7 16.4 18.2 16.9 13.3350–399 . . . . . . . . . . . . . . . . 9.6 22.2 22.9 20.4 14.9 12.5 8.1 7.0 8.6 9.0 7.4 6.0 5.8400–449 . . . . . . . . . . . . . . . . 3.7 13.5 13.5 9.5 6.9 4.6 3.1 1.8 2.9 2.4 2.4 1.9 2.3450–499 . . . . . . . . . . . . . . . . 1.5 8.5 5.8 4.3 3.5 1.3 0.4 1.2 0.6 0.9 0.8 1.1 0.9500–549 . . . . . . . . . . . . . . . . 0.6 5.7 2.6 1.5 0.2 0.1 0.1 0.3 0.3 0.4 0.7 0.6 0.3550 and more . . . . . . . . . . . . 0.5 4.7 1.7 1.2 0.3 0.0 0.3 0.1 0.2 0.3 0.5 0.4 0.8
Non-Hispanic white
Total . . . . . . . . . . . . . . . . . . 100.0 100.0 100.0 100.0 100.0 100.0 100.0 100.0 100.0 100.0 100.0 100.0 100.0
Less than 150 . . . . . . . . . . . . 1.4 0.0 0.3 0.0 0.4 0.6 0.4 1.3 1.4 1.1 1.0 2.9 3.5150–199 . . . . . . . . . . . . . . . . 9.1 0.3 0.9 0.7 0.8 4.0 4.6 10.2 9.0 12.5 9.6 10.9 16.4200–249 . . . . . . . . . . . . . . . . 26.9 4.9 5.9 8.8 16.0 21.5 31.4 29.9 32.1 29.0 25.5 30.4 30.1250–299 . . . . . . . . . . . . . . . . 28.7 17.5 19.7 24.6 29.2 30.5 32.1 29.4 31.2 27.9 31.9 28.6 24.6300–349 . . . . . . . . . . . . . . . . 18.4 21.9 28.6 29.1 30.3 25.2 20.3 18.5 14.5 16.1 19.2 16.4 13.1350–399 . . . . . . . . . . . . . . . . 8.9 23.0 22.2 19.1 13.2 12.7 6.8 6.6 8.1 8.4 7.5 5.9 5.9400–449 . . . . . . . . . . . . . . . . 3.2 12.9 13.8 9.6 6.0 3.9 2.8 1.7 2.1 2.2 2.2 1.7 2.5450–499 . . . . . . . . . . . . . . . . 1.2 8.4 4.5 3.5 3.0 0.9 0.1 1.1 0.3 0.4 0.9 1.2 0.9500–549 . . . . . . . . . . . . . . . . 0.5 5.7 2.1 1.5 0.2 0.0 0.0 0.1 0.3 0.4 0.7 0.6 0.3550 and more . . . . . . . . . . . . 0.4 4.0 1.5 1.5 0.1 0.0 0.4 0.0 0.2 0.3 0.5 0.4 0.7
Non-Hispanic black
Total . . . . . . . . . . . . . . . . . . 100.0 100.0 100.0 100.0 100.0 100.0 100.0 100.0 100.0 100.0 100.0 100.0 100.0
Less than 150 . . . . . . . . . . . . 1.3 0.0 0.0 0.1 0.5 0.2 0.6 1.0 1.6 2.1 1.3 4.1 2.4150–199 . . . . . . . . . . . . . . . . 6.9 0.4 1.5 0.5 0.3 3.2 5.1 8.4 9.3 7.8 8.8 9.5 17.4200–249 . . . . . . . . . . . . . . . . 19.6 3.4 3.6 9.1 9.1 11.9 22.1 22.3 21.9 25.6 26.3 25.4 26.9250–299 . . . . . . . . . . . . . . . . 27.1 13.8 15.5 19.5 23.9 31.2 28.7 30.4 28.2 26.2 35.0 28.2 27.1300–349 . . . . . . . . . . . . . . . . 22.1 22.2 28.8 26.3 30.8 31.1 24.4 20.2 21.2 19.9 15.7 18.0 15.6350–399 . . . . . . . . . . . . . . . . 12.1 19.6 21.9 26.2 20.6 11.5 11.6 9.9 10.3 9.9 6.2 8.4 5.4400–449 . . . . . . . . . . . . . . . . 5.6 16.4 13.1 10.3 9.1 6.5 5.2 3.3 4.2 5.0 3.3 3.0 1.1450–499 . . . . . . . . . . . . . . . . 2.5 9.2 7.2 4.3 5.0 2.0 1.0 2.0 1.6 2.2 0.4 1.2 1.2500–549 . . . . . . . . . . . . . . . . 1.0 7.2 3.8 1.6 0.0 0.7 0.5 0.8 0.4 0.4 0.5 0.6 0.4550 and more . . . . . . . . . . . . 0.9 7.5 3.6 1.0 0.6 0.0 0.3 0.5 0.3 0.3 1.1 0.1 1.4
Mexican American
Total . . . . . . . . . . . . . . . . . . 100.0 100.0 100.0 100.0 100.0 100.0 100.0 100.0 100.0 100.0 100.0 100.0 100.0
Less than 150 . . . . . . . . . . . . 1.0 0.0 0.2 0.0 0.2 0.2 0.5 1.7 0.8 1.4 1.9 2.5 2.2150–199 . . . . . . . . . . . . . . . . 6.6 0.4 1.8 0.9 0.0 2.4 6.6 7.7 7.5 9.1 14.3 13.5 16.2200–249 . . . . . . . . . . . . . . . . 20.0 4.3 8.6 5.8 8.8 15.0 23.9 25.2 25.8 22.9 19.8 27.3 30.8250–299 . . . . . . . . . . . . . . . . 27.6 16.6 19.2 19.4 26.3 29.5 32.2 30.8 28.9 28.0 31.2 27.9 24.1300–349 . . . . . . . . . . . . . . . . 21.4 18.3 21.8 27.0 31.1 26.0 19.2 19.9 21.2 22.2 15.4 15.9 16.3350–399 . . . . . . . . . . . . . . . . 12.7 23.3 22.4 25.8 17.4 14.7 11.5 9.4 9.0 8.9 9.5 8.2 6.8400–449 . . . . . . . . . . . . . . . . 5.4 12.5 12.5 9.6 8.4 6.6 4.3 2.8 4.1 4.1 4.1 2.7 1.9450–499 . . . . . . . . . . . . . . . . 2.6 12.2 6.9 7.2 5.1 4.0 0.8 0.7 1.2 1.2 1.0 0.7 0.4500–549 . . . . . . . . . . . . . . . . 1.0 5.0 3.8 2.4 0.7 0.0 0.3 0.7 0.1 0.5 1.0 0.1 0.2550 and more . . . . . . . . . . . . 0.7 6.4 1.9 0.9 1.0 0.5 0.4 0.0 0.3 0.4 0.3 0.1 0.5
0.0 Quantity more than zero but less than 0.05.1Includes all other race/ethnic groups not listed separately.
NOTE: Numbers may not add to totals because of rounding.
Series 11, No. 247 [ Page 103

Table 77. Percent distribution of platelet count as 109 cells per liter for males 1 year and over, by race/ethnicity and age: United States,1988–94
Race/ethnicity andselected platelet
count cutoffs1 year
and over1–2
years3–5
years6–8
years9–11years
12–14years
15–19years
20–29years
30–39years
40–49years
50–59years
60–69years
70 yearsand over
All race/ethnic groups1
Total . . . . . . . . . . . . . . . . . . 100.0 100.0 100.0 100.0 100.0 100.0 100.0 100.0 100.0 100.0 100.0 100.0 100.0
Less than 150 . . . . . . . . . . . . 1.7 0.2 0.2 0.0 0.3 0.0 0.7 2.0 2.0 1.4 1.2 4.2 4.2150–199 . . . . . . . . . . . . . . . . 11.0 0.5 1.2 1.0 0.1 4.1 6.0 12.7 10.0 15.5 13.8 16.7 23.4200–249 . . . . . . . . . . . . . . . . 27.4 4.0 5.7 10.0 13.6 17.3 32.4 30.1 33.9 33.0 28.2 31.2 31.8250–299 . . . . . . . . . . . . . . . . 29.4 19.1 21.9 22.9 30.9 33.2 34.2 33.4 31.0 27.1 33.8 25.5 22.7300–349 . . . . . . . . . . . . . . . . 16.5 22.2 27.7 28.8 27.7 27.8 17.2 14.5 13.7 12.8 13.2 14.4 9.3350–399 . . . . . . . . . . . . . . . . 7.6 21.9 23.7 18.8 14.1 10.1 5.9 3.7 6.2 5.7 5.4 3.9 4.2400–449 . . . . . . . . . . . . . . . . 3.0 11.9 10.4 9.9 7.2 5.2 2.1 1.0 1.9 1.4 1.9 1.0 1.3450–499 . . . . . . . . . . . . . . . . 1.3 8.5 5.2 3.5 4.3 0.8 0.3 0.7 0.3 0.4 0.6 0.9 0.9500–549 . . . . . . . . . . . . . . . . 0.6 5.8 2.5 1.6 0.4 0.1 0.1 0.3 0.4 0.5 0.4 0.7 0.1550 and more . . . . . . . . . . . . 0.4 5.3 0.9 1.9 0.4 0.0 0.1 0.0 0.0 0.1 0.3 0.3 0.8
Non-Hispanic white
Total . . . . . . . . . . . . . . . . . . 100.0 100.0 100.0 100.0 100.0 100.0 100.0 100.0 100.0 100.0 100.0 100.0 100.0
Less than 150 . . . . . . . . . . . . 1.8 0.0 0.3 0.0 0.3 0.0 0.7 2.0 2.3 1.3 1.2 4.3 4.5150–199 . . . . . . . . . . . . . . . . 11.6 0.6 1.5 1.3 0.0 5.0 5.0 13.5 9.7 16.5 13.1 16.7 23.8200–249 . . . . . . . . . . . . . . . . 28.5 3.3 5.8 8.6 14.3 18.5 34.8 31.3 35.4 33.2 28.1 31.2 31.4250–299 . . . . . . . . . . . . . . . . 29.8 18.3 26.2 23.4 34.8 33.4 35.1 32.8 32.7 26.7 34.0 25.7 22.2300–349 . . . . . . . . . . . . . . . . 15.5 23.7 27.3 30.8 27.6 27.3 16.7 13.9 11.5 12.3 13.5 13.5 9.5350–399 . . . . . . . . . . . . . . . . 6.7 23.9 21.6 17.5 11.4 9.9 4.7 3.0 5.5 5.5 5.7 4.0 4.0400–449 . . . . . . . . . . . . . . . . 2.6 10.5 9.9 10.4 6.0 4.2 2.5 0.9 1.6 1.2 2.0 1.1 1.4450–499 . . . . . . . . . . . . . . . . 1.0 7.9 4.0 1.8 3.7 0.6 0.0 0.9 0.3 0.2 0.6 1.0 0.8500–549 . . . . . . . . . . . . . . . . 0.6 6.0 1.8 2.0 0.4 0.0 0.0 0.0 0.4 0.6 0.4 0.8 0.1550 and more . . . . . . . . . . . . 0.4 5.3 0.9 2.2 0.3 0.0 0.0 0.0 0.0 0.2 0.3 0.3 0.8
Non-Hispanic black
Total . . . . . . . . . . . . . . . . . . 100.0 100.0 100.0 100.0 100.0 100.0 100.0 100.0 100.0 100.0 100.0 100.0 100.0
Less than 150 . . . . . . . . . . . . 1.4 0.0 0.0 0.3 0.6 0.0 1.0 1.0 1.8 3.3 0.8 4.1 2.9150–199 . . . . . . . . . . . . . . . . 10.0 0.5 0.9 0.3 0.6 2.5 9.3 12.9 14.7 11.9 11.9 14.9 23.2200–249 . . . . . . . . . . . . . . . . 23.3 3.1 4.2 9.1 11.7 13.6 26.1 28.2 27.7 31.6 29.8 31.7 29.3250–299 . . . . . . . . . . . . . . . . 27.4 17.0 16.5 20.0 21.8 31.5 30.1 32.5 29.9 26.4 33.9 24.3 23.4300–349 . . . . . . . . . . . . . . . . 19.1 20.0 31.2 25.0 28.1 31.2 22.0 14.2 16.1 17.7 12.4 15.5 10.5350–399 . . . . . . . . . . . . . . . . 9.7 17.5 21.8 28.8 21.4 10.8 7.4 6.0 6.5 4.1 4.5 6.5 4.5400–449 . . . . . . . . . . . . . . . . 4.2 16.9 11.5 8.4 9.6 7.6 1.6 1.5 1.9 3.3 2.2 0.6 0.3450–499 . . . . . . . . . . . . . . . . 2.0 9.6 7.4 4.5 5.0 0.4 1.0 0.8 0.3 0.9 0.4 0.7 2.7500–549 . . . . . . . . . . . . . . . . 1.0 7.9 3.9 0.8 0.0 0.5 0.6 0.4 0.2 0.3 1.1 0.6 0.5550 and more . . . . . . . . . . . . 0.8 6.9 1.7 1.7 0.8 0.0 0.7 0.0 0.1 0.0 1.3 0.3 1.6
Mexican American
Total . . . . . . . . . . . . . . . . . . 100.0 100.0 100.0 100.0 100.0 100.0 100.0 100.0 100.0 100.0 100.0 100.0 100.0
Less than 150 . . . . . . . . . . . . 1.2 0.0 0.2 0.0 0.5 0.4 0.6 1.9 1.6 1.5 1.7 3.4 2.3150–199 . . . . . . . . . . . . . . . . 8.5 0.3 1.5 0.8 0.0 2.7 9.1 9.9 9.7 13.2 20.8 13.0 23.2200–249 . . . . . . . . . . . . . . . . 23.5 6.1 8.6 8.0 9.9 14.5 29.9 30.3 27.6 28.4 23.7 34.6 31.9250–299 . . . . . . . . . . . . . . . . 28.5 14.8 18.5 20.0 28.7 29.4 31.9 29.8 33.7 30.7 28.4 30.0 23.4300–349 . . . . . . . . . . . . . . . . 19.0 17.7 25.2 28.7 27.3 27.4 15.4 18.4 17.6 14.9 11.2 12.5 11.9350–399 . . . . . . . . . . . . . . . . 10.6 23.2 20.6 23.5 17.9 13.0 9.7 6.2 6.8 7.4 8.0 4.0 5.1400–449 . . . . . . . . . . . . . . . . 3.9 11.3 13.1 9.2 6.8 7.4 2.4 1.8 1.1 2.1 2.3 0.9 0.3450–499 . . . . . . . . . . . . . . . . 2.3 12.6 6.7 6.7 5.6 3.7 0.7 0.1 0.7 0.3 1.5 0.7 0.4500–549 . . . . . . . . . . . . . . . . 0.9 4.5 3.7 1.5 1.1 0.0 0.0 0.9 0.2 0.0 1.4 0.0 0.4550 and more . . . . . . . . . . . . 0.6 7.7 1.0 1.6 1.1 0.0 0.0 0.0 0.0 0.0 0.5 0.0 0.3
0.0 Quantity more than zero but less than 0.05.1Includes all other race/ethnic groups not listed separately.
NOTE: Numbers may not add to totals because of rounding.
Page 104 [ Series 11, No. 247

Table 78. Percent distribution of platelet count as 109 cells per liter for females 1 year and over, by race/ethnicity and age: United States,1988–94
Race/ethnicity andselected platelet
count cutoffs1 year
and over1–2
years3–5
years6–8
years9–11years
12–14years
15–19years
20–29years
30–39years
40–49years
50–59years
60–69years
70 yearsand over
All race/ethnic groups1
Total . . . . . . . . . . . . . . . . . . 100.0 100.0 100.0 100.0 100.0 100.0 100.0 100.0 100.0 100.0 100.0 100.0 100.0
Less than 150 . . . . . . . . . . . . 1.0 0.0 0.2 0.0 0.4 0.9 0.1 0.7 0.6 1.3 1.3 1.8 2.7150–199 . . . . . . . . . . . . . . . . 6.2 0.1 0.7 0.2 1.3 2.6 4.0 6.8 7.4 7.7 6.1 6.3 11.8200–249 . . . . . . . . . . . . . . . . 23.2 5.7 5.3 8.2 14.7 22.4 24.8 25.9 26.0 23.5 23.6 28.1 28.9250–299 . . . . . . . . . . . . . . . . 27.8 15.4 13.2 24.3 24.9 28.8 31.0 27.8 29.0 29.2 30.1 31.4 26.4300–349 . . . . . . . . . . . . . . . . 21.9 21.3 29.0 28.3 33.5 23.9 23.2 23.4 19.7 19.8 22.9 19.1 15.9350–399 . . . . . . . . . . . . . . . . 11.6 22.5 22.0 22.3 15.7 15.1 10.2 10.2 10.9 12.1 9.4 7.8 6.9400–449 . . . . . . . . . . . . . . . . 4.4 15.2 16.8 9.0 6.5 3.8 4.2 2.7 3.9 3.4 2.9 2.7 3.0450–499 . . . . . . . . . . . . . . . . 1.8 8.6 6.4 5.1 2.7 1.8 0.5 1.6 1.0 1.3 1.1 1.3 1.0500–549 . . . . . . . . . . . . . . . . 0.6 5.7 2.6 1.3 0.0 0.1 0.1 0.3 0.3 0.4 0.9 0.5 0.5550 and more . . . . . . . . . . . . 0.6 4.0 2.5 0.5 0.1 0.1 0.6 0.1 0.4 0.4 0.6 0.4 0.7
Non-Hispanic white
Total . . . . . . . . . . . . . . . . . . 100.0 100.0 100.0 100.0 100.0 100.0 100.0 100.0 100.0 100.0 100.0 100.0 100.0
Less than 150 . . . . . . . . . . . . 0.9 0.0 0.2 0.0 0.6 1.3 0.1 0.6 0.4 0.8 0.8 1.6 2.8150–199 . . . . . . . . . . . . . . . . 6.7 0.0 0.2 0.0 1.7 2.7 4.3 7.1 8.3 8.4 6.2 5.8 11.5200–249 . . . . . . . . . . . . . . . . 25.3 6.8 6.0 9.1 17.7 25.2 28.1 28.6 28.6 24.7 23.1 29.6 29.2250–299 . . . . . . . . . . . . . . . . 27.6 16.6 12.5 26.0 23.6 26.8 29.1 26.2 29.7 29.1 30.0 31.1 26.2300–349 . . . . . . . . . . . . . . . . 21.2 19.8 30.0 27.1 32.9 22.6 23.7 22.9 17.5 20.0 24.5 19.0 15.5350–399 . . . . . . . . . . . . . . . . 11.0 22.1 22.9 21.1 15.0 16.2 8.9 10.0 10.8 11.4 9.1 7.7 7.1400–449 . . . . . . . . . . . . . . . . 3.8 15.7 18.1 8.7 6.1 3.6 3.1 2.5 2.7 3.1 2.4 2.3 3.2450–499 . . . . . . . . . . . . . . . . 1.4 9.0 4.9 5.6 2.4 1.2 0.2 1.4 0.4 0.7 1.2 1.4 1.0500–549 . . . . . . . . . . . . . . . . 0.5 5.3 2.4 0.9 0.0 0.0 0.0 0.2 0.2 0.3 1.0 0.5 0.5550 and more . . . . . . . . . . . . 0.5 2.5 2.1 0.6 0.0 0.0 0.8 0.0 0.4 0.5 0.6 0.5 0.7
Non-Hispanic black
Total . . . . . . . . . . . . . . . . . . 100.0 100.0 100.0 100.0 100.0 100.0 100.0 100.0 100.0 100.0 100.0 100.0 100.0
Less than 150 . . . . . . . . . . . . 1.1 0.0 0.0 0.0 0.3 0.4 0.1 1.0 1.4 1.0 1.7 4.1 2.0150–199 . . . . . . . . . . . . . . . . 4.3 0.3 2.1 0.7 0.0 3.8 0.8 4.6 4.8 4.6 6.2 5.6 13.7200–249 . . . . . . . . . . . . . . . . 16.4 3.6 3.1 9.0 6.5 10.4 18.1 17.3 17.1 20.8 23.4 21.0 25.4250–299 . . . . . . . . . . . . . . . . 26.8 10.7 14.4 19.0 26.0 31.0 27.3 28.6 26.7 26.1 35.9 30.9 29.5300–349 . . . . . . . . . . . . . . . . 24.6 24.4 26.4 27.5 33.4 31.1 26.9 25.3 25.4 21.6 18.4 19.7 18.8350–399 . . . . . . . . . . . . . . . . 14.1 21.7 22.0 23.7 19.8 12.1 15.8 13.3 13.5 14.5 7.7 9.7 6.0400–449 . . . . . . . . . . . . . . . . 6.8 15.9 14.7 12.2 8.5 5.6 8.7 4.8 6.0 6.4 4.1 4.8 1.7450–499 . . . . . . . . . . . . . . . . 2.9 8.7 7.0 4.1 5.0 3.5 1.0 3.0 2.6 3.2 0.3 1.5 0.2500–549 . . . . . . . . . . . . . . . . 1.0 6.4 3.7 2.4 0.0 0.9 0.4 1.0 0.6 0.5 0.0 0.7 0.3550 and more . . . . . . . . . . . . 1.0 8.1 5.5 0.4 0.5 0.0 0.0 0.9 0.4 0.6 1.0 0.0 1.3
Mexican American
Total . . . . . . . . . . . . . . . . . . 100.0 100.0 100.0 100.0 100.0 100.0 100.0 100.0 100.0 100.0 100.0 100.0 100.0
Less than 150 . . . . . . . . . . . . 0.7 0.0 0.3 0.0 0.0 0.0 0.5 1.4 0.0 1.3 2.1 1.9 2.0150–199 . . . . . . . . . . . . . . . . 4.4 0.5 2.0 1.0 0.0 2.2 3.8 5.0 5.2 4.8 8.1 13.9 9.4200–249 . . . . . . . . . . . . . . . . 16.2 2.4 8.6 3.7 7.6 15.4 17.4 18.8 23.9 17.1 16.1 21.7 29.7250–299 . . . . . . . . . . . . . . . . 26.7 18.5 19.9 18.8 23.5 29.6 32.5 32.0 23.6 25.2 34.0 26.2 24.9300–349 . . . . . . . . . . . . . . . . 24.0 18.9 18.4 25.3 35.6 24.9 23.3 21.8 25.1 29.9 19.4 18.5 20.8350–399 . . . . . . . . . . . . . . . . 15.0 23.4 24.3 28.1 16.8 16.2 13.5 13.6 11.4 10.4 11.0 11.4 8.5400–449 . . . . . . . . . . . . . . . . 7.0 13.7 11.8 10.1 10.3 6.0 6.4 4.1 7.3 6.3 5.8 4.1 3.5450–499 . . . . . . . . . . . . . . . . 3.0 11.7 7.0 7.6 4.7 4.2 0.9 1.5 1.7 2.1 0.5 0.7 0.3500–549 . . . . . . . . . . . . . . . . 1.1 5.6 4.0 3.3 0.2 0.0 0.6 0.6 0.1 1.1 0.6 0.1 0.0550 and more . . . . . . . . . . . . 0.9 5.0 2.8 0.3 0.8 0.9 0.8 0.1 0.7 0.8 0.0 0.1 0.7
0.0 Quantity more than zero but less than 0.05.1Includes all other race/ethnic groups not listed separately.
NOTE: Numbers may not add to totals because of rounding.
Series 11, No. 247 [ Page 105
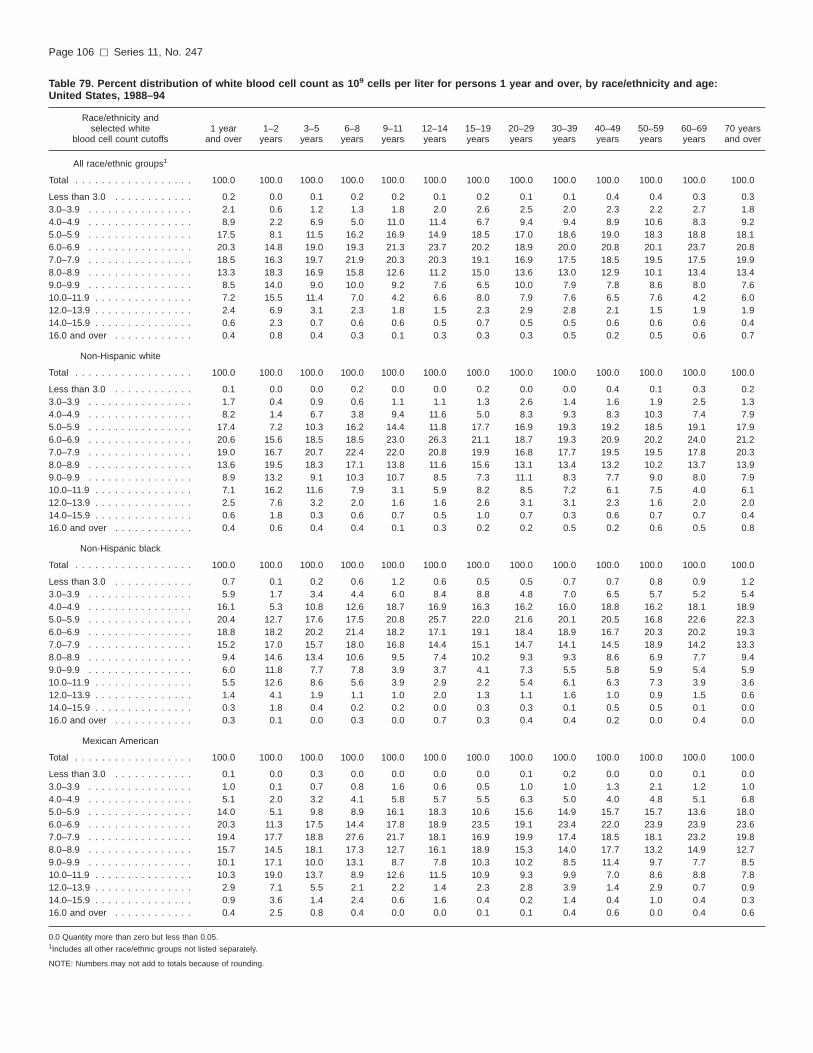
Table 79. Percent distribution of white blood cell count as 109 cells per liter for persons 1 year and over, by race/ethnicity and age:United States, 1988–94
Race/ethnicity andselected white
blood cell count cutoffs1 year
and over1–2
years3–5
years6–8
years9–11years
12–14years
15–19years
20–29years
30–39years
40–49years
50–59years
60–69years
70 yearsand over
All race/ethnic groups1
Total . . . . . . . . . . . . . . . . . . 100.0 100.0 100.0 100.0 100.0 100.0 100.0 100.0 100.0 100.0 100.0 100.0 100.0
Less than 3.0 . . . . . . . . . . . . 0.2 0.0 0.1 0.2 0.2 0.1 0.2 0.1 0.1 0.4 0.4 0.3 0.33.0–3.9 . . . . . . . . . . . . . . . . 2.1 0.6 1.2 1.3 1.8 2.0 2.6 2.5 2.0 2.3 2.2 2.7 1.84.0–4.9 . . . . . . . . . . . . . . . . 8.9 2.2 6.9 5.0 11.0 11.4 6.7 9.4 9.4 8.9 10.6 8.3 9.25.0–5.9 . . . . . . . . . . . . . . . . 17.5 8.1 11.5 16.2 16.9 14.9 18.5 17.0 18.6 19.0 18.3 18.8 18.16.0–6.9 . . . . . . . . . . . . . . . . 20.3 14.8 19.0 19.3 21.3 23.7 20.2 18.9 20.0 20.8 20.1 23.7 20.87.0–7.9 . . . . . . . . . . . . . . . . 18.5 16.3 19.7 21.9 20.3 20.3 19.1 16.9 17.5 18.5 19.5 17.5 19.98.0–8.9 . . . . . . . . . . . . . . . . 13.3 18.3 16.9 15.8 12.6 11.2 15.0 13.6 13.0 12.9 10.1 13.4 13.49.0–9.9 . . . . . . . . . . . . . . . . 8.5 14.0 9.0 10.0 9.2 7.6 6.5 10.0 7.9 7.8 8.6 8.0 7.610.0–11.9 . . . . . . . . . . . . . . . 7.2 15.5 11.4 7.0 4.2 6.6 8.0 7.9 7.6 6.5 7.6 4.2 6.012.0–13.9 . . . . . . . . . . . . . . . 2.4 6.9 3.1 2.3 1.8 1.5 2.3 2.9 2.8 2.1 1.5 1.9 1.914.0–15.9 . . . . . . . . . . . . . . . 0.6 2.3 0.7 0.6 0.6 0.5 0.7 0.5 0.5 0.6 0.6 0.6 0.416.0 and over . . . . . . . . . . . . 0.4 0.8 0.4 0.3 0.1 0.3 0.3 0.3 0.5 0.2 0.5 0.6 0.7
Non-Hispanic white
Total . . . . . . . . . . . . . . . . . . 100.0 100.0 100.0 100.0 100.0 100.0 100.0 100.0 100.0 100.0 100.0 100.0 100.0
Less than 3.0 . . . . . . . . . . . . 0.1 0.0 0.0 0.2 0.0 0.0 0.2 0.0 0.0 0.4 0.1 0.3 0.23.0–3.9 . . . . . . . . . . . . . . . . 1.7 0.4 0.9 0.6 1.1 1.1 1.3 2.6 1.4 1.6 1.9 2.5 1.34.0–4.9 . . . . . . . . . . . . . . . . 8.2 1.4 6.7 3.8 9.4 11.6 5.0 8.3 9.3 8.3 10.3 7.4 7.95.0–5.9 . . . . . . . . . . . . . . . . 17.4 7.2 10.3 16.2 14.4 11.8 17.7 16.9 19.3 19.2 18.5 19.1 17.96.0–6.9 . . . . . . . . . . . . . . . . 20.6 15.6 18.5 18.5 23.0 26.3 21.1 18.7 19.3 20.9 20.2 24.0 21.27.0–7.9 . . . . . . . . . . . . . . . . 19.0 16.7 20.7 22.4 22.0 20.8 19.9 16.8 17.7 19.5 19.5 17.8 20.38.0–8.9 . . . . . . . . . . . . . . . . 13.6 19.5 18.3 17.1 13.8 11.6 15.6 13.1 13.4 13.2 10.2 13.7 13.99.0–9.9 . . . . . . . . . . . . . . . . 8.9 13.2 9.1 10.3 10.7 8.5 7.3 11.1 8.3 7.7 9.0 8.0 7.910.0–11.9 . . . . . . . . . . . . . . . 7.1 16.2 11.6 7.9 3.1 5.9 8.2 8.5 7.2 6.1 7.5 4.0 6.112.0–13.9 . . . . . . . . . . . . . . . 2.5 7.6 3.2 2.0 1.6 1.6 2.6 3.1 3.1 2.3 1.6 2.0 2.014.0–15.9 . . . . . . . . . . . . . . . 0.6 1.8 0.3 0.6 0.7 0.5 1.0 0.7 0.3 0.6 0.7 0.7 0.416.0 and over . . . . . . . . . . . . 0.4 0.6 0.4 0.4 0.1 0.3 0.2 0.2 0.5 0.2 0.6 0.5 0.8
Non-Hispanic black
Total . . . . . . . . . . . . . . . . . . 100.0 100.0 100.0 100.0 100.0 100.0 100.0 100.0 100.0 100.0 100.0 100.0 100.0
Less than 3.0 . . . . . . . . . . . . 0.7 0.1 0.2 0.6 1.2 0.6 0.5 0.5 0.7 0.7 0.8 0.9 1.23.0–3.9 . . . . . . . . . . . . . . . . 5.9 1.7 3.4 4.4 6.0 8.4 8.8 4.8 7.0 6.5 5.7 5.2 5.44.0–4.9 . . . . . . . . . . . . . . . . 16.1 5.3 10.8 12.6 18.7 16.9 16.3 16.2 16.0 18.8 16.2 18.1 18.95.0–5.9 . . . . . . . . . . . . . . . . 20.4 12.7 17.6 17.5 20.8 25.7 22.0 21.6 20.1 20.5 16.8 22.6 22.36.0–6.9 . . . . . . . . . . . . . . . . 18.8 18.2 20.2 21.4 18.2 17.1 19.1 18.4 18.9 16.7 20.3 20.2 19.37.0–7.9 . . . . . . . . . . . . . . . . 15.2 17.0 15.7 18.0 16.8 14.4 15.1 14.7 14.1 14.5 18.9 14.2 13.38.0–8.9 . . . . . . . . . . . . . . . . 9.4 14.6 13.4 10.6 9.5 7.4 10.2 9.3 9.3 8.6 6.9 7.7 9.49.0–9.9 . . . . . . . . . . . . . . . . 6.0 11.8 7.7 7.8 3.9 3.7 4.1 7.3 5.5 5.8 5.9 5.4 5.910.0–11.9 . . . . . . . . . . . . . . . 5.5 12.6 8.6 5.6 3.9 2.9 2.2 5.4 6.1 6.3 7.3 3.9 3.612.0–13.9 . . . . . . . . . . . . . . . 1.4 4.1 1.9 1.1 1.0 2.0 1.3 1.1 1.6 1.0 0.9 1.5 0.614.0–15.9 . . . . . . . . . . . . . . . 0.3 1.8 0.4 0.2 0.2 0.0 0.3 0.3 0.1 0.5 0.5 0.1 0.016.0 and over . . . . . . . . . . . . 0.3 0.1 0.0 0.3 0.0 0.7 0.3 0.4 0.4 0.2 0.0 0.4 0.0
Mexican American
Total . . . . . . . . . . . . . . . . . . 100.0 100.0 100.0 100.0 100.0 100.0 100.0 100.0 100.0 100.0 100.0 100.0 100.0
Less than 3.0 . . . . . . . . . . . . 0.1 0.0 0.3 0.0 0.0 0.0 0.0 0.1 0.2 0.0 0.0 0.1 0.03.0–3.9 . . . . . . . . . . . . . . . . 1.0 0.1 0.7 0.8 1.6 0.6 0.5 1.0 1.0 1.3 2.1 1.2 1.04.0–4.9 . . . . . . . . . . . . . . . . 5.1 2.0 3.2 4.1 5.8 5.7 5.5 6.3 5.0 4.0 4.8 5.1 6.85.0–5.9 . . . . . . . . . . . . . . . . 14.0 5.1 9.8 8.9 16.1 18.3 10.6 15.6 14.9 15.7 15.7 13.6 18.06.0–6.9 . . . . . . . . . . . . . . . . 20.3 11.3 17.5 14.4 17.8 18.9 23.5 19.1 23.4 22.0 23.9 23.9 23.67.0–7.9 . . . . . . . . . . . . . . . . 19.4 17.7 18.8 27.6 21.7 18.1 16.9 19.9 17.4 18.5 18.1 23.2 19.88.0–8.9 . . . . . . . . . . . . . . . . 15.7 14.5 18.1 17.3 12.7 16.1 18.9 15.3 14.0 17.7 13.2 14.9 12.79.0–9.9 . . . . . . . . . . . . . . . . 10.1 17.1 10.0 13.1 8.7 7.8 10.3 10.2 8.5 11.4 9.7 7.7 8.510.0–11.9 . . . . . . . . . . . . . . . 10.3 19.0 13.7 8.9 12.6 11.5 10.9 9.3 9.9 7.0 8.6 8.8 7.812.0–13.9 . . . . . . . . . . . . . . . 2.9 7.1 5.5 2.1 2.2 1.4 2.3 2.8 3.9 1.4 2.9 0.7 0.914.0–15.9 . . . . . . . . . . . . . . . 0.9 3.6 1.4 2.4 0.6 1.6 0.4 0.2 1.4 0.4 1.0 0.4 0.316.0 and over . . . . . . . . . . . . 0.4 2.5 0.8 0.4 0.0 0.0 0.1 0.1 0.4 0.6 0.0 0.4 0.6
0.0 Quantity more than zero but less than 0.05.1Includes all other race/ethnic groups not listed separately.
NOTE: Numbers may not add to totals because of rounding.
Page 106 [ Series 11, No. 247

Table 80. Percent distribution of white blood cell count as 109 cells per liter for males 1 year and over, by race/ethnicity and age:United States, 1988–94
Race/ethnicity andselected white
blood cell count cutoffs1 year
and over1–2
years3–5
years6–8
years9–11years
12–14years
15–19years
20–29years
30–39years
40–49years
50–59years
60–69years
70 yearsand over
All race/ethnic groups1
Total . . . . . . . . . . . . . . . . . . 100.0 100.0 100.0 100.0 100.0 100.0 100.0 100.0 100.0 100.0 100.0 100.0 100.0
Less than 3.0 . . . . . . . . . . . . 0.1 0.0 0.1 0.0 0.3 0.2 0.1 0.1 0.1 0.3 0.2 0.1 0.23.0–3.9 . . . . . . . . . . . . . . . . 2.1 0.5 1.5 1.4 2.2 1.8 3.4 2.3 1.9 2.2 2.0 2.2 1.84.0–4.9 . . . . . . . . . . . . . . . . 8.7 2.8 6.9 4.7 12.6 14.1 8.6 9.5 9.2 8.3 9.1 6.1 7.95.0–5.9 . . . . . . . . . . . . . . . . 18.3 7.3 13.2 17.4 16.8 16.8 21.3 18.7 20.0 19.6 17.2 19.9 16.26.0–6.9 . . . . . . . . . . . . . . . . 20.6 14.4 20.6 20.5 21.3 25.7 20.0 21.0 19.0 19.4 20.2 23.4 22.27.0–7.9 . . . . . . . . . . . . . . . . 18.9 17.0 19.6 22.0 17.1 15.8 17.0 19.3 17.9 20.1 20.6 17.0 21.28.0–8.9 . . . . . . . . . . . . . . . . 12.9 19.6 15.4 15.1 14.9 7.6 13.6 11.7 13.9 12.0 9.7 15.2 12.99.0–9.9 . . . . . . . . . . . . . . . . 8.6 12.7 7.8 9.6 9.1 8.8 5.5 9.0 8.2 8.6 9.7 8.6 7.510.0–11.9 . . . . . . . . . . . . . . . 6.8 15.3 10.5 5.7 3.1 6.2 7.8 6.1 6.9 6.2 8.1 4.8 6.312.0–13.9 . . . . . . . . . . . . . . . 2.3 7.2 2.8 3.0 1.5 2.3 2.4 1.7 2.2 2.6 1.8 1.7 2.114.0–15.9 . . . . . . . . . . . . . . . 0.5 2.3 1.0 0.4 0.8 0.7 0.0 0.3 0.3 0.3 0.9 0.2 0.616.0 and over . . . . . . . . . . . . 0.4 1.0 0.5 0.2 0.2 0.0 0.3 0.4 0.4 0.3 0.6 0.7 1.0
Non-Hispanic white
Total . . . . . . . . . . . . . . . . . . 100.0 100.0 100.0 100.0 100.0 100.0 100.0 100.0 100.0 100.0 100.0 100.0 100.0
Less than 3.0 . . . . . . . . . . . . 0.0 0.0 0.0 0.0 0.0 0.0 0.0 0.0 0.0 0.2 0.2 0.0 0.13.0–3.9 . . . . . . . . . . . . . . . . 1.6 0.0 1.6 0.5 1.2 0.5 2.7 2.5 1.0 1.6 2.1 2.2 1.54.0–4.9 . . . . . . . . . . . . . . . . 7.9 1.9 7.7 3.6 10.3 16.0 5.5 9.0 9.4 7.5 8.3 5.3 5.95.0–5.9 . . . . . . . . . . . . . . . . 18.2 7.0 12.4 17.3 15.8 15.2 20.3 18.8 20.9 20.1 16.0 20.3 15.56.0–6.9 . . . . . . . . . . . . . . . . 20.5 15.2 18.8 20.0 22.5 27.5 18.4 20.3 18.4 18.9 21.3 23.6 22.67.0–7.9 . . . . . . . . . . . . . . . . 19.4 18.2 21.6 23.5 18.8 15.3 18.9 20.1 17.6 21.0 20.6 16.4 21.98.0–8.9 . . . . . . . . . . . . . . . . 13.2 20.1 15.8 16.4 16.4 7.5 14.8 10.5 14.2 12.7 9.6 16.5 13.69.0–9.9 . . . . . . . . . . . . . . . . 9.1 11.7 7.4 9.4 11.6 9.7 6.9 10.2 8.9 8.8 10.1 8.4 8.110.0–11.9 . . . . . . . . . . . . . . . 6.6 15.9 10.5 6.2 1.5 5.2 8.6 6.2 6.7 5.6 8.0 4.7 6.612.0–13.9 . . . . . . . . . . . . . . . 2.4 7.4 3.5 2.5 0.6 2.6 3.4 1.8 2.2 3.0 2.0 1.8 2.414.0–15.9 . . . . . . . . . . . . . . . 0.5 2.1 0.5 0.2 1.0 0.6 0.0 0.3 0.3 0.4 1.0 0.2 0.716.0 and over . . . . . . . . . . . . 0.5 0.5 0.3 0.2 0.3 0.0 0.4 0.3 0.5 0.3 0.8 0.6 1.1
Non-Hispanic black
Total . . . . . . . . . . . . . . . . . . 100.0 100.0 100.0 100.0 100.0 100.0 100.0 100.0 100.0 100.0 100.0 100.0 100.0
Less than 3.0 . . . . . . . . . . . . 0.7 0.0 0.5 0.3 1.7 1.3 0.9 0.6 0.7 0.3 0.4 0.7 1.63.0–3.9 . . . . . . . . . . . . . . . . 6.8 1.9 2.6 5.3 7.9 11.1 10.5 4.4 9.6 7.9 3.7 4.7 6.64.0–4.9 . . . . . . . . . . . . . . . . 17.3 5.5 10.4 13.9 18.5 17.1 22.0 20.1 16.6 19.0 15.7 17.6 19.85.0–5.9 . . . . . . . . . . . . . . . . 21.0 14.4 21.3 18.2 20.8 25.7 20.8 22.0 21.7 19.6 20.1 22.4 22.26.0–6.9 . . . . . . . . . . . . . . . . 19.2 18.2 19.5 21.2 19.4 18.8 21.1 20.2 17.3 17.8 17.2 21.8 19.97.0–7.9 . . . . . . . . . . . . . . . . 14.5 15.1 14.4 17.1 15.7 10.3 13.8 12.7 13.9 14.3 19.1 16.7 15.08.0–8.9 . . . . . . . . . . . . . . . . 8.8 12.1 13.4 10.2 8.6 5.0 8.2 9.5 9.6 7.2 8.1 6.4 6.29.0–9.9 . . . . . . . . . . . . . . . . 5.3 12.7 7.0 6.7 2.5 4.8 1.6 5.8 5.2 5.6 6.0 4.1 4.510.0–11.9 . . . . . . . . . . . . . . . 4.9 11.7 9.5 6.2 3.6 2.7 0.9 3.8 4.2 6.1 7.7 4.5 4.212.0–13.9 . . . . . . . . . . . . . . . 1.2 6.2 1.2 0.5 0.8 3.2 0.2 0.7 0.9 1.5 1.5 0.8 0.014.0–15.9 . . . . . . . . . . . . . . . 0.3 2.1 0.1 0.0 0.4 0.0 0.0 0.3 0.2 0.3 0.5 0.0 0.016.0 and over . . . . . . . . . . . . 0.1 0.0 0.0 0.3 0.0 0.0 0.0 0.0 0.2 0.4 0.0 0.0 0.0
Mexican American
Total . . . . . . . . . . . . . . . . . . 100.0 100.0 100.0 100.0 100.0 100.0 100.0 100.0 100.0 100.0 100.0 100.0 100.0
Less than 3.0 . . . . . . . . . . . . 0.1 0.0 0.5 0.0 0.0 0.0 0.0 0.2 0.2 0.0 0.0 0.2 0.03.0–3.9 . . . . . . . . . . . . . . . . 1.0 0.0 0.6 0.7 2.4 0.9 0.4 1.0 0.9 0.9 1.4 1.9 1.04.0–4.9 . . . . . . . . . . . . . . . . 5.6 2.1 2.6 3.0 7.7 5.2 8.3 7.0 6.0 4.9 4.8 3.8 2.55.0–5.9 . . . . . . . . . . . . . . . . 16.1 4.1 8.6 10.1 14.9 17.1 14.7 19.0 19.1 17.9 16.6 14.9 21.56.0–6.9 . . . . . . . . . . . . . . . . 20.8 13.3 18.0 16.8 21.3 18.4 28.1 18.5 22.4 22.3 23.3 21.4 24.97.0–7.9 . . . . . . . . . . . . . . . . 19.5 17.0 22.1 27.8 18.9 18.6 15.5 20.2 17.8 19.1 17.4 24.2 23.88.0–8.9 . . . . . . . . . . . . . . . . 15.6 15.8 19.6 18.3 14.8 15.4 15.2 15.5 14.5 16.1 15.7 13.3 13.19.0–9.9 . . . . . . . . . . . . . . . . 9.2 13.8 9.9 14.1 7.2 8.5 8.1 8.4 7.9 11.4 9.4 9.4 5.310.0–11.9 . . . . . . . . . . . . . . . 8.7 21.2 11.4 5.1 10.1 13.3 8.0 8.2 6.5 6.5 6.9 8.9 6.612.0–13.9 . . . . . . . . . . . . . . . 2.0 6.5 4.4 1.1 1.7 0.4 1.3 1.5 3.4 0.4 2.5 1.4 0.314.0–15.9 . . . . . . . . . . . . . . . 0.9 3.2 1.2 2.7 1.1 2.3 0.5 0.2 0.9 0.0 2.0 0.7 0.716.0 and over . . . . . . . . . . . . 0.4 3.0 1.1 0.4 0.0 0.0 0.0 0.3 0.5 0.5 0.0 0.0 0.4
0.0 Quantity more than zero but less than 0.05.1Includes all other race/ethnic groups not listed separately.
NOTE: Numbers may not add to totals because of rounding.
Series 11, No. 247 [ Page 107

Table 81. Percent distribution of white blood cell count as 109 cells per liter for females 1 year and over, by race/ethnicity and age:United States, 1988–94
Race/ethnicity andselected white
blood cell count cutoffs1 year
and over1–2
years3–5
years6–8
years9–11years
12–14years
15–19years
20–29years
30–39years
40–49years
50–59years
60–69years
70 yearsand over
All race/ethnic groups1
Total . . . . . . . . . . . . . . . . . . 100.0 100.0 100.0 100.0 100.0 100.0 100.0 100.0 100.0 100.0 100.0 100.0 100.0
Less than 3.0 . . . . . . . . . . . . 0.3 0.1 0.0 0.4 0.1 0.0 0.2 0.0 0.1 0.5 0.5 0.6 0.33.0–3.9 . . . . . . . . . . . . . . . . 2.1 0.8 0.9 1.2 1.5 2.2 1.8 2.7 2.1 2.3 2.3 3.0 1.74.0–4.9 . . . . . . . . . . . . . . . . 9.0 1.6 7.0 5.4 9.3 8.3 4.9 9.2 9.6 9.5 12.1 10.3 10.05.0–5.9 . . . . . . . . . . . . . . . . 16.7 9.1 9.7 14.9 16.9 12.9 15.8 15.3 17.2 18.5 19.3 17.8 19.46.0–6.9 . . . . . . . . . . . . . . . . 20.1 15.2 17.3 17.8 21.2 21.4 20.4 16.9 20.9 22.0 20.0 23.9 19.97.0–7.9 . . . . . . . . . . . . . . . . 18.2 15.5 19.8 21.7 23.5 25.3 21.0 14.5 17.1 16.9 18.5 18.0 19.08.0–8.9 . . . . . . . . . . . . . . . . 13.7 16.9 18.6 16.7 10.4 15.1 16.3 15.4 12.2 13.8 10.6 11.9 13.79.0–9.9 . . . . . . . . . . . . . . . . 8.5 15.5 10.3 10.5 9.3 6.1 7.5 11.0 7.7 7.1 7.5 7.4 7.710.0–11.9 . . . . . . . . . . . . . . . 7.7 15.7 12.3 8.6 5.3 7.0 8.1 9.8 8.3 6.9 7.1 3.8 5.712.0–13.9 . . . . . . . . . . . . . . . 2.6 6.5 3.5 1.6 2.2 0.6 2.3 4.2 3.4 1.6 1.3 2.0 1.714.0–15.9 . . . . . . . . . . . . . . . 0.7 2.4 0.3 0.9 0.3 0.3 1.3 0.8 0.8 0.8 0.3 0.9 0.216.0 and over . . . . . . . . . . . . 0.4 0.7 0.3 0.4 0.0 0.6 0.3 0.2 0.5 0.1 0.4 0.5 0.6
Non-Hispanic white
Total . . . . . . . . . . . . . . . . . . 100.0 100.0 100.0 100.0 100.0 100.0 100.0 100.0 100.0 100.0 100.0 100.0 100.0
Less than 3.0 . . . . . . . . . . . . 0.2 0.0 0.0 0.4 0.0 0.0 0.4 0.0 0.0 0.6 0.0 0.6 0.33.0–3.9 . . . . . . . . . . . . . . . . 1.7 0.9 0.2 0.7 1.1 1.8 0.0 2.7 1.8 1.6 1.7 2.8 1.14.0–4.9 . . . . . . . . . . . . . . . . 8.4 0.8 5.7 4.1 8.4 6.1 4.4 7.5 9.3 9.2 12.2 9.3 9.35.0–5.9 . . . . . . . . . . . . . . . . 16.6 7.5 8.0 15.0 13.0 7.7 15.1 15.1 17.7 18.2 20.8 18.0 19.56.0–6.9 . . . . . . . . . . . . . . . . 20.7 16.0 18.1 16.6 23.5 24.7 23.8 17.1 20.2 23.0 19.2 24.3 20.37.0–7.9 . . . . . . . . . . . . . . . . 18.5 15.0 19.7 21.1 25.1 27.6 20.8 13.6 17.8 18.0 18.4 19.1 19.38.0–8.9 . . . . . . . . . . . . . . . . 14.0 18.7 21.0 18.0 11.4 16.7 16.4 15.7 12.7 13.7 10.8 11.2 14.19.0–9.9 . . . . . . . . . . . . . . . . 8.6 14.9 11.0 11.3 9.9 7.2 7.7 12.0 7.7 6.5 7.9 7.6 7.810.0–11.9 . . . . . . . . . . . . . . . 7.6 16.5 12.9 9.8 4.5 6.8 7.8 10.6 7.8 6.6 7.1 3.5 5.712.0–13.9 . . . . . . . . . . . . . . . 2.6 7.8 2.9 1.4 2.7 0.4 1.7 4.5 4.0 1.6 1.1 2.1 1.714.0–15.9 . . . . . . . . . . . . . . . 0.7 1.4 0.0 1.0 0.4 0.3 1.9 1.1 0.3 0.9 0.3 1.1 0.316.0 and over . . . . . . . . . . . . 0.4 0.7 0.4 0.5 0.0 0.6 0.0 0.1 0.6 0.1 0.5 0.5 0.7
Non-Hispanic black
Total . . . . . . . . . . . . . . . . . . 100.0 100.0 100.0 100.0 100.0 100.0 100.0 100.0 100.0 100.0 100.0 100.0 100.0
Less than 3.0 . . . . . . . . . . . . 0.6 0.3 0.0 0.9 0.7 0.0 0.0 0.3 0.8 1.1 1.0 1.0 0.93.0–3.9 . . . . . . . . . . . . . . . . 5.2 1.4 4.1 3.5 4.0 6.1 7.0 5.2 4.9 5.3 7.3 5.5 4.64.0–4.9 . . . . . . . . . . . . . . . . 15.0 5.1 11.1 11.3 18.9 16.9 10.6 12.9 15.6 18.6 16.7 18.4 18.45.0–5.9 . . . . . . . . . . . . . . . . 19.9 11.0 13.9 16.7 20.7 25.8 23.2 21.3 18.7 21.2 14.1 22.7 22.36.0–6.9 . . . . . . . . . . . . . . . . 18.5 18.2 20.8 21.5 16.9 15.7 17.1 16.9 20.3 15.8 22.8 19.1 19.07.0–7.9 . . . . . . . . . . . . . . . . 15.9 18.9 17.0 18.8 18.0 17.8 16.3 16.5 14.4 14.7 18.7 12.3 12.28.0–8.9 . . . . . . . . . . . . . . . . 10.0 17.1 13.5 11.1 10.4 9.5 12.3 9.1 9.0 9.7 5.8 8.5 11.69.0–9.9 . . . . . . . . . . . . . . . . 6.7 10.9 8.5 8.8 5.2 2.8 6.6 8.6 5.8 5.8 5.8 6.3 6.810.0–11.9 . . . . . . . . . . . . . . . 6.1 13.5 7.6 5.0 4.1 3.2 3.4 6.8 7.7 6.5 6.9 3.5 3.212.0–13.9 . . . . . . . . . . . . . . . 1.5 2.0 2.6 1.6 1.1 0.9 2.4 1.4 2.2 0.7 0.5 1.9 1.014.0–15.9 . . . . . . . . . . . . . . . 0.3 1.4 0.8 0.4 0.0 0.0 0.6 0.3 0.1 0.5 0.4 0.2 0.016.0 and over . . . . . . . . . . . . 0.4 0.2 0.0 0.2 0.0 1.4 0.5 0.7 0.6 0.0 0.0 0.7 0.0
Mexican American
Total . . . . . . . . . . . . . . . . . . 100.0 100.0 100.0 100.0 100.0 100.0 100.0 100.0 100.0 100.0 100.0 100.0 100.0
Less than 3.0 . . . . . . . . . . . . 0.0 0.0 0.1 0.0 0.0 0.0 0.0 0.0 0.2 0.0 0.0 0.0 0.03.0–3.9 . . . . . . . . . . . . . . . . 1.0 0.3 0.8 0.9 0.8 0.4 0.7 1.1 1.0 1.7 2.8 0.7 1.04.0–4.9 . . . . . . . . . . . . . . . . 4.4 1.8 3.9 5.1 3.7 6.2 2.4 5.5 3.9 3.2 4.8 6.2 10.95.0–5.9 . . . . . . . . . . . . . . . . 11.8 6.3 11.1 7.8 17.4 19.3 6.1 11.4 10.3 13.3 14.9 12.6 14.56.0–6.9 . . . . . . . . . . . . . . . . 19.7 9.1 17.0 12.1 13.8 19.3 18.5 19.8 24.5 21.7 24.5 25.9 22.47.0–7.9 . . . . . . . . . . . . . . . . 19.2 18.4 15.5 27.5 25.1 17.7 18.4 19.6 17.0 17.8 18.9 22.4 15.88.0–8.9 . . . . . . . . . . . . . . . . 15.7 13.2 16.7 16.4 10.3 16.7 23.0 15.0 13.5 19.4 10.8 16.1 12.29.0–9.9 . . . . . . . . . . . . . . . . 11.1 20.6 10.1 12.1 10.4 7.2 12.7 12.5 9.2 11.5 10.0 6.4 11.710.0–11.9 . . . . . . . . . . . . . . . 12.0 16.7 16.0 12.5 15.5 10.0 14.2 10.7 13.5 7.6 10.2 8.7 9.112.0–13.9 . . . . . . . . . . . . . . . 3.7 7.8 6.6 3.1 2.8 2.2 3.4 4.4 4.5 2.4 3.2 0.2 1.514.0–15.9 . . . . . . . . . . . . . . . 1.0 3.9 1.7 2.0 0.1 1.0 0.3 0.1 2.0 0.7 0.0 0.1 0.016.0 and over . . . . . . . . . . . . 0.3 1.9 0.6 0.5 0.0 0.0 0.3 0.0 0.2 0.7 0.0 0.7 0.8
0.0 Quantity more than zero but less than 0.05.1Includes all other race/ethnic groups not listed separately.
NOTE: Numbers may not add to totals because of rounding.
Page 108 [ Series 11, No. 247

Table 82. Percent distribution of granulocytes as 109 cells per liter, measured electronically (CoulterTM 3-part differential) for persons 1 yearand over, by race/ethnicity and age: United States, 1988–94
Race/ethnicityand selected
granulocyte cutoffs1 year
and over1–2
years3–5
years6–8
years9–11years
12–14years
15–19years
20–29years
30–39years
40–49years
50–59years
60–69years
70 yearsand over
All race/ethnic groups1
Total . . . . . . . . . . . . . . . . . . 100.0 100.0 100.0 100.0 100.0 100.0 100.0 100.0 100.0 100.0 100.0 100.0 100.0
Less than 1.25 . . . . . . . . . . . . 0.4 2.5 0.8 0.5 0.9 0.4 0.8 0.1 0.1 0.2 0.4 0.1 0.11.25–1.74 . . . . . . . . . . . . . . . 1.3 6.0 3.5 1.9 2.5 2.7 0.7 1.1 0.9 1.1 0.7 0.7 0.51.75–2.24 . . . . . . . . . . . . . . . 3.8 15.0 8.0 5.5 5.8 5.7 3.6 3.0 3.1 3.2 3.0 2.7 2.02.25–2.74 . . . . . . . . . . . . . . . 8.1 13.8 13.9 11.8 13.2 9.2 6.0 9.0 7.0 6.2 7.3 7.0 6.42.75–3.24 . . . . . . . . . . . . . . . 10.9 15.4 13.3 13.0 14.7 10.8 10.6 9.0 10.4 10.2 11.8 12.4 8.93.25–3.74 . . . . . . . . . . . . . . . 13.1 13.9 11.6 12.7 14.2 15.5 11.9 11.5 14.8 13.3 13.0 12.7 12.43.75–4.24 . . . . . . . . . . . . . . . 13.4 11.4 11.7 14.0 12.8 11.7 11.1 14.0 12.6 14.5 14.0 14.6 14.24.25–4.74 . . . . . . . . . . . . . . . 12.3 6.2 11.4 11.7 10.6 13.0 14.0 11.8 10.8 12.8 15.2 13.5 13.44.75–5.24 . . . . . . . . . . . . . . . 10.0 4.2 7.8 8.7 8.1 11.0 11.5 8.3 11.5 9.8 9.5 11.3 12.45.25–5.74 . . . . . . . . . . . . . . . 7.7 3.6 6.3 7.1 4.7 7.2 8.7 7.7 7.2 10.0 6.3 9.0 8.35.75–6.24 . . . . . . . . . . . . . . . 5.7 1.7 3.0 4.3 3.8 4.2 5.8 6.9 6.1 6.3 6.4 4.8 6.16.25–6.74 . . . . . . . . . . . . . . . 3.5 1.5 2.3 2.5 3.4 2.4 3.2 4.8 3.5 3.0 3.1 3.8 4.96.75–7.24 . . . . . . . . . . . . . . . 2.7 1.5 2.0 1.8 1.8 1.5 3.1 3.2 3.2 2.6 3.1 2.2 3.17.25–7.74 . . . . . . . . . . . . . . . 2.1 1.0 1.0 1.3 0.7 1.1 2.6 2.7 2.7 2.2 2.1 1.3 2.27.75–8.24 . . . . . . . . . . . . . . . 1.4 0.8 0.6 1.3 0.2 1.6 1.7 1.7 1.5 1.8 0.9 1.0 1.98.25–8.74 . . . . . . . . . . . . . . . 1.1 0.3 1.5 0.9 0.2 0.3 1.1 2.1 1.2 0.6 1.3 1.0 0.78.75–9.24 . . . . . . . . . . . . . . . 0.7 0.3 0.4 0.2 0.5 0.8 0.8 0.8 1.1 0.4 0.4 0.7 0.99.25 and more . . . . . . . . . . . . 1.8 1.0 0.9 0.9 1.9 0.9 2.8 2.3 2.2 1.8 1.6 1.3 1.8
Non-Hispanic white
Total . . . . . . . . . . . . . . . . . . 100.0 100.0 100.0 100.0 100.0 100.0 100.0 100.0 100.0 100.0 100.0 100.0 100.0
Less than 1.25 . . . . . . . . . . . . 0.1 1.7 0.1 0.0 0.5 0.0 0.2 0.0 0.0 0.1 0.1 0.0 0.01.25–1.74 . . . . . . . . . . . . . . . 0.6 5.1 2.6 0.5 0.5 1.8 0.0 0.6 0.3 0.6 0.2 0.4 0.31.75–2.24 . . . . . . . . . . . . . . . 2.8 15.5 7.6 4.9 3.5 5.2 2.3 2.3 2.2 1.9 2.1 1.7 1.32.25–2.74 . . . . . . . . . . . . . . . 7.3 15.2 14.0 11.3 13.2 9.5 4.5 8.2 6.4 4.9 7.0 6.6 5.12.75–3.24 . . . . . . . . . . . . . . . 10.5 15.6 13.8 13.1 14.9 9.2 9.3 7.9 10.5 10.1 12.0 12.1 8.53.25–3.74 . . . . . . . . . . . . . . . 13.4 14.1 12.2 12.5 15.0 16.1 11.5 11.5 15.5 14.0 13.2 12.7 12.43.75–4.24 . . . . . . . . . . . . . . . 13.7 12.4 11.4 13.8 13.8 12.4 11.7 14.4 12.4 15.2 13.4 14.7 14.44.25–4.74 . . . . . . . . . . . . . . . 12.9 6.0 12.0 13.1 12.9 14.6 15.5 12.6 10.5 13.2 15.5 13.5 13.84.75–5.24 . . . . . . . . . . . . . . . 10.6 3.1 7.5 8.6 8.8 12.2 12.5 8.0 12.3 10.6 10.0 12.4 13.05.25–5.74 . . . . . . . . . . . . . . . 8.2 3.1 7.9 8.2 4.7 6.6 9.6 7.9 7.8 10.8 6.6 9.6 8.55.75–6.24 . . . . . . . . . . . . . . . 6.0 1.6 2.6 4.8 3.7 4.5 6.4 7.6 6.2 6.6 7.0 5.1 6.26.25–6.74 . . . . . . . . . . . . . . . 3.5 1.6 2.7 3.0 3.2 1.6 3.5 4.7 3.3 2.7 2.9 3.6 5.36.75–7.24 . . . . . . . . . . . . . . . 2.9 1.7 1.9 1.8 1.9 1.7 3.8 3.2 3.7 2.3 3.2 2.2 3.37.25–7.74 . . . . . . . . . . . . . . . 2.1 1.1 0.7 1.5 0.6 1.1 2.7 3.2 2.5 1.9 2.2 1.4 2.37.75–8.24 . . . . . . . . . . . . . . . 1.5 0.9 0.4 0.9 0.1 1.4 1.7 1.9 1.6 2.0 1.0 1.1 2.08.25–8.74 . . . . . . . . . . . . . . . 1.2 0.4 1.4 1.0 0.1 0.2 0.9 2.5 1.4 0.6 1.4 1.1 0.88.75–9.24 . . . . . . . . . . . . . . . 0.7 0.3 0.2 0.1 0.4 0.8 0.7 0.7 1.3 0.4 0.3 0.6 0.99.25 and more . . . . . . . . . . . . 2.0 0.5 0.9 0.9 2.0 0.8 3.5 2.6 2.1 2.1 1.8 1.4 1.9
Non-Hispanic black
Total . . . . . . . . . . . . . . . . . . 100.0 100.0 100.0 100.0 100.0 100.0 100.0 100.0 100.0 100.0 100.0 100.0 100.0
Less than 1.25 . . . . . . . . . . . . 1.7 7.3 4.2 2.1 3.4 2.8 2.2 0.6 1.0 0.7 0.8 0.6 1.31.25–1.74 . . . . . . . . . . . . . . . 6.2 13.2 8.8 10.2 10.4 9.6 4.7 4.6 5.7 5.2 4.9 3.7 3.11.75–2.24 . . . . . . . . . . . . . . . 11.4 17.5 14.0 10.1 14.3 11.7 13.0 8.8 9.0 14.5 11.7 11.9 7.72.25–2.74 . . . . . . . . . . . . . . . 14.3 13.8 15.6 15.2 16.4 14.5 14.2 14.1 15.3 14.6 9.6 12.4 15.32.75–3.24 . . . . . . . . . . . . . . . 13.5 13.2 12.8 12.6 13.9 12.9 14.5 14.2 12.6 11.0 14.1 17.6 15.13.25–3.74 . . . . . . . . . . . . . . . 12.4 10.3 14.3 13.6 10.7 16.1 9.4 12.8 12.5 12.1 12.5 12.5 11.83.75–4.24 . . . . . . . . . . . . . . . 10.3 7.2 8.6 8.0 10.2 6.9 11.7 10.6 10.1 9.7 12.2 13.1 12.64.25–4.74 . . . . . . . . . . . . . . . 8.6 5.8 5.7 7.6 5.5 7.1 8.2 8.8 10.3 10.0 10.2 9.2 8.84.75–5.24 . . . . . . . . . . . . . . . 5.9 4.1 4.9 6.7 3.9 6.5 6.4 6.2 6.5 5.0 7.4 5.8 5.35.25–5.74 . . . . . . . . . . . . . . . 4.2 2.0 2.6 5.4 4.2 3.6 5.4 4.5 3.7 4.1 4.4 4.1 6.35.75–6.24 . . . . . . . . . . . . . . . 3.3 1.5 2.4 2.7 2.5 2.3 3.1 3.6 3.7 4.1 4.3 2.5 4.46.25–6.74 . . . . . . . . . . . . . . . 2.6 1.3 1.7 1.5 1.5 1.1 2.1 3.9 3.1 2.1 3.2 2.2 2.96.75–7.24 . . . . . . . . . . . . . . . 1.9 1.1 0.9 1.2 1.0 0.6 0.8 3.0 2.2 3.5 1.3 1.4 0.87.25–7.74 . . . . . . . . . . . . . . . 1.3 0.2 1.1 1.2 0.9 1.1 1.5 1.7 1.2 1.4 1.0 0.6 1.77.75–8.24 . . . . . . . . . . . . . . . 0.8 0.4 0.6 0.2 0.4 1.1 0.2 1.0 1.3 0.6 0.5 0.9 0.68.25–8.74 . . . . . . . . . . . . . . . 0.5 0.1 0.4 0.7 0.1 0.4 0.2 0.5 0.5 0.4 0.8 0.4 0.78.75–9.24 . . . . . . . . . . . . . . . 0.5 0.4 0.7 0.5 0.4 0.5 0.5 0.2 0.7 0.3 0.6 0.7 0.99.25 and more . . . . . . . . . . . . 0.8 0.6 0.5 0.6 0.4 1.2 1.9 1.0 0.8 0.6 0.5 0.4 0.7
See footnotes at end of table.
Series 11, No. 247 [ Page 109

Table 82. Percent distribution of granulocytes as 109 cells per liter, measured electronically (CoulterTM 3-part differential) for persons 1 yearand over, by race/ethnicity and age: United States, 1988–94—Con.
Race/ethnicityand selected
granulocyte cutoffs1 year
and over1–2
years3–5
years6–8
years9–11years
12–14years
15–19years
20–29years
30–39years
40–49years
50–59years
60–69years
70 yearsand over
Mexican American
Total . . . . . . . . . . . . . . . . . . 100.0 100.0 100.0 100.0 100.0 100.0 100.0 100.0 100.0 100.0 100.0 100.0 100.0
Less than 1.25 . . . . . . . . . . . . 0.2 0.8 0.5 0.4 0.3 0.0 0.0 0.1 0.1 0.0 0.0 0.0 0.01.25–1.74 . . . . . . . . . . . . . . . 0.7 3.2 2.3 0.6 1.6 0.2 0.4 0.2 0.3 0.5 0.3 0.3 0.01.75–2.24 . . . . . . . . . . . . . . . 2.4 10.2 3.0 4.9 1.7 1.8 1.3 2.4 1.7 1.2 1.9 1.2 0.92.25–2.74 . . . . . . . . . . . . . . . 5.7 9.4 10.5 3.0 13.0 5.5 4.2 5.6 3.8 5.2 3.4 2.6 3.52.75–3.24 . . . . . . . . . . . . . . . 9.6 16.8 12.9 11.0 12.3 12.1 6.8 8.1 9.2 8.1 9.7 9.0 6.13.25–3.74 . . . . . . . . . . . . . . . 13.0 12.0 11.3 12.6 13.4 14.1 11.3 13.9 13.3 13.3 13.3 11.7 13.93.75–4.24 . . . . . . . . . . . . . . . 13.9 12.3 16.9 15.5 12.9 14.5 14.0 11.8 12.8 15.6 15.8 17.6 13.64.25–4.74 . . . . . . . . . . . . . . . 12.9 10.4 10.6 14.0 9.7 13.3 11.8 12.5 14.8 12.6 14.4 16.3 15.74.75–5.24 . . . . . . . . . . . . . . . 10.3 6.9 6.7 10.1 8.5 10.0 9.4 11.1 10.2 11.0 12.3 13.6 14.05.25–5.74 . . . . . . . . . . . . . . . 8.6 6.6 8.7 7.9 7.1 7.3 9.8 8.8 8.2 10.2 7.4 9.8 11.45.75–6.24 . . . . . . . . . . . . . . . 6.3 3.0 4.3 7.0 5.1 4.5 11.0 6.6 5.8 7.3 5.5 5.3 6.26.25–6.74 . . . . . . . . . . . . . . . 4.5 1.9 2.3 3.0 5.3 5.5 4.8 5.4 5.5 4.6 2.3 2.3 4.46.75–7.24 . . . . . . . . . . . . . . . 3.6 1.1 2.0 4.3 4.1 2.7 4.0 4.1 3.0 3.5 5.5 4.5 2.77.25–7.74 . . . . . . . . . . . . . . . 2.2 1.3 0.9 1.1 1.9 2.0 3.5 2.2 2.4 2.2 3.4 1.7 3.17.75–8.24 . . . . . . . . . . . . . . . 1.8 0.8 2.2 1.0 1.3 2.3 2.8 2.1 1.6 1.6 0.9 2.1 0.38.25–8.74 . . . . . . . . . . . . . . . 1.3 0.4 1.6 1.0 0.6 0.7 1.6 2.0 1.4 0.7 0.9 0.4 1.98.75–9.24 . . . . . . . . . . . . . . . 1.1 0.3 1.2 0.2 0.2 1.7 1.6 1.5 1.2 1.0 0.6 0.4 1.29.25 and more . . . . . . . . . . . . 2.2 2.6 2.3 2.5 0.9 1.8 1.6 1.5 4.4 1.5 2.5 1.2 1.0
0.0 Quantity more than zero but less than 0.05.1Includes all other race/ethnic groups not listed separately.
NOTE: Numbers may not add to totals because of rounding.
Page 110 [ Series 11, No. 247

Table 83. Percent distribution of granulocytes as 109 cells per liter, measured electronically (CoulterTM 3-part differential) for males 1 yearand over, by race/ethnicity and age: United States, 1988–94
Race/ethnicityand selected
granulocyte cutoffs1 year
and over1–2
years3–5
years6–8
years9–11years
12–14years
15–19years
20–29years
30–39years
40–49years
50–59years
60–69years
70 yearsand over
All race/ethnic groups1
Total . . . . . . . . . . . . . . . . . . 100.0 100.0 100.0 100.0 100.0 100.0 100.0 100.0 100.0 100.0 100.0 100.0 100.0
Less than 1.25 . . . . . . . . . . . . 0.3 2.5 0.6 0.6 0.5 0.3 0.5 0.1 0.1 0.3 0.0 0.1 0.21.25–1.74 . . . . . . . . . . . . . . . 1.3 5.9 4.1 1.6 3.4 4.1 0.8 0.8 1.0 0.8 0.3 0.3 0.41.75–2.24 . . . . . . . . . . . . . . . 4.0 13.2 8.0 5.8 5.3 7.9 5.3 3.2 2.6 3.1 3.1 2.7 1.32.25–2.74 . . . . . . . . . . . . . . . 7.9 14.8 14.9 11.8 14.5 10.3 7.9 8.7 6.5 6.3 5.4 3.4 5.62.75–3.24 . . . . . . . . . . . . . . . 11.1 16.7 14.5 13.3 15.7 9.7 14.0 9.1 11.6 9.6 10.7 11.0 7.43.25–3.74 . . . . . . . . . . . . . . . 13.7 13.7 12.8 12.2 13.9 17.2 10.1 13.7 16.7 13.4 12.0 12.5 12.23.75–4.24 . . . . . . . . . . . . . . . 13.9 11.1 11.2 16.2 12.2 13.5 11.0 14.7 12.5 14.8 14.2 17.6 15.24.25–4.74 . . . . . . . . . . . . . . . 12.5 5.8 9.1 12.2 9.7 12.9 11.7 14.6 9.7 12.3 17.3 13.9 14.14.75–5.24 . . . . . . . . . . . . . . . 10.5 4.0 8.7 9.1 8.5 7.5 13.4 8.1 12.9 11.6 9.7 13.0 10.65.25–5.74 . . . . . . . . . . . . . . . 7.4 2.9 5.0 6.7 5.7 4.2 6.9 8.2 7.0 10.4 6.0 8.4 9.15.75–6.24 . . . . . . . . . . . . . . . 5.5 1.8 2.3 3.0 3.7 5.0 5.2 6.7 5.6 6.0 6.7 5.1 7.26.25–6.74 . . . . . . . . . . . . . . . 3.2 2.6 2.1 1.6 3.2 1.0 2.8 4.3 3.6 1.8 3.5 4.4 4.56.75–7.24 . . . . . . . . . . . . . . . 2.2 2.0 1.3 1.7 1.1 1.3 2.4 1.1 2.7 2.6 3.5 2.4 3.07.25–7.74 . . . . . . . . . . . . . . . 2.1 0.7 1.4 0.8 0.2 0.4 2.8 2.4 2.7 2.6 2.7 1.8 2.37.75–8.24 . . . . . . . . . . . . . . . 1.2 0.4 0.6 1.4 0.1 2.3 1.2 1.1 1.3 1.2 0.9 1.3 2.68.25–8.74 . . . . . . . . . . . . . . . 0.9 0.5 2.4 0.5 0.1 0.3 1.1 1.6 0.7 0.6 1.1 0.9 1.08.75–9.24 . . . . . . . . . . . . . . . 0.6 0.3 0.4 0.3 0.5 1.2 0.8 0.4 0.8 0.5 0.6 0.5 1.09.25 and more . . . . . . . . . . . . 1.6 1.0 0.7 1.2 1.7 0.9 2.1 1.2 1.9 1.9 2.3 0.8 2.3
Non-Hispanic white
Total . . . . . . . . . . . . . . . . . . 100.0 100.0 100.0 100.0 100.0 100.0 100.0 100.0 100.0 100.0 100.0 100.0 100.0
Less than 1.25 . . . . . . . . . . . . 0.1 1.7 0.0 0.0 0.0 0.0 0.0 0.0 0.0 0.2 0.0 0.0 0.11.25–1.74 . . . . . . . . . . . . . . . 0.6 4.8 3.7 0.0 1.1 3.4 0.0 0.5 0.3 0.2 0.0 0.0 0.21.75–2.24 . . . . . . . . . . . . . . . 3.0 13.5 7.5 4.9 2.9 8.1 4.3 2.6 2.0 1.7 2.1 2.2 0.82.25–2.74 . . . . . . . . . . . . . . . 6.9 16.9 15.7 11.4 13.9 11.3 5.1 8.4 5.3 5.5 4.6 2.6 3.82.75–3.24 . . . . . . . . . . . . . . . 10.5 17.7 14.6 13.7 16.1 7.5 12.2 7.5 11.9 9.3 10.5 10.7 6.93.25–3.74 . . . . . . . . . . . . . . . 14.0 13.6 13.9 11.2 16.5 18.4 8.5 14.2 17.8 13.9 12.2 12.1 12.03.75–4.24 . . . . . . . . . . . . . . . 14.2 11.5 10.4 16.1 13.5 14.6 11.5 14.7 12.5 15.0 14.0 17.8 15.04.25–4.74 . . . . . . . . . . . . . . . 13.1 5.8 10.2 14.9 12.0 15.5 13.2 15.8 8.7 12.7 17.0 13.6 14.84.75–5.24 . . . . . . . . . . . . . . . 11.0 3.0 8.1 10.3 8.5 7.0 15.0 7.4 13.5 12.4 10.3 14.4 11.35.25–5.74 . . . . . . . . . . . . . . . 8.0 2.2 5.8 7.4 5.7 2.2 8.3 8.4 7.5 11.7 6.5 8.7 9.35.75–6.24 . . . . . . . . . . . . . . . 6.1 1.6 2.2 3.3 3.4 5.2 6.1 7.7 5.9 6.3 7.6 5.7 7.76.25–6.74 . . . . . . . . . . . . . . . 3.3 2.9 2.3 1.8 3.6 0.4 3.3 4.7 3.7 1.6 3.0 4.2 4.86.75–7.24 . . . . . . . . . . . . . . . 2.4 2.8 0.6 2.0 1.0 1.3 3.3 0.5 3.2 2.7 3.7 2.3 3.37.25–7.74 . . . . . . . . . . . . . . . 2.2 0.6 1.2 0.7 0.0 0.0 3.0 3.1 2.5 2.1 3.1 1.9 2.57.75–8.24 . . . . . . . . . . . . . . . 1.3 0.0 0.5 0.4 0.0 2.1 1.6 1.1 1.5 1.3 1.0 1.4 2.98.25–8.74 . . . . . . . . . . . . . . . 1.0 0.7 2.6 0.6 0.0 0.4 0.7 1.7 0.9 0.7 1.2 1.0 1.18.75–9.24 . . . . . . . . . . . . . . . 0.7 0.3 0.2 0.2 0.7 1.5 0.6 0.5 0.9 0.5 0.7 0.6 1.09.25 and more . . . . . . . . . . . . 1.7 0.3 0.4 1.2 1.1 1.0 3.1 0.9 2.0 2.3 2.6 0.8 2.5
Non-Hispanic black
Total . . . . . . . . . . . . . . . . . . 100.0 100.0 100.0 100.0 100.0 100.0 100.0 100.0 100.0 100.0 100.0 100.0 100.0
Less than 1.25 . . . . . . . . . . . . 1.7 7.0 3.4 2.6 3.1 2.7 3.2 0.4 0.7 0.7 0.5 0.9 1.51.25–1.74 . . . . . . . . . . . . . . . 6.9 14.5 9.5 11.1 10.7 12.2 4.7 3.9 7.9 6.4 3.4 3.9 3.11.75–2.24 . . . . . . . . . . . . . . . 12.4 17.3 13.7 12.9 16.2 15.1 14.4 10.2 9.5 16.5 9.8 10.6 7.02.25–2.74 . . . . . . . . . . . . . . . 15.5 13.8 13.8 15.2 17.0 14.9 20.0 15.2 17.3 15.7 9.5 11.8 15.32.75–3.24 . . . . . . . . . . . . . . . 13.9 12.4 14.9 11.7 18.2 11.2 12.7 16.4 12.3 10.5 16.4 16.3 13.63.25–3.74 . . . . . . . . . . . . . . . 12.9 10.4 14.1 14.7 10.3 14.6 9.5 13.5 13.2 11.1 14.7 17.1 13.43.75–4.24 . . . . . . . . . . . . . . . 9.4 5.9 8.9 8.6 6.9 6.6 11.7 10.9 8.1 9.4 7.7 11.4 16.34.25–4.74 . . . . . . . . . . . . . . . 8.2 5.6 5.1 5.5 4.4 5.1 9.0 8.8 9.8 8.7 12.7 9.1 8.04.75–5.24 . . . . . . . . . . . . . . . 5.9 3.9 5.0 3.7 4.1 6.1 6.4 5.7 7.7 4.8 8.9 7.2 4.15.25–5.74 . . . . . . . . . . . . . . . 3.8 2.3 2.3 6.3 2.9 3.2 3.8 4.9 3.2 2.8 3.6 4.0 6.85.75–6.24 . . . . . . . . . . . . . . . 2.7 0.9 2.1 2.0 1.2 1.1 1.8 3.4 3.1 4.0 3.6 2.1 4.76.25–6.74 . . . . . . . . . . . . . . . 2.1 2.5 1.5 0.5 2.5 2.1 1.2 2.2 2.3 1.7 5.0 0.9 2.56.75–7.24 . . . . . . . . . . . . . . . 1.5 1.0 1.4 1.3 0.8 0.4 0.3 1.5 2.1 3.3 0.9 2.4 0.07.25–7.74 . . . . . . . . . . . . . . . 1.1 0.4 2.0 1.8 1.1 1.8 0.8 1.0 0.8 2.1 0.3 0.3 0.97.75–8.24 . . . . . . . . . . . . . . . 0.7 0.8 1.1 0.0 0.0 1.5 0.2 1.1 0.6 0.9 0.9 0.7 0.08.25–8.74 . . . . . . . . . . . . . . . 0.3 0.3 0.4 0.8 0.2 0.0 0.2 0.1 0.2 0.3 0.5 0.4 0.68.75–9.24 . . . . . . . . . . . . . . . 0.4 0.5 0.5 0.6 0.0 0.9 0.0 0.1 0.5 0.3 0.6 0.7 0.69.25 and more . . . . . . . . . . . . 0.6 0.4 0.1 0.6 0.4 0.3 0.1 0.9 0.8 0.7 1.0 0.0 1.7
See footnotes at end of table.
Series 11, No. 247 [ Page 111

Table 83. Percent distribution of granulocytes as 109 cells per liter, measured electronically (CoulterTM 3-part differential) for males 1 yearand over, by race/ethnicity and age: United States, 1988–94—Con.
Race/ethnicityand selected
granulocyte cutoffs1 year
and over1–2
years3–5
years6–8
years9–11years
12–14years
15–19years
20–29years
30–39years
40–49years
50–59years
60–69years
70 yearsand over
Mexican American
Total . . . . . . . . . . . . . . . . . . 100.0 100.0 100.0 100.0 100.0 100.0 100.0 100.0 100.0 100.0 100.0 100.0 100.0
Less than 1.25 . . . . . . . . . . . . 0.2 0.9 0.4 0.5 0.5 0.0 0.0 0.2 0.2 0.0 0.0 0.0 0.01.25–1.74 . . . . . . . . . . . . . . . 0.5 2.0 1.0 0.4 2.6 0.5 0.2 0.0 0.3 0.2 0.5 0.1 0.01.75–2.24 . . . . . . . . . . . . . . . 2.7 12.8 3.5 5.4 1.9 1.8 2.1 2.3 1.5 2.0 2.3 1.8 1.02.25–2.74 . . . . . . . . . . . . . . . 6.5 7.8 9.1 2.7 14.7 5.1 6.7 6.6 5.7 7.0 1.8 2.1 2.32.75–3.24 . . . . . . . . . . . . . . . 10.5 16.5 14.2 8.7 12.8 12.9 9.5 8.9 12.1 7.9 10.6 7.4 4.53.25–3.74 . . . . . . . . . . . . . . . 14.4 15.0 9.7 16.7 13.1 16.1 15.0 15.3 14.0 15.3 12.2 12.1 14.53.75–4.24 . . . . . . . . . . . . . . . 14.4 12.7 21.6 16.1 11.5 13.1 17.6 12.9 12.4 15.9 13.6 16.9 11.64.25–4.74 . . . . . . . . . . . . . . . 12.5 6.8 10.7 15.2 9.8 14.3 10.0 12.0 15.7 11.1 11.9 17.8 18.94.75–5.24 . . . . . . . . . . . . . . . 10.6 5.8 7.2 11.6 9.5 10.6 10.6 11.8 8.5 10.9 16.9 10.1 17.75.25–5.74 . . . . . . . . . . . . . . . 8.5 8.5 8.6 6.7 9.3 4.3 6.5 7.7 9.5 11.1 8.1 12.3 11.15.75–6.24 . . . . . . . . . . . . . . . 5.4 3.0 2.9 4.8 3.0 5.1 8.0 7.1 3.6 6.5 6.3 4.1 5.36.25–6.74 . . . . . . . . . . . . . . . 4.3 3.1 2.4 3.7 5.6 5.6 4.0 4.1 5.8 4.0 2.9 3.7 4.26.75–7.24 . . . . . . . . . . . . . . . 3.0 1.1 1.8 2.2 3.0 3.6 2.5 3.7 2.6 2.9 4.2 5.0 3.47.25–7.74 . . . . . . . . . . . . . . . 1.9 1.0 0.4 1.2 0.4 2.4 1.7 2.1 2.8 1.6 3.0 2.7 1.47.75–8.24 . . . . . . . . . . . . . . . 1.3 0.6 1.7 0.3 0.7 1.8 1.5 1.9 0.9 1.5 0.3 1.7 0.38.25–8.74 . . . . . . . . . . . . . . . 0.8 0.2 0.7 0.0 0.5 0.5 1.5 1.4 0.3 0.2 1.1 0.4 1.58.75–9.24 . . . . . . . . . . . . . . . 0.9 0.4 1.9 0.4 0.0 0.4 1.5 0.7 1.4 1.1 0.8 0.2 0.99.25 and more . . . . . . . . . . . . 1.8 1.8 2.1 3.5 1.1 1.8 1.1 1.2 2.7 0.7 3.6 1.5 1.4
0.0 Quantity more than zero but less than 0.05.1Includes all other race/ethnic groups not listed separately.
NOTE: Numbers may not add to totals because of rounding.
Page 112 [ Series 11, No. 247

Table 84. Percent distribution of granulocytes as 109 cells per liter, measured electronically (CoulterTM 3-part differential) for females 1 yearand over, by race/ethnicity and age: United States, 1988–94
Race/ethnicityand selected
granulocyte cutoffs1 year
and over1–2
years3–5
years6–8
years9–11years
12–14years
15–19years
20–29years
30–39years
40–49years
50–59years
60–69years
70 yearsand over
All race/ethnic groups1
Total . . . . . . . . . . . . . . . . . . 100.0 100.0 100.0 100.0 100.0 100.0 100.0 100.0 100.0 100.0 100.0 100.0 100.0
Less than 1.25 . . . . . . . . . . . . 0.4 2.5 1.0 0.3 1.4 0.5 1.1 0.1 0.2 0.1 0.8 0.0 0.11.25–1.74 . . . . . . . . . . . . . . . 1.3 6.1 3.0 2.3 1.6 1.2 0.7 1.3 0.8 1.3 1.0 1.1 0.61.75–2.24 . . . . . . . . . . . . . . . 3.7 16.9 8.1 5.1 6.3 3.3 1.9 2.8 3.6 3.2 3.0 2.7 2.42.25–2.74 . . . . . . . . . . . . . . . 8.4 12.6 12.8 11.8 12.0 8.0 4.0 9.3 7.6 6.1 9.2 10.2 6.82.75–3.24 . . . . . . . . . . . . . . . 10.7 13.9 12.0 12.6 13.7 12.2 7.2 9.0 9.2 10.8 12.9 13.6 9.93.25–3.74 . . . . . . . . . . . . . . . 12.5 14.0 10.2 13.3 14.4 13.5 13.8 9.3 13.0 13.3 13.9 12.9 12.53.75–4.24 . . . . . . . . . . . . . . . 12.9 11.8 12.3 11.3 13.5 9.8 11.2 13.3 12.7 14.3 13.8 12.0 13.64.25–4.74 . . . . . . . . . . . . . . . 12.2 6.7 13.9 11.1 11.4 13.2 16.2 9.1 11.9 13.3 13.1 13.1 12.94.75–5.24 . . . . . . . . . . . . . . . 9.5 4.4 6.9 8.1 7.7 14.8 9.6 8.6 10.0 8.0 9.3 9.8 13.55.25–5.74 . . . . . . . . . . . . . . . 8.0 4.3 7.7 7.6 3.7 10.6 10.5 7.3 7.5 9.6 6.5 9.6 7.85.75–6.24 . . . . . . . . . . . . . . . 5.8 1.7 3.7 5.9 3.9 3.3 6.3 7.0 6.7 6.6 6.1 4.6 5.36.25–6.74 . . . . . . . . . . . . . . . 3.8 0.3 2.5 3.5 3.5 3.9 3.6 5.3 3.4 4.1 2.7 3.3 5.26.75–7.24 . . . . . . . . . . . . . . . 3.2 1.0 2.7 1.9 2.5 1.7 3.7 5.1 3.6 2.5 2.8 2.0 3.27.25–7.74 . . . . . . . . . . . . . . . 2.0 1.2 0.6 1.7 1.2 1.9 2.5 3.0 2.6 1.8 1.5 0.8 2.27.75–8.24 . . . . . . . . . . . . . . . 1.6 1.3 0.5 1.3 0.4 0.8 2.2 2.2 1.8 2.4 0.9 0.8 1.48.25–8.74 . . . . . . . . . . . . . . . 1.2 0.1 0.7 1.3 0.2 0.2 1.1 2.6 1.7 0.6 1.5 1.0 0.68.75–9.24 . . . . . . . . . . . . . . . 0.7 0.2 0.4 0.2 0.5 0.3 0.8 1.2 1.3 0.3 0.2 0.8 0.79.25 and more . . . . . . . . . . . . 2.0 1.0 1.2 0.7 2.0 0.9 3.4 3.5 2.5 1.6 1.0 1.6 1.4
Non-Hispanic white
Total . . . . . . . . . . . . . . . . . . 100.0 100.0 100.0 100.0 100.0 100.0 100.0 100.0 100.0 100.0 100.0 100.0 100.0
Less than 1.25 . . . . . . . . . . . . 0.1 1.8 0.2 0.0 1.1 0.0 0.4 0.0 0.0 0.0 0.3 0.0 0.01.25–1.74 . . . . . . . . . . . . . . . 0.7 5.4 1.4 1.1 0.0 0.0 0.0 0.8 0.3 1.0 0.3 0.8 0.41.75–2.24 . . . . . . . . . . . . . . . 2.5 17.9 7.7 5.0 4.2 1.6 0.2 2.0 2.4 2.2 2.0 1.1 1.72.25–2.74 . . . . . . . . . . . . . . . 7.8 13.2 12.1 11.2 12.5 7.4 3.9 8.0 7.6 4.4 9.2 10.1 6.02.75–3.24 . . . . . . . . . . . . . . . 10.6 13.2 12.8 12.4 13.8 11.2 6.4 8.3 9.2 11.0 13.5 13.3 9.53.25–3.74 . . . . . . . . . . . . . . . 12.8 14.8 10.3 14.0 13.5 13.3 14.4 9.0 13.1 14.1 14.1 13.3 12.73.75–4.24 . . . . . . . . . . . . . . . 13.2 13.4 12.5 11.0 14.1 9.7 11.8 14.0 12.4 15.3 12.9 12.0 14.04.25–4.74 . . . . . . . . . . . . . . . 12.8 6.2 14.1 10.9 13.7 13.6 17.7 9.6 12.4 13.6 14.1 13.4 13.14.75–5.24 . . . . . . . . . . . . . . . 10.2 3.2 7.0 6.6 9.1 18.6 9.9 8.6 11.0 8.7 9.7 10.6 14.15.25–5.74 . . . . . . . . . . . . . . . 8.5 4.1 10.3 9.0 3.7 12.1 10.9 7.5 8.2 9.9 6.6 10.3 8.15.75–6.24 . . . . . . . . . . . . . . . 6.0 1.6 3.0 6.6 4.0 3.6 6.7 7.5 6.5 6.9 6.5 4.5 5.36.25–6.74 . . . . . . . . . . . . . . . 3.7 0.0 3.3 4.4 2.9 3.1 3.6 4.7 2.9 3.8 2.8 3.1 5.66.75–7.24 . . . . . . . . . . . . . . . 3.3 0.6 3.4 1.6 2.8 2.1 4.3 5.8 4.2 1.8 2.8 2.1 3.27.25–7.74 . . . . . . . . . . . . . . . 2.0 1.7 0.1 2.3 1.3 2.5 2.3 3.3 2.5 1.7 1.4 0.8 2.17.75–8.24 . . . . . . . . . . . . . . . 1.6 1.9 0.3 1.6 0.2 0.6 1.7 2.6 1.7 2.6 1.0 0.8 1.48.25–8.74 . . . . . . . . . . . . . . . 1.4 0.0 0.0 1.5 0.3 0.0 1.2 3.2 1.8 0.5 1.7 1.2 0.58.75–9.24 . . . . . . . . . . . . . . . 0.7 0.2 0.3 0.0 0.0 0.0 0.8 0.9 1.6 0.3 0.0 0.7 0.79.25 and more . . . . . . . . . . . . 2.2 0.8 1.3 0.6 2.9 0.6 3.9 4.3 2.2 2.0 1.1 1.9 1.4
Non-Hispanic black
Total . . . . . . . . . . . . . . . . . . 100.0 100.0 100.0 100.0 100.0 100.0 100.0 100.0 100.0 100.0 100.0 100.0 100.0
Less than 1.25 . . . . . . . . . . . . 1.7 7.6 4.9 1.7 3.8 3.0 1.3 0.8 1.2 0.8 1.1 0.4 1.21.25–1.74 . . . . . . . . . . . . . . . 5.6 11.8 8.1 9.4 10.2 7.5 4.7 5.2 3.9 4.3 6.2 3.5 3.11.75–2.24 . . . . . . . . . . . . . . . 10.5 17.6 14.2 7.2 12.4 8.9 11.5 7.6 8.5 12.9 13.2 12.8 8.12.25–2.74 . . . . . . . . . . . . . . . 13.3 13.7 17.4 15.3 15.7 14.1 8.2 13.2 13.6 13.8 9.7 12.9 15.32.75–3.24 . . . . . . . . . . . . . . . 13.2 13.9 10.6 13.4 9.3 14.4 16.4 12.3 12.7 11.5 12.2 18.4 16.03.25–3.74 . . . . . . . . . . . . . . . 11.9 10.2 14.5 12.5 11.0 17.4 9.3 12.2 11.8 12.9 10.8 9.2 10.83.75–4.24 . . . . . . . . . . . . . . . 11.0 8.6 8.3 7.3 13.7 7.1 11.8 10.2 11.8 9.9 15.8 14.3 10.34.25–4.74 . . . . . . . . . . . . . . . 9.0 6.0 6.3 9.7 6.7 8.7 7.4 8.8 10.8 11.0 8.1 9.3 9.34.75–5.24 . . . . . . . . . . . . . . . 5.9 4.3 4.7 9.6 3.6 6.8 6.4 6.6 5.4 5.2 6.2 4.8 6.15.25–5.74 . . . . . . . . . . . . . . . 4.6 1.7 3.0 4.4 5.5 4.0 7.0 4.1 4.2 5.3 5.0 4.1 6.05.75–6.24 . . . . . . . . . . . . . . . 3.8 2.2 2.6 3.3 3.8 3.3 4.4 3.8 4.2 4.1 4.8 2.8 4.26.25–6.74 . . . . . . . . . . . . . . . 3.0 0.0 1.9 2.4 0.6 0.3 3.1 5.4 3.7 2.4 1.8 3.2 3.26.75–7.24 . . . . . . . . . . . . . . . 2.2 1.2 0.5 1.1 1.2 0.8 1.3 4.1 2.3 3.7 1.5 0.6 1.37.25–7.74 . . . . . . . . . . . . . . . 1.4 0.0 0.2 0.6 0.7 0.4 2.3 2.4 1.6 0.8 1.5 0.8 2.37.75–8.24 . . . . . . . . . . . . . . . 0.8 0.0 0.2 0.4 0.8 0.8 0.3 0.9 2.0 0.3 0.2 1.0 0.98.25–8.74 . . . . . . . . . . . . . . . 0.6 0.0 0.4 0.6 0.0 0.7 0.1 0.7 0.8 0.5 1.1 0.4 0.88.75–9.24 . . . . . . . . . . . . . . . 0.6 0.3 1.0 0.4 0.8 0.1 0.9 0.4 0.8 0.3 0.7 0.7 1.09.25 and more . . . . . . . . . . . . 1.0 0.8 1.0 0.6 0.3 1.9 3.7 1.2 0.7 0.4 0.0 0.8 0.0
See footnotes at end of table.
Series 11, No. 247 [ Page 113

Table 84. Percent distribution of granulocytes as 109 cells per liter, measured electronically (CoulterTM 3-part differential) for females 1 yearand over, by race/ethnicity and age: United States, 1988–94—Con.
Race/ethnicityand selected
granulocyte cutoffs1 year
and over1–2
years3–5
years6–8
years9–11years
12–14years
15–19years
20–29years
30–39years
40–49years
50–59years
60–69years
70 yearsand over
Mexican American
Total . . . . . . . . . . . . . . . . . . 100.0 100.0 100.0 100.0 100.0 100.0 100.0 100.0 100.0 100.0 100.0 100.0 100.0
Less than 1.25 . . . . . . . . . . . . 0.1 0.8 0.5 0.4 0.2 0.0 0.0 0.0 0.0 0.0 0.0 0.0 0.01.25–1.74 . . . . . . . . . . . . . . . 0.8 4.5 3.5 0.7 0.5 0.0 0.5 0.4 0.4 0.9 0.0 0.5 0.01.75–2.24 . . . . . . . . . . . . . . . 2.0 7.5 2.6 4.5 1.4 1.8 0.6 2.5 1.8 0.5 1.6 0.6 0.72.25–2.74 . . . . . . . . . . . . . . . 4.8 11.2 11.8 3.2 11.1 5.7 1.4 4.3 1.8 3.4 4.9 3.0 4.82.75–3.24 . . . . . . . . . . . . . . . 8.7 17.2 11.6 13.3 11.8 11.4 3.8 7.2 6.0 8.3 8.7 10.2 7.73.25–3.74 . . . . . . . . . . . . . . . 11.6 8.7 12.8 8.6 13.8 12.4 7.4 12.0 12.6 11.1 14.3 11.4 13.43.75–4.24 . . . . . . . . . . . . . . . 13.4 11.9 12.2 14.9 14.4 15.6 10.0 10.5 13.3 15.2 17.8 18.2 15.54.25–4.74 . . . . . . . . . . . . . . . 13.3 14.4 10.6 12.8 9.6 12.4 13.9 13.1 13.8 14.1 16.9 15.1 12.64.75–5.24 . . . . . . . . . . . . . . . 9.9 8.1 6.3 8.7 7.3 9.5 8.2 10.2 12.1 11.1 7.9 16.2 10.25.25–5.74 . . . . . . . . . . . . . . . 8.7 4.5 8.8 9.0 4.4 9.8 13.3 10.2 6.8 9.1 6.8 7.8 11.75.75–6.24 . . . . . . . . . . . . . . . 7.3 2.9 5.7 9.2 7.6 4.0 14.3 6.0 8.3 8.2 4.8 6.2 7.06.25–6.74 . . . . . . . . . . . . . . . 4.7 0.7 2.2 2.3 5.1 5.4 5.6 7.1 5.3 5.3 1.7 1.3 4.66.75–7.24 . . . . . . . . . . . . . . . 4.1 1.0 2.1 6.3 5.4 2.0 5.6 4.6 3.5 4.1 6.8 4.2 2.07.25–7.74 . . . . . . . . . . . . . . . 2.6 1.7 1.3 1.0 3.7 1.7 5.5 2.3 2.0 2.7 3.9 1.0 4.87.75–8.24 . . . . . . . . . . . . . . . 2.3 1.0 2.7 1.6 1.9 2.8 4.2 2.5 2.4 1.7 1.5 2.4 0.38.25–8.74 . . . . . . . . . . . . . . . 1.8 0.5 2.4 2.0 0.7 0.8 1.8 2.8 2.5 1.2 0.7 0.4 2.28.75–9.24 . . . . . . . . . . . . . . . 1.3 0.1 0.4 0.0 0.4 2.8 1.6 2.6 0.9 0.9 0.3 0.7 1.69.25 and more . . . . . . . . . . . . 2.6 3.4 2.6 1.4 0.7 1.9 2.2 1.9 6.4 2.3 1.4 1.0 0.7
0.0 Quantity more than zero but less than 0.05.1Includes all other race/ethnic groups not listed separately.
NOTE: Numbers may not add to totals because of rounding.
Page 114 [ Series 11, No. 247

Table 85. Percent distribution of lymphocytes as 109 cells per liter, measured electronically (CoulterTM 3-part differential) for persons 1 yearand over, by race/ethnicity and age: United States, 1988–94
Race/ethnicity andselected lymphoctye
number cutoffs1 year
and over1–2
years3–5
years6–8
years9–11years
12–14years
15–19years
20–29years
30–39years
40–49years
50–59years
60–69years
70 yearsand over
All race/ethnic groups1
Total . . . . . . . . . . . . . . . . . . 100.0 100.0 100.0 100.0 100.0 100.0 100.0 100.0 100.0 100.0 100.0 100.0 100.0
Less than 1.00 . . . . . . . . . . . . 0.6 0.0 0.2 0.0 0.3 0.7 0.2 0.2 0.2 0.4 0.4 1.5 2.61.00–1.24 . . . . . . . . . . . . . . . 2.4 0.1 0.4 0.6 0.4 0.1 1.7 2.1 1.7 3.5 3.3 3.3 6.01.25–1.49 . . . . . . . . . . . . . . . 5.4 0.1 0.5 1.0 2.0 1.9 4.8 5.8 6.0 5.5 6.5 7.2 11.01.50–1.74 . . . . . . . . . . . . . . . 10.5 0.5 1.4 2.8 3.5 5.0 10.4 11.5 11.8 13.7 11.5 13.4 14.61.75–1.99 . . . . . . . . . . . . . . . 14.1 0.6 2.7 5.6 8.3 11.5 15.7 17.0 15.7 15.4 14.4 16.4 17.12.00–2.24 . . . . . . . . . . . . . . . 14.8 1.5 4.6 9.4 15.2 18.1 17.8 16.1 15.8 16.3 15.1 14.2 14.52.25–2.49 . . . . . . . . . . . . . . . 13.2 2.0 8.0 11.0 13.4 12.5 17.3 14.5 15.3 12.9 14.0 12.3 10.92.50–2.74 . . . . . . . . . . . . . . . 11.0 3.3 10.1 14.9 14.0 15.7 11.5 10.0 10.8 11.5 11.9 10.9 7.92.75–2.99 . . . . . . . . . . . . . . . 8.2 3.6 9.6 13.1 10.6 10.1 8.1 9.5 8.2 6.5 9.0 6.1 5.33.00–3.24 . . . . . . . . . . . . . . . 6.4 5.5 11.7 9.6 10.5 9.0 6.2 6.1 5.8 6.2 5.4 5.2 3.83.25–3.49 . . . . . . . . . . . . . . . 3.8 4.6 10.6 10.5 8.9 4.2 2.2 2.2 3.3 3.0 3.0 3.5 2.43.50–3.74 . . . . . . . . . . . . . . . 2.6 5.9 7.4 5.1 4.2 5.0 2.0 1.8 2.3 2.0 1.8 2.6 1.03.75–3.99 . . . . . . . . . . . . . . . 1.8 7.3 8.4 5.4 3.6 2.7 0.8 1.4 0.8 1.0 1.1 0.8 0.74.00–4.24 . . . . . . . . . . . . . . . 1.4 7.7 6.2 4.1 2.6 0.9 0.7 0.8 1.1 0.6 0.8 0.9 0.74.25–4.49 . . . . . . . . . . . . . . . 0.9 7.6 5.4 3.0 0.7 1.3 0.0 0.2 0.4 0.4 0.6 0.5 0.24.50–4.74 . . . . . . . . . . . . . . . 0.7 5.7 4.4 1.8 0.8 0.4 0.3 0.3 0.3 0.4 0.5 0.3 0.24.75–4.99 . . . . . . . . . . . . . . . 0.5 5.8 2.3 0.7 0.6 0.5 0.3 0.2 0.1 0.3 0.5 0.1 0.35.00 and more . . . . . . . . . . . . 1.6 38.2 6.3 1.6 0.4 0.4 0.0 0.3 0.2 0.6 0.4 0.7 0.9
Non-Hispanic white
Total . . . . . . . . . . . . . . . . . . 100.0 100.0 100.0 100.0 100.0 100.0 100.0 100.0 100.0 100.0 100.0 100.0 100.0
Less than 1.00 . . . . . . . . . . . . 0.6 0.0 0.2 0.0 0.5 0.9 0.3 0.0 0.2 0.4 0.4 1.7 2.61.00–1.24 . . . . . . . . . . . . . . . 2.6 0.1 0.5 0.7 0.3 0.0 1.3 2.3 1.8 3.9 2.9 3.7 5.91.25–1.49 . . . . . . . . . . . . . . . 6.0 0.0 0.4 1.1 2.6 2.1 5.2 6.6 6.4 5.4 6.8 7.5 11.31.50–1.74 . . . . . . . . . . . . . . . 11.5 0.6 0.7 2.0 3.3 4.7 10.8 12.8 12.6 15.4 11.7 14.6 14.91.75–1.99 . . . . . . . . . . . . . . . 14.9 0.4 2.9 5.9 7.5 11.1 15.4 17.5 17.0 15.5 16.1 17.1 17.82.00–2.24 . . . . . . . . . . . . . . . 15.2 1.3 4.7 8.6 13.1 17.6 18.1 16.8 16.8 17.5 15.7 13.9 14.12.25–2.49 . . . . . . . . . . . . . . . 13.1 1.3 8.2 10.7 14.1 12.6 17.6 14.1 15.0 12.8 13.7 11.9 10.82.50–2.74 . . . . . . . . . . . . . . . 10.6 2.8 8.9 14.4 15.3 16.1 12.0 9.2 10.6 10.1 11.7 10.9 8.12.75–2.99 . . . . . . . . . . . . . . . 7.6 3.3 8.8 12.9 11.6 10.4 7.2 8.9 7.6 6.0 8.6 5.8 4.83.00–3.24 . . . . . . . . . . . . . . . 5.9 5.2 12.9 10.0 10.5 8.4 6.3 5.5 4.8 5.6 5.2 4.2 3.83.25–3.49 . . . . . . . . . . . . . . . 3.5 4.4 10.7 13.0 8.1 4.0 2.1 1.6 3.1 2.6 2.6 3.5 2.33.50–3.74 . . . . . . . . . . . . . . . 2.3 5.7 6.8 4.4 4.1 5.3 2.2 1.4 1.8 1.8 1.6 2.6 0.93.75–3.99 . . . . . . . . . . . . . . . 1.7 7.2 9.4 5.9 3.9 2.7 0.7 1.6 0.6 0.9 1.0 0.6 0.54.00–4.24 . . . . . . . . . . . . . . . 1.3 8.7 6.7 4.2 2.9 1.0 0.9 0.8 1.1 0.4 0.7 0.7 0.64.25–4.49 . . . . . . . . . . . . . . . 0.7 8.0 6.0 2.6 0.5 1.6 0.0 0.1 0.2 0.2 0.3 0.4 0.24.50–4.74 . . . . . . . . . . . . . . . 0.6 5.5 5.0 1.9 1.0 0.4 0.0 0.3 0.2 0.4 0.4 0.3 0.24.75–4.99 . . . . . . . . . . . . . . . 0.4 6.3 2.0 0.5 0.5 0.7 0.0 0.3 0.0 0.2 0.3 0.0 0.35.00 and more . . . . . . . . . . . . 1.4 39.2 5.4 1.2 0.1 0.4 0.0 0.2 0.2 0.6 0.2 0.6 1.0
Non-Hispanic black
Total . . . . . . . . . . . . . . . . . . 100.0 100.0 100.0 100.0 100.0 100.0 100.0 100.0 100.0 100.0 100.0 100.0 100.0
Less than 1.00 . . . . . . . . . . . . 0.5 0.0 0.2 0.0 0.0 0.3 0.1 0.4 0.3 0.5 0.9 0.9 3.31.00–1.24 . . . . . . . . . . . . . . . 1.7 0.0 0.3 0.3 0.3 0.0 1.4 2.0 2.3 1.7 2.1 1.4 6.51.25–1.49 . . . . . . . . . . . . . . . 4.4 0.1 1.2 1.5 1.6 2.5 5.3 4.0 5.1 5.1 6.5 7.6 7.01.50–1.74 . . . . . . . . . . . . . . . 8.8 0.6 2.3 3.8 5.6 5.8 12.7 10.0 11.4 8.5 9.7 9.1 13.21.75–1.99 . . . . . . . . . . . . . . . 12.1 0.8 3.1 6.6 10.1 14.7 16.2 14.1 14.7 12.8 9.8 15.3 10.62.00–2.24 . . . . . . . . . . . . . . . 13.5 1.8 6.1 13.2 15.3 21.1 13.9 16.3 13.1 11.8 11.5 14.4 16.12.25–2.49 . . . . . . . . . . . . . . . 13.1 3.6 8.7 12.3 11.8 12.7 13.9 14.3 13.4 15.2 13.0 13.3 14.92.50–2.74 . . . . . . . . . . . . . . . 11.5 3.9 10.9 12.9 12.2 12.9 11.0 10.9 10.9 14.7 14.4 10.3 7.72.75–2.99 . . . . . . . . . . . . . . . 9.3 5.1 8.7 9.7 11.6 8.1 10.7 10.4 9.5 7.8 10.0 7.9 8.83.00–3.24 . . . . . . . . . . . . . . . 7.3 5.3 9.4 10.9 7.9 9.5 6.1 7.3 6.5 8.0 5.6 6.9 4.93.25–3.49 . . . . . . . . . . . . . . . 4.7 5.0 9.4 6.3 8.5 3.4 4.1 4.1 3.4 4.7 5.6 3.2 2.93.50–3.74 . . . . . . . . . . . . . . . 3.5 6.6 7.3 5.3 4.6 4.3 2.5 1.6 3.6 3.0 4.1 3.2 1.43.75–3.99 . . . . . . . . . . . . . . . 2.8 9.3 7.3 5.7 4.4 2.3 1.6 1.8 2.0 1.6 2.1 2.0 1.54.00–4.24 . . . . . . . . . . . . . . . 1.9 7.6 6.2 3.8 1.4 0.8 0.6 1.4 1.9 1.3 0.6 1.6 0.64.25–4.49 . . . . . . . . . . . . . . . 1.3 5.5 4.1 3.1 2.3 0.8 0.0 0.5 0.5 1.3 1.8 1.2 0.14.50–4.74 . . . . . . . . . . . . . . . 1.0 7.8 3.9 1.9 0.2 0.5 0.0 0.4 0.5 0.7 1.2 0.1 0.04.75–4.99 . . . . . . . . . . . . . . . 0.7 4.6 4.1 1.3 1.1 0.2 0.0 0.0 0.3 0.7 0.5 0.6 0.05.00 and more . . . . . . . . . . . . 2.0 32.3 6.6 1.1 1.2 0.2 0.0 0.5 0.6 0.5 0.6 1.1 0.4
See footnotes at end of table.
Series 11, No. 247 [ Page 115

Table 85. Percent distribution of lymphocytes as 109 cells per liter, measured electronically (CoulterTM 3-part differential) for persons 1 yearand over, by race/ethnicity and age: United States, 1988–94—Con.
Race/ethnicity andselected lymphoctye
number cutoffs1 year
and over1–2
years3–5
years6–8
years9–11years
12–14years
15–19years
20–29years
30–39years
40–49years
50–59years
60–69years
70 yearsand over
Mexican American
Total . . . . . . . . . . . . . . . . . . 100.0 100.0 100.0 100.0 100.0 100.0 100.0 100.0 100.0 100.0 100.0 100.0 100.0
Less than 1.00 . . . . . . . . . . . . 0.4 0.0 0.1 0.0 0.0 0.0 0.6 0.4 0.4 0.4 0.5 0.6 3.21.00–1.24 . . . . . . . . . . . . . . . 1.3 0.0 0.1 0.5 0.5 1.0 0.2 1.9 1.2 1.0 2.7 2.1 7.91.25–1.49 . . . . . . . . . . . . . . . 3.6 0.0 0.7 0.8 0.9 1.0 3.5 4.7 4.4 4.7 8.4 3.9 8.21.50–1.74 . . . . . . . . . . . . . . . 8.0 0.5 2.1 3.1 3.4 5.5 9.4 11.0 9.2 9.3 10.4 9.4 14.21.75–1.99 . . . . . . . . . . . . . . . 12.0 1.8 2.3 5.0 9.3 11.1 16.6 14.9 14.6 12.8 11.4 15.1 14.92.00–2.24 . . . . . . . . . . . . . . 13.4 0.5 4.2 9.5 10.5 14.3 19.6 13.7 15.5 14.7 16.3 18.0 16.92.25–2.49 . . . . . . . . . . . . . . . 13.5 1.8 6.1 11.3 13.6 14.7 14.4 16.3 15.9 14.5 11.5 15.1 8.92.50–2.74 . . . . . . . . . . . . . . . 11.7 2.9 11.4 11.0 11.1 15.3 13.5 12.1 11.0 14.2 10.3 12.1 6.52.75–2.99 . . . . . . . . . . . . . . . 9.3 3.6 11.5 12.1 10.9 13.6 8.6 8.6 8.1 10.0 8.9 8.2 8.63.00–3.24 . . . . . . . . . . . . . . . 7.8 5.5 9.5 11.3 14.9 8.2 6.3 6.7 6.7 7.3 8.2 7.4 3.33.25–3.49 . . . . . . . . . . . . . . . 5.1 4.8 8.8 9.9 9.8 5.7 2.9 4.2 4.1 5.0 3.3 2.9 1.53.50–3.74 . . . . . . . . . . . . . . . 3.9 8.0 10.9 7.8 4.5 3.8 2.6 2.2 3.8 2.3 1.8 2.0 1.73.75–3.99 . . . . . . . . . . . . . . . 2.5 5.0 8.4 3.9 3.2 1.6 1.1 1.4 2.1 1.9 1.5 1.4 1.84.00–4.24 . . . . . . . . . . . . . . . 1.8 7.5 4.9 5.2 3.3 1.7 0.0 0.9 1.4 0.1 0.8 0.5 1.24.25–4.49 . . . . . . . . . . . . . . . 1.3 8.9 4.4 2.4 0.7 0.6 0.4 0.5 0.5 0.6 1.4 0.3 0.14.50–4.74 . . . . . . . . . . . . . . . 1.0 4.8 3.4 2.3 1.5 0.7 0.2 0.2 0.7 0.3 1.4 0.1 0.64.75–4.99 . . . . . . . . . . . . . . . 0.8 6.5 2.8 1.7 1.1 0.1 0.0 0.2 0.1 0.5 0.4 0.2 0.05.00 and more . . . . . . . . . . . . 2.6 38.1 8.3 2.3 0.8 0.9 0.2 0.2 0.2 0.4 0.6 0.7 0.5
0.0 Quantity more than zero but less than 0.05.1Includes all other race/ethnic groups not listed separately.
NOTE: Numbers may not add to totals because of rounding.
Page 116 [ Series 11, No. 247

Table 86. Percent distribution of lymphocytes as 109 cells per liter, measured electronically (CoulterTM 3-part differential) for males 1 yearand over, by race/ethnicity and age: United States, 1988–94
Race/ethnicity andselected lymphoctye
number cutoffs1 year
and over1–2
years3–5
years6–8
years9–11years
12–14years
15–19years
20–29years
30–39years
40–49years
50–59years
60–69years
70 yearsand over
All race/ethnic groups1
Total . . . . . . . . . . . . . . . . . . 100.0 100.0 100.0 100.0 100.0 100.0 100.0 100.0 100.0 100.0 100.0 100.0 100.0
Less than 1.00 . . . . . . . . . . . . 0.7 0.0 0.2 0.0 0.2 0.8 0.3 0.3 0.3 0.4 0.9 1.9 3.61.00–1.24 . . . . . . . . . . . . . . . 2.2 0.2 0.6 0.5 0.3 0.1 1.9 1.2 2.1 2.8 3.1 3.3 7.01.25–1.49 . . . . . . . . . . . . . . . 5.7 0.2 0.7 1.3 3.2 1.7 5.1 7.3 5.8 5.6 7.7 6.5 11.61.50–1.74 . . . . . . . . . . . . . . . 10.6 0.6 1.7 3.9 3.9 4.6 10.9 14.8 9.9 12.6 10.4 15.9 14.71.75–1.99 . . . . . . . . . . . . . . . 14.8 0.5 2.7 6.2 9.1 12.9 16.2 17.7 16.9 17.4 14.8 17.1 17.22.00–2.24 . . . . . . . . . . . . . . . 14.5 2.0 5.3 8.4 14.0 18.6 18.0 16.2 15.9 14.8 14.9 15.0 14.02.25–2.49 . . . . . . . . . . . . . . . 12.7 2.4 6.7 11.3 12.4 11.2 14.5 13.5 16.1 13.6 13.4 10.2 9.82.50–2.74 . . . . . . . . . . . . . . . 11.0 2.4 11.3 15.3 16.0 15.5 13.0 10.0 12.0 8.4 11.5 10.3 8.12.75–2.99 . . . . . . . . . . . . . . . 8.4 2.4 8.6 13.9 9.9 9.9 7.8 9.2 7.8 7.5 10.9 6.8 5.23.00–3.24 . . . . . . . . . . . . . . . 6.0 5.2 12.1 8.6 9.5 9.1 5.5 5.1 4.0 7.4 5.3 5.0 2.83.25–3.49 . . . . . . . . . . . . . . . 4.0 5.1 13.0 10.5 7.4 4.3 2.1 1.1 3.9 3.9 3.1 3.1 2.63.50–3.74 . . . . . . . . . . . . . . . 2.7 7.7 7.5 5.7 4.2 3.9 2.4 1.6 2.6 1.6 1.5 2.4 1.23.75–3.99 . . . . . . . . . . . . . . . 1.8 8.2 7.6 5.7 4.7 2.7 1.1 0.8 0.7 1.4 0.8 0.7 0.44.00–4.24 . . . . . . . . . . . . . . . 1.2 7.6 5.8 2.3 2.6 0.8 1.1 0.3 0.8 0.8 0.4 0.3 0.74.25–4.49 . . . . . . . . . . . . . . . 0.9 6.6 4.4 2.1 0.5 1.9 0.1 0.2 0.7 0.4 0.3 0.3 0.24.50–4.74 . . . . . . . . . . . . . . . 0.6 4.4 3.4 1.4 0.9 0.5 0.0 0.2 0.3 0.6 0.5 0.4 0.04.75–4.99 . . . . . . . . . . . . . . . 0.5 6.1 2.6 0.7 1.0 0.8 0.0 0.2 0.0 0.1 0.1 0.0 0.15.00 and more . . . . . . . . . . . . 1.8 38.5 5.6 2.4 0.3 0.8 0.0 0.3 0.2 0.6 0.5 0.9 0.9
Non-Hispanic white
Total . . . . . . . . . . . . . . . . . . 100.0 100.0 100.0 100.0 100.0 100.0 100.0 100.0 100.0 100.0 100.0 100.0 100.0
Less than 1.00 . . . . . . . . . . . . 0.8 0.0 0.3 0.0 0.3 1.0 0.4 0.0 0.3 0.5 0.8 2.2 3.51.00–1.24 . . . . . . . . . . . . . . . 2.3 0.3 0.9 0.7 0.3 0.0 1.7 1.1 2.2 3.0 2.4 3.7 7.01.25–1.49 . . . . . . . . . . . . . . . 6.3 0.0 0.3 1.3 4.4 1.6 5.2 8.8 6.2 5.4 8.3 6.8 11.81.50–1.74 . . . . . . . . . . . . . . . 11.4 0.6 0.7 3.0 3.1 3.9 10.9 16.9 10.0 14.3 10.5 17.0 15.01.75–1.99 . . . . . . . . . . . . . . . 15.5 0.3 2.6 6.6 8.2 13.5 14.2 17.8 18.3 17.6 16.3 17.5 17.72.00–2.24 . . . . . . . . . . . . . . . 14.6 2.2 6.0 7.4 9.8 18.2 18.6 16.1 16.4 15.3 15.3 14.6 13.42.25–2.49 . . . . . . . . . . . . . . . 12.5 1.6 6.9 11.3 13.1 10.4 13.7 12.5 16.1 14.4 13.2 9.1 9.72.50–2.74 . . . . . . . . . . . . . . . 11.1 2.3 9.9 15.5 18.6 17.1 14.8 10.4 12.5 7.1 11.1 10.8 8.22.75–2.99 . . . . . . . . . . . . . . . 8.1 1.5 8.2 15.0 10.6 10.3 7.3 8.5 7.7 7.1 11.0 6.3 4.63.00–3.24 . . . . . . . . . . . . . . . 5.2 4.7 13.4 9.5 9.8 8.5 5.6 4.2 2.1 6.5 5.4 4.0 2.73.25–3.49 . . . . . . . . . . . . . . . 3.9 5.1 13.7 12.8 7.7 4.6 1.9 0.7 4.1 3.5 2.7 3.2 2.73.50–3.74 . . . . . . . . . . . . . . . 2.3 8.4 6.5 4.6 3.4 3.2 3.1 1.2 1.9 1.6 1.0 2.5 1.23.75–3.99 . . . . . . . . . . . . . . . 1.7 8.4 8.8 6.7 5.3 2.3 1.2 0.8 0.3 1.5 0.7 0.6 0.34.00–4.24 . . . . . . . . . . . . . . . 1.1 7.9 6.8 1.8 2.9 0.6 1.5 0.2 0.8 0.6 0.4 0.3 0.84.25–4.49 . . . . . . . . . . . . . . . 0.6 6.3 4.6 0.5 0.3 2.4 0.0 0.2 0.5 0.4 0.0 0.2 0.24.50–4.74 . . . . . . . . . . . . . . . 0.6 3.8 3.4 0.8 1.0 0.4 0.0 0.2 0.4 0.6 0.5 0.5 0.04.75–4.99 . . . . . . . . . . . . . . . 0.4 7.3 2.6 0.5 1.1 1.0 0.0 0.2 0.0 0.1 0.1 0.0 0.15.00 and more . . . . . . . . . . . . 1.5 39.3 4.5 2.0 0.0 0.8 0.0 0.1 0.3 0.6 0.3 0.7 1.0
Non-Hispanic black
Total . . . . . . . . . . . . . . . . . . 100.0 100.0 100.0 100.0 100.0 100.0 100.0 100.0 100.0 100.0 100.0 100.0 100.0
Less than 1.00 . . . . . . . . . . . . 0.7 0.0 0.3 0.0 0.0 0.7 0.0 0.5 0.2 0.7 2.0 1.0 6.11.00–1.24 . . . . . . . . . . . . . . . 1.7 0.0 0.1 0.0 0.3 0.0 2.3 2.3 2.2 1.4 2.3 2.1 5.51.25–1.49 . . . . . . . . . . . . . . . 5.1 0.3 2.2 2.5 1.9 3.7 7.2 4.6 6.4 5.8 7.3 7.4 7.31.50–1.74 . . . . . . . . . . . . . . . 10.0 0.9 2.0 3.3 7.2 4.5 15.5 12.4 13.6 8.0 10.0 11.8 15.51.75–1.99 . . . . . . . . . . . . . . . 13.6 0.7 3.4 5.7 12.7 18.5 20.9 15.2 15.6 14.3 11.7 15.6 13.52.00–2.24 . . . . . . . . . . . . . . . 13.5 2.1 7.5 13.9 13.8 21.4 13.0 16.1 13.2 14.2 9.5 16.5 15.12.25–2.49 . . . . . . . . . . . . . . . 12.5 4.6 10.0 14.3 10.3 11.0 13.2 15.9 11.8 12.7 13.7 11.5 12.72.50–2.74 . . . . . . . . . . . . . . . 10.4 3.6 11.7 14.7 11.4 11.7 8.4 9.1 10.0 12.4 14.0 8.1 9.02.75–2.99 . . . . . . . . . . . . . . . 8.3 4.3 9.0 5.9 11.4 7.5 7.6 8.8 9.8 6.7 8.5 10.4 5.93.00–3.24 . . . . . . . . . . . . . . . 7.4 5.6 9.5 9.4 7.9 9.7 4.7 8.0 6.3 9.8 4.9 6.7 6.13.25–3.49 . . . . . . . . . . . . . . . 4.2 5.4 9.5 6.8 6.9 2.5 3.9 2.3 2.3 5.8 5.5 2.4 1.63.50–3.74 . . . . . . . . . . . . . . . 3.4 6.6 8.0 6.2 4.6 2.6 1.4 1.5 3.8 2.9 5.0 1.9 0.43.75–3.99 . . . . . . . . . . . . . . . 2.7 11.1 5.9 4.0 5.6 2.6 1.6 1.0 2.8 0.9 2.6 1.2 1.04.00–4.24 . . . . . . . . . . . . . . . 1.6 7.5 4.1 4.6 1.3 1.3 0.3 1.0 1.2 1.5 0.4 0.7 0.04.25–4.49 . . . . . . . . . . . . . . . 1.2 4.3 3.6 3.1 1.7 0.6 0.0 0.2 0.9 0.9 2.2 1.5 0.44.50–4.74 . . . . . . . . . . . . . . . 0.9 6.9 2.7 3.3 0.4 0.9 0.0 0.6 0.0 1.1 0.3 0.0 0.04.75–4.99 . . . . . . . . . . . . . . . 0.6 3.8 3.7 1.6 1.1 0.5 0.0 0.0 0.0 0.2 0.0 0.4 0.05.00 and more . . . . . . . . . . . . 2.0 32.3 6.7 0.8 1.5 0.4 0.0 0.5 0.0 0.7 0.0 1.0 0.0
See footnotes at end of table.
Series 11, No. 247 [ Page 117

Table 86. Percent distribution of lymphocytes as 109 cells per liter, measured electronically (CoulterTM 3-part differential) for males 1 yearand over, by race/ethnicity and age: United States, 1988–94—Con.
Race/ethnicity andselected lymphoctye
number cutoffs1 year
and over1–2
years3–5
years6–8
years9–11years
12–14years
15–19years
20–29years
30–39years
40–49years
50–59years
60–69years
70 yearsand over
Mexican American
Total . . . . . . . . . . . . . . . . . . 100.0 100.0 100.0 100.0 100.0 100.0 100.0 100.0 100.0 100.0 100.0 100.0 100.0
Less than 1.00 . . . . . . . . . . . . 0.5 0.0 0.0 0.0 0.0 0.0 0.7 0.4 0.5 0.3 1.0 0.8 5.11.00–1.24 . . . . . . . . . . . . . . . 1.4 0.0 0.0 0.0 0.8 1.4 0.3 2.2 1.1 1.4 3.2 2.6 7.31.25–1.49 . . . . . . . . . . . . . . . 3.8 0.0 1.3 0.6 0.6 0.4 2.9 5.0 5.2 4.5 9.2 4.4 8.81.50–1.74 . . . . . . . . . . . . . . . 8.5 0.2 3.2 5.1 5.2 4.9 7.4 12.7 9.0 8.6 13.5 8.6 13.21.75–1.99 . . . . . . . . . . . . . . . 13.5 2.0 2.1 8.3 7.9 10.4 20.3 17.2 14.6 15.1 13.5 17.6 17.42.00–2.24 . . . . . . . . . . . . . . . 12.9 0.6 3.9 7.2 9.3 14.9 18.0 14.1 14.8 13.9 15.3 17.6 17.92.25–2.49 . . . . . . . . . . . . . . . 13.9 1.8 5.5 12.5 15.0 12.8 17.2 15.5 17.0 14.8 11.7 13.9 10.62.50–2.74 . . . . . . . . . . . . . . . 11.0 2.6 12.2 8.3 10.3 14.9 14.2 10.2 11.2 14.0 8.7 11.8 5.72.75–2.99 . . . . . . . . . . . . . . . 8.8 3.0 10.0 14.5 11.6 9.1 7.8 8.1 7.7 10.4 8.4 8.7 8.03.00–3.24 . . . . . . . . . . . . . . . 7.9 6.0 11.6 10.1 17.1 10.2 4.9 7.0 7.3 6.5 5.6 6.8 2.33.25–3.49 . . . . . . . . . . . . . . . 5.1 4.3 9.3 10.7 9.9 8.6 2.8 3.6 3.6 5.8 2.7 2.2 0.63.50–3.74 . . . . . . . . . . . . . . . 3.4 6.5 12.4 7.2 4.3 4.4 1.9 1.7 2.7 1.2 2.1 1.9 0.93.75–3.99 . . . . . . . . . . . . . . . 2.1 5.4 7.8 3.3 3.7 1.3 0.6 0.9 2.3 1.4 0.0 1.6 1.44.00–4.24 . . . . . . . . . . . . . . . 1.5 9.0 5.2 2.3 0.9 2.2 0.0 0.5 1.6 0.0 0.8 0.1 0.84.25–4.49 . . . . . . . . . . . . . . . 1.4 8.7 5.2 3.3 0.6 0.9 0.8 0.1 0.4 0.5 2.8 0.5 0.04.50–4.74 . . . . . . . . . . . . . . . 1.1 4.6 2.6 4.2 1.8 1.3 0.2 0.3 0.7 0.5 1.5 0.2 0.04.75–4.99 . . . . . . . . . . . . . . . 0.6 4.6 1.9 1.0 1.1 0.3 0.0 0.3 0.0 0.4 0.0 0.2 0.05.00 and more . . . . . . . . . . . . 2.5 40.7 5.7 1.2 0.0 2.0 0.0 0.2 0.3 0.8 0.0 0.6 0.2
0.0 Quantity more than zero but less than 0.05.1Includes all other race/ethnic groups not listed separately.
NOTE: Numbers may not add to totals because of rounding.
Page 118 [ Series 11, No. 247

Table 87. Percent distribution of lymphocytes as 109 cells per liter, measured electronically (CoulterTM 3-part differential) for females 1 yearand over, by race/ethnicity and age: United States, 1988–94
Race/ethnicity andselected lymphoctye
number cutoffs1 year
and over1–2
years3–5
years6–8
years9–11years
12–14years
15–19years
20–29years
30–39years
40–49years
50–59years
60–69years
70 yearsand over
All race/ethnic groups1
Total . . . . . . . . . . . . . . . . . . 100.0 100.0 100.0 100.0 100.0 100.0 100.0 100.0 100.0 100.0 100.0 100.0 100.0
Less than 1.00 . . . . . . . . . . . . 0.4 0.0 0.1 0.0 0.4 0.5 0.2 0.1 0.2 0.3 0.0 1.1 1.91.00–1.24 . . . . . . . . . . . . . . . 2.6 0.0 0.1 0.6 0.5 0.1 1.4 2.9 1.4 4.2 3.4 3.3 5.31.25–1.49 . . . . . . . . . . . . . . . 5.2 0.0 0.3 0.6 0.8 2.1 4.5 4.3 6.1 5.4 5.3 7.8 10.71.50–1.74 . . . . . . . . . . . . . . . 10.4 0.5 1.2 1.5 3.1 5.4 10.0 8.2 13.6 14.7 12.6 11.3 14.51.75–1.99 . . . . . . . . . . . . . . . 13.4 0.7 2.7 4.8 7.5 10.0 15.2 16.4 14.5 13.5 14.0 15.9 17.02.00–2.24 . . . . . . . . . . . . . . . 15.0 1.0 3.8 10.5 16.4 17.4 17.7 16.1 15.8 17.7 15.2 13.5 14.92.25–2.49 . . . . . . . . . . . . . . . 13.8 1.5 9.2 10.7 14.5 14.0 20.0 15.5 14.6 12.1 14.5 14.1 11.72.50–2.74 . . . . . . . . . . . . . . . 11.0 4.2 8.7 14.4 12.0 15.9 9.9 9.9 9.6 14.4 12.3 11.4 7.82.75–2.99 . . . . . . . . . . . . . . . 8.0 4.8 10.7 12.1 11.2 10.4 8.4 9.8 8.5 5.6 7.2 5.6 5.43.00–3.24 . . . . . . . . . . . . . . . 6.8 5.9 11.3 10.8 11.5 8.9 6.8 7.0 7.6 5.0 5.6 5.4 4.43.25–3.49 . . . . . . . . . . . . . . . 3.7 4.2 8.0 10.5 10.3 4.1 2.3 3.3 2.8 2.2 2.9 3.8 2.33.50–3.74 . . . . . . . . . . . . . . . 2.6 3.9 7.2 4.3 4.3 6.3 1.7 2.0 2.1 2.3 2.2 2.7 0.93.75–3.99 . . . . . . . . . . . . . . . 1.8 6.2 9.2 5.0 2.5 2.7 0.5 2.1 0.9 0.6 1.3 1.0 0.94.00–4.24 . . . . . . . . . . . . . . . 1.6 7.9 6.6 6.1 2.7 1.1 0.3 1.3 1.4 0.4 1.2 1.3 0.64.25–4.49 . . . . . . . . . . . . . . . 0.9 8.7 6.3 4.1 1.0 0.6 0.0 0.2 0.1 0.3 0.8 0.6 0.24.50–4.74 . . . . . . . . . . . . . . . 0.8 7.1 5.5 2.3 0.8 0.3 0.6 0.3 0.3 0.2 0.5 0.2 0.34.75–4.99 . . . . . . . . . . . . . . . 0.5 5.5 2.1 0.7 0.3 0.2 0.5 0.2 0.1 0.4 0.8 0.2 0.45.00 and more . . . . . . . . . . . . 1.5 38.0 7.1 0.8 0.4 0.0 0.0 0.2 0.2 0.6 0.2 0.6 0.9
Non-Hispanic white
Total . . . . . . . . . . . . . . . . . . 100.0 100.0 100.0 100.0 100.0 100.0 100.0 100.0 100.0 100.0 100.0 100.0 100.0
Less than 1.00 . . . . . . . . . . . . 0.5 0.0 0.0 0.0 0.7 0.8 0.1 0.0 0.1 0.4 0.0 1.3 2.11.00–1.24 . . . . . . . . . . . . . . . 2.8 0.0 0.0 0.7 0.2 0.0 0.9 3.5 1.4 4.8 3.3 3.7 5.21.25–1.49 . . . . . . . . . . . . . . . 5.7 0.0 0.4 0.7 0.8 2.6 5.3 4.6 6.5 5.4 5.4 8.1 11.01.50–1.74 . . . . . . . . . . . . . . . 11.6 0.6 0.7 0.9 3.6 5.6 10.7 8.8 15.3 16.6 12.8 12.4 14.81.75–1.99 . . . . . . . . . . . . . . . 14.4 0.6 3.2 5.1 6.9 8.1 16.6 17.2 15.6 13.4 15.9 16.7 17.82.00–2.24 . . . . . . . . . . . . . . . 15.8 0.4 3.3 10.1 16.3 16.8 17.6 17.4 17.2 19.8 16.1 13.3 14.62.25–2.49 . . . . . . . . . . . . . . . 13.6 0.9 9.7 9.9 15.2 15.2 21.5 15.7 13.9 11.2 14.3 14.3 11.42.50–2.74 . . . . . . . . . . . . . . . 10.2 3.4 7.7 13.2 12.1 14.9 9.1 8.1 8.6 13.2 12.2 11.0 8.02.75–2.99 . . . . . . . . . . . . . . . 7.2 5.5 9.3 10.5 12.5 10.5 7.1 9.3 7.5 4.9 6.4 5.4 4.93.00–3.24 . . . . . . . . . . . . . . . 6.5 5.7 12.4 10.7 11.2 8.3 7.1 6.8 7.7 4.6 5.1 4.3 4.53.25–3.49 . . . . . . . . . . . . . . . 3.2 3.6 7.3 13.1 8.4 3.2 2.2 2.5 2.2 1.8 2.5 3.8 2.13.50–3.74 . . . . . . . . . . . . . . . 2.3 2.6 7.1 4.1 4.8 7.9 1.3 1.6 1.6 2.1 2.1 2.7 0.83.75–3.99 . . . . . . . . . . . . . . . 1.6 5.8 10.1 4.8 2.6 3.3 0.2 2.3 0.9 0.3 1.3 0.6 0.64.00–4.24 . . . . . . . . . . . . . . . 1.5 9.6 6.6 7.0 2.9 1.4 0.2 1.4 1.4 0.3 1.0 1.0 0.44.25–4.49 . . . . . . . . . . . . . . . 0.8 10.0 7.6 5.2 0.7 0.6 0.0 0.0 0.0 0.1 0.6 0.6 0.24.50–4.74 . . . . . . . . . . . . . . . 0.7 7.3 6.7 3.1 1.0 0.4 0.0 0.4 0.1 0.2 0.3 0.2 0.34.75–4.99 . . . . . . . . . . . . . . . 0.4 5.1 1.3 0.5 0.0 0.3 0.0 0.3 0.0 0.3 0.5 0.0 0.55.00 and more . . . . . . . . . . . . 1.3 39.0 6.5 0.3 0.2 0.0 0.0 0.2 0.1 0.6 0.1 0.6 1.0
Non-Hispanic black
Total . . . . . . . . . . . . . . . . . . 100.0 100.0 100.0 100.0 100.0 100.0 100.0 100.0 100.0 100.0 100.0 100.0 100.0
Less than 1.00 . . . . . . . . . . . . 0.3 0.0 0.2 0.0 0.0 0.0 0.2 0.2 0.3 0.4 0.0 0.9 1.41.00–1.24 . . . . . . . . . . . . . . . 1.7 0.0 0.6 0.5 0.2 0.0 0.4 1.8 2.4 1.9 2.0 0.8 7.21.25–1.49 . . . . . . . . . . . . . . . 3.7 0.0 0.2 0.5 1.3 1.5 3.4 3.6 4.1 4.6 5.9 7.7 6.81.50–1.74 . . . . . . . . . . . . . . . 7.8 0.3 2.5 4.4 3.9 6.8 10.0 7.9 9.7 8.8 9.4 7.2 11.81.75–1.99 . . . . . . . . . . . . . . . 10.9 0.9 2.9 7.5 7.6 11.5 11.5 13.2 13.9 11.7 8.2 15.0 8.82.00–2.24 13.4 1.5 4.7 12.6 16.8 20.9 14.8 16.5 13.1 9.8 13.1 12.9 16.72.25–2.49 . . . . . . . . . . . . . . . 13.5 2.6 7.5 10.4 13.3 14.1 14.5 12.9 14.7 17.2 12.4 14.6 16.32.50–2.74 . . . . . . . . . . . . . . . 12.4 4.2 10.0 11.1 12.9 13.9 13.5 12.5 11.7 16.6 14.8 11.9 6.92.75–2.99 . . . . . . . . . . . . . . . 10.2 5.9 8.5 13.4 11.8 8.6 13.9 11.7 9.2 8.8 11.3 6.1 10.63.00–3.24 . . . . . . . . . . . . . . . 7.1 5.0 9.4 12.5 8.0 9.3 7.4 6.7 6.6 6.7 6.1 7.1 4.23.25–3.49 . . . . . . . . . . . . . . . 5.2 4.6 9.4 5.9 10.2 4.1 4.2 5.6 4.3 3.8 5.7 3.7 3.73.50–3.74 3.5 6.7 6.5 4.5 4.5 5.7 3.6 1.6 3.4 3.1 3.3 4.2 2.13.75–3.99 . . . . . . . . . . . . . . . 2.8 7.5 8.7 7.3 3.1 2.1 1.6 2.5 1.4 2.1 1.7 2.5 1.84.00–4.24 . . . . . . . . . . . . . . . 2.1 7.7 8.2 3.1 1.6 0.3 0.9 1.8 2.5 1.1 0.7 2.3 1.04.25–4.49 . . . . . . . . . . . . . . . 1.4 6.7 4.7 3.2 2.9 1.1 0.0 0.8 0.2 1.6 1.5 1.0 0.04.50–4.74 . . . . . . . . . . . . . . . 1.0 8.7 5.1 0.6 0.0 0.1 0.0 0.2 0.9 0.3 2.0 0.2 0.04.75–4.99 . . . . . . . . . . . . . . . 0.9 5.3 4.5 1.1 1.1 0.0 0.0 0.0 0.6 1.1 0.9 0.8 0.05.00 and more . . . . . . . . . . . . 2.0 32.4 6.4 1.5 0.9 0.0 0.0 0.6 1.0 0.5 1.2 1.1 0.6
See footnotes at end of table.
Series 11, No. 247 [ Page 119

Table 87. Percent distribution of lymphocytes as 109 cells per liter, measured electronically (CoulterTM 3-part differential) for females 1 yearand over, by race/ethnicity and age: United States, 1988–94—Con.
Race/ethnicity andselected lymphoctye
number cutoffs1 year
and over1–2
years3–5
years6–8
years9–11years
12–14years
15–19years
20–29years
30–39years
40–49years
50–59years
60–69years
70 yearsand over
Mexican American
Total . . . . . . . . . . . . . . . . . . 100.0 100.0 100.0 100.0 100.0 100.0 100.0 100.0 100.0 100.0 100.0 100.0 100.0
Less than 1.00 . . . . . . . . . . . . 0.3 0.0 0.2 0.0 0.0 0.0 0.5 0.3 0.4 0.6 0.0 0.4 1.41.00–1.24 . . . . . . . . . . . . . . . 1.1 0.0 0.2 0.9 0.2 0.6 0.2 1.6 1.2 0.6 2.1 1.7 8.61.25–1.49 . . . . . . . . . . . . . . . 3.4 0.0 0.1 0.9 1.2 1.6 4.1 4.3 3.6 5.0 7.7 3.5 7.61.50–1.74 . . . . . . . . . . . . . . . 7.4 0.7 1.1 1.2 1.3 6.1 11.5 8.8 9.5 10.1 7.4 10.1 15.31.75–1.99 . . . . . . . . . . . . . . . 10.4 1.5 2.5 1.8 10.9 11.8 12.6 12.0 14.6 10.3 9.4 13.1 12.42.00–2.24 . . . . . . . . . . . . . . . 13.9 0.3 4.4 11.6 11.9 13.8 21.3 13.2 16.3 15.5 17.3 18.3 15.82.25–2.49 . . . . . . . . . . . . . . . 13.1 1.9 6.8 10.2 11.9 16.2 11.3 17.2 14.7 14.3 11.3 16.1 7.22.50–2.74 . . . . . . . . . . . . . . . 12.4 3.1 10.6 13.6 12.1 15.7 12.7 14.4 10.9 14.4 11.9 12.4 7.12.75–2.99 . . . . . . . . . . . . . . . 9.8 4.1 13.0 9.8 10.1 17.4 9.4 9.3 8.6 9.5 9.4 7.8 9.23.00–3.24 . . . . . . . . . . . . . . . 7.7 5.0 7.3 12.4 12.3 6.5 7.8 6.3 6.1 8.1 10.8 7.9 4.33.25–3.49 . . . . . . . . . . . . . . . 5.1 5.4 8.3 9.1 9.8 3.3 3.0 4.9 4.7 4.2 3.9 3.4 2.43.50–3.74 . . . . . . . . . . . . . . . 4.5 9.7 9.5 8.4 4.8 3.3 3.3 2.9 5.1 3.5 1.6 2.1 2.53.75–3.99 . . . . . . . . . . . . . . . 2.8 4.7 9.0 4.5 2.6 1.9 1.7 2.1 1.8 2.4 3.0 1.2 2.24.00–4.24 . . . . . . . . . . . . . . . 2.1 5.9 4.6 8.0 6.1 1.3 0.0 1.3 1.1 0.2 0.8 0.9 1.64.25–4.49 . . . . . . . . . . . . . . . 1.2 9.1 3.5 1.6 0.8 0.4 0.0 1.0 0.5 0.8 0.0 0.1 0.34.50–4.74 . . . . . . . . . . . . . . . 0.9 4.9 4.2 0.4 1.3 0.2 0.3 0.1 0.7 0.0 1.4 0.0 1.34.75–4.99 . . . . . . . . . . . . . . . 1.0 8.5 3.8 2.3 1.0 0.0 0.0 0.0 0.2 0.7 0.9 0.3 0.05.00 and more . . . . . . . . . . . . 2.8 35.2 10.9 3.3 1.7 0.0 0.3 0.1 0.0 0.0 1.3 0.8 0.8
0.0 Quantity more than zero but less than 0.05.1Includes all other race/ethnic groups not listed separately.
NOTE: Numbers may not add to totals because of rounding.
Page 120 [ Series 11, No. 247

Table 88. Percent distribution of mononuclear cells as 109 cells per liter, measured electronically (CoulterTM 3-part differential) for persons 1year and over, by race/ethnicity and age: United States, 1988–94
Race/ethnicity andselected mononuclear
cell number cutoffs1 year
and over1–2
years3–5
years6–8
years9–11years
12–14years
15–19years
20–29years
30–39years
40–49years
50–59years
60–69years
70 yearsand over
All race/ethnic groups1
Total . . . . . . . . . . . . . . . . . . 100.0 100.0 100.0 100.0 100.0 100.0 100.0 100.0 100.0 100.0 100.0 100.0 100.0
Less than 0.100 . . . . . . . . . . . 0.4 0.0 0.3 0.2 0.2 0.3 0.2 0.3 0.5 0.6 0.3 0.7 0.60.100–0.224 . . . . . . . . . . . . . 13.7 5.3 11.6 12.7 12.1 15.7 15.2 14.1 15.8 13.3 12.2 12.1 14.60.225–0.349 . . . . . . . . . . . . . 19.3 10.1 15.5 18.5 17.5 16.4 18.1 20.5 19.6 22.8 20.3 18.1 19.00.350–0.474 . . . . . . . . . . . . . 31.5 19.9 26.8 27.2 31.9 35.1 32.6 32.0 32.8 33.0 31.4 31.5 29.60.475–0.599 . . . . . . . . . . . . . 15.0 17.7 14.2 15.7 13.8 13.5 16.0 15.8 14.2 14.2 16.0 16.1 13.80.600–0.724 . . . . . . . . . . . . . 12.0 20.7 16.7 12.6 14.4 10.7 11.5 10.7 10.8 10.3 11.8 13.5 13.10.725–0.849 . . . . . . . . . . . . . 3.6 8.7 6.0 4.7 4.1 3.9 3.1 3.3 2.7 3.3 3.5 3.4 3.60.850–0.974 . . . . . . . . . . . . . 2.2 8.4 3.7 3.8 2.6 1.7 1.6 1.7 1.2 1.6 2.4 2.9 2.80.975–1.099 . . . . . . . . . . . . . 0.8 2.4 2.1 1.4 1.1 1.7 0.4 0.6 0.7 0.4 0.7 0.6 0.81.100 and more . . . . . . . . . . . 1.5 6.8 3.0 3.4 2.1 0.9 1.2 1.0 1.5 0.4 1.3 1.2 2.2
Non-Hispanic white
Total . . . . . . . . . . . . . . . . . . 100.0 100.0 100.0 100.0 100.0 100.0 100.0 100.0 100.0 100.0 100.0 100.0 100.0
Less than 0.100 . . . . . . . . . . . 0.4 0.0 0.5 0.1 0.2 0.0 0.2 0.2 0.5 0.7 0.3 0.8 0.30.100–0.224 . . . . . . . . . . . . . 13.1 4.8 9.1 11.5 9.0 14.6 14.6 13.8 15.3 13.2 12.2 11.6 13.70.225–0.349 . . . . . . . . . . . . . 19.2 10.5 17.2 18.9 17.6 14.2 17.3 19.6 19.9 23.4 19.9 17.3 18.80.350–0.474 . . . . . . . . . . . . . 31.6 18.2 24.9 27.0 33.1 36.4 32.4 31.9 32.9 33.0 32.3 31.9 29.50.475–0.599 . . . . . . . . . . . . . 15.3 19.1 15.4 17.4 13.3 15.0 16.7 16.4 14.6 14.2 15.7 16.3 14.00.600–0.724 . . . . . . . . . . . . . 12.5 22.5 18.0 12.2 15.6 11.4 13.4 11.3 11.8 10.1 11.9 13.6 13.80.725–0.849 . . . . . . . . . . . . . 3.6 8.9 6.1 4.0 4.7 4.0 2.7 3.3 2.8 3.4 3.8 3.7 3.80.850–0.974 . . . . . . . . . . . . . 2.0 7.2 3.8 4.1 3.3 1.9 1.2 1.8 0.3 1.5 1.9 3.0 3.00.975–1.099 . . . . . . . . . . . . . 0.8 2.7 2.4 1.5 1.4 1.8 0.2 0.7 0.7 0.2 0.7 0.6 0.91.100 and more . . . . . . . . . . . 1.4 6.2 2.6 3.4 1.9 0.6 1.4 1.0 1.2 0.3 1.2 1.2 2.2
Non-Hispanic black
Total . . . . . . . . . . . . . . . . . . 100.0 100.0 100.0 100.0 100.0 100.0 100.0 100.0 100.0 100.0 100.0 100.0 100.0
Less than 0.100 . . . . . . . . . . . 0.7 0.1 0.1 0.2 0.2 1.4 0.1 0.9 1.1 0.4 0.8 0.7 1.80.100–0.224 . . . . . . . . . . . . . 18.5 6.5 16.5 19.9 18.1 18.0 20.4 20.5 17.8 18.9 15.6 19.2 23.70.225–0.349 . . . . . . . . . . . . . 21.7 10.9 15.0 18.1 19.6 21.6 23.2 24.1 21.8 21.5 24.5 24.4 23.90.350–0.474 . . . . . . . . . . . . . 29.0 23.0 24.6 27.6 28.6 36.4 30.4 28.9 28.9 31.9 29.2 26.6 25.70.475–0.599 . . . . . . . . . . . . . 12.0 14.1 12.3 7.6 13.2 9.0 11.9 11.1 14.4 11.7 10.9 13.1 12.80.600–0.724 . . . . . . . . . . . . . 9.1 17.7 14.1 12.3 10.1 7.3 6.2 8.8 7.4 8.3 9.7 11.2 6.70.725–0.849 . . . . . . . . . . . . . 3.2 6.4 6.0 4.0 3.1 2.1 3.3 2.4 2.9 2.6 3.7 2.4 3.20.850–0.974 . . . . . . . . . . . . . 2.6 10.9 4.6 3.4 2.0 1.4 2.0 1.5 2.6 2.9 2.7 1.3 0.80.975–1.099 . . . . . . . . . . . . . 0.7 1.7 1.9 1.2 1.1 0.2 0.9 0.5 0.5 0.6 0.8 0.0 0.31.100 and more . . . . . . . . . . . 2.5 8.7 4.9 5.7 3.9 2.5 1.6 1.3 2.7 1.2 2.2 1.1 1.1
Mexican American
Total . . . . . . . . . . . . . . . . . . 100.0 100.0 100.0 100.0 100.0 100.0 100.0 100.0 100.0 100.0 100.0 100.0 100.0
Less than 0.100 . . . . . . . . . . . 0.4 0.0 0.1 0.6 0.3 1.1 0.8 0.2 0.4 0.5 1.0 0.1 0.60.100–0.224 . . . . . . . . . . . . . 12.4 5.5 10.4 12.2 13.2 8.0 15.0 12.7 14.8 10.8 13.1 13.0 13.60.225–0.349 . . . . . . . . . . . . . 19.2 9.5 13.7 17.2 16.5 21.1 19.8 20.7 20.5 20.9 20.9 19.7 20.30.350–0.474 . . . . . . . . . . . . . 31.7 22.3 26.5 26.1 30.4 32.6 30.2 34.6 33.5 34.0 33.1 31.8 33.00.475–0.599 . . . . . . . . . . . . . 15.9 17.1 15.4 18.2 20.2 14.5 15.7 15.1 14.9 17.1 13.0 17.5 15.70.600–0.724 . . . . . . . . . . . . . 12.1 18.4 17.6 12.9 12.8 14.3 12.2 10.2 9.0 12.3 13.0 12.3 9.70.725–0.849 . . . . . . . . . . . . . 4.0 9.7 7.8 4.6 2.7 4.3 3.3 3.5 3.6 2.9 3.7 1.9 3.50.850–0.974 . . . . . . . . . . . . . 2.1 7.7 3.9 4.8 1.7 1.5 1.6 1.5 2.2 0.6 0.2 2.2 1.70.975–1.099 . . . . . . . . . . . . . 0.7 2.0 1.5 1.6 0.8 0.8 0.3 0.4 0.1 0.5 1.0 0.9 0.41.100 and more . . . . . . . . . . . 1.5 7.9 2.9 1.7 1.4 1.7 1.0 1.1 1.0 0.4 1.0 0.9 1.6
0.0 Quantity more than zero but less than 0.05.1Includes all other race/ethnic groups not listed separately.
NOTE: Numbers may not add to totals because of rounding.
Series 11, No. 247 [ Page 121

Table 89. Percent distribution of mononuclear cells as 109 cells per liter, measured electronically (CoulterTM 3-part differential) for males 1year and over, by race/ethnicity and age: United States, 1988–94
Race/ethnicity andselected mononuclear
cell number cutoffs1 year
and over1–2
years3–5
years6–8
years9–11years
12–14years
15–19years
20–29years
30–39years
40–49years
50–59years
60–69years
70 yearsand over
All race/ethnic groups1
Total . . . . . . . . . . . . . . . . . . 100.0 100.0 100.0 100.0 100.0 100.0 100.0 100.0 100.0 100.0 100.0 100.0 100.0
Less than 0.100 . . . . . . . . . . . 0.3 0.0 0.4 0.1 0.1 0.1 0.3 0.2 0.5 0.2 0.0 0.9 1.00.100–0.224 . . . . . . . . . . . . . 11.0 4.0 12.3 12.0 12.1 15.1 13.7 10.3 11.2 9.6 10.1 9.0 12.80.225–0.349 . . . . . . . . . . . . . 16.9 8.4 15.5 14.2 17.1 14.8 15.0 19.3 18.7 18.7 16.1 15.3 14.50.350–0.474 . . . . . . . . . . . . . 31.1 20.5 23.9 27.4 32.6 29.9 32.1 32.1 33.0 33.8 30.2 30.4 29.60.475–0.599 . . . . . . . . . . . . . 16.8 16.3 14.2 16.8 15.6 17.8 17.3 17.6 16.5 16.4 18.5 16.8 15.20.600–0.724 . . . . . . . . . . . . . 14.3 21.4 17.1 15.1 12.8 11.8 14.5 12.8 13.8 13.4 14.2 17.3 15.60.725–0.849 . . . . . . . . . . . . . 4.4 8.7 6.7 5.2 4.6 4.6 3.0 4.2 3.0 4.3 5.3 4.4 4.60.850–0.974 . . . . . . . . . . . . . 2.7 9.5 4.2 3.8 1.7 1.4 1.8 2.3 1.6 2.5 3.8 3.1 3.90.975–1.099 . . . . . . . . . . . . . 1.0 2.8 2.4 1.6 1.7 3.1 0.7 0.6 0.7 0.7 0.5 0.9 0.61.100 and more . . . . . . . . . . . 1.5 8.4 3.4 3.8 1.7 1.3 1.5 0.6 1.0 0.4 1.4 1.9 2.2
Non-Hispanic white
Total . . . . . . . . . . . . . . . . . . 100.0 100.0 100.0 100.0 100.0 100.0 100.0 100.0 100.0 100.0 100.0 100.0 100.0
Less than 0.100 . . . . . . . . . . . 0.3 0.0 0.6 0.0 0.0 0.0 0.5 0.2 0.5 0.1 0.0 1.0 0.60.100–0.224 . . . . . . . . . . . . . 10.3 3.7 8.9 9.7 9.2 14.8 13.6 10.0 10.6 9.4 9.7 9.4 11.70.225–0.349 . . . . . . . . . . . . . 16.5 8.6 17.2 14.5 16.7 12.7 12.7 18.3 18.6 18.9 15.6 15.0 13.90.350–0.474 . . . . . . . . . . . . . 31.2 19.6 23.9 26.1 33.7 29.8 31.7 31.3 33.9 34.0 31.5 29.9 29.30.475–0.599 . . . . . . . . . . . . . 17.2 16.8 14.4 20.5 16.3 19.1 18.5 18.4 16.7 16.5 18.0 16.3 15.60.600–0.724 . . . . . . . . . . . . . 15.3 23.6 18.1 14.5 14.6 13.1 16.3 14.3 15.1 13.7 14.7 17.9 16.60.725–0.849 . . . . . . . . . . . . . 4.5 9.1 7.3 5.0 4.9 5.1 2.8 3.7 3.4 4.2 6.0 4.4 4.80.850–0.974 . . . . . . . . . . . . . 2.3 7.9 4.2 3.9 1.5 1.4 1.6 2.5 0.1 2.3 2.8 2.9 4.40.975–1.099 . . . . . . . . . . . . . 1.0 3.1 2.7 1.8 2.2 3.2 0.4 0.8 0.6 0.4 0.4 1.1 0.71.100 and more . . . . . . . . . . . 1.4 7.5 2.7 4.1 1.0 0.9 2.0 0.5 0.5 0.3 1.4 2.1 2.4
Non-Hispanic black
Total . . . . . . . . . . . . . . . . . . 100.0 100.0 100.0 100.0 100.0 100.0 100.0 100.0 100.0 100.0 100.0 100.0 100.0
Less than 0.100 . . . . . . . . . . . 0.4 0.0 0.2 0.0 0.5 1.0 0.0 0.2 1.1 0.3 0.0 0.4 1.80.100–0.224 . . . . . . . . . . . . . 16.1 6.8 15.7 20.7 15.4 19.7 17.2 19.0 15.3 14.3 9.9 11.8 25.50.225–0.349 . . . . . . . . . . . . . 19.9 10.5 17.0 17.1 17.3 21.1 20.3 21.3 19.9 20.4 22.9 21.4 23.80.350–0.474 . . . . . . . . . . . . . 29.4 23.2 22.0 29.3 30.8 28.6 33.7 30.5 29.9 31.7 29.1 29.4 22.10.475–0.599 . . . . . . . . . . . . . 13.2 10.5 13.3 6.9 11.3 10.6 13.2 12.4 18.1 13.8 10.4 15.7 13.50.600–0.724 . . . . . . . . . . . . . 11.0 17.8 13.4 10.2 11.8 8.9 9.1 10.8 9.2 10.4 14.4 14.2 7.40.725–0.849 . . . . . . . . . . . . . 3.3 3.9 5.0 4.7 3.5 3.1 2.0 3.3 2.1 2.7 5.1 4.2 3.90.850–0.974 . . . . . . . . . . . . . 3.0 13.6 6.5 3.2 2.9 2.3 2.2 1.2 1.8 3.8 3.9 1.6 0.50.975–1.099 . . . . . . . . . . . . . 0.8 1.5 1.5 1.8 1.7 0.4 1.3 0.4 0.2 1.2 1.1 0.0 0.01.100 and more . . . . . . . . . . . 2.9 12.1 5.4 6.1 4.8 4.2 1.1 0.8 2.5 1.4 3.1 1.3 1.4
Mexican American
Total . . . . . . . . . . . . . . . . . . 100.0 100.0 100.0 100.0 100.0 100.0 100.0 100.0 100.0 100.0 100.0 100.0 100.0
Less than 0.100 . . . . . . . . . . . 0.3 0.0 0.1 0.7 0.1 0.0 0.5 0.0 0.5 0.1 1.0 0.0 0.00.100–0.224 . . . . . . . . . . . . . 10.8 4.3 10.1 12.4 12.7 4.9 13.4 9.6 14.4 9.3 11.5 10.2 12.20.225–0.349 . . . . . . . . . . . . . 17.1 8.5 14.3 17.6 12.3 16.2 19.3 18.7 17.6 18.2 22.8 11.6 15.60.350–0.474 . . . . . . . . . . . . . 32.1 19.6 20.8 24.2 34.4 32.4 31.0 33.7 36.7 33.9 34.0 32.7 38.90.475–0.599 . . . . . . . . . . . . . 16.6 17.0 17.2 15.5 19.8 18.4 15.1 17.5 14.2 18.4 10.7 21.3 16.10.600–0.724 . . . . . . . . . . . . . 13.4 18.9 20.3 14.5 12.3 16.3 14.5 11.5 9.0 15.2 13.3 15.9 10.10.725–0.849 . . . . . . . . . . . . . 4.8 11.4 6.7 4.6 4.2 6.0 4.5 4.9 3.8 3.4 3.3 2.9 4.40.850–0.974 . . . . . . . . . . . . . 2.7 8.3 4.1 7.7 2.2 2.5 0.8 2.2 3.0 0.8 0.3 4.2 1.20.975–1.099 . . . . . . . . . . . . . 0.7 1.6 2.5 1.2 0.7 0.8 0.0 0.6 0.0 0.1 1.7 0.3 0.41.100 and more . . . . . . . . . . . 1.7 10.4 3.9 1.6 1.3 2.6 0.9 1.2 0.8 0.5 1.3 0.8 1.1
0.0 Quantity more than zero but less than 0.05.1Includes all other race/ethnic groups not listed separately.
NOTE: Numbers may not add to totals because of rounding.
Page 122 [ Series 11, No. 247

Table 90. Percent distribution of mononuclear cells as 109 cells per liter, measured electronically (CoulterTM 3-part differential) for females 1year and over, by race/ethnicity and age: United States, 1988–94
Race/ethnicity andselected mononuclear
cell number cutoffs1 year
and over1–2
years3–5
years6–8
years9–11years
12–14years
15–19years
20–29years
30–39years
40–49years
50–59years
60–69years
70 yearsand over
All race/ethnic groups1
Total . . . . . . . . . . . . . . . . . . 100.0 100.0 100.0 100.0 100.0 100.0 100.0 100.0 100.0 100.0 100.0 100.0 100.0
Less than 0.100 . . . . . . . . . . . 0.5 0.0 0.3 0.3 0.2 0.5 0.1 0.4 0.6 1.0 0.6 0.5 0.30.100–0.224 . . . . . . . . . . . . . 16.3 6.8 10.9 13.4 12.2 16.5 16.6 17.9 20.4 17.0 14.1 14.7 15.70.225–0.349 . . . . . . . . . . . . . 21.6 11.9 15.5 23.5 18.0 18.2 21.3 21.7 20.5 26.8 24.3 20.4 22.00.350–0.474 . . . . . . . . . . . . . 31.8 19.4 30.0 26.9 31.3 40.9 33.2 31.9 32.6 32.2 32.6 32.5 29.50.475–0.599 . . . . . . . . . . . . . 13.3 19.2 14.2 14.4 12.1 8.8 14.7 14.1 12.0 12.0 13.8 15.5 12.90.600–0.724 . . . . . . . . . . . . . 9.7 20.0 16.2 9.7 16.0 9.6 8.5 8.6 7.8 7.3 9.6 10.2 11.50.725–0.849 . . . . . . . . . . . . . 2.9 8.6 5.3 4.0 3.7 3.1 3.2 2.4 2.5 2.4 1.8 2.6 3.00.850–0.974 . . . . . . . . . . . . . 1.7 7.1 3.1 3.7 3.6 1.9 1.5 1.1 0.9 0.8 1.2 2.6 2.00.975–1.099 . . . . . . . . . . . . . 0.6 2.0 1.9 1.1 0.5 0.1 0.1 0.5 0.8 0.1 0.9 0.4 0.91.100 and more . . . . . . . . . . . 1.5 5.0 2.6 2.9 2.4 0.5 0.9 1.4 2.0 0.4 1.2 0.5 2.1
Non-Hispanic white
Total . . . . . . . . . . . . . . . . . . 100.0 100.0 100.0 100.0 100.0 100.0 100.0 100.0 100.0 100.0 100.0 100.0 100.0
Less than 0.100 . . . . . . . . . . . 0.4 0.0 0.4 0.3 0.3 0.0 0.0 0.2 0.4 1.2 0.5 0.6 0.20.100–0.224 . . . . . . . . . . . . . 15.8 6.0 9.3 13.7 8.8 14.4 15.6 17.4 20.3 17.0 14.6 13.6 15.00.225–0.349 . . . . . . . . . . . . . 21.9 12.7 17.2 24.0 18.5 16.1 21.9 20.8 21.2 28.0 24.0 19.3 22.00.350–0.474 . . . . . . . . . . . . . 32.0 16.5 26.1 28.0 32.5 44.7 33.1 32.4 31.8 32.0 33.1 33.6 29.60.475–0.599 . . . . . . . . . . . . . 13.5 21.6 16.4 13.8 10.4 9.9 14.9 14.6 12.5 11.8 13.6 16.2 12.90.600–0.724 . . . . . . . . . . . . . 9.8 21.2 18.0 9.5 16.7 9.4 10.5 8.5 8.4 6.4 9.3 9.8 12.00.725–0.849 . . . . . . . . . . . . . 2.8 8.6 4.7 2.7 4.6 2.6 2.5 2.9 2.1 2.6 1.8 3.0 3.20.850–0.974 . . . . . . . . . . . . . 1.7 6.3 3.5 4.4 5.0 2.7 0.7 1.2 0.5 0.7 1.0 3.1 2.00.975–1.099 . . . . . . . . . . . . . 0.7 2.3 2.1 1.2 0.5 0.0 0.0 0.6 0.9 0.0 1.0 0.3 1.01.100 and more . . . . . . . . . . . 1.4 4.8 2.4 2.5 2.8 0.3 0.8 1.5 1.9 0.3 1.1 0.4 2.1
Non-Hispanic black
Total . . . . . . . . . . . . . . . . . . 100.0 100.0 100.0 100.0 100.0 100.0 100.0 100.0 100.0 100.0 100.0 100.0 100.0
Less than 0.100 . . . . . . . . . . . 0.9 0.3 0.0 0.4 0.0 1.8 0.2 1.5 1.1 0.5 1.4 1.0 1.80.100–0.224 . . . . . . . . . . . . . 20.6 6.1 17.4 19.2 20.7 16.6 23.8 21.7 19.9 22.5 20.3 24.5 22.60.225–0.349 . . . . . . . . . . . . . 23.2 11.3 13.0 19.2 21.9 22.0 26.2 26.5 23.5 22.4 25.8 26.6 24.00.350–0.474 . . . . . . . . . . . . . 28.6 22.7 27.3 25.8 26.4 42.9 26.9 27.6 28.0 32.0 29.2 24.6 28.00.475–0.599 . . . . . . . . . . . . . 11.0 17.8 11.2 8.3 15.2 7.7 10.6 10.0 11.3 10.1 11.3 11.3 12.30.600–0.724 . . . . . . . . . . . . . 7.6 17.7 14.8 14.4 8.4 6.0 3.2 7.0 5.8 6.7 5.8 9.1 6.20.725–0.849 . . . . . . . . . . . . . 3.0 8.8 7.0 3.4 2.8 1.3 4.6 1.6 3.5 2.5 2.5 1.1 2.70.850–0.974 . . . . . . . . . . . . . 2.2 8.2 2.7 3.6 1.0 0.7 1.8 1.8 3.3 2.1 1.7 1.0 1.00.975–1.099 . . . . . . . . . . . . . 0.6 1.9 2.4 0.5 0.5 0.0 0.5 0.5 0.8 0.2 0.6 0.0 0.51.100 and more . . . . . . . . . . . 2.2 5.2 4.3 5.2 3.0 1.0 2.2 1.8 2.9 1.0 1.5 0.9 0.9
Mexican American
Total . . . . . . . . . . . . . . . . . . 100.0 100.0 100.0 100.0 100.0 100.0 100.0 100.0 100.0 100.0 100.0 100.0 100.0
Less than 0.100 . . . . . . . . . . . 0.6 0.0 0.1 0.5 0.5 2.1 1.1 0.4 0.4 0.9 0.9 0.2 1.10.100–0.224 . . . . . . . . . . . . . 14.0 6.7 10.8 12.1 13.8 10.7 16.7 16.7 15.2 12.4 14.6 15.2 15.00.225–0.349 . . . . . . . . . . . . . 21.4 10.6 13.2 16.9 21.4 25.3 20.4 23.2 23.7 23.7 19.2 26.0 25.00.350–0.474 . . . . . . . . . . . . . 31.4 25.2 32.2 28.0 25.6 32.8 29.4 35.6 30.0 34.1 32.3 31.1 27.10.475–0.599 . . . . . . . . . . . . . 15.2 17.2 13.7 20.9 20.8 11.2 16.3 12.2 15.7 15.7 15.2 14.4 15.30.600–0.724 . . . . . . . . . . . . . 10.7 17.8 14.9 11.4 13.5 12.7 9.7 8.4 9.0 9.2 12.6 9.5 9.20.725–0.849 . . . . . . . . . . . . . 3.2 7.9 9.0 4.6 1.0 2.7 2.1 1.7 3.3 2.4 4.1 1.1 2.60.850–0.974 . . . . . . . . . . . . . 1.5 6.9 3.7 2.0 1.2 0.6 2.5 0.6 1.5 0.3 0.0 0.6 2.20.975–1.099 . . . . . . . . . . . . . 0.7 2.4 0.4 1.9 0.9 0.8 0.7 0.2 0.2 0.9 0.3 1.3 0.41.100 and more . . . . . . . . . . . 1.3 5.2 1.9 1.8 1.5 1.1 1.1 1.0 1.1 0.4 0.7 0.6 2.0
0.0 Quantity more than zero but less than 0.05.1Includes all other race/ethnic groups not listed separately.
NOTE: Numbers may not add to totals because of rounding.
Series 11, No. 247 [ Page 123
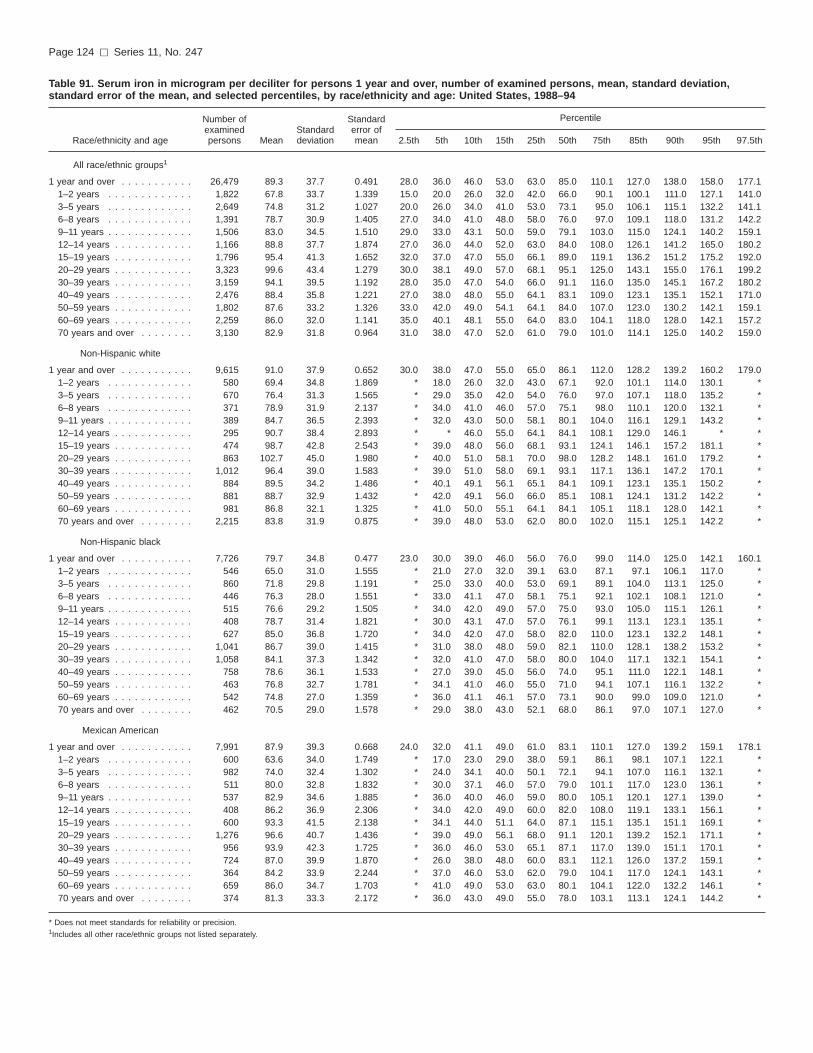
Table 91. Serum iron in microgram per deciliter for persons 1 year and over, number of examined persons, mean, standard deviation,standard error of the mean, and selected percentiles, by race/ethnicity and age: United States, 1988–94
Race/ethnicity and age
Number ofexaminedpersons Mean
Standarddeviation
Standarderror ofmean
Percentile
2.5th 5th 10th 15th 25th 50th 75th 85th 90th 95th 97.5th
All race/ethnic groups1
1 year and over . . . . . . . . . . . 26,479 89.3 37.7 0.491 28.0 36.0 46.0 53.0 63.0 85.0 110.1 127.0 138.0 158.0 177.11–2 years . . . . . . . . . . . . . 1,822 67.8 33.7 1.339 15.0 20.0 26.0 32.0 42.0 66.0 90.1 100.1 111.0 127.1 141.03–5 years . . . . . . . . . . . . . 2,649 74.8 31.2 1.027 20.0 26.0 34.0 41.0 53.0 73.1 95.0 106.1 115.1 132.2 141.16–8 years . . . . . . . . . . . . . 1,391 78.7 30.9 1.405 27.0 34.0 41.0 48.0 58.0 76.0 97.0 109.1 118.0 131.2 142.29–11 years . . . . . . . . . . . . . 1,506 83.0 34.5 1.510 29.0 33.0 43.1 50.0 59.0 79.1 103.0 115.0 124.1 140.2 159.112–14 years . . . . . . . . . . . . 1,166 88.8 37.7 1.874 27.0 36.0 44.0 52.0 63.0 84.0 108.0 126.1 141.2 165.0 180.215–19 years . . . . . . . . . . . . 1,796 95.4 41.3 1.652 32.0 37.0 47.0 55.0 66.1 89.0 119.1 136.2 151.2 175.2 192.020–29 years . . . . . . . . . . . . 3,323 99.6 43.4 1.279 30.0 38.1 49.0 57.0 68.1 95.1 125.0 143.1 155.0 176.1 199.230–39 years . . . . . . . . . . . . 3,159 94.1 39.5 1.192 28.0 35.0 47.0 54.0 66.0 91.1 116.0 135.0 145.1 167.2 180.240–49 years . . . . . . . . . . . . 2,476 88.4 35.8 1.221 27.0 38.0 48.0 55.0 64.1 83.1 109.0 123.1 135.1 152.1 171.050–59 years . . . . . . . . . . . . 1,802 87.6 33.2 1.326 33.0 42.0 49.0 54.1 64.1 84.0 107.0 123.0 130.2 142.1 159.160–69 years . . . . . . . . . . . . 2,259 86.0 32.0 1.141 35.0 40.1 48.1 55.0 64.0 83.0 104.1 118.0 128.0 142.1 157.270 years and over . . . . . . . . 3,130 82.9 31.8 0.964 31.0 38.0 47.0 52.0 61.0 79.0 101.0 114.1 125.0 140.2 159.0
Non-Hispanic white
1 year and over . . . . . . . . . . . 9,615 91.0 37.9 0.652 30.0 38.0 47.0 55.0 65.0 86.1 112.0 128.2 139.2 160.2 179.01–2 years . . . . . . . . . . . . . 580 69.4 34.8 1.869 * 18.0 26.0 32.0 43.0 67.1 92.0 101.1 114.0 130.1 *3–5 years . . . . . . . . . . . . . 670 76.4 31.3 1.565 * 29.0 35.0 42.0 54.0 76.0 97.0 107.1 118.0 135.2 *6–8 years . . . . . . . . . . . . . 371 78.9 31.9 2.137 * 34.0 41.0 46.0 57.0 75.1 98.0 110.1 120.0 132.1 *9–11 years . . . . . . . . . . . . . 389 84.7 36.5 2.393 * 32.0 43.0 50.0 58.1 80.1 104.0 116.1 129.1 143.2 *12–14 years . . . . . . . . . . . . 295 90.7 38.4 2.893 * * 46.0 55.0 64.1 84.1 108.1 129.0 146.1 * *15–19 years . . . . . . . . . . . . 474 98.7 42.8 2.543 * 39.0 48.0 56.0 68.1 93.1 124.1 146.1 157.2 181.1 *20–29 years . . . . . . . . . . . . 863 102.7 45.0 1.980 * 40.0 51.0 58.1 70.0 98.0 128.2 148.1 161.0 179.2 *30–39 years . . . . . . . . . . . . 1,012 96.4 39.0 1.583 * 39.0 51.0 58.0 69.1 93.1 117.1 136.1 147.2 170.1 *40–49 years . . . . . . . . . . . . 884 89.5 34.2 1.486 * 40.1 49.1 56.1 65.1 84.1 109.1 123.1 135.1 150.2 *50–59 years . . . . . . . . . . . . 881 88.7 32.9 1.432 * 42.0 49.1 56.0 66.0 85.1 108.1 124.1 131.2 142.2 *60–69 years . . . . . . . . . . . . 981 86.8 32.1 1.325 * 41.0 50.0 55.1 64.1 84.1 105.1 118.1 128.0 142.1 *70 years and over . . . . . . . . 2,215 83.8 31.9 0.875 * 39.0 48.0 53.0 62.0 80.0 102.0 115.1 125.1 142.2 *
Non-Hispanic black
1 year and over . . . . . . . . . . . 7,726 79.7 34.8 0.477 23.0 30.0 39.0 46.0 56.0 76.0 99.0 114.0 125.0 142.1 160.11–2 years . . . . . . . . . . . . . 546 65.0 31.0 1.555 * 21.0 27.0 32.0 39.1 63.0 87.1 97.1 106.1 117.0 *3–5 years . . . . . . . . . . . . . 860 71.8 29.8 1.191 * 25.0 33.0 40.0 53.0 69.1 89.1 104.0 113.1 125.0 *6–8 years . . . . . . . . . . . . . 446 76.3 28.0 1.551 * 33.0 41.1 47.0 58.1 75.1 92.1 102.1 108.1 121.0 *9–11 years . . . . . . . . . . . . . 515 76.6 29.2 1.505 * 34.0 42.0 49.0 57.0 75.0 93.0 105.0 115.1 126.1 *12–14 years . . . . . . . . . . . . 408 78.7 31.4 1.821 * 30.0 43.1 47.0 57.0 76.1 99.1 113.1 123.1 135.1 *15–19 years . . . . . . . . . . . . 627 85.0 36.8 1.720 * 34.0 42.0 47.0 58.0 82.0 110.0 123.1 132.2 148.1 *20–29 years . . . . . . . . . . . . 1,041 86.7 39.0 1.415 * 31.0 38.0 48.0 59.0 82.1 110.0 128.1 138.2 153.2 *30–39 years . . . . . . . . . . . . 1,058 84.1 37.3 1.342 * 32.0 41.0 47.0 58.0 80.0 104.0 117.1 132.1 154.1 *40–49 years . . . . . . . . . . . . 758 78.6 36.1 1.533 * 27.0 39.0 45.0 56.0 74.0 95.1 111.0 122.1 148.1 *50–59 years . . . . . . . . . . . . 463 76.8 32.7 1.781 * 34.1 41.0 46.0 55.0 71.0 94.1 107.1 116.1 132.2 *60–69 years . . . . . . . . . . . . 542 74.8 27.0 1.359 * 36.0 41.1 46.1 57.0 73.1 90.0 99.0 109.0 121.0 *70 years and over . . . . . . . . 462 70.5 29.0 1.578 * 29.0 38.0 43.0 52.1 68.0 86.1 97.0 107.1 127.0 *
Mexican American
1 year and over . . . . . . . . . . . 7,991 87.9 39.3 0.668 24.0 32.0 41.1 49.0 61.0 83.1 110.1 127.0 139.2 159.1 178.11–2 years . . . . . . . . . . . . . 600 63.6 34.0 1.749 * 17.0 23.0 29.0 38.0 59.1 86.1 98.1 107.1 122.1 *3–5 years . . . . . . . . . . . . . 982 74.0 32.4 1.302 * 24.0 34.1 40.0 50.1 72.1 94.1 107.0 116.1 132.1 *6–8 years . . . . . . . . . . . . . 511 80.0 32.8 1.832 * 30.0 37.1 46.0 57.0 79.0 101.1 117.0 123.0 136.1 *9–11 years . . . . . . . . . . . . . 537 82.9 34.6 1.885 * 36.0 40.0 46.0 59.0 80.0 105.1 120.1 127.1 139.0 *12–14 years . . . . . . . . . . . . 408 86.2 36.9 2.306 * 34.0 42.0 49.0 60.0 82.0 108.0 119.1 133.1 156.1 *15–19 years . . . . . . . . . . . . 600 93.3 41.5 2.138 * 34.1 44.0 51.1 64.0 87.1 115.1 135.1 151.1 169.1 *20–29 years . . . . . . . . . . . . 1,276 96.6 40.7 1.436 * 39.0 49.0 56.1 68.0 91.1 120.1 139.2 152.1 171.1 *30–39 years . . . . . . . . . . . . 956 93.9 42.3 1.725 * 36.0 46.0 53.0 65.1 87.1 117.0 139.0 151.1 170.1 *40–49 years . . . . . . . . . . . . 724 87.0 39.9 1.870 * 26.0 38.0 48.0 60.0 83.1 112.1 126.0 137.2 159.1 *50–59 years . . . . . . . . . . . . 364 84.2 33.9 2.244 * 37.0 46.0 53.0 62.0 79.0 104.1 117.0 124.1 143.1 *60–69 years . . . . . . . . . . . . 659 86.0 34.7 1.703 * 41.0 49.0 53.0 63.0 80.1 104.1 122.0 132.2 146.1 *70 years and over . . . . . . . . 374 81.3 33.3 2.172 * 36.0 43.0 49.0 55.0 78.0 103.1 113.1 124.1 144.2 *
* Does not meet standards for reliability or precision.1Includes all other race/ethnic groups not listed separately.
Page 124 [ Series 11, No. 247

Table 92. Serum iron in microgram per deciliter for males 1 year and over, number of examined persons, mean, standard deviation,standard error of the mean, and selected percentiles, by race/ethnicity and age: United States, 1988–94
Race/ethnicity and age
Number ofexaminedpersons Mean
Standarddeviation
Standarderror ofmean
Percentile
2.5th 5th 10th 15th 25th 50th 75th 85th 90th 95th 97.5th
All race/ethnic groups1
1 year and over . . . . . . . . . . . 12,650 95.1 37.2 0.701 33.1 42.0 53.0 59.0 69.0 91.1 116.1 132.1 142.2 163.2 178.21–2 years . . . . . . . . . . . . . 929 67.4 32.9 1.667 15.0 20.0 26.0 31.0 42.0 66.0 90.1 100.1 113.0 126.1 142.03–5 years . . . . . . . . . . . . . 1,291 74.9 31.8 1.367 20.0 28.0 33.1 41.0 53.0 73.1 94.1 107.1 117.1 137.1 143.06–8 years . . . . . . . . . . . . . 708 79.6 31.3 1.821 27.0 35.0 43.0 48.0 60.0 75.1 100.0 110.1 121.0 133.1 154.29–11 years . . . . . . . . . . . . . 768 82.6 35.0 1.955 29.0 39.0 44.1 51.0 58.0 79.0 103.0 112.1 118.1 140.0 155.212–14 years . . . . . . . . . . . . 540 90.8 37.7 2.508 30.0 36.0 48.0 56.0 64.1 84.1 112.1 130.1 146.2 165.2 181.015–19 years . . . . . . . . . . . . 847 103.4 40.8 2.170 39.0 47.0 56.0 63.0 73.1 98.1 128.1 147.1 163.0 183.1 195.120–29 years . . . . . . . . . . . . 1,559 105.2 41.2 1.614 37.0 48.1 59.0 66.0 75.0 101.0 129.2 148.2 160.1 176.1 188.230–39 years . . . . . . . . . . . . 1,398 102.5 35.9 1.483 43.0 53.1 60.0 66.1 77.0 100.1 123.0 138.1 149.1 171.1 179.240–49 years . . . . . . . . . . . . 1,171 96.3 33.4 1.509 46.1 54.0 59.0 65.0 73.0 92.0 114.1 128.0 138.2 154.2 176.150–59 years . . . . . . . . . . . . 832 94.0 33.3 1.784 39.1 46.1 54.1 60.0 68.1 92.0 116.1 128.2 135.0 145.1 165.060–69 years . . . . . . . . . . . . 1,140 92.5 33.0 1.510 36.0 43.0 55.0 60.0 71.0 90.1 112.1 124.1 133.1 147.2 168.170 years and over . . . . . . . . 1,467 88.0 34.2 1.380 31.0 38.0 48.1 55.0 64.0 84.1 108.1 123.0 132.1 151.1 164.1
Non-Hispanic white
1 year and over . . . . . . . . . . . 4,537 96.1 37.1 0.929 34.1 44.0 54.1 60.0 70.0 92.1 117.1 133.1 143.2 164.2 179.21–2 years . . . . . . . . . . . . . 300 70.4 33.8 2.268 * 20.0 27.0 31.0 45.0 70.1 92.1 103.0 116.0 130.2 *3–5 years . . . . . . . . . . . . . 326 76.7 31.8 2.046 * 29.0 37.0 43.0 53.0 76.1 98.0 109.1 121.1 138.0 *6–8 years . . . . . . . . . . . . . 192 80.3 31.8 2.663 * * 43.0 48.0 60.0 75.1 101.1 111.0 121.1 * *9–11 years . . . . . . . . . . . . . 199 84.1 37.2 3.068 * * 44.0 51.0 58.0 79.0 105.0 113.1 119.1 * *12–14 years . . . . . . . . . . . . 139 92.9 39.3 3.874 * * 52.0 58.1 65.1 85.1 116.0 135.1 147.2 * *15–19 years . . . . . . . . . . . . 205 104.0 42.9 3.479 * * 55.0 60.0 73.1 98.0 131.1 151.2 165.0 * *20–29 years . . . . . . . . . . . . 383 108.6 42.7 2.534 * 49.1 61.0 67.0 77.1 105.1 133.2 150.2 163.0 177.2 *30–39 years . . . . . . . . . . . . 439 102.3 34.9 1.934 * 54.0 60.0 67.0 77.1 100.1 121.0 138.0 148.1 170.2 *40–49 years . . . . . . . . . . . . 422 95.4 31.2 1.764 * 56.0 59.1 65.0 73.0 91.1 112.1 127.0 135.1 150.2 *50–59 years . . . . . . . . . . . . 411 95.2 33.5 1.918 * 49.0 55.0 60.0 70.1 92.1 120.0 130.1 135.2 145.2 *60–69 years . . . . . . . . . . . . 500 93.2 32.8 1.705 * 44.0 55.0 61.0 71.1 91.1 113.0 124.1 132.2 150.2 *70 years and over . . . . . . . . 1,021 88.8 34.3 1.246 * 38.0 49.0 55.0 65.0 85.1 109.1 123.1 132.1 153.1 *
Non-Hispanic black
1 year and over . . . . . . . . . . . 3,609 86.8 35.5 0.712 31.0 38.0 46.1 54.0 63.0 82.1 105.1 120.1 132.1 152.1 171.01–2 years . . . . . . . . . . . . . 274 60.3 28.1 1.923 * 19.0 25.0 31.0 38.0 58.0 78.1 93.0 99.0 114.0 *3–5 years . . . . . . . . . . . . . 420 70.2 30.0 1.653 * 25.0 33.0 38.0 48.1 67.1 89.1 101.1 110.1 124.0 *6–8 years . . . . . . . . . . . . . 224 75.2 29.1 2.202 * 32.0 41.0 45.0 56.0 73.0 92.0 102.1 109.1 127.0 *9–11 years . . . . . . . . . . . . . 267 76.2 29.5 2.041 * 36.1 44.0 49.0 57.0 74.1 92.1 105.0 110.1 125.0 *12–14 years . . . . . . . . . . . . 185 82.2 32.1 2.670 * * 44.0 48.0 59.0 79.1 104.1 120.0 128.1 * *15–19 years . . . . . . . . . . . . 297 95.5 33.9 2.223 * 53.0 56.1 64.1 70.0 90.1 116.1 128.0 138.1 154.2 *20–29 years . . . . . . . . . . . . 461 96.1 35.8 1.889 * 46.0 54.1 60.0 71.0 93.0 117.0 133.1 142.1 157.2 *30–39 years . . . . . . . . . . . . 456 95.9 36.7 1.947 * 47.1 58.0 62.0 72.1 90.1 113.1 132.1 146.1 169.1 *40–49 years . . . . . . . . . . . . 334 92.8 37.5 2.321 * 42.1 53.0 60.0 67.1 85.1 110.1 125.1 144.1 172.0 *50–59 years . . . . . . . . . . . . 205 83.7 35.6 2.809 * * 45.1 50.1 59.0 78.0 101.1 113.1 129.0 * *60–69 years . . . . . . . . . . . . 270 78.6 29.7 2.048 * 36.0 41.1 49.0 61.0 76.1 92.1 103.1 118.1 131.2 *70 years and over . . . . . . . . 216 75.2 31.0 2.389 * * 40.1 45.0 55.1 72.0 89.1 102.0 114.1 * *
Mexican American
1 year and over . . . . . . . . . . . 3,961 95.4 40.3 0.974 29.0 37.1 50.0 56.1 68.0 90.1 117.1 136.1 149.2 169.1 190.21–2 years . . . . . . . . . . . . . 296 62.3 32.5 2.323 * * 21.0 29.0 38.1 59.1 84.0 96.1 107.0 * *3–5 years . . . . . . . . . . . . . 472 73.8 33.1 1.874 * 22.0 32.1 38.1 50.1 73.0 93.0 106.1 115.1 133.2 *6–8 years . . . . . . . . . . . . . 252 79.9 32.5 2.515 * * 38.1 47.0 57.0 79.0 101.1 113.1 124.1 * *9–11 years . . . . . . . . . . . . . 268 85.9 36.6 2.745 * * 43.0 48.0 59.0 85.1 107.1 120.1 128.1 * *12–14 years . . . . . . . . . . . . 190 88.2 35.0 3.121 * * 50.0 55.0 64.1 82.1 109.0 124.0 138.0 * *15–19 years . . . . . . . . . . . . 307 103.4 42.2 2.957 * 49.0 57.0 64.1 72.1 99.1 123.1 149.1 163.2 190.1 *20–29 years . . . . . . . . . . . . 644 104.7 39.3 1.904 * 51.0 62.0 67.1 77.0 100.1 126.0 145.2 157.2 180.1 *30–39 years . . . . . . . . . . . . 448 105.6 42.4 2.459 * 52.0 58.1 65.1 75.1 98.1 132.1 151.1 161.1 182.2 *40–49 years . . . . . . . . . . . . 370 99.7 38.3 2.445 * 47.1 55.0 63.0 72.1 94.1 122.0 137.2 150.2 175.0 *50–59 years . . . . . . . . . . . . 177 90.7 37.7 3.483 * * 44.0 56.0 66.1 88.0 112.0 128.0 134.2 * *60–69 years . . . . . . . . . . . . 337 94.4 39.2 2.624 * 49.0 53.0 59.0 67.1 87.0 118.1 134.2 142.2 158.1 *70 years and over . . . . . . . . 200 86.8 36.7 3.188 * * 43.0 50.0 56.0 85.0 111.1 125.1 141.2 * *
* Does not meet standards for reliability or precision.1Includes all other race/ethnic groups not listed separately.
Series 11, No. 247 [ Page 125

Table 93. Serum iron in microgram per deciliter for females 1 year and over, number of examined persons, mean, standard deviation,standard error of the mean, and selected percentiles, by race/ethnicity and age: United States, 1988–94
Race/ethnicity and age
Number ofexaminedpersons Mean
Standarddeviation
Standarderror ofmean
Percentile
2.5th 5th 10th 15th 25th 50th 75th 85th 90th 95th 97.5th
All race/ethnic groups1
1 year and over . . . . . . . . . . . 13,829 83.8 37.4 0.675 25.0 32.0 41.0 47.0 58.0 79.1 103.1 119.1 132.1 151.2 173.11–2 years . . . . . . . . . . . . . 893 68.2 34.5 1.999 15.0 18.0 26.0 33.0 42.0 65.1 91.0 100.0 109.1 128.1 138.13–5 years . . . . . . . . . . . . . 1,358 74.7 30.5 1.431 20.0 25.0 34.0 42.0 54.1 73.1 95.1 105.1 113.0 129.1 138.06–8 years . . . . . . . . . . . . . 683 77.8 30.3 2.004 28.0 34.0 39.1 46.1 57.0 77.0 95.1 107.0 116.0 131.0 132.29–11 years . . . . . . . . . . . . . 738 83.4 34.0 2.164 29.0 32.0 40.0 50.0 60.1 80.0 102.0 117.1 127.1 142.0 162.212–14 years . . . . . . . . . . . . 626 86.6 37.6 2.598 27.0 35.0 42.0 47.0 60.1 84.0 106.0 122.1 134.2 157.0 179.015–19 years . . . . . . . . . . . . 949 87.4 40.1 2.251 30.0 32.0 41.0 47.0 59.0 82.0 110.0 126.1 142.1 164.1 184.120–29 years . . . . . . . . . . . . 1,764 94.1 44.8 1.846 25.0 34.0 43.0 50.0 62.0 86.1 118.1 138.0 152.1 175.1 202.130–39 years . . . . . . . . . . . . 1,761 85.6 41.1 1.693 22.0 29.0 37.0 44.0 54.1 82.0 108.1 128.0 140.2 157.2 183.240–49 years . . . . . . . . . . . . 1,305 80.7 36.4 1.741 24.0 28.0 40.0 46.0 55.0 76.0 99.1 118.1 130.0 150.0 170.050–59 years . . . . . . . . . . . . 970 81.6 31.9 1.769 30.0 37.0 44.0 50.0 59.0 78.1 99.0 112.0 121.1 134.2 155.160–69 years . . . . . . . . . . . . 1,119 80.5 30.0 1.550 34.0 39.0 45.0 51.1 59.1 77.0 98.1 109.1 121.0 131.2 147.270 years and over . . . . . . . . 1,663 79.4 29.6 1.254 30.0 38.0 46.0 51.0 59.0 76.0 96.1 110.0 118.0 132.2 148.2
Non-Hispanic white
1 year and over . . . . . . . . . . . 5,078 86.1 38.0 0.901 27.0 34.0 43.0 49.0 59.1 81.1 106.0 122.1 135.2 154.2 178.11–2 years . . . . . . . . . . . . . 280 68.3 35.9 2.822 * 17.0 25.0 33.0 42.0 64.0 91.1 100.1 109.1 129.1 *3–5 years . . . . . . . . . . . . . 344 76.0 30.9 2.188 * 27.0 34.0 42.0 55.0 75.1 96.1 107.0 113.1 131.0 *6–8 years . . . . . . . . . . . . . 179 77.4 31.9 3.136 * * 36.0 43.0 55.0 75.1 96.0 108.1 118.1 * *9–11 years . . . . . . . . . . . . . 190 85.2 35.8 3.417 * * 40.0 49.0 60.0 81.0 103.1 120.1 130.1 * *12–14 years . . . . . . . . . . . . 156 88.0 37.2 3.918 * * 41.0 50.0 62.0 84.1 106.1 126.0 138.0 * *15–19 years . . . . . . . . . . . . 269 93.1 42.1 3.376 * 35.0 45.0 50.0 63.0 90.1 115.1 131.0 150.2 174.2 *20–29 years . . . . . . . . . . . . 480 97.1 46.5 2.789 * 36.0 45.0 53.0 63.1 88.1 122.0 143.2 154.1 181.2 *30–39 years . . . . . . . . . . . . 573 90.3 41.9 2.303 * 31.0 41.0 48.0 59.0 86.0 111.1 132.2 144.2 166.2 *40–49 years . . . . . . . . . . . . 462 83.4 36.0 2.203 * 32.0 42.1 48.0 58.0 78.1 102.0 121.0 135.2 150.2 *50–59 years . . . . . . . . . . . . 470 82.5 31.1 1.889 * 37.0 45.0 51.0 60.0 80.0 100.1 112.1 124.1 134.2 *60–69 years . . . . . . . . . . . . 481 81.2 30.4 1.822 * 39.0 45.0 52.0 60.0 77.1 99.1 112.0 121.1 131.1 *70 years and over . . . . . . . . 1,194 80.5 29.7 1.131 * 40.0 47.0 52.0 61.0 76.1 97.1 110.1 119.1 133.2 *
Non-Hispanic black
1 year and over . . . . . . . . . . . 4,117 73.6 33.0 0.620 21.0 26.0 34.1 41.0 50.1 70.1 91.1 106.1 116.1 133.2 148.01–2 years . . . . . . . . . . . . . 272 69.6 33.0 2.341 * 22.0 28.0 34.0 44.0 68.1 92.0 104.1 113.0 122.0 *3–5 years . . . . . . . . . . . . . 440 73.5 29.6 1.654 * 25.0 35.0 44.0 54.0 70.1 89.1 106.0 115.1 125.1 *6–8 years . . . . . . . . . . . . . 222 77.3 26.8 2.107 * * 42.0 50.0 59.1 78.1 93.1 102.0 107.1 * *9–11 years . . . . . . . . . . . . . 248 77.0 28.9 2.146 * 31.0 39.0 49.0 58.1 76.0 93.0 106.0 119.1 131.2 *12–14 years . . . . . . . . . . . . 223 75.7 30.5 2.393 * * 43.0 46.0 55.0 73.1 96.1 105.0 115.1 * *15–19 years . . . . . . . . . . . . 330 74.7 36.7 2.362 * 28.0 34.0 38.1 46.1 68.1 96.0 115.1 127.1 141.1 *20–29 years . . . . . . . . . . . . 580 78.5 39.8 1.934 * 25.0 32.0 37.0 50.0 73.0 101.1 122.1 132.2 147.2 *30–39 years . . . . . . . . . . . . 602 74.4 34.9 1.663 * 28.0 35.0 41.0 49.0 71.0 95.1 111.0 117.0 136.1 *40–49 years . . . . . . . . . . . . 424 67.4 30.5 1.735 * 23.0 30.0 37.1 48.0 64.1 84.0 95.1 107.0 122.1 *50–59 years . . . . . . . . . . . . 258 71.2 29.1 2.123 * 30.0 38.0 43.0 52.0 69.0 86.1 101.0 113.1 122.1 *60–69 years . . . . . . . . . . . . 272 72.1 24.6 1.743 * 34.1 41.1 45.1 55.0 72.0 88.0 98.0 103.0 115.1 *70 years and over . . . . . . . . 246 67.6 27.1 2.026 * 23.0 34.0 41.0 50.1 65.1 84.0 92.0 101.0 114.1 *
Mexican American
1 year and over . . . . . . . . . . . 4,030 80.0 36.5 0.875 20.0 28.0 37.1 43.0 54.0 76.0 102.1 118.0 128.0 146.1 161.01–2 years . . . . . . . . . . . . . 304 65.0 35.3 2.248 * 17.0 26.0 30.0 38.0 59.1 90.1 100.0 107.1 122.0 *3–5 years . . . . . . . . . . . . . 510 74.2 31.5 1.549 * 25.0 36.0 41.0 50.0 71.1 96.0 107.1 116.1 131.1 *6–8 years . . . . . . . . . . . . . 259 80.0 33.2 2.285 * * 37.0 43.0 56.0 79.1 103.0 117.1 119.1 * *9–11 years . . . . . . . . . . . . . 269 79.6 32.0 2.166 * * 38.1 45.0 59.0 74.0 99.1 121.0 127.0 * *12–14 years . . . . . . . . . . . . 218 84.5 38.4 2.884 * * 41.0 44.1 56.0 81.1 106.1 118.1 133.0 * *15–19 years . . . . . . . . . . . . 293 81.9 37.7 2.443 * 30.0 35.0 42.0 55.0 78.1 103.1 126.0 135.1 151.0 *20–29 years . . . . . . . . . . . . 632 86.4 40.0 1.767 * 34.0 41.0 46.1 57.0 79.1 112.1 128.0 143.1 159.2 *30–39 years . . . . . . . . . . . . 508 81.2 38.4 1.890 * 24.0 37.0 42.1 52.0 76.1 105.0 119.0 134.1 150.0 *40–49 years . . . . . . . . . . . . 354 73.5 37.0 2.184 * 18.0 27.0 35.0 48.0 70.1 97.1 115.1 122.1 137.1 *50–59 years . . . . . . . . . . . . 187 77.8 28.5 2.309 * * 47.0 52.0 59.0 73.1 94.1 107.1 117.1 * *60–69 years . . . . . . . . . . . . 322 79.5 29.0 1.791 * 40.0 45.0 49.0 60.0 76.1 98.1 109.1 120.0 127.1 *70 years and over . . . . . . . . 174 75.9 28.7 2.409 * * 43.0 48.0 53.0 72.1 99.0 106.0 111.1 * *
* Does not meet standards for reliability or precision.1Includes all other race/ethnic groups not listed separately.
Page 126 [ Series 11, No. 247
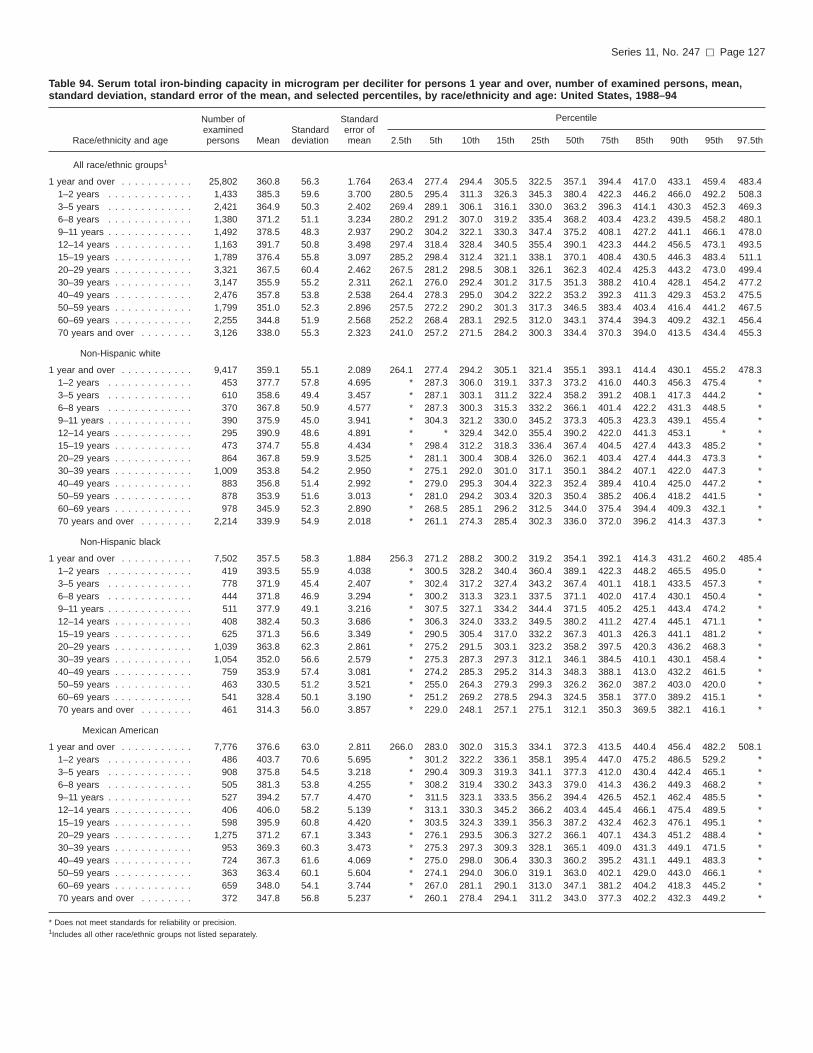
Table 94. Serum total iron-binding capacity in microgram per deciliter for persons 1 year and over, number of examined persons, mean,standard deviation, standard error of the mean, and selected percentiles, by race/ethnicity and age: United States, 1988–94
Race/ethnicity and age
Number ofexaminedpersons Mean
Standarddeviation
Standarderror ofmean
Percentile
2.5th 5th 10th 15th 25th 50th 75th 85th 90th 95th 97.5th
All race/ethnic groups1
1 year and over . . . . . . . . . . . 25,802 360.8 56.3 1.764 263.4 277.4 294.4 305.5 322.5 357.1 394.4 417.0 433.1 459.4 483.41–2 years . . . . . . . . . . . . . 1,433 385.3 59.6 3.700 280.5 295.4 311.3 326.3 345.3 380.4 422.3 446.2 466.0 492.2 508.33–5 years . . . . . . . . . . . . . 2,421 364.9 50.3 2.402 269.4 289.1 306.1 316.1 330.0 363.2 396.3 414.1 430.3 452.3 469.36–8 years . . . . . . . . . . . . . 1,380 371.2 51.1 3.234 280.2 291.2 307.0 319.2 335.4 368.2 403.4 423.2 439.5 458.2 480.19–11 years . . . . . . . . . . . . . 1,492 378.5 48.3 2.937 290.2 304.2 322.1 330.3 347.4 375.2 408.1 427.2 441.1 466.1 478.012–14 years . . . . . . . . . . . . 1,163 391.7 50.8 3.498 297.4 318.4 328.4 340.5 355.4 390.1 423.3 444.2 456.5 473.1 493.515–19 years . . . . . . . . . . . . 1,789 376.4 55.8 3.097 285.2 298.4 312.4 321.1 338.1 370.1 408.4 430.5 446.3 483.4 511.120–29 years . . . . . . . . . . . . 3,321 367.5 60.4 2.462 267.5 281.2 298.5 308.1 326.1 362.3 402.4 425.3 443.2 473.0 499.430–39 years . . . . . . . . . . . . 3,147 355.9 55.2 2.311 262.1 276.0 292.4 301.2 317.5 351.3 388.2 410.4 428.1 454.2 477.240–49 years . . . . . . . . . . . . 2,476 357.8 53.8 2.538 264.4 278.3 295.0 304.2 322.2 353.2 392.3 411.3 429.3 453.2 475.550–59 years . . . . . . . . . . . . 1,799 351.0 52.3 2.896 257.5 272.2 290.2 301.3 317.3 346.5 383.4 403.4 416.4 441.2 467.560–69 years . . . . . . . . . . . . 2,255 344.8 51.9 2.568 252.2 268.4 283.1 292.5 312.0 343.1 374.4 394.3 409.2 432.1 456.470 years and over . . . . . . . . 3,126 338.0 55.3 2.323 241.0 257.2 271.5 284.2 300.3 334.4 370.3 394.0 413.5 434.4 455.3
Non-Hispanic white
1 year and over . . . . . . . . . . . 9,417 359.1 55.1 2.089 264.1 277.4 294.2 305.1 321.4 355.1 393.1 414.4 430.1 455.2 478.31–2 years . . . . . . . . . . . . . 453 377.7 57.8 4.695 * 287.3 306.0 319.1 337.3 373.2 416.0 440.3 456.3 475.4 *3–5 years . . . . . . . . . . . . . 610 358.6 49.4 3.457 * 287.1 303.1 311.2 322.4 358.2 391.2 408.1 417.3 444.2 *6–8 years . . . . . . . . . . . . . 370 367.8 50.9 4.577 * 287.3 300.3 315.3 332.2 366.1 401.4 422.2 431.3 448.5 *9–11 years . . . . . . . . . . . . . 390 375.9 45.0 3.941 * 304.3 321.2 330.0 345.2 373.3 405.3 423.3 439.1 455.4 *12–14 years . . . . . . . . . . . . 295 390.9 48.6 4.891 * * 329.4 342.0 355.4 390.2 422.0 441.3 453.1 * *15–19 years . . . . . . . . . . . . 473 374.7 55.8 4.434 * 298.4 312.2 318.3 336.4 367.4 404.5 427.4 443.3 485.2 *20–29 years . . . . . . . . . . . . 864 367.8 59.9 3.525 * 281.1 300.4 308.4 326.0 362.1 403.4 427.4 444.3 473.3 *30–39 years . . . . . . . . . . . . 1,009 353.8 54.2 2.950 * 275.1 292.0 301.0 317.1 350.1 384.2 407.1 422.0 447.3 *40–49 years . . . . . . . . . . . . 883 356.8 51.4 2.992 * 279.0 295.3 304.4 322.3 352.4 389.4 410.4 425.0 447.2 *50–59 years . . . . . . . . . . . . 878 353.9 51.6 3.013 * 281.0 294.2 303.4 320.3 350.4 385.2 406.4 418.2 441.5 *60–69 years . . . . . . . . . . . . 978 345.9 52.3 2.890 * 268.5 285.1 296.2 312.5 344.0 375.4 394.4 409.3 432.1 *70 years and over . . . . . . . . 2,214 339.9 54.9 2.018 * 261.1 274.3 285.4 302.3 336.0 372.0 396.2 414.3 437.3 *
Non-Hispanic black
1 year and over . . . . . . . . . . . 7,502 357.5 58.3 1.884 256.3 271.2 288.2 300.2 319.2 354.1 392.1 414.3 431.2 460.2 485.41–2 years . . . . . . . . . . . . . 419 393.5 55.9 4.038 * 300.5 328.2 340.4 360.4 389.1 422.3 448.2 465.5 495.0 *3–5 years . . . . . . . . . . . . . 778 371.9 45.4 2.407 * 302.4 317.2 327.4 343.2 367.4 401.1 418.1 433.5 457.3 *6–8 years . . . . . . . . . . . . . 444 371.8 46.9 3.294 * 300.2 313.3 323.1 337.5 371.1 402.0 417.4 430.1 450.4 *9–11 years . . . . . . . . . . . . . 511 377.9 49.1 3.216 * 307.5 327.1 334.2 344.4 371.5 405.2 425.1 443.4 474.2 *12–14 years . . . . . . . . . . . . 408 382.4 50.3 3.686 * 306.3 324.0 333.2 349.5 380.2 411.2 427.4 445.1 471.1 *15–19 years . . . . . . . . . . . . 625 371.3 56.6 3.349 * 290.5 305.4 317.0 332.2 367.3 401.3 426.3 441.1 481.2 *20–29 years . . . . . . . . . . . . 1,039 363.8 62.3 2.861 * 275.2 291.5 303.1 323.2 358.2 397.5 420.3 436.2 468.3 *30–39 years . . . . . . . . . . . . 1,054 352.0 56.6 2.579 * 275.3 287.3 297.3 312.1 346.1 384.5 410.1 430.1 458.4 *40–49 years . . . . . . . . . . . . 759 353.9 57.4 3.081 * 274.2 285.3 295.2 314.3 348.3 388.1 413.0 432.2 461.5 *50–59 years . . . . . . . . . . . . 463 330.5 51.2 3.521 * 255.0 264.3 279.3 299.3 326.2 362.0 387.2 403.0 420.0 *60–69 years . . . . . . . . . . . . 541 328.4 50.1 3.190 * 251.2 269.2 278.5 294.3 324.5 358.1 377.0 389.2 415.1 *70 years and over . . . . . . . . 461 314.3 56.0 3.857 * 229.0 248.1 257.1 275.1 312.1 350.3 369.5 382.1 416.1 *
Mexican American
1 year and over . . . . . . . . . . . 7,776 376.6 63.0 2.811 266.0 283.0 302.0 315.3 334.1 372.3 413.5 440.4 456.4 482.2 508.11–2 years . . . . . . . . . . . . . 486 403.7 70.6 5.695 * 301.2 322.2 336.1 358.1 395.4 447.0 475.2 486.5 529.2 *3–5 years . . . . . . . . . . . . . 908 375.8 54.5 3.218 * 290.4 309.3 319.3 341.1 377.3 412.0 430.4 442.4 465.1 *6–8 years . . . . . . . . . . . . . 505 381.3 53.8 4.255 * 308.2 319.4 330.2 343.3 379.0 414.3 436.2 449.3 468.2 *9–11 years . . . . . . . . . . . . . 527 394.2 57.7 4.470 * 311.5 323.1 333.5 356.2 394.4 426.5 452.1 462.4 485.5 *12–14 years . . . . . . . . . . . . 406 406.0 58.2 5.139 * 313.1 330.3 345.2 366.2 403.4 445.4 466.1 475.4 489.5 *15–19 years . . . . . . . . . . . . 598 395.9 60.8 4.420 * 303.5 324.3 339.1 356.3 387.2 432.4 462.3 476.1 495.1 *20–29 years . . . . . . . . . . . . 1,275 371.2 67.1 3.343 * 276.1 293.5 306.3 327.2 366.1 407.1 434.3 451.2 488.4 *30–39 years . . . . . . . . . . . . 953 369.3 60.3 3.473 * 275.3 297.3 309.3 328.1 365.1 409.0 431.3 449.1 471.5 *40–49 years . . . . . . . . . . . . 724 367.3 61.6 4.069 * 275.0 298.0 306.4 330.3 360.2 395.2 431.1 449.1 483.3 *50–59 years . . . . . . . . . . . . 363 363.4 60.1 5.604 * 274.1 294.0 306.0 319.1 363.0 402.1 429.0 443.0 466.1 *60–69 years . . . . . . . . . . . . 659 348.0 54.1 3.744 * 267.0 281.1 290.1 313.0 347.1 381.2 404.2 418.3 445.2 *70 years and over . . . . . . . . 372 347.8 56.8 5.237 * 260.1 278.4 294.1 311.2 343.0 377.3 402.2 432.3 449.2 *
* Does not meet standards for reliability or precision.1Includes all other race/ethnic groups not listed separately.
Series 11, No. 247 [ Page 127

Table 95. Serum total iron-binding capacity in microgram per deciliter for males 1 year and over, number of examined persons, mean,standard deviation, standard error of the mean, and selected percentiles, by race/ethnicity and age: United States, 1988–94
Race/ethnicity and age
Number ofexaminedpersons Mean
Standarddeviation
Standarderror ofmean
Percentile
2.5th 5th 10th 15th 25th 50th 75th 85th 90th 95th 97.5th
All race/ethnic groups1
1 year and over . . . . . . . . . . . 12,304 354.1 51.2 2.324 261.3 276.4 292.3 304.2 320.1 351.2 386.3 405.4 419.1 440.5 462.11–2 years . . . . . . . . . . . . . 719 389.7 59.7 4.383 288.0 303.1 318.2 331.4 350.1 382.1 427.3 453.3 469.3 497.3 521.13–5 years . . . . . . . . . . . . . 1,180 367.2 51.6 2.953 278.2 294.2 308.2 315.4 327.5 365.2 399.5 421.3 437.2 459.2 474.16–8 years . . . . . . . . . . . . . 704 371.4 50.2 3.723 280.4 289.3 305.2 318.3 334.4 371.3 404.2 423.2 431.5 454.3 480.19–11 years . . . . . . . . . . . . . 760 376.4 47.2 3.365 294.0 306.0 324.0 330.1 347.5 373.1 403.4 426.3 441.1 465.2 475.312–14 years . . . . . . . . . . . . 539 391.9 49.3 4.176 302.4 321.3 330.3 340.3 355.2 389.2 428.4 442.1 453.2 473.1 493.115–19 years . . . . . . . . . . . . 844 365.2 47.6 3.223 278.1 293.0 310.4 320.2 335.4 360.2 394.1 414.5 424.5 442.5 474.420–29 years . . . . . . . . . . . . 1,560 351.1 49.4 2.458 263.1 277.1 292.3 304.4 318.0 347.2 383.4 401.5 413.2 428.2 442.430–39 years . . . . . . . . . . . . 1,393 348.8 46.9 2.473 267.0 276.2 290.1 301.1 316.5 347.0 381.0 398.4 410.0 430.2 443.140–49 years . . . . . . . . . . . . 1,171 348.9 46.7 2.683 260.4 275.5 295.4 305.3 321.3 345.3 377.1 395.4 407.4 430.4 447.150–59 years . . . . . . . . . . . . 832 346.3 49.2 3.357 249.0 269.1 290.4 302.1 316.0 342.1 377.4 396.1 410.1 426.2 449.160–69 years . . . . . . . . . . . . 1,137 340.3 50.7 2.956 246.1 266.2 282.1 289.3 305.2 339.1 370.1 387.3 403.4 426.0 452.470 years and over . . . . . . . . 1,465 330.0 52.7 2.708 239.1 251.1 267.4 280.1 295.0 327.2 360.4 381.2 396.0 422.1 445.5
Non-Hispanic white
1 year and over . . . . . . . . . . . 4,433 353.2 50.1 2.768 261.3 277.1 292.4 304.2 319.4 350.1 385.3 405.1 418.1 438.3 458.31–2 years . . . . . . . . . . . . . 226 383.0 57.4 5.437 * * 315.1 326.4 342.4 373.5 417.4 441.5 463.3 * *3–5 years . . . . . . . . . . . . . 300 359.1 50.1 4.119 * 289.4 303.2 311.5 319.4 354.2 391.4 408.3 424.2 447.3 *6–8 years . . . . . . . . . . . . . 192 368.6 49.3 5.066 * * 298.5 311.4 332.0 371.2 404.3 422.5 430.1 * *9–11 years . . . . . . . . . . . . . 199 375.7 44.0 4.446 * * 324.4 330.0 347.1 373.5 403.0 420.5 440.1 * *12–14 years . . . . . . . . . . . . 139 391.0 47.1 5.697 * * 333.1 340.4 354.3 386.2 432.1 441.3 451.4 * *15–19 years . . . . . . . . . . . . 205 365.0 46.6 4.642 * * 312.0 321.0 337.1 359.4 393.1 413.1 422.4 * *20–29 years . . . . . . . . . . . . 384 351.3 49.3 3.585 * 277.3 295.1 305.4 317.3 346.4 386.2 406.4 416.4 430.3 *30–39 years . . . . . . . . . . . . 438 349.4 46.2 3.142 * 276.4 290.3 301.4 318.1 348.0 379.2 398.5 410.2 430.1 *40–49 years . . . . . . . . . . . . 421 349.6 45.2 3.138 * 277.4 296.4 308.0 322.1 345.0 377.2 395.4 410.1 431.1 *50–59 years . . . . . . . . . . . . 411 349.3 49.2 3.458 * 276.1 295.3 304.1 318.3 347.4 381.1 400.1 411.2 426.3 *60–69 years . . . . . . . . . . . . 498 340.8 50.6 3.232 * 268.0 282.2 289.5 305.3 339.2 370.1 387.3 403.4 427.1 *70 years and over . . . . . . . . 1,020 331.6 52.9 2.359 * 255.2 269.4 282.1 296.3 328.5 361.4 384.0 397.0 422.3 *
Non-Hispanic black
1 year and over . . . . . . . . . . . 3,497 349.5 54.0 2.559 253.1 269.1 285.2 296.3 314.2 346.1 383.4 403.0 416.3 439.3 465.41–2 years . . . . . . . . . . . . . 207 392.7 58.2 5.486 * * 325.0 340.5 359.4 388.2 422.4 455.2 466.5 * *3–5 years . . . . . . . . . . . . . 381 372.6 44.6 3.103 * 304.4 316.4 326.3 343.3 367.1 403.2 418.3 437.3 457.2 *6–8 years . . . . . . . . . . . . . 224 373.2 48.8 4.419 * 294.2 311.1 315.4 340.2 373.4 403.2 419.2 429.4 453.5 *9–11 years . . . . . . . . . . . . . 264 375.5 49.2 4.106 * 312.2 324.2 329.4 341.0 367.3 401.3 424.1 443.2 474.4 *12–14 years . . . . . . . . . . . . 185 383.8 50.8 5.068 * * 321.0 328.2 343.1 384.2 417.2 428.4 449.3 * *15–19 years . . . . . . . . . . . . 297 357.4 48.2 3.793 * 274.4 301.1 309.2 324.2 355.4 393.2 407.0 418.4 431.0 *20–29 years . . . . . . . . . . . . 461 342.0 54.7 3.453 * 270.4 285.1 291.5 308.2 336.4 372.1 388.3 402.0 417.3 *30–39 years . . . . . . . . . . . . 454 340.5 49.8 3.167 * 269.0 281.4 289.1 305.3 337.3 371.0 391.2 407.1 431.0 *40–49 years . . . . . . . . . . . . 335 340.6 44.7 3.316 * 274.3 285.1 294.3 311.3 340.2 366.2 386.0 401.3 422.1 *50–59 years . . . . . . . . . . . . 205 327.4 51.1 4.842 * * 261.3 275.5 298.2 326.2 353.2 377.1 402.2 * *60–69 years . . . . . . . . . . . . 269 326.7 53.4 4.415 * 240.2 264.1 276.3 294.1 322.1 357.2 373.2 390.5 418.4 *70 years and over . . . . . . . . 215 315.0 53.3 4.927 * * 250.1 258.5 277.3 313.4 346.4 366.0 376.4 * *
Mexican American
1 year and over . . . . . . . . . . . 3,856 367.4 57.1 3.621 262.5 280.2 298.0 311.4 330.1 365.3 400.2 424.2 439.5 463.4 480.41–2 years . . . . . . . . . . . . . 242 412.7 69.4 6.839 * * 335.5 349.5 371.4 399.2 452.2 484.0 500.1 * *3–5 years . . . . . . . . . . . . . 433 378.2 56.0 4.125 * 290.3 309.4 321.1 342.3 377.2 416.1 434.4 448.4 465.0 *6–8 years . . . . . . . . . . . . . 249 386.3 53.6 5.204 * * 328.3 333.3 353.2 382.2 414.3 447.3 459.2 * *9–11 years . . . . . . . . . . . . . 263 391.6 59.6 5.635 * * 323.2 338.0 356.2 386.2 424.1 450.5 459.4 * *12–14 years . . . . . . . . . . . . 189 409.2 58.9 6.563 * * 343.2 355.1 370.2 407.2 443.4 462.4 478.1 * *15–19 years . . . . . . . . . . . . 306 381.7 55.5 4.861 * 298.3 319.1 331.4 347.3 373.4 414.2 436.0 458.1 475.3 *20–29 years . . . . . . . . . . . . 644 354.1 51.2 3.092 * 273.1 290.0 301.0 322.0 355.3 388.2 406.2 421.1 435.2 *30–39 years . . . . . . . . . . . . 447 354.3 49.3 3.573 * 270.0 291.5 303.2 320.0 352.4 386.4 409.5 421.2 435.3 *40–49 years . . . . . . . . . . . . 370 356.2 52.8 4.205 * 272.1 296.3 303.4 323.2 353.3 381.4 407.3 424.2 453.4 *50–59 years . . . . . . . . . . . . 176 356.4 50.7 5.861 * * 291.2 306.0 318.1 360.2 392.4 406.3 418.3 * *60–69 years . . . . . . . . . . . . 337 343.6 54.1 4.516 * 263.0 272.4 288.5 308.2 342.5 375.4 399.3 417.3 439.5 *70 years and over . . . . . . . . 200 343.2 50.9 5.518 * * 276.3 294.2 311.1 341.3 373.4 391.5 406.5 * *
* Does not meet standards for reliability or precision.1Includes all other race/ethnic groups not listed separately.
Page 128 [ Series 11, No. 247

Table 96. Serum total iron-binding capacity in microgram per deciliter for females 1 year and over, number of examined persons, mean,standard deviation, standard error of the mean, and selected percentiles, by race/ethnicity and age: United States, 1988–94
Race/ethnicity and age
Number ofexaminedpersons Mean
Standarddeviation
Standarderror ofmean
Percentile
2.5th 5th 10th 15th 25th 50th 75th 85th 90th 95th 97.5th
All race/ethnic groups1
1 year and over . . . . . . . . . . . 13,498 367.2 60.0 2.602 264.5 278.5 296.0 307.2 326.3 362.4 403.4 428.1 445.4 473.0 497.21–2 years . . . . . . . . . . . . . 714 380.8 59.2 4.394 279.3 284.4 303.2 319.2 341.0 380.1 418.4 442.0 456.1 480.2 499.13–5 years . . . . . . . . . . . . . 1,241 362.5 48.8 2.750 266.3 283.4 304.2 316.3 331.2 361.5 392.3 409.1 419.4 444.5 466.16–8 years . . . . . . . . . . . . . 676 370.9 52.2 3.983 278.0 294.2 311.1 319.3 338.0 365.1 403.1 423.4 445.2 462.1 480.09–11 years . . . . . . . . . . . . . 732 380.6 49.3 3.616 288.3 301.3 321.3 331.1 347.3 377.1 414.2 430.2 441.2 467.1 499.112–14 years . . . . . . . . . . . . 624 391.5 52.4 4.161 297.2 309.2 326.4 343.0 357.3 390.2 420.3 445.4 457.5 473.1 507.315–19 years . . . . . . . . . . . . 945 387.7 60.9 3.931 292.2 303.0 313.4 324.0 344.4 381.2 422.4 454.1 470.4 503.4 537.020–29 years . . . . . . . . . . . . 1,761 383.9 65.7 3.107 275.1 288.1 303.3 315.3 338.2 378.4 424.2 450.2 470.1 497.2 536.430–39 years . . . . . . . . . . . . 1,754 363.0 61.5 2.916 255.1 275.1 294.3 302.2 319.4 357.5 399.3 425.1 447.0 473.3 494.440–49 years . . . . . . . . . . . . 1,305 366.3 58.5 3.216 266.4 279.3 293.1 303.3 324.3 363.3 405.3 428.1 444.1 474.0 493.550–59 years . . . . . . . . . . . . 967 355.5 54.7 3.489 264.0 274.4 290.2 300.2 320.1 351.1 390.5 412.0 426.0 452.2 475.360–69 years . . . . . . . . . . . . 1,118 348.6 52.6 3.125 254.2 270.4 285.3 299.3 315.2 346.4 378.4 398.3 412.4 435.5 468.570 years and over . . . . . . . . 1,661 343.3 56.3 2.742 244.2 261.0 274.2 287.0 304.5 339.2 377.1 403.1 418.4 441.0 463.2
Non-Hispanic white
1 year and over . . . . . . . . . . . 4,984 364.8 59.0 3.075 264.5 278.2 295.2 306.2 324.5 360.4 400.3 423.1 441.4 470.1 493.21–2 years . . . . . . . . . . . . . 227 372.2 57.7 5.667 * * 297.3 309.3 332.3 370.3 410.1 437.0 449.1 * *3–5 years . . . . . . . . . . . . . 310 358.0 48.6 4.085 * 282.1 303.0 307.3 326.4 360.2 391.1 407.1 412.4 438.1 *6–8 years . . . . . . . . . . . . . 178 366.8 52.8 5.854 * * 300.4 315.4 333.2 361.1 400.0 422.0 439.4 * *9–11 years . . . . . . . . . . . . . 191 376.1 45.9 4.918 * * 319.4 330.0 344.4 373.3 408.4 423.4 435.5 * *12–14 years . . . . . . . . . . . . 156 390.7 50.3 5.956 * * 326.2 342.5 360.4 390.4 419.2 441.2 456.2 * *15–19 years . . . . . . . . . . . . 268 384.7 62.3 5.630 * 301.1 312.3 317.3 336.3 379.2 418.2 454.2 470.5 511.1 *20–29 years . . . . . . . . . . . . 480 383.8 64.8 4.374 * 286.4 306.2 314.5 337.4 379.2 424.3 450.5 470.3 495.0 *30–39 years . . . . . . . . . . . . 571 358.4 61.1 3.784 * 271.3 292.3 299.3 316.0 354.1 391.1 416.3 437.1 470.2 *40–49 years . . . . . . . . . . . . 462 364.2 56.1 3.864 * 279.5 293.2 303.2 324.2 360.3 402.2 422.4 437.1 468.2 *50–59 years . . . . . . . . . . . . 467 358.3 53.5 3.661 * 281.5 294.1 303.1 324.0 354.0 393.3 412.3 426.2 456.2 *60–69 years . . . . . . . . . . . . 480 350.4 53.3 3.597 * 271.2 286.3 301.3 317.3 348.2 380.4 399.3 415.1 441.5 *70 years and over . . . . . . . . 1,194 345.4 55.6 2.379 * 264.2 277.0 289.4 309.1 340.1 378.5 406.0 419.4 442.3 *
Non-Hispanic black
1 year and over . . . . . . . . . . . 4,005 364.4 60.8 2.692 260.1 273.4 290.4 303.4 323.4 361.2 400.0 426.1 442.3 470.5 497.31–2 years . . . . . . . . . . . . . 212 394.3 53.5 4.644 * * 330.4 340.3 361.2 390.2 422.2 441.3 457.5 * *3–5 years . . . . . . . . . . . . . 397 371.3 46.1 2.925 * 297.4 318.1 329.1 343.1 369.1 399.4 417.4 429.3 457.3 *6–8 years . . . . . . . . . . . . . 220 370.5 45.0 3.839 * * 319.2 325.1 337.1 366.4 399.0 415.4 430.3 * *9–11 years . . . . . . . . . . . . . 247 380.4 48.9 3.939 * 306.4 329.2 338.1 349.1 375.3 406.0 426.2 444.2 474.1 *12–14 years . . . . . . . . . . . . 223 381.1 49.8 4.222 * * 330.1 335.5 352.3 377.2 407.3 425.3 443.4 * *15–19 years . . . . . . . . . . . . 328 385.2 60.8 4.248 * 295.5 315.3 327.3 342.1 379.1 425.0 444.3 481.1 504.3 *20–29 years . . . . . . . . . . . . 578 382.5 62.4 3.284 * 287.4 307.3 324.0 340.4 381.0 419.4 440.1 459.2 495.2 *30–39 years . . . . . . . . . . . . 600 361.4 60.0 3.097 * 280.4 296.4 301.4 317.5 355.0 396.1 427.3 446.3 471.4 *40–49 years . . . . . . . . . . . . 424 364.4 63.8 3.917 * 274.1 286.1 297.2 316.4 357.0 403.0 432.5 459.2 480.3 *50–59 years . . . . . . . . . . . . 258 333.0 51.1 4.027 * 260.5 269.1 280.3 300.3 326.1 366.2 388.4 403.1 425.5 *60–69 years . . . . . . . . . . . . 272 329.6 47.7 3.657 * 264.3 272.1 280.3 295.1 325.4 359.1 378.4 387.3 412.4 *70 years and over . . . . . . . . 246 313.9 57.6 4.646 * 231.1 245.1 255.2 273.3 311.0 354.1 372.1 386.2 416.4 *
Mexican American
1 year and over . . . . . . . . . . . 3,920 386.4 67.3 4.231 268.2 287.2 306.4 320.3 340.0 381.5 429.3 454.1 472.2 496.4 528.21–2 years . . . . . . . . . . . . . 244 394.7 70.7 7.230 * * 310.4 327.1 341.1 389.1 440.1 455.5 479.4 * *3–5 years . . . . . . . . . . . . . 475 373.4 52.9 3.877 * 291.1 309.2 319.0 333.5 378.0 408.0 426.0 441.2 465.2 *6–8 years . . . . . . . . . . . . . 256 376.6 53.6 5.347 * * 310.1 321.1 342.1 373.0 413.4 430.4 443.0 * *9–11 years . . . . . . . . . . . . . 264 397.0 55.4 5.447 * * 323.1 333.3 354.4 400.2 433.1 456.1 463.4 * *12–14 years . . . . . . . . . . . . 217 403.4 57.6 6.244 * * 324.5 338.4 360.3 402.2 447.3 467.4 474.1 * *15–19 years . . . . . . . . . . . . 292 412.1 62.5 5.842 * 318.5 337.2 352.4 371.4 406.5 452.5 480.2 492.5 511.1 *20–29 years . . . . . . . . . . . . 631 392.9 77.9 4.949 * 281.1 300.3 314.3 337.4 390.2 440.3 465.3 490.1 524.9 *30–39 years . . . . . . . . . . . . 506 385.6 66.6 4.730 * 282.2 305.4 321.2 338.1 378.0 430.1 456.3 468.4 492.2 *40–49 years . . . . . . . . . . . . 354 379.0 67.8 5.754 * 279.1 299.2 312.3 337.2 371.2 414.2 447.5 478.3 507.5 *50–59 years . . . . . . . . . . . . 187 370.2 67.1 7.838 * * 295.0 306.0 320.3 363.2 412.1 440.3 459.3 * *60–69 years . . . . . . . . . . . . 322 351.5 53.8 4.788 * 269.1 283.1 290.3 319.1 351.4 383.1 405.4 420.2 445.2 *70 years and over . . . . . . . . 172 352.4 61.8 7.525 * * 279.3 294.0 311.3 343.2 384.3 418.4 438.3 * *
* Does not meet standards for reliability or precision.1Includes all other race/ethnic groups not listed separately.
Series 11, No. 247 [ Page 129

Table 97. Transferrin saturation in percentages for persons 1 year and over, number of examined persons, mean, standard deviation,standard error of the mean, and selected percentiles, by race/ethnicity and age: United States, 1988–94
Race/ethnicity and age
Number ofexaminedpersons Mean
Standarddeviation
Standarderror ofmean
Percentile
2.5th 5th 10th 15th 25th 50th 75th 85th 90th 95th 97.5th
All race/ethnic groups1
1 year and over . . . . . . . . . . . 25,770 25.4 11.4 0.171 7.4 9.5 12.5 14.5 17.5 24.0 31.4 36.1 39.9 45.9 52.31–2 years . . . . . . . . . . . . . 1,428 18.1 9.5 0.432 4.0 5.0 7.1 8.4 11.0 17.0 24.2 27.1 29.9 35.3 39.23–5 years . . . . . . . . . . . . . 2,416 20.8 9.0 0.315 5.7 7.3 9.6 11.5 14.7 20.1 26.0 29.1 32.0 37.2 41.36–8 years . . . . . . . . . . . . . 1,380 21.5 9.0 0.420 6.6 9.1 11.5 12.8 15.5 20.5 26.6 29.2 31.6 36.8 41.09–11 years . . . . . . . . . . . . . 1,491 22.3 10.1 0.453 7.6 8.9 11.2 13.0 15.5 20.9 27.6 31.1 33.1 39.3 45.912–14 years . . . . . . . . . . . . 1,163 23.0 9.9 0.500 6.5 9.3 11.1 13.1 16.1 21.5 28.0 32.4 35.2 42.2 46.715–19 years . . . . . . . . . . . . 1,787 26.0 12.1 0.497 7.5 9.5 12.6 14.2 17.5 23.5 32.7 38.3 42.9 49.7 54.520–29 years . . . . . . . . . . . . 3,317 27.8 12.8 0.383 7.3 9.9 13.1 15.1 18.8 26.5 34.7 39.7 43.8 49.8 56.130–39 years . . . . . . . . . . . . 3,145 27.1 12.2 0.376 7.9 9.4 12.9 15.1 18.5 25.8 34.2 39.2 42.2 49.2 54.440–49 years . . . . . . . . . . . . 2,473 25.3 11.0 0.383 6.5 10.1 13.0 15.2 18.0 24.0 31.2 35.2 39.5 46.1 52.750–59 years . . . . . . . . . . . . 1,797 25.5 10.7 0.435 9.0 11.6 13.4 15.5 18.2 24.1 31.3 35.9 38.5 44.9 49.260–69 years . . . . . . . . . . . . 2,252 25.5 10.1 0.369 9.3 11.3 14.0 15.9 18.6 24.3 31.1 35.2 38.2 43.3 48.870 years and over . . . . . . . . 3,121 25.0 10.4 0.321 8.8 11.2 13.6 15.4 18.1 23.5 30.6 34.7 37.7 43.7 49.1
Non-Hispanic white
1 year and over . . . . . . . . . . . 9,401 26.0 11.5 0.223 8.0 10.1 13.0 15.1 18.0 24.4 32.1 36.8 40.4 46.7 52.81–2 years . . . . . . . . . . . . . 451 18.8 9.8 0.611 * 5.1 7.4 8.8 11.5 17.3 25.4 27.9 30.2 35.8 *3–5 years . . . . . . . . . . . . . 607 21.6 9.0 0.482 * 8.0 10.4 12.3 15.2 21.3 26.8 30.3 32.5 38.1 *6–8 years . . . . . . . . . . . . . 370 21.8 9.4 0.646 * 9.1 11.4 12.8 15.8 20.6 26.7 29.5 31.9 37.7 *9–11 years . . . . . . . . . . . . . 389 22.9 10.8 0.725 * 8.7 11.2 12.8 16.1 21.3 28.6 31.4 34.5 40.8 *12–14 years . . . . . . . . . . . . 295 23.4 9.8 0.756 * * 11.3 13.3 16.7 21.8 28.3 33.7 36.8 * *15–19 years . . . . . . . . . . . . 473 27.0 12.6 0.762 * 10.5 12.8 14.9 17.9 24.7 34.6 40.3 44.9 51.8 *20–29 years . . . . . . . . . . . . 863 28.6 13.2 0.593 * 10.5 13.6 15.6 19.1 27.2 35.7 40.6 44.6 52.5 *30–39 years . . . . . . . . . . . . 1,008 27.9 12.2 0.506 * 10.2 13.9 16.0 19.5 26.4 35.1 39.9 42.7 49.9 *40–49 years . . . . . . . . . . . . 882 25.6 10.6 0.469 * 10.8 13.9 15.8 18.5 24.3 31.3 35.1 39.4 46.1 *50–59 years . . . . . . . . . . . . 878 25.6 10.4 0.462 * 11.7 13.5 15.7 18.3 24.4 31.4 35.7 38.6 45.1 *60–69 years . . . . . . . . . . . . 975 25.7 10.3 0.434 * 11.3 14.1 16.0 18.8 24.4 31.5 35.3 38.6 43.8 *70 years and over . . . . . . . . 2,210 25.2 10.4 0.293 * 11.2 13.6 15.5 18.3 23.6 30.7 34.8 38.0 44.0 *
Non-Hispanic black
1 year and over . . . . . . . . . . . 7,496 22.9 10.6 0.176 5.8 8.1 10.8 12.7 15.6 21.7 28.7 33.1 36.5 42.2 47.21–2 years . . . . . . . . . . . . . 419 17.0 8.8 0.518 * 5.1 6.5 7.9 10.3 16.0 22.6 25.3 28.2 32.3 *3–5 years . . . . . . . . . . . . . 777 19.3 8.2 0.357 * 6.7 9.2 10.3 13.8 18.6 24.3 28.0 31.2 34.3 *6–8 years . . . . . . . . . . . . . 444 20.8 8.1 0.465 * 8.3 11.3 12.0 15.4 20.1 25.7 28.3 30.9 34.3 *9–11 years . . . . . . . . . . . . . 511 20.7 8.3 0.443 * 8.6 10.4 12.6 15.3 20.1 24.9 29.1 31.7 34.6 *12–14 years . . . . . . . . . . . . 408 21.0 8.9 0.537 * 7.6 11.1 12.0 14.5 20.4 26.8 29.8 32.9 37.0 *15–19 years . . . . . . . . . . . . 625 23.7 11.1 0.538 * 8.6 10.5 12.8 15.6 22.2 30.6 35.3 38.6 42.9 *20–29 years . . . . . . . . . . . . 1,037 24.6 11.6 0.435 * 7.7 10.5 12.6 16.1 23.3 31.6 36.6 39.1 43.8 *30–39 years . . . . . . . . . . . . 1,054 24.6 11.4 0.427 * 8.2 11.5 13.6 16.4 23.3 30.9 35.9 39.3 45.5 *40–49 years . . . . . . . . . . . . 758 23.0 11.6 0.509 * 7.6 10.3 12.4 15.4 21.5 28.5 33.0 36.8 44.6 *50–59 years . . . . . . . . . . . . 462 23.5 10.0 0.564 * 9.6 12.6 14.0 16.6 22.0 28.9 33.4 35.9 42.4 *60–69 years . . . . . . . . . . . . 541 23.1 8.6 0.449 * 11.1 13.2 14.7 17.6 22.6 28.3 31.0 33.3 36.7 *70 years and over . . . . . . . . 460 22.7 9.2 0.521 * 9.3 11.7 13.7 17.2 21.5 28.2 31.4 34.8 38.6 *
Mexican American
1 year and over . . . . . . . . . . . 7,767 24.2 11.6 0.228 5.8 7.9 10.9 13.0 16.2 22.7 30.4 35.6 39.1 45.6 50.91–2 years . . . . . . . . . . . . . 483 16.6 9.4 0.541 * 4.2 5.2 7.3 9.4 15.6 22.0 25.8 29.2 33.7 *3–5 years . . . . . . . . . . . . . 907 20.2 9.5 0.400 * 6.4 9.0 10.4 13.4 19.5 25.5 28.6 32.3 38.2 *6–8 years . . . . . . . . . . . . . 505 21.2 9.0 0.510 * 7.7 10.2 12.2 14.9 20.7 26.2 30.9 33.6 37.7 *9–11 years . . . . . . . . . . . . . 527 21.3 9.3 0.511 * 8.6 10.4 12.3 14.9 19.9 26.8 30.6 33.0 38.6 *12–14 years . . . . . . . . . . . . 406 21.8 10.5 0.659 * 8.0 9.7 12.1 14.5 20.7 27.8 30.6 34.0 40.9 *15–19 years . . . . . . . . . . . . 596 24.3 11.9 0.617 * 8.0 11.1 12.8 16.0 22.7 30.4 35.6 39.5 46.2 *20–29 years . . . . . . . . . . . . 1,274 26.9 12.4 0.442 * 10.0 12.7 14.7 18.2 25.2 33.6 39.0 43.5 49.8 *30–39 years . . . . . . . . . . . . 952 26.1 12.2 0.502 * 8.5 12.0 14.1 17.7 24.4 32.7 38.5 41.6 49.2 *40–49 years . . . . . . . . . . . . 723 24.6 12.2 0.573 * 6.2 10.3 12.9 16.4 23.4 31.5 36.5 40.8 45.8 *50–59 years . . . . . . . . . . . . 363 23.8 10.2 0.677 * 10.0 12.6 14.8 17.2 22.5 29.2 32.7 36.9 40.8 *60–69 years . . . . . . . . . . . . 659 25.3 11.0 0.543 * 11.0 13.4 15.2 18.4 23.1 30.0 36.6 39.6 44.5 *70 years and over . . . . . . . . 372 23.9 10.1 0.663 * 9.6 12.0 14.1 16.9 22.7 30.1 34.2 37.2 42.0 *
* Does not meet standards for reliability or precision.1Includes all other race/ethnic groups not listed separately.
Page 130 [ Series 11, No. 247

Table 98. Transferrin saturation in percentages for males 1 year and over, number of examined persons, mean, standard deviation, standarderror of the mean, and selected percentiles, by race/ethnicity and age: United States, 1988–94
Race/ethnicity and age
Number ofexaminedpersons Mean
Standarddeviation
Standarderror ofmean
Percentile
2.5th 5th 10th 15th 25th 50th 75th 85th 90th 95th 97.5th
All race/ethnic groups1
1 year and over . . . . . . . . . . . 12,288 27.4 11.4 0.246 9.0 11.8 14.7 16.5 19.5 26.1 33.7 38.1 41.9 47.9 53.41–2 years . . . . . . . . . . . . . 715 18.0 9.5 0.550 3.9 5.1 6.9 8.4 10.6 17.0 23.8 26.9 30.1 35.6 39.23–5 years . . . . . . . . . . . . . 1,178 20.6 9.2 0.416 5.5 7.3 9.3 10.9 14.3 19.5 26.1 29.3 33.1 38.0 41.36–8 years . . . . . . . . . . . . . 704 21.7 9.0 0.524 6.6 9.4 11.6 12.9 16.0 20.6 26.7 29.6 33.2 38.7 42.69–11 years . . . . . . . . . . . . . 760 22.3 9.9 0.554 8.6 9.4 11.3 13.4 15.3 20.6 28.4 30.4 32.4 39.1 40.812–14 years . . . . . . . . . . . . 539 23.4 9.4 0.628 7.0 9.4 12.7 14.5 17.0 21.9 28.3 33.4 35.6 41.8 45.515–19 years . . . . . . . . . . . . 844 28.8 12.2 0.651 10.6 12.8 15.0 17.3 19.7 26.7 36.4 41.9 45.6 52.2 55.620–29 years . . . . . . . . . . . . 1,557 30.5 12.7 0.499 11.0 13.3 16.2 18.5 21.8 29.7 36.8 42.5 45.9 53.7 60.330–39 years . . . . . . . . . . . . 1,391 29.9 11.1 0.460 11.9 15.1 17.2 18.8 22.2 28.1 36.1 41.0 45.3 51.0 54.540–49 years . . . . . . . . . . . . 1,170 27.9 10.1 0.457 13.4 15.4 16.9 18.3 20.9 26.2 33.5 37.0 40.7 46.1 50.450–59 years . . . . . . . . . . . . 831 27.7 10.7 0.575 11.2 13.1 15.8 17.1 19.8 26.4 33.6 37.6 39.8 45.6 52.260–69 years . . . . . . . . . . . . 1,136 27.7 10.4 0.479 9.7 12.5 16.1 17.8 20.9 26.7 33.3 37.2 40.3 45.7 49.170 years and over . . . . . . . . 1,463 27.2 11.2 0.452 8.8 12.0 14.5 16.5 19.6 25.9 33.3 37.4 40.5 46.0 51.6
Non-Hispanic white
1 year and over . . . . . . . . . . . 4,426 27.8 11.4 0.324 9.4 12.3 15.1 16.9 19.8 26.3 34.1 38.6 42.5 48.2 53.71–2 years . . . . . . . . . . . . . 224 19.0 9.9 0.772 * * 8.2 9.0 11.4 17.7 25.1 27.9 33.2 * *3–5 years . . . . . . . . . . . . . 299 21.6 9.4 0.632 * 8.0 10.3 12.1 14.8 20.5 27.0 31.5 35.7 40.2 *6–8 years . . . . . . . . . . . . . 192 22.1 9.2 0.775 * * 11.9 12.9 16.1 20.7 26.7 30.1 33.5 * *9–11 years . . . . . . . . . . . . . 199 22.7 10.4 0.863 * * 11.2 12.9 14.9 20.6 28.6 30.5 33.1 * *12–14 years . . . . . . . . . . . . 139 23.9 9.6 0.947 * * 12.8 15.1 17.3 22.5 30.3 33.7 37.2 * *15–19 years . . . . . . . . . . . . 205 29.0 12.8 1.040 * * 14.4 16.3 19.5 26.4 37.1 43.6 45.7 * *20–29 years . . . . . . . . . . . . 383 31.5 13.3 0.794 * 13.9 16.6 18.8 22.6 30.6 37.5 44.3 47.6 54.4 *30–39 years . . . . . . . . . . . . 437 29.8 11.0 0.613 * 15.1 17.2 18.7 22.4 28.0 36.1 40.8 45.7 50.2 *40–49 years . . . . . . . . . . . . 421 27.6 9.5 0.538 * 15.7 17.0 18.4 20.9 25.9 32.9 36.6 40.2 46.1 *50–59 years . . . . . . . . . . . . 411 27.8 10.9 0.629 * 13.2 15.8 17.1 19.8 26.4 33.5 37.6 41.5 46.9 *60–69 years . . . . . . . . . . . . 497 27.9 10.5 0.549 * 12.9 16.4 18.1 21.0 26.9 33.4 37.0 41.1 45.9 *70 years and over . . . . . . . . 1,019 27.3 11.2 0.410 * 11.7 14.5 16.6 19.7 26.0 33.6 37.5 40.7 45.9 *
Non-Hispanic black
1 year and over . . . . . . . . . . . 3,494 25.5 10.9 0.266 8.3 10.8 13.1 15.2 18.0 23.9 31.3 36.1 39.2 45.2 52.41–2 years . . . . . . . . . . . . . 207 15.9 8.4 0.693 * * 5.9 6.9 9.7 14.8 21.2 24.5 25.3 * *3–5 years . . . . . . . . . . . . . 381 18.8 8.3 0.504 * 6.8 8.8 9.8 12.4 18.3 23.9 27.1 30.9 33.9 *6–8 years . . . . . . . . . . . . . 224 20.4 8.1 0.643 * 8.2 11.0 11.7 15.2 19.7 25.1 28.2 30.9 36.3 *9–11 years . . . . . . . . . . . . . 264 20.7 8.4 0.609 * 9.7 11.8 12.8 15.4 19.7 24.8 28.9 31.3 34.1 *12–14 years . . . . . . . . . . . . 185 22.0 9.3 0.810 * * 11.1 12.1 14.9 21.3 28.0 32.0 34.0 * *15–19 years . . . . . . . . . . . . 297 27.2 10.3 0.709 * 13.7 15.9 17.0 19.3 25.6 32.8 37.9 40.8 45.9 *20–29 years . . . . . . . . . . . . 460 28.5 10.9 0.601 * 13.1 15.5 17.3 20.7 27.2 35.4 39.2 42.5 48.2 *30–39 years . . . . . . . . . . . . 454 28.7 11.3 0.625 * 13.8 16.8 18.2 21.1 26.8 34.0 38.5 43.5 53.1 *40–49 years . . . . . . . . . . . . 334 27.7 12.1 0.781 * 12.5 16.1 17.6 19.5 25.2 32.3 38.5 44.2 50.4 *50–59 years . . . . . . . . . . . . 205 25.8 10.1 0.838 * * 14.1 15.3 18.4 24.1 31.9 35.9 39.6 * *60–69 years . . . . . . . . . . . . 269 24.6 9.6 0.696 * 10.8 13.9 15.9 17.8 24.1 29.8 33.0 35.7 42.0 *70 years and over . . . . . . . . 214 24.2 9.4 0.759 * * 12.9 15.1 18.1 22.8 29.4 32.5 37.1 * *
Mexican American
1 year and over . . . . . . . . . . . 3,851 26.7 12.0 0.335 7.7 10.1 13.1 15.2 18.6 24.8 33.0 38.1 42.6 49.1 54.31–2 years . . . . . . . . . . . . . 240 15.8 8.8 0.702 * * 5.1 6.9 8.8 15.0 21.5 24.9 28.9 * *3–5 years . . . . . . . . . . . . . 432 20.2 9.8 0.578 * 6.4 8.8 10.2 13.5 19.7 25.3 28.6 33.0 38.2 *6–8 years . . . . . . . . . . . . . 249 21.0 8.9 0.694 * * 10.2 11.5 15.0 20.4 26.2 30.7 33.1 * *9–11 years . . . . . . . . . . . . . 263 22.4 9.9 0.748 * * 10.9 12.3 15.3 21.6 27.3 31.1 34.4 * *12–14 years . . . . . . . . . . . . 189 22.2 10.2 0.915 * * 11.1 13.2 15.1 20.7 27.3 31.2 34.1 * *15–19 years . . . . . . . . . . . . 306 27.6 12.3 0.861 * 12.0 14.5 16.3 19.3 26.4 33.0 38.7 45.2 50.9 *20–29 years . . . . . . . . . . . . 643 30.0 12.0 0.583 * 14.0 17.1 19.0 21.6 28.5 35.6 41.5 45.4 53.0 *30–39 years . . . . . . . . . . . . 446 30.0 12.0 0.701 * 14.0 16.8 18.4 21.3 28.4 37.0 41.6 47.8 52.7 *40–49 years . . . . . . . . . . . . 370 28.5 11.5 0.736 * 13.4 15.9 17.4 20.7 26.4 35.0 39.7 43.6 48.6 *50–59 years . . . . . . . . . . . . 176 25.8 11.1 1.031 * * 13.0 14.8 18.9 24.5 31.2 36.9 39.0 * *60–69 years . . . . . . . . . . . . 337 28.2 12.6 0.842 * 13.0 16.0 17.0 19.8 25.5 36.6 40.4 42.7 49.8 *70 years and over . . . . . . . . 200 25.7 11.2 0.974 * * 11.8 15.3 17.3 24.2 33.2 37.5 39.6 * *
* Does not meet standards for reliability or precision.1Includes all other race/ethnic groups not listed separately.
Series 11, No. 247 [ Page 131

Table 99. Transferrin saturation in percentages for females 1 year and over, number of examined persons, mean, standard deviation,standard error of the mean, and selected percentiles, by race/ethnicity and age: United States, 1988–94
Race/ethnicity and age
Number ofexaminedpersons Mean
Standarddeviation
Standarderror ofmean
Percentile
2.5th 5th 10th 15th 25th 50th 75th 85th 90th 95th 97.5th
All race/ethnic groups1
1 year and over . . . . . . . . . . . 13,482 23.5 11.1 0.229 6.4 8.4 11.0 12.9 15.8 21.9 29.3 33.8 37.3 43.4 51.01–2 years . . . . . . . . . . . . . 713 18.3 9.4 0.615 4.0 4.7 7.3 8.7 11.6 17.0 24.9 27.2 29.5 34.8 39.63–5 years . . . . . . . . . . . . . 1,238 20.9 8.7 0.430 5.8 7.3 9.7 12.2 15.0 20.8 25.9 29.0 31.6 34.9 41.16–8 years . . . . . . . . . . . . . 676 21.3 9.1 0.607 7.2 9.1 11.4 12.6 15.3 20.4 26.5 29.2 30.7 34.1 37.99–11 years . . . . . . . . . . . . . 731 22.4 10.4 0.668 6.8 8.3 10.4 12.6 16.1 21.0 27.3 31.4 34.1 41.1 45.912–14 years . . . . . . . . . . . . 624 22.6 10.3 0.721 6.4 8.7 10.6 12.0 15.1 21.4 27.7 31.4 35.0 42.2 55.515–19 years . . . . . . . . . . . . 943 23.2 11.4 0.648 6.7 7.6 10.3 12.0 15.2 21.4 29.2 34.5 37.4 45.6 52.120–29 years . . . . . . . . . . . . 1,760 25.0 12.2 0.507 6.1 8.6 11.1 13.0 16.3 23.7 31.5 36.8 40.1 46.7 54.530–39 years . . . . . . . . . . . . 1,754 24.4 12.6 0.526 5.0 8.0 10.2 11.9 15.1 22.5 31.3 37.7 40.3 46.0 53.540–49 years . . . . . . . . . . . . 1,303 22.9 11.3 0.546 5.4 6.9 10.6 12.3 15.3 20.8 28.7 33.6 36.2 45.8 53.950–59 years . . . . . . . . . . . . 966 23.5 10.2 0.574 7.4 10.0 12.3 13.7 16.7 22.2 28.6 32.2 35.7 42.6 45.660–69 years . . . . . . . . . . . . 1,116 23.6 9.5 0.494 8.8 11.2 12.9 14.5 16.9 22.6 28.9 32.9 35.6 40.3 45.970 years and over . . . . . . . . 1,658 23.6 9.5 0.407 8.8 10.9 13.2 14.6 17.4 22.2 28.7 32.0 35.2 40.3 46.6
Non-Hispanic white
1 year and over . . . . . . . . . . . 4,975 24.2 11.2 0.300 7.0 9.0 11.7 13.4 16.5 22.5 30.2 34.6 38.2 44.8 52.11–2 years . . . . . . . . . . . . . 227 18.5 9.8 0.859 * * 7.3 8.3 11.7 16.5 25.8 27.9 29.6 * *3–5 years . . . . . . . . . . . . . 308 21.6 8.6 0.647 * 8.1 10.7 12.6 15.8 21.6 26.6 29.7 31.7 34.9 *6–8 years . . . . . . . . . . . . . 178 21.4 9.7 0.960 * * 10.7 12.1 15.2 20.5 26.8 29.2 30.9 * *9–11 years . . . . . . . . . . . . . 190 23.2 11.2 1.077 * * 10.4 12.5 17.4 21.6 28.4 31.6 35.0 * *12–14 years . . . . . . . . . . . . 156 22.9 10.1 1.076 * * 10.3 12.4 16.2 21.5 28.1 33.1 35.1 * *15–19 years . . . . . . . . . . . . 268 24.9 12.0 0.973 * 9.0 11.2 13.3 16.6 22.7 31.5 36.0 41.2 48.3 *20–29 years . . . . . . . . . . . . 480 25.7 12.5 0.754 * 9.2 11.7 13.6 16.8 24.3 32.9 37.3 40.6 46.8 *30–39 years . . . . . . . . . . . . 571 26.0 13.0 0.723 * 8.9 11.1 13.2 16.5 24.1 33.3 39.1 41.0 47.8 *40–49 years . . . . . . . . . . . . 461 23.7 11.2 0.693 * 7.6 11.0 12.7 15.9 21.5 29.5 34.1 37.3 47.3 *50–59 years . . . . . . . . . . . . 467 23.5 9.4 0.575 * 10.2 12.5 13.7 16.8 22.4 29.2 32.6 36.1 42.6 *60–69 years . . . . . . . . . . . . 478 23.8 9.7 0.587 * 11.2 12.7 14.3 16.9 22.6 29.8 33.3 35.7 41.3 *70 years and over . . . . . . . . 1,191 23.8 9.6 0.370 * 11.1 13.3 14.9 17.6 22.3 28.7 32.3 35.3 40.8 *
Non-Hispanic black
1 year and over . . . . . . . . . . . 4,002 20.8 9.7 0.222 5.2 6.8 9.1 11.0 14.0 19.7 26.4 30.5 33.4 38.5 43.21–2 years . . . . . . . . . . . . . 212 18.2 8.9 0.711 * * 7.4 8.9 11.1 17.5 24.2 27.5 30.2 * *3–5 years . . . . . . . . . . . . . 396 19.9 8.1 0.471 * 6.6 9.6 12.2 14.6 19.0 24.7 28.4 31.2 34.4 *6–8 years . . . . . . . . . . . . . 220 21.2 8.0 0.629 * * 11.6 12.3 15.5 20.4 26.3 28.5 30.8 * *9–11 years . . . . . . . . . . . . . 247 20.6 8.2 0.604 * 8.4 9.4 11.6 15.0 20.3 25.2 29.5 32.3 35.8 *12–14 years . . . . . . . . . . . . 223 20.2 8.5 0.665 * * 11.0 11.8 14.4 20.1 25.6 28.2 31.1 * *15–19 years . . . . . . . . . . . . 328 20.1 10.7 0.685 * 6.3 8.6 9.4 12.0 18.6 26.2 30.8 33.4 39.5 *20–29 years . . . . . . . . . . . . 577 21.2 11.0 0.534 * 5.8 8.2 9.5 12.6 19.5 27.9 33.6 36.5 41.4 *30–39 years . . . . . . . . . . . . 600 21.4 10.5 0.497 * 6.8 8.9 11.0 14.1 20.1 27.1 32.2 35.1 41.1 *40–49 years . . . . . . . . . . . . 424 19.3 9.7 0.547 * 5.3 7.8 9.9 13.2 18.1 24.9 28.7 31.0 35.6 *50–59 years . . . . . . . . . . . . 257 21.7 9.5 0.688 * 9.1 10.2 13.0 15.5 20.6 26.6 31.0 33.4 37.7 *60–69 years . . . . . . . . . . . . 272 22.1 7.6 0.538 * 11.2 13.2 14.2 16.9 21.9 26.6 29.4 31.5 34.6 *70 years and over . . . . . . . . 246 21.8 9.0 0.666 * 8.6 10.7 11.9 16.5 20.3 26.9 31.3 33.3 37.9 *
Mexican American
1 year and over . . . . . . . . . . . 3,916 21.5 10.5 0.290 4.9 6.4 9.4 11.1 14.1 20.3 27.2 31.6 35.6 40.9 45.81–2 years . . . . . . . . . . . . . 243 17.4 9.8 0.751 * * 5.8 7.8 10.3 16.1 22.5 26.4 29.3 * *3–5 years . . . . . . . . . . . . . 475 20.2 9.2 0.505 * 6.3 9.3 10.4 13.4 19.3 26.1 28.6 31.7 37.2 *6–8 years . . . . . . . . . . . . . 256 21.4 9.1 0.683 * * 10.6 12.3 14.2 21.3 26.1 31.7 33.6 * *9–11 years . . . . . . . . . . . . . 264 20.2 8.4 0.616 * * 10.0 12.1 14.7 18.1 26.5 29.1 31.8 * *12–14 years . . . . . . . . . . . . 217 21.5 10.6 0.864 * * 9.6 11.1 13.4 20.7 28.0 30.4 32.4 * *15–19 years . . . . . . . . . . . . 290 20.5 10.1 0.712 * 6.3 8.0 9.6 12.9 19.1 27.0 30.7 35.6 38.4 *20–29 years . . . . . . . . . . . . 631 23.0 11.8 0.560 * 7.2 10.0 11.9 14.6 21.2 29.1 35.5 39.2 46.0 *30–39 years . . . . . . . . . . . . 506 21.9 10.9 0.580 * 6.1 8.8 10.9 14.1 21.0 27.6 31.9 37.4 41.1 *40–49 years . . . . . . . . . . . . 353 20.5 11.4 0.727 * 3.4 6.2 8.4 12.3 19.5 27.2 31.6 36.2 42.1 *50–59 years . . . . . . . . . . . . 187 21.7 8.7 0.760 * * 12.4 14.7 16.8 20.2 26.8 30.6 32.3 * *60–69 years . . . . . . . . . . . . 322 23.0 8.9 0.593 * 10.8 12.2 13.9 16.8 22.3 27.3 31.0 34.5 39.1 *70 years and over . . . . . . . . 172 22.1 8.4 0.769 * * 12.0 13.6 16.4 21.3 26.5 31.1 34.8 * *
* Does not meet standards for reliability or precision.1Includes all other race/ethnic groups not listed separately.
Page 132 [ Series 11, No. 247

Table 100. Erythrocyte protoporphyrin in microgram per deciliter of red blood cells for persons 1 year and over, number of examinedpersons, mean, standard deviation, standard error of the mean, and selected percentiles, by race/ethnicity and age: United States, 1988–94
Race/ethnicity and age
Number ofexaminedpersons Mean
Standarddeviation
Standarderror ofmean
Percentile
2.5th 5th 10th 15th 25th 50th 75th 85th 90th 95th 97.5th
All race/ethnic groups1
1 year and over . . . . . . . . . . . 26,706 49.5 26.1 0.274 28.0 30.0 33.0 34.1 37.0 44.0 54.0 62.0 67.1 81.1 107.01–2 years . . . . . . . . . . . . . 1,877 57.6 29.2 0.925 30.0 33.0 37.0 39.0 42.0 50.1 63.0 73.0 83.1 109.0 129.23–5 years . . . . . . . . . . . . . 2,690 47.0 20.4 0.538 28.0 30.0 33.0 34.1 37.0 44.0 52.0 58.0 63.0 71.1 85.16–8 years . . . . . . . . . . . . . 1,401 45.8 14.5 0.530 28.0 30.0 33.0 34.0 37.0 43.1 51.0 58.0 62.0 69.0 76.19–11 years . . . . . . . . . . . . . 1,521 47.6 16.8 0.591 28.0 30.0 32.1 35.0 38.0 45.0 54.0 59.0 63.1 74.0 97.012–14 years . . . . . . . . . . . . 1,170 47.6 18.3 0.734 27.0 30.0 32.0 35.0 38.0 44.0 53.0 58.1 64.1 74.1 91.115–19 years . . . . . . . . . . . . 1,808 46.3 20.5 0.661 26.0 28.0 30.0 33.0 35.1 42.0 51.0 58.0 64.1 73.0 95.020–29 years . . . . . . . . . . . . 3,343 46.4 21.0 0.497 28.0 30.0 32.0 34.0 36.0 42.0 51.1 58.0 64.0 73.0 94.130–39 years . . . . . . . . . . . . 3,178 48.6 29.4 0.714 27.0 29.0 32.0 34.0 36.0 43.0 53.0 60.0 65.0 78.1 109.140–49 years . . . . . . . . . . . . 2,487 51.3 31.7 0.871 29.0 31.0 33.0 35.0 37.1 44.1 55.0 62.1 70.0 88.1 122.050–59 years . . . . . . . . . . . . 1,811 49.8 25.3 0.816 29.0 30.0 33.0 35.0 38.0 44.1 54.0 61.1 67.1 84.1 113.060–69 years . . . . . . . . . . . . 2,272 52.3 30.6 0.881 30.0 32.0 34.1 36.0 39.0 47.0 56.1 64.1 71.1 91.0 109.070 years and over . . . . . . . . 3,148 56.0 29.1 0.710 30.0 32.0 36.0 38.0 41.0 50.0 62.0 71.1 78.1 101.1 118.1
Non-Hispanic white
1 year and over . . . . . . . . . . . 9,681 47.8 22.3 0.303 28.0 30.0 32.1 34.0 37.0 43.1 53.0 59.0 64.1 75.0 98.01–2 years . . . . . . . . . . . . . 595 52.9 20.4 0.970 * 32.1 35.0 38.0 40.0 48.1 59.0 66.1 73.0 96.1 *3–5 years . . . . . . . . . . . . . 677 43.6 14.2 0.631 * 29.0 31.0 33.0 36.0 42.0 49.0 53.1 57.1 63.1 *6–8 years . . . . . . . . . . . . . 371 43.6 10.7 0.640 * 29.0 32.0 34.0 36.1 42.1 48.0 53.0 58.0 63.0 *9–11 years . . . . . . . . . . . . . 395 45.1 12.6 0.737 * 30.0 32.0 34.0 36.1 43.0 51.0 56.0 60.0 66.1 *12–14 years . . . . . . . . . . . . 297 46.3 17.3 1.159 * * 32.0 35.0 37.0 43.1 51.1 57.0 61.1 * *15–19 years . . . . . . . . . . . . 477 44.2 15.4 0.814 * 28.0 31.0 33.0 35.0 41.0 49.1 55.0 60.0 68.0 *20–29 years . . . . . . . . . . . . 865 44.3 14.5 0.572 * 29.0 32.0 33.0 35.1 41.0 49.1 55.1 61.0 65.1 *30–39 years . . . . . . . . . . . . 1,016 46.0 23.9 0.869 * 28.0 32.0 33.0 35.1 42.0 51.0 57.1 62.0 70.1 *40–49 years . . . . . . . . . . . . 887 48.5 23.1 0.898 * 31.0 33.0 34.1 37.0 43.0 53.0 60.0 65.1 79.0 *50–59 years . . . . . . . . . . . . 886 49.3 25.9 1.006 * 30.0 33.0 35.0 38.0 44.0 53.0 60.0 67.0 79.0 *60–69 years . . . . . . . . . . . . 990 51.8 28.9 1.064 * 32.0 34.1 36.0 39.0 46.1 56.0 64.0 70.1 91.1 *70 years and over . . . . . . . . 2,225 55.9 27.8 0.682 * 32.0 36.0 38.0 41.0 50.0 62.0 71.0 78.1 101.0 *
Non-Hispanic black
1 year and over . . . . . . . . . . . 7,811 50.5 36.0 0.408 28.0 29.0 32.0 34.0 36.1 43.0 53.1 61.1 68.1 89.1 121.11–2 years . . . . . . . . . . . . . 561 59.9 32.9 1.479 * 34.0 37.0 39.0 42.0 51.0 66.1 76.0 93.0 115.1 *3–5 years . . . . . . . . . . . . . 875 47.3 20.6 0.741 * 30.0 33.0 34.1 37.0 44.0 52.1 58.0 62.0 69.1 *6–8 years . . . . . . . . . . . . . 453 45.8 16.9 0.846 * 29.0 32.0 33.0 36.0 42.0 52.0 56.0 60.0 71.0 *9–11 years . . . . . . . . . . . . . 519 47.4 22.2 1.037 * 30.0 32.1 34.1 37.1 43.0 52.0 59.0 62.0 70.0 *12–14 years . . . . . . . . . . . . 409 46.4 22.6 1.186 * 29.0 31.0 33.0 36.0 42.0 49.0 56.0 62.0 75.1 *15–19 years . . . . . . . . . . . . 633 46.1 29.6 1.249 * 27.0 29.0 30.0 33.0 40.0 49.0 57.0 64.1 81.1 *20–29 years . . . . . . . . . . . . 1,052 48.8 36.1 1.182 * 29.0 31.0 33.0 35.0 41.0 51.0 60.1 67.0 84.1 *30–39 years . . . . . . . . . . . . 1,068 52.4 41.6 1.355 * 31.0 32.0 34.0 36.0 42.0 53.0 62.1 71.0 108.0 *40–49 years . . . . . . . . . . . . 762 55.6 48.3 1.860 * 31.0 33.0 35.0 37.0 44.0 56.0 66.0 73.1 115.0 *50–59 years . . . . . . . . . . . . 465 49.1 21.5 1.060 * 30.0 33.0 34.0 37.0 44.0 54.0 62.0 72.1 88.0 *60–69 years . . . . . . . . . . . . 546 52.5 47.2 2.145 * 30.0 33.0 35.0 38.0 46.0 57.0 62.0 70.0 88.0 *70 years and over . . . . . . . . 468 55.0 43.2 2.124 * 32.0 35.0 37.0 39.1 47.1 57.0 67.1 76.1 103.0 *
Mexican American
1 year and over . . . . . . . . . . . 8,052 56.8 32.6 0.524 30.0 33.0 35.0 37.1 41.0 50.0 62.0 71.1 79.0 105.1 126.11–2 years . . . . . . . . . . . . . 619 72.5 49.9 2.491 * 38.0 41.0 44.0 48.1 59.1 74.1 94.0 112.1 144.2 *3–5 years . . . . . . . . . . . . . 997 56.2 36.5 1.436 * 35.0 37.1 39.0 44.0 52.0 62.0 69.1 74.0 85.1 *6–8 years . . . . . . . . . . . . . 514 53.6 19.8 1.086 * 33.1 36.0 38.0 41.0 50.0 62.0 68.1 74.0 82.0 *9–11 years . . . . . . . . . . . . . 542 56.2 19.0 1.014 * 35.0 38.0 40.0 44.0 53.0 63.0 70.1 77.0 97.1 *12–14 years . . . . . . . . . . . . 409 54.1 16.5 1.010 * 35.0 38.1 41.0 44.0 51.0 60.0 66.0 71.1 82.1 *15–19 years . . . . . . . . . . . . 602 55.8 31.0 1.566 * 31.0 35.0 37.0 41.0 48.0 61.0 69.1 76.1 108.1 *20–29 years . . . . . . . . . . . . 1,283 53.1 28.1 0.975 * 31.0 34.0 35.1 39.0 47.0 60.0 69.1 75.0 96.0 *30–39 years . . . . . . . . . . . . 960 56.4 30.8 1.234 * 32.0 34.1 36.1 40.1 49.0 63.0 70.1 78.1 106.0 *40–49 years . . . . . . . . . . . . 727 63.3 47.7 2.197 * 33.0 36.0 38.0 40.1 50.0 65.1 79.1 105.1 145.1 *50–59 years . . . . . . . . . . . . 364 56.8 32.1 2.089 * 32.0 34.0 36.0 40.0 49.0 62.0 72.1 88.1 115.0 *60–69 years . . . . . . . . . . . . 659 56.5 32.0 1.546 * 33.0 36.0 38.0 42.0 51.0 63.0 71.0 76.0 98.1 *70 years and over . . . . . . . . 376 59.6 31.2 1.997 * 34.0 36.0 38.0 43.0 53.0 65.0 77.1 89.1 110.1 *
* Does not meet standards for reliability or precision.1Includes all other race/ethnic groups not listed separately.
Series 11, No. 247 [ Page 133

Table 101. Erythrocyte protoporphyrin in microgram per deciliter of red blood cells for males 1 year and over, number of examined persons,mean, standard deviation, standard error of the mean, and selected percentiles, by race/ethnicity and age: United States, 1988–94
Race/ethnicity and age
Number ofexaminedpersons Mean
Standarddeviation
Standarderror ofmean
Percentile
2.5th 5th 10th 15th 25th 50th 75th 85th 90th 95th 97.5th
All race/ethnic groups1
1 year and over . . . . . . . . . . . 12,761 44.3 19.3 0.292 27.0 29.0 31.0 33.0 35.0 41.0 48.1 54.0 59.1 69.0 84.11–2 years . . . . . . . . . . . . . 962 57.2 30.9 1.384 31.0 33.0 37.0 39.0 42.0 50.0 62.0 70.0 78.1 110.0 129.23–5 years . . . . . . . . . . . . . 1,305 46.9 23.8 0.915 28.0 29.0 32.0 34.0 37.0 43.0 52.0 58.1 63.0 72.1 87.06–8 years . . . . . . . . . . . . . 716 45.9 14.9 0.772 27.0 30.0 33.0 34.0 37.0 43.0 52.0 58.0 63.0 70.0 77.19–11 years . . . . . . . . . . . . . 775 46.6 15.6 0.778 27.0 30.0 32.1 34.1 38.0 44.0 52.1 58.0 62.0 71.0 79.112–14 years . . . . . . . . . . . . 543 45.0 15.1 0.903 26.0 29.0 31.0 34.0 37.0 43.0 49.0 55.1 57.0 65.1 83.015–19 years . . . . . . . . . . . . 853 40.0 11.0 0.524 25.0 27.0 29.0 30.0 33.0 38.0 45.0 48.1 52.1 60.0 67.120–29 years . . . . . . . . . . . . 1,567 40.2 10.6 0.372 26.0 28.0 30.0 32.0 34.0 38.0 45.0 49.0 52.0 59.0 65.030–39 years . . . . . . . . . . . . 1,407 40.8 11.8 0.438 25.0 27.0 30.0 32.0 34.0 39.0 45.1 48.1 53.0 60.1 65.140–49 years . . . . . . . . . . . . 1,171 43.9 19.2 0.781 26.0 29.0 31.0 33.0 35.0 41.0 47.1 53.0 56.0 64.0 80.050–59 years . . . . . . . . . . . . 837 45.0 17.9 0.859 28.0 29.0 31.0 33.0 35.0 41.0 49.0 54.1 61.0 72.1 87.060–69 years . . . . . . . . . . . . 1,148 49.1 28.6 1.175 29.0 31.0 33.0 35.0 37.0 44.0 53.0 61.0 66.1 84.1 104.070 years and over . . . . . . . . 1,477 53.4 32.9 1.191 28.0 31.0 34.0 35.1 38.1 47.0 57.1 67.0 77.1 101.1 128.1
Non-Hispanic white
1 year and over . . . . . . . . . . . 4,569 43.4 17.1 0.338 27.0 28.0 31.0 33.0 35.0 40.0 48.0 53.0 57.0 65.1 78.01–2 years . . . . . . . . . . . . . 312 51.9 20.3 1.361 * 32.1 35.1 38.0 40.0 48.0 58.0 65.0 68.1 79.1 *3–5 years . . . . . . . . . . . . . 331 43.4 16.4 1.064 * 28.0 31.0 33.0 36.0 41.0 48.1 53.0 57.0 63.0 *6–8 years . . . . . . . . . . . . . 193 44.0 11.7 0.997 * * 32.0 34.0 36.0 42.1 49.0 54.0 58.0 * *9–11 years . . . . . . . . . . . . . 203 44.4 12.6 1.050 * * 32.0 34.0 36.1 42.0 50.0 55.0 61.0 * *12–14 years . . . . . . . . . . . . 141 43.8 12.5 1.250 * * 30.0 34.0 37.0 43.0 49.0 54.0 56.1 * *15–19 years . . . . . . . . . . . . 206 39.6 9.8 0.811 * * 29.0 31.0 33.0 38.0 44.0 47.1 51.0 * *20–29 years . . . . . . . . . . . . 382 39.2 9.5 0.576 * 28.0 30.0 31.0 34.0 38.0 43.0 47.1 50.0 57.0 *30–39 years . . . . . . . . . . . . 439 39.9 10.1 0.572 * 27.0 30.0 31.0 34.0 38.1 44.0 48.0 52.0 57.0 *40–49 years . . . . . . . . . . . . 420 43.1 19.3 1.113 * 29.0 31.0 33.0 35.0 40.0 47.0 52.1 55.0 61.0 *50–59 years . . . . . . . . . . . . 411 44.1 16.0 0.937 * 29.0 31.0 33.0 35.0 40.1 48.0 54.0 59.0 71.1 *60–69 years . . . . . . . . . . . . 505 48.4 21.8 1.147 * 31.0 32.1 35.0 37.0 43.1 52.1 59.0 65.1 84.1 *70 years and over . . . . . . . . 1,026 53.3 30.5 1.127 * 30.0 34.0 36.0 38.1 47.0 57.1 66.1 77.1 101.1 *
Non-Hispanic black
1 year and over . . . . . . . . . . . 3,648 43.8 27.2 0.450 27.0 28.0 30.0 32.0 34.0 39.0 47.0 52.1 58.0 67.1 87.11–2 years . . . . . . . . . . . . . 279 61.8 37.8 2.404 * 33.0 37.0 39.0 42.0 52.1 67.0 79.0 106.0 115.1 *3–5 years . . . . . . . . . . . . . 425 47.2 23.7 1.224 * 30.0 32.0 34.0 37.0 43.1 52.0 57.1 62.0 69.0 *6–8 years . . . . . . . . . . . . . 230 43.9 15.8 1.108 * 29.0 31.0 33.0 35.0 41.0 50.0 55.0 57.0 61.0 *9–11 years . . . . . . . . . . . . . 267 47.1 22.4 1.455 * 30.0 32.0 33.1 37.0 43.0 52.0 59.1 63.0 70.1 *12–14 years . . . . . . . . . . . . 185 46.8 25.7 2.010 * * 30.0 33.0 36.0 41.0 48.0 57.0 66.0 * *15–19 years . . . . . . . . . . . . 301 36.2 8.9 0.543 * 25.0 28.0 29.0 30.0 36.0 40.0 43.0 46.0 50.0 *20–29 years . . . . . . . . . . . . 464 38.5 10.7 0.528 * 27.0 29.0 31.0 33.0 37.0 42.0 46.0 49.0 55.0 *30–39 years . . . . . . . . . . . . 461 41.8 17.3 0.856 * 29.0 31.0 32.0 34.0 38.1 45.0 48.0 52.0 62.0 *40–49 years . . . . . . . . . . . . 335 41.8 13.2 0.764 * 29.0 31.0 33.0 34.1 40.0 45.0 50.0 54.0 62.0 *50–59 years . . . . . . . . . . . . 208 45.2 20.8 1.529 * * 31.0 33.0 35.0 40.1 49.0 55.0 61.0 * *60–69 years . . . . . . . . . . . . 273 52.7 69.1 4.445 * 30.0 31.0 33.0 35.1 43.0 51.0 61.0 64.0 94.0 *70 years and over . . . . . . . . 220 53.8 58.3 4.180 * * 33.0 34.1 38.0 44.0 53.1 64.0 72.0 * *
Mexican American
1 year and over . . . . . . . . . . . 3,993 50.5 26.6 0.607 28.0 31.0 33.0 35.0 38.0 45.0 55.1 63.1 69.1 82.1 106.11–2 years . . . . . . . . . . . . . 309 75.1 54.9 3.720 * 38.0 41.0 44.0 48.0 60.0 75.0 104.1 127.0 171.0 *3–5 years . . . . . . . . . . . . . 475 56.3 48.3 2.638 * 35.0 37.0 38.1 43.0 52.0 61.0 68.0 73.1 83.1 *6–8 years . . . . . . . . . . . . . 253 53.2 22.7 1.700 * * 36.0 37.0 40.0 49.0 62.0 68.1 72.1 * *9–11 years . . . . . . . . . . . . . 271 54.8 19.6 1.420 * * 38.0 39.0 42.0 51.1 61.0 68.1 74.1 * *12–14 years . . . . . . . . . . . . 191 51.8 16.4 1.416 * * 37.0 39.0 41.0 49.0 57.0 64.0 71.1 * *15–19 years . . . . . . . . . . . . 307 47.2 17.5 1.191 * 29.0 31.0 34.1 37.0 44.0 51.1 58.0 63.1 72.1 *20–29 years . . . . . . . . . . . . 650 45.2 14.9 0.697 * 29.0 32.0 34.0 36.0 41.1 50.1 57.0 63.0 71.1 *30–39 years . . . . . . . . . . . . 452 46.0 14.9 0.834 * 30.0 32.0 34.0 37.0 43.0 53.0 58.0 64.0 69.1 *40–49 years . . . . . . . . . . . . 370 49.8 22.0 1.365 * 30.0 33.0 35.0 38.1 45.0 53.0 60.0 69.1 87.1 *50–59 years . . . . . . . . . . . . 177 55.2 36.4 3.265 * * 33.0 34.1 39.0 45.1 59.0 72.0 81.0 * *60–69 years . . . . . . . . . . . . 337 53.8 42.1 2.734 * 32.0 34.0 35.1 38.0 45.1 58.0 67.1 71.1 82.1 *70 years and over . . . . . . . . 201 56.5 23.7 1.994 * * 35.0 36.0 39.0 53.0 63.1 79.0 89.1 * *
* Does not meet standards for reliability or precision.1Includes all other race/ethnic groups not listed separately.
Page 134 [ Series 11, No. 247
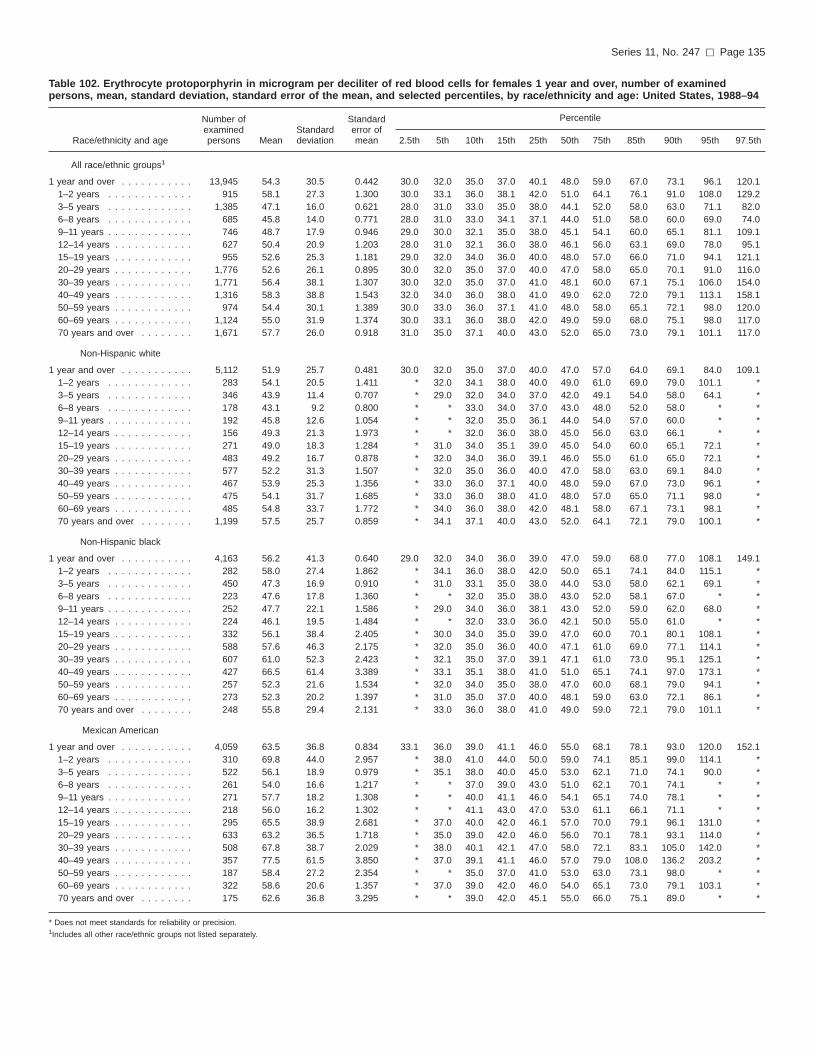
Table 102. Erythrocyte protoporphyrin in microgram per deciliter of red blood cells for females 1 year and over, number of examinedpersons, mean, standard deviation, standard error of the mean, and selected percentiles, by race/ethnicity and age: United States, 1988–94
Race/ethnicity and age
Number ofexaminedpersons Mean
Standarddeviation
Standarderror ofmean
Percentile
2.5th 5th 10th 15th 25th 50th 75th 85th 90th 95th 97.5th
All race/ethnic groups1
1 year and over . . . . . . . . . . . 13,945 54.3 30.5 0.442 30.0 32.0 35.0 37.0 40.1 48.0 59.0 67.0 73.1 96.1 120.11–2 years . . . . . . . . . . . . . 915 58.1 27.3 1.300 30.0 33.1 36.0 38.1 42.0 51.0 64.1 76.1 91.0 108.0 129.23–5 years . . . . . . . . . . . . . 1,385 47.1 16.0 0.621 28.0 31.0 33.0 35.0 38.0 44.1 52.0 58.0 63.0 71.1 82.06–8 years . . . . . . . . . . . . . 685 45.8 14.0 0.771 28.0 31.0 33.0 34.1 37.1 44.0 51.0 58.0 60.0 69.0 74.09–11 years . . . . . . . . . . . . . 746 48.7 17.9 0.946 29.0 30.0 32.1 35.0 38.0 45.1 54.1 60.0 65.1 81.1 109.112–14 years . . . . . . . . . . . . 627 50.4 20.9 1.203 28.0 31.0 32.1 36.0 38.0 46.1 56.0 63.1 69.0 78.0 95.115–19 years . . . . . . . . . . . . 955 52.6 25.3 1.181 29.0 32.0 34.0 36.0 40.0 48.0 57.0 66.0 71.0 94.1 121.120–29 years . . . . . . . . . . . . 1,776 52.6 26.1 0.895 30.0 32.0 35.0 37.0 40.0 47.0 58.0 65.0 70.1 91.0 116.030–39 years . . . . . . . . . . . . 1,771 56.4 38.1 1.307 30.0 32.0 35.0 37.0 41.0 48.1 60.0 67.1 75.1 106.0 154.040–49 years . . . . . . . . . . . . 1,316 58.3 38.8 1.543 32.0 34.0 36.0 38.0 41.0 49.0 62.0 72.0 79.1 113.1 158.150–59 years . . . . . . . . . . . . 974 54.4 30.1 1.389 30.0 33.0 36.0 37.1 41.0 48.0 58.0 65.1 72.1 98.0 120.060–69 years . . . . . . . . . . . . 1,124 55.0 31.9 1.374 30.0 33.1 36.0 38.0 42.0 49.0 59.0 68.0 75.1 98.0 117.070 years and over . . . . . . . . 1,671 57.7 26.0 0.918 31.0 35.0 37.1 40.0 43.0 52.0 65.0 73.0 79.1 101.1 117.0
Non-Hispanic white
1 year and over . . . . . . . . . . . 5,112 51.9 25.7 0.481 30.0 32.0 35.0 37.0 40.0 47.0 57.0 64.0 69.1 84.0 109.11–2 years . . . . . . . . . . . . . 283 54.1 20.5 1.411 * 32.0 34.1 38.0 40.0 49.0 61.0 69.0 79.0 101.1 *3–5 years . . . . . . . . . . . . . 346 43.9 11.4 0.707 * 29.0 32.0 34.0 37.0 42.0 49.1 54.0 58.0 64.1 *6–8 years . . . . . . . . . . . . . 178 43.1 9.2 0.800 * * 33.0 34.0 37.0 43.0 48.0 52.0 58.0 * *9–11 years . . . . . . . . . . . . . 192 45.8 12.6 1.054 * * 32.0 35.0 36.1 44.0 54.0 57.0 60.0 * *12–14 years . . . . . . . . . . . . 156 49.3 21.3 1.973 * * 32.0 36.0 38.0 45.0 56.0 63.0 66.1 * *15–19 years . . . . . . . . . . . . 271 49.0 18.3 1.284 * 31.0 34.0 35.1 39.0 45.0 54.0 60.0 65.1 72.1 *20–29 years . . . . . . . . . . . . 483 49.2 16.7 0.878 * 32.0 34.0 36.0 39.1 46.0 55.0 61.0 65.0 72.1 *30–39 years . . . . . . . . . . . . 577 52.2 31.3 1.507 * 32.0 35.0 36.0 40.0 47.0 58.0 63.0 69.1 84.0 *40–49 years . . . . . . . . . . . . 467 53.9 25.3 1.356 * 33.0 36.0 37.1 40.0 48.0 59.0 67.0 73.0 96.1 *50–59 years . . . . . . . . . . . . 475 54.1 31.7 1.685 * 33.0 36.0 38.0 41.0 48.0 57.0 65.0 71.1 98.0 *60–69 years . . . . . . . . . . . . 485 54.8 33.7 1.772 * 34.0 36.0 38.0 42.0 48.1 58.0 67.1 73.1 98.1 *70 years and over . . . . . . . . 1,199 57.5 25.7 0.859 * 34.1 37.1 40.0 43.0 52.0 64.1 72.1 79.0 100.1 *
Non-Hispanic black
1 year and over . . . . . . . . . . . 4,163 56.2 41.3 0.640 29.0 32.0 34.0 36.0 39.0 47.0 59.0 68.0 77.0 108.1 149.11–2 years . . . . . . . . . . . . . 282 58.0 27.4 1.862 * 34.1 36.0 38.0 42.0 50.0 65.1 74.1 84.0 115.1 *3–5 years . . . . . . . . . . . . . 450 47.3 16.9 0.910 * 31.0 33.1 35.0 38.0 44.0 53.0 58.0 62.1 69.1 *6–8 years . . . . . . . . . . . . . 223 47.6 17.8 1.360 * * 32.0 35.0 38.0 43.0 52.0 58.1 67.0 * *9–11 years . . . . . . . . . . . . . 252 47.7 22.1 1.586 * 29.0 34.0 36.0 38.1 43.0 52.0 59.0 62.0 68.0 *12–14 years . . . . . . . . . . . . 224 46.1 19.5 1.484 * * 32.0 33.0 36.0 42.1 50.0 55.0 61.0 * *15–19 years . . . . . . . . . . . . 332 56.1 38.4 2.405 * 30.0 34.0 35.0 39.0 47.0 60.0 70.1 80.1 108.1 *20–29 years . . . . . . . . . . . . 588 57.6 46.3 2.175 * 32.0 35.0 36.0 40.0 47.1 61.0 69.0 77.1 114.1 *30–39 years . . . . . . . . . . . . 607 61.0 52.3 2.423 * 32.1 35.0 37.0 39.1 47.1 61.0 73.0 95.1 125.1 *40–49 years . . . . . . . . . . . . 427 66.5 61.4 3.389 * 33.1 35.1 38.0 41.0 51.0 65.1 74.1 97.0 173.1 *50–59 years . . . . . . . . . . . . 257 52.3 21.6 1.534 * 32.0 34.0 35.0 38.0 47.0 60.0 68.1 79.0 94.1 *60–69 years . . . . . . . . . . . . 273 52.3 20.2 1.397 * 31.0 35.0 37.0 40.0 48.1 59.0 63.0 72.1 86.1 *70 years and over . . . . . . . . 248 55.8 29.4 2.131 * 33.0 36.0 38.0 41.0 49.0 59.0 72.1 79.0 101.1 *
Mexican American
1 year and over . . . . . . . . . . . 4,059 63.5 36.8 0.834 33.1 36.0 39.0 41.1 46.0 55.0 68.1 78.1 93.0 120.0 152.11–2 years . . . . . . . . . . . . . 310 69.8 44.0 2.957 * 38.0 41.0 44.0 50.0 59.0 74.1 85.1 99.0 114.1 *3–5 years . . . . . . . . . . . . . 522 56.1 18.9 0.979 * 35.1 38.0 40.0 45.0 53.0 62.1 71.0 74.1 90.0 *6–8 years . . . . . . . . . . . . . 261 54.0 16.6 1.217 * * 37.0 39.0 43.0 51.0 62.1 70.1 74.1 * *9–11 years . . . . . . . . . . . . . 271 57.7 18.2 1.308 * * 40.0 41.1 46.0 54.1 65.1 74.0 78.1 * *12–14 years . . . . . . . . . . . . 218 56.0 16.2 1.302 * * 41.1 43.0 47.0 53.0 61.1 66.1 71.1 * *15–19 years . . . . . . . . . . . . 295 65.5 38.9 2.681 * 37.0 40.0 42.0 46.1 57.0 70.0 79.1 96.1 131.0 *20–29 years . . . . . . . . . . . . 633 63.2 36.5 1.718 * 35.0 39.0 42.0 46.0 56.0 70.1 78.1 93.1 114.0 *30–39 years . . . . . . . . . . . . 508 67.8 38.7 2.029 * 38.0 40.1 42.1 47.0 58.0 72.1 83.1 105.0 142.0 *40–49 years . . . . . . . . . . . . 357 77.5 61.5 3.850 * 37.0 39.1 41.1 46.0 57.0 79.0 108.0 136.2 203.2 *50–59 years . . . . . . . . . . . . 187 58.4 27.2 2.354 * * 35.0 37.0 41.0 53.0 63.0 73.1 98.0 * *60–69 years . . . . . . . . . . . . 322 58.6 20.6 1.357 * 37.0 39.0 42.0 46.0 54.0 65.1 73.0 79.1 103.1 *70 years and over . . . . . . . . 175 62.6 36.8 3.295 * * 39.0 42.0 45.1 55.0 66.0 75.1 89.0 * *
* Does not meet standards for reliability or precision.1Includes all other race/ethnic groups not listed separately.
Series 11, No. 247 [ Page 135

Table 103. Serum ferritin in nanogram per milliliter for persons 1 year and over, number of examined persons, mean, standard deviation,standard error of the mean, and selected percentiles, by race/ethnicity and age: United States, 1988–94
Race/ethnicity and age
Number ofexaminedpersons Mean
Standarddeviation
Standarderror ofmean
Percentile
2.5th 5th 10th 15th 25th 50th 75th 85th 90th 95th 97.5th
All race/ethnic groups1
1 year and over . . . . . . . . . . . 26,393 105.3 126.8 1.477 8.0 11.0 17.0 21.0 30.0 63.0 136.1 193.1 242.0 332.2 431.41–2 years . . . . . . . . . . . . . 1,805 25.9 23.4 0.818 3.0 6.0 8.0 10.0 14.0 22.0 32.1 39.1 44.1 60.0 73.13–5 years . . . . . . . . . . . . . 2,638 32.1 30.4 0.878 9.0 11.0 14.0 16.0 20.0 27.0 38.1 47.0 54.1 69.1 82.16–8 years . . . . . . . . . . . . . 1,382 35.4 22.7 0.904 13.0 14.0 17.0 18.0 21.0 31.0 44.0 53.0 60.0 77.1 91.19–11 years . . . . . . . . . . . . . 1,499 37.5 20.8 0.798 10.0 14.0 17.0 20.0 23.0 33.0 47.0 56.0 63.0 75.0 85.012–14 years . . . . . . . . . . . . 1,159 41.8 74.3 3.237 7.0 10.0 15.0 18.0 21.0 32.0 45.0 57.0 66.0 83.0 103.115–19 years . . . . . . . . . . . . 1,796 50.6 41.6 1.456 6.0 9.0 14.0 18.0 24.0 39.0 67.1 83.1 99.0 121.1 160.020–29 years . . . . . . . . . . . . 3,320 88.3 76.5 1.970 7.0 11.0 17.0 22.0 33.0 66.1 121.0 164.1 187.1 239.2 272.230–39 years . . . . . . . . . . . . 3,154 119.5 125.4 3.313 6.0 10.0 17.0 24.0 39.0 82.1 163.2 216.0 266.0 333.5 425.540–49 years . . . . . . . . . . . . 2,476 132.2 146.7 4.374 6.0 9.0 13.0 20.0 33.0 90.1 178.2 247.2 301.1 412.0 528.950–59 years . . . . . . . . . . . . 1,793 153.4 143.9 5.039 14.0 18.0 28.0 39.0 59.0 110.1 200.1 266.2 337.2 434.2 536.560–69 years . . . . . . . . . . . . 2,251 170.0 169.1 5.287 16.0 25.0 35.0 45.0 63.1 122.1 224.2 288.1 358.2 475.1 605.370 years and over . . . . . . . . 3,120 155.0 174.3 4.628 14.0 20.0 32.0 41.0 59.0 107.0 189.2 259.4 311.5 442.1 573.6
Non-Hispanic white
1 year and over . . . . . . . . . . . 9,590 106.5 122.9 1.866 9.0 12.0 18.0 22.0 31.0 66.1 139.0 193.2 242.1 328.2 425.41–2 years . . . . . . . . . . . . . 577 25.5 19.0 0.911 * 7.0 9.0 11.0 14.0 21.0 33.0 39.0 42.0 59.1 *3–5 years . . . . . . . . . . . . . 666 30.9 17.5 0.781 * 12.0 15.0 16.0 19.0 26.0 37.1 46.0 54.1 68.1 *6–8 years . . . . . . . . . . . . . 371 34.1 18.9 1.130 * 14.0 16.0 18.0 20.0 29.0 42.0 51.0 57.0 73.1 *9–11 years . . . . . . . . . . . . . 389 36.3 18.2 1.061 * 13.0 17.0 20.0 23.0 33.0 45.1 55.0 59.0 72.0 *12–14 years . . . . . . . . . . . . 293 43.5 87.5 5.874 * * 16.0 19.0 21.0 31.0 44.0 56.0 64.1 * *15–19 years . . . . . . . . . . . . 474 50.4 38.1 2.009 * 11.0 16.0 19.0 25.0 41.0 68.0 81.0 97.0 119.1 *20–29 years . . . . . . . . . . . . 861 86.8 73.7 2.886 * 13.0 18.0 23.0 33.0 65.0 116.1 160.1 184.1 238.0 *30–39 years . . . . . . . . . . . . 1,010 115.6 114.7 4.145 * 12.0 19.0 26.0 41.0 82.0 158.1 207.1 252.2 322.3 *40–49 years . . . . . . . . . . . . 885 129.9 136.0 5.250 * 9.0 15.0 22.0 34.0 91.1 176.0 240.0 299.4 400.0 *50–59 years . . . . . . . . . . . . 876 145.7 134.9 5.238 * 17.0 26.0 38.0 56.0 108.0 190.0 253.2 325.5 400.2 *60–69 years . . . . . . . . . . . . 978 165.8 157.9 5.800 * 24.0 33.1 43.1 63.0 119.1 222.1 284.2 353.0 468.4 *70 years and over . . . . . . . . 2,210 150.3 168.5 4.117 * 20.0 31.0 41.0 57.1 105.0 183.0 254.2 304.4 434.1 *
Non-Hispanic black
1 year and over . . . . . . . . . . . 7,683 113.9 152.7 2.549 7.0 10.0 17.0 21.0 30.0 61.0 142.2 209.1 267.3 382.0 523.51–2 years . . . . . . . . . . . . . 538 29.0 26.2 1.311 * 6.0 10.0 12.0 16.0 24.0 34.0 44.0 53.0 62.0 *3–5 years . . . . . . . . . . . . . 853 39.8 62.5 2.487 * 13.0 16.0 19.0 23.0 32.0 44.0 53.0 64.0 90.1 *6–8 years . . . . . . . . . . . . . 442 45.4 36.7 2.030 * 18.0 20.0 22.0 26.0 38.0 56.1 68.0 77.0 92.0 *9–11 years . . . . . . . . . . . . . 508 45.2 29.6 1.527 * 17.0 20.0 22.0 26.0 39.0 56.0 68.0 75.1 89.0 *12–14 years . . . . . . . . . . . . 405 43.4 39.6 2.288 * 12.0 15.0 18.0 24.0 35.0 52.1 67.1 78.1 105.1 *15–19 years . . . . . . . . . . . . 626 54.1 48.4 2.250 * 8.0 12.0 16.0 22.0 42.0 71.0 95.0 111.0 137.2 *20–29 years . . . . . . . . . . . . 1,040 94.2 91.2 3.284 * 8.0 13.0 19.0 29.0 68.0 130.0 173.2 216.1 259.2 *30–39 years . . . . . . . . . . . . 1,054 137.3 166.5 5.958 * 9.0 17.0 22.0 38.0 90.0 182.0 251.1 317.3 415.0 *40–49 years . . . . . . . . . . . . 757 159.8 192.8 8.142 * 7.0 12.0 19.0 34.0 99.1 212.2 287.4 360.5 529.3 *50–59 years . . . . . . . . . . . . 462 208.4 172.7 9.337 * 33.0 46.0 60.1 88.0 156.2 276.4 374.3 430.1 560.5 *60–69 years . . . . . . . . . . . . 539 208.9 234.2 11.719 * 32.0 48.1 61.0 90.0 146.2 265.3 360.2 430.1 554.9 *70 years and over . . . . . . . . 459 212.7 226.2 12.266 * 28.0 40.0 56.0 79.1 146.1 254.2 340.4 423.1 693.3 *
Mexican American
1 year and over . . . . . . . . . . . 7,976 83.3 108.2 1.551 4.0 8.0 13.0 16.0 23.0 45.0 106.0 158.2 197.2 274.3 348.41–2 years . . . . . . . . . . . . . 592 23.7 41.6 2.140 * 3.0 3.0 7.0 10.0 18.0 28.0 36.1 43.0 61.0 *3–5 years . . . . . . . . . . . . . 983 29.7 19.6 0.781 * 9.0 11.0 14.0 18.0 25.0 37.0 45.1 51.0 63.0 *6–8 years . . . . . . . . . . . . . 508 31.8 18.1 1.008 * 11.0 13.0 15.0 19.0 28.0 38.1 46.0 56.0 66.1 *9–11 years . . . . . . . . . . . . . 537 36.1 21.0 1.135 * 14.0 17.0 19.0 22.0 31.0 43.1 52.1 63.0 78.1 *12–14 years . . . . . . . . . . . . 406 31.6 23.2 1.444 * 9.0 11.0 13.0 17.0 26.0 40.0 49.0 57.1 76.1 *15–19 years . . . . . . . . . . . . 601 44.5 37.5 1.915 * 6.0 11.0 15.0 20.0 33.1 59.1 77.1 93.1 120.0 *20–29 years . . . . . . . . . . . . 1,277 89.6 82.0 2.876 * 8.0 14.0 19.0 31.0 68.1 124.1 163.2 196.0 243.2 *30–39 years . . . . . . . . . . . . 957 118.7 133.7 5.417 * 8.0 13.0 18.0 30.0 78.1 161.2 216.2 276.1 346.3 *40–49 years . . . . . . . . . . . . 725 124.4 127.9 5.951 * 6.0 11.0 17.0 29.0 91.1 175.1 242.0 278.2 378.3 *50–59 years . . . . . . . . . . . . 361 149.2 177.5 11.707 * 15.0 22.0 31.0 60.0 110.1 187.1 237.1 284.0 414.4 *60–69 years . . . . . . . . . . . . 657 153.7 178.2 8.709 * 19.0 30.0 40.0 60.0 108.1 192.2 250.2 291.4 418.4 *70 years and over . . . . . . . . 372 131.5 129.2 8.390 * 18.0 24.0 31.0 41.0 93.1 179.1 237.2 303.3 386.4 *
* Does not meet standards for reliability or precision.1Includes all other race/ethnic groups not listed separately.
Page 136 [ Series 11, No. 247

Table 104. Serum ferritin in nanogram per milliliter for males 1 year and over, number of examined persons, mean, standard deviation,standard error of the mean, and selected percentiles, by race/ethnicity and age: United States, 1988–94
Race/ethnicity and age
Number ofexaminedpersons Mean
Standarddeviation
Standarderror ofmean
Percentile
2.5th 5th 10th 15th 25th 50th 75th 85th 90th 95th 97.5th
All race/ethnic groups1
1 year and over . . . . . . . . . . . 12,603 141.2 139.9 2.358 14.0 18.0 24.0 30.0 47.0 103.0 185.2 248.2 302.0 403.3 503.41–2 years . . . . . . . . . . . . . 920 24.0 18.2 0.884 3.0 5.0 8.0 10.0 13.0 21.0 30.0 37.0 42.0 57.0 69.13–5 years . . . . . . . . . . . . . 1,283 30.2 19.2 0.793 9.0 11.0 13.0 15.0 19.0 26.0 35.0 45.0 52.0 69.1 84.06–8 years . . . . . . . . . . . . . 704 34.3 24.8 1.382 13.0 14.0 16.0 17.0 20.0 29.0 40.0 47.0 56.0 84.0 91.19–11 years . . . . . . . . . . . . . 762 38.5 19.4 1.039 12.0 15.0 19.0 21.0 25.0 34.0 48.0 56.0 64.0 74.1 85.012–14 years . . . . . . . . . . . . 537 40.6 29.6 1.884 11.0 15.0 18.0 20.0 23.0 32.1 50.0 63.0 70.0 92.0 103.115–19 years . . . . . . . . . . . . 846 67.5 47.6 2.416 18.0 20.0 26.0 29.0 34.1 57.0 82.1 103.1 118.1 155.1 197.220–29 years . . . . . . . . . . . . 1,557 131.2 79.7 2.982 25.0 38.1 52.0 59.1 77.0 113.1 172.1 198.2 238.0 270.0 324.430–39 years . . . . . . . . . . . . 1,396 182.7 132.5 5.236 30.0 48.0 66.1 77.1 97.1 152.2 231.1 285.4 325.4 416.5 511.240–49 years . . . . . . . . . . . . 1,169 195.1 155.3 6.705 18.0 29.0 50.1 73.0 99.1 159.1 255.1 317.2 385.2 488.1 592.350–59 years . . . . . . . . . . . . 830 200.5 165.2 8.466 20.0 34.0 54.0 66.1 94.1 156.1 258.2 353.2 410.4 489.4 632.860–69 years . . . . . . . . . . . . 1,135 208.1 182.5 8.000 18.0 28.0 49.0 62.0 86.1 161.2 270.2 365.2 436.2 557.9 695.170 years and over . . . . . . . . 1,464 187.0 185.0 7.137 17.0 28.0 41.1 50.1 73.0 138.0 238.2 320.3 400.5 536.0 649.4
Non-Hispanic white
1 year and over . . . . . . . . . . . 4,526 142.2 136.4 3.014 14.0 18.0 25.0 31.0 50.0 106.1 187.0 251.2 302.1 395.3 488.31–2 years . . . . . . . . . . . . . 301 23.7 18.3 1.220 * 6.0 8.0 10.0 13.0 20.0 28.0 36.0 41.0 47.0 *3–5 years . . . . . . . . . . . . . 324 29.7 19.0 1.221 * 12.0 14.0 15.0 18.0 24.0 33.0 44.0 56.0 69.1 *6–8 years . . . . . . . . . . . . . 192 33.1 19.2 1.603 * * 16.0 17.0 19.0 29.0 39.0 46.0 54.0 * *9–11 years . . . . . . . . . . . . . 199 37.1 17.5 1.436 * * 18.0 21.0 25.0 33.1 48.0 55.0 57.1 * *12–14 years . . . . . . . . . . . . 138 39.8 26.5 2.610 * * 19.0 21.0 24.0 31.0 49.0 61.0 70.0 * *15–19 years . . . . . . . . . . . . 204 66.1 42.7 3.464 * * 27.0 28.0 35.0 59.0 80.0 101.1 114.0 * *20–29 years . . . . . . . . . . . . 381 130.2 77.9 4.617 * 41.0 52.0 60.0 77.0 111.1 172.2 197.0 231.1 264.4 *30–39 years . . . . . . . . . . . . 439 173.7 125.2 6.917 * 48.0 66.1 77.1 95.1 146.0 218.1 272.3 319.2 357.2 *40–49 years . . . . . . . . . . . . 421 188.0 141.2 7.967 * 28.0 50.0 73.1 99.1 151.2 236.2 304.2 362.4 466.2 *50–59 years . . . . . . . . . . . . 411 193.9 156.1 8.915 * 34.0 51.0 64.0 91.0 154.2 252.2 349.4 386.4 471.3 *60–69 years . . . . . . . . . . . . 497 206.8 179.8 9.339 * 29.0 49.0 62.0 87.1 161.2 267.2 365.0 426.3 532.9 *70 years and over . . . . . . . . 1,019 182.4 179.5 6.509 * 28.0 41.0 50.0 73.0 135.2 237.1 308.5 388.2 499.2 *
Non-Hispanic black
1 year and over . . . . . . . . . . . 3,584 152.0 163.8 4.004 15.0 19.0 25.0 30.0 43.1 98.1 200.2 273.0 343.3 468.2 603.21–2 years . . . . . . . . . . . . . 269 25.8 17.1 1.149 * 5.0 7.0 10.0 14.0 23.0 31.0 42.0 50.0 62.0 *3–5 years . . . . . . . . . . . . . 415 35.0 19.9 1.074 * 12.0 16.0 19.0 22.0 31.0 41.1 49.0 56.0 74.0 *6–8 years . . . . . . . . . . . . . 223 43.1 46.3 3.408 * * 19.0 21.0 24.0 33.1 47.0 60.0 77.0 * *9–11 years . . . . . . . . . . . . . 262 46.1 25.2 1.710 * 18.0 22.0 25.0 29.0 40.0 56.1 66.1 76.1 89.0 *12–14 years . . . . . . . . . . . . 183 46.8 48.3 3.928 * * 18.0 19.0 26.0 37.0 57.1 70.1 80.1 * *15–19 years . . . . . . . . . . . . 297 72.7 54.8 3.500 * 20.0 25.0 29.0 39.0 59.0 90.1 112.1 135.2 161.1 *20–29 years . . . . . . . . . . . . 461 145.8 92.4 4.734 * 43.0 54.0 65.1 84.0 123.1 190.0 235.2 256.2 302.4 *30–39 years . . . . . . . . . . . . 453 213.3 152.0 7.857 * 45.0 62.1 82.0 108.1 174.1 280.1 359.0 415.3 534.3 *40–49 years . . . . . . . . . . . . 333 259.3 224.3 13.523 * 50.0 69.1 82.1 122.1 198.0 316.4 418.2 523.8 686.4 *50–59 years . . . . . . . . . . . . 205 252.1 191.1 14.685 * * 67.0 88.0 130.0 201.0 340.5 423.0 489.5 * *60–69 years . . . . . . . . . . . . 268 236.5 196.0 13.171 * 22.0 51.0 71.0 101.0 180.2 317.4 406.2 485.3 612.1 *70 years and over . . . . . . . . 215 256.3 246.9 18.524 * * 51.1 67.1 96.1 183.2 310.3 446.2 660.1 * *
Mexican American
1 year and over . . . . . . . . . . . 3,954 116.3 129.6 2.640 10.0 14.0 19.0 24.0 34.0 80.0 156.2 211.1 253.2 332.1 436.51–2 years . . . . . . . . . . . . . 291 21.8 19.9 1.502 * * 3.0 7.0 10.0 17.0 27.0 33.0 42.0 * *3–5 years . . . . . . . . . . . . . 472 29.0 20.5 1.215 * 8.0 12.0 14.0 17.0 25.0 35.0 45.0 48.0 63.0 *6–8 years . . . . . . . . . . . . . 251 32.3 19.4 1.575 * * 14.0 15.0 20.0 28.0 38.1 45.0 55.0 * *9–11 years . . . . . . . . . . . . . 267 36.6 21.7 1.710 * * 18.0 19.0 22.0 30.0 43.0 52.1 68.1 * *12–14 years . . . . . . . . . . . . 190 34.8 23.7 2.216 * * 14.0 15.0 19.0 28.0 44.0 53.0 60.0 * *15–19 years . . . . . . . . . . . . 307 59.9 40.2 2.958 * 17.0 20.0 24.0 31.0 50.0 78.0 98.1 111.0 136.1 *20–29 years . . . . . . . . . . . . 645 127.8 84.7 4.295 * 37.1 45.0 55.1 70.1 108.0 165.0 203.1 235.1 282.4 *30–39 years . . . . . . . . . . . . 449 186.5 148.5 9.031 * 42.0 57.1 72.1 96.1 153.1 224.2 306.2 342.1 447.3 *40–49 years . . . . . . . . . . . . 370 188.0 139.3 9.330 * 33.0 53.1 67.1 93.0 156.1 244.2 302.1 374.2 453.1 *50–59 years . . . . . . . . . . . . 175 196.5 229.7 22.374 * * 43.1 63.1 82.1 155.1 235.1 309.1 391.1 * *60–69 years . . . . . . . . . . . . 337 194.0 214.9 15.082 * 28.0 39.0 53.0 79.0 137.1 245.1 300.0 392.3 453.5 *70 years and over . . . . . . . . 200 153.1 144.5 13.162 * * 26.0 33.0 48.0 103.1 206.1 280.3 358.1 * *
* Does not meet standards for reliability or precision.1Includes all other race/ethnic groups not listed separately.
Series 11, No. 247 [ Page 137

Table 105. Serum ferritin in nanogram per milliliter for females 1 year and over, number of examined persons, mean, standard deviation,standard error of the mean, and selected percentiles, by race/ethnicity and age: United States, 1988–94
Race/ethnicity and age
Number ofexaminedpersons Mean
Standarddeviation
Standarderror ofmean
Percentile
2.5th 5th 10th 15th 25th 50th 75th 85th 90th 95th 97.5th
All race/ethnic groups1
1 year and over . . . . . . . . . . . 13,790 71.1 101.8 1.640 6.0 8.0 13.0 17.0 23.0 42.0 82.0 116.1 156.1 227.2 302.21–2 years . . . . . . . . . . . . . 885 27.9 27.9 1.380 3.0 6.0 9.0 11.0 16.0 23.0 34.0 40.0 47.1 62.0 81.13–5 years . . . . . . . . . . . . . 1,355 34.0 38.7 1.547 10.0 11.0 15.0 17.0 21.0 30.0 40.0 49.0 56.0 69.0 82.16–8 years . . . . . . . . . . . . . 678 36.7 19.8 1.120 12.0 14.0 17.0 19.0 23.0 31.0 47.0 56.0 65.1 74.0 84.09–11 years . . . . . . . . . . . . . 737 36.5 22.1 1.196 10.0 14.0 15.0 18.0 23.0 31.0 44.1 56.1 63.0 76.0 85.012–14 years . . . . . . . . . . . . 622 43.2 103.1 6.073 6.0 9.0 11.0 15.0 19.0 31.0 42.0 52.0 60.0 73.0 95.115–19 years . . . . . . . . . . . . 950 33.7 25.0 1.194 3.0 6.0 9.0 12.0 17.0 27.0 43.0 54.1 66.1 89.0 100.120–29 years . . . . . . . . . . . . 1,763 45.9 41.8 1.465 4.0 7.0 11.0 15.0 21.0 35.0 57.0 77.1 91.1 114.0 145.230–39 years . . . . . . . . . . . . 1,758 56.3 77.0 2.699 3.0 6.0 10.0 14.0 21.0 42.0 69.1 88.0 107.1 161.0 198.240–49 years . . . . . . . . . . . . 1,307 71.9 107.8 4.383 4.0 6.0 9.0 11.0 18.0 38.0 86.0 117.1 161.0 238.2 354.450–59 years . . . . . . . . . . . . 963 108.6 101.5 4.809 10.0 14.0 21.0 27.0 41.0 82.1 139.2 192.1 233.0 296.0 381.260–69 years . . . . . . . . . . . . 1,116 137.6 149.4 6.574 16.0 22.0 30.0 38.1 51.1 96.0 176.1 234.2 270.4 363.3 471.470 years and over . . . . . . . . 1,656 133.6 163.3 5.898 14.0 18.0 27.0 35.0 52.0 95.1 160.0 213.2 260.2 364.1 481.5
Non-Hispanic white
1 year and over . . . . . . . . . . . 5,064 72.0 96.4 2.015 6.0 9.0 14.0 18.0 24.0 44.0 84.0 118.0 157.2 227.2 294.41–2 years . . . . . . . . . . . . . 276 27.6 19.6 1.337 * 8.0 9.0 12.0 16.0 23.0 34.0 40.0 48.0 64.0 *3–5 years . . . . . . . . . . . . . 342 32.2 15.7 0.962 * 13.0 16.0 17.0 21.0 29.0 39.1 48.0 54.0 66.1 *6–8 years . . . . . . . . . . . . . 179 35.2 18.6 1.572 * * 17.0 19.0 22.0 29.0 47.0 53.1 65.0 * *9–11 years . . . . . . . . . . . . . 190 35.6 18.8 1.546 * * 16.0 18.0 23.0 31.0 44.0 56.0 62.0 * *12–14 years . . . . . . . . . . . . 155 48.1 126.7 11.515 * * 13.0 16.0 20.0 32.0 42.0 52.0 58.1 * *15–19 years . . . . . . . . . . . . 270 34.4 23.5 1.619 * 7.0 11.0 14.0 18.0 28.0 45.1 54.1 66.0 83.1 *20–29 years . . . . . . . . . . . . 480 45.1 35.8 1.848 * 8.0 13.0 16.0 22.0 37.0 57.0 74.1 90.1 105.1 *30–39 years . . . . . . . . . . . . 571 55.4 58.3 2.758 * 7.0 12.0 16.0 24.0 43.0 69.0 83.1 99.1 142.0 *40–49 years . . . . . . . . . . . . 464 70.9 100.5 5.276 * 7.0 10.0 12.0 20.0 39.0 84.1 114.0 152.2 240.1 *50–59 years . . . . . . . . . . . . 465 99.7 89.3 4.687 * 14.0 20.0 25.0 39.0 79.1 129.0 182.2 216.2 261.1 *60–69 years . . . . . . . . . . . . 481 130.3 125.7 6.482 * 21.0 30.0 37.0 51.0 91.1 175.0 232.0 254.2 358.1 *70 years and over . . . . . . . . 1,191 129.1 157.2 5.154 * 18.0 27.0 35.0 51.0 92.1 157.1 205.2 250.1 341.0 *
Non-Hispanic black
1 year and over . . . . . . . . . . . 4,099 81.5 134.3 3.068 4.0 8.0 12.0 16.0 23.0 43.0 93.1 138.1 177.0 271.4 378.41–2 years . . . . . . . . . . . . . 269 32.1 32.3 2.201 * 7.0 11.0 13.0 18.0 25.0 36.0 46.0 55.0 82.0 *3–5 years . . . . . . . . . . . . . 438 44.7 85.9 4.591 * 13.0 16.0 20.0 24.0 33.0 48.0 58.0 75.1 107.1 *6–8 years . . . . . . . . . . . . . 219 47.8 23.9 1.805 * * 21.0 25.0 31.0 43.0 62.0 71.0 77.0 * *9–11 years . . . . . . . . . . . . . 246 44.3 33.5 2.390 * 14.0 18.0 20.0 24.0 37.0 55.0 68.1 75.0 92.0 *12–14 years . . . . . . . . . . . . 222 40.5 30.0 2.255 * * 14.0 17.0 22.0 33.0 50.0 62.0 70.1 * *15–19 years . . . . . . . . . . . . 329 35.5 31.5 1.942 * 4.0 8.0 9.0 14.0 26.0 46.0 62.0 72.0 100.1 *20–29 years . . . . . . . . . . . . 579 49.8 62.0 2.880 * 6.0 8.0 12.0 17.0 33.0 61.0 84.0 108.0 143.1 *30–39 years . . . . . . . . . . . . 601 75.8 151.6 6.915 * 6.0 10.0 15.0 22.0 44.0 88.1 120.1 151.1 211.0 *40–49 years . . . . . . . . . . . . 424 81.0 112.7 6.118 * 6.0 8.0 11.0 18.0 43.0 108.1 146.2 193.2 238.2 *50–59 years . . . . . . . . . . . . 257 173.4 147.3 10.275 * 21.0 39.0 51.0 66.1 130.1 232.1 305.0 385.3 511.4 *60–69 years . . . . . . . . . . . . 271 189.5 255.9 17.379 * 34.0 48.0 57.0 83.1 136.2 204.2 300.4 387.4 478.4 *70 years and over . . . . . . . . 244 184.5 206.8 14.798 * 28.0 36.0 48.0 71.0 129.0 220.1 289.2 344.3 469.4 *
Mexican American
1 year and over . . . . . . . . . . . 4,022 48.0 62.0 1.253 3.0 5.0 9.0 12.0 17.0 30.0 55.0 81.1 104.0 154.1 200.21–2 years . . . . . . . . . . . . . 301 25.6 55.5 3.618 * 3.0 3.0 6.0 11.0 19.0 33.0 39.0 43.0 61.0 *3–5 years . . . . . . . . . . . . . 511 30.4 18.5 0.927 * 9.0 11.0 14.0 19.0 26.0 38.0 46.0 55.0 65.0 *6–8 years . . . . . . . . . . . . . 257 31.3 16.8 1.189 * * 13.0 15.0 18.0 29.0 39.0 46.1 56.0 * *9–11 years . . . . . . . . . . . . . 270 35.6 20.2 1.390 * * 16.0 19.0 22.0 31.0 45.0 53.1 62.0 * *12–14 years . . . . . . . . . . . . 216 29.0 22.5 1.730 * * 11.0 11.0 15.0 24.0 36.0 43.0 54.0 * *15–19 years . . . . . . . . . . . . 294 27.1 24.4 1.609 * 3.0 6.0 8.0 13.0 22.0 34.0 43.0 48.0 68.1 *20–29 years . . . . . . . . . . . . 632 41.2 44.5 2.003 * 3.0 7.0 10.0 15.0 29.0 52.1 71.1 84.0 111.1 *30–39 years . . . . . . . . . . . . 508 45.3 54.9 2.758 * 3.0 8.0 11.0 16.0 31.0 58.0 80.0 91.1 119.1 *40–49 years . . . . . . . . . . . . 355 57.0 65.7 3.943 * 3.0 6.0 9.0 15.0 32.0 77.0 112.1 136.1 176.1 *50–59 years . . . . . . . . . . . . 186 104.1 84.3 6.997 * * 20.0 24.0 37.0 93.0 146.0 186.1 203.1 * *60–69 years . . . . . . . . . . . . 320 122.0 134.5 8.507 * 16.0 27.0 34.1 50.0 92.1 158.0 198.1 243.2 291.2 *70 years and over . . . . . . . . 172 110.1 107.7 9.288 * * 23.0 28.0 38.1 77.1 138.2 207.0 230.2 * *
* Does not meet standards for reliability or precision.1Includes all other race/ethnic groups not listed separately.
Page 138 [ Series 11, No. 247

Table 106. Percent distribution of serum iron in microgram per deciliter for persons 1 year and over, by race/ethnicity and age:United States, 1988–94
Race/ethnicity andselected serum
iron cutoffs1 year
and over1–2
years3–5
years6–8
years9–11years
12–14years
15–19years
20–29years
30–39years
40–49years
50–59years
60–69years
70 yearsand over
All race/ethnic groups1
Total . . . . . . . . . . . . . . . . . . 100.0 100.0 100.0 100.0 100.0 100.0 100.0 100.0 100.0 100.0 100.0 100.0 100.0
Less than 20 . . . . . . . . . . . . . 0.9 5.0 2.0 1.1 0.6 0.3 0.4 0.9 0.9 0.8 0.4 0.6 0.720–29 . . . . . . . . . . . . . . . . . 2.0 8.0 4.5 2.7 2.2 2.6 1.0 1.6 1.9 2.1 1.5 0.9 1.630–39 . . . . . . . . . . . . . . . . . 3.8 9.8 7.2 4.8 4.7 4.1 4.9 3.0 4.0 2.7 2.5 3.2 3.340–49 . . . . . . . . . . . . . . . . . 6.0 9.6 7.6 8.1 7.0 6.2 5.8 4.7 5.0 6.0 6.4 5.9 7.050–59 . . . . . . . . . . . . . . . . . 8.8 11.3 11.4 10.1 11.5 8.4 7.0 6.2 8.2 8.6 9.5 9.8 10.960–69 . . . . . . . . . . . . . . . . . 10.6 11.0 12.2 13.3 10.3 11.8 9.8 9.8 8.1 10.5 11.3 12.2 14.270–79 . . . . . . . . . . . . . . . . . 11.9 10.3 12.9 15.1 13.9 11.4 11.1 9.3 9.7 14.7 12.3 13.4 13.380–89 . . . . . . . . . . . . . . . . . 11.2 9.2 11.5 11.4 11.9 12.7 10.6 9.6 10.8 11.1 11.9 12.4 12.290–99 . . . . . . . . . . . . . . . . . 10.2 10.1 10.3 10.9 10.6 9.0 9.1 9.5 9.2 10.6 11.3 11.7 10.7100–119 . . . . . . . . . . . . . . . . 16.1 8.3 11.9 13.4 15.6 14.9 15.6 16.8 19.7 16.1 15.9 15.8 14.0120–139 . . . . . . . . . . . . . . . . 9.3 4.9 5.6 6.4 6.7 8.4 11.0 12.5 10.3 8.2 11.3 8.6 6.5140–159 . . . . . . . . . . . . . . . . 4.5 1.8 2.1 1.4 3.0 4.8 5.6 7.0 5.5 4.8 3.2 3.3 3.3160–179 . . . . . . . . . . . . . . . . 2.6 0.2 0.7 0.7 1.0 2.5 3.8 5.0 4.0 2.0 1.0 1.0 1.7180 and more . . . . . . . . . . . . 2.2 0.5 0.0 0.6 1.1 2.9 4.3 4.1 2.5 1.8 1.5 1.2 0.6
Non-Hispanic white
Total . . . . . . . . . . . . . . . . . . 100.0 100.0 100.0 100.0 100.0 100.0 100.0 100.0 100.0 100.0 100.0 100.0 100.0
Less than 20 . . . . . . . . . . . . . 0.8 5.1 1.9 1.2 0.6 0.0 0.3 1.0 0.9 0.4 0.3 0.6 0.620–29 . . . . . . . . . . . . . . . . . 1.7 7.9 4.0 2.8 2.3 2.7 0.6 1.2 1.7 1.7 1.5 0.7 1.530–39 . . . . . . . . . . . . . . . . . 3.3 9.0 6.5 4.8 4.5 4.3 4.7 2.6 3.2 2.3 2.4 3.1 3.140–49 . . . . . . . . . . . . . . . . . 5.6 8.8 7.8 9.0 7.3 4.9 5.6 4.5 3.8 5.7 5.9 5.5 6.850–59 . . . . . . . . . . . . . . . . . 8.6 12.1 11.5 10.0 11.8 7.6 6.9 6.2 8.0 8.1 9.2 10.0 10.360–69 . . . . . . . . . . . . . . . . . 10.3 9.0 10.6 12.8 8.9 11.8 8.2 9.5 7.7 10.7 10.5 11.7 14.270–79 . . . . . . . . . . . . . . . . . 11.9 10.6 12.9 14.9 13.3 12.5 11.8 8.1 9.7 15.0 12.7 12.9 13.280–89 . . . . . . . . . . . . . . . . . 11.1 9.8 11.4 8.9 10.2 12.4 9.2 9.5 11.2 11.7 11.9 12.8 12.390–99 . . . . . . . . . . . . . . . . . 10.3 10.6 11.2 12.4 11.2 8.7 9.7 9.1 9.5 10.5 11.1 11.6 10.9100–119 . . . . . . . . . . . . . . . . 16.8 8.3 12.8 12.9 16.7 14.8 15.7 17.1 21.2 17.0 16.5 16.6 14.5120–139 . . . . . . . . . . . . . . . . 9.7 5.8 6.1 7.1 7.2 8.7 11.1 13.2 10.5 8.4 11.9 9.1 6.7140–159 . . . . . . . . . . . . . . . . 4.9 2.1 2.5 1.8 3.4 5.0 6.3 7.7 5.9 5.1 3.6 3.0 3.4160–179 . . . . . . . . . . . . . . . . 2.8 0.3 0.7 0.8 1.1 3.3 4.4 5.5 4.1 1.9 1.0 1.1 1.9180 and more . . . . . . . . . . . . 2.4 0.6 0.0 0.5 1.5 3.0 5.4 4.9 2.7 1.7 1.4 1.3 0.6
Non-Hispanic black
Total . . . . . . . . . . . . . . . . . . 100.0 100.0 100.0 100.0 100.0 100.0 100.0 100.0 100.0 100.0 100.0 100.0 100.0
Less than 20 . . . . . . . . . . . . . 1.3 4.6 2.3 1.1 1.2 1.9 1.1 0.9 0.9 2.1 0.7 0.4 1.620–29 . . . . . . . . . . . . . . . . . 3.3 7.1 5.1 3.0 2.0 2.9 2.3 3.5 2.8 3.7 2.5 2.3 4.130–39 . . . . . . . . . . . . . . . . . 5.7 13.3 7.1 4.7 5.7 3.1 5.6 6.4 5.0 4.6 5.3 5.2 5.940–49 . . . . . . . . . . . . . . . . . 8.3 10.4 8.4 8.7 6.7 10.1 8.3 5.7 8.6 8.0 9.6 10.2 9.950–59 . . . . . . . . . . . . . . . . . 10.6 10.9 11.2 8.8 12.2 11.2 8.7 9.3 9.3 11.1 14.6 9.6 15.460–69 . . . . . . . . . . . . . . . . . 12.8 13.2 16.7 13.5 13.0 13.4 11.6 10.7 10.2 14.3 15.3 15.0 16.070–79 . . . . . . . . . . . . . . . . . 13.2 10.3 13.0 15.9 17.4 11.7 11.1 11.2 13.1 14.4 12.5 17.4 14.580–89 . . . . . . . . . . . . . . . . . 11.6 8.0 11.3 16.3 14.5 11.4 12.3 9.4 11.5 11.0 10.9 14.8 12.790–99 . . . . . . . . . . . . . . . . . 9.0 8.5 7.8 10.0 8.2 9.6 7.4 10.1 9.7 8.6 7.8 10.8 7.6100–119 . . . . . . . . . . . . . . . . 12.2 9.4 9.8 11.7 11.6 13.5 14.6 13.6 14.5 11.5 11.9 8.8 5.9120–139 . . . . . . . . . . . . . . . . 6.5 2.6 5.0 4.7 5.6 7.1 9.4 10.1 6.8 4.8 5.3 3.6 4.4140–159 . . . . . . . . . . . . . . . . 2.8 0.9 1.9 0.4 1.5 3.3 4.4 5.4 3.3 2.1 1.6 0.9 1.6160–179 . . . . . . . . . . . . . . . . 1.3 0.3 0.4 0.6 0.3 0.0 1.8 1.7 2.3 1.8 1.3 0.5 0.1180 and more . . . . . . . . . . . . 1.3 0.4 0.0 0.7 0.2 0.8 1.5 1.9 2.0 1.9 0.9 0.4 0.3
Mexican American
Total . . . . . . . . . . . . . . . . . . 100.0 100.0 100.0 100.0 100.0 100.0 100.0 100.0 100.0 100.0 100.0 100.0 100.0
Less than 20 . . . . . . . . . . . . . 1.7 7.3 2.5 1.0 0.6 0.4 0.8 0.8 1.7 3.5 1.6 0.8 2.020–29 . . . . . . . . . . . . . . . . . 2.4 7.9 5.1 3.2 2.0 2.8 1.7 1.1 2.3 3.0 0.2 0.9 1.030–39 . . . . . . . . . . . . . . . . . 4.8 11.7 7.0 8.2 7.4 4.8 5.4 3.1 3.4 4.3 3.9 1.9 3.540–49 . . . . . . . . . . . . . . . . . 6.6 13.1 9.7 5.8 7.0 7.1 4.8 5.5 5.7 5.7 7.7 7.3 9.050–59 . . . . . . . . . . . . . . . . . 8.3 10.1 10.3 9.8 9.1 9.1 7.3 6.2 8.2 8.5 8.8 9.6 13.160–69 . . . . . . . . . . . . . . . . . 11.1 11.8 12.7 11.7 14.0 12.5 10.9 10.1 9.1 9.9 14.7 13.8 11.3
See footnotes at end of table.
Series 11, No. 247 [ Page 139
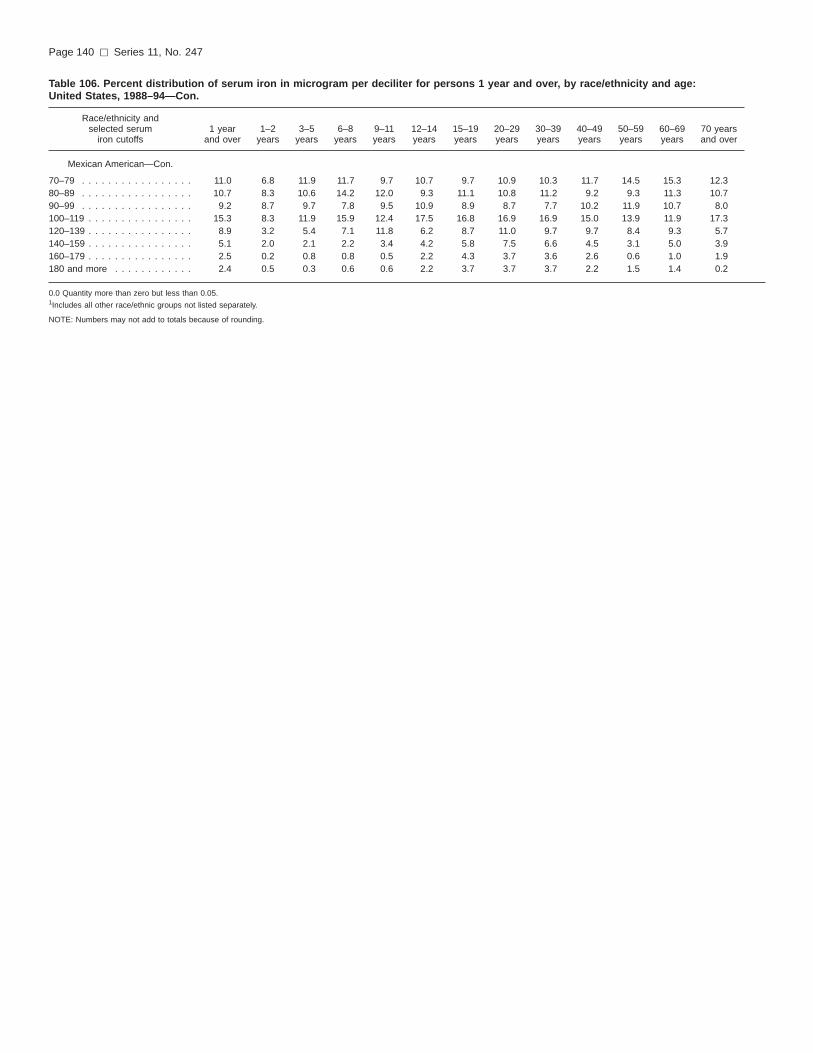
Table 106. Percent distribution of serum iron in microgram per deciliter for persons 1 year and over, by race/ethnicity and age:United States, 1988–94—Con.
Race/ethnicity andselected serum
iron cutoffs1 year
and over1–2
years3–5
years6–8
years9–11years
12–14years
15–19years
20–29years
30–39years
40–49years
50–59years
60–69years
70 yearsand over
Mexican American—Con.
70–79 . . . . . . . . . . . . . . . . . 11.0 6.8 11.9 11.7 9.7 10.7 9.7 10.9 10.3 11.7 14.5 15.3 12.380–89 . . . . . . . . . . . . . . . . . 10.7 8.3 10.6 14.2 12.0 9.3 11.1 10.8 11.2 9.2 9.3 11.3 10.790–99 . . . . . . . . . . . . . . . . . 9.2 8.7 9.7 7.8 9.5 10.9 8.9 8.7 7.7 10.2 11.9 10.7 8.0100–119 . . . . . . . . . . . . . . . . 15.3 8.3 11.9 15.9 12.4 17.5 16.8 16.9 16.9 15.0 13.9 11.9 17.3120–139 . . . . . . . . . . . . . . . . 8.9 3.2 5.4 7.1 11.8 6.2 8.7 11.0 9.7 9.7 8.4 9.3 5.7140–159 . . . . . . . . . . . . . . . . 5.1 2.0 2.1 2.2 3.4 4.2 5.8 7.5 6.6 4.5 3.1 5.0 3.9160–179 . . . . . . . . . . . . . . . . 2.5 0.2 0.8 0.8 0.5 2.2 4.3 3.7 3.6 2.6 0.6 1.0 1.9180 and more . . . . . . . . . . . . 2.4 0.5 0.3 0.6 0.6 2.2 3.7 3.7 3.7 2.2 1.5 1.4 0.2
0.0 Quantity more than zero but less than 0.05.1Includes all other race/ethnic groups not listed separately.
NOTE: Numbers may not add to totals because of rounding.
Page 140 [ Series 11, No. 247

Table 107. Percent distribution of serum iron in microgram per deciliter for males 1 year and over, by race/ethnicity and age:United States, 1988–94
Race/ethnicity andselected serum
iron cutoffs1 year
and over1–2
years3–5
years6–8
years9–11years
12–14years
15–19years
20–29years
30–39years
40–49years
50–59years
60–69years
70 yearsand over
All race/ethnic groups1
Total . . . . . . . . . . . . . . . . . . 100.0 100.0 100.0 100.0 100.0 100.0 100.0 100.0 100.0 100.0 100.0 100.0 100.0
Less than 20 . . . . . . . . . . . . . 0.5 4.8 2.0 1.4 0.5 0.1 0.0 0.7 0.1 0.1 0.4 0.3 0.620–29 . . . . . . . . . . . . . . . . . 1.3 8.4 4.4 2.8 2.1 2.3 0.5 0.5 0.6 0.3 0.9 0.9 1.830–39 . . . . . . . . . . . . . . . . . 2.4 10.3 7.6 3.0 3.0 4.1 2.4 1.5 1.5 0.8 1.3 2.6 3.240–49 . . . . . . . . . . . . . . . . . 3.9 9.4 8.0 9.0 8.5 3.9 3.7 2.7 1.5 2.5 4.1 3.3 5.150–59 . . . . . . . . . . . . . . . . . 7.4 10.4 11.7 8.3 13.6 8.3 6.3 4.7 6.1 6.9 7.8 7.6 10.060–69 . . . . . . . . . . . . . . . . . 10.3 11.2 11.5 16.4 10.9 13.3 8.4 9.7 7.8 10.3 11.7 9.4 11.370–79 . . . . . . . . . . . . . . . . . 11.5 11.7 12.3 16.2 11.9 12.8 10.3 9.4 10.4 14.6 9.4 12.3 11.580–89 . . . . . . . . . . . . . . . . . 11.2 8.5 12.7 9.0 12.2 11.8 12.6 8.7 11.4 11.7 11.8 12.7 11.890–99 . . . . . . . . . . . . . . . . . 10.5 9.3 8.9 8.7 8.7 9.4 8.2 10.6 10.0 11.6 10.8 14.0 11.9100–119 . . . . . . . . . . . . . . . . 18.6 8.9 11.8 15.0 19.2 12.5 15.8 18.6 23.8 21.4 18.5 18.6 16.0120–139 . . . . . . . . . . . . . . . . 11.5 4.5 5.5 6.7 4.3 10.2 15.0 14.6 13.3 10.1 16.3 10.2 8.6140–159 . . . . . . . . . . . . . . . . 5.2 2.2 2.6 2.1 3.4 4.8 6.1 8.0 5.4 5.2 4.2 4.8 4.9160–179 . . . . . . . . . . . . . . . . 3.4 0.2 0.9 0.9 0.4 3.2 5.1 6.2 5.8 2.2 1.5 1.7 2.4180 and more . . . . . . . . . . . . 2.4 0.2 0.0 0.6 1.3 3.3 5.6 4.0 2.4 2.2 1.6 1.5 0.9
Non-Hispanic white
Total . . . . . . . . . . . . . . . . . . 100.0 100.0 100.0 100.0 100.0 100.0 100.0 100.0 100.0 100.0 100.0 100.0 100.0
Less than 20 . . . . . . . . . . . . . 0.5 4.3 2.0 1.5 0.3 0.0 0.0 1.0 0.0 0.1 0.4 0.3 0.620–29 . . . . . . . . . . . . . . . . . 1.2 7.8 3.4 2.8 2.9 2.5 0.4 0.4 0.5 0.2 1.0 0.7 1.930–39 . . . . . . . . . . . . . . . . . 2.1 9.0 6.6 2.5 2.2 3.8 3.1 1.0 1.6 0.5 0.9 2.3 3.140–49 . . . . . . . . . . . . . . . . . 3.6 7.7 9.0 10.0 8.9 3.5 4.3 2.6 0.9 2.5 3.6 3.1 4.850–59 . . . . . . . . . . . . . . . . . 7.4 10.5 11.6 7.5 14.7 7.0 7.0 4.4 6.3 7.1 8.0 8.0 9.660–69 . . . . . . . . . . . . . . . . . 9.9 9.9 9.9 16.3 9.4 13.8 7.1 10.0 7.5 10.4 10.6 8.8 11.370–79 . . . . . . . . . . . . . . . . . 11.5 12.8 12.2 16.4 12.3 14.1 11.5 7.3 10.3 15.4 10.0 11.8 11.080–89 . . . . . . . . . . . . . . . . . 11.0 9.1 13.1 7.3 9.2 10.8 11.7 7.7 12.0 11.6 12.1 12.9 11.990–99 . . . . . . . . . . . . . . . . . 10.6 11.0 9.6 9.4 7.9 9.5 8.1 10.1 10.0 11.9 9.8 14.0 12.2100–119 . . . . . . . . . . . . . . . . 19.2 9.3 12.5 15.3 22.2 11.8 13.1 19.0 25.3 21.8 18.5 19.8 16.6120–139 . . . . . . . . . . . . . . . . 11.8 5.0 6.1 7.1 3.9 10.0 15.2 16.3 12.3 10.1 17.1 10.7 8.6140–159 . . . . . . . . . . . . . . . . 5.3 3.0 3.4 2.7 3.9 4.4 6.4 8.5 5.8 4.8 4.7 3.9 4.9160–179 . . . . . . . . . . . . . . . . 3.6 0.3 0.7 1.2 0.5 4.5 5.8 7.1 5.5 1.7 1.5 1.9 2.6180 and more . . . . . . . . . . . . 2.5 0.3 0.0 0.2 1.7 4.2 6.5 4.7 2.0 2.0 1.7 1.7 0.9
Non-Hispanic black
Total . . . . . . . . . . . . . . . . . . 100.0 100.0 100.0 100.0 100.0 100.0 100.0 100.0 100.0 100.0 100.0 100.0 100.0
Less than 20 . . . . . . . . . . . . . 0.7 5.0 2.7 1.6 1.2 1.1 0.0 0.0 0.2 0.0 0.0 0.8 0.920–29 . . . . . . . . . . . . . . . . . 1.6 7.9 4.9 3.2 0.7 2.6 0.9 0.2 0.8 0.8 1.1 2.4 2.530–39 . . . . . . . . . . . . . . . . . 3.6 14.9 8.9 5.2 4.6 3.1 0.6 3.0 1.4 1.9 4.0 4.3 5.040–49 . . . . . . . . . . . . . . . . . 6.4 12.5 9.0 10.3 9.1 8.8 3.3 4.4 3.4 4.7 8.7 8.0 9.750–59 . . . . . . . . . . . . . . . . . 8.7 13.0 11.5 7.0 14.5 9.8 7.3 7.2 6.0 6.8 11.7 7.9 14.360–69 . . . . . . . . . . . . . . . . . 12.6 13.8 15.6 13.5 12.3 15.1 12.5 9.2 10.9 13.9 16.1 14.2 13.070–79 . . . . . . . . . . . . . . . . . 12.8 9.5 12.5 18.7 15.2 10.5 11.0 11.9 13.1 11.8 9.6 16.1 17.880–89 . . . . . . . . . . . . . . . . . 12.9 5.9 10.0 14.7 16.1 11.8 14.2 11.0 13.4 16.1 9.5 17.1 12.090–99 . . . . . . . . . . . . . . . . . 10.3 8.4 8.9 6.9 6.4 6.4 10.0 12.4 12.2 10.4 11.2 11.4 9.7100–119 . . . . . . . . . . . . . . . . 14.8 6.3 9.1 12.2 13.9 15.6 19.2 17.2 18.0 16.5 14.4 8.5 5.4120–139 . . . . . . . . . . . . . . . . 8.4 2.2 5.1 4.9 4.4 10.5 12.4 13.0 8.8 6.2 8.0 6.0 7.4140–159 . . . . . . . . . . . . . . . . 3.5 0.8 1.4 0.3 1.1 4.0 4.1 6.2 5.0 3.2 2.6 1.7 1.1160–179 . . . . . . . . . . . . . . . . 1.8 0.0 0.5 0.3 0.0 0.0 2.1 2.0 3.3 3.9 1.9 0.6 0.3180 and more . . . . . . . . . . . . 2.0 0.0 0.0 1.2 0.4 0.7 2.5 2.3 3.4 3.7 1.4 1.0 0.8
Mexican American
Total . . . . . . . . . . . . . . . . . . 100.0 100.0 100.0 100.0 100.0 100.0 100.0 100.0 100.0 100.0 100.0 100.0 100.0
Less than 20 . . . . . . . . . . . . . 1.0 7.8 3.0 0.6 0.6 0.0 0.0 0.4 0.7 0.3 1.3 0.6 2.320–29 . . . . . . . . . . . . . . . . . 1.5 8.1 5.7 3.5 1.7 1.5 0.6 0.4 1.0 0.4 0.5 0.8 0.730–39 . . . . . . . . . . . . . . . . . 3.5 10.4 7.1 6.8 5.7 5.9 2.9 1.9 0.7 2.3 5.1 0.9 3.440–49 . . . . . . . . . . . . . . . . . 4.0 15.4 8.2 6.4 7.5 2.4 1.6 1.8 1.8 2.7 7.2 3.1 7.450–59 . . . . . . . . . . . . . . . . . 7.0 8.4 10.6 11.5 10.1 8.7 5.3 4.0 7.0 6.9 3.2 9.7 13.660–69 . . . . . . . . . . . . . . . . . 10.2 13.9 11.2 12.9 9.9 14.6 10.7 8.8 8.3 8.8 12.9 12.2 9.770–79 . . . . . . . . . . . . . . . . . 11.0 8.5 13.9 10.5 8.7 14.0 10.2 10.2 10.2 12.2 11.9 15.4 9.6
See footnotes at end of table.
Series 11, No. 247 [ Page 141

Table 107. Percent distribution of serum iron in microgram per deciliter for males 1 year and over, by race/ethnicity and age:United States, 1988–94—Con.
Race/ethnicity andselected serum
iron cutoffs1 year
and over1–2
years3–5
years6–8
years9–11years
12–14years
15–19years
20–29years
30–39years
40–49years
50–59years
60–69years
70 yearsand over
Mexican American—Con.
80–89 . . . . . . . . . . . . . . . . . 11.2 7.7 10.3 12.5 11.8 9.8 10.8 11.8 12.4 10.2 10.4 13.4 8.790–99 . . . . . . . . . . . . . . . . . 9.6 6.5 10.2 7.7 11.2 10.5 8.8 9.9 8.8 11.7 11.4 8.0 7.0100–119 . . . . . . . . . . . . . . . . 17.4 6.8 11.5 15.5 15.9 16.6 22.4 20.4 17.3 18.5 16.6 11.5 18.5120–139 . . . . . . . . . . . . . . . . 10.3 4.2 4.7 8.0 11.2 7.0 8.3 12.3 12.4 11.8 11.1 11.5 8.6140–159 . . . . . . . . . . . . . . . . 6.3 2.1 1.8 2.5 3.8 5.5 6.9 8.8 7.8 6.2 4.8 8.6 7.8160–179 . . . . . . . . . . . . . . . . 3.3 0.2 1.4 1.4 0.7 1.0 5.1 4.1 5.6 4.2 1.2 1.9 2.2180 and more . . . . . . . . . . . . 3.7 0.0 0.3 0.3 1.0 2.6 6.4 5.2 6.1 3.7 2.3 2.4 0.5
0.0 Quantity more than zero but less than 0.05.1Includes all other race/ethnic groups not listed separately.
NOTE: Numbers may not add to totals because of rounding.
Page 142 [ Series 11, No. 247

Table 108. Percent distribution of serum iron in microgram per deciliter for females 1 year and over, by race/ethnicity and age:United States, 1988–94
Race/ethnicity andselected serum
iron cutoffs1 year
and over1–2
years3–5
years6–8
years9–11years
12–14years
15–19years
20–29years
30–39years
40–49years
50–59years
60–69years
70 yearsand over
All race/ethnic groups1
Total . . . . . . . . . . . . . . . . . . 100.0 100.0 100.0 100.0 100.0 100.0 100.0 100.0 100.0 100.0 100.0 100.0 100.0
Less than 20 . . . . . . . . . . . . . 1.2 5.2 2.1 0.8 0.8 0.5 0.9 1.1 1.8 1.4 0.4 0.8 0.720–29 . . . . . . . . . . . . . . . . . 2.7 7.6 4.7 2.6 2.3 2.8 1.5 2.6 3.3 3.9 2.0 0.8 1.530–39 . . . . . . . . . . . . . . . . . 5.1 9.3 6.7 6.8 6.3 4.1 7.4 4.5 6.4 4.4 3.7 3.7 3.440–49 . . . . . . . . . . . . . . . . . 8.0 9.9 7.2 7.0 5.4 8.7 7.9 6.6 8.6 9.3 8.5 8.1 8.350–59 . . . . . . . . . . . . . . . . . 10.1 12.3 11.1 12.1 9.4 8.6 7.7 7.8 10.4 10.3 11.2 11.8 11.560–69 . . . . . . . . . . . . . . . . . 11.0 10.7 12.9 9.8 9.6 10.2 11.2 9.8 8.3 10.7 10.9 14.5 16.070–79 . . . . . . . . . . . . . . . . . 12.3 8.8 13.5 14.0 15.8 10.0 12.0 9.2 9.1 14.8 15.1 14.4 14.480–89 . . . . . . . . . . . . . . . . . 11.1 9.9 10.3 14.1 11.6 13.7 8.6 10.5 10.2 10.6 12.1 12.2 12.590–99 . . . . . . . . . . . . . . . . . 9.8 10.9 11.8 13.4 12.5 8.5 10.0 8.4 8.4 9.6 11.8 9.8 9.9100–119 . . . . . . . . . . . . . . . . 13.6 7.7 12.0 11.6 12.1 17.6 15.4 15.0 15.6 11.0 13.5 13.3 12.7120–139 . . . . . . . . . . . . . . . . 7.3 5.3 5.7 6.1 9.0 6.5 7.0 10.5 7.3 6.3 6.6 7.1 5.1140–159 . . . . . . . . . . . . . . . . 3.9 1.2 1.6 0.7 2.6 4.7 5.1 6.1 5.6 4.4 2.2 2.1 2.3160–179 . . . . . . . . . . . . . . . . 1.8 0.3 0.5 0.3 1.7 1.6 2.5 3.8 2.2 1.8 0.6 0.4 1.3180 and more . . . . . . . . . . . . 2.0 0.9 0.0 0.7 0.9 2.5 2.9 4.2 2.7 1.5 1.4 0.9 0.3
Non-Hispanic white
Total . . . . . . . . . . . . . . . . . . 100.0 100.0 100.0 100.0 100.0 100.0 100.0 100.0 100.0 100.0 100.0 100.0 100.0
Less than 20 . . . . . . . . . . . . . 1.0 6.0 1.8 0.8 0.9 0.0 0.7 1.1 1.8 0.6 0.2 0.9 0.620–29 . . . . . . . . . . . . . . . . . 2.3 8.0 4.6 2.8 1.8 3.0 0.9 2.0 2.9 3.2 1.9 0.7 1.230–39 . . . . . . . . . . . . . . . . . 4.6 9.0 6.5 7.7 6.8 4.9 6.4 4.0 4.8 4.0 3.8 3.7 3.140–49 . . . . . . . . . . . . . . . . . 7.4 9.9 6.5 7.9 5.7 6.6 7.0 6.3 6.8 9.1 8.0 7.6 8.150–59 . . . . . . . . . . . . . . . . . 9.7 14.0 11.4 13.1 9.1 8.2 6.9 7.9 9.8 9.1 10.3 11.7 10.860–69 . . . . . . . . . . . . . . . . . 10.6 8.0 11.5 8.7 8.4 9.4 9.4 9.1 7.9 11.0 10.5 14.3 16.070–79 . . . . . . . . . . . . . . . . . 12.3 8.1 13.7 13.1 14.2 10.6 12.0 9.0 9.1 14.5 15.3 13.8 14.780–89 . . . . . . . . . . . . . . . . . 11.3 10.5 9.5 10.9 11.1 14.4 6.6 11.2 10.3 11.8 11.7 12.7 12.690–99 . . . . . . . . . . . . . . . . . 10.1 10.2 12.9 16.0 14.3 7.9 11.3 8.1 8.9 9.1 12.4 9.6 10.0100–119 . . . . . . . . . . . . . . . . 14.4 7.2 13.1 10.1 11.4 18.5 18.4 15.2 17.0 12.0 14.7 13.8 13.1120–139 . . . . . . . . . . . . . . . . 7.7 6.7 6.0 7.2 10.3 7.2 6.8 10.2 8.5 6.6 7.0 7.7 5.4140–159 . . . . . . . . . . . . . . . . 4.4 1.1 1.6 0.7 3.0 5.8 6.3 7.0 6.1 5.3 2.6 2.2 2.4160–179 . . . . . . . . . . . . . . . . 2.0 0.3 0.7 0.3 1.8 2.0 3.1 3.9 2.7 2.2 0.5 0.3 1.4180 and more . . . . . . . . . . . . 2.3 1.0 0.0 0.8 1.3 1.6 4.3 5.1 3.5 1.4 1.1 1.1 0.4
Non-Hispanic black
Total . . . . . . . . . . . . . . . . . . 100.0 100.0 100.0 100.0 100.0 100.0 100.0 100.0 100.0 100.0 100.0 100.0 100.0
Less than 20 . . . . . . . . . . . . . 1.9 4.2 1.9 0.7 1.2 2.6 2.2 1.6 1.5 3.7 1.2 0.2 2.020–29 . . . . . . . . . . . . . . . . . 4.6 6.5 5.3 2.9 3.3 3.2 3.7 6.3 4.5 6.0 3.6 2.3 5.230–39 . . . . . . . . . . . . . . . . . 7.4 11.8 5.2 4.2 6.8 3.1 10.6 9.4 7.9 6.7 6.3 5.9 6.440–49 . . . . . . . . . . . . . . . . . 9.9 8.4 7.7 7.2 4.1 11.2 13.2 6.7 12.8 10.6 10.3 11.9 10.150–59 . . . . . . . . . . . . . . . . . 12.2 8.8 10.9 10.4 9.8 12.4 10.1 11.2 12.0 14.5 16.9 10.8 16.060–69 . . . . . . . . . . . . . . . . . 13.1 12.6 17.9 13.4 13.7 12.0 10.6 12.0 9.7 14.6 14.6 15.6 17.970–79 . . . . . . . . . . . . . . . . . 13.6 11.1 13.5 13.2 19.6 12.6 11.2 10.7 13.0 16.4 14.8 18.3 12.480–89 . . . . . . . . . . . . . . . . . 10.6 10.0 12.6 17.8 12.9 11.0 10.3 8.0 10.1 7.1 12.1 13.1 13.190–99 . . . . . . . . . . . . . . . . . 8.0 8.7 6.8 12.9 10.2 12.3 4.8 8.2 7.7 7.1 5.0 10.4 6.3100–119 . . . . . . . . . . . . . . . . 10.0 12.4 10.6 11.2 9.1 11.7 10.1 10.5 11.7 7.5 9.9 9.1 6.2120–139 . . . . . . . . . . . . . . . . 4.9 3.1 5.0 4.6 6.8 4.3 6.4 7.7 5.2 3.8 3.2 1.9 2.4140–159 . . . . . . . . . . . . . . . . 2.3 1.0 2.4 0.5 2.0 2.7 4.8 4.7 1.8 1.3 0.9 0.3 2.0160–179 . . . . . . . . . . . . . . . . 0.8 0.6 0.4 0.8 0.5 0.0 1.5 1.5 1.4 0.2 0.8 0.4 0.0180 and more . . . . . . . . . . . . 0.7 0.8 0.0 0.3 0.0 0.9 0.5 1.6 0.8 0.6 0.5 0.0 0.0
Mexican American
Total . . . . . . . . . . . . . . . . . . 100.0 100.0 100.0 100.0 100.0 100.0 100.0 100.0 100.0 100.0 100.0 100.0 100.0
Less than 20 . . . . . . . . . . . . . 2.5 6.8 2.1 1.4 0.4 0.8 1.8 1.4 2.9 7.0 2.0 1.0 1.720–29 . . . . . . . . . . . . . . . . . 3.2 7.6 4.5 3.0 2.3 3.9 3.0 2.1 3.8 5.6 0.0 1.0 1.330–39 . . . . . . . . . . . . . . . . . 6.2 13.1 6.8 9.5 9.3 4.0 8.2 4.6 6.2 6.4 2.6 2.7 3.740–49 . . . . . . . . . . . . . . . . . 9.4 10.7 11.2 5.2 6.4 11.2 8.4 10.2 9.9 8.9 8.1 10.6 10.650–59 . . . . . . . . . . . . . . . . . 9.7 11.9 9.9 8.1 8.1 9.4 9.5 8.9 9.4 10.1 14.2 9.5 12.660–69 . . . . . . . . . . . . . . . . . 12.1 9.8 14.2 10.5 18.5 10.7 11.1 11.7 9.9 11.0 16.3 15.0 12.9
See footnotes at end of table.
Series 11, No. 247 [ Page 143

Table 108. Percent distribution of serum iron in microgram per deciliter for females 1 year and over, by race/ethnicity and age:United States, 1988–94—Con.
Race/ethnicity andselected serum
iron cutoffs1 year
and over1–2
years3–5
years6–8
years9–11years
12–14years
15–19years
20–29years
30–39years
40–49years
50–59years
60–69years
70 yearsand over
Mexican American—Con.
70–79 . . . . . . . . . . . . . . . . . 11.1 5.1 9.9 12.8 10.8 8.0 9.1 11.7 10.5 11.3 16.9 15.1 14.980–89 . . . . . . . . . . . . . . . . . 10.2 8.9 11.0 15.9 12.2 8.9 11.5 9.6 9.9 8.1 8.3 9.6 12.690–99 . . . . . . . . . . . . . . . . . 8.7 11.0 9.2 7.9 7.6 11.2 9.1 7.1 6.6 8.7 12.4 12.9 9.0100–119 . . . . . . . . . . . . . . . . 13.1 9.9 12.3 16.3 8.5 18.4 10.5 12.4 16.3 11.2 11.3 12.1 16.2120–139 . . . . . . . . . . . . . . . . 7.5 2.2 6.1 6.3 12.6 5.6 9.2 9.4 6.7 7.6 5.8 7.5 2.9140–159 . . . . . . . . . . . . . . . . 3.7 1.8 2.4 1.8 3.0 3.0 4.5 5.9 5.4 2.8 1.4 2.2 0.0160–179 . . . . . . . . . . . . . . . . 1.6 0.2 0.1 0.3 0.2 3.3 3.4 3.2 1.5 0.9 0.0 0.2 1.6180 and more . . . . . . . . . . . . 1.0 1.1 0.3 0.9 0.3 1.8 0.7 1.8 1.0 0.5 0.7 0.6 0.0
0.0 Quantity more than zero but less than 0.05.1Includes all other race/ethnic groups not listed separately.
NOTE: Numbers may not add to totals because of rounding.
Page 144 [ Series 11, No. 247

Table 109. Percent distribution of serum total iron-binding capacity in microgram per deciliter for persons 1 year and over, by race/ethnicityand age: United States, 1988–94
Race/ethnicity andselected serumTIBC cutoffs1
1 yearand over
1–2years
3–5years
6–8years
9–11years
12–14years
15–19years
20–29years
30–39years
40–49years
50–59years
60–69years
70 yearsand over
All race/ethnic groups2
Total . . . . . . . . . . . . . . . . . . 100.0 100.0 100.0 100.0 100.0 100.0 100.0 100.0 100.0 100.0 100.0 100.0 100.0
Less than 150 . . . . . . . . . . . . 0.0 0.0 0.0 0.0 0.0 0.0 0.0 0.0 0.0 0.1 0.0 0.0 0.1150–199 . . . . . . . . . . . . . . . . 0.1 0.0 0.1 0.1 0.0 0.0 0.0 0.0 0.1 0.1 0.3 0.2 0.3200–249 . . . . . . . . . . . . . . . . 1.2 0.6 1.1 0.1 0.1 0.0 0.2 0.8 1.6 0.9 1.8 2.1 3.2250–299 . . . . . . . . . . . . . . . . 10.8 5.6 5.9 7.5 4.2 2.9 4.9 9.5 12.1 11.6 12.3 15.6 21.1300–349 . . . . . . . . . . . . . . . . 32.6 20.2 32.1 28.4 23.8 18.2 27.7 31.8 35.0 34.9 37.4 38.3 36.3350–399 . . . . . . . . . . . . . . . . 32.9 36.1 37.8 36.0 41.5 38.0 38.0 31.8 31.7 32.3 30.9 30.9 25.9400–449 . . . . . . . . . . . . . . . . 15.9 23.6 17.7 21.5 22.5 28.7 19.2 17.5 14.0 14.8 13.5 9.4 9.8450–499 . . . . . . . . . . . . . . . . 5.0 10.5 4.7 5.5 6.5 10.0 6.8 6.2 4.5 4.3 3.2 2.4 2.6500 and more . . . . . . . . . . . . 1.4 3.4 0.6 0.9 1.4 2.2 3.1 2.5 1.0 1.0 0.6 1.1 0.7
Non-Hispanic white
Total . . . . . . . . . . . . . . . . . . 100.0 100.0 100.0 100.0 100.0 100.0 100.0 100.0 100.0 100.0 100.0 100.0 100.0
Less than 150 . . . . . . . . . . . . 0.0 0.0 0.0 0.0 0.0 0.0 0.0 0.0 0.0 0.0 0.0 0.0 0.0150–199 . . . . . . . . . . . . . . . . 0.1 0.0 0.2 0.2 0.0 0.0 0.0 0.0 0.1 0.1 0.3 0.2 0.3200–249 . . . . . . . . . . . . . . . . 1.2 0.5 1.5 0.0 0.0 0.0 0.1 0.7 1.9 0.9 1.4 2.1 2.7250–299 . . . . . . . . . . . . . . . . 11.0 6.7 6.6 9.6 4.0 2.9 5.2 8.7 12.5 11.1 11.3 15.0 20.5300–349 . . . . . . . . . . . . . . . . 33.7 24.2 35.4 29.1 25.3 18.3 29.3 33.4 35.5 36.2 36.0 38.0 36.4350–399 . . . . . . . . . . . . . . . . 32.6 35.6 37.4 34.3 42.3 37.7 37.7 30.4 32.3 32.2 32.6 31.6 26.3400–449 . . . . . . . . . . . . . . . . 15.5 21.2 14.9 22.0 22.2 29.9 18.3 17.7 13.3 14.9 14.3 9.4 10.4450–499 . . . . . . . . . . . . . . . . 4.6 9.7 3.5 4.4 5.7 10.1 6.2 6.7 3.7 3.9 3.4 2.5 2.7500 and more . . . . . . . . . . . . 1.2 2.0 0.4 0.5 0.5 1.2 3.2 2.2 0.9 0.6 0.6 1.3 0.8
Non-Hispanic black
Total . . . . . . . . . . . . . . . . . . 100.0 100.0 100.0 100.0 100.0 100.0 100.0 100.0 100.0 100.0 100.0 100.0 100.0
Less than 150 . . . . . . . . . . . . 0.0 0.0 0.0 0.0 0.0 0.0 0.0 0.0 0.1 0.0 0.0 0.0 0.6150–199 . . . . . . . . . . . . . . . . 0.1 0.0 0.0 0.0 0.0 0.0 0.0 0.0 0.1 0.0 0.6 0.2 1.2200–249 . . . . . . . . . . . . . . . . 1.6 0.5 0.2 0.4 0.2 0.0 0.7 1.1 1.1 1.1 3.9 3.9 9.0250–299 . . . . . . . . . . . . . . . . 12.9 4.2 4.2 4.3 3.2 3.1 6.6 11.9 15.8 16.0 20.5 24.4 29.7300–349 . . . . . . . . . . . . . . . . 32.2 12.1 27.9 27.1 25.9 21.9 29.7 31.1 36.0 34.0 44.3 40.2 34.4350–399 . . . . . . . . . . . . . . . . 32.0 42.8 41.9 42.7 42.4 42.3 36.8 31.9 29.0 29.5 19.7 23.1 19.0400–449 . . . . . . . . . . . . . . . . 14.5 26.2 19.9 19.9 19.2 24.4 17.7 16.3 11.4 11.9 9.1 6.6 4.2450–499 . . . . . . . . . . . . . . . . 5.0 10.6 5.1 4.2 7.5 6.8 5.1 4.9 5.4 6.4 1.9 1.2 1.9500 and more . . . . . . . . . . . . 1.5 3.5 0.7 1.3 1.6 1.5 3.4 2.8 1.1 1.0 0.0 0.5 0.0
Mexican American
Total . . . . . . . . . . . . . . . . . . 100.0 100.0 100.0 100.0 100.0 100.0 100.0 100.0 100.0 100.0 100.0 100.0 100.0
Less than 150 . . . . . . . . . . . . 0.0 0.0 0.0 0.0 0.0 0.0 0.0 0.1 0.0 0.0 0.0 0.0 0.1150–199 . . . . . . . . . . . . . . . . 0.0 0.0 0.0 0.0 0.0 0.0 0.0 0.0 0.0 0.0 0.0 0.1 0.0200–249 . . . . . . . . . . . . . . . . 1.1 1.6 0.9 0.7 0.4 0.0 0.4 1.4 0.8 1.2 2.0 2.4 3.0250–299 . . . . . . . . . . . . . . . . 8.2 3.3 5.9 2.9 3.4 2.6 3.8 11.1 9.9 10.1 10.2 16.9 14.9300–349 . . . . . . . . . . . . . . . . 24.8 17.4 24.3 24.7 17.7 14.5 16.5 25.7 28.6 28.4 31.0 32.6 37.7350–399 . . . . . . . . . . . . . . . . 33.3 29.8 36.6 39.7 31.6 29.7 35.8 32.4 32.1 36.9 30.8 31.2 28.8400–449 . . . . . . . . . . . . . . . . 20.7 25.3 23.8 23.1 31.1 30.3 25.6 19.0 18.6 13.7 17.9 12.3 10.9450–499 . . . . . . . . . . . . . . . . 8.9 14.8 8.0 6.8 12.1 19.9 13.7 6.8 8.0 6.5 6.1 4.3 3.2500 and more . . . . . . . . . . . . 2.9 7.7 0.6 2.2 3.7 3.0 4.2 3.6 2.0 3.2 2.1 0.1 1.3
0.0 Quantity more than zero but less than 0.05.1TIBC is total iron-binding capacity.2Includes all other race/ethnic groups not listed separately.
NOTE: Numbers may not add to totals because of rounding.
Series 11, No. 247 [ Page 145

Table 110. Percent distribution of serum total iron-binding capacity in microgram per deciliter for males 1 year and over, by race/ethnicityand age: United States, 1988–94
Race/ethnicity andselected serumTIBC cutoffs1
1 yearand over
1–2years
3–5years
6–8years
9–11years
12–14years
15–19years
20–29years
30–39years
40–49years
50–59years
60–69years
70 yearsand over
All race/ethnic groups2
Total . . . . . . . . . . . . . . . . . . 100.0 100.0 100.0 100.0 100.0 100.0 100.0 100.0 100.0 100.0 100.0 100.0 100.0
Less than 150 . . . . . . . . . . . . 0.0 0.0 0.0 0.0 0.0 0.0 0.0 0.0 0.0 0.2 0.0 0.0 0.0150–199 . . . . . . . . . . . . . . . . 0.1 0.0 0.0 0.0 0.0 0.0 0.0 0.0 0.1 0.1 0.6 0.0 0.5200–249 . . . . . . . . . . . . . . . . 1.2 0.4 0.7 0.1 0.1 0.0 0.2 1.3 0.9 0.9 2.1 2.6 4.1250–299 . . . . . . . . . . . . . . . . 11.3 3.9 5.8 8.2 3.7 2.3 5.6 11.1 13.1 11.1 11.2 18.4 23.8300–349 . . . . . . . . . . . . . . . . 36.3 20.7 33.3 28.3 25.5 18.8 31.9 39.1 38.5 40.8 41.5 39.5 38.6350–399 . . . . . . . . . . . . . . . . 33.5 35.3 35.2 34.7 43.6 36.8 41.1 33.1 33.1 34.2 30.8 28.2 23.9400–449 . . . . . . . . . . . . . . . . 13.9 23.5 18.8 22.2 17.8 30.4 16.9 13.3 12.4 10.9 11.6 8.4 6.7450–499 . . . . . . . . . . . . . . . . 3.1 11.8 5.6 5.6 8.9 10.3 3.1 1.5 1.8 1.7 2.1 2.0 1.6500 and more . . . . . . . . . . . . 0.6 4.5 0.5 0.8 0.5 1.3 1.1 0.4 0.0 0.2 0.2 1.0 0.6
Non-Hispanic white
Total . . . . . . . . . . . . . . . . . . 100.0 100.0 100.0 100.0 100.0 100.0 100.0 100.0 100.0 100.0 100.0 100.0 100.0
Less than 150 . . . . . . . . . . . . 0.0 0.0 0.0 0.0 0.0 0.0 0.0 0.0 0.0 0.0 0.0 0.0 0.0150–199 . . . . . . . . . . . . . . . . 0.2 0.0 0.0 0.0 0.0 0.0 0.0 0.0 0.1 0.2 0.7 0.0 0.4200–249 . . . . . . . . . . . . . . . . 1.3 0.0 1.0 0.0 0.0 0.0 0.0 1.5 1.0 0.8 1.9 2.5 3.7250–299 . . . . . . . . . . . . . . . . 11.2 4.3 7.0 10.1 3.0 2.3 5.6 10.2 12.3 10.6 9.7 18.2 23.7300–349 . . . . . . . . . . . . . . . . 37.3 25.5 38.2 29.8 28.3 19.7 31.7 41.3 38.5 41.7 40.0 39.3 38.0350–399 . . . . . . . . . . . . . . . . 33.0 34.2 35.1 31.7 42.2 36.1 42.7 30.4 33.6 34.0 32.6 28.7 24.6400–449 . . . . . . . . . . . . . . . . 13.9 22.1 14.1 23.5 18.0 30.9 16.4 14.6 12.7 11.1 12.7 8.3 7.2450–499 . . . . . . . . . . . . . . . . 2.8 10.6 4.7 4.8 8.5 11.1 2.3 1.5 1.7 1.5 2.2 1.8 1.7500 and more . . . . . . . . . . . . 0.4 3.3 0.0 0.1 0.0 0.0 1.3 0.4 0.0 0.1 0.3 1.1 0.7
Non-Hispanic black
Total . . . . . . . . . . . . . . . . . . 100.0 100.0 100.0 100.0 100.0 100.0 100.0 100.0 100.0 100.0 100.0 100.0 100.0
Less than 150 . . . . . . . . . . . . 0.0 0.0 0.0 0.0 0.0 0.0 0.0 0.0 0.2 0.0 0.0 0.0 0.0150–199 . . . . . . . . . . . . . . . . 0.1 0.0 0.0 0.0 0.0 0.0 0.0 0.0 0.1 0.0 0.5 0.4 1.5200–249 . . . . . . . . . . . . . . . . 1.9 1.1 0.0 0.3 0.0 0.0 1.2 1.2 1.4 1.5 6.3 5.6 7.9250–299 . . . . . . . . . . . . . . . . 14.4 4.6 3.3 6.3 2.5 2.0 8.1 18.2 20.3 17.4 18.9 24.3 26.7300–349 . . . . . . . . . . . . . . . . 35.9 10.7 29.4 22.7 30.0 26.5 34.1 41.7 37.5 39.9 46.6 38.1 41.5350–399 . . . . . . . . . . . . . . . . 31.2 44.5 40.5 44.3 40.6 34.8 36.9 28.9 28.9 30.7 17.4 22.1 17.1400–449 . . . . . . . . . . . . . . . . 12.4 22.1 21.0 19.6 17.2 27.2 16.9 7.9 8.9 8.9 8.5 7.0 3.5450–499 . . . . . . . . . . . . . . . . 3.4 13.3 5.4 5.6 8.2 7.5 2.4 1.3 2.6 1.4 1.8 2.0 1.9500 and more . . . . . . . . . . . . 0.7 3.7 0.3 1.1 1.5 2.1 0.4 1.0 0.0 0.2 0.0 0.6 0.0
Mexican American
Total . . . . . . . . . . . . . . . . . . 100.0 100.0 100.0 100.0 100.0 100.0 100.0 100.0 100.0 100.0 100.0 100.0 100.0
Less than 150 . . . . . . . . . . . . 0.0 0.0 0.0 0.0 0.0 0.0 0.0 0.1 0.0 0.0 0.0 0.1 0.3150–199 . . . . . . . . . . . . . . . . 0.0 0.0 0.0 0.0 0.0 0.0 0.0 0.0 0.0 0.0 0.0 0.0 0.0200–249 . . . . . . . . . . . . . . . . 1.1 2.2 0.8 0.8 0.8 0.0 0.4 1.7 0.5 0.9 1.0 2.8 2.0250–299 . . . . . . . . . . . . . . . . 9.4 1.3 5.7 2.3 2.8 3.8 5.0 13.0 12.0 11.3 10.8 18.1 16.0300–349 . . . . . . . . . . . . . . . . 27.2 11.6 22.1 20.1 18.1 9.2 21.3 29.8 34.9 34.1 32.4 35.0 37.6350–399 . . . . . . . . . . . . . . . . 37.0 35.5 38.5 44.6 35.7 32.3 41.7 37.5 35.6 36.7 36.5 29.6 31.5400–449 . . . . . . . . . . . . . . . . 17.7 23.1 23.1 20.9 27.4 32.7 20.6 15.2 14.2 11.7 14.7 9.8 10.5450–499 . . . . . . . . . . . . . . . . 6.1 16.3 8.9 7.9 12.3 18.6 8.6 2.3 2.2 4.6 4.6 4.6 1.9500 and more . . . . . . . . . . . . 1.5 10.1 0.9 3.3 2.8 3.4 2.4 0.4 0.5 0.7 0.0 0.0 0.2
0.0 Quantity more than zero but less than 0.05.1TIBC is total iron-binding capacity.2Includes all other race/ethnic groups not listed separately.
NOTE: Numbers may not add to totals because of rounding.
Page 146 [ Series 11, No. 247

Table 111. Percent distribution of serum total iron-binding capacity in microgram per deciliter for females 1 year and over, by race/ethnicityand age: United States, 1988–94
Race/ethnicity andselected serumTIBC cutoffs1
1 yearand over
1–2years
3–5years
6–8years
9–11years
12–14years
15–19years
20–29years
30–39years
40–49years
50–59years
60–69years
70 yearsand over
All race/ethnic groups2
Total . . . . . . . . . . . . . . . . . . 100.0 100.0 100.0 100.0 100.0 100.0 100.0 100.0 100.0 100.0 100.0 100.0 100.0
Less than 150 . . . . . . . . . . . . 0.0 0.0 0.0 0.0 0.0 0.0 0.0 0.0 0.0 0.0 0.0 0.0 0.1150–199 . . . . . . . . . . . . . . . . 0.1 0.0 0.2 0.2 0.0 0.0 0.0 0.0 0.0 0.0 0.1 0.3 0.2200–249 . . . . . . . . . . . . . . . . 1.2 0.8 1.4 0.1 0.1 0.0 0.2 0.2 2.2 0.9 1.5 1.7 2.6250–299 . . . . . . . . . . . . . . . . 10.4 7.4 6.1 6.6 4.6 3.5 4.3 7.9 11.1 12.1 13.3 13.1 19.2300–349 . . . . . . . . . . . . . . . . 29.2 19.8 30.8 28.4 22.1 17.4 23.5 24.5 31.5 29.2 33.5 37.3 34.8350–399 . . . . . . . . . . . . . . . . 32.3 36.9 40.5 37.4 39.5 39.4 34.8 30.5 30.3 30.6 31.1 33.3 27.2400–449 . . . . . . . . . . . . . . . . 17.9 23.7 16.5 20.7 27.2 26.8 21.6 21.6 15.6 18.6 15.2 10.3 11.9450–499 . . . . . . . . . . . . . . . . 6.7 9.2 3.8 5.4 4.1 9.6 10.5 10.8 7.2 6.8 4.3 2.8 3.2500 and more . . . . . . . . . . . . 2.3 2.2 0.7 1.0 2.4 3.2 5.1 4.5 2.0 1.8 1.0 1.2 0.8
Non-Hispanic white
Total . . . . . . . . . . . . . . . . . . 100.0 100.0 100.0 100.0 100.0 100.0 100.0 100.0 100.0 100.0 100.0 100.0 100.0
Less than 150 . . . . . . . . . . . . 0.0 0.0 0.0 0.0 0.0 0.0 0.0 0.0 0.0 0.0 0.0 0.0 0.1150–199 . . . . . . . . . . . . . . . . 0.1 0.0 0.4 0.4 0.0 0.0 0.0 0.0 0.0 0.0 0.0 0.3 0.2200–249 . . . . . . . . . . . . . . . . 1.2 1.1 2.1 0.0 0.0 0.0 0.2 0.0 2.8 1.0 1.0 1.7 2.0250–299 . . . . . . . . . . . . . . . . 10.8 9.3 6.1 9.0 4.9 3.5 4.7 7.3 12.6 11.7 12.7 12.2 18.4300–349 . . . . . . . . . . . . . . . . 30.3 22.9 32.4 28.2 22.5 16.7 26.9 25.7 32.3 30.6 32.2 37.0 35.3350–399 . . . . . . . . . . . . . . . . 32.3 37.0 40.1 37.5 42.5 39.6 32.5 30.4 30.9 30.4 32.6 34.0 27.4400–449 . . . . . . . . . . . . . . . . 17.1 20.3 15.8 20.2 26.1 28.7 20.3 20.7 13.9 18.7 15.9 10.2 12.5450–499 . . . . . . . . . . . . . . . . 6.3 8.7 2.3 3.9 3.0 8.9 10.2 11.8 5.7 6.4 4.5 3.2 3.3500 and more . . . . . . . . . . . . 1.9 0.6 0.8 0.9 1.0 2.6 5.2 4.0 1.8 1.1 1.0 1.4 0.9
Non-Hispanic black
Total . . . . . . . . . . . . . . . . . . 100.0 100.0 100.0 100.0 100.0 100.0 100.0 100.0 100.0 100.0 100.0 100.0 100.0
Less than 150 . . . . . . . . . . . . 0.1 0.0 0.0 0.0 0.0 0.0 0.0 0.0 0.0 0.0 0.0 0.0 0.9150–199 . . . . . . . . . . . . . . . . 0.1 0.0 0.0 0.0 0.0 0.0 0.0 0.0 0.0 0.0 0.7 0.0 1.0200–249 . . . . . . . . . . . . . . . . 1.4 0.0 0.4 0.4 0.4 0.0 0.2 1.0 0.9 0.7 2.0 2.7 9.7250–299 . . . . . . . . . . . . . . . . 11.7 3.8 5.0 2.5 4.0 4.0 5.1 6.6 12.1 14.9 21.8 24.5 31.6300–349 . . . . . . . . . . . . . . . . 29.1 13.5 26.4 31.3 21.8 18.0 25.3 22.1 34.8 29.3 42.5 41.7 29.9350–399 . . . . . . . . . . . . . . . . 32.6 41.2 43.4 41.2 44.2 48.7 36.7 34.5 29.0 28.6 21.5 23.7 20.3400–449 . . . . . . . . . . . . . . . . 16.4 30.2 18.8 20.2 21.2 22.1 18.4 23.6 13.3 14.3 9.6 6.3 4.7450–499 . . . . . . . . . . . . . . . . 6.4 8.0 4.9 2.9 6.8 6.2 7.7 7.9 7.7 10.4 1.9 0.7 1.9500 and more . . . . . . . . . . . . 2.3 3.3 1.1 1.6 1.6 1.0 6.5 4.4 2.0 1.7 0.0 0.4 0.0
Mexican American
Total . . . . . . . . . . . . . . . . . . 100.0 100.0 100.0 100.0 100.0 100.0 100.0 100.0 100.0 100.0 100.0 100.0 100.0
Less than 150 . . . . . . . . . . . . 0.0 0.0 0.0 0.0 0.0 0.0 0.0 0.0 0.0 0.0 0.0 0.0 0.0150–199 . . . . . . . . . . . . . . . . 0.0 0.0 0.1 0.0 0.0 0.0 0.0 0.0 0.0 0.0 0.0 0.1 0.0200–249 . . . . . . . . . . . . . . . . 1.1 1.0 1.0 0.6 0.0 0.0 0.4 1.1 1.2 1.4 2.9 2.1 4.0250–299 . . . . . . . . . . . . . . . . 7.0 5.3 6.0 3.4 4.0 1.6 2.5 8.7 7.5 8.9 9.5 16.0 13.8300–349 . . . . . . . . . . . . . . . . 22.2 23.2 26.5 29.1 17.2 19.0 11.0 20.5 21.8 22.4 29.6 30.8 37.8350–399 . . . . . . . . . . . . . . . . 29.4 24.1 34.6 35.0 27.1 27.4 29.0 25.9 28.3 37.1 25.5 32.4 26.2400–449 . . . . . . . . . . . . . . . . 23.9 27.6 24.5 25.1 35.2 28.3 31.2 23.7 23.4 15.8 20.9 14.3 11.3450–499 . . . . . . . . . . . . . . . . 11.9 13.4 7.1 5.7 11.8 21.1 19.5 12.4 14.2 8.5 7.5 4.1 4.5500 and more . . . . . . . . . . . . 4.5 5.4 0.3 1.1 4.6 2.6 6.3 7.7 3.6 5.9 4.1 0.3 2.3
0.0 Quantity more than zero but less than 0.05.1TIBC is total iron-binding capacity.2Includes all other race/ethnic groups not listed separately.
NOTE: Numbers may not add to totals because of rounding.
Series 11, No. 247 [ Page 147
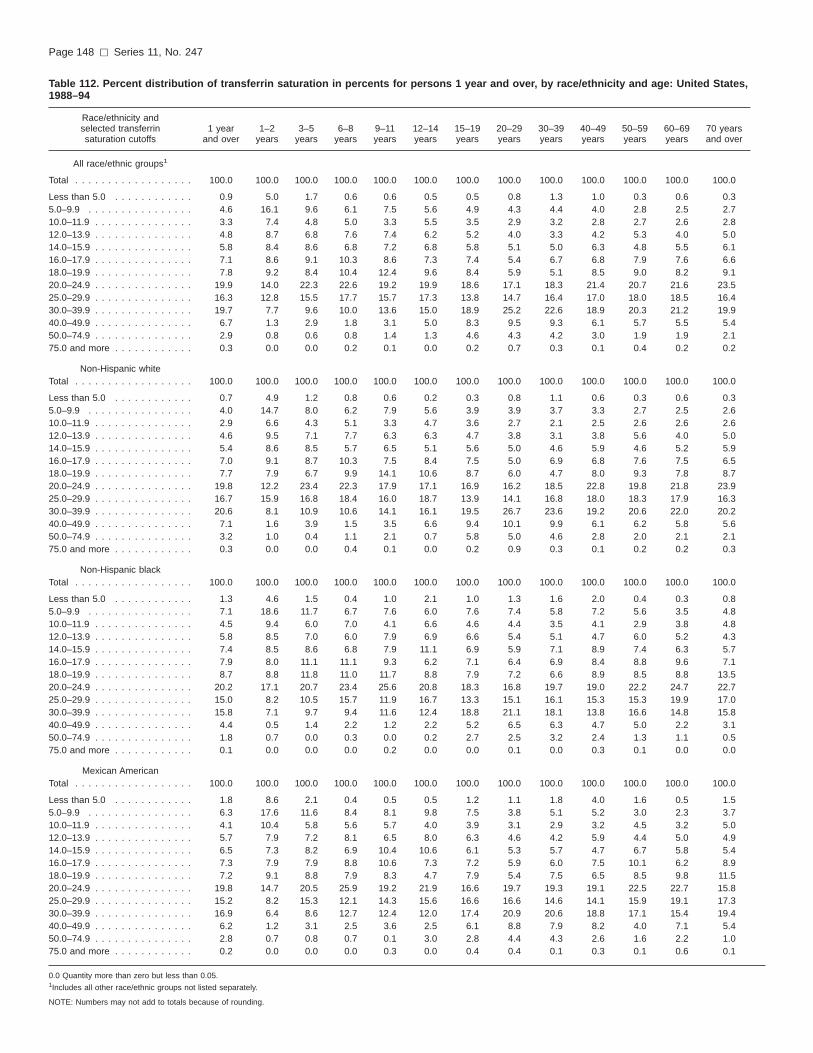
Table 112. Percent distribution of transferrin saturation in percents for persons 1 year and over, by race/ethnicity and age: United States,1988–94
Race/ethnicity andselected transferrinsaturation cutoffs
1 yearand over
1–2years
3–5years
6–8years
9–11years
12–14years
15–19years
20–29years
30–39years
40–49years
50–59years
60–69years
70 yearsand over
All race/ethnic groups1
Total . . . . . . . . . . . . . . . . . . 100.0 100.0 100.0 100.0 100.0 100.0 100.0 100.0 100.0 100.0 100.0 100.0 100.0
Less than 5.0 . . . . . . . . . . . . 0.9 5.0 1.7 0.6 0.6 0.5 0.5 0.8 1.3 1.0 0.3 0.6 0.35.0–9.9 . . . . . . . . . . . . . . . . 4.6 16.1 9.6 6.1 7.5 5.6 4.9 4.3 4.4 4.0 2.8 2.5 2.710.0–11.9 . . . . . . . . . . . . . . . 3.3 7.4 4.8 5.0 3.3 5.5 3.5 2.9 3.2 2.8 2.7 2.6 2.812.0–13.9 . . . . . . . . . . . . . . . 4.8 8.7 6.8 7.6 7.4 6.2 5.2 4.0 3.3 4.2 5.3 4.0 5.014.0–15.9 . . . . . . . . . . . . . . . 5.8 8.4 8.6 6.8 7.2 6.8 5.8 5.1 5.0 6.3 4.8 5.5 6.116.0–17.9 . . . . . . . . . . . . . . . 7.1 8.6 9.1 10.3 8.6 7.3 7.4 5.4 6.7 6.8 7.9 7.6 6.618.0–19.9 . . . . . . . . . . . . . . . 7.8 9.2 8.4 10.4 12.4 9.6 8.4 5.9 5.1 8.5 9.0 8.2 9.120.0–24.9 . . . . . . . . . . . . . . . 19.9 14.0 22.3 22.6 19.2 19.9 18.6 17.1 18.3 21.4 20.7 21.6 23.525.0–29.9 . . . . . . . . . . . . . . . 16.3 12.8 15.5 17.7 15.7 17.3 13.8 14.7 16.4 17.0 18.0 18.5 16.430.0–39.9 . . . . . . . . . . . . . . . 19.7 7.7 9.6 10.0 13.6 15.0 18.9 25.2 22.6 18.9 20.3 21.2 19.940.0–49.9 . . . . . . . . . . . . . . . 6.7 1.3 2.9 1.8 3.1 5.0 8.3 9.5 9.3 6.1 5.7 5.5 5.450.0–74.9 . . . . . . . . . . . . . . . 2.9 0.8 0.6 0.8 1.4 1.3 4.6 4.3 4.2 3.0 1.9 1.9 2.175.0 and more . . . . . . . . . . . . 0.3 0.0 0.0 0.2 0.1 0.0 0.2 0.7 0.3 0.1 0.4 0.2 0.2
Non-Hispanic whiteTotal . . . . . . . . . . . . . . . . . . 100.0 100.0 100.0 100.0 100.0 100.0 100.0 100.0 100.0 100.0 100.0 100.0 100.0
Less than 5.0 . . . . . . . . . . . . 0.7 4.9 1.2 0.8 0.6 0.2 0.3 0.8 1.1 0.6 0.3 0.6 0.35.0–9.9 . . . . . . . . . . . . . . . . 4.0 14.7 8.0 6.2 7.9 5.6 3.9 3.9 3.7 3.3 2.7 2.5 2.610.0–11.9 . . . . . . . . . . . . . . . 2.9 6.6 4.3 5.1 3.3 4.7 3.6 2.7 2.1 2.5 2.6 2.6 2.612.0–13.9 . . . . . . . . . . . . . . . 4.6 9.5 7.1 7.7 6.3 6.3 4.7 3.8 3.1 3.8 5.6 4.0 5.014.0–15.9 . . . . . . . . . . . . . . . 5.4 8.6 8.5 5.7 6.5 5.1 5.6 5.0 4.6 5.9 4.6 5.2 5.916.0–17.9 . . . . . . . . . . . . . . . 7.0 9.1 8.7 10.3 7.5 8.4 7.5 5.0 6.9 6.8 7.6 7.5 6.518.0–19.9 . . . . . . . . . . . . . . . 7.7 7.9 6.7 9.9 14.1 10.6 8.7 6.0 4.7 8.0 9.3 7.8 8.720.0–24.9 . . . . . . . . . . . . . . . 19.8 12.2 23.4 22.3 17.9 17.1 16.9 16.2 18.5 22.8 19.8 21.8 23.925.0–29.9 . . . . . . . . . . . . . . . 16.7 15.9 16.8 18.4 16.0 18.7 13.9 14.1 16.8 18.0 18.3 17.9 16.330.0–39.9 . . . . . . . . . . . . . . . 20.6 8.1 10.9 10.6 14.1 16.1 19.5 26.7 23.6 19.2 20.6 22.0 20.240.0–49.9 . . . . . . . . . . . . . . . 7.1 1.6 3.9 1.5 3.5 6.6 9.4 10.1 9.9 6.1 6.2 5.8 5.650.0–74.9 . . . . . . . . . . . . . . . 3.2 1.0 0.4 1.1 2.1 0.7 5.8 5.0 4.6 2.8 2.0 2.1 2.175.0 and more . . . . . . . . . . . . 0.3 0.0 0.0 0.4 0.1 0.0 0.2 0.9 0.3 0.1 0.2 0.2 0.3
Non-Hispanic blackTotal . . . . . . . . . . . . . . . . . . 100.0 100.0 100.0 100.0 100.0 100.0 100.0 100.0 100.0 100.0 100.0 100.0 100.0
Less than 5.0 . . . . . . . . . . . . 1.3 4.6 1.5 0.4 1.0 2.1 1.0 1.3 1.6 2.0 0.4 0.3 0.85.0–9.9 . . . . . . . . . . . . . . . . 7.1 18.6 11.7 6.7 7.6 6.0 7.6 7.4 5.8 7.2 5.6 3.5 4.810.0–11.9 . . . . . . . . . . . . . . . 4.5 9.4 6.0 7.0 4.1 6.6 4.6 4.4 3.5 4.1 2.9 3.8 4.812.0–13.9 . . . . . . . . . . . . . . . 5.8 8.5 7.0 6.0 7.9 6.9 6.6 5.4 5.1 4.7 6.0 5.2 4.314.0–15.9 . . . . . . . . . . . . . . . 7.4 8.5 8.6 6.8 7.9 11.1 6.9 5.9 7.1 8.9 7.4 6.3 5.716.0–17.9 . . . . . . . . . . . . . . . 7.9 8.0 11.1 11.1 9.3 6.2 7.1 6.4 6.9 8.4 8.8 9.6 7.118.0–19.9 . . . . . . . . . . . . . . . 8.7 8.8 11.8 11.0 11.7 8.8 7.9 7.2 6.6 8.9 8.5 8.8 13.520.0–24.9 . . . . . . . . . . . . . . . 20.2 17.1 20.7 23.4 25.6 20.8 18.3 16.8 19.7 19.0 22.2 24.7 22.725.0–29.9 . . . . . . . . . . . . . . . 15.0 8.2 10.5 15.7 11.9 16.7 13.3 15.1 16.1 15.3 15.3 19.9 17.030.0–39.9 . . . . . . . . . . . . . . . 15.8 7.1 9.7 9.4 11.6 12.4 18.8 21.1 18.1 13.8 16.6 14.8 15.840.0–49.9 . . . . . . . . . . . . . . . 4.4 0.5 1.4 2.2 1.2 2.2 5.2 6.5 6.3 4.7 5.0 2.2 3.150.0–74.9 . . . . . . . . . . . . . . . 1.8 0.7 0.0 0.3 0.0 0.2 2.7 2.5 3.2 2.4 1.3 1.1 0.575.0 and more . . . . . . . . . . . . 0.1 0.0 0.0 0.0 0.2 0.0 0.0 0.1 0.0 0.3 0.1 0.0 0.0
Mexican AmericanTotal . . . . . . . . . . . . . . . . . . 100.0 100.0 100.0 100.0 100.0 100.0 100.0 100.0 100.0 100.0 100.0 100.0 100.0
Less than 5.0 . . . . . . . . . . . . 1.8 8.6 2.1 0.4 0.5 0.5 1.2 1.1 1.8 4.0 1.6 0.5 1.55.0–9.9 . . . . . . . . . . . . . . . . 6.3 17.6 11.6 8.4 8.1 9.8 7.5 3.8 5.1 5.2 3.0 2.3 3.710.0–11.9 . . . . . . . . . . . . . . . 4.1 10.4 5.8 5.6 5.7 4.0 3.9 3.1 2.9 3.2 4.5 3.2 5.012.0–13.9 . . . . . . . . . . . . . . . 5.7 7.9 7.2 8.1 6.5 8.0 6.3 4.6 4.2 5.9 4.4 5.0 4.914.0–15.9 . . . . . . . . . . . . . . . 6.5 7.3 8.2 6.9 10.4 10.6 6.1 5.3 5.7 4.7 6.7 5.8 5.416.0–17.9 . . . . . . . . . . . . . . . 7.3 7.9 7.9 8.8 10.6 7.3 7.2 5.9 6.0 7.5 10.1 6.2 8.918.0–19.9 . . . . . . . . . . . . . . . 7.2 9.1 8.8 7.9 8.3 4.7 7.9 5.4 7.5 6.5 8.5 9.8 11.520.0–24.9 . . . . . . . . . . . . . . . 19.8 14.7 20.5 25.9 19.2 21.9 16.6 19.7 19.3 19.1 22.5 22.7 15.825.0–29.9 . . . . . . . . . . . . . . . 15.2 8.2 15.3 12.1 14.3 15.6 16.6 16.6 14.6 14.1 15.9 19.1 17.330.0–39.9 . . . . . . . . . . . . . . . 16.9 6.4 8.6 12.7 12.4 12.0 17.4 20.9 20.6 18.8 17.1 15.4 19.440.0–49.9 . . . . . . . . . . . . . . . 6.2 1.2 3.1 2.5 3.6 2.5 6.1 8.8 7.9 8.2 4.0 7.1 5.450.0–74.9 . . . . . . . . . . . . . . . 2.8 0.7 0.8 0.7 0.1 3.0 2.8 4.4 4.3 2.6 1.6 2.2 1.075.0 and more . . . . . . . . . . . . 0.2 0.0 0.0 0.0 0.3 0.0 0.4 0.4 0.1 0.3 0.1 0.6 0.1
0.0 Quantity more than zero but less than 0.05.1Includes all other race/ethnic groups not listed separately.
NOTE: Numbers may not add to totals because of rounding.
Page 148 [ Series 11, No. 247

Table 113. Percent distribution of transferrin saturation in percents for males 1 year and over, by race/ethnicity and age: United States,1988–94
Race/ethnicity andselected transferrinsaturation cutoffs
1 yearand over
1–2years
3–5years
6–8years
9–11years
12–14years
15–19years
20–29years
30–39years
40–49years
50–59years
60–69years
70 yearsand over
All race/ethnic groups1
Total . . . . . . . . . . . . . . . . . . 100.0 100.0 100.0 100.0 100.0 100.0 100.0 100.0 100.0 100.0 100.0 100.0 100.0
Less than 5.0 . . . . . . . . . . . . 0.4 4.6 2.0 0.7 0.4 0.6 0.0 0.4 0.1 0.1 0.4 0.3 0.45.0–9.9 . . . . . . . . . . . . . . . . 2.8 17.5 10.3 5.2 6.2 5.6 1.4 1.9 1.7 0.5 1.0 2.8 2.310.0–11.9 . . . . . . . . . . . . . . . 2.0 8.2 5.7 4.9 4.2 2.6 1.7 1.2 0.7 0.8 1.8 1.8 2.112.0–13.9 . . . . . . . . . . . . . . . 3.2 7.8 6.0 8.4 7.2 5.3 4.6 2.2 1.0 1.8 3.5 1.4 3.914.0–15.9 . . . . . . . . . . . . . . . 4.6 7.9 9.8 5.8 9.6 7.8 4.6 4.1 2.8 4.0 3.8 3.1 4.716.0–17.9 . . . . . . . . . . . . . . . 6.7 8.9 8.8 11.3 9.4 7.4 5.9 4.3 7.1 6.5 7.9 6.0 5.018.0–19.9 . . . . . . . . . . . . . . . 6.9 8.9 9.1 10.0 10.1 11.3 8.2 5.4 4.3 6.8 7.3 5.9 7.620.0–24.9 . . . . . . . . . . . . . . . 19.7 15.2 20.1 24.0 17.4 19.3 19.3 17.5 18.4 24.4 18.9 19.7 20.325.0–29.9 . . . . . . . . . . . . . . . 17.8 10.3 14.4 15.6 19.6 17.1 13.9 13.9 20.2 19.8 18.6 22.9 18.630.0–39.9 . . . . . . . . . . . . . . . 23.6 8.5 9.8 10.4 12.0 16.4 22.6 30.2 27.0 24.2 27.6 25.4 24.240.0–49.9 . . . . . . . . . . . . . . . 8.6 1.3 3.7 2.6 2.6 6.3 11.3 12.7 11.1 8.4 6.0 8.6 7.750.0–74.9 . . . . . . . . . . . . . . . 3.4 0.7 0.3 1.3 1.0 0.2 6.1 5.4 5.5 2.3 2.9 1.8 3.075.0 and more . . . . . . . . . . . . 0.3 0.0 0.0 0.0 0.3 0.0 0.4 0.9 0.0 0.3 0.4 0.4 0.2
Non-Hispanic whiteTotal . . . . . . . . . . . . . . . . . . 100.0 100.0 100.0 100.0 100.0 100.0 100.0 100.0 100.0 100.0 100.0 100.0 100.0
Less than 5.0 . . . . . . . . . . . . 0.4 4.2 1.4 0.8 0.3 0.4 0.0 0.6 0.0 0.1 0.4 0.3 0.35.0–9.9 . . . . . . . . . . . . . . . . 2.6 14.6 8.0 4.6 6.9 5.6 1.7 1.9 2.1 0.1 1.0 2.8 2.510.0–11.9 . . . . . . . . . . . . . . . 1.8 7.5 5.5 4.8 4.3 1.8 2.0 1.2 0.6 0.6 1.7 1.9 2.012.0–13.9 . . . . . . . . . . . . . . . 2.9 7.7 6.4 8.8 6.8 5.4 4.7 1.8 0.8 1.7 3.4 1.0 3.814.0–15.9 . . . . . . . . . . . . . . . 4.5 7.9 10.1 4.1 9.8 6.7 5.3 4.2 3.0 4.3 3.9 3.1 4.416.0–17.9 . . . . . . . . . . . . . . . 6.6 10.1 9.2 11.9 8.3 8.1 5.2 3.2 7.6 6.8 8.3 5.7 4.918.0–19.9 . . . . . . . . . . . . . . . 6.6 8.6 7.3 9.8 10.9 12.6 8.9 5.1 3.6 6.4 7.1 5.4 7.820.0–24.9 . . . . . . . . . . . . . . . 19.6 14.4 20.3 24.2 14.2 16.3 18.6 16.3 18.8 26.4 18.3 20.3 20.125.0–29.9 . . . . . . . . . . . . . . . 18.1 12.6 15.5 16.0 22.2 17.9 12.9 12.4 20.7 20.6 18.9 22.6 18.730.0–39.9 . . . . . . . . . . . . . . . 23.9 9.6 11.0 10.9 11.7 17.3 21.4 32.3 26.4 23.0 26.9 25.8 24.540.0–49.9 . . . . . . . . . . . . . . . 9.0 1.8 5.0 2.4 2.8 7.8 11.6 13.9 11.2 8.2 6.6 9.0 7.950.0–74.9 . . . . . . . . . . . . . . . 3.5 0.9 0.3 1.8 1.4 0.0 7.3 6.1 5.3 1.8 3.1 1.9 2.875.0 and more . . . . . . . . . . . . 0.4 0.0 0.0 0.0 0.3 0.0 0.4 1.2 0.0 0.2 0.5 0.4 0.2
Non-Hispanic blackTotal . . . . . . . . . . . . . . . . . . 100.0 100.0 100.0 100.0 100.0 100.0 100.0 100.0 100.0 100.0 100.0 100.0 100.0
Less than 5.0 . . . . . . . . . . . . 0.7 5.5 1.6 0.7 1.2 2.2 0.0 0.0 0.4 0.0 0.0 0.8 1.05.0–9.9 . . . . . . . . . . . . . . . . 3.3 21.5 13.8 7.6 4.1 6.1 0.9 0.6 0.9 1.6 1.5 3.3 1.010.0–11.9 . . . . . . . . . . . . . . . 3.3 11.5 8.4 7.6 5.0 5.4 0.7 1.7 1.5 2.4 2.6 2.7 3.212.0–13.9 . . . . . . . . . . . . . . . 4.8 7.8 6.0 6.4 10.1 5.1 4.4 4.4 2.5 3.0 5.7 3.9 7.414.0–15.9 . . . . . . . . . . . . . . . 5.0 10.9 7.3 4.8 7.3 10.0 4.5 4.7 2.9 2.4 6.1 4.6 5.116.0–17.9 . . . . . . . . . . . . . . . 7.7 6.7 11.1 13.6 12.4 6.3 9.6 4.8 5.4 8.4 6.0 9.5 7.518.0–19.9 . . . . . . . . . . . . . . . 8.4 6.4 13.0 10.3 10.8 10.7 7.9 5.3 7.3 9.4 8.7 8.0 9.320.0–24.9 . . . . . . . . . . . . . . . 21.2 18.2 18.3 23.9 24.5 16.9 20.9 20.1 22.1 21.3 22.7 21.4 23.225.0–29.9 . . . . . . . . . . . . . . . 16.6 6.8 9.2 13.3 13.0 18.4 14.6 17.3 19.8 18.6 15.0 21.7 19.130.0–39.9 . . . . . . . . . . . . . . . 20.0 3.5 9.6 9.9 10.3 15.4 24.8 27.7 23.5 20.1 22.9 18.7 18.740.0–49.9 . . . . . . . . . . . . . . . 6.0 0.4 1.6 1.9 0.8 3.4 8.7 9.2 7.9 7.6 6.7 3.4 3.550.0–74.9 . . . . . . . . . . . . . . . 2.9 0.8 0.0 0.0 0.0 0.0 3.0 4.1 5.8 4.5 2.2 2.1 1.175.0 and more . . . . . . . . . . . . 0.1 0.0 0.0 0.0 0.4 0.0 0.0 0.0 0.0 0.8 0.0 0.0 0.0
Mexican AmericanTotal . . . . . . . . . . . . . . . . . . 100.0 100.0 100.0 100.0 100.0 100.0 100.0 100.0 100.0 100.0 100.0 100.0 100.0
Less than 5.0 . . . . . . . . . . . . 0.8 9.3 2.9 0.3 0.5 0.0 0.0 0.0 0.7 0.5 1.3 0.4 2.15.0–9.9 . . . . . . . . . . . . . . . . 3.9 19.7 11.6 9.1 7.2 8.4 2.0 1.4 0.8 1.1 3.3 1.4 3.110.0–11.9 . . . . . . . . . . . . . . . 2.9 12.6 5.4 6.2 6.4 3.7 2.8 0.8 0.9 1.2 4.5 2.1 5.112.0–13.9 . . . . . . . . . . . . . . . 4.0 5.8 6.7 6.1 6.3 4.7 4.8 2.5 2.6 4.4 4.0 2.1 2.414.0–15.9 . . . . . . . . . . . . . . . 5.0 6.9 7.9 8.5 6.7 11.8 4.1 3.4 3.6 3.2 5.2 3.9 5.216.0–17.9 . . . . . . . . . . . . . . . 6.1 8.8 8.7 9.2 7.6 11.9 6.6 3.6 4.5 6.4 3.5 6.5 8.318.0–19.9 . . . . . . . . . . . . . . . 7.0 7.9 8.4 8.7 10.2 5.3 8.6 4.9 7.3 6.0 5.9 10.6 8.920.0–24.9 . . . . . . . . . . . . . . . 20.6 14.0 21.0 24.6 22.0 21.3 17.0 21.3 19.8 19.7 26.8 21.6 15.425.0–29.9 . . . . . . . . . . . . . . . 16.4 7.1 15.3 11.6 14.4 14.0 20.4 18.9 15.1 18.6 16.2 15.4 13.930.0–39.9 . . . . . . . . . . . . . . . 20.8 7.2 8.4 12.6 13.1 12.9 19.4 26.2 26.9 24.1 21.0 19.2 25.840.0–49.9 . . . . . . . . . . . . . . . 7.9 0.7 2.8 2.6 4.9 3.4 8.8 10.0 10.6 10.1 5.6 12.5 7.750.0–74.9 . . . . . . . . . . . . . . . 4.2 0.0 1.0 0.4 0.3 2.6 4.7 6.4 7.3 4.1 2.5 3.0 1.775.0 and more . . . . . . . . . . . . 0.3 0.0 0.0 0.0 0.5 0.0 0.7 0.4 0.0 0.6 0.2 1.4 0.3
0.0 Quantity more than zero but less than 0.05.1Includes all other race/ethnic groups not listed separately.
NOTE: Numbers may not add to totals because of rounding.
Series 11, No. 247 [ Page 149

Table 114. Percent distribution of transferrin saturation in percents for females 1 year and over, by race/ethnicity and age: United States,1988–94
Race/ethnicity andselected transferrinsaturation cutoffs
1 yearand over
1–2years
3–5years
6–8years
9–11years
12–14years
15–19years
20–29years
30–39years
40–49years
50–59years
60–69years
70 yearsand over
All race/ethnic groups1
Total . . . . . . . . . . . . . . . . . . 100.0 100.0 100.0 100.0 100.0 100.0 100.0 100.0 100.0 100.0 100.0 100.0 100.0
Less than 5.0 . . . . . . . . . . . . 1.3 5.3 1.5 0.6 0.8 0.4 0.9 1.2 2.5 1.8 0.3 0.8 0.35.0–9.9 . . . . . . . . . . . . . . . . 6.3 14.7 8.8 7.1 8.7 5.7 8.3 6.7 7.1 7.4 4.6 2.3 2.910.0–11.9 . . . . . . . . . . . . . . . 4.6 6.5 3.9 5.2 2.5 8.6 5.3 4.5 5.6 4.7 3.6 3.3 3.212.0–13.9 . . . . . . . . . . . . . . . 6.3 9.6 7.6 6.7 7.6 7.2 5.9 5.7 5.6 6.4 7.2 6.2 5.814.0–15.9 . . . . . . . . . . . . . . . 7.0 9.0 7.3 8.0 4.8 5.7 6.9 6.1 7.2 8.4 5.8 7.5 7.016.0–17.9 . . . . . . . . . . . . . . . 7.5 8.3 9.4 9.2 7.7 7.0 8.9 6.5 6.2 7.0 8.0 9.0 7.618.0–19.9 . . . . . . . . . . . . . . . 8.8 9.5 7.8 10.9 14.5 7.6 8.6 6.5 5.8 10.2 10.6 10.2 10.020.0–24.9 . . . . . . . . . . . . . . . 20.0 12.8 24.7 20.9 21.0 20.5 17.9 16.8 18.2 18.4 22.3 23.3 25.625.0–29.9 . . . . . . . . . . . . . . . 14.9 15.2 16.6 20.1 11.9 17.6 13.7 15.5 12.5 14.3 17.4 14.8 15.030.0–39.9 . . . . . . . . . . . . . . . 15.9 6.8 9.3 9.5 15.1 13.5 15.1 20.3 18.2 13.9 13.5 17.6 17.140.0–49.9 . . . . . . . . . . . . . . . 4.8 1.4 2.2 0.9 3.5 3.6 5.2 6.4 7.5 3.9 5.3 2.9 3.850.0–74.9 . . . . . . . . . . . . . . . 2.4 0.9 1.0 0.4 1.9 2.5 3.2 3.2 3.0 3.7 1.0 2.1 1.575.0 and more . . . . . . . . . . . . 0.3 0.0 0.0 0.5 0.0 0.0 0.0 0.5 0.5 0.0 0.5 0.0 0.3
Non-Hispanic whiteTotal . . . . . . . . . . . . . . . . . . 100.0 100.0 100.0 100.0 100.0 100.0 100.0 100.0 100.0 100.0 100.0 100.0 100.0
Less than 5.0 . . . . . . . . . . . . 1.1 5.5 1.0 0.8 0.9 0.0 0.7 0.9 2.3 1.0 0.2 1.0 0.35.0–9.9 . . . . . . . . . . . . . . . . 5.4 14.8 8.1 8.1 8.8 5.6 6.2 5.9 5.3 6.5 4.4 2.2 2.610.0–11.9 . . . . . . . . . . . . . . . 4.0 5.6 3.1 5.5 2.3 8.1 5.2 4.1 3.8 4.5 3.6 3.1 3.012.0–13.9 . . . . . . . . . . . . . . . 6.2 11.3 7.9 6.5 5.8 7.4 4.6 5.8 5.5 6.0 7.6 6.6 5.814.0–15.9 . . . . . . . . . . . . . . . 6.3 9.4 6.6 7.6 3.4 3.2 5.9 5.7 6.2 7.6 5.4 7.0 6.916.0–17.9 . . . . . . . . . . . . . . . 7.4 8.1 8.2 8.4 6.7 8.7 10.0 6.7 6.2 6.8 7.0 9.1 7.518.0–19.9 . . . . . . . . . . . . . . . 8.8 7.1 6.1 10.1 17.2 8.2 8.5 6.8 5.9 9.7 11.5 9.9 9.420.0–24.9 . . . . . . . . . . . . . . . 19.9 9.9 26.8 20.0 21.5 18.0 15.1 16.0 18.2 19.2 21.4 23.1 26.425.0–29.9 . . . . . . . . . . . . . . . 15.2 19.2 18.1 21.3 10.2 19.7 15.0 15.7 12.8 15.4 17.7 13.9 14.630.0–39.9 . . . . . . . . . . . . . . . 17.4 6.4 10.8 10.2 16.4 14.5 17.5 21.4 20.6 15.4 14.5 18.7 17.440.0–49.9 . . . . . . . . . . . . . . . 5.3 1.4 2.7 0.4 4.1 5.1 7.0 6.5 8.6 4.0 5.8 3.0 4.050.0–74.9 . . . . . . . . . . . . . . . 2.8 1.1 0.6 0.3 2.8 1.6 4.3 3.9 3.8 3.9 1.0 2.3 1.775.0 and more . . . . . . . . . . . . 0.3 0.0 0.0 0.8 0.0 0.0 0.0 0.6 0.7 0.0 0.0 0.0 0.3
Non-Hispanic blackTotal . . . . . . . . . . . . . . . . . . 100.0 100.0 100.0 100.0 100.0 100.0 100.0 100.0 100.0 100.0 100.0 100.0 100.0
Less than 5.0 . . . . . . . . . . . . 1.9 3.7 1.4 0.0 0.8 2.0 2.1 2.4 2.5 3.6 0.7 0.0 0.65.0–9.9 . . . . . . . . . . . . . . . . 10.2 15.9 9.6 5.9 11.1 5.9 14.3 13.3 9.8 11.7 8.9 3.6 7.410.0–11.9 . . . . . . . . . . . . . . . 5.6 7.3 3.5 6.4 3.2 7.6 8.5 6.7 5.1 5.5 3.0 4.6 5.912.0–13.9 . . . . . . . . . . . . . . . 6.6 9.2 8.1 5.5 5.6 8.4 8.9 6.2 7.3 6.1 6.2 6.1 2.214.0–15.9 . . . . . . . . . . . . . . . 9.4 6.1 9.8 8.8 8.5 11.9 9.3 7.0 10.5 14.1 8.4 7.4 6.116.0–17.9 . . . . . . . . . . . . . . . 8.0 9.3 11.2 8.7 6.1 6.1 4.6 7.8 8.1 8.5 11.0 9.6 6.918.0–19.9 . . . . . . . . . . . . . . . 9.0 11.2 10.5 11.7 12.7 7.3 8.0 8.7 6.1 8.6 8.3 9.3 16.220.0–24.9 . . . . . . . . . . . . . . . 19.3 16.0 23.1 22.8 26.7 24.1 15.7 13.9 17.7 17.2 21.8 27.0 22.425.0–29.9 . . . . . . . . . . . . . . . 13.7 9.6 11.8 18.0 10.8 15.2 11.9 13.1 13.1 12.7 15.7 18.6 15.630.0–39.9 . . . . . . . . . . . . . . . 12.2 10.6 9.8 8.9 12.9 9.9 12.7 15.3 13.6 8.8 11.5 12.0 14.040.0–49.9 . . . . . . . . . . . . . . . 3.0 0.6 1.2 2.5 1.6 1.2 1.7 4.3 5.0 2.4 3.7 1.4 2.850.0–74.9 . . . . . . . . . . . . . . . 0.8 0.6 0.0 0.6 0.0 0.4 2.4 1.2 1.1 0.8 0.6 0.4 0.075.0 and more . . . . . . . . . . . . 0.0 0.0 0.0 0.0 0.0 0.0 0.0 0.2 0.0 0.0 0.2 0.0 0.0
Mexican AmericanTotal . . . . . . . . . . . . . . . . . . 100.0 100.0 100.0 100.0 100.0 100.0 100.0 100.0 100.0 100.0 100.0 100.0 100.0
Less than 5.0 . . . . . . . . . . . . 2.8 7.9 1.3 0.5 0.5 1.0 2.5 2.6 3.0 7.7 2.0 0.7 1.05.0–9.9 . . . . . . . . . . . . . . . . 8.8 15.4 11.7 7.6 9.0 11.0 13.7 6.8 9.8 9.7 2.7 3.0 4.210.0–11.9 . . . . . . . . . . . . . . . 5.3 8.2 6.2 5.0 4.8 4.3 5.1 5.9 5.0 5.3 4.5 4.1 5.012.0–13.9 . . . . . . . . . . . . . . . 7.5 9.9 7.8 10.1 6.7 10.7 8.0 7.2 6.0 7.4 4.7 7.2 7.314.0–15.9 . . . . . . . . . . . . . . . 8.1 7.7 8.6 5.3 14.6 9.6 8.4 7.7 7.9 6.2 8.2 7.3 5.616.0–17.9 . . . . . . . . . . . . . . . 8.6 7.0 7.2 8.4 13.9 3.5 8.0 8.9 7.6 8.8 16.4 6.0 9.418.0–19.9 . . . . . . . . . . . . . . . 7.4 10.3 9.2 7.0 6.2 4.2 7.1 5.9 7.7 7.0 10.9 9.2 14.020.0–24.9 . . . . . . . . . . . . . . . 19.0 15.5 19.9 27.2 16.2 22.4 16.1 17.6 18.7 18.5 18.3 23.6 16.225.0–29.9 . . . . . . . . . . . . . . . 14.0 9.4 15.3 12.6 14.1 16.9 12.3 13.8 14.0 9.2 15.6 22.0 20.630.0–39.9 . . . . . . . . . . . . . . . 12.8 5.7 8.8 12.8 11.6 11.3 15.1 14.1 13.7 13.3 13.4 12.5 13.240.0–49.9 . . . . . . . . . . . . . . . 4.3 1.8 3.5 2.4 2.2 1.8 3.1 7.2 5.1 6.1 2.4 2.9 3.150.0–74.9 . . . . . . . . . . . . . . . 1.3 1.3 0.5 1.0 0.0 3.3 0.7 2.0 1.2 1.0 0.8 1.6 0.475.0 and more . . . . . . . . . . . . 0.1 0.0 0.0 0.0 0.0 0.0 0.0 0.4 0.1 0.0 0.0 0.0 0.0
0.0 Quantity more than zero but less than 0.05.1Includes all other race/ethnic groups not listed separately.
NOTE: Numbers may not add to totals because of rounding.
Page 150 [ Series 11, No. 247

Table 115. Percent distribution of erythrocyte protoporphyrin in microgram per deciliter of red blood cells for persons 1 year and over, byrace/ethnicity and age: United States, 1988–94
Race/ethnicity andselected erythrocyte
protoporphyrin cutoffs1 year
and over1–2
years3–5
years6–8
years9–11years
12–14years
15–19years
20–29years
30–39years
40–49years
50–59years
60–69years
70 yearsand over
All race/ethnic groups1
Total . . . . . . . . . . . . . . . . . . 100.0 100.0 100.0 100.0 100.0 100.0 100.0 100.0 100.0 100.0 100.0 100.0 100.0
Less than 30 . . . . . . . . . . . . . 4.2 1.4 4.7 4.7 4.0 5.0 7.1 4.9 5.2 3.4 3.8 2.4 2.230–39 . . . . . . . . . . . . . . . . . 29.1 16.8 30.6 28.8 28.3 27.9 32.3 35.6 32.2 28.9 27.5 24.0 18.140–49 . . . . . . . . . . . . . . . . . 32.2 29.2 33.0 38.4 32.4 34.8 31.7 31.3 32.0 32.0 34.1 32.6 28.250–59 . . . . . . . . . . . . . . . . . 17.5 22.5 18.7 15.8 20.8 18.7 15.4 14.5 15.3 17.3 18.0 20.6 22.460–69 . . . . . . . . . . . . . . . . . 8.4 12.9 6.6 7.8 7.6 6.9 7.1 7.8 7.8 8.3 7.6 9.5 12.370–79 . . . . . . . . . . . . . . . . . 3.5 6.3 3.6 2.5 3.0 3.3 2.5 2.1 2.6 3.7 3.4 4.4 7.180–89 . . . . . . . . . . . . . . . . . 1.2 1.8 0.8 0.3 1.3 0.8 1.0 0.9 1.2 1.5 1.4 1.3 2.290–99 . . . . . . . . . . . . . . . . . 0.9 2.2 0.5 0.7 0.4 0.9 0.6 0.6 0.6 1.0 0.7 1.4 2.2100–149 . . . . . . . . . . . . . . . . 2.2 5.6 1.1 0.8 2.0 1.1 1.8 1.8 1.7 2.2 2.7 2.7 4.2150–199 . . . . . . . . . . . . . . . . 0.5 0.6 0.1 0.2 0.1 0.2 0.3 0.3 0.7 0.8 0.3 0.6 0.7200–299 . . . . . . . . . . . . . . . . 0.3 0.5 0.2 0.0 0.0 0.3 0.1 0.1 0.4 0.5 0.3 0.5 0.3300 and more . . . . . . . . . . . . 0.1 0.2 0.0 0.0 0.0 0.0 0.1 0.1 0.2 0.3 0.1 0.1 0.2
Non-Hispanic white
Total . . . . . . . . . . . . . . . . . . 100.0 100.0 100.0 100.0 100.0 100.0 100.0 100.0 100.0 100.0 100.0 100.0 100.0
Less than 30 . . . . . . . . . . . . . 4.5 1.9 6.6 5.5 4.8 5.8 6.8 5.2 5.8 3.7 4.0 2.3 2.330–39 . . . . . . . . . . . . . . . . . 30.6 20.9 36.7 30.7 32.1 29.8 34.8 37.8 33.9 31.6 28.1 24.1 17.940–49 . . . . . . . . . . . . . . . . . 33.2 30.7 33.9 42.3 32.7 36.3 33.5 32.3 33.5 32.0 35.5 34.4 28.450–59 . . . . . . . . . . . . . . . . . 16.9 23.0 15.4 13.5 19.9 17.4 14.9 14.1 14.1 17.5 16.9 20.4 22.560–69 . . . . . . . . . . . . . . . . . 7.9 12.1 4.6 6.2 6.3 6.1 6.0 7.4 7.6 7.8 7.3 8.5 12.470–79 . . . . . . . . . . . . . . . . . 2.9 4.3 1.9 1.2 1.9 2.7 2.0 1.5 2.1 2.5 3.5 3.8 7.080–89 . . . . . . . . . . . . . . . . . 1.0 1.0 0.1 0.0 1.6 0.0 0.3 0.5 1.0 1.3 1.1 1.0 2.290–99 . . . . . . . . . . . . . . . . . 0.7 1.3 0.3 0.0 0.1 0.6 0.3 0.2 0.5 0.8 0.3 1.5 2.0100–149 . . . . . . . . . . . . . . . . 1.7 4.6 0.4 0.6 0.5 0.8 1.2 0.9 1.1 1.7 2.6 2.6 4.1150–199 . . . . . . . . . . . . . . . . 0.4 0.0 0.0 0.0 0.0 0.2 0.2 0.1 0.3 0.7 0.3 0.6 0.7200–299 . . . . . . . . . . . . . . . . 0.2 0.2 0.2 0.0 0.0 0.4 0.0 0.0 0.1 0.2 0.4 0.6 0.2300 and more . . . . . . . . . . . . 0.1 0.0 0.0 0.0 0.0 0.0 0.0 0.0 0.1 0.2 0.2 0.1 0.2
Non-Hispanic black
Total . . . . . . . . . . . . . . . . . . 100.0 100.0 100.0 100.0 100.0 100.0 100.0 100.0 100.0 100.0 100.0 100.0 100.0
Less than 30 . . . . . . . . . . . . . 5.1 1.3 3.5 5.5 5.0 5.9 12.0 6.7 3.7 3.6 4.0 4.1 2.130–39 . . . . . . . . . . . . . . . . . 32.3 15.4 31.7 31.9 28.8 33.4 37.2 37.2 35.8 28.9 33.5 27.3 23.640–49 . . . . . . . . . . . . . . . . . 30.2 29.9 32.7 33.7 36.6 36.9 27.1 27.9 29.5 29.8 28.0 28.8 31.550–59 . . . . . . . . . . . . . . . . . 15.3 21.5 19.1 18.1 15.5 11.8 10.2 12.4 13.4 17.4 15.8 20.6 21.560–69 . . . . . . . . . . . . . . . . . 7.5 11.3 8.3 5.6 8.9 5.3 5.6 7.4 7.3 8.3 7.8 9.1 7.170–79 . . . . . . . . . . . . . . . . . 3.4 7.9 2.2 2.5 2.4 2.7 2.6 3.1 2.6 4.0 4.0 3.5 6.280–89 . . . . . . . . . . . . . . . . . 1.2 2.4 0.5 0.7 0.7 1.2 1.0 0.6 0.9 1.4 2.8 2.4 1.490–99 . . . . . . . . . . . . . . . . . 0.8 1.1 0.3 0.1 0.0 0.8 0.8 0.6 1.0 1.3 1.1 0.6 1.3100–149 . . . . . . . . . . . . . . . . 2.6 7.2 1.3 1.3 1.2 1.1 2.3 2.6 3.4 2.2 2.5 2.7 3.6150–199 . . . . . . . . . . . . . . . . 0.7 0.9 0.2 0.3 0.7 0.8 0.4 0.7 0.9 1.2 0.4 0.5 0.6200–299 . . . . . . . . . . . . . . . . 0.5 0.8 0.1 0.2 0.0 0.0 0.5 0.6 0.6 1.2 0.2 0.3 1.0300 and more . . . . . . . . . . . . 0.4 0.4 0.2 0.0 0.2 0.1 0.2 0.3 0.9 0.9 0.0 0.2 0.2
Mexican American
Total . . . . . . . . . . . . . . . . . . 100.0 100.0 100.0 100.0 100.0 100.0 100.0 100.0 100.0 100.0 100.0 100.0 100.0
Less than 30 . . . . . . . . . . . . . 2.2 0.5 0.8 2.4 0.6 1.7 2.9 3.6 2.2 2.0 2.0 0.8 1.030–39 . . . . . . . . . . . . . . . . . 18.3 6.2 15.1 16.0 13.4 9.7 18.3 23.9 20.2 18.4 21.7 19.6 17.640–49 . . . . . . . . . . . . . . . . . 28.1 20.1 24.8 30.9 27.6 32.8 31.5 28.1 28.3 29.0 27.4 25.9 20.150–59 . . . . . . . . . . . . . . . . . 22.4 23.3 30.4 21.9 26.7 29.9 21.0 19.2 20.4 19.6 22.5 23.0 27.660–69 . . . . . . . . . . . . . . . . . 12.5 17.9 14.2 14.0 15.4 14.9 11.7 10.8 12.5 10.0 9.4 13.1 14.270–79 . . . . . . . . . . . . . . . . . 7.1 11.9 8.2 9.3 9.1 5.3 5.6 6.6 7.2 6.2 4.7 9.4 6.680–89 . . . . . . . . . . . . . . . . . 2.2 3.7 2.2 2.2 0.8 2.0 2.5 2.0 2.0 2.3 2.5 2.5 3.290–99 . . . . . . . . . . . . . . . . . 1.4 2.9 1.1 1.5 1.9 1.0 0.5 1.6 1.1 1.4 2.5 0.7 1.2100–149 . . . . . . . . . . . . . . . . 4.3 8.8 3.1 1.7 4.1 2.6 4.2 3.4 3.9 7.1 5.1 3.8 6.8150–199 . . . . . . . . . . . . . . . . 0.8 1.4 0.1 0.2 0.5 0.0 1.1 0.5 1.0 1.2 1.7 0.5 1.2200–299 . . . . . . . . . . . . . . . . 0.6 1.8 0.0 0.0 0.0 0.0 0.4 0.2 1.1 2.1 0.0 0.2 0.2300 and more . . . . . . . . . . . . 0.3 1.5 0.0 0.1 0.0 0.0 0.3 0.1 0.1 0.7 0.6 0.4 0.3
0.0 Quantity more than zero but less than 0.05.1Includes all other race/ethnic groups not listed separately.
NOTE: Numbers may not add to totals because of rounding.
Series 11, No. 247 [ Page 151

Table 116. Percent distribution of erythrocyte protoporphyrin in microgram per deciliter of red blood cells for males 1 year and over, byrace/ethnicity and age: United States, 1988–94
Race/ethnicity andselected erythrocyte
protoporphyrin cutoffs1 year
and over1–2
years3–5
years6–8
years9–11years
12–14years
15–19years
20–29years
30–39years
40–49years
50–59years
60–69years
70 yearsand over
All race/ethnic groups1
Total . . . . . . . . . . . . . . . . . . 100.0 100.0 100.0 100.0 100.0 100.0 100.0 100.0 100.0 100.0 100.0 100.0 100.0
Less than 30 . . . . . . . . . . . . . 6.5 1.8 5.5 4.9 4.2 6.1 11.5 8.4 8.2 6.0 6.5 2.5 3.930–39 . . . . . . . . . . . . . . . . . 38.3 15.7 32.6 29.0 29.0 31.4 44.0 49.5 44.8 38.6 36.3 33.7 24.640–49 . . . . . . . . . . . . . . . . . 32.6 31.0 30.8 36.6 32.9 39.1 31.9 29.2 33.5 34.0 33.6 31.6 29.950–59 . . . . . . . . . . . . . . . . . 12.8 23.5 17.7 15.8 19.8 16.1 7.6 8.0 8.3 13.6 13.4 16.3 18.660–69 . . . . . . . . . . . . . . . . . 5.2 12.9 6.8 8.7 7.6 3.1 3.2 3.6 3.7 4.1 4.2 7.9 9.670–79 . . . . . . . . . . . . . . . . . 1.9 5.8 3.7 2.7 4.2 1.6 1.2 0.5 0.6 1.2 2.7 2.7 4.380–89 . . . . . . . . . . . . . . . . . 0.6 1.1 0.8 0.2 1.1 0.4 0.4 0.3 0.1 0.4 1.2 0.5 2.090–99 . . . . . . . . . . . . . . . . . 0.6 1.6 0.6 0.8 0.1 1.0 0.0 0.0 0.3 1.0 0.1 2.0 1.6100–149 . . . . . . . . . . . . . . . . 1.2 5.3 1.1 1.2 0.9 1.2 0.3 0.4 0.5 0.7 1.9 1.6 4.2150–199 . . . . . . . . . . . . . . . . 0.2 0.2 0.0 0.0 0.2 0.1 0.0 0.0 0.1 0.2 0.0 0.7 0.8200–299 . . . . . . . . . . . . . . . . 0.1 0.9 0.2 0.0 0.0 0.0 0.0 0.0 0.0 0.0 0.1 0.5 0.2300 and more . . . . . . . . . . . . 0.1 0.2 0.1 0.0 0.0 0.0 0.0 0.0 0.0 0.2 0.0 0.1 0.2
Non-Hispanic white
Total . . . . . . . . . . . . . . . . . . 100.0 100.0 100.0 100.0 100.0 100.0 100.0 100.0 100.0 100.0 100.0 100.0 100.0
Less than 30 . . . . . . . . . . . . . 6.9 2.4 7.6 5.8 5.1 6.9 10.4 9.1 8.8 6.4 6.8 2.4 4.130–39 . . . . . . . . . . . . . . . . . 39.8 18.8 39.0 29.0 32.7 33.1 45.7 52.2 46.0 40.5 38.3 33.8 24.140–49 . . . . . . . . . . . . . . . . . 33.0 34.3 31.9 42.0 34.8 40.1 33.4 28.3 34.3 32.8 33.4 32.8 30.050–59 . . . . . . . . . . . . . . . . . 11.7 23.4 14.0 13.3 16.7 15.5 6.3 6.5 6.3 14.0 11.6 16.5 18.860–69 . . . . . . . . . . . . . . . . . 4.7 12.0 4.6 7.1 6.2 1.2 2.3 3.3 3.7 3.5 4.2 7.1 9.870–79 . . . . . . . . . . . . . . . . . 1.5 4.1 1.8 1.8 2.9 1.1 1.6 0.3 0.5 0.7 2.7 2.1 4.280–89 . . . . . . . . . . . . . . . . . 0.4 0.6 0.0 0.0 1.1 0.0 0.4 0.0 0.0 0.3 1.1 0.3 2.290–99 . . . . . . . . . . . . . . . . . 0.6 0.3 0.4 0.0 0.0 1.0 0.0 0.0 0.3 0.9 0.0 2.1 1.4100–149 . . . . . . . . . . . . . . . . 1.0 3.6 0.4 1.1 0.5 1.0 0.0 0.3 0.3 0.6 1.6 1.6 4.1150–199 . . . . . . . . . . . . . . . . 0.1 0.0 0.0 0.0 0.0 0.0 0.0 0.0 0.0 0.0 0.0 0.8 0.9200–299 . . . . . . . . . . . . . . . . 0.1 0.4 0.3 0.0 0.0 0.0 0.0 0.0 0.0 0.0 0.1 0.5 0.2300 and more . . . . . . . . . . . . 0.1 0.0 0.0 0.0 0.0 0.0 0.0 0.0 0.0 0.3 0.0 0.0 0.2
Non-Hispanic black
Total . . . . . . . . . . . . . . . . . . 100.0 100.0 100.0 100.0 100.0 100.0 100.0 100.0 100.0 100.0 100.0 100.0 100.0
Less than 30 . . . . . . . . . . . . . 7.9 1.8 4.3 5.9 4.8 7.6 19.8 11.7 6.0 6.1 6.9 4.9 2.030–39 . . . . . . . . . . . . . . . . . 42.9 14.8 32.5 37.5 30.4 34.8 52.5 54.8 50.7 43.8 38.8 36.6 31.440–49 . . . . . . . . . . . . . . . . . 30.0 28.7 31.6 31.1 36.3 36.2 22.2 24.4 30.2 34.4 31.0 31.3 33.550–59 . . . . . . . . . . . . . . . . . 10.3 21.1 18.9 18.6 13.7 8.3 3.8 6.1 7.2 9.0 12.3 12.5 16.260–69 . . . . . . . . . . . . . . . . . 4.5 11.7 8.1 4.8 8.5 4.9 1.1 1.5 3.6 4.1 4.7 7.9 6.370–79 . . . . . . . . . . . . . . . . . 1.5 7.7 2.1 1.0 3.3 2.8 0.0 0.4 0.6 0.7 2.8 0.7 3.680–89 . . . . . . . . . . . . . . . . . 0.7 2.2 0.5 0.0 1.4 0.7 0.2 0.0 0.1 1.2 1.9 1.6 0.590–99 . . . . . . . . . . . . . . . . . 0.3 1.4 0.2 0.0 0.0 1.7 0.0 0.2 0.2 0.0 0.3 0.2 0.9100–149 . . . . . . . . . . . . . . . . 1.4 8.2 1.1 0.8 0.6 1.9 0.3 0.9 1.0 0.5 0.5 3.4 4.5150–199 . . . . . . . . . . . . . . . . 0.3 0.4 0.2 0.0 0.9 0.7 0.0 0.0 0.4 0.2 0.4 0.0 0.3200–299 . . . . . . . . . . . . . . . . 0.2 1.3 0.0 0.3 0.0 0.0 0.0 0.0 0.2 0.0 0.4 0.6 0.3300 and more . . . . . . . . . . . . 0.1 0.7 0.4 0.0 0.2 0.3 0.0 0.0 0.0 0.0 0.0 0.4 0.5
Mexican American
Total . . . . . . . . . . . . . . . . . . 100.0 100.0 100.0 100.0 100.0 100.0 100.0 100.0 100.0 100.0 100.0 100.0 100.0
Less than 30 . . . . . . . . . . . . . 3.6 0.4 0.9 1.2 0.9 3.3 5.2 6.1 4.0 3.8 2.4 0.8 1.730–39 . . . . . . . . . . . . . . . . . 26.0 6.9 16.3 17.6 17.0 12.9 26.1 34.2 32.7 26.2 25.8 31.9 24.440–49 . . . . . . . . . . . . . . . . . 30.9 21.6 24.5 31.8 26.6 37.2 38.6 31.6 31.9 32.7 30.1 25.5 17.150–59 . . . . . . . . . . . . . . . . . 20.1 20.5 30.9 21.3 25.8 26.1 17.8 15.3 18.1 21.7 18.6 18.8 26.460–69 . . . . . . . . . . . . . . . . . 9.7 19.1 13.9 15.7 15.3 10.4 7.2 7.3 8.6 5.7 7.5 9.5 13.370–79 . . . . . . . . . . . . . . . . . 4.4 10.4 8.1 7.3 7.6 3.5 1.4 3.0 2.4 3.9 5.6 7.8 4.380–89 . . . . . . . . . . . . . . . . . 1.3 2.1 1.8 2.5 0.9 3.5 0.8 0.5 0.8 1.1 2.6 2.0 2.990–99 . . . . . . . . . . . . . . . . . 0.7 1.3 1.8 0.8 1.2 1.0 0.0 0.2 0.4 0.8 1.3 0.3 1.0100–149 . . . . . . . . . . . . . . . . 2.6 12.1 1.8 1.5 4.0 2.3 2.5 1.5 0.8 3.1 4.5 1.7 8.7150–199 . . . . . . . . . . . . . . . . 0.4 1.7 0.0 0.2 0.7 0.0 0.5 0.2 0.2 0.6 0.4 0.6 0.0200–299 . . . . . . . . . . . . . . . . 0.2 2.7 0.0 0.0 0.0 0.0 0.0 0.0 0.0 0.3 0.0 0.2 0.2300 and more . . . . . . . . . . . . 0.2 1.2 0.0 0.1 0.0 0.0 0.0 0.0 0.0 0.0 1.3 0.8 0.0
0.0 Quantity more than zero but less than 0.05.1Includes all other race/ethnic groups not listed separately.
NOTE: Numbers may not add to totals because of rounding.
Page 152 [ Series 11, No. 247

Table 117. Percent distribution of erythrocyte protoporphyrin in microgram per deciliter of red blood cells for females 1 year and over, byrace/ethnicity and age: United States, 1988–94
Race/ethnicity andselected erythrocyte
protoporphyrin cutoffs1 year
and over1–2
years3–5
years6–8
years9–11years
12–14years
15–19years
20–29years
30–39years
40–49years
50–59years
60–69years
70 yearsand over
All race/ethnic groups1
Total . . . . . . . . . . . . . . . . . . 100.0 100.0 100.0 100.0 100.0 100.0 100.0 100.0 100.0 100.0 100.0 100.0 100.0
Less than 30 . . . . . . . . . . . . . 2.0 1.0 3.9 4.6 3.8 3.7 2.7 1.4 2.2 0.9 1.3 2.3 1.230–39 . . . . . . . . . . . . . . . . . 20.3 17.9 28.6 28.5 27.6 24.1 20.7 21.9 19.8 19.7 19.3 15.7 13.840–49 . . . . . . . . . . . . . . . . . 31.8 27.2 35.3 40.4 31.8 30.1 31.5 33.5 30.4 30.2 34.6 33.5 27.150–59 . . . . . . . . . . . . . . . . . 21.9 21.4 19.7 15.7 21.7 21.7 23.3 20.9 22.2 20.8 22.3 24.2 24.960–69 . . . . . . . . . . . . . . . . . 11.3 12.9 6.4 6.9 7.7 11.0 10.9 12.0 11.9 12.3 10.8 10.8 14.170–79 . . . . . . . . . . . . . . . . . 4.9 6.7 3.5 2.1 1.9 5.3 3.8 3.7 4.7 6.2 4.1 5.9 8.980–89 . . . . . . . . . . . . . . . . . 1.8 2.4 0.9 0.4 1.5 1.2 1.6 1.5 2.2 2.5 1.6 2.0 2.290–99 . . . . . . . . . . . . . . . . . 1.2 3.0 0.4 0.5 0.6 0.9 1.2 1.1 1.0 1.0 1.2 0.9 2.5100–149 . . . . . . . . . . . . . . . . 3.2 6.1 1.1 0.5 3.2 1.0 3.3 3.1 2.9 3.7 3.5 3.6 4.1150–199 . . . . . . . . . . . . . . . . 0.8 0.9 0.1 0.4 0.1 0.4 0.6 0.5 1.4 1.5 0.6 0.5 0.6200–299 . . . . . . . . . . . . . . . . 0.5 0.2 0.1 0.0 0.0 0.5 0.2 0.2 0.8 0.9 0.5 0.5 0.4300 and more . . . . . . . . . . . . 0.2 0.2 0.0 0.0 0.0 0.0 0.1 0.1 0.3 0.4 0.2 0.1 0.2
Non-Hispanic white
Total . . . . . . . . . . . . . . . . . . 100.0 100.0 100.0 100.0 100.0 100.0 100.0 100.0 100.0 100.0 100.0 100.0 100.0
Less than 30 . . . . . . . . . . . . . 2.2 1.3 5.6 5.1 4.5 4.6 3.2 1.5 2.7 0.9 1.4 2.2 1.130–39 . . . . . . . . . . . . . . . . . 21.8 23.2 34.1 32.8 31.6 25.6 23.7 24.0 21.5 22.6 18.6 15.6 13.840–49 . . . . . . . . . . . . . . . . . 33.4 26.6 36.1 42.7 30.8 31.6 33.6 36.1 32.6 31.3 37.4 35.7 27.350–59 . . . . . . . . . . . . . . . . . 21.9 22.6 16.8 13.7 23.1 19.8 23.7 21.4 22.2 21.1 21.8 23.8 25.060–69 . . . . . . . . . . . . . . . . . 10.9 12.1 4.7 5.1 6.3 12.0 9.8 11.4 11.6 12.2 10.1 9.8 14.270–79 . . . . . . . . . . . . . . . . . 4.1 4.4 2.0 0.6 0.9 4.7 2.4 2.6 3.7 4.3 4.3 5.4 8.980–89 . . . . . . . . . . . . . . . . . 1.5 1.5 0.2 0.0 2.1 0.0 0.2 0.9 2.1 2.3 1.1 1.6 2.190–99 . . . . . . . . . . . . . . . . . 0.8 2.5 0.1 0.0 0.3 0.0 0.7 0.5 0.7 0.7 0.5 1.0 2.4100–149 . . . . . . . . . . . . . . . . 2.4 5.8 0.4 0.0 0.5 0.5 2.4 1.5 1.9 2.8 3.5 3.5 4.1150–199 . . . . . . . . . . . . . . . . 0.6 0.0 0.0 0.0 0.0 0.4 0.4 0.3 0.6 1.5 0.5 0.5 0.6200–299 . . . . . . . . . . . . . . . . 0.3 0.0 0.0 0.0 0.0 0.9 0.0 0.0 0.2 0.4 0.6 0.6 0.3300 and more . . . . . . . . . . . . 0.1 0.0 0.0 0.0 0.0 0.0 0.0 0.0 0.1 0.0 0.3 0.1 0.2
Non-Hispanic black
Total . . . . . . . . . . . . . . . . . . 100.0 100.0 100.0 100.0 100.0 100.0 100.0 100.0 100.0 100.0 100.0 100.0 100.0
Less than 30 . . . . . . . . . . . . . 2.7 0.8 2.8 5.2 5.1 4.5 4.1 2.4 1.8 1.7 1.5 3.6 2.230–39 . . . . . . . . . . . . . . . . . 23.3 15.9 30.8 26.3 27.1 32.1 21.8 22.3 23.7 17.1 29.1 20.7 18.640–49 . . . . . . . . . . . . . . . . . 30.4 31.1 33.7 36.2 37.0 37.5 32.0 30.8 28.9 26.1 25.6 27.0 30.150–59 . . . . . . . . . . . . . . . . . 19.6 21.9 19.3 17.5 17.4 14.8 16.6 17.7 18.5 24.0 18.6 26.3 24.960–69 . . . . . . . . . . . . . . . . . 10.1 10.9 8.5 6.5 9.4 5.6 10.0 12.5 10.4 11.6 10.4 10.0 7.670–79 . . . . . . . . . . . . . . . . . 4.9 8.2 2.3 3.9 1.4 2.6 5.3 5.4 4.2 6.6 4.9 5.5 7.980–89 . . . . . . . . . . . . . . . . . 1.6 2.5 0.4 1.5 0.0 1.6 1.9 1.1 1.5 1.5 3.5 3.0 2.090–99 . . . . . . . . . . . . . . . . . 1.2 0.8 0.4 0.3 0.0 0.0 1.6 0.9 1.8 2.3 1.7 0.8 1.6100–149 . . . . . . . . . . . . . . . . 3.6 6.2 1.5 1.9 1.8 0.5 4.4 4.0 5.4 3.5 4.1 2.2 3.1150–199 . . . . . . . . . . . . . . . . 1.0 1.4 0.2 0.6 0.4 0.9 0.9 1.2 1.3 1.9 0.4 0.8 0.7200–299 . . . . . . . . . . . . . . . . 0.8 0.3 0.2 0.0 0.0 0.0 1.0 1.1 0.8 2.2 0.0 0.0 1.4300 and more . . . . . . . . . . . . 0.6 0.0 0.0 0.0 0.3 0.0 0.4 0.6 1.7 1.6 0.0 0.0 0.0
Mexican American
Total . . . . . . . . . . . . . . . . . . 100.0 100.0 100.0 100.0 100.0 100.0 100.0 100.0 100.0 100.0 100.0 100.0 100.0
Less than 30 . . . . . . . . . . . . . 0.7 0.7 0.7 3.7 0.2 0.4 0.2 0.5 0.3 0.0 1.6 0.9 0.430–39 . . . . . . . . . . . . . . . . . 10.1 5.4 13.9 14.4 9.3 7.0 9.6 10.8 6.5 10.1 17.7 9.9 11.040–49 . . . . . . . . . . . . . . . . . 25.1 18.5 25.1 30.1 28.7 29.0 23.5 23.7 24.5 25.1 24.8 26.3 22.950–59 . . . . . . . . . . . . . . . . . 24.8 26.3 29.9 22.5 27.6 33.2 24.6 24.0 22.9 17.4 26.3 26.4 28.760–69 . . . . . . . . . . . . . . . . . 15.4 16.5 14.5 12.3 15.5 18.8 16.7 15.3 16.7 14.6 11.2 16.0 15.170–79 . . . . . . . . . . . . . . . . . 10.1 13.4 8.3 11.1 10.7 6.8 10.4 11.0 12.4 8.7 3.9 10.7 8.880–89 . . . . . . . . . . . . . . . . . 3.1 5.3 2.6 1.8 0.8 0.8 4.4 3.8 3.2 3.5 2.4 2.9 3.590–99 . . . . . . . . . . . . . . . . . 2.1 4.6 0.5 2.1 2.7 1.0 1.1 3.3 1.8 2.0 3.6 1.0 1.3100–149 . . . . . . . . . . . . . . . . 6.0 5.4 4.3 1.8 4.2 2.9 6.2 5.9 7.3 11.4 5.6 5.4 4.9150–199 . . . . . . . . . . . . . . . . 1.2 1.1 0.1 0.2 0.2 0.0 1.8 1.0 1.9 1.9 2.9 0.4 2.4200–299 . . . . . . . . . . . . . . . . 1.0 0.9 0.1 0.0 0.0 0.0 0.9 0.4 2.3 4.0 0.0 0.1 0.3300 and more . . . . . . . . . . . . 0.4 1.8 0.0 0.0 0.0 0.0 0.6 0.3 0.2 1.3 0.0 0.0 0.6
0.0 Quantity more than zero but less than 0.05.1Includes all other race/ethnic groups not listed separately.
NOTE: Numbers may not add to totals because of rounding.
Series 11, No. 247 [ Page 153

Table 118. Percent distribution of serum ferritin in nanogram per milliliter for persons 1 year and over, by race/ethnicity and age:United States, 1988–94
Race/ethnicity andselected serumferritin cutoffs
1 yearand over
1–2years
3–5years
6–8years
9–11years
12–14years
15–19years
20–29years
30–39years
40–49years
50–59years
60–69years
70 yearsand over
All race/ethnic groups1
Total . . . . . . . . . . . . . . . . . . 100.0 100.0 100.0 100.0 100.0 100.0 100.0 100.0 100.0 100.0 100.0 100.0 100.0
Less than 10 . . . . . . . . . . . . . 3.7 12.9 2.7 0.9 2.1 4.0 5.7 4.1 4.5 5.7 1.3 1.1 0.810–15 . . . . . . . . . . . . . . . . . 4.8 17.5 11.2 7.0 5.5 6.2 5.6 4.0 4.6 5.8 2.1 1.1 2.316–25 . . . . . . . . . . . . . . . . . 11.8 31.1 31.0 28.9 22.6 25.7 16.0 10.6 7.3 9.0 5.8 3.2 3.726–50 . . . . . . . . . . . . . . . . . 22.6 31.1 43.0 46.6 49.4 44.4 35.4 20.6 16.5 14.8 11.6 12.3 13.851–100 . . . . . . . . . . . . . . . . 22.8 6.3 11.1 15.2 19.2 16.6 27.8 28.0 24.7 18.9 24.7 24.9 26.2101–250 . . . . . . . . . . . . . . . . 25.1 1.1 1.1 1.3 1.2 2.5 8.7 28.7 31.1 31.1 37.5 38.0 37.4251–500 . . . . . . . . . . . . . . . . 7.6 0.1 0.0 0.0 0.0 0.2 0.7 3.7 9.8 11.9 14.1 15.2 12.3501–999 . . . . . . . . . . . . . . . . 1.4 0.0 0.0 0.0 0.0 0.0 0.0 0.2 1.4 2.5 2.6 3.7 2.81,000 and more . . . . . . . . . . . 0.2 0.0 0.0 0.0 0.0 0.4 0.0 0.0 0.1 0.3 0.3 0.6 0.7
Non-Hispanic white
Total . . . . . . . . . . . . . . . . . . 100.0 100.0 100.0 100.0 100.0 100.0 100.0 100.0 100.0 100.0 100.0 100.0 100.0
Less than 10 . . . . . . . . . . . . . 3.0 12.0 1.5 1.0 2.8 3.1 4.5 3.3 3.3 5.1 1.4 1.2 0.810–15 . . . . . . . . . . . . . . . . . 4.5 17.6 11.8 7.1 5.2 5.2 5.2 3.9 4.5 5.1 2.2 1.2 2.416–25 . . . . . . . . . . . . . . . . . 11.5 33.0 34.2 31.9 23.4 27.4 16.2 10.7 7.0 8.4 6.2 3.4 3.826–50 . . . . . . . . . . . . . . . . . 22.0 30.7 40.8 44.9 49.2 45.4 35.6 21.7 16.5 15.8 12.5 12.5 14.151–100 . . . . . . . . . . . . . . . . 23.7 5.5 11.2 14.0 18.7 15.6 29.6 28.8 26.9 19.3 25.4 25.3 26.8101–250 . . . . . . . . . . . . . . . . 26.0 1.3 0.5 1.1 0.6 2.4 8.5 27.8 31.5 31.9 36.7 38.0 37.0251–500 . . . . . . . . . . . . . . . . 7.8 0.0 0.0 0.0 0.0 0.2 0.5 3.5 9.2 12.0 13.4 14.5 12.0501–999 . . . . . . . . . . . . . . . . 1.3 0.0 0.0 0.0 0.0 0.0 0.0 0.2 1.0 2.4 2.0 3.5 2.61,000 and more . . . . . . . . . . . 0.2 0.0 0.0 0.0 0.0 0.6 0.0 0.0 0.1 0.1 0.2 0.4 0.6
Non-Hispanic black
Total . . . . . . . . . . . . . . . . . . 100.0 100.0 100.0 100.0 100.0 100.0 100.0 100.0 100.0 100.0 100.0 100.0 100.0
Less than 10 . . . . . . . . . . . . . 4.4 9.8 1.8 0.6 1.1 4.1 7.7 6.1 5.3 6.7 0.6 0.6 1.110–15 . . . . . . . . . . . . . . . . . 4.6 14.1 7.4 1.9 3.1 6.1 6.2 5.4 3.9 5.3 1.8 0.7 0.616–25 . . . . . . . . . . . . . . . . . 11.5 32.3 22.3 20.8 18.1 17.8 15.5 10.2 8.3 7.9 1.5 2.7 2.926–50 . . . . . . . . . . . . . . . . . 23.4 32.6 50.5 47.3 46.6 44.7 30.3 18.7 16.5 12.7 7.8 7.5 8.751–100 . . . . . . . . . . . . . . . . 21.1 9.7 14.0 26.0 27.2 21.7 27.6 24.8 19.5 17.6 18.6 18.7 20.7101–250 . . . . . . . . . . . . . . . . 23.8 1.1 3.9 3.1 3.6 5.3 12.0 28.7 31.5 30.5 40.1 42.8 40.4251–500 . . . . . . . . . . . . . . . . 8.6 0.4 0.1 0.0 0.2 0.1 0.6 5.5 12.2 13.4 22.3 20.5 17.2501–999 . . . . . . . . . . . . . . . . 2.4 0.0 0.0 0.2 0.0 0.2 0.1 0.5 2.7 5.0 6.8 5.9 6.01,000 and more . . . . . . . . . . . 0.3 0.0 0.1 0.0 0.0 0.0 0.0 0.0 0.2 0.8 0.5 0.7 2.4
Mexican American
Total . . . . . . . . . . . . . . . . . . 100.0 100.0 100.0 100.0 100.0 100.0 100.0 100.0 100.0 100.0 100.0 100.0 100.0
Less than 10 . . . . . . . . . . . . . 6.2 21.5 6.3 1.4 1.3 6.2 9.0 6.0 6.2 8.6 2.9 1.5 0.910–15 . . . . . . . . . . . . . . . . . 7.7 20.2 12.3 13.7 6.1 16.9 7.6 5.5 5.8 4.7 2.6 2.5 2.516–25 . . . . . . . . . . . . . . . . . 15.1 27.1 31.6 26.0 27.3 24.8 19.7 8.8 8.8 9.9 6.8 3.7 8.226–50 . . . . . . . . . . . . . . . . . 24.8 24.4 39.8 47.2 47.4 38.3 33.8 18.2 17.3 12.1 9.3 13.3 17.551–100 . . . . . . . . . . . . . . . . 20.0 5.4 9.1 11.0 16.4 12.6 21.2 28.3 20.5 18.7 25.6 26.2 25.7101–250 . . . . . . . . . . . . . . . . 20.2 1.3 0.8 0.7 1.5 1.2 8.5 28.7 29.2 32.5 40.3 38.0 32.6251–500 . . . . . . . . . . . . . . . . 5.1 0.0 0.1 0.0 0.0 0.0 0.2 4.0 10.2 11.5 9.4 12.5 10.6501–999 . . . . . . . . . . . . . . . . 0.9 0.0 0.0 0.0 0.0 0.0 0.0 0.5 1.8 2.0 2.9 1.2 1.91,000 and more . . . . . . . . . . . 0.1 0.1 0.0 0.0 0.0 0.0 0.0 0.0 0.2 0.1 0.3 1.2 0.1
0.0 Quantity more than zero but less than 0.05.1Includes all other race/ethnic groups not listed separately.
NOTE: Numbers may not add to totals because of rounding.
Page 154 [ Series 11, No. 247

Table 119. Percent distribution of serum ferritin in nanogram per milliliter for males 1 year and over, by race/ethnicity and age:United States, 1988–94
Race/ethnicity andselected serumferritin cutoffs
1 yearand over
1–2years
3–5years
6–8years
9–11years
12–14years
15–19years
20–29years
30–39years
40–49years
50–59years
60–69years
70 yearsand over
All race/ethnic groups1
Total . . . . . . . . . . . . . . . . . . 100.0 100.0 100.0 100.0 100.0 100.0 100.0 100.0 100.0 100.0 100.0 100.0 100.0
Less than 10 . . . . . . . . . . . . . 1.0 13.9 3.2 1.0 1.8 1.2 0.1 0.2 0.3 0.5 0.2 1.2 0.510–15 . . . . . . . . . . . . . . . . . 2.5 21.5 12.9 6.2 3.4 4.5 1.1 0.3 0.9 1.5 0.3 1.0 1.816–25 . . . . . . . . . . . . . . . . . 7.8 31.1 33.7 32.0 20.7 25.4 8.7 2.2 0.9 2.1 3.4 1.3 1.826–50 . . . . . . . . . . . . . . . . . 15.9 27.4 39.0 47.9 52.1 45.8 33.7 7.1 3.5 6.1 5.1 7.6 11.051–100 . . . . . . . . . . . . . . . . 21.9 5.3 10.1 11.2 21.1 19.2 40.0 31.9 21.0 15.6 19.3 19.9 23.2101–250 . . . . . . . . . . . . . . . . 36.1 0.8 1.1 1.6 1.0 3.9 15.0 51.0 52.1 48.8 45.7 40.9 38.3251–500 . . . . . . . . . . . . . . . . 12.3 0.0 0.0 0.0 0.0 0.0 1.4 6.9 18.5 21.0 21.1 21.4 17.9501–999 . . . . . . . . . . . . . . . . 2.3 0.0 0.0 0.0 0.0 0.1 0.0 0.4 2.6 4.0 4.5 6.2 4.81,000 and more . . . . . . . . . . . 0.2 0.0 0.0 0.0 0.0 0.0 0.0 0.0 0.1 0.5 0.5 0.4 0.7
Non-Hispanic white
Total . . . . . . . . . . . . . . . . . . 100.0 100.0 100.0 100.0 100.0 100.0 100.0 100.0 100.0 100.0 100.0 100.0 100.0
Less than 10 . . . . . . . . . . . . . 0.9 12.9 2.0 1.2 2.6 0.9 0.0 0.3 0.3 0.5 0.1 1.3 0.510–15 . . . . . . . . . . . . . . . . . 2.4 22.6 14.6 6.9 4.1 4.4 0.8 0.3 1.1 1.3 0.2 1.0 1.916–25 . . . . . . . . . . . . . . . . . 7.3 31.9 37.4 33.0 20.4 26.3 8.3 1.5 1.0 2.4 3.9 1.2 1.726–50 . . . . . . . . . . . . . . . . . 14.9 28.2 34.7 47.3 52.4 47.0 32.9 7.6 3.3 6.2 5.2 7.5 11.351–100 . . . . . . . . . . . . . . . . 22.2 3.5 10.4 10.0 19.9 16.9 42.7 32.6 22.0 15.5 20.6 20.3 23.7101–250 . . . . . . . . . . . . . . . . 37.3 0.9 0.9 1.5 0.6 4.4 14.4 50.7 53.2 50.0 44.6 41.5 37.9251–500 . . . . . . . . . . . . . . . . 12.7 0.0 0.0 0.0 0.0 0.0 0.9 6.6 17.5 20.5 21.1 21.1 18.1501–999 . . . . . . . . . . . . . . . . 2.1 0.0 0.0 0.0 0.0 0.0 0.0 0.4 1.6 3.5 3.9 5.8 4.41,000 and more . . . . . . . . . . . 0.2 0.0 0.0 0.0 0.0 0.0 0.0 0.0 0.2 0.2 0.4 0.3 0.6
Non-Hispanic blackTotal . . . . . . . . . . . . . . . . . . 100.0 100.0 100.0 100.0 100.0 100.0 100.0 100.0 100.0 100.0 100.0 100.0 100.0
Less than 10 . . . . . . . . . . . . . 1.1 12.7 2.1 0.2 0.5 2.7 0.0 0.0 0.5 0.2 0.4 1.4 1.110–15 . . . . . . . . . . . . . . . . . 1.8 15.5 7.1 2.2 1.0 3.3 1.8 0.2 0.7 0.0 0.9 1.2 0.316–25 . . . . . . . . . . . . . . . . . 7.9 31.6 25.3 27.3 15.1 18.3 9.3 0.6 1.0 1.1 0.5 2.8 3.426–50 . . . . . . . . . . . . . . . . . 19.0 30.4 51.8 48.7 50.3 45.4 30.3 6.9 4.9 3.9 6.2 4.4 4.751–100 . . . . . . . . . . . . . . . . 21.1 9.1 11.4 17.8 29.6 25.3 38.2 29.0 16.4 15.2 11.5 14.8 18.6101–250 . . . . . . . . . . . . . . . . 31.4 0.5 2.4 3.4 3.5 4.6 19.1 51.8 47.3 42.0 41.4 37.0 40.1251–500 . . . . . . . . . . . . . . . . 13.6 0.0 0.0 0.0 0.0 0.0 1.2 10.6 23.5 26.6 29.8 29.2 17.8501–999 . . . . . . . . . . . . . . . . 3.8 0.0 0.0 0.3 0.0 0.4 0.1 0.8 5.6 9.3 8.4 8.8 11.41,000 and more . . . . . . . . . . . 0.4 0.0 0.0 0.0 0.0 0.0 0.0 0.0 0.0 1.8 1.1 0.3 2.6
Mexican American
Total . . . . . . . . . . . . . . . . . . 100.0 100.0 100.0 100.0 100.0 100.0 100.0 100.0 100.0 100.0 100.0 100.0 100.0
Less than 10 . . . . . . . . . . . . . 2.1 22.5 7.2 2.0 0.4 2.8 1.0 0.1 0.4 0.9 0.9 1.5 0.410–15 . . . . . . . . . . . . . . . . . 4.4 23.6 13.3 13.0 5.4 12.6 3.2 0.5 0.1 0.5 2.3 2.4 4.316–25 . . . . . . . . . . . . . . . . . 10.1 27.4 31.3 27.4 28.4 25.2 12.5 0.9 1.0 1.8 2.8 1.0 4.726–50 . . . . . . . . . . . . . . . . . 19.8 19.0 39.6 45.7 48.1 42.7 34.2 10.1 5.6 5.7 6.8 9.6 17.351–100 . . . . . . . . . . . . . . . . 22.6 6.3 7.8 11.2 16.6 15.0 34.5 34.3 20.2 19.3 22.6 22.1 21.2101–250 . . . . . . . . . . . . . . . . 30.8 1.1 0.6 0.7 1.1 1.7 14.4 46.7 50.5 47.4 44.6 40.8 35.2251–500 . . . . . . . . . . . . . . . . 8.5 0.0 0.2 0.0 0.0 0.0 0.3 6.4 18.6 20.4 14.5 18.3 14.4501–999 . . . . . . . . . . . . . . . . 1.5 0.0 0.0 0.0 0.0 0.0 0.0 0.9 3.2 3.8 5.0 2.6 2.31,000 and more . . . . . . . . . . . 0.2 0.0 0.0 0.0 0.0 0.0 0.0 0.0 0.4 0.1 0.6 1.7 0.3
0.0 Quantity more than zero but less than 0.05.1Includes all other race/ethnic groups not listed separately.
NOTE: Numbers may not add to totals because of rounding.
Series 11, No. 247 [ Page 155

Table 120. Percent distribution of serum ferritin in nanogram per milliliter for females 1 year and over, by race/ethnicity and age:United States, 1988–94
Race/ethnicity andselected serumferritin cutoffs
1 yearand over
1–2years
3–5years
6–8years
9–11years
12–14years
15–19years
20–29years
30–39years
40–49years
50–59years
60–69years
70 yearsand over
All race/ethnic groups1
Total . . . . . . . . . . . . . . . . . . 100.0 100.0 100.0 100.0 100.0 100.0 100.0 100.0 100.0 100.0 100.0 100.0 100.0
Less than 10 . . . . . . . . . . . . . 6.2 11.8 2.1 0.7 2.5 7.0 11.4 8.0 8.7 10.6 2.4 1.1 0.910–15 . . . . . . . . . . . . . . . . . 7.1 13.0 9.3 8.0 7.6 8.1 10.0 7.7 8.3 9.8 3.9 1.2 2.616–25 . . . . . . . . . . . . . . . . . 15.7 31.1 28.1 25.4 24.5 26.1 23.4 18.9 13.7 15.5 8.0 4.7 5.026–50 . . . . . . . . . . . . . . . . . 28.9 35.2 47.1 45.1 46.8 42.8 37.1 33.9 29.4 23.2 17.7 16.3 15.651–100 . . . . . . . . . . . . . . . . 23.6 7.3 12.3 19.7 17.3 13.8 15.7 24.3 28.4 22.0 29.8 29.1 28.2101–250 . . . . . . . . . . . . . . . . 14.6 1.5 1.1 1.0 1.4 1.0 2.4 6.6 10.2 14.1 29.7 35.5 36.7251–500 . . . . . . . . . . . . . . . . 3.1 0.1 0.0 0.0 0.1 0.4 0.0 0.6 1.0 3.3 7.5 9.8 8.6501–999 . . . . . . . . . . . . . . . . 0.6 0.0 0.0 0.0 0.0 0.0 0.0 0.0 0.3 1.2 0.9 1.5 1.41,000 and more . . . . . . . . . . . 0.2 0.0 0.0 0.0 0.0 0.9 0.0 0.0 0.0 0.2 0.1 0.7 0.8
Non-Hispanic white
Total . . . . . . . . . . . . . . . . . . 100.0 100.0 100.0 100.0 100.0 100.0 100.0 100.0 100.0 100.0 100.0 100.0 100.0
Less than 10 . . . . . . . . . . . . . 5.1 11.0 0.9 0.7 3.0 5.6 9.1 6.3 6.4 9.7 2.6 1.1 1.010–15 . . . . . . . . . . . . . . . . . 6.5 12.0 8.8 7.3 6.3 6.2 9.8 7.3 8.0 8.9 4.2 1.3 2.716–25 . . . . . . . . . . . . . . . . . 15.5 34.2 30.7 30.6 26.3 28.6 24.4 19.5 13.2 14.5 8.4 5.2 5.226–50 . . . . . . . . . . . . . . . . . 28.9 33.5 47.5 42.0 46.1 43.6 38.3 35.2 30.3 25.6 19.4 16.9 16.051–100 . . . . . . . . . . . . . . . . 25.2 7.7 12.1 18.8 17.5 14.0 16.1 25.3 32.1 23.1 30.1 29.7 28.8101–250 . . . . . . . . . . . . . . . . 15.1 1.6 0.1 0.6 0.7 0.0 2.4 5.8 9.0 13.5 29.2 34.9 36.5251–500 . . . . . . . . . . . . . . . . 3.1 0.0 0.0 0.0 0.0 0.5 0.0 0.6 0.6 3.4 6.0 8.9 8.0501–999 . . . . . . . . . . . . . . . . 0.5 0.0 0.0 0.0 0.0 0.0 0.0 0.0 0.3 1.3 0.1 1.4 1.41,000 and more . . . . . . . . . . . 0.2 0.0 0.0 0.0 0.0 1.4 0.0 0.0 0.0 0.0 0.1 0.5 0.6
Non-Hispanic black
Total . . . . . . . . . . . . . . . . . . 100.0 100.0 100.0 100.0 100.0 100.0 100.0 100.0 100.0 100.0 100.0 100.0 100.0
Less than 10 . . . . . . . . . . . . . 7.2 6.9 1.4 1.0 1.7 5.2 15.4 11.3 9.1 11.9 0.8 0.0 1.110–15 . . . . . . . . . . . . . . . . . 6.9 12.6 7.7 1.7 5.3 8.5 10.7 10.0 6.6 9.6 2.5 0.3 0.816–25 . . . . . . . . . . . . . . . . . 14.6 33.0 19.3 14.5 21.2 17.3 21.6 18.4 14.1 13.4 2.4 2.5 2.626–50 . . . . . . . . . . . . . . . . . 27.2 34.7 49.2 46.0 42.8 44.1 30.4 28.8 25.9 19.7 9.1 9.6 11.451–100 . . . . . . . . . . . . . . . . 21.1 10.3 16.6 34.0 24.8 18.7 17.1 21.2 21.9 19.5 24.4 21.3 22.0101–250 . . . . . . . . . . . . . . . . 17.3 1.7 5.4 2.8 3.8 5.9 4.9 8.9 18.7 21.4 39.0 46.9 40.7251–500 . . . . . . . . . . . . . . . . 4.3 0.7 0.2 0.0 0.4 0.2 0.0 1.1 3.1 3.0 16.3 14.4 16.8501–999 . . . . . . . . . . . . . . . . 1.1 0.0 0.0 0.0 0.0 0.0 0.0 0.3 0.3 1.6 5.5 3.9 2.41,000 and more . . . . . . . . . . . 0.3 0.0 0.2 0.0 0.0 0.0 0.0 0.0 0.3 0.0 0.0 1.0 2.3
Mexican American
Total . . . . . . . . . . . . . . . . . . 100.0 100.0 100.0 100.0 100.0 100.0 100.0 100.0 100.0 100.0 100.0 100.0 100.0
Less than 10 . . . . . . . . . . . . . 10.7 20.5 5.3 0.9 2.3 9.1 18.0 13.5 12.5 16.7 4.8 1.5 1.310–15 . . . . . . . . . . . . . . . . . 11.1 16.7 11.3 14.4 6.9 20.5 12.6 12.0 12.0 9.0 2.8 2.6 0.716–25 . . . . . . . . . . . . . . . . . 20.5 26.8 31.8 24.6 26.0 24.5 27.7 18.8 17.3 18.5 10.7 5.8 11.826–50 . . . . . . . . . . . . . . . . . 30.0 29.8 40.0 48.7 46.7 34.6 33.4 28.4 29.9 18.9 11.7 16.2 17.751–100 . . . . . . . . . . . . . . . . 17.2 4.5 10.5 10.8 16.1 10.6 6.3 20.7 20.7 18.1 28.4 29.4 30.1101–250 . . . . . . . . . . . . . . . . 8.9 1.6 1.0 0.7 1.9 0.7 1.8 5.8 6.2 16.6 36.2 35.8 29.9251–500 . . . . . . . . . . . . . . . . 1.4 0.0 0.0 0.0 0.0 0.0 0.2 0.9 1.1 2.1 4.5 8.0 6.9501–999 . . . . . . . . . . . . . . . . 0.2 0.0 0.0 0.0 0.0 0.0 0.0 0.0 0.3 0.2 0.9 0.0 1.51,000 and more . . . . . . . . . . . 0.0 0.1 0.0 0.0 0.0 0.0 0.0 0.0 0.0 0.0 0.0 0.7 0.0
0.0 Quantity more than zero but less than 0.05.1Includes all other race/ethnic groups not listed separately.
NOTE: Numbers may not add to totals because of rounding.
Page 156 [ Series 11, No. 247

Vital and Health Statisticsseries descriptions
SERIES 1. Programs and Collection Procedures—These reportsdescribe the data collection programs of the National Centerfor Health Statistics. They include descriptions of the methodsused to collect and process the data, definitions, and othermaterial necessary for understanding the data.
SERIES 2. Data Evaluation and Methods Research—These reportsare studies of new statistical methods and include analyticaltechniques, objective evaluations of reliability of collecteddata, and contributions to statistical theory. These studiesalso include experimental tests of new survey methods andcomparisons of U.S. methodology with those of othercountries.
SERIES 3. Analytical and Epidemiological Studies—These reportspresent analytical or interpretive studies based on vital andhealth statistics. These reports carry the analyses further thanthe expository types of reports in the other series.
SERIES 4. Documents and Committee Reports—These are finalreports of major committees concerned with vital and healthstatistics and documents such as recommended model vitalregistration laws and revised birth and death certificates.
SERIES 5. International Vital and Health Statistics Reports—Thesereports are analytical or descriptive reports that compare U.S.vital and health statistics with those of other countries orpresent other international data of relevance to the healthstatistics system of the United States.
SERIES 6. Cognition and Survey Measurement—These reports arefrom the National Laboratory for Collaborative Research inCognition and Survey Measurement. They use methods ofcognitive science to design, evaluate, and test surveyinstruments.
SERIES 10. Data From the National Health Interview Survey—Thesereports contain statistics on illness; unintentional injuries;disability; use of hospital, medical, and other health services;and a wide range of special current health topics coveringmany aspects of health behaviors, health status, and healthcare utilization. They are based on data collected in acontinuing national household interview survey.
SERIES 11. Data From the National Health Examination Survey, theNational Health and Nutrition Examination Surveys, andthe Hispanic Health and Nutrition Examination Survey—Data from direct examination, testing, and measurement onrepresentative samples of the civilian noninstitutionalizedpopulation provide the basis for (1) medically defined totalprevalence of specific diseases or conditions in the UnitedStates and the distributions of the population with respect tophysical, physiological, and psychological characteristics, and(2) analyses of trends and relationships among variousmeasurements and between survey periods.
SERIES 12. Data From the Institutionalized Population Surveys—Discontinued in 1975. Reports from these surveys areincluded in Series 13.
SERIES 13. Data From the National Health Care Survey—Thesereports contain statistics on health resources and the public’suse of health care resources including ambulatory, hospital,and long-term care services based on data collected directlyfrom health care providers and provider records.
SERIES 14. Data on Health Resources: Manpower and Facilities—Discontinued in 1990. Reports on the numbers, geographicdistribution, and characteristics of health resources are nowincluded in Series 13.
SERIES 15. Data From Special Surveys—These reports containstatistics on health and health-related topics collected inspecial surveys that are not part of the continuing datasystems of the National Center for Health Statistics.
SERIES 16. Compilations of Advance Data From Vital and HealthStatistics—Advance Data Reports provide early release ofinformation from the National Center for Health Statistics’health and demographic surveys. They are compiled in theorder in which they are published. Some of these releasesmay be followed by detailed reports in Series 10–13.
SERIES 20. Data on Mortality—These reports contain statistics onmortality that are not included in regular, annual, or monthlyreports. Special analyses by cause of death, age, otherdemographic variables, and geographic and trend analysesare included.
SERIES 21. Data on Natality, Marriage, and Divorce—These reportscontain statistics on natality, marriage, and divorce that arenot included in regular, annual, or monthly reports. Specialanalyses by health and demographic variables andgeographic and trend analyses are included.
SERIES 22. Data From the National Mortality and Natality Surveys—Discontinued in 1975. Reports from these sample surveys,based on vital records, are now published in Series 20 or 21.
SERIES 23. Data From the National Survey of Family Growth—Thesereports contain statistics on factors that affect birth rates,including contraception, infertility, cohabitation, marriage,divorce, and remarriage; adoption; use of medical care forfamily planning and infertility; and related maternal and infanthealth topics. These statistics are based on national surveysof women of childbearing age.
SERIES 24. Compilations of Data on Natality, Mortality, Marriage, andDivorce—These include advance reports of births, deaths,marriages, and divorces based on final data from the NationalVital Statistics System that were published as National VitalStatistics Reports (NVSR), formerly Monthly Vital StatisticsReport. These reports provide highlights and summaries ofdetailed data subsequently published in Vital Statistics of theUnited States. Other special reports published here provideselected findings based on final data from the National VitalStatistics System and may be followed by detailed reports inSeries 20 or 21.
For answers to questions about this report or for a list of reports publishedin these series, contact:
Data Dissemination BranchNational Center for Health StatisticsCenters for Disease Control and Prevention3311 Toledo Road, Room 5412Hyattsville, MD 20782
1-866-441-NCHS (6247)E-mail: [email protected]: www.cdc.gov/nchs

U.S. DEPARTMENT OFHEALTH & HUMAN SERVICES
Centers for Disease Control and PreventionNational Center for Health Statistics3311 Toledo RoadHyattsville, Maryland 20782
DHHS Publication No. (PHS) 2005-1697, Series 11, No. 24704-0557 (03/05)
MEDIA MAILPOSTAGE & FEES PAID
CDC/NCHSPERMIT NO. G-284
FOLD FOLDSPINE
COVER 4PRINTER: ADJUST SPINE TO FIT
PRINTER:
POSITIVE ART FOR BACK COVER (cover 4): PRINT SOLID PMS
NEGATIVE ART FOR FRONT COVER (cover 1): PRINT SOLID PMS