helsinki university of technology mba programs · found applicable for valuation of biotechnology...
TRANSCRIPT

1
Helsinki University of Technology
MBA Programs
Margita Engström
REAL OPTION MODEL FOR VALUATION OF BIOTECHNOLOGY COMPANIES
Thesis submitted in partial fulfillment of the requirements of the MBA Program
Espoo, September 14, 2001
SUPERVISOR
Tomi Laamanen
Professor of Strategy and International Business
INSTRUCTORS
Saila Miettinen-Lähde Investment Banking, D. Carnegie Ab
Janne Aura Investment Banking, D. Carnegie
Mika Naumanen
Helsinki University of Technology

2
Helsinki University of Technology
MBA Programs
Abstract of the MBA Thesis
REAL OPTION MODEL FOR VALUATION OF BIOTECHNOLOGY COMPANIES
Margita Engström, Master of Science in Engineering Espoo, September 11, 2001
Number of pages
124
Supervisor Tomi Laamanen, Professor of Strategy and International Business
Instructors
Saila-Miettinen-Lähde, D. Carnegie Ab, Investment banking Janne Aura, D. Carnegie Ab, Investment banking
Mika Naumanen, Helsinki University of Technology
The purpose of this study was to apply a real option framework to valuation of biotechnology companies. The
study identified the weakness of traditional valuation methods as applied to immature industries to be the over-emphasis on risk and the inflexibility to act rationally as new information is acquired. Real option was
found applicable for valuation of biotechnology companies, as the analogy to financial options of the right but not the obligation to exercise was identified in development projects. Real options have been applied in
valuation of biotechnology companies and they are likely to add significant value due to high volatility and
long times to maturity.
The real option model produce was based on the binomial lattice methodology. The typical development project of a biotechnology company is analogous to an American financial call option. The portfolio of assets
could be modeled as an American or European call option in order to incorporate the realized effects (i.e. the volatility) on the market of similar (i.e. replicating) companies hence not only focusing on asset volatility. In
order to identify the effect of continuously compoundness a Black-Scholes valuation is applied. All real option
valuation methods described above were applied to case valuation of a typical biotechnology company.
The volatility parameter estimated in the study was calculated to be 82% based on the replicating portfolio method, which is used for ROV of the portfolio of assets. The volatility of individual asset, i.e. the revenue
distribution of asset was estimated out of the Decision Tree analysis and varied from 18…23% depending on
asset. The risk free interest rate was of today 5,06% and the time to maturity varied from 4…6 years depending on the drug development project.
The value of the company as of DCF were found to be 276,7 mEUR. The study identified an additional option
value of 73,6 mEUR based on individual valuations of each asset in comparison to the traditional discounted cash flow valuation. The Black-Scholes method results in an additional ROV of 1,31, which is the result of
underestimation of volatility effect. The valuation based on the portfolio of asset resulted in very similar
valuations as the corresponding base case valuations (0…3%), which is illustrating the effect on volatility on company value. The high volatility results in low asset values that are resulting from several subsequent
downward changes in asset value.
ROV add value to the valuation process. The main advantages of real option valuations are the quantification
of strategic value and a deep understanding of critical financial decisions that the company face.

3
ACKNOWLEDGEMENTS
I wish my to express my greatest gratitude to Saila Miettinen-Lähde at D. Carnegie Ab for giving me this challenging opportunity to such an interesting title for the thesis. I also am very grateful for her most
valuable input to the thesis and for her trust in me. I also wish to thank Janne Aura for his insights on the problems of valuation and for him sharing his experience on valuation.
Finally, I want to thank the supervising professor Tomi Laamanen and researcher Mika Naumanen for their valuable input and courage they have given me in order to complete the challenge of real option modeling.

1. INTRODUCTION 7
1.1 BACKGROUND INFORMATION 7
1.2 RESEARCH PROBLEM 7
1.3 OBJECTIVES OF THE STUDY 7
1.4 SCOPE OF THE STUDY 7
1.5 RESEARCH APPROACHES AND METHODS 8
2. BIOTECHNOLOGY INDUSTRY 9
2.1 THE BIOTECHNOLOGY INDUSTRY OVERLOOK 9 2.1.1 Innovation and intensive R&D 11 2.1.2 Technological pace 11 2.1.3 Uncertainty, risk and volatility 11 2.1.4 The regulatory approval process 12 2.1.5 Intellectual property rights 13
2.2 RECENT CHANGES IN THE BIOTECHNOLOGY INDUSTRY STRUCTURE 13 2.2.1 Financing 13 2.2.2 Separating from technology 15 2.2.3 The public and private financial markets for biotechnology companies 15 2.2.4 Strategic alliances 16 2.2.5 Biotechnological manufacturing capacity 17 2.2.6 The impact of size and structure as success factors of the biotechnology industry 17
2.3 BIOTECHNOLOGY INDUSTRY PROSPECTS 18 2.3.1 Technological jumps 18 2.3.2 Demographics change 20 2.3.3 Global financial markets 20 2.3.4 Technology trends affecting individuals 20 2.3.5 Trends in the biotechnology industry sector 20 2.3.6 The pharmaceutical market 21 2.3.7 Technological development affecting the industry 21
3. THEORY ON VALUATION METHODS 23
3.1 ASSETS BASED VALUATIONS OF COMPANIES 24 3.1.1 Yield capitalization method 24 3.1.2 Conclusions on valuation by accounting methods 25
3.2 MULTIPLES METHODS 25 3.2.1 P/E and P/D multiples 25 3.2.2 EBIT multiple 26 3.2.3 Free cash flow multiple 26 3.2.4 Historic and prospective multiples 26 3.2.5 Other quick methods for valuation 27 3.2.6 Conclusions on valuation by quick methods 27
3.3 DISCOUNTED CASH FLOW MODELS 28 3.3.1 Calculating the FCF’s over the explicit time horizon 28 3.3.2 Estimating the cost of capital 29 3.3.3 Calculating the continuing value (CV) 30 3.3.4 Discounting to present 31 3.3.5 Modified discounted cash flow methods (APV) 32 3.3.6 Conclusions on valuation by cash flow methods 32
3.4 DECISION ANALYSIS 33

5
4. REAL OPTIONS 34
4.1 CLASSIFICATION OF REAL OPTIONS 36 4.1.1 Real options reflect value creation due to flexibility 38 4.1.2 Advantages and disadvantages of real options 40 4.1.3 Characteristics of real options 41
4.2 REAL OPTION VALUATION FRAMEWORKS 43 4.2.1 The binominal option models 44 4.2.2 The Black-Scholes option valuation model 46 4.2.3 The Jump model 47 4.2.4 The Monte Carlo approach 47 4.2.5 Complex real option models 48 4.2.6 Real option applications 49 4.2.7 Conclusions on real option valuation 52
5. VALUATION OF BIOTECHNOLOGY COMPANIES 53
5.1 VALUATION ASPECTS IN THE BIOTECHNOLOGY INDUSTRY 54 5.1.1 Biotechnology value creation and critical success factors 54 5.1.2 Unique industry factors to be considered in valuation of biotechnology companies 55 5.1.3 Real option valuation cases in the biotechnology industry 58 5.1.4 Conclusions on factors affecting biotechnology valuation 60
5.2 ANALYSIS OF THE CASE COMPANY BIOTIE THERAPIES OYJ 62 5.2.1 The technology strategy of the case company 62 5.2.2 The market for selected target areas 63
5.3 DEVELOPING A REAL OPTION MODEL FOR VALUING A BIOTECHNOLOGY COMPANY BASED ON OPTION THEORY 64 5.3.1 Applicability of real option methodology in valuation of biotechnology companies 64 5.3.2 Assumptions for the valuation model on forecasted cash flows 66 5.3.3 Assumptions underlying the real option valuation model 67 5.3.4 The real option method applied 68
5.4 STARTING POINT FOR THE BASE CASE VALUATION 70
5.5 VALUATION OF THE CASE BIOTECHNOLOGY COMPANY WITH REAL OPTIONS 70 5.5.1 The parameters estimated for real option valuation 70 5.5.2 Variables of the replicating portfolio for estimation of company volatility 71 5.5.3 The asset volatility of a drug under development 71
6. RESULTS OF THE CASE STUDY 72
6.1 THE BASE CASE NPV VALUATION METHOD 72 6.1.1 The result of the base case valuation (NPV) 73 6.1.2 The base case valuation with Decision Tree outcomes of commercialization cash flows. 73
6.2 VALUATION OF THE COMPANY’S ASSETS BY REAL OPTION METHODOLOGY 74 6.2.1 The input variables to the valuation template 74 6.2.2 Real option valuation parameters 76 6.2.3 Derived real option parameters 77 6.2.4 The ROV of all asset individually by the binomial method as American call options 78 6.2.5 ROV of all assets individually by the Black-Scholes method 78 6.2.6 ROV of the entire portfolio of assets 79
6.3 RESULTS OF THE REAL OPTION VALUATION 80 6.3.1 Valuation of the company as the sum of the individual assets by the binomial method 80 6.3.2 Valuation of the company as the sum of the individual assets by the Black-Scholes option valuation method 80 6.3.3 Valuation of the company based on a portfolio of most probable assets values 81 6.3.4 Valuation of the company based on a portfolio of decision tree outcomes of asset values 81

6
6.3.5 Comparison of the results 82 6.4 SENSITIVITY ANALYSIS 84
6.4.1 Sensitivity with respect to the volatility parameter 84 6.4.2 Sensitivity with respect to the risk free interest rate parameter 85 6.4.3 Sensitivity with respect to the time to maturity parameter 85
6.5 RELIABILITY ANALYSIS 86
6.6 CONCLUSIONS ON REAL OPTION VALUATION 86
7. SUMMARY 88
Appendices
References
7
1. INTRODUCTION
Biotechnology is a rapidly growing industry in early stage. Valuation of biotechnology companies is difficult
because most companies still have their products in the development phase hence having no or negative revenues. The business and technology environments are highly dynamic and risky thus neither the products
nor the markets for the products exist.
1.1 Background information
Biotechnology firms include many different types of companies. In general, biotechnology firms are defined as any firm using biotechnology in R&D, manufacturing of products such as genetic products, proteins,
biopharmaceuticals, medical devices, services and bioinformatics. The biotechnology industry is characterized
as immature and highly uncertain and the main assets lie in intangibles such as knowledge and expertise. Biotechnology companies typically make huge upfront investments, opening a wide array of opportunities to
exploit the great many inventions.
Traditional valuation methods tend to overemphasize risk, as the huge array of opportunities cannot be
properly incorporated in the valuation method as the value of opportunities that are rights not obligations to take action nor do the traditional methods valuate flexibility to take action as events unfold. Real option
models properly express the uncertainty, risk, and the option to pursue from a great array of opportunities.
1.2 Research problem
Traditional valuation methods tend to focus on mature businesses and the tools used for valuation of mature
having positive revenues. The most frequently used valuation method is the discounted cash flow method, where a discount factor is used to reveal risk to return. However, this approach is not considered appropriate
for valuation of businesses that highly dynamic and immature since the same discount factor is not to be
used for products under development facing development risks and revenues from product sales associated with returns to market risk, since these risks are different. Discounted cash flow method fail also to reflect
the ability to respond to changes in technology and market, it simply assumes that the project is forecasted concerning its duration, cost and possible revenue generation once and it gives no room for management’s
flexibility. Further, high discount rates reflecting high uncertainty and risk reduces the valuation too much in
order to conduct businesses efficiently. If low valuations are obtained for biotechnology companies, the risk for them not obtaining sufficient funding to maintain a product pipeline will occur and promising development
projects might not get spotted.
1.3 Objectives of the study
The main objective of the study is to build a real option model for valuation of biotechnology companies. The study will explore and compare traditional valuation methods used for valuation of biotechnology firms such
as multiples methods, discounted cash flow methods and other net present valuations. In order to build an option model for valuation biotechnology companies, the industry and company characteristics and structure
must be analyzed properly in order to identify factors affecting valuation. These factors will be applied in a
real case valuation in order to demonstrate the applicability.
1.4 Scope of the study
The study will briefly explore different valuation methods in valuation biotechnology companies. The emphasis is on comparing the strengths and weaknesses of diverse valuation techniques in relation to real
8
option valuation. The study will focus on identifying industry specific factors affecting valuation and methods
for incorporating these into the real option valuation context.
1.5 Research approaches and methods
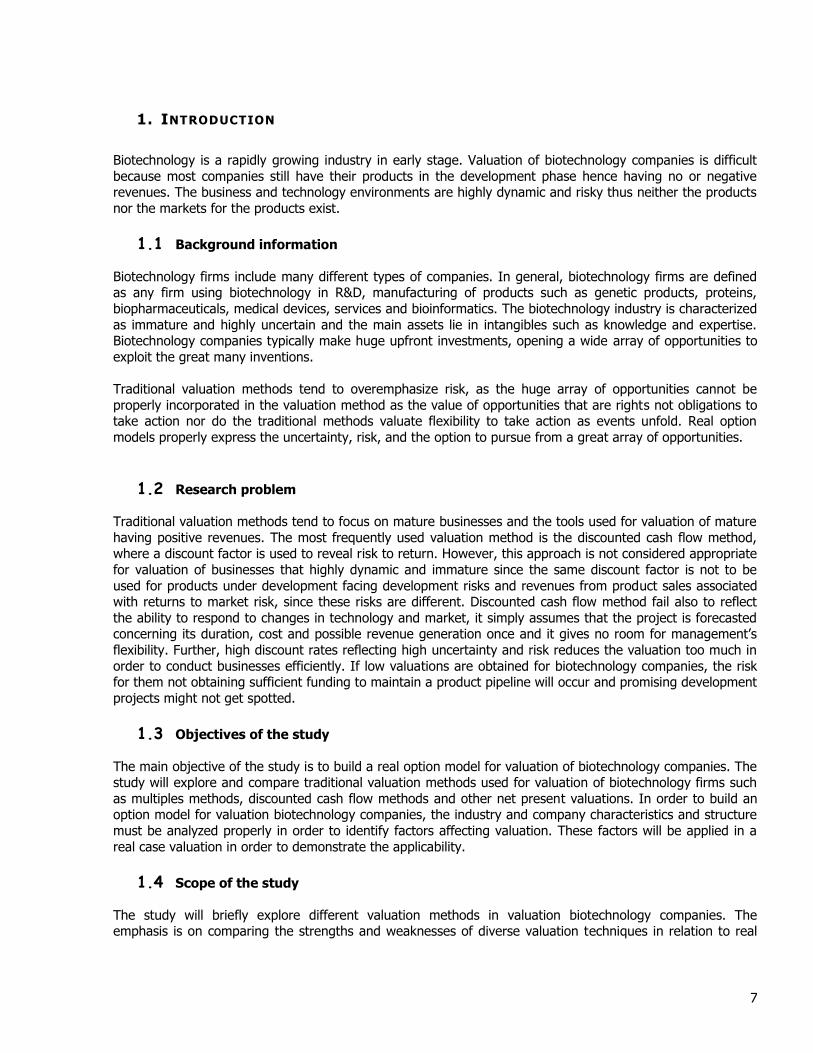
The theory part will begin with an industry analyze (chapter 2). The study will focus on identifying industry
specific characteristics. First, an overview of the latest trends in the biotechnology industry will be produced. Second, the study will explore the types of biotechnology companies operating in the main markets; USA,
Germany, United Kingdom, France and the Nordic countries. Third, the industry and company specific characteristics will be identified based on the research.
Fourth, the study will produce an overview of existing methods and tools for valuation used and assess their compatibility for valuation of biotechnology companies (chapter 3).As a result of the literature review, the
study will produce a real option model for valuation of biotechnology companies (chapter 4). The study will begin with an introduction to real options and explore how real options are used in valuations. Second, the
study will identify different types of real options compatible with the biotechnology industry. The study will make use of the analysis of the biotechnology industry from chapter 2. Finally, the option model will be
empirically compared to the most important traditional valuation method in a real case valuation.
Structure Methodology
Chapter 2
Trends and characteristics of the biotechnology industry
Chapter 3
Theory on valuation methods
of companies
Literature review
Chapter 4
Valuation of biotechnology companies
Chapter 5
An option model for valuation of biotechnology companies
Formation of
an option model based on literature reviews
Chapter 6
Case study
Empirical validation of the
model
Chapters 7,8 and 9
Results, conclusions and recommendations
Figure 1 The structure of the study.
9
2. BIOTECHNOLOGY INDUSTRY
Companies offering enabling technologies were a driver behind this increased financing. The most significant
trend in the biotechnology sector last year was "the effusion of stocks with enabling technologies," explains Eric Schmidt, analyst with SG Cowen. These technologies include functional genomics, proteomics,
bioinformatics, pharmacogenomics and directed evolution.
The general perspective of the health of the industry also affects financing to the biotechnology sector. SG
Cowen analyst Mr. Schmidt says that previously demonstrated success of biotech firms has aided in reducing the investment perception that the biotechnology industry is merely speculative. 1
2.1 The biotechnology industry overlook
So far in 2001, the healthcare services sector has replaced biotech as the darling of Wall Street's healthcare
bankers. That hardly means that the days of biotech are numbered-after all, gene research is still in its infancy, in many ways-but it does mean that capital is flowing into what has rapidly morphed into a sizzling
sector that includes hospitals, nursing homes and managed care companies, among others. The shift to
healthcare services from biotech may result in some scrambling among firms trying to assemble teams in this sector, which has largely been ignored by the Street for the past three years. Merrill Lynch & Co., Banc of
America Securities, Lehman Brothers and CIBC World Markets all report having healthcare services deals in the pipeline. Deals include standard equity and debt offerings and, increasingly, convertibles. Peter Crowley,
who runs healthcare banking at CIBC, added that specialized medical facilities for treating heart disease and orthopedic ailments, for example, are also experiencing a growth spurt, and probably will seek funding
sometime this year. The threat of economic recession and the precipitous decline in high-growth technology
stocks have increased investors' appetite for non- cyclical safe-haven stocks like healthcare services.2
The advances that are the result of genetic engineering, diagnostic techniques, and cell/tissue techniques will surely change our world and our lives. We have already observed the importance and results of biological
techniques in developing products and services that serve the needs of human health care or animal health,
agricultural productivity, food processing, renewable resources and environmental affairs.3
Biotechnology consist of a variety of applications. The medical related biotechnology sector consists of following segments:
1. Biopharmaceuticals . Companies in this segment discover and develop proteins, antibodies, and small molecules for potential drug treatments. Biotech companies have over 300 compounds in
human clinical trials, and as these products are approved in the next few years, more and more are
going to become profitable. In addition, the time required to create and test a drug will go from the current 10 to 15 years to under two years; the failure rate will drop to less than 20 percent.
2. Pharmaceutical companies starting to access biotechnology. Traditional pharmaceutical companies will do well in the next decade. Most large drug companies have formed joint ventures or
affiliations with biotech firms, to tap their capabilities. Demographics will also play a role. Aging baby
boomers will increase the demand for medicines and treatments." 3. Genomics: the study of genes and their functions. The genes involved in disease are likely to be
few in numbers. Hence the competition to discover these genes and to gain intellectual property is intense. The research on the genetic basis for diseases is intense. Many illnesses are caused is of
genetc origion or caused by genetic damage. Diseases may be treated by gene therapy (premises for
treatment of cancer) or other short genetic treatment. 4. Proteonomics: proteins decoded by the genes are usually the real targets of the therapeutics.
Consequently, the characterization of the proteins, rather than the gene, protein expression and protein function is a starting point for drug development. Many proteins (e.g. albumin, clotting
factors, insulin, enzyme replacements) are needed for medical treatment. These proteins is be produced today more cost-efficiently and of better quality by genetic engineering.

10
5. Antibodies are developed as therapeutics, diagnostics and as a tool for identification of the targets
yieled by genomics and proteomics. Antibodies is one of the most important area in biotechnology
due to their flexibility, specificity and they are not rejected by the immunity system. Monoclonal humanized antibodies are being developed (Mab) and produced by various techniques (e.g. the use
of transgenetic manufacturing cells, phage display 6. Services. Insurers, hospitals, managed care companies, and ancillary services will be profitable in
the coming year. The hospital stocks are tought to l outperform every other health care sector in
2001." 7. Medical supplies. This category includes devices that are implanted in patients, used to monitor
and diagnose conditions, or used to discover and test new drugs and gene products. 4
8. Bioinformatics. Computer science will play a key role in biotechnology development.
By matching the chemical structure to the biological activity and protein interaction and
hence producing chemical libraries the probability of drug discovery is increased.
Bioinfomatics enable faster screening technologies for genomics and proteonomics.5, 6, 7 The size of each segment can be approximated for the venture capital funding in 1999 (Figure 2).
Figure 2 Breakdown of 1999 venture financing8
At the beginning of a new century, European countries have made progress in breaking down economic and
political boundaries to enable an integrated approach to common problems. Efforts to create pan-European systems include the introduction of a single currency, the Euro, to integrate the economies as well as the
formation of regulatory boards to minimize duplication. Yet, an important question lingers: Will Europeans have access to the best health care possible, including the latest technology and prescription drugs? This
paper presents a brief overview that policymakers can use to reflect on this critical task.9
Indeed, it also means that many more biotechs will be in-licensing technologies from their smaller brethren,
which is a new role for a lot of European companies, bringing with it the prospect of a withdrawal from dependency on big pharma. However, that does not mean the pressure is off entirely. One of the biggest
developments in the European biotech industry last year was that it partially uncoupled itself from the general technology malaise that dragged the equity markets down in the latter part of 2000. 10
Health care services
and sysems
2 %
Software
17 %
Biopharmaceuticals
3 %
Communications&Net
working
21 %
Medical devices
4 %Other IT and IS
18 %
Retail and other
35 %
11
While nations demonstrate interest and motivation in systems designed to meet the needs of their citizens,
disparities in care and inefficiencies exist among European nations. This is particularly true in areas that offer the greatest potential for innovation.
Nor will there be enough capacity anytime in the near future. Fermentation and purification facilities are very
expensive, ranging from $50 million to $400 million each, and they take several years to bring on line. Its not
a cheap method of production. It's not only the equipment which must be precision-engineered to high standards, but the plant must be located in a housing which is biologically sterile and has been validated by
regulatory authorities such as FDA. Chemical synthesis plants for the production of pharmaceutical active ingredients must also be validated by regulatory authorities, but the design conditions are not as stringent as
for a biological plant. Fermentation and cell culture have proven their commercial viability; transgenics, a very different vehicle, has yet to bring a product to market. That day may not be far off, however. Based on
the types of inquiries we are getting, there is increased activity there. Companies such as PPL Therapeutics,
Pharming, and Genzyme Transgenics Corporation (GTC) all have products obtained from transgenic animals in development.11
It is clear that we have entered what is being called "the Biotechnology Century”. While biotechnology has
been around for some time—there are those who date it from the earliest production of wine and bread
10,000 years ago—the medical, agricultural, and environmental benefits of biotechnology in the years to come will be nothing like those that preceded them.
As biotechnology evolves, data management, intellectual property, and privacy issues will have to be
addressed so that the result of the product development can be realized by the public. Biotechnology is advancing rapidly, making it difficult for regulations and policies to keep up, and advances raise ethical,
political, and public concern - not unlike those faced by the nuclear industry. To be successful, public
education about biotechnology is essential.12
2.1.1 Innovation and intensive R&D
U.S-based companies have more than doubled their research and development expenditures since 1990, when collectively they spent $8.42 billion. The major pharmaceutical companies are expected to invest more
than $28 billion in research and development (R&D) in 2001.13 These sustain a rate of progress in sciences,
at the interface of biotechnology and materials research, promises plenty of exciting opportunities14. But investing wrong can be costly but it can also lead to a profitable business as one of the world's largest
biophamaceutical contractors (as an example due, in part, to a major regulatory development).15
2.1.2 Technological pace
Speed throughout the whole innovation chain is a prerequisite to success. There is no shortage of good ideas
wherever well-trained chemists and biologists are working on biocatalysis. However, the ability to convert ideas into products quickly is crucial.16
2.1.3 Uncertainty, risk and volatility
The biotechnology sector experienced significant volatility in 2000. The Nasdaq Biotechnology Index
composite dropped 18 percent in 2000. In contrast, the S&P 500 index dropped 9 percent during the same
time. The biotechnology sector did not match the volatility of Nasdaq, which dropped an unprecedented 64 percent in 2000. The Nasdaq Biotechnology Index reached its height in the first quarter of 2000 with a
trading composite of 1596.53 points. This represented a 48 percent differential between the high and low.
When investing in biotech, first recognize that the risk is heavy. Genomic businesses have no or minuscule
profits and astronomical stock valuations17. Although scientific advances offer great promise in the
12
development of new medical therapies and new ways to test and produce these products, regulators and
manufacturers acknowledge that scientific data cannot resolve all controversies. Despite increased
understanding of the function and therapeutic capacity of proteins and monoclonal antibodies it has been acknowledged that it may be difficult to anticipate the effects of product and process changes on subsequent
clinical performance.18
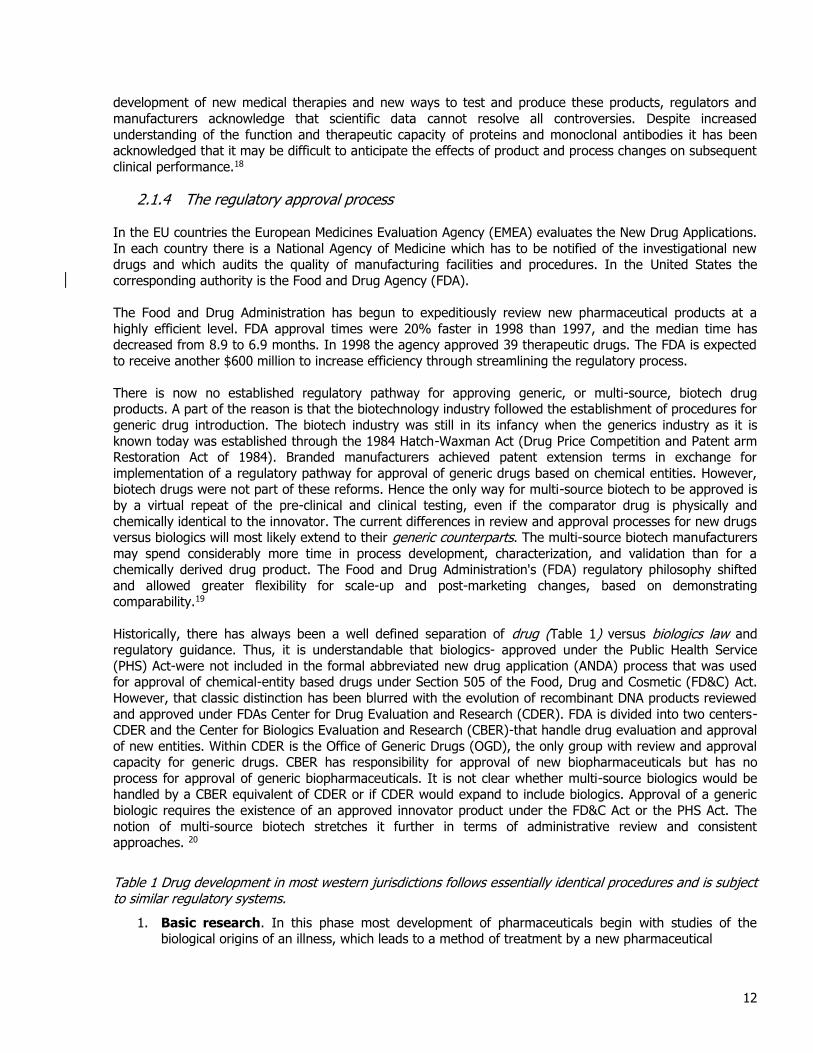
2.1.4 The regulatory approval process
In the EU countries the European Medicines Evaluation Agency (EMEA) evaluates the New Drug Applications.
In each country there is a National Agency of Medicine which has to be notified of the investigational new drugs and which audits the quality of manufacturing facilities and procedures. In the United States the
corresponding authority is the Food and Drug Agency (FDA).
The Food and Drug Administration has begun to expeditiously review new pharmaceutical products at a
highly efficient level. FDA approval times were 20% faster in 1998 than 1997, and the median time has decreased from 8.9 to 6.9 months. In 1998 the agency approved 39 therapeutic drugs. The FDA is expected
to receive another $600 million to increase efficiency through streamlining the regulatory process.
There is now no established regulatory pathway for approving generic, or multi-source, biotech drug products. A part of the reason is that the biotechnology industry followed the establishment of procedures for
generic drug introduction. The biotech industry was still in its infancy when the generics industry as it is
known today was established through the 1984 Hatch-Waxman Act (Drug Price Competition and Patent arm Restoration Act of 1984). Branded manufacturers achieved patent extension terms in exchange for
implementation of a regulatory pathway for approval of generic drugs based on chemical entities. However, biotech drugs were not part of these reforms. Hence the only way for multi-source biotech to be approved is
by a virtual repeat of the pre-clinical and clinical testing, even if the comparator drug is physically and
chemically identical to the innovator. The current differences in review and approval processes for new drugs versus biologics will most likely extend to their generic counterparts. The multi-source biotech manufacturers
may spend considerably more time in process development, characterization, and validation than for a chemically derived drug product. The Food and Drug Administration's (FDA) regulatory philosophy shifted
and allowed greater flexibility for scale-up and post-marketing changes, based on demonstrating comparability.19
Historically, there has always been a well defined separation of drug (Table 1) versus biologics law and regulatory guidance. Thus, it is understandable that biologics- approved under the Public Health Service
(PHS) Act-were not included in the formal abbreviated new drug application (ANDA) process that was used for approval of chemical-entity based drugs under Section 505 of the Food, Drug and Cosmetic (FD&C) Act.
However, that classic distinction has been blurred with the evolution of recombinant DNA products reviewed
and approved under FDAs Center for Drug Evaluation and Research (CDER). FDA is divided into two centers-CDER and the Center for Biologics Evaluation and Research (CBER)-that handle drug evaluation and approval
of new entities. Within CDER is the Office of Generic Drugs (OGD), the only group with review and approval capacity for generic drugs. CBER has responsibility for approval of new biopharmaceuticals but has no
process for approval of generic biopharmaceuticals. It is not clear whether multi-source biologics would be handled by a CBER equivalent of CDER or if CDER would expand to include biologics. Approval of a generic
biologic requires the existence of an approved innovator product under the FD&C Act or the PHS Act. The
notion of multi-source biotech stretches it further in terms of administrative review and consistent approaches. 20
Table 1 Drug development in most western jurisdictions follows essentially identical procedures and is subject to similar regulatory systems.
1. Basic research. In this phase most development of pharmaceuticals begin with studies of the biological origins of an illness, which leads to a method of treatment by a new pharmaceutical

13
2. Preclinical stage. In the preclinical phase the substance are tested in terms of their effect and their
toxicity in animal studies. Comparisons with existing treatments are made to gain an indication of the
development potential. Successful preclinical work leads to an application to begin clinical trials. The Investigational New Drug (IND) application is made to National Agency for Medicines, whereas upon
acceptance clinical trials can be initiated. 3. Clinical phase.
a. Phase I. The purpose is to identify the highest dose of the substance being tested which
can be administered to patients in phase II, without serious side effects. The trials also study how the substance is distributed and how it is metabolized. The phase I studies take
approximately 1 year. b. Phase II. The purpose of the phase II studies is to identify the relationship between a
certain dose and the negative effects to the patients. The phase II testing takes approximately 1 to 3 years.
c. Phase III. Before the phase III testing is initiated, the drug candidate has demonstrated
that the substance has the intended clinical effect and that the frequency, intensity and the nature of its side effects are acceptable in the relation to the disease intended to be treated.
In phase III it is tested that the substance has statistical significance. The phase III studies are the most time consuming and expensive phase of clinical trials.
The development of other biotechnology products can be described as analogous to the development of pharmaceuticals. The development of new products begins with a discovery type phase, resulting in a
prototype product or a product produced in tube-type scale. Next, in the development phase the product is produced in the next scale and technical and customer specifications are produced. The product is subject to
validation testing on technical performance once produced in a larger scale than the discovery phase. When the development phase is successfully completed, the product is produced in next scale-up and subject to
evaluation testing, in which the product is tested to meet up with customer’s requirements in customer
environment. Once the evaluation is completed, the product is filed for registration at the national authority.
2.1.5 Intellectual property rights
A key contributing factor to the success of the biotechnology industry is the availability of a solid platform for protection of intellectual property rights. In 1998, the EC legal Affairs Committee approved the European
Directive for Biotechnological inventions and it has been translated to the Community Patent Convention. It is
wishf7ul that the national rules will be harmonized as a pan-European biotechnology patent law would help promote the success of the biotechnology industry. 21
2.2 Recent changes in the biotechnology industry structure
From the focus on the key events of 1998 and their impact on the sector, issues in six areas define the past
year's calendar and point to possible and emerging ways forward. Accordingly, the study need to look in-depth at strategic alliances, technology trends, financing, management, newsflow, intellectual property and
ethics.
2.2.1 Financing
Biotechnology has revolutionized drug development and pushed medical stocks into a growth sprint that will
likely become a marathon. Just look at 2000, a year when the bull market ended for most sectors: Though the Standard and Poor's 500 Stock Index lost 10.2 percent and the Nasdaq plummeted a heart-stopping 39.3
percent, medical stocks gained 26.9 percent. Biotech companies are where computer-chip manufacturers
were five years ago. Continuing progress will make the health care sector the fastest growing and most profitable of the decade. Emerging markets will help boost the sector. As worldwide standards of living
increase, health care spending in less-developed countries will pick up. In general, the biotechs are better investments than the human genome concerns [which create strings of genomes to study]. Many of the

14
genomics companies have a concept, but no profits. Many biotech companies have already turned a gene
product into a tangible compound. 22
Following a record year in 2000, analysts are cautiously optimistic over biotechnology for this year. Last year
saw record financing, the largest single-day decline in valuation, and one of the largest public offerings. Although not matching last year's performance, analysts see a fairly strong investment flow into the biotech
sector. The increased confidence in the biotech industry was reflected in higher investment levels into the
sector. Total funding for 2000 tallied $31.77 billion, compared to $10.72 billion in 1999, a 196% increase. The most significant trend in the biotechnology sector last year was the effusion of stocks with enabling
technologies. The increased confidence in the biotech industry was reflected in higher investment levels into the sector. Total funding for 2000 tallied $31.77 billion, compared to $10.72 billion in 1999, a 196 percent
increase. Public financing (which includes initial public offerings, secondary public and convertible debt) accounted for 78 percent of the total amount raised. The year-over-year funding for IPOs increased 843
percent, secondary public financing increased 118 percent, and convertible debt financing increased 277
percent. Private financing also increased dramatically in 2000. Specifically, private placements increased 183 percent, and venture capital funding increased 165 percent. Partnering with large pharma increased 30
percent year-over-year. 23
Companies, which under normal circumstances would not have been able to receive financing, benefited
from the receptive climate in the investment banking community. However, the declining equity performance of the early stage companies by the end of the year caused the investment banking community to become
more cautious. The reduction of available cash will cause an. acceleration of mergers and acquisitions. Since equity and debt will be more restrictive in 2001. Investments will be redistributed to commercial-stage
biotechnology firms. Not only will investment in 2001 be channeled to the more established biotech firms, the established biotech firms will have to reprioritize their spending. 24
The current and projected financing environment will require that commercial-stage biotechnology firms redirect their development efforts away from traditional research and development spending to acquisition of
existing technologies and products. Large cap pharmaceuticals used mergers and acquisitions to expand their product and revenue base. There will be a greater number of mergers and acquisitions in the biotechnology
sector for 2001. 25
Continued growth in the European Life Sciences sector has seen revenues increase 36% to 3.7 billion euros
in 1998. But in light of this growth and the widespread uncertainty affecting the industry, the need to communicate value to investors - and society at large - must be tackled with speed and agility by biotech
companies. As findings reveal, the need to highlight and communicate value to all stakeholders - strategic
partners, the public and investors - tops the agenda. Public and political debate require dedicated engagement, and newsflow management must be a core competency for biotech companies.
This US-European difference has arisen due in part to a dramatic disparity in the level of investment in the
two industries. Comparative advantage based on resource endowments cannot explain United States (U.S.) leadership in biotechnology. Sources of heterogeneity within the process of research and development
(R&D) investment, such as international differences in the maximum per-period rate of investment and
regulatory uncertainty, offer a plausible explanation that can be incorporated into a real options approach to investment. 26 Despite the 2000 funding boom, European companies have historically been drip-fed cash,
while their US counterparts have been given sufficient funds. This allows the leaders of these organizations to focus on building the business, rather than sorting out one funding round after another or being forced to
tighten the purse strings to such an extent that they are simply left behind.27 The performance of the
European biotechnology companies 55% under-performed the Nasdaq biotechnology index in 199928.

15
2.2.2 Separating from technology
Despite a 39 percent fall in NASDAQ over the year, European biotech share indices were up 50-75 percent.
Although momentum investors will always produce wild swings, there is some evidence investor attitudes are maturing and investors are beginning to view companies in the sector as entities in their own right rather
than an amorphous group called 'biotech'. Analysts have started to apply old-fashioned criteria such as revenue growth and even profitability to the rating of many biotechs. If a company is going to be ready for
the next biotech financing window, which many public companies were not this time round, it must ensure it
has delivered along the way. 29
Whereas biotech 10 years ago may have effused a spirit of discovery with few real products, today's biotech has combined that spirit with the day-to-day management of new technologies and filling and maintaining a product pipeline. It's really a decision of where the knowhow, the skill sets, the technologies, and the
resources. For platform-based designs, it's important to have people knowledgeable about a particular class of molecules. For target-based designs, knowing all the literature in the disease area and familiarity with
animal models is more important.30
2.2.3 The public and private financial markets for biotechnology companies
One of the consequences of an opening of the IPO window, as happened in 2000, is the lowering of the hurdle to make it onto the public markets. Interestingly, the average revenue per European public bioscience
company at the start of 2000 was around 51 million. The average revenue for the IPO class of 2000 was 3
million. They have a lot of delivering to do. European biotechs are flush with cash and feeling reasonably financially secure. The risk now is that the mistakes of the nineties are repeated. The money must be used to
build the business. There is only one way this can be done and that is by pulling together all the necessary threads to build a world leading position in a chosen area. 31
Despite the fact that the biotechnology industry accessed the public markets, there are still a great number of small private companies (Table 2). This is especially true for regions not having well developed public
markets for risky and uncertain businesses. However, these small companies have increasingly accessed venture capital.
Table 2 Biotechnology industry at a glance. The financial data is based primarily on financial statements from 31st December each year. The number of companies and employees as of 31st December each year. The market capitalization is from 30th June to 30th June each year.32
$ billions Public Number of companies
Industry Total
1999 % change 1999 1998
Financial Sales 13,6 13 16,1 14,5
Revenues 18,8 13 22,3 20,2 R&D expenses 6,9 2,6 10,7 10,6 Net gain (loss) (3,1) 65,3 5,6 4,4
Industry Market capitalization 353,5 156,4 353,3 137,9
Number of companies 300 (5,1) 1273 1311 Number of employees 140000 7,5 162000 155000
Initial Public offerings The difference between the US and European Class of '96 top ten biotech IPO’s. Since IPO, the top ten
European companies raised 333 million whereas their contemporaries in the US raised 4.1 billion. There are some great European companies being formed, aimed at solving some of the most critical issues facing the
industry and we can feel proud about how much the European industry has achieved with a comparatively
small amount of funding..33, 34, 35 Equity remained the financing choice in 2000.36

16
Debt issues
The amount of convertible debt raised by the biotech sector increased 277 percent. In a market of rising
stock prices as was evident in 2000, biotech firms, generally speaking, had the latitude to issue convertible debt with a low coupon and a fixed conversion price set at a premium to its current stock price. In the short
term, this benefits the firm because of the lower interest cost associated with a lower coupon rate. In the long term, however, this could be a serious risk because cash will have to be repaid if the conversion price is
not reached. 37
Private Biotechnology Companies and Venture Capital
Within the past year, firms such as Accel Partners and Crosspoint Venture Partners have abandoned health care. But despite the industry's lackluster performance - venture-capital returns have been averaging 20% on
health-care investments, much lower than the overall private equity average of 45% - many firms continue to finance these companies, opting to hedge through diversification. The dollars invested have remained
steady, but health-care investing has become a much smaller piece of the VC pie over the last few years. Of
the total $41.5 billion in venture dollars disbursed last year, $3.5 billion (8.4%) went into medical, health and biotechnology companies - $1.4 billion of which went to biotech companies, see exhibit 10 - compared with
$3.5 billion (17.6%) in 1998 and $3.3 billion (22.9%) in 1997, according to Venture Economics Information Services (VEIS). As a result, in the last three years medical and health investments have slid to fifth place
from being the third largest sector in terms of venture dollars invested. The category now lags behind the
Internet, computer software, computer services and communications, according to VEIS. That's a far cry from the heydays of 1992 and 1994, when health care ranked behind only computer software and services
investments. Given the cyclical nature of the venture industry, firms that include health-care investing in their diversified portfolios are looking to make a comeback in the next few years. Venture capitalists can expect to
see a resurgence of interest in health care once a "blow-off" in Internet stocks takes place. Maintaining industry contacts and keeping a perspective on health care to keep up with quality deal flow. The lack of
interest in health care has also made it more difficult to create syndicates, having a harder time convincing
previous co-investors to return for new deals. Fewer health-care players, however, means less competition and a stronger position for those who remain in the game.38
2.2.4 Strategic alliances
The clearest affirmation of biotech companies' technological value is seen in their ability to attract big
pharmaceutical companies as strategic partners. Pharma companies look to the biotechnology sector to help
fill their development pipeline with potential new products and provide technology platforms. The high value of deals struck offered a viable alternative to public markets as a source of finance for biotech companies.
But companies need to ensure they understand big pharma's agenda when looking to partner their products or technology and the importance of building a pre-eminent position in their chosen field. Many of those
threads will lie within other organizations and may include cutting edge or complementary technologies,
solutions to technological challenges or maybe development capabilities not held in-house. Accessing these tools through alliances or M&A activity is vital. The number of reported alliances took a huge leap in 2000, up
by almost 55 percent on the previous year. This is an indication of how many companies are already looking to expand their networks and to co-develop, cooperate and partner their technology. The nature of these
alliances is changing also. There are far more biotech-to-biotech deals and, because of that, many of these arrangements are more genuine co-development agreements as opposed to straight licensing deals. Driven
by a need to fill a massive pipeline black hole, the big pharma companies are finding the top biotechs are
skilled in product licensing. The big pharma companies' have attempted to create their own set of entrepreneurial biotech companies by radically reorganizing their R&D functions. 39The alternative to virtual
integration through alliance networks, therefore, is real integration through Mergers & Acquisition activity.40,
41
The development of an extensive integrated network of alliances (Table 3) will provide the basis for a strong company and for growth in value as the business model develops. The question is whether this will provide
sufficiently rapid growth to keep ahead of the game. The time available for a biotech company to achieve

17
critical mass is continually shortening and the definition of critical mass is continually increasing. Biotech
companies need to run faster and jump higher than ever before. 42
Table 3 The number of deals in the biotechnology industry.43
Year Strategic alliances Sales/Supply/Distribution M&A Joint ventures Total
1999 241 75 46 20 382 1998 146 47 19 14 226 1997 170 58 39 9 276 1996 100 53 40 23 216 1995 16 86 40 74 216
2.2.5 Biotechnological manufacturing capacity
Until five years ago, the outsourcing of biopharmaceutical manufacturing had been hobbled. Whereas
traditional pharmaceuticals are overseen by FDA's Center for Drug Evaluation and Research (CDER), another branch, the Center for Biologics Evaluation and Research (CBER), is responsible for biopharmaceuticals. And
while the CDER requires a single new drug application (NDA) for a drug to be considered for approval, the CBER required two: a product license application (PLA) and an establishment (facility) license application
(ELA). Moreover, these two applications had to be filed together, and the ELA had to be submitted by the company that manufactured the product. Consequently, if the manufacturing of a biopharmaceutical was
outsourced, the contractor, not the developer, would hold its license-an unacceptable state of affairs. In
1995, FDA changed the rules, introducing the single biologics license application (BLA). So now, you could hold the license to your product without having to manufacture it. Companies that had been sinking
tremendous amounts of capital into manufacturing facilities no longer had to do that they could rely on outsourcing. That is when the contract manufacturing industry for biologics really began to grow. Several
major players offer commercial-scale production capacity, and others have programs in the works. They note
that barriers to entrance are very high, but the market for biopharmaceuticals is expanding at twice the rate of traditional drugs, and the small biotech companies responsible for most of the discovery work are a
contract manufacturer's natural clientele. Monoclonal antibodies (MAbs) are an important and growing therapeutic class in biotech drugs, and several biotech companies have recently added antibody production
capacity. Several biopharmaceuticals-biologically active proteins obtained by recombinant technologies-are
already blockbusters. Biotech manufacturers can manipulate cells to produce high yields of desired cell metabolites such as antibiotics, vitamins, amino adds, and other small molecules. As a result, regulatory
policies established for proteins must be modified for these drugs. At the same time, progress in the development of techniques to characterize these products may make it possible to have better control over
production and manufacturing changes.44,45,46 47
2.2.6 The impact of size and structure as success factors of the biotechnology industry
A glance at the difference between the US and European industry shows just how big the size difference is.
The entire European public biotech industry is only slightly larger than US-based Amgen and the average market capitalization of a US public biotech company is almost 60 percent greater than that of the average
European one. Compound this with the fact that the US biotech industry raised five times the amount the European sector did on the public markets last year, and we return to the question of who will be doing the
integrating. 48, 49
Large liquid stocks attract investors and even if there is good value in some smaller companies, they suffer
from poor liquidity and R&D pipeline gaps 50. Most companies in Europe are still simply too small to command the resources necessary to attain global leadership. There is evidence that things are changing. There are
many more venture rounds in excess of 25 million than there were a few years ago, the equity markets dug
deep into their pockets in 2000. The German model of matching private capital with state funding is paying off with the catapulting of young companies the top echelons of European biotech. 51
18
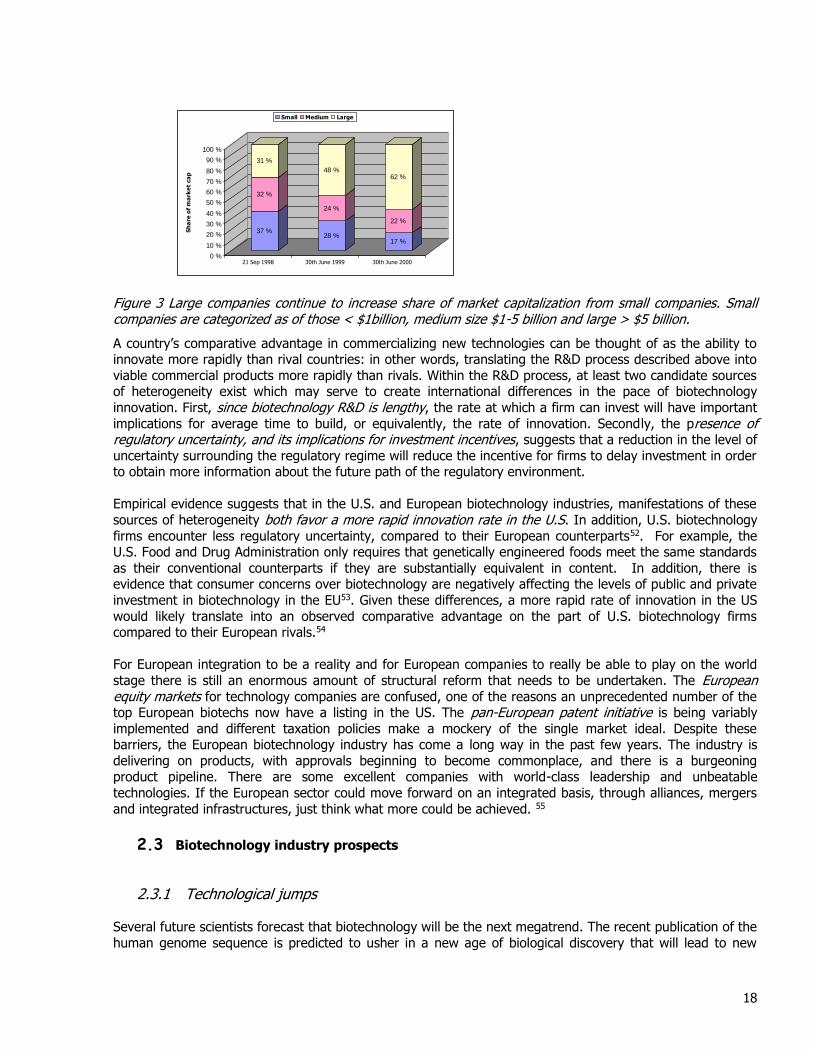
Figure 3 Large companies continue to increase share of market capitalization from small companies. Small companies are categorized as of those < $1billion, medium size $1-5 billion and large > $5 billion.
A country’s comparative advantage in commercializing new technologies can be thought of as the ability to innovate more rapidly than rival countries: in other words, translating the R&D process described above into
viable commercial products more rapidly than rivals. Within the R&D process, at least two candidate sources of heterogeneity exist which may serve to create international differences in the pace of biotechnology
innovation. First, since biotechnology R&D is lengthy, the rate at which a firm can invest will have important
implications for average time to build, or equivalently, the rate of innovation. Secondly, the presence of regulatory uncertainty, and its implications for investment incentives, suggests that a reduction in the level of
uncertainty surrounding the regulatory regime will reduce the incentive for firms to delay investment in order to obtain more information about the future path of the regulatory environment.
Empirical evidence suggests that in the U.S. and European biotechnology industries, manifestations of these
sources of heterogeneity both favor a more rapid innovation rate in the U.S. In addition, U.S. biotechnology
firms encounter less regulatory uncertainty, compared to their European counterparts52. For example, the U.S. Food and Drug Administration only requires that genetically engineered foods meet the same standards
as their conventional counterparts if they are substantially equivalent in content. In addition, there is evidence that consumer concerns over biotechnology are negatively affecting the levels of public and private
investment in biotechnology in the EU53. Given these differences, a more rapid rate of innovation in the US
would likely translate into an observed comparative advantage on the part of U.S. biotechnology firms compared to their European rivals.54
For European integration to be a reality and for European companies to really be able to play on the world
stage there is still an enormous amount of structural reform that needs to be undertaken. The European equity markets for technology companies are confused, one of the reasons an unprecedented number of the top European biotechs now have a listing in the US. The pan-European patent initiative is being variably
implemented and different taxation policies make a mockery of the single market ideal. Despite these barriers, the European biotechnology industry has come a long way in the past few years. The industry is
delivering on products, with approvals beginning to become commonplace, and there is a burgeoning product pipeline. There are some excellent companies with world-class leadership and unbeatable
technologies. If the European sector could move forward on an integrated basis, through alliances, mergers
and integrated infrastructures, just think what more could be achieved. 55
2.3 Biotechnology industry prospects
2.3.1 Technological jumps
Several future scientists forecast that biotechnology will be the next megatrend. The recent publication of the
human genome sequence is predicted to usher in a new age of biological discovery that will lead to new
37 %
32 %
31 %
28 %
24 %
48 %
17 %
22 %
62 %
0 %
10 %
20 %
30 %
40 %
50 %
60 %
70 %
80 %
90 %
100 %
Sh
are
of
ma
rke
t ca
p
21 Sep 1998 30th June 1999 30th June 2000
Small Medium Large

19
methods for drug research and discovery and whole new industries involved in biionformatics and
proteomics. Although industry and the public stand to benefit from this eruption in new biomedical discovery,
these developments present major challenges to pharmaceutical manufacturers. Difficulties in characterizing and setting specifications for complex new substances necessitate new approaches to validating and testing
new manufacturing systems. Even after a new therapy gains approval, problems may be encountered in scaling up to commercial production to meet patient demand for effective therapies. Advances in genomics
also promise to considerably influence how the government regulates the testing and manufacture of medical
products. FDA already is examining whether its rules and procedures can accommodate the anticipated wave of complex new experimental products.56
The new economic basics underlying the biotechnology industry are
1. The daily doubling of knowledge. The patent approvals took 8 years to double in the 1970´s and 4years to double in 1997.
2. The global scope of biomaterials is inversely proportional to its subatomic scale.
Biotechnology differs from other kinds of R&D because the end-results are very difficult to identify and predict in advance. The areas of real commercial impact of biotechnology account fro one-third
of the world’s GDP. Hence the R&D work focusing on subatomic issues are global in scope 3. Accelerating vertical growth rates. As resources committed to biotechnology research
increase, the commercial returns will (might) increase exponentially. 57
Figure 4 The Economic eras.
Biotechnology offers several technological ways to improve the properties of bio-originated materials. The
methods vary largely and the efficiency can still be increased remarkably. The basic ideas of surgery have changed from removal of damaged tissues to replacing damaged tissues with biocompatible materials and
tissue transplants. Biomaterials will focus on developing materials that release proteins and growth factors thus promoting growth of bone and soft tissues, simultaneously preventing growth of bacterial biofilms on
artificial implants. An important issue in biomaterials is to reduce their tendency to activate the human
defense systems, when placed in long-term contact with living tissues.
Another important issue is that the customers (i.e. the patients) expect an implant to function as well as its biological counterpart and to last forever. This misconception has been fostered by the press and some
physicians and will only be corrected by properly educating potential recipients. Biomaterial and implant
research will continue to concentrate on serving the needs of medical device manufacturers and recipients, as well as medical professionals developing technologies to meet those needs. 58
Agrarian Age
Time
Biomaterials Age
Information Age
Industrial Age
Glo
bal
izat
ion a
nd
Eco
no
mic
Ad
ded
Val
ue

20
2.3.2 Demographics change
Demographics play a positive role in the outlook for the healthcare industry. Demographics also bode well for
assisted living, nursing home and related industries, as the demand for long-term care grows with the population's age. Hospitals are joining the assisted-living trend in some capacity. Cost containment will
continue to be a driving force in the healthcare industry as well as the public's concern for safety and health.59
Trends in the life expectancy indicate that the population will grow older globally. The millennium children will place unique demand on the health science industry. Lifestyle related chronic disease is starting at
younger age and health concerns previously associated with older adults are some of the concerns of today´s youngsters. Health consumers around the world are using the increased disposable income to
improve their health care, gain access to new advances and alternative treatments. A key element in
improving the health is the access of nations to new information technology and the ability to be interconnected to other health networks. The developing nations are in a constant state of catching up to the
interconnected global market place. Their major problem will still be access to capital.
2.3.3 Global financial markets
The financial markets have expanded-although still volatile due to business cycles; the financial pie is getting bigger. In addition, governments, individuals and institutions are becoming increasingly involved. More
investments access the international markets and the nations are becoming richer. As a result, the nations
are more able to invest more in health science products and services. Positive regulatory news helped the industry. Over the next ten years, spending on healthcare services will grow substantially faster than the
economy. The global market place for health services and products grow, and the companies producing these are (need to) becoming international.
The global financial markets quickly affect others. Integration result in standardization of systems for trading and connecting them with technology hence opening new opportunities for biotechnology companies.
Business transaction can be conducted internationally at the Internet anytime and at low cost.
2.3.4 Technology trends affecting individuals
The IT and biotechnology is intertwined and they are fuelling each other. The implications are that the
technology breakthroughs have simplified and quickened the pace of research. The biotechnology discovery is identified quickly and the research is accomplished faster, at lower cost and higher quality. The power of
biotechnology to redefine our lives is just becoming to be grasped.
Consumer perception and empowerment to act on the awareness is creating a shift in every industry. A new
consumer paradigm has evolved. Just as physician and companies are becoming interconnected, consumers have access to volumes of new medical information and they use it. 60
2.3.5 Trends in the biotechnology industry sector
Currently, the biotechnology sector is diverged by region and size. The US biotechnology companies are
bigger by size, further in the development of products and hence showing more profits, they have access to
more capital. The biggest biotechnology clustering within Europe is in he UK and the fastest growth is emphasized to occur in Germany. Biotechnology companies have mainly listed on the London Stock
Exchange (UK), the Neuer Markt (Germany), The Swiss Stock exchange (Switzerland) and Bourse de Paris (France). Biotechnology companies exist mainly in Belgium, the Netherlands, Denmark and Sweden. 61
Analysts believe that it is likely that the biotech sector in Europe will grown fueled by product successes,
increasing profitability and M&A activity to achieve critical mass. Small companies are likely to pursue the

21
strongest growth, but the attractive company stocks are for those reaching profitability and products on close
to reaching the market. Once approaching profitability, the next challenge is to sustain growth. The smaller
companies will help drive the biotechnology sector growth in the long run, but the large groups are the ones likely to be the ones to deliver the promises. The emerging themes are likely to be 1) M%A activity, 2) re-rating of the biotechnology stocks, 3) technology becomes a commodity, 4) The European segment will grown, but the challenges will relate to quality and value, 5) growth is likely to concentrate in regions and 6)
the relative importance of special segments will grow (e.g. bioinformatics) The stocks are highly valuated and
not likely to sustain as e.g. retail demand is fuelling valuations in Germany. New entrants are highly likely and more companies will raise equity (IPO’s) and M&A will continue.62
2.3.6 The pharmaceutical market
Analysts estimate that the large multinational pharmaceutical companies' profits increased by approximately
18 percent in 2000. Many of the companies' margins are improving, and their product lines are dominated by
very profitable and successful drugs. Expenditures for prescription drugs in the U.S. are expected to grow at a 10.8 percent compounded annual rate between 1999-2004, as opposed to the 12.6 percent rate over the
preceding five years.63
The future market for generic biopharmaceuticals depends on the resolution of a number of legal, regulatory and technology issues. To what extent biopharmaceuticals will enter the generics mainstream is uncertain. A
position in generics biopharmaceuticals is risky. Most companies are not expected to pursue generic biologics
because the manufacturing processes are too complex and costly. With several patents for key biopharmaceutical products approaching their expiration dates, some in the generics industry are pushing for
a regulatory pathway that will more clearly establish the procedure and process for generic biologics. The current differences in review and approval processes for new drugs versus biologics will most likely extend to
their generic counterparts.
The predicted shift from blockbuster drugs designed to treat millions of patients to more custom-designed
therapies may require revisions in the regulatory system. Managed care providers use their powerful collective clout to secure discounts on bulk purchases of pharmaceutical and medical products, as well as on
physician and hospital services. Managed care has historically favored drug therapies because of their cost-effectiveness. They typically insist on the use of low-cost generics whenever possible. However, in terms of
government oversight and pricing issues, the pharmaceutical industry is still under some political pressure.
Prescription drug pricing is coming under increased pressure from managed care and governmental authorities. 64
2.3.7 Technological development affecting the industry
As recent developments alter biotechnology and biochemistry, it will be important to standardize products
further based on new in vitro and analytical assays. Not only will new analytical technologies such as three-
dimensional nuclear magnetic resonance, microarrays and proteomics provide new ways for scientists to understand molecular structures and accelerate laboratory analysis of cellular substances, but they also may
provide new approaches for developing and scaling up manufacturing systems.65
In addition to accelerating new product development, these technologies can facilitate the characterization of
complex molecules, a key step in simplifying the regulatory process for monitoring and approving manufacturing changes to approved products. FDA began to encourage manufacturers to write comparability
protocols (Cps) for well-characterized drugs and biologics in 1997, and companies are submitting written CP plans now as part of new drug applications or supplements. The protocol can be as short as a few pages,
enough to specify the tests, validation studies, and acceptance criteria of the product. CPs provide a reference point to demonstrate later that a change in manufacturing process, equipment, or location after
approval has no adverse effects on the quality, purity, or potency of the product. 66

22
The biopharmaceutical industry has offered breakthrough treatments for serious diseases. The potential of
this industry comes not only from the development of monoclonal antibodies and recombinant proteins as
therapeutics but also from the technologies associated with drug discovery, design, and understanding of the diseases. Chemists have been an integral part of the development of the biopharmaceutical industry by
exploring the molecular mechanisms that regulate, enhance, and limit the biochemical pathways involved in various diseases.67
The broader challenge for manufacturers is to use these new technologies to overcome technical and economic roadblocks to production. Most companies are unwilling or unable to invest millions of dollars in
new manufacturing facilities until they have strong evidence of - if not FDA approval for - a safe and effective product. However, the complexities in scaling up production can make this a long process. 68
23
3. THEORY ON VALUATION METHODS
There are no absolutes in valuation; the circumstances of the valuation and its purpose will influence the
value. The market is sophisticated and changes in value are linked more closely to changes in expectation than to absolute performance. Valuation levels are linked to the return on invested capital and growth. The
market sees through cosmetics earnings and put weight on long-term results.
The company’s value its equal to the value of its assets. When the value of debt is deducted from the assets
value, the value of equity is remaining. As equity in a firm is a residual claim, i.e., equity holders lay claim to all cash flows left over after other financial claim-holders (debt, preferred stock etc.) have been satisfied. If a
firm is liquidated, the same principle applies, with equity investors receiving whatever is left over in the firm after all outstanding debts and other financial claims are paid off. The principle of limited liability, however,
protects equity investors in publicly traded firms if the value of the firm is less than the value of the
outstanding debt, and they cannot lose more than their investment in the firm. Equity can be viewed as a call option the firm, where exercising the option requires that the firm be liquidated and the face value of the
debt (which corresponds to the exercise price) paid off. The first implication is that equity will have value, even if the value of the firm falls well below the face value of the outstanding debt. Such a firm will be
viewed as troubled by investors, accountants and analysts, but that does not mean that its equity is worthless. Just as deep out-of-the-money traded options command value because of the possibility that the
value of the underlying asset may increase above the strike price in the remaining lifetime of the option,
equity will command value because of the time premium on the option (the time until the bonds mature and come due) and the possibility that the value of the assets may increase above the face value of the bonds
before they come due.
The value placed by a strategic investor is higher than the value of the financial investor, as the strategic
investor is able to attract additional value from the company associated with synergy gains.
Equation 1
Value strategic investor= Value financial investor+ Value synergy gains In the real market you create value by earning a return on your invested capital greater than the opportunity
cost of capital. The more you invest at return the above the cost of capital the more value is created. The
returns shareholders earn depend primarily on changes in expectation more than on the performance of the company. The value of a company’s shares in the stock market equals the intrinsic value on the market’s
expectation of future performance, but the market expectations of future performance are an unbiased estimate of performance. 69The three laws of value creation are Cash is King and Time is Queen70
The valuer should recognize the sensitivity of judgments and assumptions on the valuation derived. The validity of the valuation method can still be objectively scruin. Depending on the circumstances some
methods are better than others, while other methods may be incorrect r irrelevant.71
The purpose of metrics is to help measure value creation, make value-creating decision and to orient towards value creation. Attempts to compare metrics that have different goals will lead to confusion. DCF valuation
measures performance over time and Economic profit is a short-term indicator. Generally, economic
measures are considered to be better than accounting based methods, as empirical evidence suggests that share prices are driven by cash flow not accounting earnings. However, there are no perfect measures and
some have developed frameworks to link various measures to describe different aspects of performance. 72
What drives the market value of companies? One way is to measure investors’ return is a combination of
share price appreciation and dividends earned (TRS). Other methods involve Market Value Added (MVA), which is the difference between the market value of a company’s debt and equity and the amount of capital
24
invested. A variation of MVA; the market-to-capital ratio is the market capitalization of a company’s debt and
equity. MVA pose problems because of use of accounting data. By combination TRS and MVA an interesting
insight into the dynamics is achieved, especially for terms of less than 10 years.73 TRS and MVA are linked to the current speed of the market’s expectations. Analysis has shown that market and sector movements
explain 40% of the returns during any one to three year period.
3.1 Assets based valuations of companies
The actual value of company is often ambiguous, depending upon which parts of the balance sheet were included. Knowing which assets are included, how ownership is held, and what the terms of the transaction
will be will make a big difference in the final sale price. When a third party attempts to use only the actual
sales price to make a decision about the value of his or her own property management business, confusion will be the result. On the right-hand side of the balance sheet, the term equity means the ownership interest.
Also, in the right-hand column, a sale also may include invested capital instead of merely equity. The left-hand side of the balance sheet contains the company's assets included in the sale. Even after the transaction
value has been established, you still may not have a complete picture of how much a seller receives for his or her management company. The method and terms of payment also affect the actual value of the sale.74
Business Structure On the right-hand side of the balance sheet, the term equity means the ownership interest. In a corporation,
equity is represented by stock. If there is more than one class of stock outstanding, the term equity by itself usually means the combined value of all classes of stock. If it is intended that the value represent only one
class of stock in a multi-class capital structure, there should be a statement as to which class of equity the
value represents. 75
Assets to Value The left-hand side of the balance sheet contains the company's assets included in the sale. In a cash-for-
stock transfer, all of the assets and all of the liabilities of the company are assumed to be included (unless specifically excluded) in the price. In a cash-for-stock transaction, contracts (for leases, etc.) need not be
rewritten whereas contracts may need to be renegotiated in a cash-for-assets transaction. Similarly, off
balance sheet liabilities such as lawsuits and insurance claims are part of cash-- for-stock transaction and may not be part of a cash-for-assets deal. When estimating the value of a business in a cash-for-assets
transaction, it may be necessary to estimate the value of each of these assets. The financial assets such as cash, accounts receivable, and inventory have values that are usually straightforward. Normally book value is
a good starting point for estimating the fair market value. If any of these assets aren't part of the transaction
for any reason, once their value is estimated, it can be subtracted. 76
The value of tangible personal property is usually estimated by beginning with the original cost and making an estimate of their depreciated cost (perhaps by using a depreciation method that is different from the one
used to calculate book value). The value of the records is often not estimated separately from the going-
concern value of the other assets since the records are often needed in order to maintain the going concern. The intangible assets of a property management company may or may not contribute substantial economic
value. They might even contribute negative economic value, which is recognized as economic obsolescence. One way to estimate the value of the intangible assets is to measure the company's expected rate of return
on assets. The value of the business itself without these components, the value of these components must be subtracted from the transaction value. 77
3.1.1 Yield capitalization method
The yield capitalization method of firm valuation is advocated as a valid declining asset valuation model over
the direct capitalization or the stock and debt approach to firm valuation. However, yield capitalization is not an appropriately specified declining asset valuation model. The use of yield capitalization is not justified
25
based on the argument that the procedure values only the asset already in place. A correctly formulated
equation is presented for a situation in which only the declining assets in place are to be valued. Yield
capitalization estimates from the correctly specified declining asset model are compared to the true firm value calculated using the Gordon dividend discount model. It has been demonstrated algebraically that if a
firm is expected to earn a return on invested equity capital (ROE) that exceeds (falls below) the required market return on that investment, the yield capitalization valuation method systematically will underestimate
(overestimate) the true equity value of the subject firm. The direct capitalization and the stock and debt
valuation methods contain no such inherent biases. 78
Notwithstanding this and other evidence, many supporters of yield capitalization still advocate its use over direct capitalization or the stock and debt approach to firm valuation. These proponents argue that although
the yield capitalization procedure usually provides lower estimates of firm value, this result occurs because yield capitalization values only the expected future cash flow from the firm's existing assets, which
necessarily decline over time with depreciation. These same proponents correctly argue that the value of the
net cash flow from the firm's future growth opportunities is embedded in both the direct capitalization and the stock and debt estimates of value. 79
3.1.2 Conclusions on valuation by accounting methods
It might be useful to study the accounting numbers for a series of reasons. However, valuation is about
forecasting future earnings and as the future is not fully reflected by historical data, it is not recommended to
use accounting numbers only into the valuation. Further, accounting numbers do not fully reflect the issues important in valuation such as net working capital and capital expenditures. Further, depreciation is not a
cash income but a calculation used for taxation, and should not be included in FCF calculations.
3.2 Multiples methods
All multiple methods derive the theoretical justification from discounted cash flow models. In principle the multiples capture the market’s view of the balance between the value of future cash flows der iving from the
existing business plus other future growth opportunities and the corresponding risks. 80
By the multiple methods companies are valuated based on their accounting earnings hence forecasting near
future with reflecting past performance. The earnings-multiple approaches do not value directly what matters to investors. As investments can be financed by other means than only earning generated by cash flows are
used for future investments, multiples becomes inadequate. 81
3.2.1 P/E and P/D multiples
The P/E ratio (Equation 2) shows the value of a company’s equity as a function of current earnings
perpetuity and the value of future NPV projects. The P/E ratio is not only a function of the current earnings growth rate but also how long the growth is likely to continue, the fixed assets and WCR to fund the growth.
These multiples are slow moving variables and forecast hence long-horizon movements. A high P/D ratio
indicates that the prices will grow more slowly than dividends for a long time, until the P/D ratio is
reestablished. When P/D ratio is high one of three things must happen 1) investors expect dividends to rise, 2) investors expect returns to be low or 3) investors expect prices to keep rising forever. Historically, all
variations in P/D ratios have reflected varying expected returns. 82Both P/E and P/D ratios are forecasting low returns for years to come.
Equation 2
EPS
PVGO
rEP 1

26
Although the P/D ratio is sometimes used for valuation it should be noticed that the NPV of future growth
opportunities is independent of how the growth is financed (Modgliani- Miller proposition I). The dividend
policy should have no affect on the value of the company. Nevertheless, dividends may be regarded as indicators of a company’s strength and reinvestment needs.83
However, the Modgliani-Miller proposition II says that in perfect markets the investor can expect to receive a
higher return as the company’s debt-to-equity ratio increases. 84
Equation 3
DAAEE
D
3.2.2 EBIT multiple
The EBIT multiple is popular since it focuses directly on the growth and risk of the busines’s operational
earnings. EBIT valuates the operational earnings without involving the financial structure. However, if there is a gain in leverage, the EBIT multiple fails to recognize it. Although taxes do not affect the EBIT, it implicitly
assumes that companies being compared are subject to similar taxes. The advantage and simultaneously the disadvantage, of earnings multiples are that accounting principles allow earnings figures to smooth out short
term cash flow fluctuations. 85
3.2.3 Free cash flow multiple
Free cash flow after tax but before interest an be estimated as the sum of EBIT + depreciation - tax-increase
in WCR-non-discretionary capital expenditures. The advantage of he FCF multiple is that it gets around differing accounting conventions in different countries that have different accounting standards. 86
Equation 4
Value of the company / FCFoperational after tax and before interest
3.2.4 Historic and prospective multiples
The reason for using historic and prospective multiples is that they provide and estimate for how the market values will develop.
Equation 5
Historic multiple= sultsported
ueCurrentVal
ReRe
Equation 6
Prospective multiple= sultsEstimated
ueCurrentVal
Re
27
3.2.5 Other quick methods for valuation
The Economic Profit Model
In the economic profit model the value of a company equals the amount of capital invested plus a premium equal to the present value of the value created each year. The principle lies in taking into account the
expenses recorded in its accounting year as well as the opportunity cost of capital employed in the business. It has the advantage of providing a measure for understanding a company’s performance in any single year.
Equation 7
WACCROICIofitEconomic Pr
The Venture Capital Method
The venture capital method is sued for valuing high risk investments in start-ups or early stages companies. The projections typically follow the hockey stick (i.e. initial losses followed by cash generations). The return
is a function of the terminal value (at the exit) and the finance required. The returns will mostly be in the
form of capital gains rather than income. The venture capitalist (VC) will estimate a P/E ratio appropriate for the business and the investment return required for such investments. Then the PV of the company´s
opportunity is calculated and the value of the opportunity before the investment is subtracted. The VC calculates the required equity stake by dividing the investment by the post-money valuation.
Different financial structures do not alter the overall risk as these types of investments are always high-risk investments and they lock-up the investments totally in the company.
Comparable companies approach
'EBITDA
V
Market-to-book ratio and the comparable companies approach is widely used by investors. However there
are two major problems with the comparables methods. First, the normal multiple problem is the difficulty to assess to what extent the comparable companies are similar and whether they are similar enough to serve
the multiple method. Second, the problem of double counting might occur.
3.2.6 Conclusions on valuation by quick methods
When multiples are used to valuate or benchmark companies, the problem of comparability incur. Multiples
are related to the company’s long-term cash returns and a full appraisal should be considering the relative levels of:
o Profitability, tax rates, asset turnover and return on capital employed
o Growth prospects in terms of growth and the potential size of the company’s opportunities as well as the risk associated
o Debt capacity 87
The P/E ratio is commonly used, as it is easily available. However, the P/E ratio is dependent on the leverage ratio of a company, implicitly measuring both the impact of the risk of the equity earnings plus the gain to
leverage. Varying accounting treatments between different companies make it difficult to measure the
incremental return on investment consistently. Inflation distorts the relationship of accounting earnings to cash flow. Cyclicality cannot be dealt with the accounting model, which capture an entire cycle. The multiple
methods do not capture the differences in investment and earnings patterns. The base level of earnings must be normalized to eliminate any nonrecurring items. 88
28
3.3 Discounted cash flow models
The DCF approach is based on the concept that an investment adds value if it generates a return on investment above the return that can be earned on investments of similar risks. The value of companies is
based on the expected cash flow discounted at a rate that reflects the riskiness of the cash flow. The DCF
model accounts for the difference in value by factoring the capital spending and other cash flows required to generate the earnings. The DCF models value the equity of a company as the value of company’s operations
less the debt and other investor’s claims, i.e. the value available to investors. The company debt equals the present value of the cash flow to debt holders discounted at a rate reflecting the riskiness. The value of a
company’s equity is the value of its operations plus non-operating assets less the value of its debt and non-
operating liabilities. The model value the company by adding up the components of different business operations hence helping in identifying separate investment and financing sources. The tax benefit is taken
into consideration in the calculations of WACC by adjusting the cost of debt by its tax benefit. 89
The value is defined as the present value of cash flow during an explicit period plus the present value of cash flow after the explicit period (terminal or horizontal value). Company valuation can be performed by the
discounted cash flow methods. The steps in discounted cash flow valuation of equity are:
1. Decide the length of the forecast horizon 2. Forecast the free cash flows (FCF) during the forecast horizon
3. Estimate the cost of capital (i.e. the discount rate) 4. Estimate the continuing value (CV), i.e. the value in the end of the forecast horizon
5. Discount to the present
6. Add the value of excess cash and other items that not where taken into account in free cash flows 7. Deduct the market value of financial debt
3.3.1 Calculating the FCF’s over the explicit time horizon
Cash flows, not accounting numbers are crucial when evaluating investments. Accounting numbers do not
account for changes in working capital. Further, large investments can be profitable even though they might
result in a negative short term ROIC. The relevant cash flows are after-tax cash flows, incremental cash flows and sunk costs are not to be considered. The time value of money is important as well as the riskiness of
cash flows. A payoff is expected for carrying risk. Cash flows are estimated for the company’s explicit horizon covering the years believed to forecast specific events happening in a certain industry or company. The FCF
are estimated by following:
Sales forecasts
-Cost of goods sold -Selling, general and administrative expenses
-Depreciations
-Provisions
Operating profit
-Taxes on operating profit
-Increase in deferred taxes
Net operating profit less adjusted taxes (NOPLAT) + Depreciation
+ Increase in provisions
- Increase in working capital requirement ( WCR)
- Capital expenditures
FREE CASH FLOW90
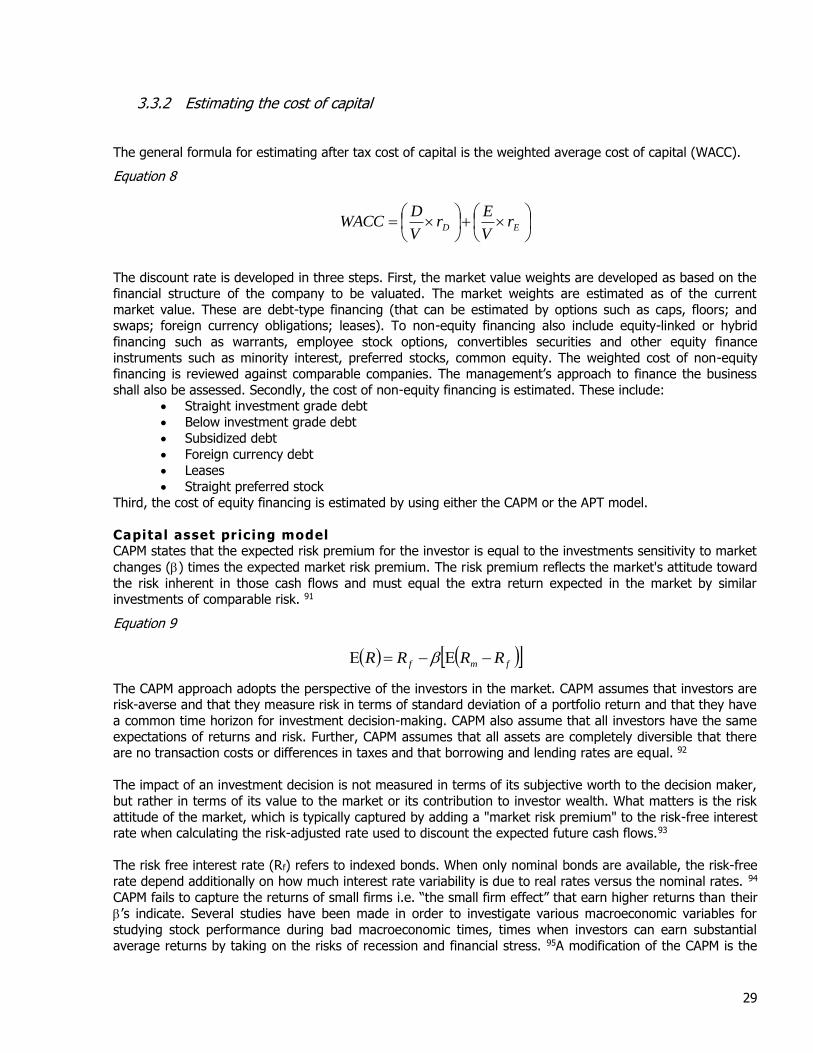
29
3.3.2 Estimating the cost of capital
The general formula for estimating after tax cost of capital is the weighted average cost of capital (WACC).
Equation 8
ED r
V
Er
V
DWACC
The discount rate is developed in three steps. First, the market value weights are developed as based on the financial structure of the company to be valuated. The market weights are estimated as of the current
market value. These are debt-type financing (that can be estimated by options such as caps, floors; and swaps; foreign currency obligations; leases). To non-equity financing also include equity-linked or hybrid
financing such as warrants, employee stock options, convertibles securities and other equity finance
instruments such as minority interest, preferred stocks, common equity. The weighted cost of non-equity financing is reviewed against comparable companies. The management’s approach to finance the business
shall also be assessed. Secondly, the cost of non-equity financing is estimated. These include: Straight investment grade debt
Below investment grade debt
Subsidized debt
Foreign currency debt
Leases
Straight preferred stock
Third, the cost of equity financing is estimated by using either the CAPM or the APT model.
Capital asset pricing model CAPM states that the expected risk premium for the investor is equal to the investments sensitivity to market
changes () times the expected market risk premium. The risk premium reflects the market's attitude toward
the risk inherent in those cash flows and must equal the extra return expected in the market by similar investments of comparable risk. 91
Equation 9
fmf RRRR
The CAPM approach adopts the perspective of the investors in the market. CAPM assumes that investors are risk-averse and that they measure risk in terms of standard deviation of a portfolio return and that they have
a common time horizon for investment decision-making. CAPM also assume that all investors have the same
expectations of returns and risk. Further, CAPM assumes that all assets are completely diversible that there are no transaction costs or differences in taxes and that borrowing and lending rates are equal. 92
The impact of an investment decision is not measured in terms of its subjective worth to the decision maker,
but rather in terms of its value to the market or its contribution to investor wealth. What matters is the risk
attitude of the market, which is typically captured by adding a "market risk premium" to the risk-free interest rate when calculating the risk-adjusted rate used to discount the expected future cash flows.93
The risk free interest rate (Rf) refers to indexed bonds. When only nominal bonds are available, the risk-free
rate depend additionally on how much interest rate variability is due to real rates versus the nominal rates. 94
CAPM fails to capture the returns of small firms i.e. “the small firm effect” that earn higher returns than their
’s indicate. Several studies have been made in order to investigate various macroeconomic variables for
studying stock performance during bad macroeconomic times, times when investors can earn substantial
average returns by taking on the risks of recession and financial stress. 95A modification of the CAPM is the

30
multifactor CAPM that enables to include other risks in addition to the market. Examples of other risks (F1…k)
are future labor income, future relative prices and future investment opportunities.
Equation 10
F
k
F
Fmm rBrBR
1
Arbitrary Pricing Theory APT postulates that a security’s return is influenced by a variety of factors (F1…H). The advantage of APT is
that it makes less restrictive assumptions about investors’ preferences towards risk and return. APT requires only that some rather unobtrusive bounds are placed on investor utility functions. No assumptions are made
about the distribution of returns and the APT does not rely on identifying the true market index and is hence testable.96 Empirical work has shown that the fundamental factors are changes in:
I. The industrial production index; a measure of how well the economy is doing in terms of actual
physical output II. The real short term interest rate; i.e. the difference between the yield of treasury bills and consumer
price index III. Short term inflation; i.e. the unexpected change in consumer price index
IV. Long term inflation; measured as the difference in yield-to-maturity on long- and short term
governmental bonds V. Default risk; i.e. the difference between the yield to maturity in AAA and BAA rated long-term
corporate bonds.97
3.3.3 Calculating the continuing value (CV)
The implicit CV calculations rely on relatively crude assumptions about what will happen after the explicit
horizon. The company’s present value is proportionately composed of the resent value of the explicit time horizon and the CV. The relative size of the CV depends on the growth rate. At high growth rates (g>ROCE)
the company consumes cash to grow and the CV value contribution represents more than 100% of the PV of the company value. Following methods can be used for estimating the CV98, 99
FCF growing at rate g (Equation 11)
'
1
gWACC
FCFCV T
T
Caution must be taken when using the FCF growing at rate g method, as it is misleading to carry out a
sensitivity analysis by varying g. I.e. when changing the g assumption, the CAPEX assumption in the FCF
calculation must also be changed. Value-driver formula (Equation 12)
'
1 1
gWACC
RONICg
NOPLAT
CVT
T
RONIC (return on newly invested capital) drive to a better intuition of what drives the company value due to
the fact that the value creation process must be explicitly modeled by choosing values for g and RONIC.
Perfect competition after the forecast horizon (Equation 13)
'
1
WACC
NOPLATCV T
T

31
This formula assumes that the growth rate g is zero and creates no value (NPV, EVA =0) for new
investments. Hence, the pace of growth is irrelevant.
Liquidation value relies on the assumptions of why to liquidate and how to liquidate. Replacement-cost approach. The danger with this method is that the underlying assumption is that new
investments are assumed to have zero NPV.
3.3.4 Discounting to present
When calculating the present value the expected payoffs need to be discounted with the rate of return (r,
opportunity cost of capital or cost of capital). The discount rate depends on the riskiness of the investment. Cash flows are not intuitive. The growth of the company and the return on invested capital drives the cash
flows. There are five methods for discounting growth (Equation 14- Equation 18). Notice that the interest rate (r) needs not to be the same for each period.
Equation 14. Finite uneven CF’s (100; 200; 300 @ r%)
n
i
ii DFCFPV1
Equation 15. Finite annuities (200, 200, 200,… @ r%)
r
rCFPV
n
1
11
Equation 16. Perpetual CF’s (100,100,….. @r%)
r
CFPV
Equation 17. Growing perpetuity (100, 100(1+g), 100(1+g)2;……@r%)
tgr
CFPV
1
Equation 18. Growing annuity (100; 100(1+g); 100(1+g)2 @r%)
gr
r
g
CFPV
n
1
11
1
The return on an investment(R) during a given interval is equal to the change in value (i.e. market value);
expressed as a fraction of the initial value plus any distributions received from the investments.
Equation 19
0
0
V
DivVVR tt
32
The expected return is the weighted average of possible outcomes, where the weights are relative chances
of occurrence (Pi the probability of the outcome).
Equation 20
n
i
ii RPR1
Risk is defined as the chance of achieving returns lower than expected, i.e. the dispersion of possible returns. Risk measures are however calculated as based on symmetric about the expected value. The total variability
of returns are measured as the variance of returns.
Equation 21
2
1
2
n
i
ii RRP
The total risk is the sum of systematic risk (m) and the unsystematic risk (). The systematic risk cannot
be eliminated through diversification. The unsystematic risk can be diminished by diversification, and
depends on factors unique to the investment (e.g. labor, levels of sales, managerial issues) and is not linked to the overall market and economic system. The relationship between risk and return is described by the
capital asset pricing model (CAPM).100
3.3.5 Modified discounted cash flow methods (APV)
The adjusted present value (APV) is similar to the DCF model. APV discounts the FCF to estimate the value of
operations and ultimately the company value once the non-operating assets are added and value of debt deducted.
APV separates the value of operations into two components: value of the operations as if the company were
all equity financed and the value of the tax benefit arising from debt financing. The tax benefit from paying interest is estimated by discounting the projected tax savings.
Both DCF and APV will result in the same value if done correctly and with identical assumptions about capital structure. This paper compares estimates of value derived from conventional discounted cash flow and price
earnings valuation methods to the market price. The median absolute pricing error is around 20% and the models explain around 70% of the cross-sectional variation in market price scaled by book value.101
3.3.6 Conclusions on valuation by cash flow methods
NPV calculates the value of a project by predicting its payouts, adjusting them for risk, and subtracting the investment outlay. But by boiling down all the possibilities for the future into a single scenario, NPV doesn't
account for the ability of executives to react to new circumstances--for instance, spend a little up front, see how things develop, then either cancel or go full speed ahead. 102
Real options valuation has been extended into biotechnology, pharmaceuticals, software, computer chips, and similar fields. The underlying asset of the option is no longer a traded product such as oil, whose going
price can be plugged easily into a formula. Now, the asset that you get with the call option is something that's not traded--for example, a factory that hasn't even been constructed yet. Its present value must be
estimated from projections of its future cash flows. 103 Net present value theory says that companies should fund every project whose expected return exceeds the corporate cost of capital. But companies set hurdle
rates for proposals that are far higher than their cost of capital and this is an indication of non-confidentiality
in NPV. 104
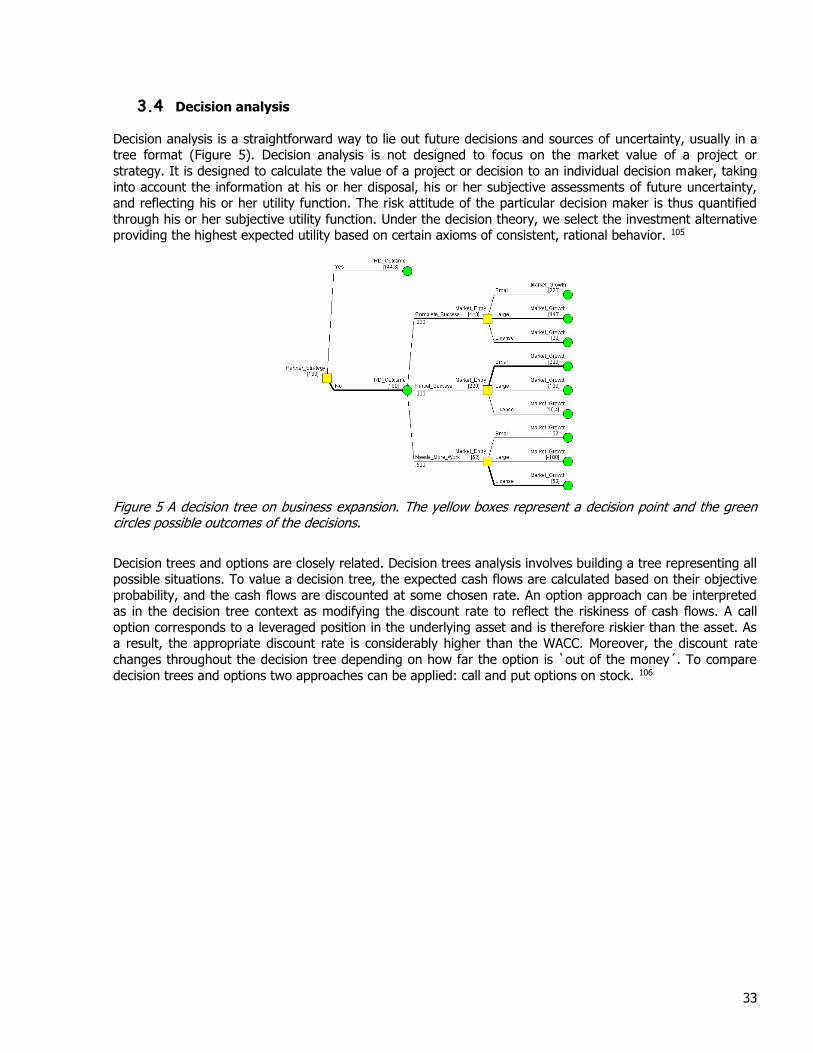
33
3.4 Decision analysis
Decision analysis is a straightforward way to lie out future decisions and sources of uncertainty, usually in a tree format (Figure 5). Decision analysis is not designed to focus on the market value of a project or
strategy. It is designed to calculate the value of a project or decision to an individual decision maker, taking
into account the information at his or her disposal, his or her subjective assessments of future uncertainty, and reflecting his or her utility function. The risk attitude of the particular decision maker is thus quantified
through his or her subjective utility function. Under the decision theory, we select the investment alternative providing the highest expected utility based on certain axioms of consistent, rational behavior. 105
Figure 5 A decision tree on business expansion. The yellow boxes represent a decision point and the green circles possible outcomes of the decisions.
Decision trees and options are closely related. Decision trees analysis involves building a tree representing all possible situations. To value a decision tree, the expected cash flows are calculated based on their objective
probability, and the cash flows are discounted at some chosen rate. An option approach can be interpreted as in the decision tree context as modifying the discount rate to reflect the riskiness of cash flows. A call
option corresponds to a leveraged position in the underlying asset and is therefore riskier than the asset. As a result, the appropriate discount rate is considerably higher than the WACC. Moreover, the discount rate
changes throughout the decision tree depending on how far the option is `out of the money´. To compare
decision trees and options two approaches can be applied: call and put options on stock. 106

34
4. REAL OPTIONS
Finance theory has been struggling with the question of how to evaluate investment under uncertainty. The
costs and benefits of an investment is actually highly complex, since costs are incurred today while benefits are uncertain and reaped in future.
Positive NPV projects are creating value and are accepted. DCF calculations fulfill important criteria: cash flow
based, risk adjusted, multi-period and forward looking. NPV translates to a real bias towards projects that
produce returns in the short term. The more distant the time horizon, the more uncertainty enters the equation, so whatever large potential payoffs in long-term may be present is discounted away. However DCF
fails to incorporate flexibility and because it assumes the decision in a project is `all or nothing´. NPV calculations do not fully incorporate strategic value and managers are left to rely in their intuition when
deciding on profitable long-term investments. When the NPV calculation forces to include all potential cost
and discounting to present he real option valuation is justifying only for the first investment giving the option to continue and abandon the project.107
Table 4 Key criteria for valuation techniques108
Cash flow
based
Risk adjusted Multi-period Captures
flexibility
Real option value Yes Yes Yes Yes NPV / DCF Yes Yes Yes No
Decision tree Yes No Yes Yes Economic profit Yes Yes No No
Earnings growth No No No No
The difference in DCF and real options is most crucial in valuations where management can respond to
flexible to new information and where the NPV without flexibility is close to zero or negative.
Figure 6 The difference between DCF and real option valuation is greater, the greater the likelihood to receive new information upon to respond and greater the managerial ability to respond. The corresponding appropriate valuation methods are DCT, Option pricing models, DCF and Monte Carlo simulation. 109, 110
Moderate flexibility value
Decision Tree Analysis
High flexibility value
Option Pricing Models
Low flexibility value
DCF Multiples
Moderate flexibility value
Monte Carlo Simulation
Sensitivity analysis
Hig
h
Low
High Low
Uncertainty: Likelihood of receiving new information
Room
for
managerial flexib
ility
:
Abili
ty t
o r
esp
ond
35
Traditional methods (e.g. discounted cash flows) fail to accurately capture the economic value of investments
in an environment of widespread uncertainty and rapid change. The investment decisions of today require analysts to accept that they cannot see far into the future because the product markets are not anymore
stable and predictable. Companies do make round of investments with the clear expectation that the initial plan will be modified or expanded in the future, as the projects go forward. Management must continuously
communicate to the public markets the news of project success, even before the project has generated
positive cash flows. There is a demand for real options in management to benefit from uncertainty and to communicate the company’s strategic flexibility.111 Real options offer the possibility to integrate major
analytical methods into a coherent framework that more closely approximates the dynamics of a company’s behavior with less heroic assumptions of the environment. New realities of our economy like instantaneous
communications, information intensity and heavy interconnectivity among companies have created new heights of volatility and uncertainty. Options are worth more than ever as it makes sense to adopt the
perspective on the overall value of a company. The value of a company consists of two parts: the value of its existing projects that generates the cash flows and the value of the options that the company holds to do other things. 112
Real options are defined as the subset of strategic options in which the exercise decision is largely triggered by market priced risk, a risk that is captured in the value of a traded security. Risks that are not captured in the price fluctuations of traded securities are known as private risks. Assets with market priced risks are associated with a wider set of opportunities because one can always acquire,
reduce or reshape risk through a position in traded securities. Securitization has the effect of deepening existing markets, creating liquidity and lowering transaction costs resulting in the ability to economically
maintain tracking position. Tracking plays a central role in the definition of market priced risk and in the accuracy of option pricing models. The quality of the option valuation depends on the opportunity to track
market priced risks. The farther away from financial markets the more difficult and costly it will be to track
the option. For real assets the distance between real and strategic options will shrink over time as more markets are completed. 113
It has been shown that it is very likely that some kind of tracking can be established for the value of the underlying asset. The private risk is defined and measured as the size of the tracking error on the underlying
asset and can hence be resolved by the data. The size of the risk will also diminue over time with
securitization. The analysts must dig deep and consider whether the risk might be correlated with a portfolio of traded securities. 114
An option is the right, but not the obligation to buy or sell an asset at some point within a predetermined
period of time for a predetermined price. The right to exercise (i.e. option) is purchased at some price (price
of the option). The value of the option is dependent on 6 variables 1. The exercise price. If the market price is higher than the exercise price then the option is `in the
money´ and when the market price is lower than the exercise price the option is said to be `out of the money´.
2. The value of the underlying variable i.e. real asset (positively correlated to the option value) 3. The level of uncertainty of the underlying variable (positively correlated to the option value)
4. The exercise price (negative correlated to the option value)
5. The time to maturity (positively correlated to the option value) 6. Time value of money i.e. the risk free interest rate (negatively correlated with the option value).
The pricing of real options relies on the fundamental concept of finding a replicating portfolio of priced
securities that have the same payout as the option to be valued and hence the same value.115 If the payouts
can be described and a portfolio of other securities is built with exactly the same payout, the arbitrage-free theory states that the prices must be the same (as the risk and returns profiles are the same).116
Analysts focus their attention on determining the optimal point in time for their financial options to be
exercised. This allows for the greatest contribution to managers of real options: the criticality to choose the

36
optimal time to invest in a real asset. Waiting will give the advantage of more information but it might as well
erode advantages. 117
Analogs exist between financial and real options although the analogy has limitations118. As real option
assets are not traded in liquid markets unique challenges in real option valuation is present. The value of an option is positively correlated to volatility because the value of the option will increase if the value of the
underlying assets increases. The probability of the increase of value is expressed as volatility. Both real and
financial options benefit from volatility. Both provide their owners the right, nut not the obligation to exercise. Finally, both options limit their downside risk while simultaneously gaining the access to the
potential upside. Financial and real options also differ in some respect as illustrated in Table 5 Comparison of financial and real options.119
Real options come into existence by the opportunities created by the firm’s strategic investments. Real
options involve uncertainty about the future and the management’s ability to respond to what it learns as the
uncertainty gradually decreases. If the management is no able to respond, options become bets. Making irreversible investments is risky and being able to change a decision as new information becomes available
help reducing that risk.
Real options have significant implications for the conception and implementation of the company’s strategy
and risk management. For instance, real option analysis encourage managers to create value and reduce risk by making strategic investments, monitoring various sources of uncertainty and changing resource
allocations appropriately in real time. 120
Table 5 Comparison of financial and real options
Financial options Real options
Require no ongoing investments Often require substantial ongoing investments in managerial time and effort
Provide a proprietary claim on an asset at exercise
May provide only a non-proprietary or shared claim at exercise
The exercise price is fixed The exercise price vary over time The value of the underlying asset is identical for
all owners The value is unique for each owner (e.g. due to
learning, capabilities, synergies etc.) Traded freely Often require sticky investments that may be
difficult to unwind
4.1 Classification of real options
Real options are classified to identify flexibility and strategic factors. The 7S framework of classifying real
options is illustrated in Figure 7 and explained in the text below. 121
The opt ion to defer . The most common type of real option is the possibility to defer investments and
wait for the uncertainty factors to resolve. During the time of deferral the company has the possibility to gain new information about the profitability of the investment as well as the evolution of market conditions.
Time-to-bui ld opt ion (staged investment) . The investment can be staged into phases hence
allowing for the possibility to review the project at different times and take actions (e.g. continue or abandon). The phases can also be dependent; i.e. the previous phase must be successfully completed before
continuing on the next (compound options). This is typical for the biotechnology industry, where the approval
is upon successful completion of previous phase. The opt ion to expand. The investment can be expanded for instance if the market conditions turns out to be more favorable than anticipated. If the initial value (V) is expanded by X%, the total NPV after the
expansion becomes
V + max (xV- I e x p an s i o n , 0)
37
The opt ion to contract. The company can reduce an investment by sharing the investment cost and
revenues with another party. Partnership and alliances are common in the biotechnology industry because
the investor carries substantial nondiversible risk, which the investor seeks to diminish. The option to contract can be viewed as an American put option, where the company capacity(c) is adjusted to marketing
conditions and the investment is decreased to Ic. The NPV becomes V + max(I c – cV , 0) The opt ion to shut down and restart operat ions. These options are common in the natural resources industry where the production can be shut down if the production cost exceed revenues at some
point of time, and restarted when prices are correct. The opt ion to abandon. If the market conditions become extremely unfavorable the company may decide to shut down. The option to shut down may be a very valuable. The option to abandon can be seen
as a combination of an American put option and NPV. If the value of the company on secondary markets or
at some other the best use, the value becomes as follows V + max(A – V, 0) Option to switch. The company may have inherent flexibility to switch for instance the production to
meet with changes in market condition (customization of product type). This option may be very valuable in
dynamic industries. Growth opt ions. Company infrastructure and R&D assets may be considered as assets for growth. The value of these options is not realized as immediate cash flows but as potential future cash flows.
The opt ion to redevelop. Real assets can be redeveloped repeatedly. In other words, the option to
redevelop a real asset can be exercised repeatedly, without limitation on the total number of times. This
compound option, or option on options, has both an infinite life and an infinite number of compounds. Although the above analysis focuses on developed assets with the option to redevelop, it also applies to
undeveloped assets. 122
Real options may occur in combinations (compound options). Real options can depend on more than one
source of uncertainty (rainbow options). Commercializing a R&D project includes rainbow options as the uncertainty arise of at least two sources (market and technological uncertainty) Learning options arise when
the company is able to both speed up the acquisition (new costs) of new information and to use what is has learned of the information hence modifying its investments. It is about balancing the value of the learning
option to act against the cost of acquiring the new information. A series of partial investments is an example
of learning options. Multi-staged R&D projects contain a series of embedded options based on technological and market uncertainty (learning options). 123
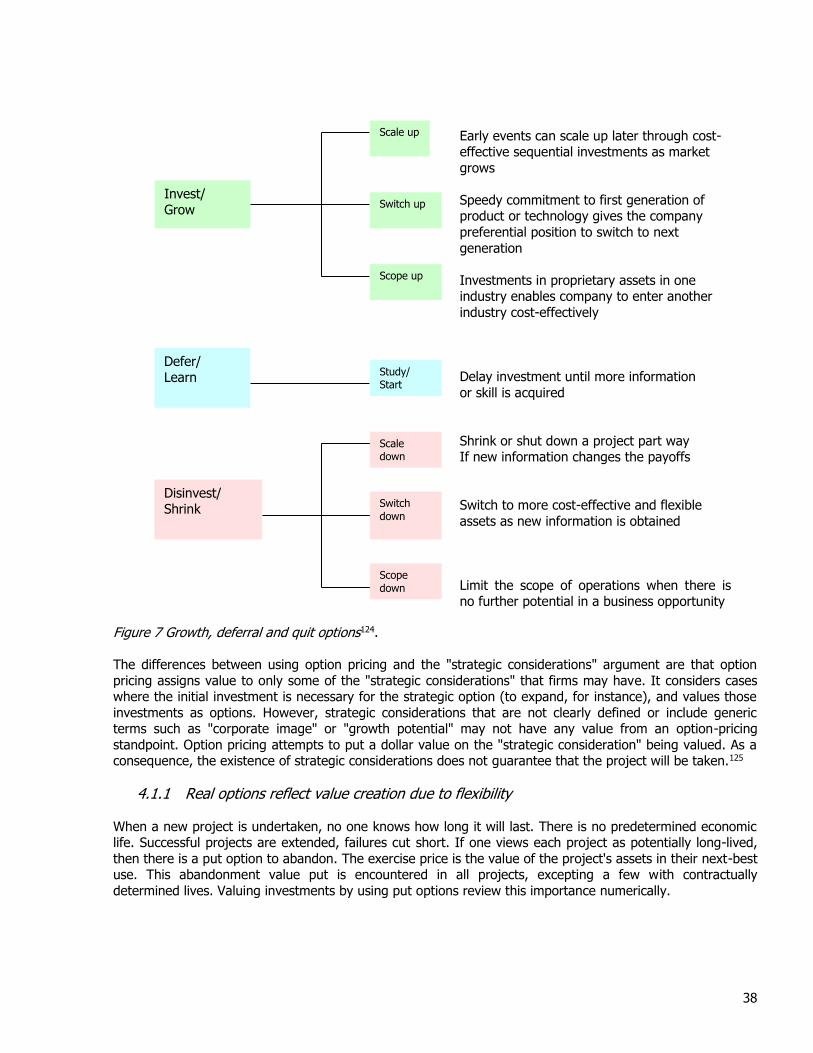
38
Figure 7 Growth, deferral and quit options124.
The differences between using option pricing and the "strategic considerations" argument are that option
pricing assigns value to only some of the "strategic considerations" that firms may have. It considers cases where the initial investment is necessary for the strategic option (to expand, for instance), and values those
investments as options. However, strategic considerations that are not clearly defined or include generic terms such as "corporate image" or "growth potential" may not have any value from an option-pricing
standpoint. Option pricing attempts to put a dollar value on the "strategic consideration" being valued. As a consequence, the existence of strategic considerations does not guarantee that the project will be taken.125
4.1.1 Real options reflect value creation due to flexibility
When a new project is undertaken, no one knows how long it will last. There is no predetermined economic life. Successful projects are extended, failures cut short. If one views each project as potentially long-lived,
then there is a put option to abandon. The exercise price is the value of the project's assets in their next-best use. This abandonment value put is encountered in all projects, excepting a few with contractually
determined lives. Valuing investments by using put options review this importance numerically.
Early events can scale up later through cost- effective sequential investments as market
grows
Speedy commitment to first generation of product or technology gives the company
preferential position to switch to next
generation
Investments in proprietary assets in one industry enables company to enter another
industry cost-effectively
Delay investment until more information
or skill is acquired
Shrink or shut down a project part way If new information changes the payoffs
Switch to more cost-effective and flexible
assets as new information is obtained
Limit the scope of operations when there is no further potential in a business opportunity
Invest/ Grow
Defer/ Learn
Disinvest/ Shrink
Scale up
Switch up
Scope up
Study/ Start
Scale down
Switch
down
Scope
down
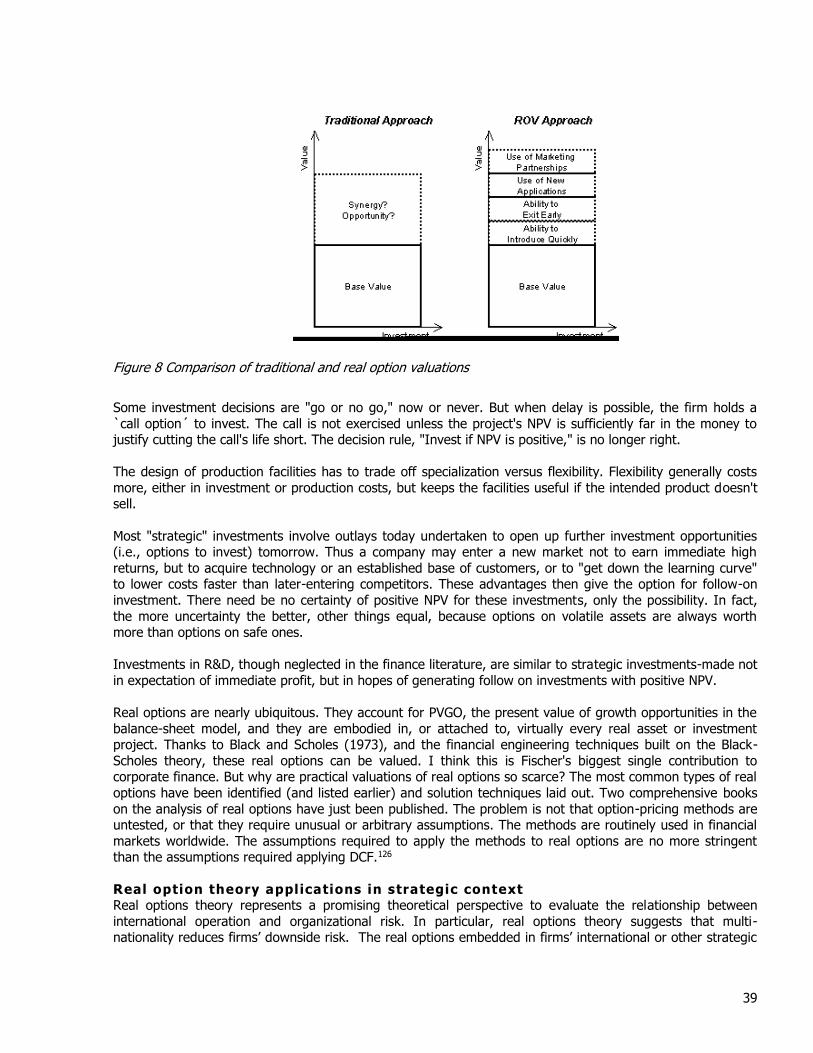
39
Figure 8 Comparison of traditional and real option valuations
Some investment decisions are "go or no go," now or never. But when delay is possible, the firm holds a
`call option´ to invest. The call is not exercised unless the project's NPV is sufficiently far in the money to justify cutting the call's life short. The decision rule, "Invest if NPV is positive," is no longer right.
The design of production facilities has to trade off specialization versus flexibility. Flexibility generally costs
more, either in investment or production costs, but keeps the facilities useful if the intended product doesn't sell.
Most "strategic" investments involve outlays today undertaken to open up further investment opportunities (i.e., options to invest) tomorrow. Thus a company may enter a new market not to earn immediate high
returns, but to acquire technology or an established base of customers, or to "get down the learning curve" to lower costs faster than later-entering competitors. These advantages then give the option for follow-on
investment. There need be no certainty of positive NPV for these investments, only the possibility. In fact,
the more uncertainty the better, other things equal, because options on volatile assets are always worth more than options on safe ones.
Investments in R&D, though neglected in the finance literature, are similar to strategic investments-made not
in expectation of immediate profit, but in hopes of generating follow on investments with positive NPV.
Real options are nearly ubiquitous. They account for PVGO, the present value of growth opportunities in the
balance-sheet model, and they are embodied in, or attached to, virtually every real asset or investment project. Thanks to Black and Scholes (1973), and the financial engineering techniques built on the Black-
Scholes theory, these real options can be valued. I think this is Fischer's biggest single contribution to corporate finance. But why are practical valuations of real options so scarce? The most common types of real
options have been identified (and listed earlier) and solution techniques laid out. Two comprehensive books
on the analysis of real options have just been published. The problem is not that option-pricing methods are untested, or that they require unusual or arbitrary assumptions. The methods are routinely used in financial
markets worldwide. The assumptions required to apply the methods to real options are no more stringent than the assumptions required applying DCF.126
Real option theory applications in strategic context Real options theory represents a promising theoretical perspective to evaluate the relationship between
international operation and organizational risk. In particular, real options theory suggests that multi-nationality reduces firms’ downside risk. The real options embedded in firms’ international or other strategic

40
investments can take many forms, including options to defer investment, expand or contract production, abandon operations, switch use of inputs, and grow into expanding markets127. As a result, investing in real
options allows the firm to manage risk by proactively confronting uncertainty over time in a flexible fashion 128 rather than by attempting to avoid uncertainty. Real options theory therefore provides researchers with a
tool to evaluate the tradeoffs between commitment and flexibility under conditions of uncertainty. 129 Two key types of real options are viewed as central t flexibility enchancement and risk reduction:
multinational networks and international joint ventures130. A parsimonious model to assess the impact of multi-nationality and IJV investments on organizational risk has been developed. Firm size was incorporated
in the models to accommodate the greater project diversity of larger firms131; financial, human, or other resources that can affect risk; potential rigidity or organizational inertia; and the relative importance of the
firm’s international investments. Finally, a control for industry risk addressed inter-industry risk differences and non-observable effects at the industry level. The results are striking in light of prior research in the
international literature on the diversification benefits of multi-nationality and recent evidence that higher-
performing132 and higher-prestige133 firms are more active in forming alliances. The evidence can be explained by the observation that not all investments undertaken in uncertain contexts provide significant options nor do firms necessarily manage real options properly. The results thus reveal a gap between the “promise” of risk reduction that theory holds out and the “reality” of firms’ apparently limited capabilities for
managing international investments as options134. This gap may be explained as the company’s capability and
readiness to use real options efficiently.135 When managing risk through investment in real option companies need to increase their odds of success in challenges: sensitivity to the specifics of transaction costs and
develop and support the capabilities necessary to implement real options.
Table 6 Challenges and opportunities realizing from real options.
Corporate readiness Transaction design and execution
o Recognition of embedded options o Limiting carrying costs and coordination problems
o Valuation and negotiation capabilities o Scanning multiple, complex environmental signals
o Management and information systems o Making a secure claim on upside opportunities o Global strategy o Organizational configuration
Option theory has also been applied in models for analyzing the choice of governance and technology
acquisitions. Option value and transaction costs were found to determine the governance model in technology acquisitions. First, collaborative sources of governance provide with the right to buy and sell
equity (right of first refusal). Second, the opportunity for a partner to recognize value in the technology before potential other bidders arosen due to close interaction is tough of as value of technology (not the
technology itself). The contribution of option theory (value of the options) was found to strongly support equity collaborations, but less strongly supported in non-equity collaborations.136
4.1.2 Advantages and disadvantages of real options
Real-options analysis rewards flexibility--and that's what makes it better than today's standard decision-
making tool, ``net present value.'' Although conceived more than 20 years ago, real-options analysis is just now coming into wide use. Experts had developed rules of thumb that simplify the formidable math behind
options valuation, while making real options applicable in a broader range of situations. And consulting firms
have latched on to the technique as the Next Big Thing to sell clients. But, real-options analysis has its detractors. It is too complex to be worthwhile for minor decisions. And it is not useful for projects that
require a full commitment right away, since the value of an option lies in the ability to spend a little now and decide later whether to forge ahead.137

41
Trigeorgis138, 139, 140 discussed the problem of determining the value of the underlying asset for a real option
(a parameter required for the Black-Scholes model). Essentially, if the underlying asset is not traded in the
market (as is the case for R&D projects), it is difficult, if not impossible, to establish this value. Finally, recognize that the volatility in the Black-Scholes models is derived from the "price relative" (final stock price
divided by initial stock price) and obtained from historical data, which does not usually exist for R&D projects. The advantage of this approach is that it eliminates the need to make some of the possibly unrealistic
assumptions required by the Black-Scholes model. However, it still requires management to estimate the
distribution of net cash flows. While this may be possible, it is more likely that management will have access to two separate estimates: production and marketing costs, and anticipated revenues. For this reason, I
propose a model based on the underlying distributions of costs and revenue rather than net cash flows. The work for the normal distribution141 has been extended to a model with a simple example. Black-Scholes
assumes that the revenues have a lognormal distribution and the implementation costs are known with certainty (given by a point estimate). By relaxing the lognormal assumption in the Black-Scholes model, the
model presented in this article provides a more flexible and intuitive tool for measuring the option value of
R&D projects. Because it is based on cost and revenue projections routinely used to determine the net present value of investment alternatives, it should have an intuitive appeal to practitioners. 142
Option models, all origin in the original Black-Scholes model, are based on assumptions about the market.
They assumed that the markets are random, unpredictable and that prices are normally distributed. The
option pricing model's underlying assumption stands in stark contrast to that analytical process.143 When the underlying asset is not traded the option pricing theory is built on the premise that a replicating portfolio can
be created using the underlying asset and riskless lending and borrowing. The options on assets that are not traded, and the value from option pricing models has to be interpreted with caution.
4.1.3 Characteristics of real options
The real option value depends on the 6 variables that affect ROV and the value of the real options can be influenced by acting proactively (Figure 9). Uncertainty of future expected cash flows increase the ROV as
the upside potential for profits grows and the downside remains protected. Choosing not to exercise protects the downside; if the prices of the exercise are higher than the expected inflows (i.e. the option is `out of the
money´). Either increasing the expected cash inflows by raising the price earned or by reducing the expected cash outflows can increase the potential upside. ROV is also increased by increase in the duration, reducing
the lost by waiting to exercise and increases in the risk-free interest rate. The levers that the company
chooses to pull depend on how much the different levers affect the ROV and on what levers it can pull. For instance, it might be more profitable to get the revenues up than pushing the costs down. Options are said
to be high-priority options when they are sensitive to levers that management can readily pull. Medium priority options are options that a competitor (not the current owner of the option) can pull. Low-sensitivity
options are correspondingly options that not are sensitive to levers that management can pull. 144
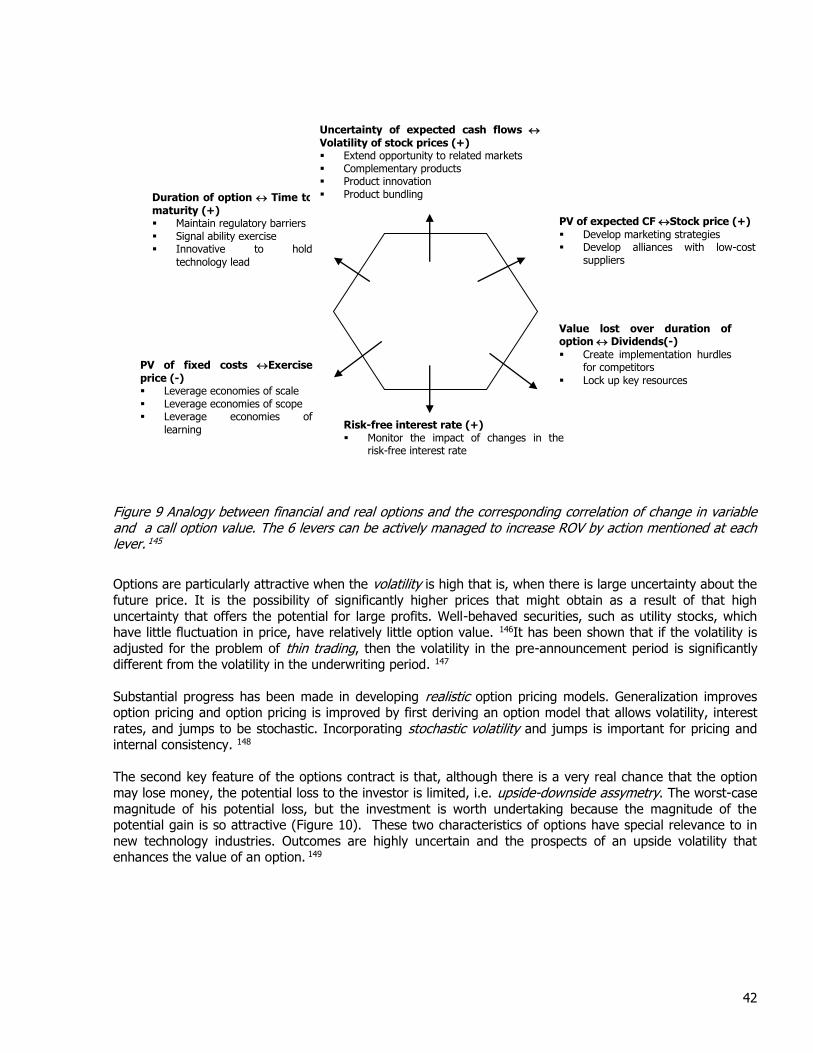
42
Figure 9 Analogy between financial and real options and the corresponding correlation of change in variable and a call option value. The 6 levers can be actively managed to increase ROV by action mentioned at each lever. 145
Options are particularly attractive when the volatility is high that is, when there is large uncertainty about the
future price. It is the possibility of significantly higher prices that might obtain as a result of that high
uncertainty that offers the potential for large profits. Well-behaved securities, such as utility stocks, which have little fluctuation in price, have relatively little option value. 146It has been shown that if the volatility is
adjusted for the problem of thin trading, then the volatility in the pre-announcement period is significantly different from the volatility in the underwriting period. 147
Substantial progress has been made in developing realistic option pricing models. Generalization improves option pricing and option pricing is improved by first deriving an option model that allows volatility, interest
rates, and jumps to be stochastic. Incorporating stochastic volatility and jumps is important for pricing and internal consistency. 148
The second key feature of the options contract is that, although there is a very real chance that the option
may lose money, the potential loss to the investor is limited, i.e. upside-downside assymetry. The worst-case
magnitude of his potential loss, but the investment is worth undertaking because the magnitude of the potential gain is so attractive (Figure 10). These two characteristics of options have special relevance to in
new technology industries. Outcomes are highly uncertain and the prospects of an upside volatility that enhances the value of an option. 149
PV of expected CF Stock price (+)
Develop marketing strategies Develop alliances with low-cost
suppliers
Value lost over duration of option Dividends(-)
Create implementation hurdles for competitors
Lock up key resources
Risk-free interest rate (+) Monitor the impact of changes in the
risk-free interest rate
PV of fixed costs Exercise
price (-) Leverage economies of scale Leverage economies of scope Leverage economies of
learning
Duration of option Time to
maturity (+) Maintain regulatory barriers Signal ability exercise Innovative to hold
technology lead
Uncertainty of expected cash flows
Volatility of stock prices (+) Extend opportunity to related markets Complementary products Product innovation Product bundling
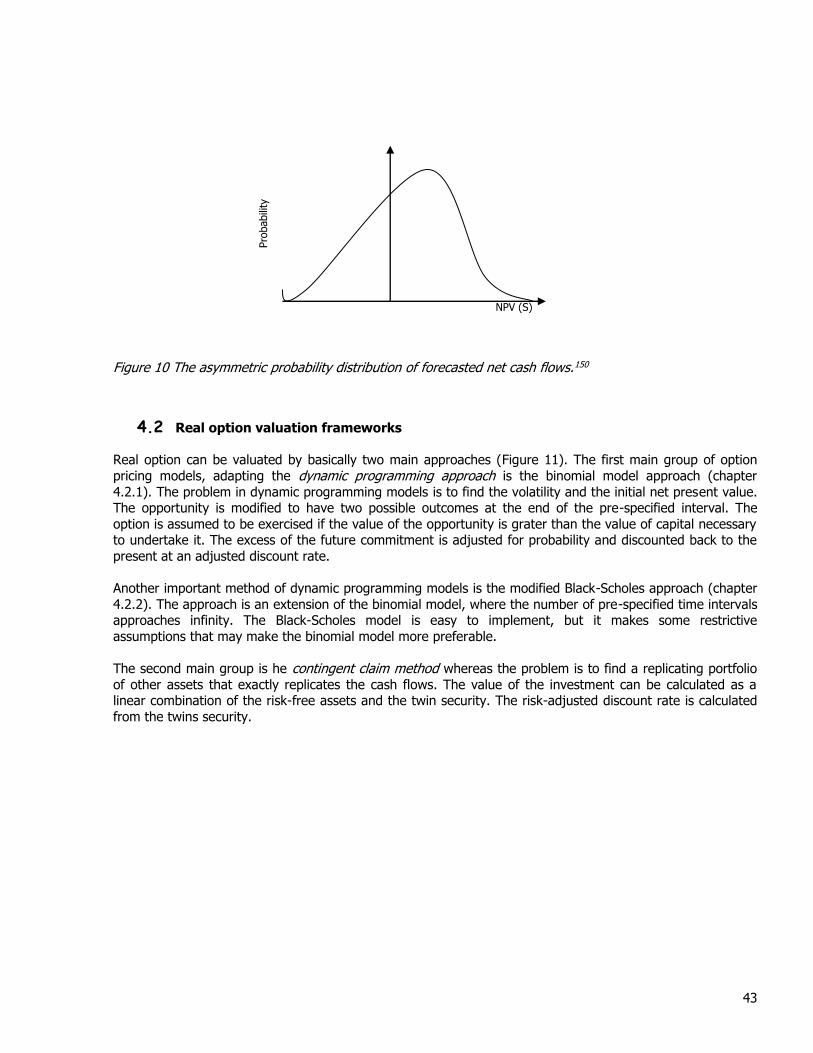
43
Figure 10 The asymmetric probability distribution of forecasted net cash flows.150
4.2 Real option valuation frameworks
Real option can be valuated by basically two main approaches (Figure 11). The first main group of option
pricing models, adapting the dynamic programming approach is the binomial model approach (chapter
4.2.1). The problem in dynamic programming models is to find the volatility and the initial net present value. The opportunity is modified to have two possible outcomes at the end of the pre-specified interval. The
option is assumed to be exercised if the value of the opportunity is grater than the value of capital necessary to undertake it. The excess of the future commitment is adjusted for probability and discounted back to the
present at an adjusted discount rate.
Another important method of dynamic programming models is the modified Black-Scholes approach (chapter
4.2.2). The approach is an extension of the binomial model, where the number of pre-specified time intervals approaches infinity. The Black-Scholes model is easy to implement, but it makes some restrictive
assumptions that may make the binomial model more preferable.
The second main group is he contingent claim method whereas the problem is to find a replicating portfolio
of other assets that exactly replicates the cash flows. The value of the investment can be calculated as a linear combination of the risk-free assets and the twin security. The risk-adjusted discount rate is calculated
from the twins security.
NPV (S)
Pro
babili
ty
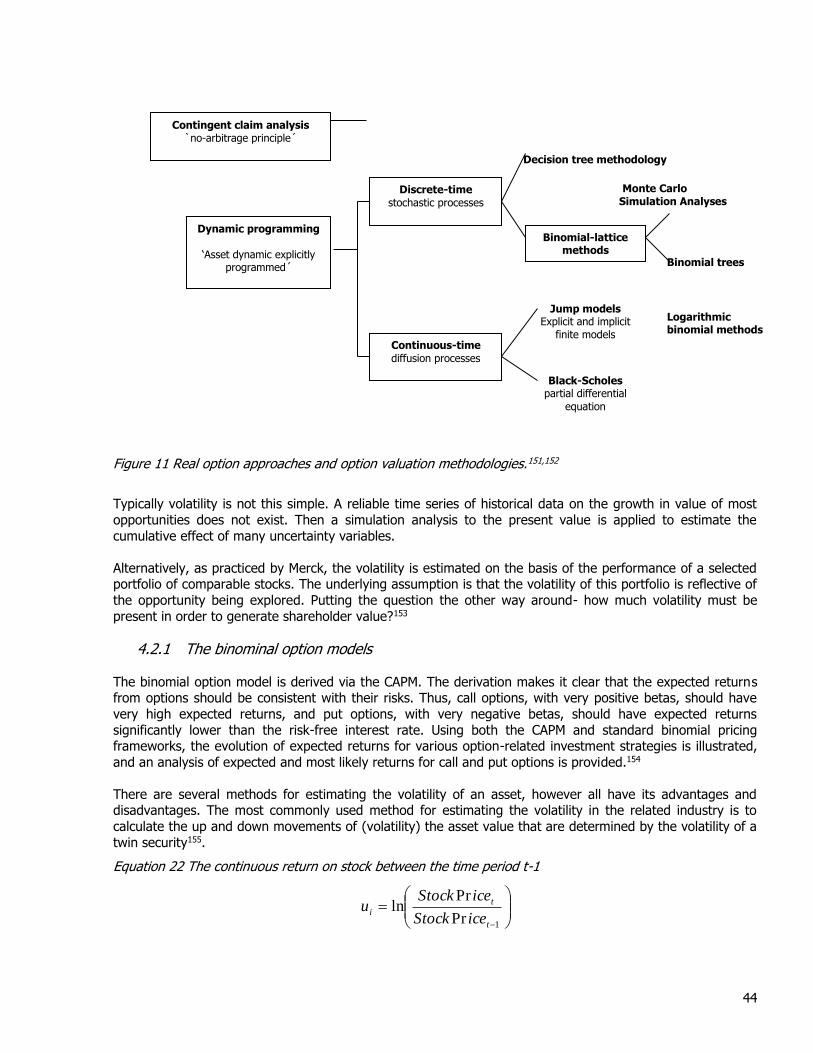
44
Figure 11 Real option approaches and option valuation methodologies.151,152
Typically volatility is not this simple. A reliable time series of historical data on the growth in value of most
opportunities does not exist. Then a simulation analysis to the present value is applied to estimate the
cumulative effect of many uncertainty variables.
Alternatively, as practiced by Merck, the volatility is estimated on the basis of the performance of a selected portfolio of comparable stocks. The underlying assumption is that the volatility of this portfolio is reflective of
the opportunity being explored. Putting the question the other way around- how much volatility must be
present in order to generate shareholder value?153
4.2.1 The binominal option models
The binomial option model is derived via the CAPM. The derivation makes it clear that the expected returns from options should be consistent with their risks. Thus, call options, with very positive betas, should have
very high expected returns, and put options, with very negative betas, should have expected returns
significantly lower than the risk-free interest rate. Using both the CAPM and standard binomial pricing frameworks, the evolution of expected returns for various option-related investment strategies is illustrated,
and an analysis of expected and most likely returns for call and put options is provided.154
There are several methods for estimating the volatility of an asset, however all have its advantages and disadvantages. The most commonly used method for estimating the volatility in the related industry is to
calculate the up and down movements of (volatility) the asset value that are determined by the volatility of a
twin security155.
Equation 22 The continuous return on stock between the time period t-1
1Pr
Prln
t
ti
iceStock
iceStocku
Decision tree methodology
Monte Carlo
Simulation Analyses
Binomial trees
Logarithmic binomial methods
Dynamic programming
‘Asset dynamic explicitly programmed´
Contingent claim analysis `no-arbitrage principle´
Black-Scholes partial differential
equation
Discrete-time
stochastic processes
Continuous-time
diffusion processes
Binomial-lattice methods
Jump models Explicit and implicit
finite models

45
Equation 23 The estimate for the variance of the return on stock
2
1
_
1
1
n
i
i uun
s
Equation 24 The volatility of expressed as the standard deviation in relation to time T
T
s
Figure 12 Asset price lattice. The changes in asset value are derived from the volatility. Every node has two outcomes - an upward change and a downward change in asset value. The tree evolves until the time-to-maturity of the option. The lattice starts from the left (A), which is the discounted and risk-adjusted cash flow from commercialization.
For the binomial lattice method the up and down movements of the asset is calculated as of formulas
Equation 25 and Equation 26. The risk-adjusted probabilities can be discounted at the risk free rate (Equation 27).
Equation 25 The upward movement of the underlying assets as estimated on the volatility.
Teu
Equation 26 The downward movement of the underlying assets as estimated on the volatility.
ued t 1
Equation 27 The risk neutral probability of upward movement in asset value (rf being the risk free interest rate). The probability of downward movement of the asset value is correspondingly 1-q.
u4A ‘u3A u2A u3dA uA ‘u2dA A udA ‘u2dS dA ud2A d2A ‘ud2A d3A ‘d4A
Ass
et
price
Time

46
du
drq
f
1
Equation 28 The present value of a real option by the lattice method.
fr
dPVpuPVpPV
1
1
Equation 29 The binominal option pricing for European call options (C) and put options (P). The PV at each node can be calculated by Equation 28.
0,, CostSMaxC sT and CostSMaxP sT ,,0
Equation 30 The binominal option pricing for American call options (C). The present value (Pd and Pu) at each node is calculated by Equation 28.
0,
1
1Cost
r
PqqPMaxC
f
du
4.2.2 The Black-Scholes option valuation model
The price of the asset follows a continuous process: The Black-Scholes option pricing model is derived under
the assumption that the underlying asset's price process is continuous, i.e., there are no price jumps. If this assumption is violated, as it is with most real options, the model will underestimate the value of deep out-of-
the-money options. One solution is to use a higher variance estimate to value deep out-of-the-money options and lower variance estimates for at-the-money or in-the-money options. Another is to use an option-pricing
model that explicitly allows for price jumps, though the inputs to these models are often difficult to estimate.
The variance is known and does not change over the life of the option: The assumption that option pricing
models make, that the variance is known and does not change over the option lifetime, is not unreasonable when applied to listed short-term options on traded stocks.
When option-pricing theory is applied to long-term real options, there are problems with this assumption, since the variance is unlikely to remain constant over extended periods of time and may in fact be difficult to
estimate in the first place.
Exercise is instantaneous: The option pricing models are based upon the premise that the exercise of an option is instantaneous. This assumption may be difficult to justify with real options, where exercise may
require the building of a plant or the construction of an oilrig, actions which are unlikely to happen in an
instant. The fact that exercise takes time also implies that the true life of a real option is often less than the stated life.156
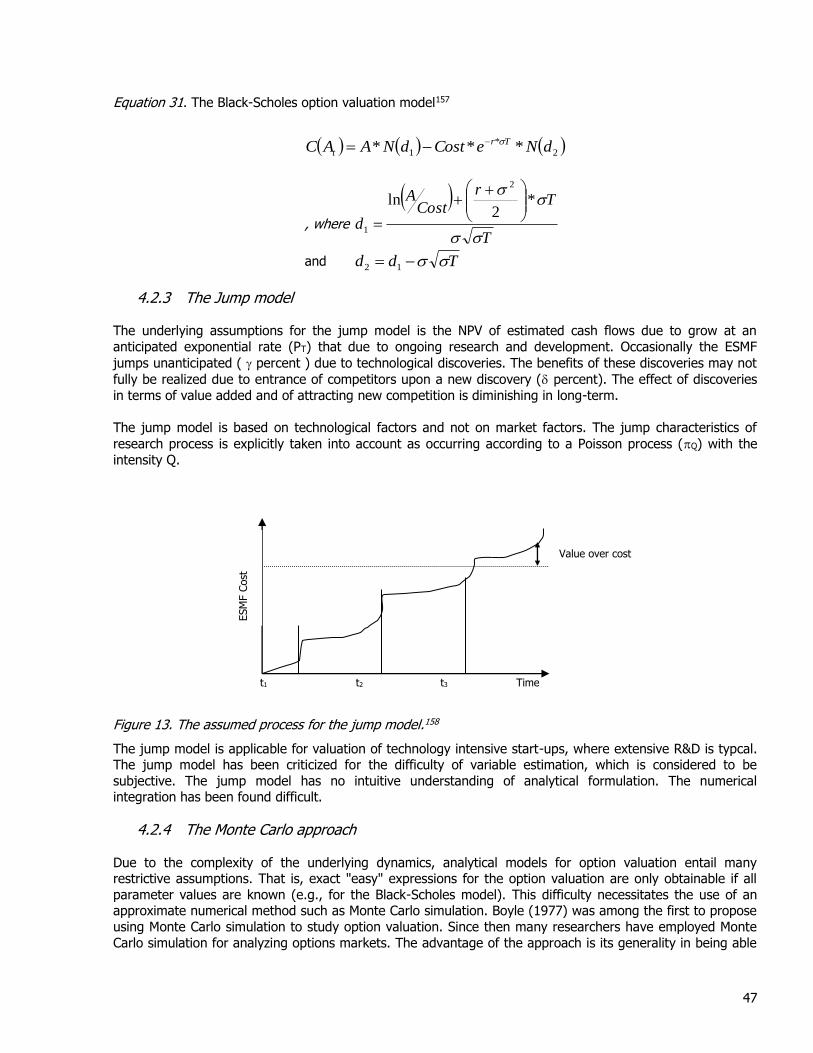
47
Equation 31. The Black-Scholes option valuation model157
2
*
1 *** dNeCostdNAAC Tr
t
, where
T
Tr
CostA
d
*2
ln2
1
and Tdd 12
4.2.3 The Jump model
The underlying assumptions for the jump model is the NPV of estimated cash flows due to grow at an
anticipated exponential rate (PT) that due to ongoing research and development. Occasionally the ESMF
jumps unanticipated ( percent ) due to technological discoveries. The benefits of these discoveries may not
fully be realized due to entrance of competitors upon a new discovery ( percent). The effect of discoveries
in terms of value added and of attracting new competition is diminishing in long-term.
The jump model is based on technological factors and not on market factors. The jump characteristics of
research process is explicitly taken into account as occurring according to a Poisson process (Q) with the
intensity Q.
Figure 13. The assumed process for the jump model.158
The jump model is applicable for valuation of technology intensive start-ups, where extensive R&D is typcal. The jump model has been criticized for the difficulty of variable estimation, which is considered to be
subjective. The jump model has no intuitive understanding of analytical formulation. The numerical integration has been found difficult.
4.2.4 The Monte Carlo approach
Due to the complexity of the underlying dynamics, analytical models for option valuation entail many restrictive assumptions. That is, exact "easy" expressions for the option valuation are only obtainable if all
parameter values are known (e.g., for the Black-Scholes model). This difficulty necessitates the use of an approximate numerical method such as Monte Carlo simulation. Boyle (1977) was among the first to propose
using Monte Carlo simulation to study option valuation. Since then many researchers have employed Monte
Carlo simulation for analyzing options markets. The advantage of the approach is its generality in being able
t1 t2 t3 Time
Value over cost
ESM
F C
ost
48
to model "imperfect" market conditions not easily captured in analytically tractable models. As Boyle (1977)
stated, "The Monte Carlo method should prove most valuable in situations where it is difficult if not
impossible to proceed using a more accurate approach." There is a need for investigating issues related to efficiently estimating various option models via Monte Carlo simulation and including control variates,
perturbation analysis, and sensitivity analysis as well as Quasi-Monte Carlo simulation approaches. Work done by Boyle (1977), Ho and Cao (1991), Fu and Hu (1995), and Birge (1994) address this topic.
Equation 32. The Monte-Carlo simulation model
tNteAAr
ttt
2
2
4.2.5 Complex real option models
When many real options exist simultaneously the options are compounded or nested. The situation occur when the company can choose e.g. between abandon, contract or temporarly shut down. The real option
valuation thus become complex, as the real options may not be additive and the value of the individual options are interdependent. Hence, the valuation must be undertaken as a system of real options.159
Compound option framework The art of real option frame is to capture the right level of detail, the opportunity and tentative path for
growth. Compound option framework generates insights about value and risk. High volatility of Internet companies due to
1. Compound options amplify the volatility of the underlying asset depending on the time-to-
maturity of each option, the cost to exercise and other factors 2. Changes in input options-based models can lead to large revisions in value. Option value falls
significantly when new information suggest that e.g. current growth option might not be exercised, is more expensive to exercise or that the mature business is less valuable than
previously forecasted
The most important benefits of the real options framework are the identification of the risk that will prevent
the full series from being exercised. Risks may be that revenues do not raise to a level that supports profitability and that growth is consequently too slow. Another risk is the possibility of financial distress.
Financial distress may occur due to too slow growth or rise in interest rates. 160
Multiple real options algorithm
An algorithm for evaluating an investment embedding an arbitrary number of real options has been developed. The model is consistent with the analysis of interactions of multiple real options, that is the
alteration of the asset as a consequence of the exercise of a real option. The underlying assumptions are o The costs and savings of additional investments are fixed and known, and independent from the
value of the underlying asset o The evolution of the underlying depend on one stochastic variable
o The interactions between the options are not technological (i.e. not compound options) but
economical. The exercise of an option modify the value of later options and its probability to be `in the money´, but it is not required for it to exists.
o The model does not consider path dependent options o Further expansions or contractions of the project are referred to the scale of the project actually
altered by prior options161
Technical dependence between options
With this expression it is indicated that the existence of a latter real options is conditioned to the exercise of a prior one (e.g. a project can be expanded twice, with the second expansion conditioned to the first one).
To include this possibility in the model have to be modified to consider the past history of the options. This
49
can be done by a state vector, with a number of Boolean elements equal to the number n of real options.
The value 1 in the kth position of the vector indicates that the kth option has been exercised. Since in the
backward moving algorithm, when the value of a certain node is evaluated, it is not known if a prior option has been exercised or not, the value of the node for each possible value of the vector V at that node has to
be evaluated (it is not necessary to evaluate the project value for each of the 2n possibly value of V, because all the elements that refer to a later options, and those that refer to option whose exercise in incompatible
with the node we are evaluating, will be zero). Instead of a unique value at each node, we obtain a set of 2n
values (some of whom are meaningless, as explained above). Moving backward in time, each component of the vector must refer to the corresponding elements of the vectors in the nodes at the next time step.
Path-dependent and multi-variable options can be evaluated with this model, with minor changes. The
technique described here can be adapted to multivariable models (e.g. Hull and White 1990, Boyle 1988)
4.2.6 Real option applications
There is a certain concern about the applicability of RO to a wide range of R&D related problems. The theoretical base behind options valuation is derived from the capital markets and thus assumes market
conditions that are closer to the theoretical construct of perfect competition than most other settings. Even under these conditions, several assumptions made and difficulties left are subject to controversial
discussions. Of course these problems even gain importance when the R&D environment with its
discontinuities and lack of regulation or institutionalized trade is assumed. Some basic properties of the real options approach are described and light is shed on existing problems for the application in R&D project
evaluation. On the other hand, roads to application of the method are shown using the Geske model of option evaluation. One main goal is to broaden and deepen the discussion on real option models in R&D and
Technology Management, which has in some cases been limited to stressing the advantages of the method
rather than reflecting on applicability and a concrete way of application of the method.162
Real options applications in R&D Real option valuation is the tool to use when the NPV calculation show negative NPV but the management
wants to go ahead due to other reasons. Real option valuation (ROV) manages to include great uncertainty and flexibility to valuation163. While the exact or specific impact of a technology idea in its early stages may
not be known for certain, there must be a perceived utility that fits into the business's plans for current or
future markets and which provides both alignment with business strategies and direction and goals for the technical activity. One useful framework for achieving and maintaining this connection is through the
technology development construct. The core of the model is the central positioning of "performance advance," the set of envisioned or sought-after attributes (physical properties) and benefits (manifestations
of those physical properties that are observable and valued by customers or end-users). These attributes and
benefits represent the common base of communication and understanding between technical and marketing partners. The model marries the technical ideas from the research scientists with the market intelligence
from business managers through a set of performance dimensions that are meaningful to both.164
Simulation for real options to characterize risk management in R&D has also been developed. The simulation analysis is provided for optimally managed real option decisions in comparison to benchmarks such as the
NPV based decision rules. The real option model is based on the assumptions for a project to be developed
1) The fixed development costs, 2) Dividend yields at a constant rate of the underlying asset of value and 3) The underlying asset has a random value, which will in each period go up by a factor u or down by a factor
d, where u has a probability and the d a probability (1-).
The option strategies are 1) To exercise immediately when NPV>0, 2) To exercise at a time N (European call) the optimization is to maximize (Strike price - Cost of development, 0) or 3) Toe exercise under
various constraints allowing for optimal delay computed by folding back on the corresponding decision tree.
The constraints may be an American real option with abandonment or immediate development with optimal
50
abandonment. 165 The framework examines the cumulative distribution function of real options strategies and
the decision maker can determine whether which strategy dominates.
Real option applications in the pharmaceutical development projects
By definition of real options, it ahs been argued that pharmaceutical development projects can not lend towards real option applications because:
1. There is no traded underlying asset or portfolio of traded assets that track project value
reasonable 2. A large amount of private risk is not resolved until just before launch and thus prior go-or-no go
decision are largely triggered by the consideration of private risk (i.e. regulatory label) 3. The most important questions in drug development are centered around the value of information
(i.e. information on safety, efficacy, dosage, formulation and side-effects)- and in such application real options has nothing to add beyond current tools. 166
The price of drug development is the value of the drug once sales begin. Once revenu, there are very few fixed costs. The revenues are correlated with the amount of funds spent on marketing and sales. Hence,
much of the value of a drug revenue is driven by the level of sales. Furthermore, neither the quantity nor the price is sensitive to industry or macroeconomic conditions. Country specific risks are associated with
revenues, as nations may vary the reimbursement or budgets for therapeutics. Pharmaceutical stocks are not
good for a tracking portfolio, since they are portfolios of drug projects. The private risk of each project is diversified away at the portfolio level and Pharma stocks have lower stock price volatility (25% p.a.) than
most major industries. The information revelations that move Pharma companies’ stock price are quite different from those revelations that would cause revisions in the value of a single drug project. The
conclusions are that it would be very difficult to establish a portfolio to track the value of a drug in revenue.
167
Real options applications in manufacturing In conjunction with new economy dynamics, the manufacturing systems themselves will also have to change.
We have already seen evidence of trends toward more process data acquisition and analysis, shorter production runs, and more stringent quality requirements.
1. New product introduction
2. Moving a product from research and development to commercialization 3. New plant location
4. Starting or restarting production of existing products
The general idea is to connect manufacturing changes with the real option variables. An European call option
model (Equation 33) can be related to a change to increase production. 168
Equation 33
Tr
TEuropean eXSMaxC
0,, 2
The second issue is to define the detailed cash flow components that will be used to calculate the NPV of an option (S). As the first step of constructing the cash flow series, we need a cost model for manufacturing
activities during the transient period to improve the prediction of the short-term and long-term effects of production delay due to the transition period. In all of the options models, we need to investigate ways to
determine the value of the parameters that relate to the transition. The third issue is to develop models of
change duration. The length of the transition period (T) is another important parameter that needs to be determined. Transition dynamics are usually characterized by high-levels of nonlinearity, disturbance,
uncertainty, and interaction among variables. Such transitions may involve a shift in the level of many factors (e.g., market share, production capacity, or even input and output materials). The fourth issue is to
determine more practical ways of computing real-options value depending upon the nature of the change
problem. There are three main types of option calculators for this computation: a. Black-Scholes option model

51
b. Binomial option model
c. Monte Carlo simulation
The first two methods are based on the concept of risk-free arbitrage in the financial market place. The Monte Carlo simulation approach is often used for valuation options when assumptions of simpler analytical
models are violated. The fifth issue is to develop a general model for optimizing real option valuation. To develop the full-scale real option models for manufacturing based on the other components of the
framework prior research that may guide our formulation for global optimization includes stochastic
programming methods 169 and the nested partitions method. Execution will depend on an understanding of the implementation issues of the optimization procedures - such as efficient search heuristics and sample-
path based techniques - for different option models. 170
The defined option theoretic (or contingent claims) model for the evaluation and analysis of production efforts characterized by two underlying sources of uncertainty, output variability and system breakdowns. For
the analysis, the breakdown propensity was functionally defined by age, rate of production and maintenance
expenditures: where increases in age or rate of production serve to intensify the breakdown propensity, while increased maintenance expenditures dampen this effect. In this vein, we have modeled the production
and maintenance expenditure rates as adapted positive real-valued processes leading to a two variable stochastic control problem embodied by a Bellman optimization equation. For this model, closed form analytic
expressions were obtained for the optimal operating policies, and in light of an insurance option on the
breakdown repair costs. The model was also extended to derive an arbitrage free insurance premium as a function of the production and maintenance policy in place. For valuation purposes, the model was solved
numerically (by a stochastic dynamic program) using finite difference methods.171
Real option applications for valuation of IPR An intangible asset is, if it is successfully managed-a claim to a future benefit that does not have a physical
or financial embodiment. When that claim is legally secured, as with a patent or copyright, we generally
call that asset "intellectual property." Intangibles are generated by one of three things: 1. Innovation, such as Merck's R&D
2. Unique organizational design, such as Cisco's Internet-based product installation 3. Maintenance system and human resources, such as the system Xerox has designed to allow
employees to share information. 172
Real option applications for valuation of human resources
The changes in a business's structure and strategic focus gave rise to the importance of intangibles. The intangibles create value by two major things. One thing differentiates intellectual capital or knowledge assets
from physical and financial assets, and that's what economists call "rivalry" and "non-rivalry" assets. Physical
assets are rival assets. Different users rival for the use of an asset. This asset cannot be used elsewhere at the same time. Physical, human and financial assets are rival, or scarce, assets, where the scarcity is
reflected by the cost of using the assets. Second, on the other hand, intangible assets are non-rival assets. The use of an asset in one case does not prevent it from being used simultaneously by others in another
case. This is what some people call "scalability" or the ability, after you've made the first initial investment in intellectual capital, to scale it endlessly and enjoy increasing returns. And if you know how to work your
market you can get huge value out of it. So this non-rivalry attribute. 173
Valuable in a biotech companies is not the networked computer system or the new lab equipment, but the
minds behind it all. Assessing the effectiveness of human capital is difficult, let alone trying to attach a dollar amount to it. Analysts and experts agree that nearly 75 percent of the sources of value in a company are
never reported and we have yet to come up with an accounting system that can record it all. The hidden
value in a company is usually lumped under "intangibles.174 Assessing the value of your employees is becoming more important in the current economic downturn: Productivity, experience, and cultural fit,
among other characteristics, take on added importance when times are not so good. It was discovered that 35 to 40 percent of portfolio allocation decisions are based on non-financial information. When looking at
IPOs of companies that had gone public from 1986 to 1997 and found that about 50 percent of them had

52
failed to either exceed or maintain the price of their stock when they went public. "The only statistically
significant difference between those that succeeded at this and those that didn't was a nonfinancial factor, whether employees' interests were aligned with corporate strategy. Various models for quantifying human capital abound 175, 176
4.2.7 Conclusions on real option valuation
The problem of using real options to company valuation is that the underlying assets is not traded. Hence
caution must be taken when interpretation the results of real option valuation. Uncertainty is increased due to high complexity and the input variables are difficult to determine. The Black-Scholes model assumes that
the price of the asset follows a continuous process, i.e. there are no jumps like technological discoveries might cause. The assumption that exercise is instantaneous may be difficult to justify with real options,
where the exercise may be delayed by requirements of various internal or external factors (regulatory
approvals). Finally, the fact that competitors also have access to real option is often neglected. 177
The major difference among these approaches is the perspective used to determine value, which may then lead to differences in accounting for risk. Certainly, there is no dominant choice among these methods for all
cases. Under certain conditions, decision analysis plus some other treatments (such as risk-adjusted probabilities) may yield results that are consistent with the option approach. However, both decision analysis
and capital asset pricing analysis are based on fixed investment scenarios, such that there is no clear way to
reconcile, aggregate, or choose between scenarios. Furthermore, many of the changes taking place in manufacturing operations are most likely market driven.178
The "standard" binomial option model, like the original Black-Scholes equation, is based on the assumption of
a constant volatility parameter. But when the model is applied to real-world data, even using implied volatility
to tie the model to the overall level of market prices leaves considerable cross-sectional mispricing. Rubinstein and others showed how to take the next step, to imply out a whole binomial tree that can match
a set of option market prices with the same expiration. This is not sufficient, however, to fit a full range of options with different strikes and maturities. A paper shows another way to generalize the standard binomial
approach to allow additional flexibility to match market prices. This technique involves revising the relationship between the probabilities of taking particular paths through the tree and the total probabilities of
reaching specific nodes. 179
Figure 14. The real options frontier 180
Model risk
Imperfect proxies
Lack of liquidity
Private risk
Organizational rigidities
Distance from markets
Com
ple
xity
53
5. VALUATION OF BIOTECHNOLOGY COMPANIES
The purpose of this study is to build a real option model and to valuate a case company. Then a real option
model will be produced as based on the findings in the literature part (4) of this study. The real option model will be applied on a real case valuation. The company selected for the case valuation is BioTie Therapies Oyj.
The first driver of framework selection is the underlying business structure. For instance, companies
developing pharmaceuticals all follow the same, regulated process. For other businesses, the industry
structure is less homogenous and the companies might be involved in multiple businesses. The product development process might have similarities but it can be hard to think of average projects. The degree of market and project risks drives the choice of methodology. The second driver affecting the applicable valuation methodology is the availability of information. The pharmaceutical industry dada yield in significant
historical information on time to market, probability of success, cost stand stock prices. However, significant
differences in time-to market and cost may occur in the biopharmaceutical development projects. Other business may have less historical or less homogenous data available. Significant variations between
businesses may exist and it might be difficult to assemble relevant databases. Financial models work well when there are only a few underlying variables of uncertainty and when these variables have an established
market price. Decision analysis is compatible when project risk is more important and when there are no effective market drivers for uncertainty.
Finally, the goal of the real option valuation affects the choice of methodology. If real option valuation recognizes additional value due to flexibility, the valuation is next a balance between precision and
complexity. The choice of method is based on how the real option valuation methodology fit into the organization. Option valuation can be more valuable in strategic terms than in precision. However, mis-priced
real option valuation creates arbitrage and errors in real options values are more difficult to identify.
Sensitivity analysis helps to address remaining uncertainties. 181
Hence, in order identify factors affecting valuation of biotechnology companies and the study will begin with an analysis of the industry structure. Second, the study will conduct an analysis of the case company (5.2) in
order to evaluate the availability of information, spot real options available to the case company. Third, the study will explore the options theory in order to incorporate the industry specific factors to the real option
valuation model.
Fourth, the real option model for valuation of biotechnology companies will be constructed based on real
options theory and based on the industry and company analysis. Real option valuation includes four main steps, i.e. 1) the determination whether an real option approach is sound, 2) the selection of valuation
method, 3) the valuation process and 4) adjustments to the valuation. The evaluation whether a real option
approach is applicable, is performed by studying the analogy to options (asymmetric payoff structure, real option characteristics). Presence and identification of real options is modeled. The valuation process begins
with estimation of the option parameters and quantitative valuation. The valuation is concluded by comparison to the base NPV calculations. Finally, sensitivity analysis is performed on option values. 182
According to option theory, the parameters of real option valuation are the risk-free interest rate, the time to
maturity, volatility, investment, and price of the underlying asset. In real option valuation the adjustment for
risk will be included in the volatility of the returns. The relevant risk factors associated biotechnology companies are identified is of an industry study produced in chapter (5.1).The results of the industry analysis
and company analysis will be used as the base for selection of a real option method and the selection of a replicating portfolio for estimation of the volatility parameter in the real option model.

54
5.1 Valuation aspects in the biotechnology industry
No standard valuation methodology can be applied universally in order to determine the value of biotechnology companies. Each available approach involves assumptions compounded by additional
assumptions. There is no method to isolate any specific scenario or state of reasonable degree of certainty
that the specific scenario will occur. How can a market share be predicted for a company when neither the product nor the markets exist?
The fair value of a biotechnology company is typically driven by the value of the company’s intellectual
property. The value of the tangible assets are minimal in comparison to their intangible assets to which their
returns can primarily be attributed. The difficulty is magnified in biotechnology companies where a company’s ability to convert its intellectual property to a revenue stream is subject to strict governmental regulations
and a lengthy approval process. Biotechnology investments may become worthless, as changes in the environment occur. The important issues in valuation of biotechnology companies are according to analysts
The pressure to deliver new products and services will increase The pace of technological development will increase
The level of quality is a risk factor for (European) biotech companies183
Today, analysts use the DCF, the risk-adjusted DCF for valuation of biotechnology companies. The method
for comparing companies to their peer group is not taught to give a true sense of a company’s value as the flurry interest around companies may inflate the stock price. 184185
5.1.1 Biotechnology value creation and critical success factors
A biotechnology company is a knowledge creation machine and the organization must b able to manage that knowledge effectively in order to maintain competitive advantage (
Figure 15). Today, there are a great number of channels of commercial interaction, which are dynamic and
rapid. Rapid change, faster cycle times, globalization, new process models and breakthrough technologies all
contribute to the context of new product development in the biotechnology industry. The ability to lever knowledge as an enable or business process is the key component to success. The speed of development
process of new products needs to be increasingly short, effective and enable to generate new ideas into the product pipeline.
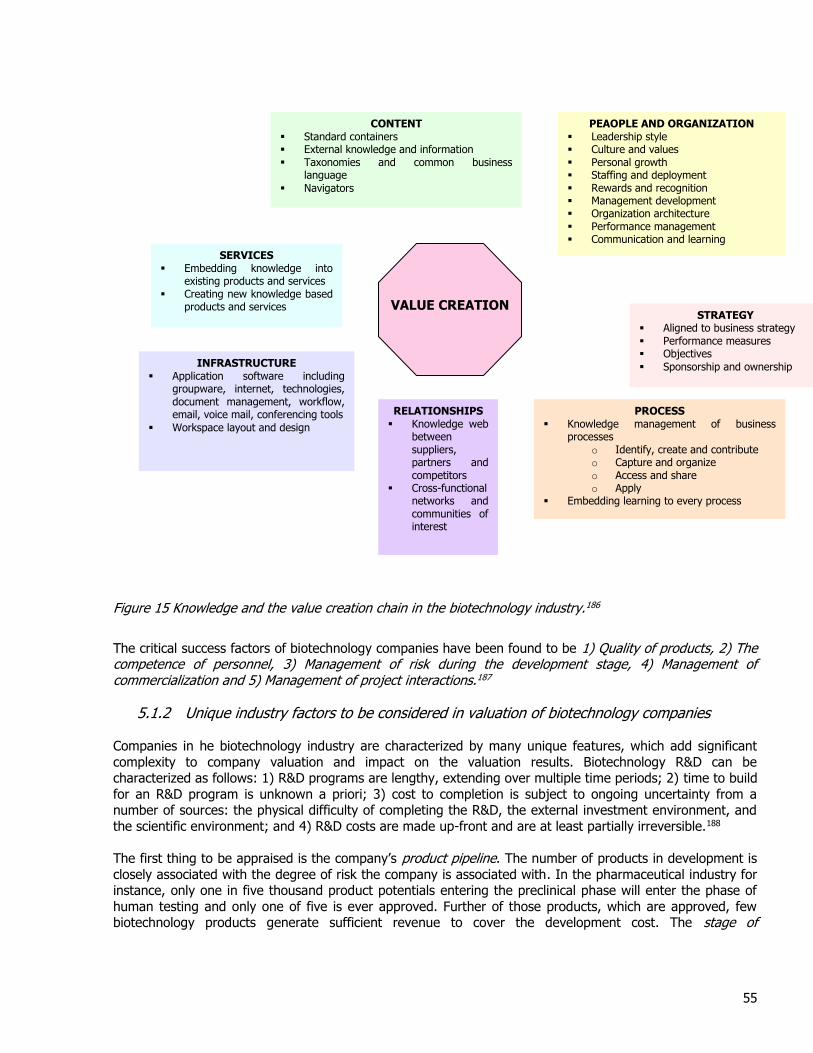
55
Figure 15 Knowledge and the value creation chain in the biotechnology industry.186
The critical success factors of biotechnology companies have been found to be 1) Quality of products, 2) The competence of personnel, 3) Management of risk during the development stage, 4) Management of commercialization and 5) Management of project interactions.187
5.1.2 Unique industry factors to be considered in valuation of biotechnology companies
Companies in he biotechnology industry are characterized by many unique features, which add significant
complexity to company valuation and impact on the valuation results. Biotechnology R&D can be characterized as follows: 1) R&D programs are lengthy, extending over multiple time periods; 2) time to build
for an R&D program is unknown a priori; 3) cost to completion is subject to ongoing uncertainty from a number of sources: the physical difficulty of completing the R&D, the external investment environment, and
the scientific environment; and 4) R&D costs are made up-front and are at least partially irreversible.188
The first thing to be appraised is the company’s product pipeline. The number of products in development is
closely associated with the degree of risk the company is associated with. In the pharmaceutical industry for instance, only one in five thousand product potentials entering the preclinical phase will enter the phase of
human testing and only one of five is ever approved. Further of those products, which are approved, few biotechnology products generate sufficient revenue to cover the development cost. The stage of
VALUE CREATION
STRATEGY Aligned to business strategy Performance measures Objectives
Sponsorship and ownership
CONTENT Standard containers External knowledge and information Taxonomies and common business
language
Navigators
PROCESS Knowledge management of business
processes o Identify, create and contribute o Capture and organize o Access and share o Apply
Embedding learning to every process
PEAOPLE AND ORGANIZATION Leadership style Culture and values Personal growth Staffing and deployment Rewards and recognition Management development Organization architecture Performance management Communication and learning
RELATIONSHIPS Knowledge web
between suppliers, partners and competitors
Cross-functional networks and communities of interest
SERVICES Embedding knowledge into
existing products and services Creating new knowledge based
products and services
INFRASTRUCTURE Application software including
groupware, internet, technologies, document management, workflow, email, voice mail, conferencing tools
Workspace layout and design
56
development of those products in the pipeline is also critical to the company valuation. It is appraiser for the
length of time before a product can be marketed and like likelihood that the product will reach the market.
The development costs per new medical product have increased significantly during the past decade.
Especially the costs of the phase III clinical trials represent a significant part of the total development costs of an approved drug. There is also a lot of pressure on big companies to be able to utilize the patent-
protected life (20 years) of the drug molecule as long as possible. As a result, a sector of small research-
oriented companies (“biopharma”) has arisen, offering late-stage development projects to pharmaceutical companies (Big Pharma). This gives an opportunity for value creation for the small companies, especially if
they are able to run the development projects more cost-effectively, than big companies. The more and more frequent alliances between pharmaceutical industry and biopharmaceutical companies are giving “big
pharma” the access to technologies to provide the next blockbuster drug, and “biopharma” the life-sustaining cash189. The costs in the phase III clinical trials rise so strongly that they are too expensive for a small
company to finance.
The burn rate is another important issue when valuation biotechnology companies. It refers to the level and
rate of expenditures required for research and development of the product(s). When assessing the company risk it is important to compare the burn rate to its cash in hand and funds available. The survival index
measures the relationship between cash and the net burn rate. Typically, small companies have the smallest
Survival index and cash to recover only 13 months of research and development. A company needs to have access to sufficient capital resources in order to sustain the significant research and development.
Many biotechnology companies focus on antibodies and other biologic drugs rather than on new chemical
molecules (small molecules). Generally, the biologics can be developed faster than small molecules. In addition to these so-called “product companies” aiming to develop a new drug, there are also “platform” or
technology companies, offering, for instance, a technology platform for high-throughput lead finding. Both
type of companies, however, look for strategic alliances or licensing agreements to finance their operations and to create revenues.
Partnerships and alliances have an important role in the success of many biotech start-ups and thus affect
positively the value of biotech companies. Few start-ups have sufficient cash available to last more than five
years and in fact 33% have cash to last less than one year. There is hence a great impetus for (small) biotechnology companies to find venture capital often in form of a partner, in order to survive the
development process. The partner often an established pharmaceutical company is able to benefit from the transfer of knowledge by obtaining marketing and manufacturing rights to products develop by their
biotechnology partners. While access to capital and improved chances for success of a partnership
arrangement increase value, the aspect of rights shared must be considered. For instance marketing and manufacturing rights can be valuable. It is important to determine whether the biotech company has
obtained comparable value in return through means such as invested capital or licensing fees.
Manufacturing, marketing and distribution capabilities impact value because they determine whether and how fast a product can generate revenues if it reaches the market. The existence of a product is not
sufficient to sustain value. A demand must be created and the product must be able to reach in the hands of the demand.. In order to generate returns the product must be sold in a quantities, at a price produced at reasonable cost in sufficient quantities. Again sufficient capital is required and the strategic alliances are
important sources of finance.
Protection of intellectual property is an important element of valuation. Future revenues are often forecasted
globally. However, protection of intellectual property in global scale is both expensive and difficult. Piracy and infringement of intellectual property occurs frequently. Protection of intellectual property improves the risk
factor associated with revenue streams and hence increase value.

57
A key feature of the biotechnology industry is that the product life cycle has two distinct life cycles.; the
development life cycle and the product life cycle. The development cycle is long (up to 20 years) as
compared to the product cycle. This due to the fact that the market is continuously refreshed up with new or improved products.
Finally, the market for biotechnology products is compounded by the impact of changing regulations and
governmental policies. Changes in health care politics can have a major impact on the product pricing and
the market size. Even the influence of insurance companies might affect the market for biotechnology products. The lawsuits against medical device manufacturers, restructuring of FDA approval procedures,
patient expectations and the health care reform movement are changing the future of medical device community.
The decision whether or not to initiate the investment, and once initiated, the decision whether or not to
continue with the next stage of R&D, is predicated on a comparison of current expected cost to completion
with a critical value, computed by applying pricing techniques for financial options to the biotechnology R&D investment decision, which, as stated above, can be re-stated as a question of optimal exercise of an option
to invest. The critical value is the threshold level of cost to completion, in excess of which it is economically infeasible to initiate or continue an R&D investment. A firm’s critical value is a function of four key
parameters: 1) the value of investment in an R&D project, 2) the per-period rate of investment, 3) the risk-
free rate of interest, and 4) uncertainty. The latter consists of technical uncertainty relating to the cost of successfully completing the project, regulatory uncertainty, and scientific uncertainty, which relates to new
results from the scientific community indicating that an R&D program should be halted. If cost to completion exceeds the critical value, the firm will either delay initiating the project, or terminate it midstream if it has
already begun. Conversely, if cost to completion is below the critical value, the firm will either initiate the investment, or proceed with the next stage of the R&D if the project is already underway.
The sources of heterogeneity has been shown to imply a higher critical value for U.S. biotechnology firms relative to European firms, the real options framework suggests that in managing their options to invest in
biotechnology R&D, U.S. firms would initiate investment earlier, innovate more rapidly, persevere longer in the face of mounting R&D costs, and ultimately, successfully complete more R&D projects than European
firms. The presence of heterogeneity in the form of a higher U.S. per-period rate of investment and a lower
U.S. level of regulatory uncertainty implies that U.S. firms will apply a looser decision criterion in exercising their options than the European firms. This in turn yields the result that, on average, the pace of innovation in the U.S. biotechnology industry will exceed that in the European industry, suggesting that biotechnology R&D and production will eventually concentrate in the U.S. However, recent changes in the industry structure
suggest that the pattern of specialization in biotechnology may, in the long run, be determined by other
factors as described in the economic literature on multinationals. Competition for external capital, and a more flexible R&D environment, may have pushed the start-ups to be early entrants to the industry relative to the
multinationals. Multinationals have delayed exercising their options to invest, preferring instead to wait for more information on the future profitability of biotechnology by observing the performance of the start-ups,
perhaps in the form of products reaching the marketplace, or at least steady progress in R&D programs. Now that a certain "critical mass" has been achieved in the industry by the start-ups, multinationals have begun to
exercise their investment options by forming alliances or merging with existing biotechnology firms. 190, 191 All the factors identified (5.1.2) have one thing in common- they affect risk. There are no definite answers to
these questions and assumptions must be made on experience, historical data, research and instinct. The challenge is to be able to estimate earnings of a product, company and a market for which no historical
information is available. The valuation methodologies used for valuation of biotechnology companies are 1) DCF, 2) Monte Carlo simulation and 3) Option pricing models.192 This approach, however, ignores three key features of many real world investment problems: irreversibility, ongoing uncertainty, and the ability to delay
investment after the opportunity to invest is acquired193. In the real options framework, the opportunity to invest in a new biotechnology R&D program is likened to holding a financial option, where the firm has the
right, but not the obligation, to initiate the first stage of investment - in other words, exercise the investment
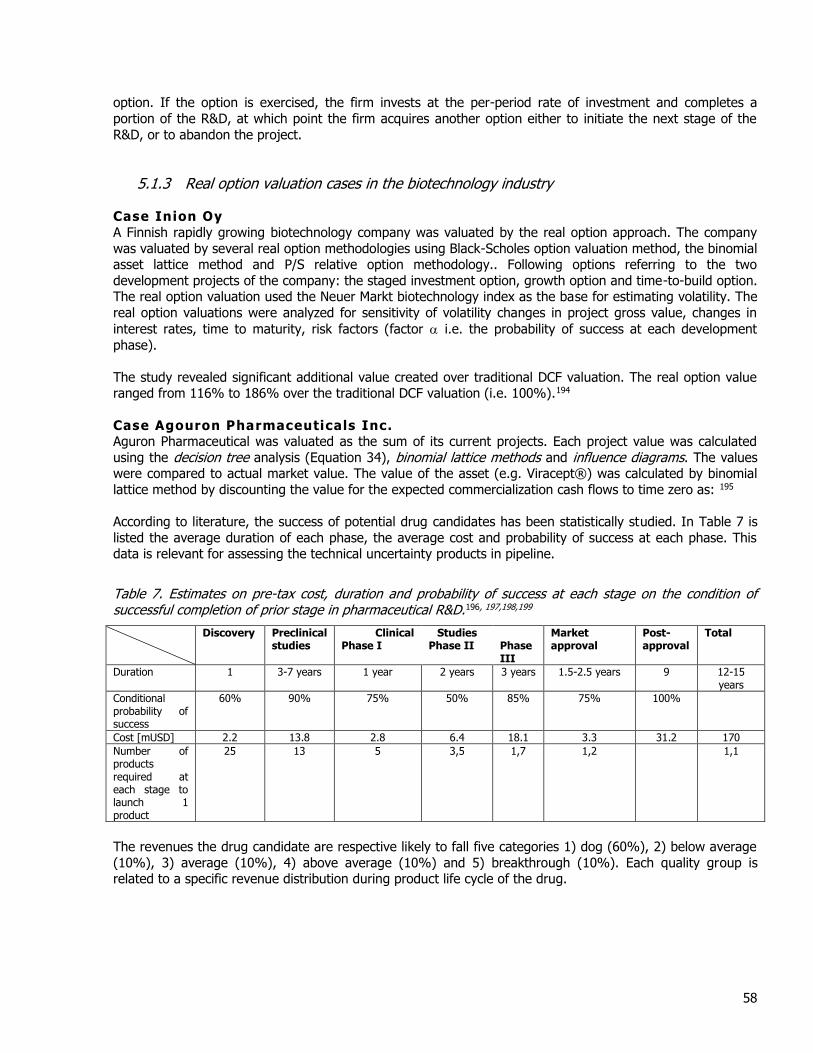
58
option. If the option is exercised, the firm invests at the per-period rate of investment and completes a
portion of the R&D, at which point the firm acquires another option either to initiate the next stage of the
R&D, or to abandon the project.
5.1.3 Real option valuation cases in the biotechnology industry
Case Inion Oy
A Finnish rapidly growing biotechnology company was valuated by the real option approach. The company
was valuated by several real option methodologies using Black-Scholes option valuation method, the binomial asset lattice method and P/S relative option methodology.. Following options referring to the two
development projects of the company: the staged investment option, growth option and time-to-build option. The real option valuation used the Neuer Markt biotechnology index as the base for estimating volatility. The
real option valuations were analyzed for sensitivity of volatility changes in project gross value, changes in
interest rates, time to maturity, risk factors (factor i.e. the probability of success at each development
phase).
The study revealed significant additional value created over traditional DCF valuation. The real option value ranged from 116% to 186% over the traditional DCF valuation (i.e. 100%).194
Case Agouron Pharmaceuticals Inc. Aguron Pharmaceutical was valuated as the sum of its current projects. Each project value was calculated
using the decision tree analysis (Equation 34), binomial lattice methods and influence diagrams. The values were compared to actual market value. The value of the asset (e.g. Viracept®) was calculated by binomial
lattice method by discounting the value for the expected commercialization cash flows to time zero as: 195
According to literature, the success of potential drug candidates has been statistically studied. In Table 7 is
listed the average duration of each phase, the average cost and probability of success at each phase. This data is relevant for assessing the technical uncertainty products in pipeline.
Table 7. Estimates on pre-tax cost, duration and probability of success at each stage on the condition of successful completion of prior stage in pharmaceutical R&D.196, 197,198,199
Discovery Preclinical studies
Clinical Phase I
Studies Phase II
Phase III
Market approval
Post- approval
Total
Duration 1 3-7 years 1 year 2 years 3 years 1.5-2.5 years 9 12-15 years
Conditional probability of success
60% 90% 75% 50% 85% 75% 100%
Cost [mUSD] 2.2 13.8 2.8 6.4 18.1 3.3 31.2 170
Number of products required at each stage to launch 1 product
25 13 5 3,5 1,7 1,2 1,1
The revenues the drug candidate are respective likely to fall five categories 1) dog (60%), 2) below average
(10%), 3) average (10%), 4) above average (10%) and 5) breakthrough (10%). Each quality group is related to a specific revenue distribution during product life cycle of the drug.
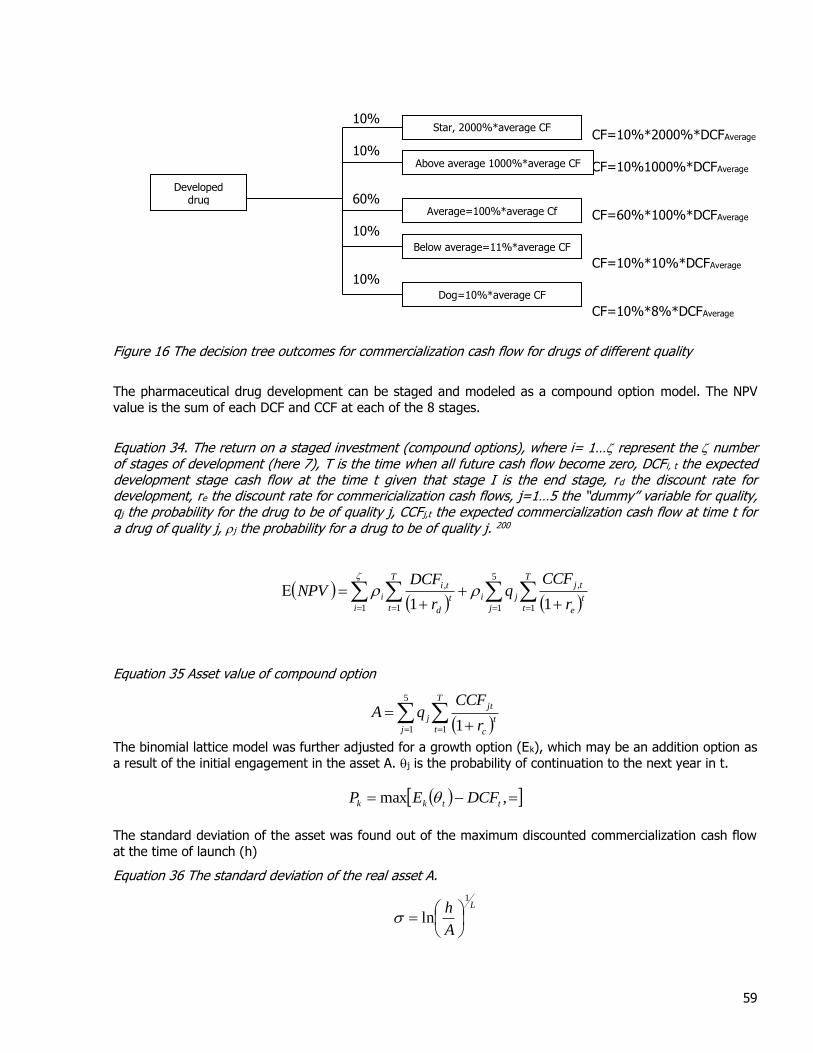
59
10%
CF=10%*2000%*DCFAverage 10%
CF=10%1000%*DCFAverage
60%
CF=60%*100%*DCFAverage 10%
CF=10%*10%*DCFAverage
10%
CF=10%*8%*DCFAverage
Figure 16 The decision tree outcomes for commercialization cash flow for drugs of different quality
The pharmaceutical drug development can be staged and modeled as a compound option model. The NPV
value is the sum of each DCF and CCF at each of the 8 stages.
Equation 34. The return on a staged investment (compound options), where i= 1… represent the number of stages of development (here 7), T is the time when all future cash flow become zero, DCFi, t the expected development stage cash flow at the time t given that stage I is the end stage, rd the discount rate for development, re the discount rate for commericialization cash flows, j=1…5 the “dummy” variable for quality, qj the probability for the drug to be of quality j, CCFj,t the expected commercialization cash flow at time t for a drug of quality j, j the probability for a drug to be of quality j. 200
T
tt
e
tj
j
ji
i
T
tt
d
ti
ir
CCFq
r
DCFNPV
1
,5
11 1
,
11
Equation 35 Asset value of compound option
T
tt
c
jt
j
jr
CCFqA
1
5
1 1
The binomial lattice model was further adjusted for a growth option (Ek), which may be an addition option as
a result of the initial engagement in the asset A. j is the probability of continuation to the next year in t.
,max ttkk DCFEP
The standard deviation of the asset was found out of the maximum discounted commercialization cash flow
at the time of launch (h)
Equation 36 The standard deviation of the real asset A.
L
A
h1
ln
Developed drug
Star, 2000%*average CF
Above average 1000%*average CF
Average=100%*average Cf
Below average=11%*average CF
Dog=10%*average CF
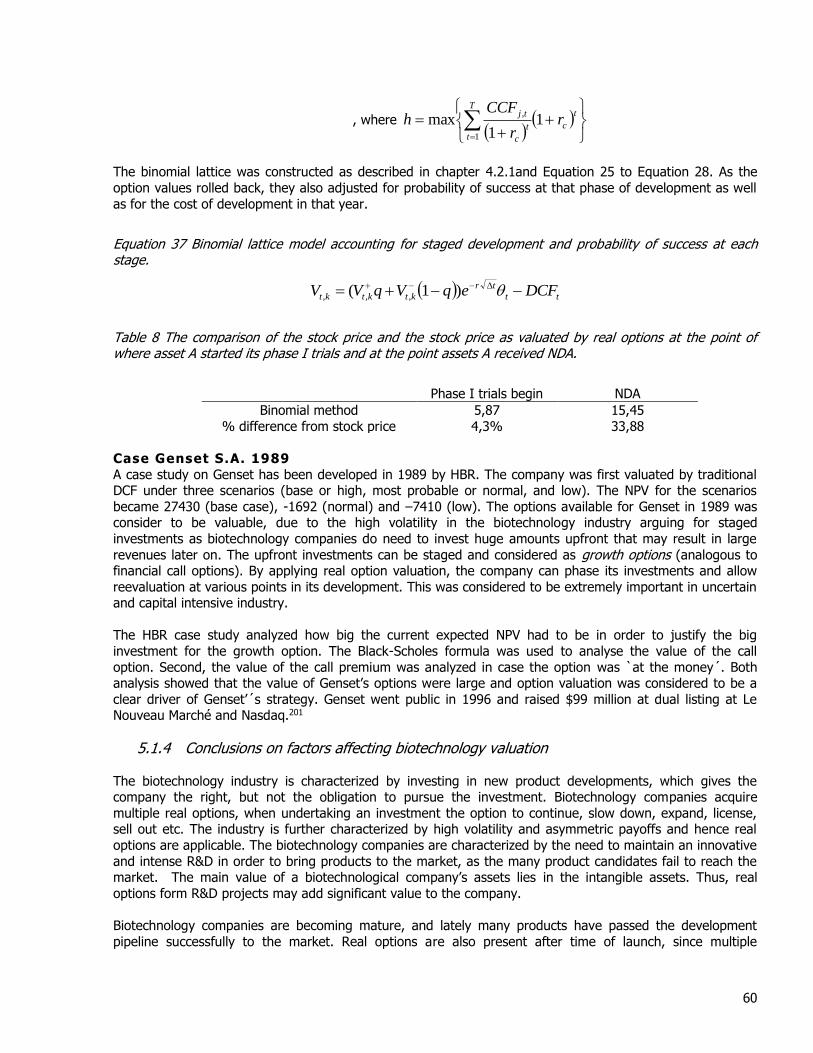
60
, where
t
c
T
tt
c
tjr
r
CCFh 1
1max
1
,
The binomial lattice was constructed as described in chapter 4.2.1and Equation 25 to Equation 28. As the
option values rolled back, they also adjusted for probability of success at that phase of development as well
as for the cost of development in that year.
Equation 37 Binomial lattice model accounting for staged development and probability of success at each stage.
tt
tr
ktktkt DCFeqVqVV )1( ,,,
Table 8 The comparison of the stock price and the stock price as valuated by real options at the point of where asset A started its phase I trials and at the point assets A received NDA.
Phase I trials begin NDA
Binomial method 5,87 15,45
% difference from stock price 4,3% 33,88
Case Genset S.A. 1989
A case study on Genset has been developed in 1989 by HBR. The company was first valuated by traditional DCF under three scenarios (base or high, most probable or normal, and low). The NPV for the scenarios
became 27430 (base case), -1692 (normal) and –7410 (low). The options available for Genset in 1989 was consider to be valuable, due to the high volatility in the biotechnology industry arguing for staged
investments as biotechnology companies do need to invest huge amounts upfront that may result in large
revenues later on. The upfront investments can be staged and considered as growth options (analogous to financial call options). By applying real option valuation, the company can phase its investments and allow
reevaluation at various points in its development. This was considered to be extremely important in uncertain and capital intensive industry.
The HBR case study analyzed how big the current expected NPV had to be in order to justify the big
investment for the growth option. The Black-Scholes formula was used to analyse the value of the call
option. Second, the value of the call premium was analyzed in case the option was `at the money´. Both analysis showed that the value of Genset’s options were large and option valuation was considered to be a
clear driver of Genset’´s strategy. Genset went public in 1996 and raised $99 million at dual listing at Le Nouveau Marché and Nasdaq.201
5.1.4 Conclusions on factors affecting biotechnology valuation
The biotechnology industry is characterized by investing in new product developments, which gives the company the right, but not the obligation to pursue the investment. Biotechnology companies acquire
multiple real options, when undertaking an investment the option to continue, slow down, expand, license, sell out etc. The industry is further characterized by high volatility and asymmetric payoffs and hence real
options are applicable. The biotechnology companies are characterized by the need to maintain an innovative
and intense R&D in order to bring products to the market, as the many product candidates fail to reach the market. The main value of a biotechnological company’s assets lies in the intangible assets. Thus, real
options form R&D projects may add significant value to the company.
Biotechnology companies are becoming mature, and lately many products have passed the development
pipeline successfully to the market. Real options are also present after time of launch, since multiple

61
biotechnology companies do contract, license their marketed products (i.e. option to contract, sell). The
companies also have the opportunity to expand the market area or switch down, if some product or market
is found inappropriate (non profitable). Hence the strategy pursued and the structure chosen gain competitive advantage and ultimately profitable revenues alters significantly the value created for its owners.
Thus, spotting and managing its real options actively, the company can add shareholder value.
A typical biotechnological product has two distinct lifecycles; the development lifecycle and the product
lifecycle. Milestones characterize the development cycle: a discovery process and development process and a validation process. The product development process is technologically related to each other, i.e. the
previous must be concluded in order to proceed with the next process. The cost associated with each phase of product development can be associated as milestone payments related to each phase. When all
development phases are successfully concluded the product released to the market(s) and the product lifecycle starts. This because the intellectually property is typically well protected in the biotechnology
industry and provide the product with a monopolistic position on the market. Off course, the product will face
competition from other products derived by different technologies, but the affect will not alter the shape of the revenue distribution. At the time of expiration of the patent protection the entering of generic products
affect the slope of the revenue distribution curve. Once the product is marketed, the revenue distribution can however be affected be technological jumps from related technologies within the industry.
The risk associated with the product is quite different in its distinct lifecycles. The risks in the development phase is mostly associated with company endogenous risks i.e. technological risks and the risk of not
receiving sufficient funding to proceed wit the project. The product lifecycle is mostly associated with market risk due to competition and alteration in the product demand caused e.g. by changes in health care politics.
Hence the real option framework can be divided into two related option models.
A typical biotechnology company either pursues two different technology strategies: a target based strategy
or a technology platform strategy. In the target strategy company focuses on acquiring knowledge and expertise in all technological areas related to the chosen target area. Hence, products and services resulting
from technologically different R&D projects are developed. Thus, technological and perhaps even economical synergy is not created from different R&D projects. The technological platform strategy is basically to
develop several different applications from the technological platform. Thus, the development of potential
products resulting from the technological platform strategy is characterized by significant interactions and may result in multiple products from the same basic source. Technological synergy is hence significant.
Thus, when valuating the potential products coming from a biotechnological company’s pipeline it is
motivated to use different approaches depending on the technology strategy pursued. When valuating
multiple products without technological interaction the risk is more associated with the degree of technical uncertainty i.e. the phase of development and time to market. The total value of a target based R&D
strategy is hence the sum of each project recognizing the time to market of each product and the probability of success related to each project. Allowing for flexibility i.e. adding option valuation to the development
projects can be done by the binomial lattice method. Thus, applying real option valuation to the development projects allow for decision making during the development phase.
As the target based technology strategy can be calculated as ‘sum of the parts´ and the technology platform strategy can not always make use of the rule of additivity due to the complex interactions of the
development projects. The technology platform strategy may result in several interconnected products and cannot be valuated as the `sum of the parts´. The technological platform needs to be valuated recognizing
the interactivity facing the same risk factor. As the same technology platform can result in a large number of
products for different markets, the binomial lattice method for nested options is applicable. Multiple technological platforms can however be added.
The time to market is critical (i.e. the time to maturity of an real option). The time and the probability of
success are affected by the use of strategic partners as described in.

62
Strategic alliances should be recognized when valuating the company’s R&D.
As companies pursue different marketing strategies as well depending on the product platform, it could be useful to apply the same distinctive option models. The target bases strategy result in marketing synergy and
the technological strategy in endogenous synergy. However, the greatest risk associated with the product on the market is the exogenous marketing risk. It might be more useful to balance the valuation towards
applicability on the expense of details resulting in too much complexity. The marketing risk associated with a
biotechnological company depends on the market segment and to a lesser extent on the geographical region. The revenues are affected by the use of marketing partners and their degree of the share of the revenues.
Finally, the access to sufficient funding to maintain a competitive product pipeline is critical to the success of
a biotechnology company. The access of funding depend on the size of the company, as large companies are more liquid an attract investors more easily. The need for funding depends on the burn-rate of the company.
Few private and/ or small companies have sufficient cash and funding available to last long. They face hence
a greater risk of not being able to maintain a competitive product pipeline.
5.2 Analysis of the case company BioTie Therapies Oyj
BioTie’s drug development programs focus on drugs for inflammation, thrombosis, and cancer. Development
programs are based on patented Finnish discoveries. The company is a university spin-off, and was established in June 1992 by Markku and Sirpa Jalkanen, both professors at the University of Turku, Finland,
at the time.
The company was first mainly a holding company of the intellectual property rights that were received as a
result of the scientific research directed by Markku and Sirpa Jalkanen. In 1996 two Finnish venture capital funds (Sitra and Aboa Venture) invested 3 EURm in the company and it started it’s own research and
development projects at the Turku BioCity facilities. The second round of venture capital financing was organized in 1998 and yielded 8,5 EURm of new capital. Co-operation agreement on contract manufacturing
with Boehringer-Ingelheim Pharma AG was reached also in 1998. BioTie filed its first Investigational New
Drug Documents to the National Agency of Medicine in 1999. Company’s IPO was in June 2000 yielding 18,4 EURm of capital. BioTie is listed on the NM-list of Helsinki Stock Exchange.
The development projects are build on three core competencies, one of which (VAP-1) is based on a finding
that a certain protein, called vascular adhesion protein, has a key role in the pathogenesis of
inflammation: the uncontrolled accumulation of leukocytes into blood vessels and tissues. BioTie also has
a competency in understanding the nature of interaction between collagen and integrin 21 receptors which
may have a role in certain types of cancer, in the binding of tumor cells to collagen, as well as in
thrombosis, initiating platelet adhesion to collagen fibrils. These two competencies are in fact an in-depth understanding of pathogenic mechanisms of some significant diseases, and therefore, BioTie has got a
platform to develop efficient drug candidates to target the specific receptors of VAP-1 and integrin 21. The
third competency of BioTie is production know-how to patented methods to manufacture biologically
active linear polysaccharides (BALP). This competency enables BioTie to develop a novel biosynthetic route to manufacture linear polysaccharides, such as heparins, that are currently animal-derived products
and subject to major concern of the biological hazard involved. Heparins are widely used as anti-thrombosis agents in medical care. We will discuss these competencies and their relation to BioTie future products in the
latter parts of this report.
5.2.1 The technology strategy of the case company
From the customer’s perspective, BioTie develops therapeutic drug potentials for treatment of thrombosis,
inflammatory diseases and cancer (Figure 17). The company pursues mainly a target based technology

63
strategy. The company serves these markets with the current four drug development projects (the
corresponding product trade names in parentheses):
1. Antibody program against VAP-1 (Vapantix, Huvap) 2. Small molecule inhibitor of VAP-1 SSAO (Vapill)
3. Biosynthetic heparin (Bioheparin)
4. Integrin 21 inhibitors
These projects aim to develop new drugs for several indications in the selected therapeutic areas.
Figure 17. The methodology for analyzing the products, processes and services and ultimately the technologies used by BioTie in order to serve a chosen market.
5.2.2 The market for selected target areas
The market for the VAP technology products The most important indications in the area of anti-inflammatory drugs are: rheumatoid arthritis (RA), asthma,
ulcerative colitis, psoriasis, myocardial infarction. It is estimated that in the industrialized world approximately
40 million people suffer from inflammatory diseases, where mainly cortiosteroids and painkillers are used. There is a definite vast unmet need to develop products, which could heel those diseases. As an example
those 10 years after diagnosis 50% of the patients with rheumatoid arthritis are disable to work.
The VAP technology is found to affect several inflammatory diseases: RA
IBD
Psoriasis Ischemia-reperfusion injury in myocardial infarction (not in normal blood vessels)
The competitors on the market for the VAP technology products
There is a great number of competing products targeted at inflammatory diseases. However, VAP is a unique
drug target. Amgen, Biogen and CAT from the USA and Genmab and Celltech from Europe have competing projects for the Hupvap and Vapill drug candidates of BioTie. None other products are targeted ate the VAP-1
receptor, but rather at tumor necrosis factor-alpha (TNT-). Most of the competitors’ projects are in phase
III and II.
The market for the BALP technology products
Heparin is widely used as an anticoagulant to prevent blood from clotting – an event that can lead to thrombosis. The worldwide heparin sales (also low-molecular weight heparins) are estimated to be more than
Planning (0 y) Vision (6 y)
Inflammatory diseasesInflammatory diseases ThrombosisThrombosis
Vapantix, Huvap, VapillVapantix, Huvap, Vapill BioheparinBioheparinIntegrins,
Tumor derived growth factors
Integrins,
Tumor derived growth factors
Alpha2beta1 integrinAlpha2beta1 integrin
PRODUCT
GROUPS
TECHNOLOGYVAP1VAP1 BALPBALPMABMAB
Small moleculeSmall molecule
CancerCancer
MARKET
Planning (0 y) Vision (6 y)Planning (0 y) Vision (6 y)
Inflammatory diseasesInflammatory diseases ThrombosisThrombosis
Vapantix, Huvap, VapillVapantix, Huvap, Vapill BioheparinBioheparinIntegrins,
Tumor derived growth factors
Integrins,
Tumor derived growth factors
Alpha2beta1 integrinAlpha2beta1 integrin
PRODUCT
GROUPS
TECHNOLOGYVAP1VAP1 BALPBALPMABMAB
Small moleculeSmall molecule
CancerCancer
MARKET
64
USD 2 bn in 2000 with a forecasted 5 % annual growth rate. Whereas various previously animal based
pharmaceutical proteins, such as insulin, growth hormone etc are today exclusively produced by means of
modern biotechnology, all heparin used is still extracted from animal tissue. The primary source is pig intestine. The major concern regarding animal-derived products is their possible contamination with prions.
Prions are the causative agents of the “mad-cow” disease and the corresponding human conditions such as he Creutzfeld-Jacon disease. In addition, production of heparin from intestinal tissues is a cumbersome
process that creates large quantities of environmentally harmful waste.
BioTie’s BioHeparin is intended to provide safe and practically unlimited source of heparin. The BioHeparin is
expected to gradually replace the animal-derived heparin markets of today. The good safety and feasible once-daily dosage have greatly expanded the use of heparin in prevention and treatment of conditions such
as unstable angina and myocardial infarction. The escalation in heparin consumption is expected upon advent of oral delivery heparin formulations. The consumption of low-molecular-weight heparin (LMWH by
Aventis, Pharmacia, Sanofi-Synthelabo) has also been increasing during recent years. Sanofi and AstraZeneca
have alternative products under development (e.g. a synthetic pentasaccharide)
The competitors on the market for the BALP (Bioheparin) technology products Competing new products are expected to capture their share of the anticoagulant market, such as Sanofi’s
synthetic pentasaccaride, which is in phase III with an expected filing in 2001. AstraZeneca has an injectable
and oral form of synthetic compound (Melagatran) expected to be filed in 2002. BioTie’s Bioheparin is however expected to capture a large market share, as it provides an attractive non-animal based source of
low molecule weight heparin for the current market. As the shortage of raw material of the traditional animal based heparin is likely to occur in combination with the increased awareness of consumers of the possible
contamination risk associated with animal sourced products occur.
5.3 Developing a real option model for valuing a biotechnology company based on option
theory
The real options method represents the new state-of-the-art technique for the valuation and management of
strategic investments. The real option method enables corporate decision-makers to leverage uncertainty and
limit downside risk.
A great deal of theoretical work exists on how to model and value investment opportunities having real options. Real options values flexibility- and are more commonly used for investment decisions. Real options
current proposed real option models are not widely used by corporate managers and practitioners due to
complexity and unfamiliarity.202 Real options capture correctly the value of uncertainty while valuing individual investments projects (option to expand, to contract, time-to-build-options). A real option
framework of decision-making is based on the opportunity to make a decision after we see how events unfold. With the real option approach, we model the cash flows from the completed project to estimate the
value of the underlying asset, and then use that estimated asset value as an input to the option valuation.
Real option pricing can be seen as a special (risk-neutral) version of decision analysis that recognizes market opportunities to trade and borrow. It is the version of decision analysis that has adopted the market
perspective, allowing determination of expected values using risk-neutral probabilities and discounting at a risk-free rate.203 Investment projects can however include several types of options and becomes hence more
complex. One way is to valuate the project by the use of different real option models and compare the results. Another way is to build multi-option models.204
5.3.1 Applicability of real option methodology in valuation of biotechnology companies
The real option approach is appropriate for company valuation when the company is characterized by flexibility (managerial flexibility to alter its initial strategy in order to capitalized on favorable future
opportunities or ability to react to mitigate losses), negative earnings, relying on a single source of revenue and a high degree of riskiness or companies with changing cost of capital.

65
Figure 18 Options on the asset and liability side205
Hence, real options are applicable for valuation of biotechnology companies, since the analogy between
financial and real options hold. An option holder has acquired the right but not the obligation to exercise. When a biotechnology company invests in a new product development, it has acquired the right, but not the
obligation to take the product to the market. Biotechnology companies hold a number of real options in their product development portfolios. Real options related to long term or strategic investments are generally
valuated by the binomial lattice method. As the development of drug is highly regulated and standardized,
the development process can be modeled as a staged investment (Appendix 1). The drug development process has been studied in literature, and thus the probabilities of success, the length of each development
phase and costs of each stage can be estimated based on historical data. For other than biopharmaceutical companies the development of a product is a single phase. The costs, length of the development process and
the probability of success must be estimated, as the literature does not recognize this information. However,
historical information on product development may exist within the company.
Real options are estimated to add significant value to biotechnology companies, since the industry is characterized by high volatility, the time to maturity is relative long, the upfront investments are huge all of
which have positive impact on option value (Figure 9).
The real option valuation will start by observing the payouts first and thus allows for option spotting. In
complex decisions such as staged R&D (continue, stall, abandon), where a wide set of options are available and where future decisions may influence future prices (imperfect competition) option modeling is critical.
The option spotting in typical biotechnology companies is illustrated in Appendix 3 Real options available for biotechnology companies. The red points indicate decision points, where management can decide whether to exercise the option or not as new information is acquired. Second, the event tree for the case company is built and (i.e. the blue circles) is expanded by adding
decision points (i.e. green squares), where opportunities to change occur as illustrated in Figure 19 Option price lattice for an American call. The green squares represent a decision point, where the option might be
Asset side
Strategic options Long-term oriented
Options regarding new
investments New market or businesses
Operative options Short term oriented
Options regarding existing
investments Capacity expansion,
procurement, production, sales or processes
Liability side
Financing of investments with Equity and Liabilities
Determination of cost of capital
Call option on company value Max (Company value-Liabilities, 0)
Binominal Method Sum-of-the-parts valuation
Black-Scholes Total valuation

66
exercised. The blue circles represent the possible outcomes in asset value. Here the types of managerial
flexibility that are available is analyzed on the event tree (nodes). Multiple sources of flexibility are available
at a single node, but priority need to be identified.
Third, the exercise of flexibility alters he risk characteristics (the CAPM model cannot be used); a replicating portfolio need to be developed. Information on risks can be collected by the use of statistics or by subjective
assessments from experts. In this study, the information found critical to valuation of biotechnology
companies found as of chapter 5.1 has been used as factors considered when constituting a replicating portfolio for estimation of the volatility parameter. Notable is however, that the uncertainty of the investment
is not the same as the uncertainty of the variables that drive the uncertainty. Uncertainty depends on endogenous and exogenous effects. Finally, a sensitivity analysis is conducted on the key unknown variables
and parameters.206
5.3.2 Assumptions for the valuation model on forecasted cash flows
As the life of a drug can be divided into two distinct lifecycles, the model includes two distinct product lifecycles as illustrated in Appendix 1. A development cycle, where the cash flows are adjusted for a
conditional probability of success (j) discounted at the development discount rate rd, and a marketing
lifecycle, including a risk adjustment depending on the development stage of the drug at the moment and a
commercialization discount rate rc.
Based on the findings above the development phase of the drug’s lifecycle is modeled as a staged investment i.e. the previous staged must be successfully concluded in order to proceed with the next stage. Each stage
is given the probabilities of success, estimated duration and cost. In Appendix 1 is illustrated the average duration of each phase, the average cost and probability of success at each phase. This data is relevant for
assessing the uncertainty products in BioTie’s pipeline. The uncertainty of BioTie’s products are
corresponding to the probability of success.
As the risk of a drug under development is significantly different as the risk for a drug on the market, different discount rates should be used. In this model, the discount rate for a drug under development is
denoted rd. The technical risk of successfully completeting a trial is denoted by j. The risk adjusted
discounted development cash flow for a drug under development is calculated as of
mt
T
tA DCFDCF1
where
td
tjApproval
eryphaseDisj
tr
CFDCF
1
*
cov
The drug reaches the market at the time of launch, prior to which all development phases are to be
successfully concluded. This is incorporated to the valuation by multiplying the CCF with the probability of the
drug under development to reach the market (j), given the current development phase as of Table 9.
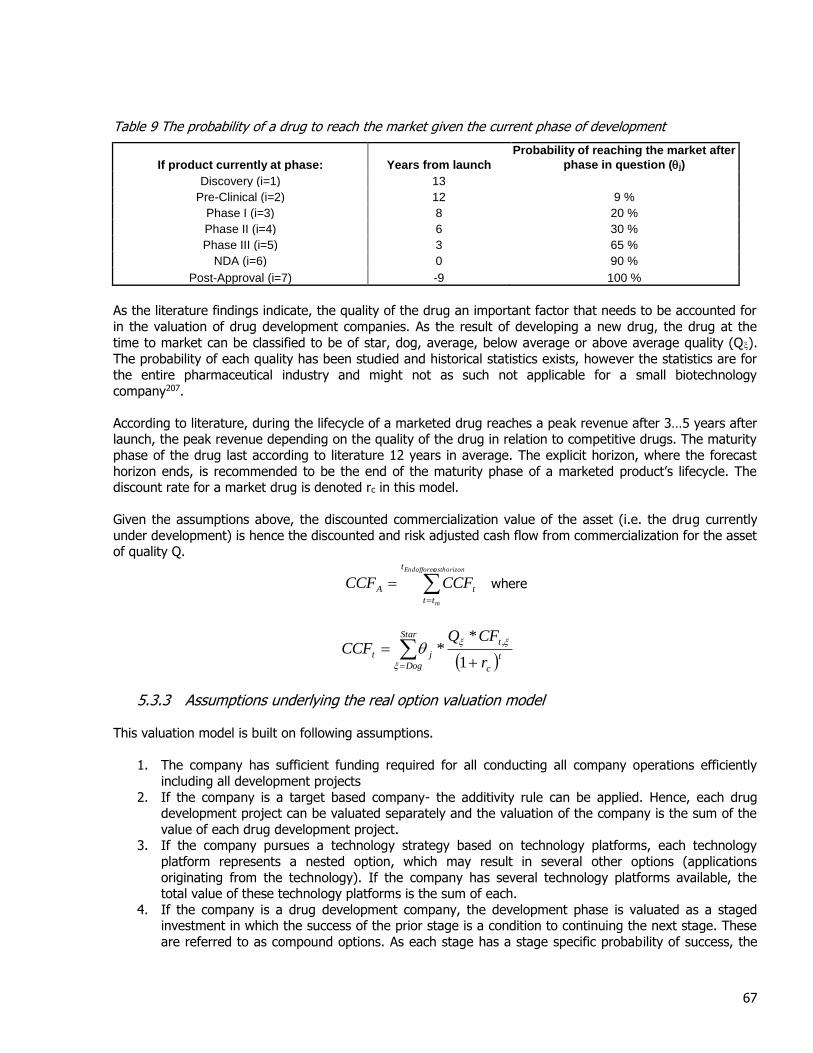
67
Table 9 The probability of a drug to reach the market given the current phase of development
If product currently at phase: Years from launch
Probability of reaching the market after
phase in question (j)
Discovery (i=1) 13
Pre-Clinical (i=2) 12 9 %
Phase I (i=3) 8 20 %
Phase II (i=4) 6 30 %
Phase III (i=5) 3 65 %
NDA (i=6) 0 90 %
Post-Approval (i=7) -9 100 %
As the literature findings indicate, the quality of the drug an important factor that needs to be accounted for
in the valuation of drug development companies. As the result of developing a new drug, the drug at the
time to market can be classified to be of star, dog, average, below average or above average quality (Q).
The probability of each quality has been studied and historical statistics exists, however the statistics are for
the entire pharmaceutical industry and might not as such not applicable for a small biotechnology
company207.
According to literature, during the lifecycle of a marketed drug reaches a peak revenue after 3…5 years after launch, the peak revenue depending on the quality of the drug in relation to competitive drugs. The maturity
phase of the drug last according to literature 12 years in average. The explicit horizon, where the forecast
horizon ends, is recommended to be the end of the maturity phase of a marketed product’s lifecycle. The discount rate for a market drug is denoted rc in this model.
Given the assumptions above, the discounted commercialization value of the asset (i.e. the drug currently
under development) is hence the discounted and risk adjusted cash flow from commercialization for the asset of quality Q.
asthorizonEndofforec
m
t
tt
tA CCFCCF where
tc
tStar
Dog
jtr
CFQCCF
1
**
,
5.3.3 Assumptions underlying the real option valuation model
This valuation model is built on following assumptions.
1. The company has sufficient funding required for all conducting all company operations efficiently
including all development projects
2. If the company is a target based company- the additivity rule can be applied. Hence, each drug development project can be valuated separately and the valuation of the company is the sum of the
value of each drug development project. 3. If the company pursues a technology strategy based on technology platforms, each technology
platform represents a nested option, which may result in several other options (applications
originating from the technology). If the company has several technology platforms available, the total value of these technology platforms is the sum of each.
4. If the company is a drug development company, the development phase is valuated as a staged investment in which the success of the prior stage is a condition to continuing the next stage. These
are referred to as compound options. As each stage has a stage specific probability of success, the

68
discounted development cash flow (DCFt ) at each time is multiplied with the probability of success at
that particular stage. The cash flows from commercialization is risk-adjusted with the probability of
completing all consequent stages of development. 5. The development stages are abandoned only for financial reasons only (i.e. the real option value is
zero). 6. The model allow for decision making each year i.e. analogous to American call options.
7. The real option template will however compare the results to corresponding European call options,
where the entire development phase includes an option to continue to marketing phase or abandon the development phase at the time to market. The European call is most appropriate for
biotechnology companies, where the development phase is analogous to one stage.
5.3.4 The real option method applied
The value of managerial flexibility or real options is added to the discounted value of the asset, by the use of
the binomial lattice model208. The principle of binomial lattice valuation of real option is to first model the changes of the asset value based on the volatility. The binomial lattice starts with the risk adjusted and
discounted value of the commercialization cash flows of the asset A (NPVA, CCF). The node of each asset value has two possible outcomes as a result of an upward change in the asset value and downward change in the
asset value. The tree for the changed asset values is rolled out forward (i.e. from the right to the left) until the time of maturity. Secondly, the values of the options included in the model are valuated. This procedure
begins with starting the valuation at the time to maturity. The option value is the asset value at the node
deducted by the risk adjusted and discounted development cash flow at that time. Then, the values of each option at the nodes are calculated from the values of the options at nodes from which they originate, by
multiplying with the probability of those outcomes and finally by adjusting for the time value of money, i.e. the risk-free interest rate.
This model includes the potential upward and downwards movements in asset value as of figure (Figure 12 Asset price lattice.). The changes in asset value are estimated based on volatility of the asset is calculated as
of Equation 25 The upward movement of the underlying assets as estimated on the volatility. and Equation 26 The downward movement of the underlying assets as estimated on the volatility. The volatility will include
changes in asset value by taking into account industry and company specific factors considered, when selecting the replicating portfolio (5.5.2).
When valuating assets with real options by the binomial method the tree for all possible changes in asset value is first set up. The initial value of the asset is CCFA i.e. the discounted and risk adjusted
commercialization cash flows for asset A. Then the value at each time ti is calculated as of the upward and downward change in the value of the asset. The change in asset value is derived from the volatility
calculated as Equation 25 and Equation 26. All the possible values are calculated ate each node by moving
forward (from the left to the right) by the use of asset lattice.
Second, the option value tree is calculated from the asset value tree. The results are calculated both by for an American call option and European call options. In this model the outcomes of each decision node (i.e.
the green squares in Figure 19) include the option to abandon and the option to continue. In the American call option valuation, the decision to continue or abandon can take place at each node. In the
European call option valuation, the decision to abandon or to continue with an investment takes place only at
the time to maturity, i.e. the time to market.
The calculation starts from the left at the time-to-maturity. In this model the time to maturity is equal to the time-to-market. The value of the option at each node (i.e. each possible outcome at the time to market) at
the time to market time tm is calculated for the asset is calculated the value of the option at each node as of
an American call option Max (Ai-DCFi, 0)
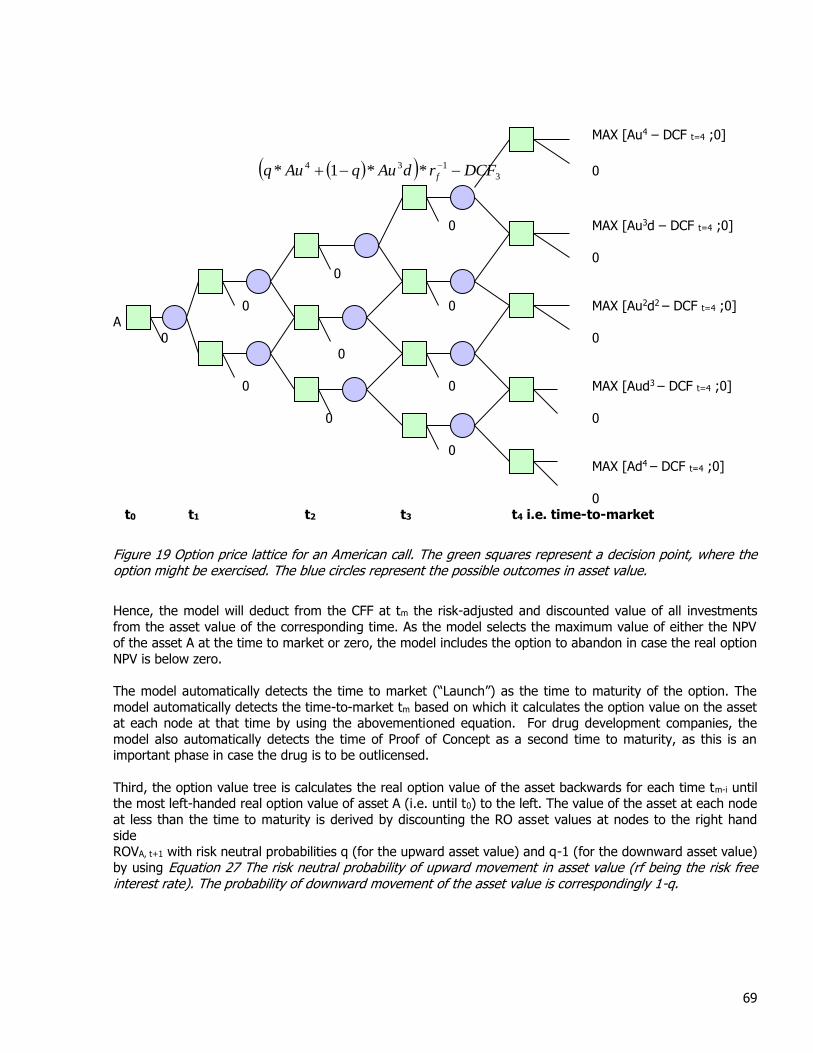
69
MAX [Au4 – DCF t=4 ;0]
3
134 **1* DCFrdAuqAuq f 0
0 MAX [Au3d – DCF t=4 ;0]
0 0
0 0 MAX [Au2d2 – DCF t=4 ;0] A
0 0 0
0 0 MAX [Aud3 – DCF t=4 ;0]
0 0
0 MAX [Ad4 – DCF t=4 ;0]
0 t0 t1 t2 t3 t4 i.e. time-to-market
Figure 19 Option price lattice for an American call. The green squares represent a decision point, where the option might be exercised. The blue circles represent the possible outcomes in asset value.
Hence, the model will deduct from the CFF at tm the risk-adjusted and discounted value of all investments
from the asset value of the corresponding time. As the model selects the maximum value of either the NPV of the asset A at the time to market or zero, the model includes the option to abandon in case the real option
NPV is below zero.
The model automatically detects the time to market (“Launch”) as the time to maturity of the option. The
model automatically detects the time-to-market tm based on which it calculates the option value on the asset at each node at that time by using the abovementioned equation. For drug development companies, the
model also automatically detects the time of Proof of Concept as a second time to maturity, as this is an important phase in case the drug is to be outlicensed.
Third, the option value tree is calculates the real option value of the asset backwards for each time tm-i until the most left-handed real option value of asset A (i.e. until t0) to the left. The value of the asset at each node
at less than the time to maturity is derived by discounting the RO asset values at nodes to the right hand side
ROVA, t+1 with risk neutral probabilities q (for the upward asset value) and q-1 (for the downward asset value) by using Equation 27 The risk neutral probability of upward movement in asset value (rf being the risk free interest rate). The probability of downward movement of the asset value is correspondingly 1-q.

70
0;*1* 11
, t
f
tttA DCF
r
ApApMaxROV
The ROVA, t is derived from the real option asset value at time t+1 from both the upward changed asset value
(A+) and the downward changed asset value (A-). The probability for the asset to have undergone a upward
change is q and the probability that the asset value have been undergone a downward change is 1-q. The probability adjusted real option value of the asset at each node at the time t is risk-neutrally discounted.
Finally, the investment (DCFt) is deducted from the real option value of the asset. If the real option value becomes negative, the option to abandon is exercised (i.e. the ROVA, t is zero).
5.4 Starting point for the base case valuation
The option valuation approach involves in principle the base case calculation without flexibility using
traditional DCF models, expanding the DCF into an event tree mapping how value evolves. The company is listed on the Helsinki stock exchange, and as of 21st September 2000 the stock value was 7 EUR. The
number of shares outstanding is 18.57 million and the free float is 74%. Thus the market capitalization is
thus 130 EURm. 209
The base case valuation will include the CDF deducted by the debt outstanding is 1.1 EURm and by reducing the non-operating costs and tax, the company´s value is obtained.
5.5 Valuation of the case biotechnology company with real options
Biotechnology product development and product marketing can be divided into two distinct product cycles.
There might be a number of options available to a biotechnology company in both product cycles.
5.5.1 The parameters estimated for real option valuation
In order to valuate real options, all methods need estimates of the following variables. 1. The value of the underlying asset is equal to the present value of the expected cash inflows. 2. The exercise price is the PV of the expenditures necessary for the buying the right, not the obligation to exercise the option
(i.e. the cost of investing in the opportunity) 3. The discount rate i.e. risk free interest rate 4. Time to maturity is the lengths of time before a decision must be made (i.e. to exercise or not to exercise) 5. Volatility can be can be measured by looking at the opportunity in order to determine the primary source of uncertainty. What
is unknown today indicates the value maximizing direction when it becomes known. Use Monte Carlo to simulate the important variables affecting risk needed? The source of uncertainty can be isolated to a single or a few uncertainty factors for which historical data exist. Thus, volatility is measured in quite straightforward fashion by producing a replicating portfolio of companies to estimate the volatility.
The study produced a general model for real options available to biotechnology companies (Appendix 3).
The value of the asset is equal to the value of the commercialization cash flow derived as of 5.3.4. As the
forecasting time horizon for the CCF’s is used 14 years (i.e. until 2015), which represent the maturity phase of a marketed drug. Alternatively, the expiration of a patent could be used as the explicit time horizon.
The value of the investment required to acquire the option, is added to each decsion node node of the compound option. It is equal to the risk adjusted and discounted development cash flow at time t i.
The time to maturity of the compound options are equal to the time of launch (i.e. the time to market).
The 10 year “Valtion obligaatio” is representing the risk free interest rate.

71
The volatility is calculated by the method of replicating portfolio, as described in flowing chapter. Despite
the fact that the case company is listed, the volatility of that cannot be used due to the fact that the stock is
relative illiquid.
5.5.2 Variables of the replicating portfolio for estimation of company volatility
Replication allow to value real options without knowing the probability distribution of stock prices and without making any assumptions about the expected rate of return on the stock. This is the important difference between real options and the related decision tree approach to valuation. Instantaneous perfect correlation
(i.e. the stock price move only small amounts in small time periods and hence the option and the stock will be perfectly correlated and can be perfectly replicated by a combination of stock plus some borrowing
position) allows to replicate the options return instant by instant. Hence a valuation formula is obtained without the knowledge of the probability distribution of the underlying stock. The relevant information about distribution is reflected by stock price serving as `sufficient statistics´.210 The industry and company specific factors that were found to affect the company risk (Table 10), hence
reflecting the volatility of expected returns on stock was used to build a replicating portfolio of companies. The volatility was calculated as Equation 24 and the number of period included in the study was 1 year for
the companies selected for the replicating portfolio.
Table 10 Factors to be considered when constructing a replicating portfolio
Market capitalization
Market segment (Biopharmaceutical, Genetic, Proteonomics, Bio-informatics, medical devices, other)
Technology strategy (platform versus target based)
Number of products in development pipeline and the phase of development expressed as
PAC (probability of reaching the market* number of products in development)
Networking (0= none, 1=Collaborative agreements signed)
Burn rate (R&D spending rate)
The companies selected for a replicating portfolio are represented in Appendix 2 Variables taken into account when selecting a replicating portfolio for estimation of the volatility parameter. If any of content of cell is indicated in red- the company has not been considered applicable for representation in the replicating portfolio due to the fact that this factor has been considered to be too deviating from the case company. The
volatility was calculated as the average of all companies in the replicating portfolio, and is hence 82%.
5.5.3 The asset volatility of a drug under development
Alternatively, the volatility of individual asset can be calculated from the forecasted cash flows from drugs of
different qualities (Figure 16 The decision tree outcomes for commercialization cash flow for drugs of different quality). The asset volatility is estimated by forecasting the future cash inflows resulting from the successfully developed product to be of quality (dog, below average, average, above average, star). The
template uses the probabilities as studied by Myers&Howe211.
The probability of a drug to be of quality star and the revenues generated by a drug of star quality has crucial influence on the final value. Hence, the model compares the base case valuations resulting from the
average, most probable outcome of an asset under development (i.e. DCF and ROV) with the Decision Tree
outcomes.
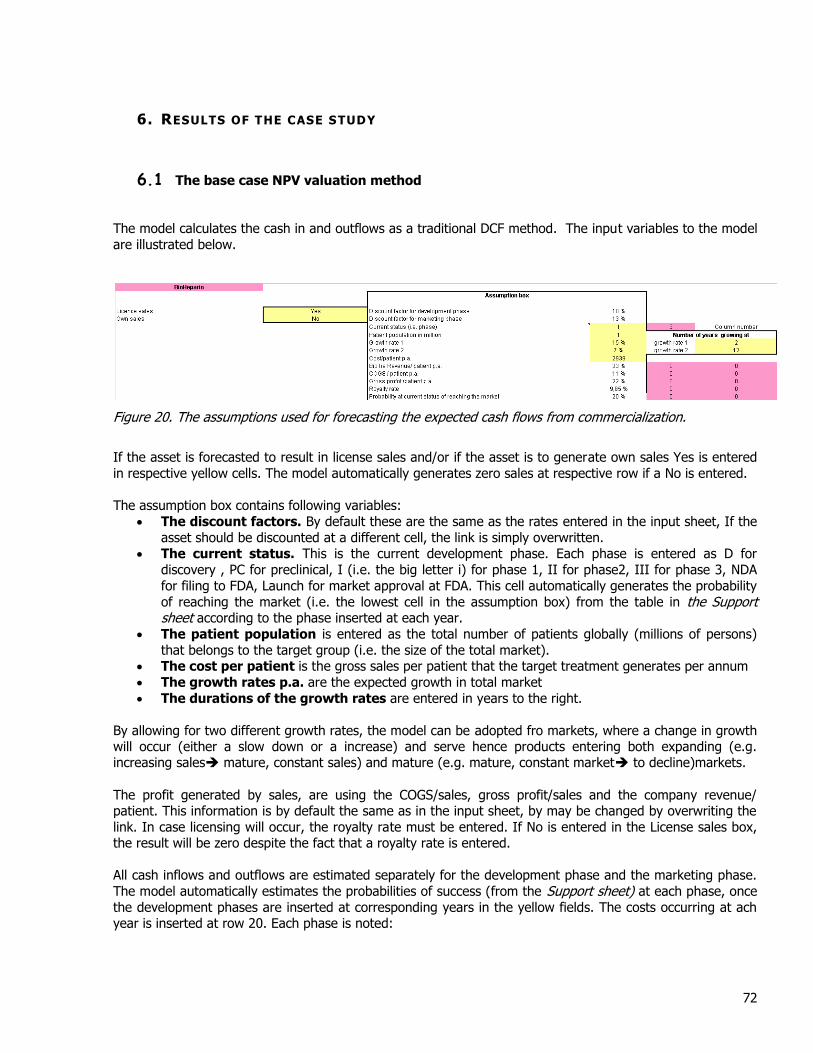
72
6. RESULTS OF THE CASE STUDY
6.1 The base case NPV valuation method
The model calculates the cash in and outflows as a traditional DCF method. The input variables to the model
are illustrated below.
Figure 20. The assumptions used for forecasting the expected cash flows from commercialization.
If the asset is forecasted to result in license sales and/or if the asset is to generate own sales Yes is entered
in respective yellow cells. The model automatically generates zero sales at respective row if a No is entered.
The assumption box contains following variables:
The discount factors. By default these are the same as the rates entered in the input sheet, If the
asset should be discounted at a different cell, the link is simply overwritten. The current status. This is the current development phase. Each phase is entered as D for
discovery , PC for preclinical, I (i.e. the big letter i) for phase 1, II for phase2, III for phase 3, NDA
for filing to FDA, Launch for market approval at FDA. This cell automatically generates the probability
of reaching the market (i.e. the lowest cell in the assumption box) from the table in the Support sheet according to the phase inserted at each year.
The patient population is entered as the total number of patients globally (millions of persons)
that belongs to the target group (i.e. the size of the total market). The cost per patient is the gross sales per patient that the target treatment generates per annum
The growth rates p.a. are the expected growth in total market
The durations of the growth rates are entered in years to the right.
By allowing for two different growth rates, the model can be adopted fro markets, where a change in growth will occur (either a slow down or a increase) and serve hence products entering both expanding (e.g. increasing sales mature, constant sales) and mature (e.g. mature, constant market to decline)markets.
The profit generated by sales, are using the COGS/sales, gross profit/sales and the company revenue/ patient. This information is by default the same as in the input sheet, by may be changed by overwriting the
link. In case licensing will occur, the royalty rate must be entered. If No is entered in the License sales box, the result will be zero despite the fact that a royalty rate is entered.
All cash inflows and outflows are estimated separately for the development phase and the marketing phase.
The model automatically estimates the probabilities of success (from the Support sheet) at each phase, once
the development phases are inserted at corresponding years in the yellow fields. The costs occurring at ach year is inserted at row 20. Each phase is noted:

73
D for the discovery phase
PC for pre-clinical phase
I for Phase 1
II for phase 2
III for phase 3
NDA for filing to authority
Launch for approval
If any collaborative agreement exist, or are planned to occur, these cash inflows and outflows are inserted in rows 26 and 27. In this model, the probability of these occurring is the same as the probability of success of
the development in that specific year.
The outcomes of the risk-adjusted and discounted cash flows from the development phase (DCF) and the
commercialization (CCF) are in the blue fields in rows 43, 45 and 47…48. The NPV of the asset is denoted and used for the base case valuation in the model.
Figure 21 The DCF and CCF calculated for all assets. The development cash flows are discounted at rd and the marketing cash flows at rc
6.1.1 The result of the base case valuation (NPV)
The base case valuation (Appendix 4) of the target company was made under for four development projects:
Huvap, Vapill, Vapantix and Bioheparin. The base case valuation model built on the assumption of two distinct lifecycles for the product under development was calculated in order to be able to compare the result
to the real option valuation results. The discount factors used for products under development was 9,5% and
the discount rate for products marketed 12,5%. Thus the company is valuated to 276,7 mEUR. This value is considerably higher than the value obtained by DCF in September 2000, due to the fact that the asset
BioHeparin has proceeded from the preclinical phase to the phase 1 clinical studies. The discount factor used for discounting of all cash flows for other items was WACC of 12,5%.
Table 11 The base case valuation with distinctive development and commercialization discount rates.
6.1.2 The base case valuation with Decision Tree outcomes of commercialization cash flows.
The base case valuation model built on the assumption of five different outcomes (i.e. products of different
qualities) for the product reaching the market was calculated in order to be able to compare the result to the real option valuation results. The probabilities of quality and the revenues generated by corresponding
quality are obtained as of Figure 16. The base case company valuation by the decision tree method is 529,9 mEUR compared to the most probable asset valuation company value of 276,67 mEUR.
NPV by DCF
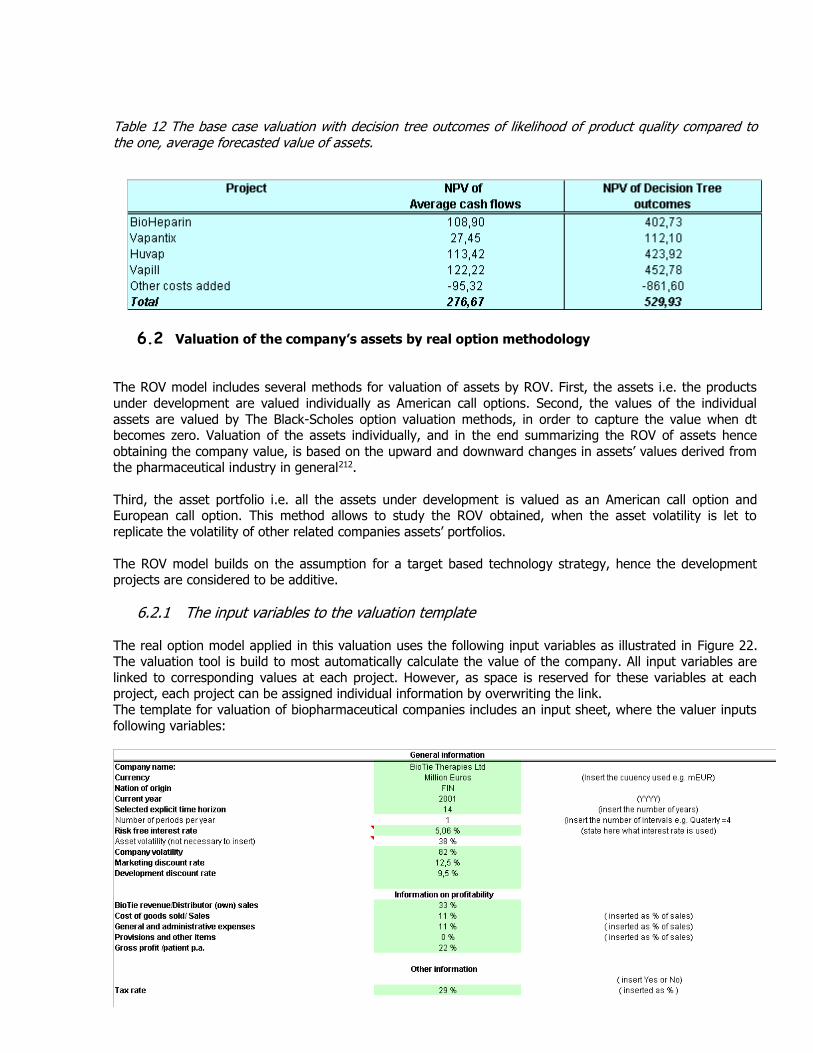
74
Table 12 The base case valuation with decision tree outcomes of likelihood of product quality compared to the one, average forecasted value of assets.
6.2 Valuation of the company’s assets by real option methodology
The ROV model includes several methods for valuation of assets by ROV. First, the assets i.e. the products
under development are valued individually as American call options. Second, the values of the individual
assets are valued by The Black-Scholes option valuation methods, in order to capture the value when dt becomes zero. Valuation of the assets individually, and in the end summarizing the ROV of assets hence
obtaining the company value, is based on the upward and downward changes in assets’ values derived from the pharmaceutical industry in general212.
Third, the asset portfolio i.e. all the assets under development is valued as an American call option and European call option. This method allows to study the ROV obtained, when the asset volatility is let to
replicate the volatility of other related companies assets’ portfolios.
The ROV model builds on the assumption for a target based technology strategy, hence the development projects are considered to be additive.
6.2.1 The input variables to the valuation template
The real option model applied in this valuation uses the following input variables as illustrated in Figure 22. The valuation tool is build to most automatically calculate the value of the company. All input variables are
linked to corresponding values at each project. However, as space is reserved for these variables at each project, each project can be assigned individual information by overwriting the link.
The template for valuation of biopharmaceutical companies includes an input sheet, where the valuer inputs
following variables:
Figure 22 The input variables to the valuation model file.

75
All input variables are entered in the green fields, in the format specified in the right hand side column.
Following variables are crucial fro the functionality of the model, as multiple follow-on calculations are using these variables.
The current year- this year is used as the starting point (t=0) for all calculations. Subsequent years
are numbered 2,3….n and used e.g. in the discounting formulas.
The risk free interest rate- this rate is used for all real option calculations. Use the long-term risk
free interest rate of the country in question. If a number is not inserted here, all real option values
will be invalid. The company volatility. This parameter is used in all real option calculations. The volatility is the
long- term average volatility (i.e. constant) of the replicating portfolio of listed companies. The
companies selected to the replicating portfolio should have the same level and sources of risk associated with the development projects and similar levels and distribution of potential future incomes from the development projects) The variables to be considered when selecting a replicating portfolio is the size (i.e. correlation factor to the expected market size of the company to be
valuated), the PAC (i.e. sum of products in a development phase * the probability of reaching the
market from that phase), products on the market (Yes/No i.e. if the company to be valuated have no products on the market none of the replicating companies should have products on the market and
vice versa), collaborative agreements (Yes/No i.e. if the company to be valuated have collaborative agreements all the replicating companies should have collaborative agreements and vice versa),
technology strategy is ether target based or platform based (i.e. if the company to be valuated has a
target based strategy all the replicating companies should have a target based strategy and vice versa) and the burn rate (i.e. the replicating portfolio should have a similar level of R&D
expenditures). The discount rate used for discounting the projects in development is lower than the discount rate
used for marketed products. The development discount rate may be equal to the risk free interest
rate, or the risk free interest adjusted for risks associated with the development projects i.e. funding, cost of capital and adjusted for inflation (i.e. real rates). The marketing discount rate is to reflect the
risk associated with assets on the market. Literature findings have quantified the nominal
development discount rate to 6% and the nominal marketing discount rate to 9%213. In order to valuate the assets i.e. the current development projects, some information on
profitability is entered. All information regarding the profitability of current development projects is
entered as % of sales. This information supplied is by default the same for all projects. However, this information may be changed to be specific for each development project, by inserting different
numbers (overwrite) the profitability numbers in the assumptions box on the top of each project
sheet (e.g. Huvap). The tax rate The tax rate is used in the sheet Other operating costs, where all nonrelated costs and
revenues must be entered.
Selected explicit time horizon. Here is entered the explicit time horizon, for which the valuation
will calculate all cash inflows and outflows. The number must be bigger than the longest time to market of the assets to be valued (or otherwise the template will not calculate at all).
The asset volatility. If the volatility of asset value is know it shall be inserted here. The valuation model
hence uses this volatility rate for the ROV of assets. In case the asset volatility is unknown, the model will
estimate the asset volatility based on Decision Tree outcomes from forecasted sales (rows 59…66 on each asset row).
In the current model, following input variables are not used in calculations, but may be used for other
purposes: Name of the company, currency units, nation of origin and provisions. This version of the template
will not in all cases calculate correctly if the number of periods per year is set other than 1 (i.e. quaterly calculations will not be correctly calculated)
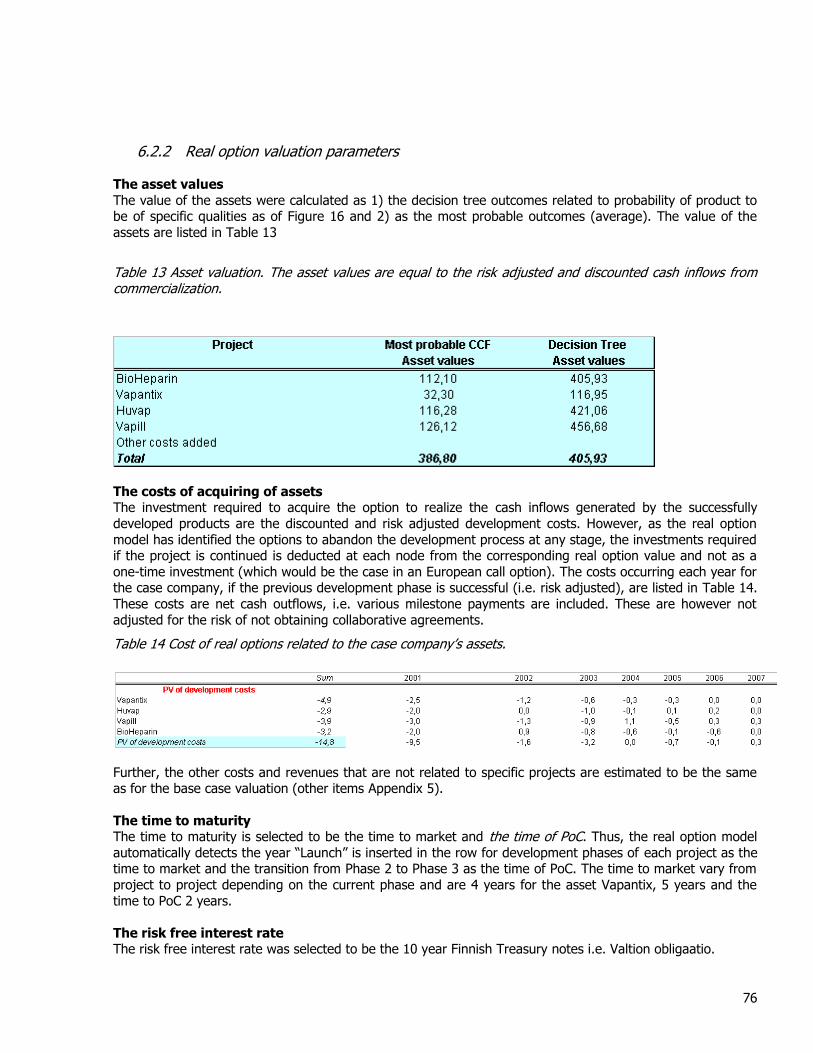
76
6.2.2 Real option valuation parameters
The asset values
The value of the assets were calculated as 1) the decision tree outcomes related to probability of product to be of specific qualities as of Figure 16 and 2) as the most probable outcomes (average). The value of the
assets are listed in Table 13
Table 13 Asset valuation. The asset values are equal to the risk adjusted and discounted cash inflows from commercialization.
The costs of acquiring of assets The investment required to acquire the option to realize the cash inflows generated by the successfully
developed products are the discounted and risk adjusted development costs. However, as the real option
model has identified the options to abandon the development process at any stage, the investments required if the project is continued is deducted at each node from the corresponding real option value and not as a
one-time investment (which would be the case in an European call option). The costs occurring each year for the case company, if the previous development phase is successful (i.e. risk adjusted), are listed in Table 14.
These costs are net cash outflows, i.e. various milestone payments are included. These are however not
adjusted for the risk of not obtaining collaborative agreements.
Table 14 Cost of real options related to the case company’s assets.
Further, the other costs and revenues that are not related to specific projects are estimated to be the same as for the base case valuation (other items Appendix 5).
The time to maturity The time to maturity is selected to be the time to market and the time of PoC. Thus, the real option model
automatically detects the year “Launch” is inserted in the row for development phases of each project as the time to market and the transition from Phase 2 to Phase 3 as the time of PoC. The time to market vary from
project to project depending on the current phase and are 4 years for the asset Vapantix, 5 years and the
time to PoC 2 years.
The risk free interest rate The risk free interest rate was selected to be the 10 year Finnish Treasury notes i.e. Valtion obligaatio.
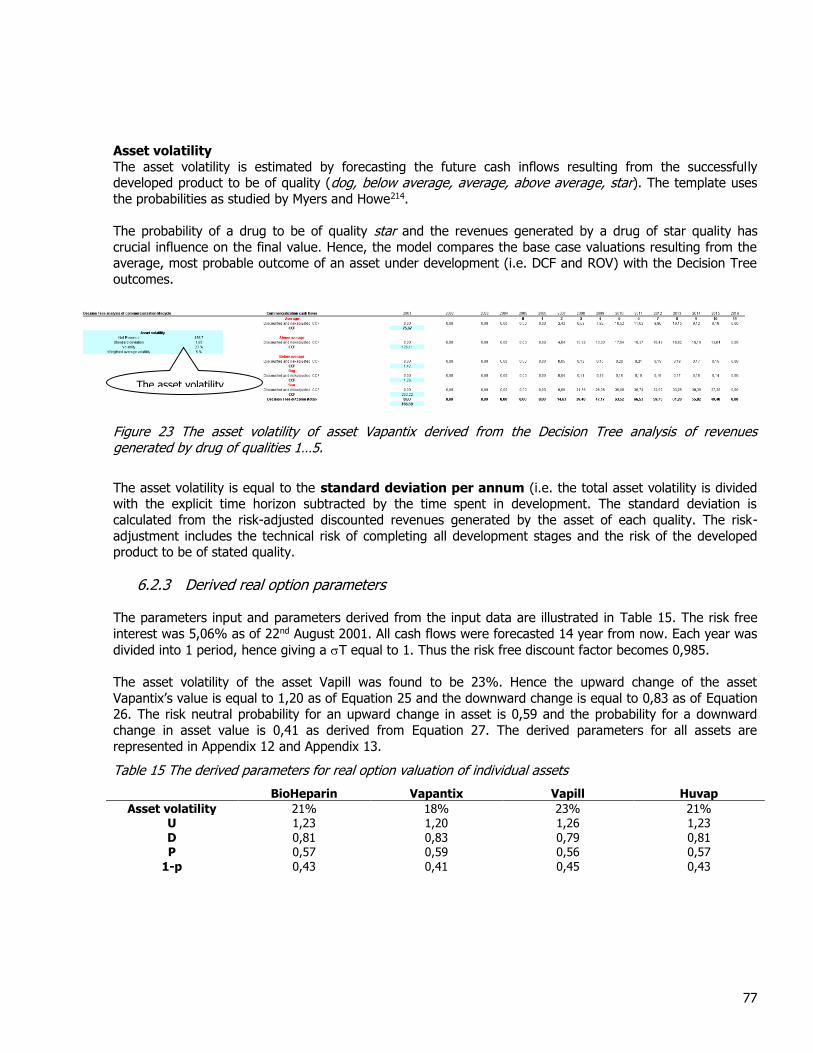
77
Asset volatility
The asset volatility is estimated by forecasting the future cash inflows resulting from the successfully developed product to be of quality (dog, below average, average, above average, star). The template uses
the probabilities as studied by Myers and Howe214.
The probability of a drug to be of quality star and the revenues generated by a drug of star quality has
crucial influence on the final value. Hence, the model compares the base case valuations resulting from the average, most probable outcome of an asset under development (i.e. DCF and ROV) with the Decision Tree
outcomes.
Figure 23 The asset volatility of asset Vapantix derived from the Decision Tree analysis of revenues generated by drug of qualities 1…5.
The asset volatility is equal to the standard deviation per annum (i.e. the total asset volatility is divided with the explicit time horizon subtracted by the time spent in development. The standard deviation is
calculated from the risk-adjusted discounted revenues generated by the asset of each quality. The risk-
adjustment includes the technical risk of completing all development stages and the risk of the developed product to be of stated quality.
6.2.3 Derived real option parameters
The parameters input and parameters derived from the input data are illustrated in Table 15. The risk free
interest was 5,06% as of 22nd August 2001. All cash flows were forecasted 14 year from now. Each year was
divided into 1 period, hence giving a T equal to 1. Thus the risk free discount factor becomes 0,985.
The asset volatility of the asset Vapill was found to be 23%. Hence the upward change of the asset
Vapantix’s value is equal to 1,20 as of Equation 25 and the downward change is equal to 0,83 as of Equation 26. The risk neutral probability for an upward change in asset is 0,59 and the probability for a downward
change in asset value is 0,41 as derived from Equation 27. The derived parameters for all assets are
represented in Appendix 12 and Appendix 13.
Table 15 The derived parameters for real option valuation of individual assets
BioHeparin Vapantix Vapill Huvap
Asset volatility 21% 18% 23% 21% U 1,23 1,20 1,26 1,23 D 0,81 0,83 0,79 0,81 P 0,57 0,59 0,56 0,57
1-p 0,43 0,41 0,45 0,43
The asset volatility

78
6.2.4 The ROV of all asset individually by the binomial method as American call options
The ROV is performed as an American call option, i.e. the asset value is equal to the risk-adjusted and
discounted CCF resulting from a marketed product. The duration of the option is studied in two ways- at the time of PoC and the time to market.
The ROV model is analogous to American call option, i.e. the option to continue is studied each year at each
node: if the value of the option is greater than 0 the option to continue is economically motivated. If the
value of the option at that node is below zero, the option to abandon the development project is exercised the outcome at the abandonment node is zero. At each node of the option valuation tree is discounted by the
risk-adjusted and discounted DCF’s (from corresponding column at row 43).
The ROV is conducted by starting from the asset value (i.e. CCF), which is inserted in the asset valuation tree
at time 0. The changes in asset value is rolled forward until the time to maturity of the option, which is automatically detected. Each asset value node has two outcomes each resulting from an upward (u) and
downward (d) change in asset value. These changes are estimated from the asset volatility.
Second, the option valuation tree is rolled back to present by discounting with risk-neutrally discount factors. The option values are also adjusted for the probabilities of the upward (p) and downward (1-p) changes in
asset value. The RO value of the asset is found in cells E102 (at the time to PoC) and E128 (at the time to
market).
Figure 24 Example of the binomial asset valuation of asset Vapantix. The model calculates the ROV for the asset as an American call option with a maturity at the time to market and the time to Proof of Concept (PoC).
6.2.5 ROV of all assets individually by the Black-Scholes method
The value of the asset is also computed by the B-S method for a call option, in order to see what the value of the asset is when the time intervals are so small that dt is becoming equal to zero, i.e. continuously
compounded.
Figure 25 The ROV of individual assets by the binomial option valuation methods fro AMERICAN AND European calls..
All parameters are the same as for the American call option valuation of the individual asset. The investments
needed to acquire the options to the assets largely the same in total. The current values for investments
Initial asset
value = CCF
The ROV of the
asset
Upward change in of A
Downward change in A
Decision points
If PV>0 Continue=PV or If PV <0: Abandon0

79
needed to take the drug under development depends however on the current phase of development
(implicitly the time until revenues are generated and the costs per annum required to develop the drug). The
development costs also adjust for collaborations- if milestone payments are received as a result to collaborative agreements these are deducted from the cost of development. Correspondingly, collaborative
agreements in terms of licensing are notified in the commercialization cash flows. In these cases, the model recognizes the existence of licensing agreements only if Yes is inserted as an answer to License sales (cell
B5) the royalty income is inserted as a % of net sales of sales generated by the partner. The sales generated
by the partner are inserted as a % of the total population with the disease treated by the products in questions.
6.2.6 ROV of the entire portfolio of assets
As a comparison, the valuation of an entire portfolio of asset is conducted. The cash flows for the product
under development and the marketed product are inserted to links in corresponding asset sheets (i.e. the rows fro DCF and CCF).
The parameters for the option valuations are derived as for the individual assets, with the exception of the
volatility. In the entire portfolio valuation, the volatility is equal to the volatility of the stocks of the companies represented in replicating portfolio. The variables that are taken into consideration, are variables
that exposing the target company to similar degree of risks. These variables are: the industry segment (i.e.
biopharmaceutical) company size (i.e. the market capitalization), the burn rate, target or platform based technology strategy and the PAC i.e. sum of the number of products under development multiplied by the
probability of reaching the market.
The volatility found for the case company was 82%. As all other factors were set to be Yes/no, and Yes (i.e.
must equal to the variable of the target company) selected for all companies represented in the replicating portfolio, all other factors were analyzed for correlation on the volatility. The market capitalization, the burn
rate and the PAC and their cofactors were found explain 69% of the volatility.
Figure 26 Result on regression analysis of factors affecting volatility (Appendix 18).
0 %
10 %
20 %
30 %
40 %
50 %
60 %
70 %
80 %
90 %
100 %
110 %
120 %
0 % 10 % 20 % 30 % 40 % 50 % 60 % 70 % 80 % 90 % 100 % 110 % 120 %
Real volatility
Re
gre
ss
ion
vo
lati
lity
Volatility= 0,008*MC+0,578*PAC-0,02*BR-,003*MC*PAC+0,0017*PAC*BR+0,00025*MC*BR
R=0,69 and R2=0,48

80
The case company was valuated as an European call, American call and Black-Scholes call, with all
parameters equal to the ROV of individual ass
ets with the exception of a company volatility of 82%. The valuation is done in the sheet Portfolio valuation results.
6.3 Results of the real option valuation
6.3.1 Valuation of the company as the sum of the individual assets by the binomial method
Valuation of the portfolio of assets as an American call The valuation of each asset is also valuated based on the CCF value of the asset. The valuation is found in
the sheet Asset valuation results. The development projects of the case company were valuated by the
binomial lattice method analogous to American call options. The company value obtained by at the time to market was 350,30 mEUR and the company value at the time to PoC 316,96 mEUR compared to the base
case valuation which resulted in a company value of 276,27 mEUR.
Table 16 The real option valuation on BioTie Therapies valuated as an American call at the time to market and the time of Proof of Concept (PoC) in comparison to the traditional DCF.
6.3.2 Valuation of the company as the sum of the individual assets by the Black-Scholes option valuation method
The company’s development projects were valuated by the Black-Scholes option valuation method. This
method is analog to the binomial lattice method, with the distinction that it is continuously compounded (i.e.
t becomes zero). For comparison, the asset values used are the decision tree outcomes and the one,
average outcome. The company value obtained by the Black-Scholes valuation method for is 312,99 mEUR at the time to market and 312,06 at the time to PoC.
Table 17 The BioTie Therapies valuated with the Black-Scholes option valuation method for asset value approximated both as a decision tree outcome and one, average outcome

81
6.3.3 Valuation of the company based on a portfolio of most probable assets values
The case company was valuated as an European call, American call and Black-Scholes call, with all parameters equal to the ROV of individual assets with the exception of a company volatility of 82%. The
valuation is done in the sheet Portfolio valuation results represented in Appendix 20. The summarized results are listed in Table 18.
Valuation of the portfolio of assets as an American call The valuation of an entire portfolio of asset is also valuated based on the Decision Tree analysis of asset
value. The valuation is found in the sheet Portfolio valuation results. All parameters are the same as in previous section with the exception of the asset value, which is here equal to the sum of all risk-adjusted,
discounted assets with a probability-adjusted quality. The development projects of the case company were
valuated by the binomial lattice method analogous to American call options. The company value obtained by at the time to market was 274,48 mEUR compared to the base case valuation which resulted in a company
value of 272,27 mEUR.
Valuation of the portfolio of assets as an European call The European call options valuation the total DCF is deducted at the end of the option maturity, which is
equal to the longest development time of the assets under development. Finally, the other items resulting
from operations not directly connected to asset cash inflows and outflows from development and marketing activities are deducted. These are found in the sheet Other operating costs in the section for the Decision
Tree outcomes. The main item different from the individual valuation is the taxes, which are adjusted to the higher sales forecasted by the Decision Tree analysis. The company was valued to 279,17 mEUR by the
European call ROV method.
Valuation of the portfolio of assets by the Black-Scholes option valuation method
The company was valued by the Black-Scholes method for the entire portfolio of assets. The Black-Scholes valuation resulted in a company value of 276,5 mEUR.
Table 18 The company value valuated as a portfolio of assets. The asset value is estimated as the sum of are the most probable CCF’s.
6.3.4 Valuation of the company based on a portfolio of decision tree outcomes of asset values
The case company was valuated as an European call, American call and Black-Scholes call, with all
parameters equal to the ROV of individual assets with the exception of a company volatility of 82%. The
valuation is done in the sheet Portfolio valuation results and Appendix 21. The results are summarized in Table 19.
Valuation of the portfolio of assets as an American call
The valuation of an entire portfolio of asset is also valuated based on the Decision Tree analysis of asset value. The valuation is found in the sheet Portfolio valuation results. All parameters are the same as in
previous section with the exception of the asset value, which is here equal to the sum of all risk-adjusted,
discounted assets with a probability-adjusted quality. The development projects of the case company were

82
valuated by the binomial lattice method analogous to American call options. The company value obtained by
at the time to market was 522,03 mEUR compared to the base case valuation which resulted in a company
value of 519,81 mEUR.
Valuation of the portfolio of assets as an European call The European call options valuation the total DCF is deducted at the end of the option maturity, which is
equal to the longest development time of the assets under development. Finally, the other items resulting
from operations not directly connected to asset cash inflows and outflows from development and marketing activities are deducted. These are found in the sheet Other operating costs in rows 40…73. The main item
different from the individual valuation is the taxes, which are adjusted to the higher sales forecasted by the Decision Tree analysis. The European call option valuation differs from the American call, in the way that the
decision to exercise the option or not is made only at the end nodes (i.e. the most right-hand sided column in the Option valuation Tree) as European options do not allow for exercise before maturity. The company
was valued to 525,32 mEUR.
Valuation of the portfolio of assets by the Black-Scholes option valuation method The company was valued by the Black-Scholes method for the entire portfolio of assets. The Black-Scholes
valuation resulted in a company value of 524,04 mEUR.
Table 19 The company values as valuated as a portfolio of assets. The asset value is estimated as the sum of the asset values generated by the Decision Tree analysis.
6.3.5 Comparison of the results
The company valuation was find result in additional value resulting from real option valuation. All methods,
except for the Black-Scholes method for decision tree asset valuation were found to result in additional option value.
Valuation of the company as the sum of the individual assets under development
The base case valuations as produced of Appendix 4 and as the valuation produced by D. Carnegie in
September 2001,which resulted in a company value of 176 mEUR. The base case valuation for this valuation, with distinct development and commercialization discount rates were found to be similar (57%), with the
exception of the decision tree asset valuation. The variation in the DCF of this base case valuation and the valuation of September 2000 due to the change in risk-adjustemnt, as the development projects have passed
successfully development phases. The asset Bioheparin has proceeded from preclinical phase to the phase 1
clinical phase, which resulted in a change in the risk-adjustment factor from 8% to 20%.
The additional value due to introduction of real option theory is compared to the static, base case valuations in Table 20. For instance, the most probable forecasted asset valuation method results in an additional real
option value of 73,6 mEUR with a maturity to time to market compared to the base case valuation in this
study.

83
Figure 27 The result of different valuation methods in absolute values and as a percentage difference to the base case valuation produced by D. Carnegie (Appendix 4).
The values generated using the binomial model compositionally are consistently higher than the values
generated using the Black-Scholes model. This result was expected for nested call options because of the underestimation of volatility due to compoundness and deviation from Black-Scholes assumptions.
Table 20 Comparison of asset valuation methods and additional value due to specific option valuation methods
The additional values resulting from option valuation, which add value due to flexibility, long time to market,
high volatility result in higher valuation of the case company are illustrated in Table 20. The option valuation resulted in significantly higher valuation by the binomial ROV methods, but the Black-Scholes valuations were
almost identical with the base case DCF valuation.
The valuation of the company based on a portfolio of assets under development
All valuations are compared to their corresponding base case asset valuation method in Table 21. The results of the binomial valuation of the company’s assets as a portfolio resulted in lower valuation. This due to the
fact, that the ROV tree found nodes where the option to abandon was economically feasible. The cost of
0,0
50,0
100,0
150,0
200,0
250,0
300,0
350,0
400,0
Valu
ation
Septe
mber
2000
(DC
F)
DC
F A
vera
ge
cash flo
ws
RO
V a
t th
e t
ime
to m
ark
et
RO
V a
t th
e t
ime
to P
oC
B-S
Valu
ation a
t
the t
ime t
o
mark
et
B-S
Valu
ation
based a
t th
e
tim
e t
o P
oC
-50 %
-40 %
-30 %
-20 %
-10 %
0 %
10 %
20 %
30 %
40 %

84
investing in a all projects at that node were less than the forecasted revenues at the corresponding node.
These nodes were the result of several downward changes in asset value.
The decision tree asset valuation method deviates significantly (201%) from the base case valuations by
most probable asset values.
Table 21 Comparison of the company value obtained by different valuation techniques.
6.4 Sensitivity analysis
A sensitivity analysis with respect to the most important parameters of the real option model is conducted in
order to assess validity of the valuation model.
6.4.1 Sensitivity with respect to the volatility parameter
The sensitivity of the company value to changes in the volatility of the replicating portfolio is illustrated in
Figure 28.
0
1
2
3
4
5
6
7
8
9
10
20 % 40 % 60 % 80 % 100 % 120 % 140 %
Va
lue o
f o
pti
on
s i
n a
dd
tio
n t
o D
CF
ROV (European call) valuation of an asset portfolio ROV (European call ) Decision Tree valuation of asset portfolio
ROV (Black-Scholes) Decision Tree valuation of asset portfolio
Volatility
Figure 28 The sensitivity with respect to volatility of the option valuation methods in comparison to corresponding DCF valuation (i.e. static valuations)

85
6.4.2 Sensitivity with respect to the risk free interest rate parameter
An increase in the risk free interest rate has a positive impact on call options. The sensitivity analysis with respect to the risk free interest rate (Appendix 23) is well inline with the theory. An increase in the risk-free
interest rate should increase the value of call options (Figure 9).
Figure 29 Sensitivity analysis of the risk free interest rate on additional real option value in comparison to the DCF valuation.
6.4.3 Sensitivity with respect to the time to maturity parameter
The sensitivity analysis with respect to time to market is illustrated in Appendix 24. American call option
values are positively correlated with increases in time to maturity. The result of the sensitivity analysis is well in line with theory- an increase in option duration increase the option value.
-1
1
3
5
7
9
1 % 2 % 3 % 4 % 5 % 6 % 7 % 8 % 9 % 10 %
Risk Free interest rate
Se
ns
itiv
ity o
f o
pti
on
valu
e t
o t
he
ris
k f
ree
in
tere
st
rate
ROV (American call) valuation of an asset portfolio ROV (European call) valuation of an asset portfolio
ROV (American call) valuation as the sum of individual assets ROV (American call ) Decision Tree valuation of asset portfolio
ROV (European call ) Decision Tree valuation of asset portfolio ROV (Black- Scholes) valuation of an asset portfolio
ROV (Black-Scholes) valuation as the sum of individual assets ROV (Black-Scholes) Decision Tree valuation of asset portfolio

86
Figure 30 Sensitivity of option value in respect of time to maturity of the call options in comparison to the corresponding DCF valuation. The time to maturity has been changed by adding 1 year in Phase II. All cash flows are risk adjusted and equal in size at corresponding phase in the base case valuation.
The effect of the option duration is also found in the valuation of individual assets at the time to market and
the time to PoC. The values of each asset are higher at the time to market. However, it is crucial to value the assets at the time to PoC, in order to negotiate the deals and valuate the deals of development and /or
marketing collaborations that usually are settled at the time to PoC.
6.5 Reliability analysis
The purpose of reliability analysis of scientific research is to minimize randomness in the results. In the context of this the results from this study should be reproducible under identical circumstances. The
references used in the literature study were intended to reduce the bias of subjectivity and ensure the
correct theoretical basis to the real option valuation model.
Several assumptions were made in order to construct a reliable real option model for valuation of biotechnology companies. The fact is however, that biotechnology companies do a have multiple real options
available and many of these are interconnected. When conduction real option valuation it is important to
priorize the real options used in the valuation model, due to the fact that complexity reduces transparency and hence increases the risk for errors. The cost of acquiring extremely detailed information increases as
well. Hence option valuation is a balance between applicability and precision.
The reliability of this study was reinforced by a comprehensive spreadsheet model, comparison of the result obtained by various methods and the sensitivity analysis conducted.
6.6 Conclusions on real option valuation
Traditional valuation methods do not explicitly address the value of managerial flexibility embedded in the
highly dynamic and immature biotechnology industry. Traditional valuation methods are mainly developed for
mature businesses, where the products and the markets exist. Hence these tend to over-emphasize risk thus
0
20
40
60
80
100
120
140
0 1 2 3
Time to maturity
Op
tio
n v
alu
eROV (American call) valuation of an asset portfolio ROV (European call) valuation of an asset portfolio
ROV (American call) valuation as the sum of individual assets ROV (American call ) Decision Tree valuation of asset portfolio
ROV (European call ) Decision Tree valuation of asset portfolio ROV (Black- Scholes) valuation of an asset portfolio
ROV (Black-Scholes) valuation as the sum of individual assets ROV (Black-Scholes) Decision Tree valuation of asset portfolio

87
leading to less precise financial valuations. Real option valuation appraises high volatility and long time to
markets characterized by most biotechnology companies. By investing in a new product development the
company acquires the right, but not the obligation to take the product to the market, analogous to financial call options
Real option valuation does not substitute for traditional discounted cash flow valuations. As shown in this
study, the real option valuation builds on the discounted cash flows. Real options are involved in all
investment decisions. This study identifies several real options available to biotechnology companies and the outcomes of development portfolios can be proactively managed by real option. However, additional value
created by real option valuation should only be applied when the management team is actively managing their real options.
As shown in the real case valuation, real options do add value to development projects. By valuating
companies, projects or other investments by real option methodology one acquires a comprehensiveness of
the impacts of the ability to act upon new information, as changes occur. This information is as valuable to the financial investor as to the managers of the companies and real option valuations might imply a
convergence of the principle agent problems.
88
7. SUMMARY
Traditional valuation methods tend to focus on mature businesses and the tools used for valuation of mature
having positive revenues. The most frequently used valuation method is the discounted cash flow method, where a discount factor is used to reveal risk to return. However, this approach is not considered appropriate
for valuation of businesses that highly dynamic and immature, since the same discount factor is not to be used for products under development facing development risks and revenues from product sales associated
with returns to market risk, since these risks are different. The discounted cash flow method fails to reflect
the ability to respond to changes in technology and market. Further, high discount rates reflecting high uncertainty and risk reduces the valuation too much in order to conduct businesses efficiently. If low
valuations are obtained for biotechnology companies the risk for them not obtaining sufficient funding occur. The purpose of this study is to develop a valuation tool for valuation of biotechnology companies.
The theory part conducted an industry analyze focusing on identifying industry specific characteristics. The study will produced an overview of existing methods and tools for valuation used as of today, and identified
them to be incompatible for valuation of biotechnology companies. In order to address some of the weaknesses of the traditional valuation methods explored the theory of real options and assessed the
applicability of real options as a tool for valuation of high technology companies with no products or markets. The biotechnology companies are characterized by the need to maintain an innovative and intense R&D in
order to bring products to the market, as the many product candidates fail to reach the market. The main
value of a biotechnological company’s assets lies in the intangible assets. Thus, real options form R&D projects may add significant value to the company. The industry is further characterized by high volatility and
asymmetric payoffs and hence real options were shown to be applicable
As a result of the literature review, the study produced a general real option model for valuation of
biotechnology companies. The case company used in the study is a biopharmaceutical drug development company. The development phase of drug candidates is analogous to a staged investment real option.
Hence, the development projects were valuated by the use of American call options, i.e. the option to abandon the project can be exercised whenever the cost exceeds the value of the asset. This is however less
likely to ever happen as the costs of developing a drug is minor in relation to the possible payoffs. Despite the fact, the real option model identified the real option valuation a potential upside of 73,6 mEUR to the
base case valuation of 276,7 mEUR initially to while allowing for each asset to be decided individually. If the
asset portfolio is valuated as an European call, i.e. the development portfolio is valuated to have a potential upside of 1% or 2,2 mEUR. This is due to the fact that the volatility of the entire portfolio is higher than the
volatility of individual assets, and the option to abandon was exercised at some of the nodes. The costs are included to the valuation model as one whole sum, which makes the option to abandon more attractive than
the option to continue; in those cases the asset values have made several downward movements.
The Decision Tree analysis is valuable for analyzing asset volatility. The use of the assets value as a starting
point for the option valuation of individual assets will however require more studies on the probabilities and revenue distribution of products developed by biopharmaceutical companies. Several factors might affect the
revenue distribution generated by drugs developed by biopharmaceutical companies. First, maintaining a product pipeline is a critical success factor of any pharmaceutical company. This requires efficient
management of several projects simultaneously. In biotechnology companies these factors are even more
crucial, as they need to manage projects even more cross disciplinary and the collaborations network are probable even more complex i.e. relatively. In fact, not much information on revenue distribution and
probability of product quality exists yet on products developed by biotechnology companies- since most of them are still in the pipeline. The development of biopharmaceutical drugs might be exposed to changes in
regulatory procedures, which might affect the option valuation model presented in this study.
Real option valuation adds value to the valuation process. First, the valuer receives insight in decisions
available to the managers of the company to be valued. This additional value produced due to flexibility on

89
financial decisions should be recognized in companies where capable management team is present. ROV puts
a value on management. Second, the outcomes on the decisions is quantified, without reducing the value too
much (i.e. as the DCF method does) due to excess discounting (i.e. to high discount rates). This because ROV evaluates the changes in asset value based on the volatility, and then discounts the value risk-neutrally.
The changes in asset value calculated as of the volatility reveals the changes in market prices of the asset directly, not having to estimate beta or market price premium. For instance, the volatility of a replicating
portfolio can be used for estimation of individual asset volatility as of the weighted average on investment
relatively to all investments. Third, once produced the ROV is applicable for analyzing the affects of changes in any of the input variables and it is easily updated as changes occur or new information is acquired. Finally,
it is fun.


APPENDICES Appendix 1 The staged investment (i.e. a compound option) in biopharmaceutical product development.
At each node, the managers can decide whether to continue the development of a drug potential or not. The successfully developed drug may be of five qualities: a start, above
average, average, below average or dog. Appendix 2 Variables taken into account when selecting a replicating portfolio for estimation of the
volatility parameter. If any of content of cell is indicated in red- the company has not been
considered applicable for representation in the replicating portfolio due to the fact that this factor has been considered to be too deviating from the case company.
Appendix 3 Real options available for biotechnology companies. The red points indicate decision points, where management can decide whether to exercise the option or not as new information is
acquired. Appendix 4 Base case valuation of the case company as of September 2001. The project’s revenues are
risk adjusted for the probability of success at each development phase. The cash flows are
discounted at 12,5%. Appendix 5 The costs and revenues from items not directly related to assets. The costs include also
taxes, which are adjusted fro the revenues generated by the assets. Thus, the costs and revenues for other items are developed for 1) the most probable revenues and 2) the
Decision Tree revenues Appendix 6 Estimation of the development cash flows and the cash flows from commercialization of
project Bioheparin. Appendix 7 Estimation of the development cash flows and the cash flows from commercialization of
project Vapantix. Appendix 8 Estimation of the development cash flows and the cash flows from commercialization of
project Huvap Appendix 9 Estimation of the development cash flows and the cash flows from commercialization of
project Vapill Appendix 10 The decision tree outcomes of forecasted commercialization cash flows for development
projects Bioheparin and Vapantix. Appendix 11 The decision tree outcomes of forecasted commercialization cash flows for development
projects Huvap and Vapill. Appendix 12 Derived parameters for the individual assets BioHeparin and Vapantix. Appendix 13 Derived parameters for the individual assets Vapill and Huvap Appendix 14 Individual real option valuation of asset BioHeparin. The asset is valuated as an American
call option with a maturity equal to time-to-market of the development project. The asset
value used as input to the binomial trees is the discounted and risk-adjusted value
commercialization cash flows from the decision tree and the average-one forecasted cash flow. Finally, the option is valuated for both asset values by the use of the Black-Scholes
model Appendix 15 Individual real option valuation of asset Vapantix. The asset is valuated as an American call
option with a maturity equal to time-to-market of the development project. The asset value used as input to the binomial trees is the discounted and risk-adjusted value
commercialization cash flows from the decision tree and the average-one forecasted cash
flow. Finally, the option is valuated for both asset values by the use of the Black-Scholes model
Appendix 16 Individual real option valuation of asset Huvap. The asset is valuated as an American call option with a maturity equal to time-to-market of the development project. The asset value
used as input to the binomial trees is the discounted and risk-adjusted value
commercialization cash flows from the decision tree and the average-one forecasted cash flow. Finally, the option is valuated for both asset values by the use of the Black-Scholes
model Appendix 17 Real option valuation of asset Vapill. The asset is valuated as an American call option with a
maturity equal to time-to-market of the development project. The asset value used as input to the binomial trees is the discounted and risk-adjusted value commercialization cash flows
from the decision tree and the average-one forecasted cash flow. Finally, the option is
valuated for both asset values by the use of the Black-Scholes model Appendix 18 Analysis of company volatility in respect to replicating portfolio variables. Appendix 19 Asset value and costs of development and derived parameters for ROV of entire
development portfolio

Appendix 20 ROV of the case company’s entire development portfolio as an American call, European call and Black-Scholes options based on the most probable asset value.
Appendix 21 ROV of the case company’s entire development portfolio as an American call, European call and Black-Scholes options based on asset value generated by the Decision Tree analysis.
Appendix 22 Sensitivity analysis with respect to volatility Appendix 23 Sensitivity analysis with respect to the risk free interest rate. Appendix 24 Sensitivity analysis with respect to time to market
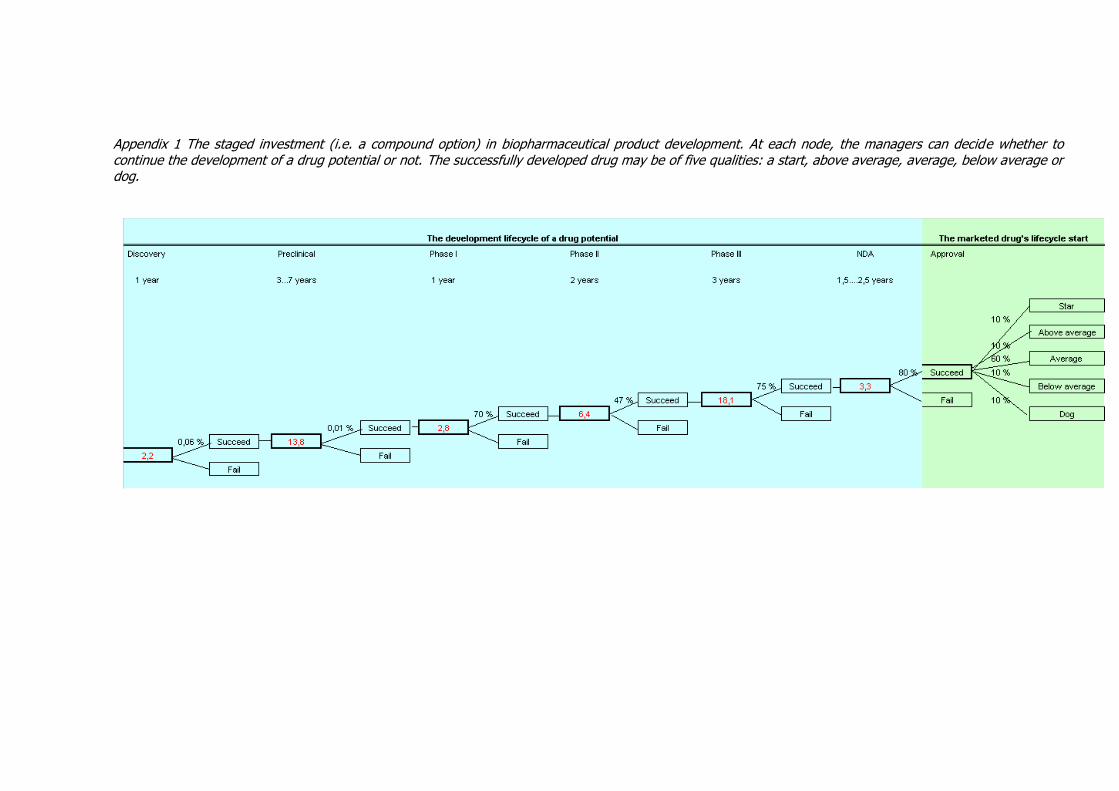
Appendix 1 The staged investment (i.e. a compound option) in biopharmaceutical product development. At each node, the managers can decide whether to continue the development of a drug potential or not. The successfully developed drug may be of five qualities: a start, above average, average, below average or dog.
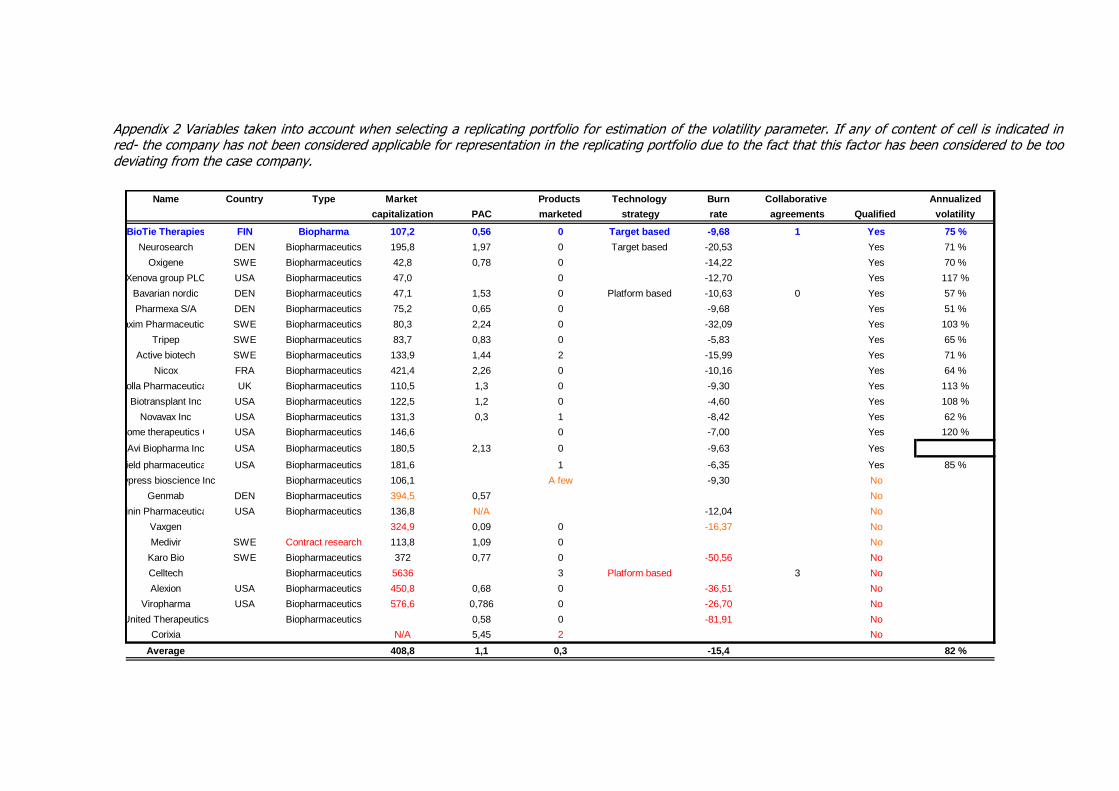
Appendix 2 Variables taken into account when selecting a replicating portfolio for estimation of the volatility parameter. If any of content of cell is indicated in red- the company has not been considered applicable for representation in the replicating portfolio due to the fact that this factor has been considered to be too deviating from the case company.
Name Country Type Market Products Technology Burn Collaborative Annualized
capitalization PAC marketed strategy rate agreements Qualified volatility
BioTie Therapies FIN Biopharma 107,2 0,56 0 Target based -9,68 1 Yes 75 %
Neurosearch DEN Biopharmaceutics 195,8 1,97 0 Target based -20,53 Yes 71 %
Oxigene SWE Biopharmaceutics 42,8 0,78 0 -14,22 Yes 70 %
Xenova group PLC USA Biopharmaceutics 47,0 0 -12,70 Yes 117 %
Bavarian nordic DEN Biopharmaceutics 47,1 1,53 0 Platform based -10,63 0 Yes 57 %
Pharmexa S/A DEN Biopharmaceutics 75,2 0,65 0 -9,68 Yes 51 %
Maxim Pharmaceuticals SWE Biopharmaceutics 80,3 2,24 0 -32,09 Yes 103 %
Tripep SWE Biopharmaceutics 83,7 0,83 0 -5,83 Yes 65 %
Active biotech SWE Biopharmaceutics 133,9 1,44 2 -15,99 Yes 71 %
Nicox FRA Biopharmaceutics 421,4 2,26 0 -10,16 Yes 64 %
La Jolla Pharmaceutical Co UK Biopharmaceutics 110,5 1,3 0 -9,30 Yes 113 %
Biotransplant Inc USA Biopharmaceutics 122,5 1,2 0 -4,60 Yes 108 %
Novavax Inc USA Biopharmaceutics 131,3 0,3 1 -8,42 Yes 62 %
Genome therapeutics Corp USA Biopharmaceutics 146,6 0 -7,00 Yes 120 %
Avi Biopharma Inc USA Biopharmaceutics 180,5 2,13 0 -9,63 Yes
Sheffield pharmaceuticals Inc USA Biopharmaceutics 181,6 1 -6,35 Yes 85 %
Cypress bioscience Inc Biopharmaceutics 106,1 A few -9,30 No
Genmab DEN Biopharmaceutics 394,5 0,57 No
Magainin Pharmaceuticals Inc USA Biopharmaceutics 136,8 N/A -12,04 No
Vaxgen 324,9 0,09 0 -16,37 No
Medivir SWE Contract research 113,8 1,09 0 No
Karo Bio SWE Biopharmaceutics 372 0,77 0 -50,56 No
Celltech Biopharmaceutics 5636 3 Platform based 3 No
Alexion USA Biopharmaceutics 450,8 0,68 0 -36,51 No
Viropharma USA Biopharmaceutics 576,6 0,786 0 -26,70 No
United Therapeutics Biopharmaceutics 0,58 0 -81,91 No
Corixia N/A 5,45 2 No
Average 408,8 1,1 0,3 -15,4 82 %

Appendix 3 Real options available for biotechnology companies. The red points indicate decision points, where management can decide whether to exercise the option or not as new information is acquired.

Appendix 4 Base case valuation of the case company as of September 2001. The project’s revenues are risk adjusted for the probability of success at each development phase. The cash flows are discounted at 12,5%.

Appendix 5 The costs and revenues from items not directly related to assets. The costs include also taxes, which are adjusted fro the revenues generated by the assets. Thus, the costs and revenues for other items are developed for 1) the most probable revenues and 2) the Decision Tree revenues

Appendix 6 Estimation of the development cash flows and the cash flows from commercialization of project Bioheparin.

Appendix 7 Estimation of the development cash flows and the cash flows from commercialization of project Vapantix.
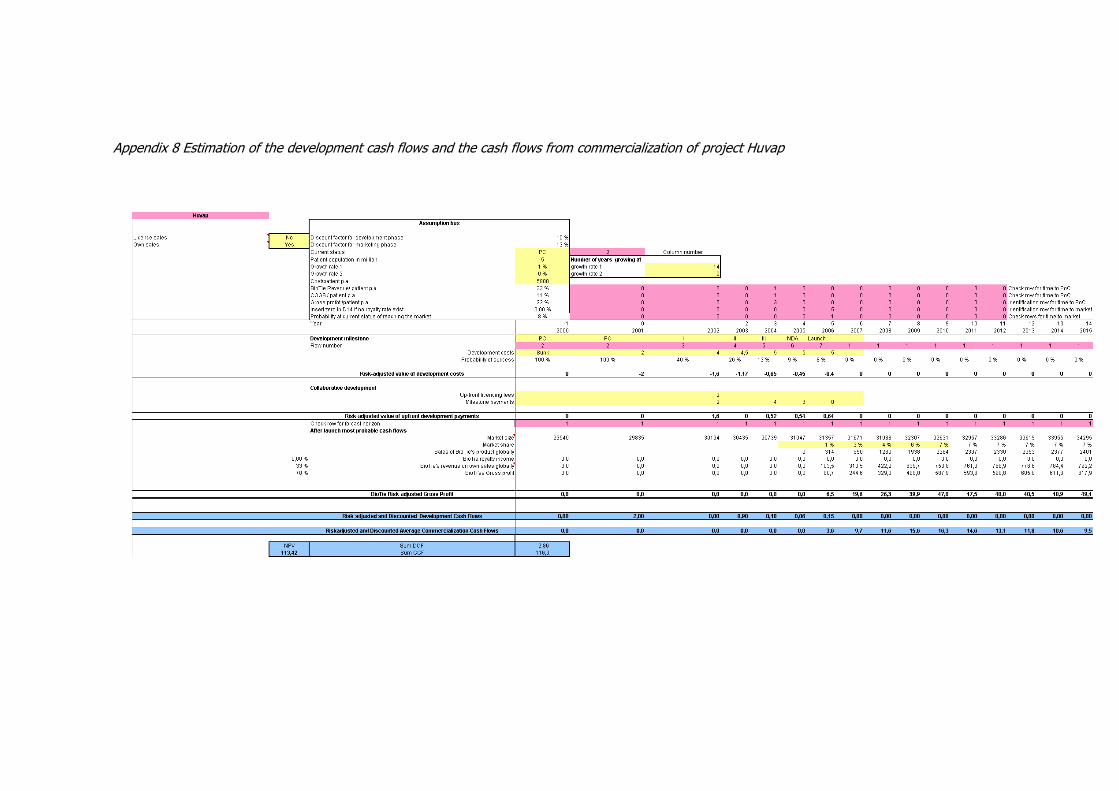
Appendix 8 Estimation of the development cash flows and the cash flows from commercialization of project Huvap

Appendix 9 Estimation of the development cash flows and the cash flows from commercialization of project Vapill
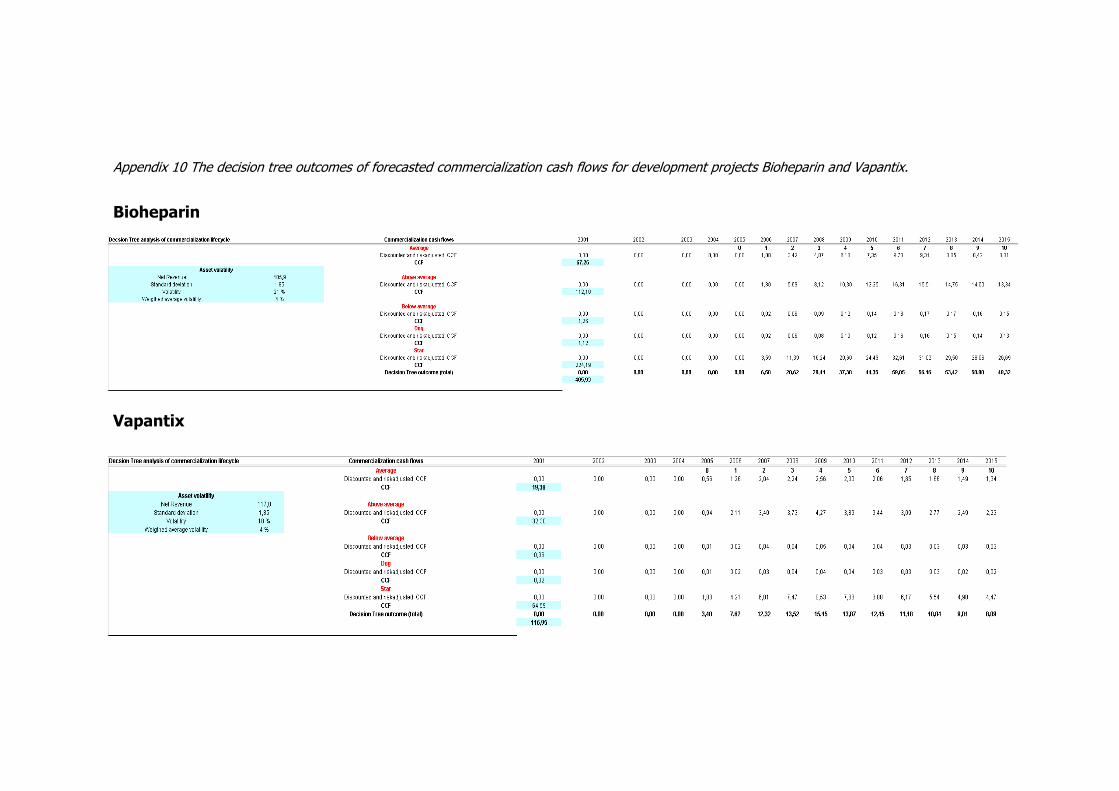
Appendix 10 The decision tree outcomes of forecasted commercialization cash flows for development projects Bioheparin and Vapantix.
Bioheparin
Vapantix
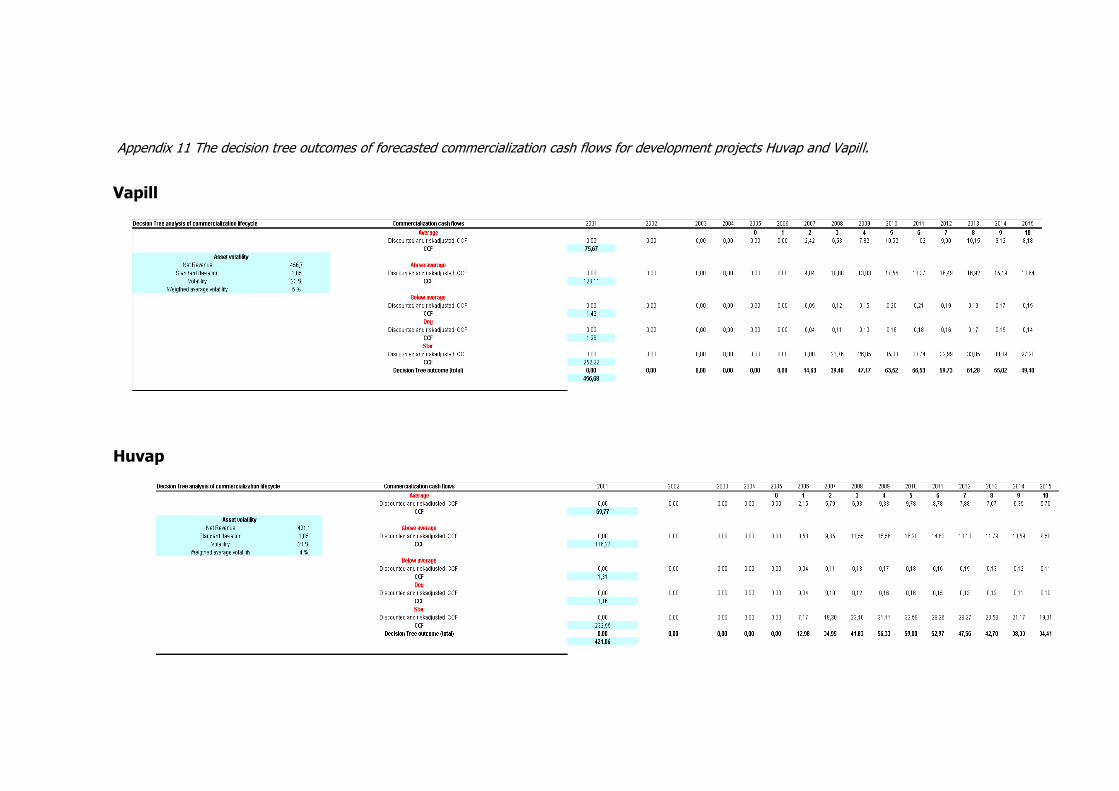
Appendix 11 The decision tree outcomes of forecasted commercialization cash flows for development projects Huvap and Vapill.
Vapill
Huvap
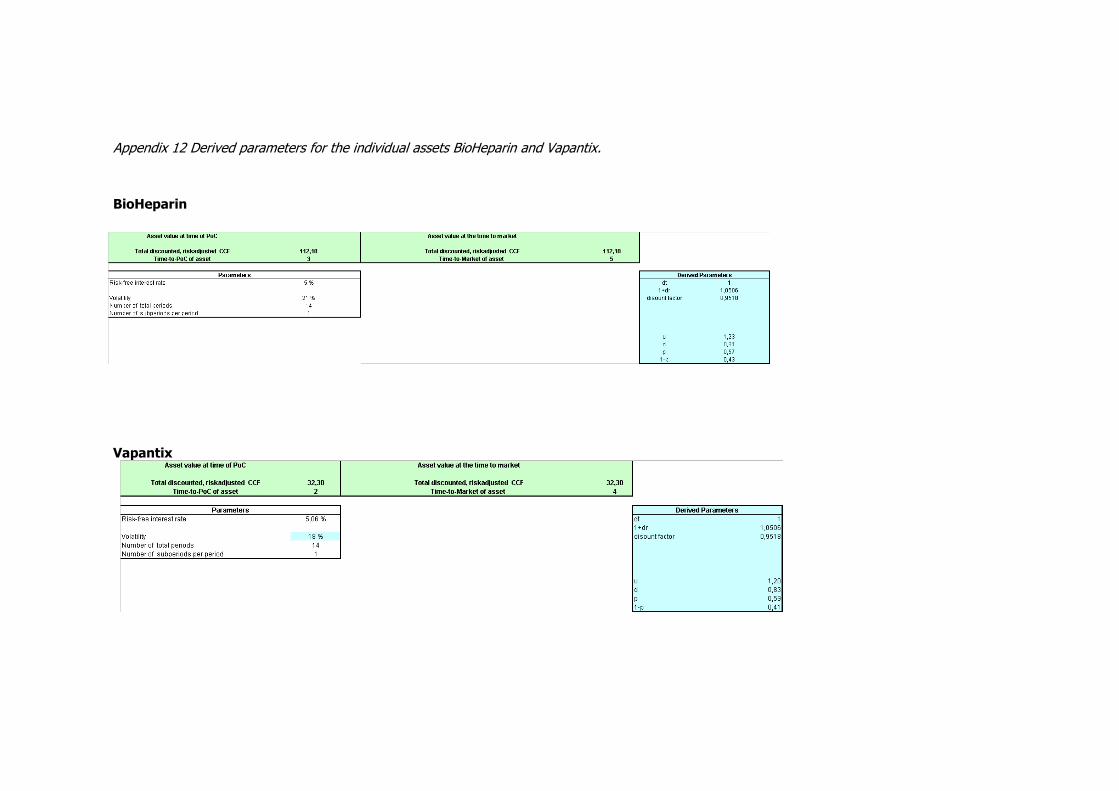
Appendix 12 Derived parameters for the individual assets BioHeparin and Vapantix.
BioHeparin
Vapantix
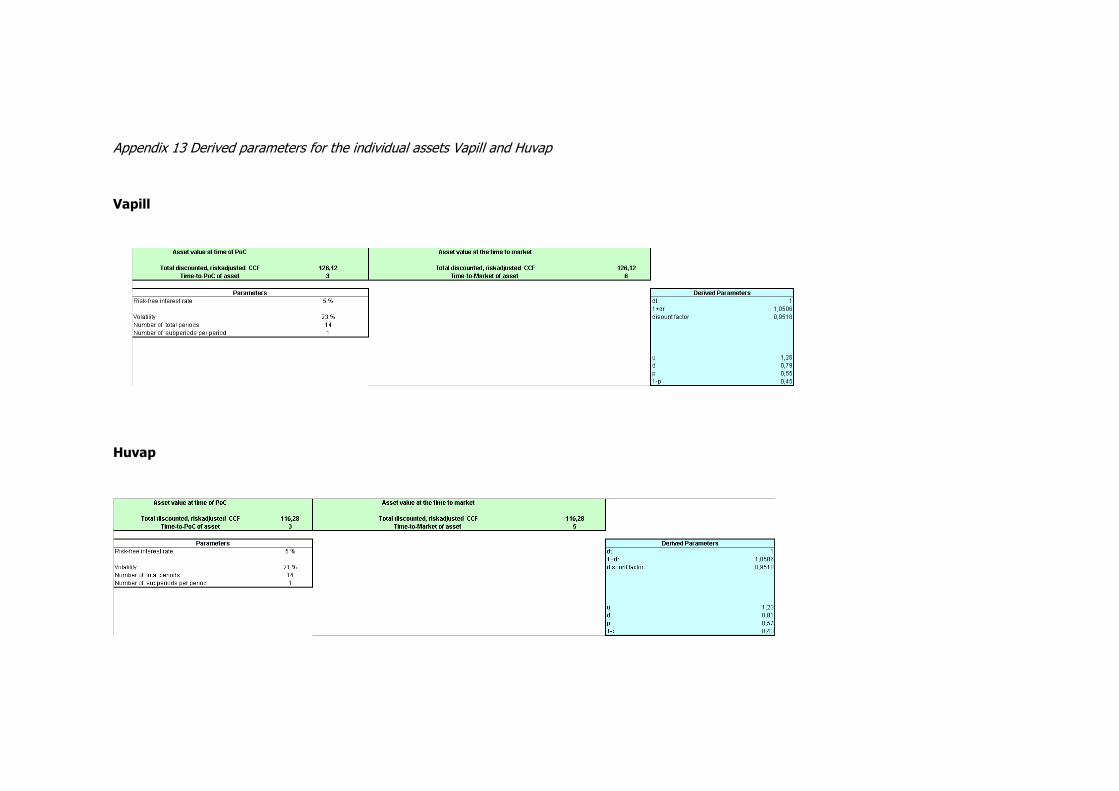
Appendix 13 Derived parameters for the individual assets Vapill and Huvap
Vapill
Huvap

Appendix 14 Individual real option valuation of asset BioHeparin. The asset is valuated as an American call option with a maturity equal to time-to-market of the development project. The asset value used as input to the binomial trees is the discounted and risk-adjusted value commercialization cash flows from the decision tree and the average-one forecasted cash flow. Finally, the option is valuated for both asset values by the use of the Black-Scholes model
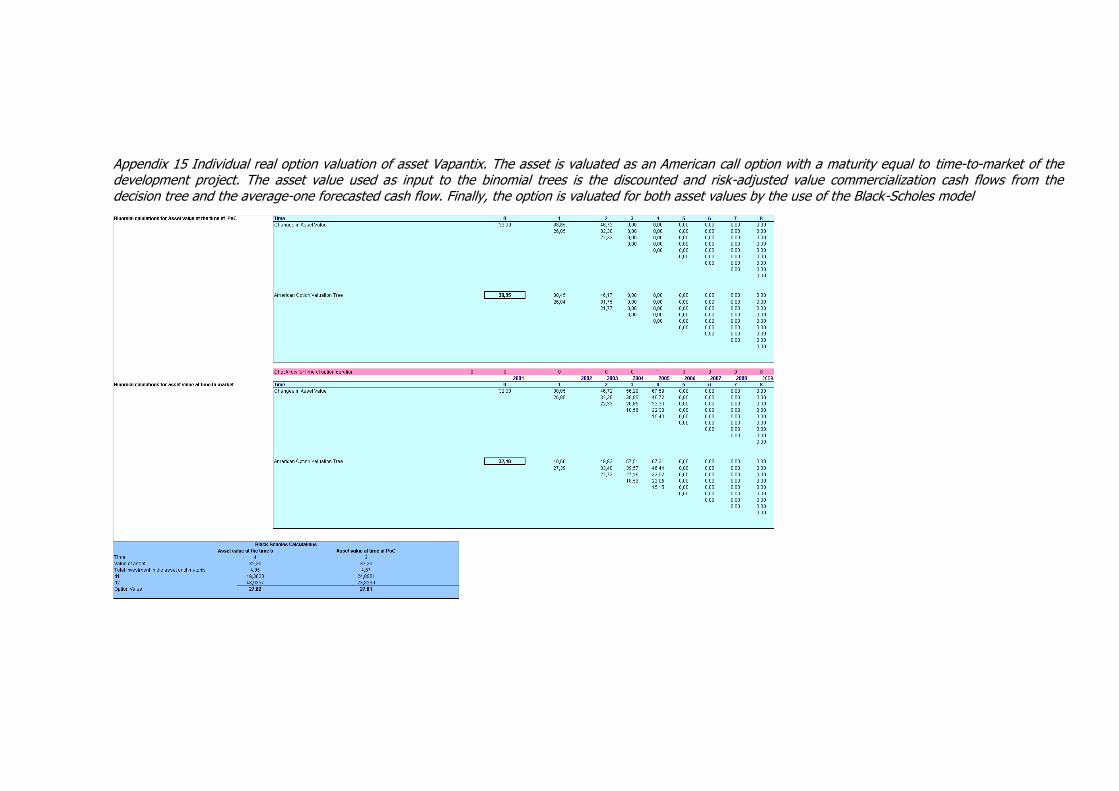
Appendix 15 Individual real option valuation of asset Vapantix. The asset is valuated as an American call option with a maturity equal to time-to-market of the development project. The asset value used as input to the binomial trees is the discounted and risk-adjusted value commercialization cash flows from the decision tree and the average-one forecasted cash flow. Finally, the option is valuated for both asset values by the use of the Black-Scholes model
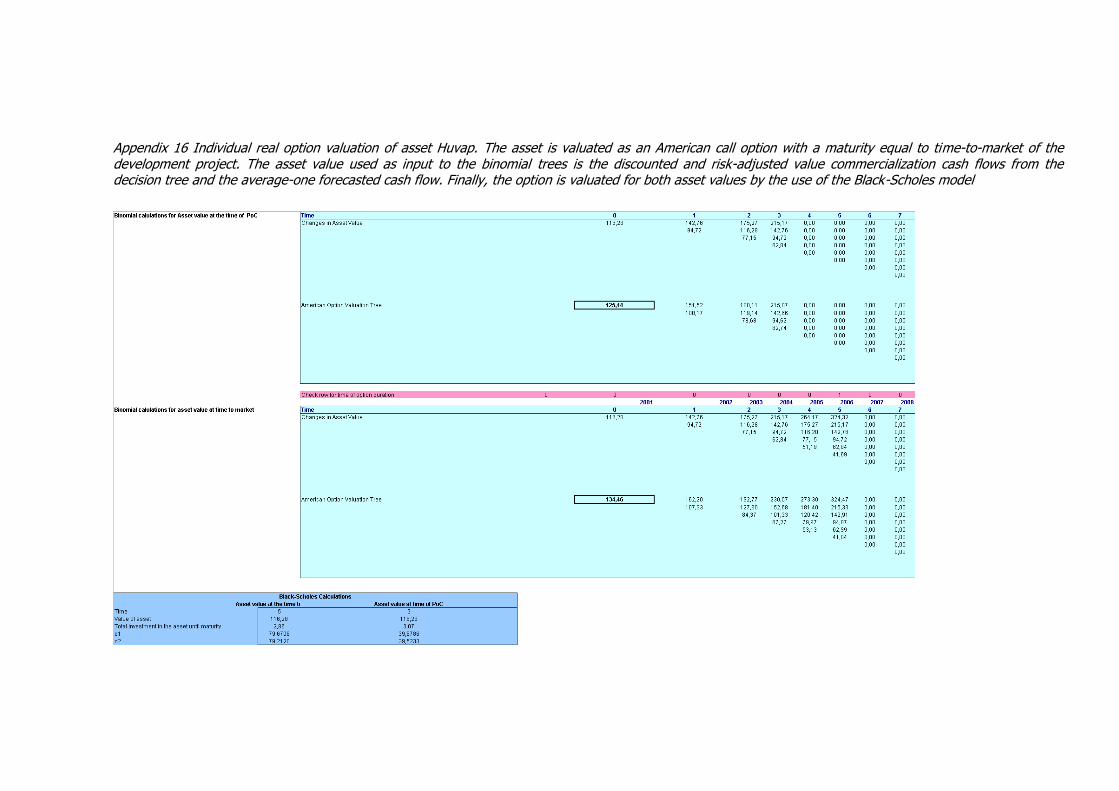
Appendix 16 Individual real option valuation of asset Huvap. The asset is valuated as an American call option with a maturity equal to time-to-market of the development project. The asset value used as input to the binomial trees is the discounted and risk-adjusted value commercialization cash flows from the decision tree and the average-one forecasted cash flow. Finally, the option is valuated for both asset values by the use of the Black-Scholes model
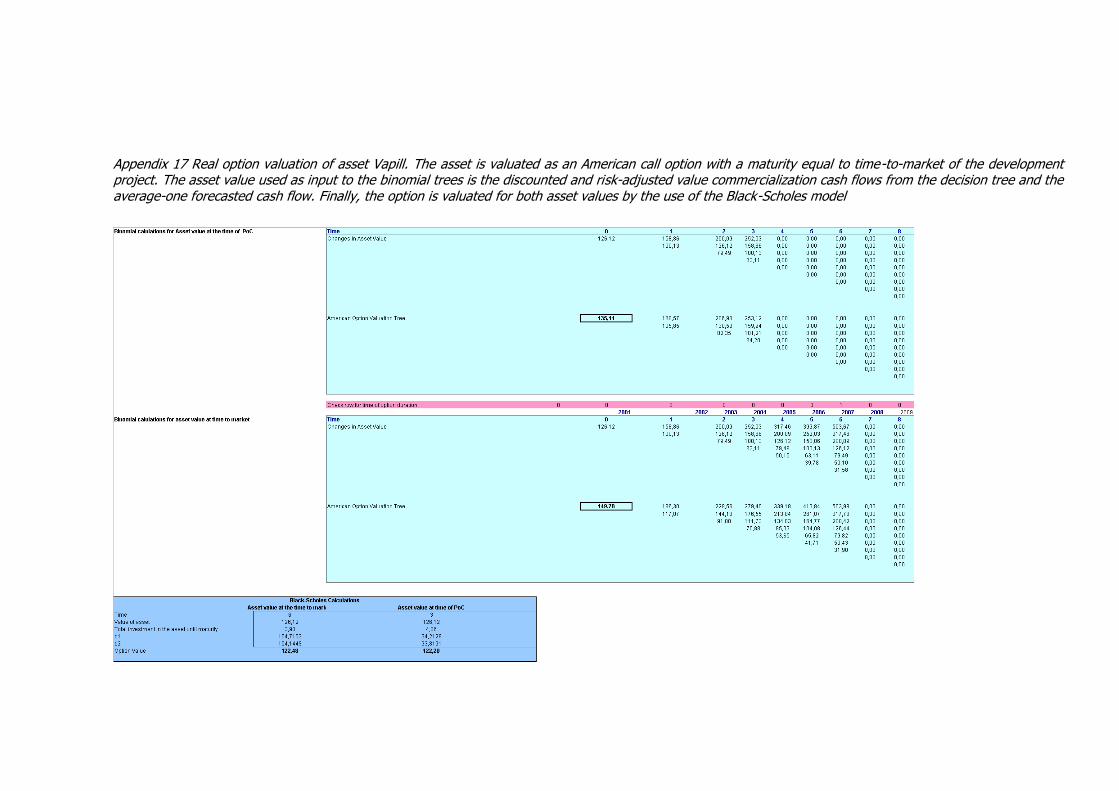
Appendix 17 Real option valuation of asset Vapill. The asset is valuated as an American call option with a maturity equal to time-to-market of the development project. The asset value used as input to the binomial trees is the discounted and risk-adjusted value commercialization cash flows from the decision tree and the average-one forecasted cash flow. Finally, the option is valuated for both asset values by the use of the Black-Scholes model

Appendix 18 Analysis of company volatility in respect to replicating portfolio variables.

Appendix 19 Asset value and costs of development and derived parameters for ROV of entire development portfolio

Appendix 20 ROV of the case company’s entire development portfolio as an American call, European call and Black-Scholes options based on the most probable asset value.

Appendix 21 ROV of the case company’s entire development portfolio as an American call, European call and Black-Scholes options based on asset value generated by the Decision Tree analysis.
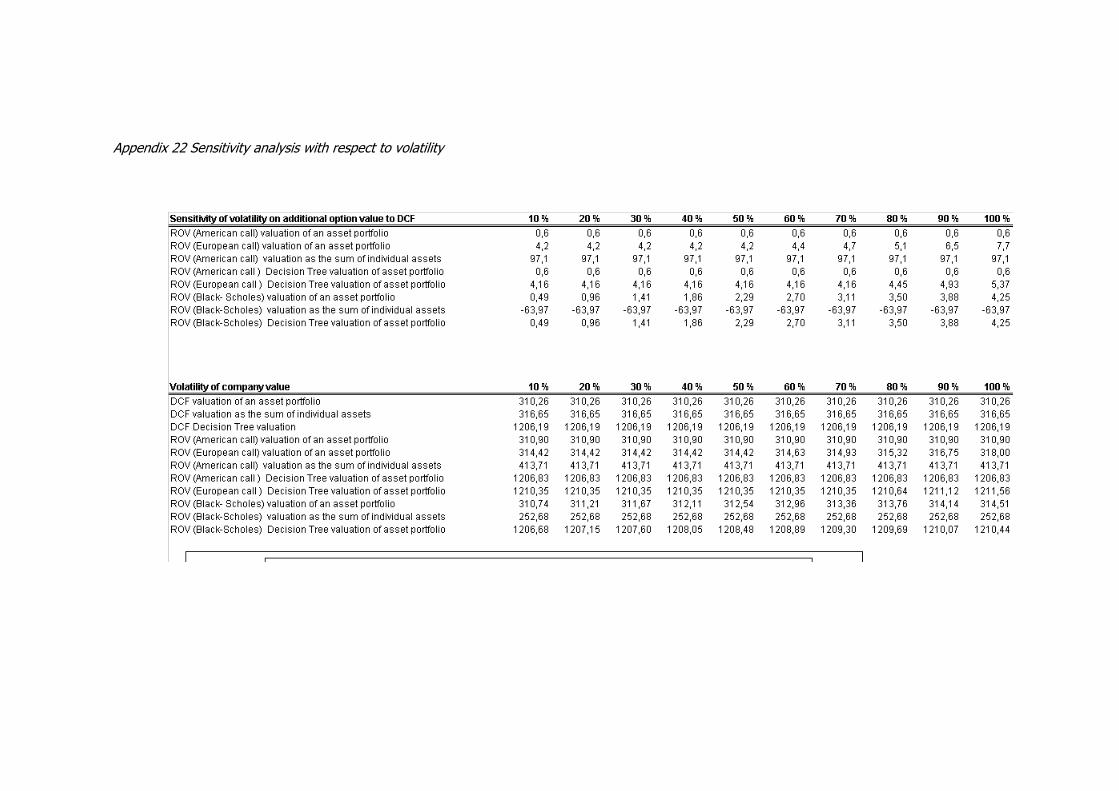
Appendix 22 Sensitivity analysis with respect to volatility

Appendix 23 Sensitivity analysis with respect to the risk free interest rate.
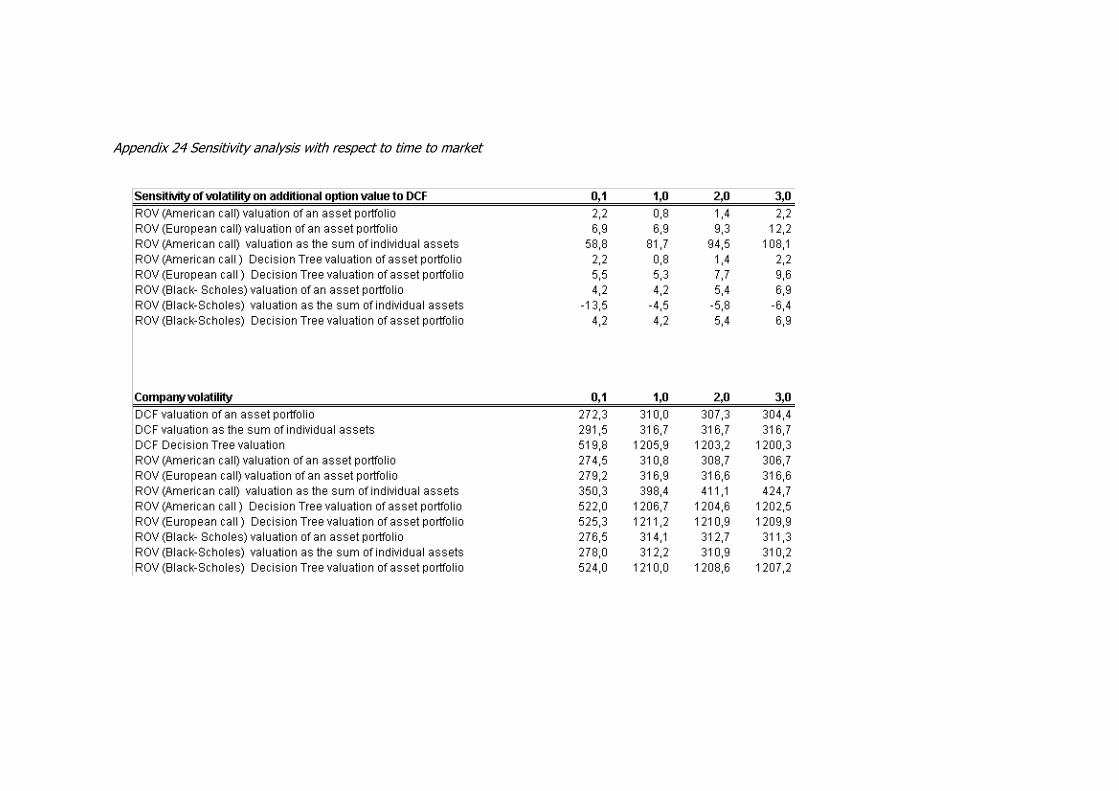
Appendix 24 Sensitivity analysis with respect to time to market

REFERENCES
1 Sauer, P., Wall Street gives biotech a shot in the arm, Chemical Market Reporter, Mar 12, 2001 2 Santini, L., Healthcare bankers have found a new darling: services, The Investment Dealers' Digest : IDD;
New York, Mar 5, 2001, pages 6-8. 3 Ernst & Young 2001, Biotechnology industry report 4 Kane, L., 25 top health care stocks: Will they lead the next market boom? Medical Economics; Oradell; Apr
9, 2001. 5 Cohen, J., Association for Computing Machinery. Communications of the ACM; New York; Mar 2001, 44(3),
pages76-77 6 Biotechnology review, West LB Panmure, 10 May 2000, 76 pages. 7 Convergence: The biotechnology industry report, Ernst & Young, Millennium edition, 85 pages. 8 Convergence: A technology explosion, Earnst&Young2000, 87 pages. 9 Szaro, D., A., The E&Y Global Health Science Industry Team, 2001 Ernst & Young. 10 Ernst &Young 's Eighth Annual European Life Sciences Report 2001. 11 Boswell, C., A time of ferment for biopharmaceutical contract manufacturing, Chemical Market Reporter;
New York; Mar 12, 2001 12 Vasquez, G., B., Biotechnology: A look ahead, Chemical & Engineering News, Washington Mar 26, 2001,
79(13), page 210. 13 Tudor, J., Valuation of the health services industry, Weekly Corporate Growth Report, 1133, pages 11237-11238, Mar 26, 2001. 14 Niemeyer, C., M., The amazing outlook for biomolecules, Chemical & Engineering News; Washington Mar 26, 2001, 79(13) page 281. 15 Boswell, C., A time of ferment for biopharmaceutical contract manufacturing, Chemical Market Reporter; New York; Mar 12, 2001. 16 Zelinski, T., Chemistry meets biotechnology, Chemical & Engineering News, Washington Mar 26 2001,
79(13), Page 264 17 Langreth, R., Decoding Gene Stocks, Forbes; New York; Oct 30, 2000. 18 Wechsler, J., Genomic discoveries challenge drug manufacturers, Pharmaceutical Technology, Cleveland; Apr 2001, 25(4), pages12-20. 19 Challener, C., Is the generics industry ready for multi-source biologics? Chemical Market Reporter, New
York Apr 23, 2001, 259(17), pages 14-15. 20 Challener, C., Is the generics industry ready for multi-source biologics? Chemical Market Reporter, New
York Apr 23, 2001,259(17), pages 14-15. 21 McGarry, S., Tracey, M., Murphy, J., Sahu, V., Healthcare; The European Biotech Sector, Goldman Sachs
Investment research, 22 October 1999, 59 pages. 22 Kane, L., 25 top health care stocks: Will they lead the next market boom? Medical Economics; Oradell; Apr 9, 2001 23 Sauer, P., Wall Street gives biotech a shot in the arm, Chemical Market Reporter, Mar 12, 2001 24 Sauer, P., Wall Street gives biotech a shot in the arm, Chemical Market Reporter, Mar 12, 2001 25 Sauer, P., Wall Street gives biotech a shot in the arm, Chemical Market Reporter, Mar 12, 2001 26 Lavoie, B. and Sheldon, I. M. (2000). The comparative advantage of real options: An Explanation for the
US specialization in biotechnology. AgBioForum, 3(1), 47-52. 27 Ernst & Young 2001, Biotechnology industry report 28 McGarry, S., Tracey, M., Murphy, J., Sahu, V., Healthcare; The European Biotech Sector, Goldman Sachs
Investment research, 22 October 1999, 59 pages. 29 Ernst & Young 2001, Biotechnology industry report 30 Karet, Gail, Stud, Tim, Managing biotech requires cross-functional coordination Research & Development;
Barrington; Mar 2001, 43(3), pages 12-17. 31 Ernst &Young 's Eighth Annual European Life Sciences Report 2001. 32 Convergence: A technology explosion, Earnst&Young2000, 87 pages. 33 Ernst & Young 2001, Biotechnology industry report

34 Ernst &Young 's Eighth Annual European Life Sciences Report 2001. 35 Sauer, P., Wall Street gives biotech a shot in the arm, Chemical Market Reporter, Mar 12, 2001 36 Ernst & Young 2001, Biotechnology industry report 37 Ernst & Young 2001, Biotechnology industry report 38 www.biospace. Com: Biotechnology Financings and Investment Outlook: 2000 Investment Outlook, Private
Biotechnology Companies and Venture Capital 39 Ernst &Young 's Eighth Annual European Life Sciences Report 2001. 40 Ernst &Young 's Eighth Annual European Life Sciences Report 2001. 41 Ernst & Young 2001, Biotechnology industry report 42 Ernst &Young 's Eighth Annual European Life Sciences Report 2001. 43 Ernst &Young 's Seventh Annual European Life Sciences Report 2001. 44 Boswell, C., A time of ferment for biopharmaceutical contract manufacturing, Chemical Market Reporter;
New York; Mar 12, 2001. 45 Kane, L., 25 top health care stocks: Will they lead the next market boom? Medical Economics; Oradell; Apr 9, 2001. 46 van Arnum, P., Antibody production, Chemical Market Reporter, New York; Mar 12, 2001, 259(11) pages FR6- 47 Wechsler, J., Genomic discoveries challenge drug manufacturers, Pharmaceutical Technology, Cleveland;
Apr 2001, 25(4), pages12-20. 48 Ernst &Young 's Eighth Annual European Life Sciences Report 2001. 49 Ernst & Young 2001, Biotechnology industry report 50 McGarry, S., Tracey, M., Murphy, J., Sahu, V., Healthcare; The European Biotech Sector, Goldman Sachs
Investment research, 22 October 1999, 59 pages. 51 Boswell, C., A time of ferment for biopharmaceutical contract manufacturing, Chemical Market Reporter;
New York; Mar 12, 2001. 52 Nelson, G.C., Josling, T., Bullock, D., Unnevehr, L., Rosegrant, M. & Hill. L. (1999). The economics and politics of genetically modified organisms in agriculture: Implications for WTO 2000 (Bulletin, 809, Office of
Research). Urbana-Champaign, IL: University of Illinois at Urbana-Champaign. 53 Consumer power heralds hard times for researchers. (2000, February 4). Science, 287, 790-791 54 Lavoie, B. and Sheldon, I. M. (2000). The comparative advantage of real options: An Explanation for the
US specialization in biotechnology. AgBioForum, 3(1), 47-52. 55 Ernst &Young 's Eighth Annual European Life Sciences Report 2001. 56 Wechsler, J., Genomic discoveries challenge drug manufacturers, Pharmaceutical Technology, Cleveland; Apr 2001, 25(4), pages12-20. 57 Oliver, R., The Coming Biotech Age: The Business of Bio-Materials, McGraw-Hill, New Yorek 2000, 266
pages. 58 Fohn, J., Biomaterials: Body Parts of the Future, Technology today, fall 1995, Southwest research institute. 59 Tudor, J., Valuation of the health services industry, Weekly Corporate Growth Report, 1133, pages 11237-11238, Mar 26, 2001. 60 Millenium in motion: Global trends shaping the health science industry, Earnst&Young health science report, June 2001, 29 pages. 61 McGarry, S., Tracey, M., Murphy, J., Sahu, V., Healthcare; The European Biotech Sector, Goldman Sachs
Investment research, 22 October 1999, 59 pages. 62 McGarry, S., Tracey, M., Murphy, J., Sahu, V., Healthcare; The European Biotech Sector, Goldman Sachs
Investment research, 22 October 1999, 59 pages. 63 Tudor, J., Valuation of the health services industry, Weekly Corporate Growth Report, 1133, pages 11237-
11238, Mar 26, 2001. 64 Tudor, J., Valuation of the health services industry, Weekly Corporate Growth Report, 1133, pages 11237-11238, Mar 26, 2001. 65 Wechsler, Jill, Genomic discoveries challenge drug manufacturers, Pharmaceutical Technology, Cleveland; Apr 2001, 25(4), pages12-20.

66 Wechsler, Jill, Genomic discoveries challenge drug manufacturers, Pharmaceutical Technology, Cleveland;
Apr 2001, 25(4), pages12-20. 67 Pandey, Anjali, Drug design, development, delivery, Chemical & Engineering News, Washington Mar 26,
2001, 79(13), page 260. 68 Wechsler, Jill, Genomic discoveries challenge drug manufacturers, Pharmaceutical Technology, Cleveland;
Apr 2001, 25(4), pages12-20. 69 Copeland, T., Koller, T., Murin, J., Valuation Measuring and Managing the Value of Companies, Wiley et Sons, 3rd edition, New York 2000, page 54. 70 Hietala, P., Corporate Financing, MBA module in finance, Helsinki University of Technology, 12-13.12.2000. 71 Anonymous, Valuing privately owned companies. Valuation techniques, LBS reference CS944-037-02,
London Business School 1993, 35 pages. 72 Copeland, T., Koller, T., Murin, J., Valuation Measuring and Managing the Value of Companies, Wiley et
Sons, 3rd edition, New York 2000, pages 55-72 73 Higgins, R., Analysis for Financial management, Irwin McGraw-Hill, 5th edition, Boston 1998, page 159. 74 Schweih, R., P., How much is it worth?, Journal of Property Management, Chicago; May/Jun 2000, 65(3),
pages 60-64. 75 Schweih, R., P., How much is it worth?, Journal of Property Management, Chicago; May/Jun 2000, 65(3),
pages 60-64. 76 Schweih, R.t P., How much is it worth?, Journal of Property Management, Chicago; May/Jun 2000, 65(3), pages 60-64. 77 Schweih, Robert P., How much is it worth?, Journal of Property Management, Chicago; May/Jun 2000, 65(3), pages 60-64. 78 Simond, Richard R, Yield capitalization is not a declining asset valuation model, Assessment Journal; Chicago; May/Jun 1999, 6(3), pages36-40. 79 Simond, Richard R, Yield capitalization is not a declining asset valuation model, Assessment Journal;
Chicago; May/Jun 1999, 6(3), pages36-40. 80 Anonymous, Valuing privately owned companies. Valuation techniques, LBS reference CS944-037-02,
London Business School 1993, 35 pages. 81 Copeland, T., Koller, T., Murin, J., Valuation Measuring and Managing the Value of Companies, Wiley et
Sons, 3rd edition, New York 2000, pages 55-72. 82 Cochrane, John H., Where is the market gong?, Economic perspectives, November/December 1997, 11(6), pages 3-40. 83 Anonymous, Valuing privately owned companies. Valuation techniques, LBS reference CS944-037-02, London Business School 1993, 35 pages. 84 Brealey, Richard A., Myers, Stewart M., The principles of corporate finance, Irwin McGraw-Hill, 6th edition,
Boston 2000, 1006 pages. 85 Anonymous, Valuing privately owned companies. Valuation techniques, LBS reference CS944-037-02,
London Business School 1993, 35 pages. 86 Anonymous, Valuing privately owned companies. Valuation techniques, LBS reference CS944-037-02,
London Business School 1993, 35 pages. 87 Anonymous, Valuing privately owned companies. Valuation techniques, LBS reference CS944-037-02,
London Business School 1993, 35 pages. 88 Copeland, T., Koller, T., Murin, J., Valuation Measuring and Managing the Value of Companies, Wiley et Sons, 3rd edition, New York 2000, pages 55-72. 89 Copeland, T., Koller, T., Murin, J., Valuation Measuring and Managing the Value of Companies, Wiley et Sons, 3rd edition, New York 2000, pages 55-72. 90 Hietala, P., Corporate Financing, MBA module in finance, Helsinki University of Technology, 12-13.12.2000. 91 Fabozzi, Frank J., Modigliani, Franco, Feri, Michale G., Foundations of financial markets and institutions, Prentice Hall, 2nd edition, New Jersey 1998, 638 pages. 92 Fabozzi, Frank J., Modigliani, Franco, Feri, Michale G., Foundations of financial markets and institutions, Prentice Hall, 2nd edition, New Jersey 1998, 638 pages.

93 Black, N., H., Shi, L., Park, C., S., Real option models for managing manufacturing system changes in the
new economy, The Engineering Economist; Norcross 2000, 45(3), pages 232-258. 94 Cochran, J. H., Portfolio advice for a multifactor world, June 28, 1999, 36 pages. 95 Cochran, J. H., New facts in finance, June 7, 1999. 96 Fabozzi, F., J., Modigliani, F., Feri, M., G., Foundations of financial markets and institutions, Prentice Hall,
2nd edition, New Jersey 1998, 638 pages. 97 Copeland, T., Koller, T., Murin, J., Valuation Measuring and Managing the Value of Companies, Wiley et Sons, 3rd edition, New York 2000, pages 55-72. 98 Anonymous, Valuing privately owned companies. Valuation techniques, LBS reference CS944-037-02, London Business School 1993, 35 pages. 99 Hietala, P., Corporate Financing, MBA module in finance, Helsinki University of Technology, 12-13.12.2000. 100 Fabozzi, F., J., Modigliani, F., Feri, M., G., Foundations of financial markets and institutions, Prentice Hall,
2nd edition, New Jersey 1998, 638 pages. 101 Berkman, H., Bradbury, M., E., Ferguson, J., The accuracy of price-earnings and discounted cash flow methods of IPO equity valuation, Journal of International Financial Management & Accounting; Oxford;
Summer 2000, 11(2), pages 71-83. 102 Coy, P., Exploiting Uncertainty- The ``real-options'' revolution in decision-making, Business Week; New
York; June 7, 1999, (3632), pages 118-148 103 Coy, P., Exploiting Uncertainty- The ``real-options'' revolution in decision-making, Business Week; New York; June 7, 1999, (3632), pages 118-148 104 Coy, P., Exploiting Uncertainty- The ``real-options'' revolution in decision-making, Business Week; New York; June 7, 1999, (3632), pages 118-148 105 Black, N., H., Shi, L., Park, C., S., Real option models for managing manufacturing system changes in the new economy, The Engineering Economist; Norcross 2000, 45(3), pages 232-258. 106 Copeland, T., E., Keenan, P., T., How much is flexibility worth, The McKinsey quaterly, 2 1998, pages 39-
49. 107 Greene, J., R., Is economic value added stunting your growth? Learn to measure your real options,
Earnst&Young. 108 Copeland, T., E., Keenan, P., T., How much is flexibility worth, The McKinsey quaterly, 2 1998, pages 39-
49. 109 Copeland, T., E., Keenan, P., T., How much is flexibility worth, The McKinsey quaterly, 2 1998, pages 39-49.
110 Echtering, J., Mueller, C., Rippetoe, T., Widestrand, J., Real options as an approach for company valuation, Seminar paper, Valuation of start-ups, WHU Otto-Beishem-Hoschule, Vallendar, 20-22 December,
2000. 111 Amram, M., Kulatilinka, N., Strategy and shareholder value: the real option frontier, Journal of corporate finance, 13(2), 2000, pages 8-21. 112 Alleman, J., Real Options overview, University of Colorado, 2000. 113 Alleman, J., Real Options overview, University of Colorado, 2000. 114 Merton, R., Applications of option pricing theory: twenty five years later, American Economic Review, 1998. 115 Copeland, T., Koller, T., Murrin, J., Valuation- Measuring and managing the value of companies, 3rd
edition, John Wiley &Sons, New York 2000, pages 399-432. 116 Copeland, T,, E., Keenan, P., T., How much is flexibility worth, The McKinsey quaterly, 2 1998, pages 39-
49. 117 Greene, J., R., Is economic value added stunting your growth? Learn to measure your real options,
Earnst&Young. 118 Alleman, J., Real Options overview, University of Colorado, 2000. 119 Reuer, J., J., Leiblein, M., J., Real options: Let the buyer beware, Mastering risk, 2001 London UK,
Prentice-Hall. 120 Reuer, J., J., Leiblein, M., J., Real options: Let the buyer beware, Mastering risk, 2001 London UK,
Prentice-Hall.

121 Copeland, T., Koller, T., Murrin, J., Valuation- Measuring and managing the value of companies, 3rd
edition, John Wiley &Sons, New York 2000, pages 399-432. 122 Williams, J., T., Redevelopment of real assets, Real Estate Economics; Bloomington; Fall 1997, 25(3),
pages 387-407 123 Copeland, T., Koller, T., Murrin, J., Valuation- Measuring and managing the value of companies, 3rd
edition, John Wiley &Sons, New York 2000, pages 399-432. 124 Copeland, T., Koller, T., Murrin, J., Valuation- Measuring and managing the value of companies, 3rd edition, John Wiley &Sons, New York 2000, pages 399-432.. 125 www.demoradanonline 126 Myers, S., C., Fischer Black's contributions to corporate finance, Financial Management; Tampa; Winter
1996, 25(4), pages 95-103 127 Trigeorgis, L. 1997. Real options. Cambridge, MA: MIT Press. 128 Kogut, B., Joint ventures and the option to expand and acquire, Management Science, 37,1991, pages 19-
33. 129 Kogut, B., Joint ventures and the option to expand and acquire, Management Science, 37,1991, pages 19-
33. 130 Reuer, J., J., Leiblein, M., J., Real options: Let the buyer beware, Mastering risk, 2001 London UK,
Prentice-Hall. 131 Scherer, F. M., & Ross, D, Industrial market structure and economic performance, 1990 3rd edition, Boston, MA: Houghton Mifflin. 132 Harbison, J. R., & Pekar, P., Jr. 1998. Smart alliances. San Francisco, CA: Jossey-Bass. 133 Stuart, T., Network positions and propensities to collaborate: An investigation of strategic alliance
formation in a high-technology industry. Administrative Science Quarterly, 43, 1998, pages 668-698. 134 Reuer, J., J., Leiblein, M., J., Downside risk implications of multinationality and international joint
ventures, Academy of Management Journal, 43(2), April 2000, pages 203-214. 135 Reuer, J., J., Leiblein, M., J., Real options: Let the buyer beware, Mastering risk, 2001 London UK, Prentice-Hall. 136 Folta, Timothy, B., Leiblein, Michael, J., Technology acquisitions and the choice of governance by established firms: Insights from option theory in a multinominal model, 137 Coy, Peter, Exploiting Uncertainty- The ``real-options'' revolution in decision-making, Business Week;
New York; June 7, 1999, (3632), pages 118-148. 138 Trigeorgis, L. "Topics in Real Options and Applications." Financial Management, Autumn 1993, pp. 202-
224. 139 Trigeorgis, L. "Topics in Real Options and Applications." Financial Management, Autumn 1993, pp. 202-
224. 140 Trigeorgis, L. Real Options: Managerial Flexibility and Strategy in Resource Allocation. 4th edition. MIT Press, Cambridge, MA, 1999 141 Morris, P.A., Teisberg, E.O. and Kolbe, L.A. "When Choosing R&D Projects, Go With the Long Shots." Research Technology Management, 34, January-February 1991, pp. 35-40. 142 Angelis, D., I., Capturing the option value of R&D, Research Technology Management; Washington; Jul/Aug 2000, 43(4), pages 31-34. 143 Fishback, D., The odds of success,Futures; Cedar Falls; Apr 1996, 25(5), pages 36-38. 144 Leslie, K., J., Michaels, M., P., The real power of real options, The McKinsey quaterly, 3 1997, pages 4- 23. 145 Leslie, K., J., Michaels, M., P., The real power of real options, The McKinsey quaterly, 3 1997, pages 4- 23. 146 Sheasley, D., W., Taking an options approach to new technology development, Research Technology
Management; Washington; Nov/Dec 2000, 43 (6), pages 37-43 147 Chan, H., W., The effect of volatility estimates in the valuation of underwritten rights issues, Applied
Financial Economics; London; Oct 1997, 7(5), pages 473-480. 148 Bakshi , G., Cao, C., Chen, Z., Empirical performance of alternative option pricing models,The Journal of
Finance; Cambridge; Dec 1997, 52( 5), pages 2003-2049.

149 Bakshi , G., Cao, C., Chen, Z., Empirical performance of alternative option pricing models,The Journal of
Finance; Cambridge; Dec 1997, 52( 5), pages 2003-2049. 150 Angelis, D., I., Capturing the option value of R&D, Research Technology Management; Washington;
Jul/Aug 2000, 43(4), pages 31-34. 151 Echtering, J., Mueller, C., Rippetoe, T., Widestrand, J., Real options as an approach for company
valuation, Seminar paper, Valuation of start-ups, WHU Otto-Beishem-Hoschule, Vallendar, 20-22 December,
2000. 152 Gustafsson, J., Risk management in Finnish biopharmaceutical companies, Master’s thesis, Helsinki
University of Technology, 2000, 132 pages. 153 Hever, Kathleen, T., Real option valuation: The challenge and promise, pages 29- 33. 154 Rendleman, Richard J., Jr Option investing from a risk-return perspective, Journal of Portfolio Management, New York May 1999, Suppl. Derivatives & Risk Management, pages 109-121. 155 Davis, G., A., Estimating volatility and dividend yield when valuing real options to invest or abandon, The
quaterly review of economics and finance, 1998 38, special issue on real options, page 727. 156 www. damoradan online, 27th June 2001. 157 Black, F., Scholes, M., The pricing of option and corporate liabilities, The Journal of Political Economy; Chicago May/June 1973, 81(3), pages 637- 158 Echtering, J., Mueller, C., Rippetoe, T., Widestrand, J., Real options as an approach for company
valuation, Seminar paper, Valuation of start-ups, WHU Otto-Beishem-Hoschule, Vallendar, 20-22 December, 2000. 159 De Neuville, R., Clark, J., Field, F., R., Evaluation of real options, Massachusets Institute of Technology, department of strategic planning, 40 pages. 160 Amram, M., Kulatilinka, N., Strategy and shareholder value: the real option frontier, Journal of corporate finance, 13(2), 2000, pages 8-21. 161 A new algorithm to evaluate projects with multiple real options 162 Perlitz, M., Peske, T., Schrank, R., Real options valuation: The new frontier in R&D project evaluation? R & D Management; Oxford; Jul 1999, 29(3), pages 255-269. 163 Copeland, T., E., Keenan, P., T., How much is flexibility worth?, The McKinsey quaterly, 2, 1998, pages 38-49. 164 Sheasley, D., W., Taking an options approach to new technology development, Research Technology
Management; Washington; Nov/Dec 2000, 43 (6), pages 37-43. 165 Calistre, D., Paulhus, M., Sick, G., Real options for managing risk: Using simulation to characterize gain in
value, April 17, 1998. 166 Amram, M., Kulatilinka, N., Strategy and shareholder value: the real option frontier, Journal of corporate
finance, 13(2), 2000, pages 8-21. 167 Amram, M., Kulatilinka, N., Strategy and shareholder value: the real option frontier, Journal of corporate finance, 13(2), 2000, pages 8-21. 168 Black, N., H., Shi, L., Park, C. S., Real option models for managing manufacturing system changes in the new economy, The Engineering Economist; Norcross 2000, 45(3), pages 232-258. 169 Birge, J.r., "Quasi-Monte Carlo Approaches to Option Pricing," Technical Report 94-10, Department of Industrial and Operations Engineering, University of Michigan, 1994. 170 Black N., H., Shi, L., Park, C. S., Real option models for managing manufacturing system changes in the
new economy , The Engineering Economist; Norcross 2000, 45(3), pages 232-258. 171 Kamrad, B., Lele, S., Production, operating risk and market uncertainty: A valuation perspective on
controlled policies, IIE Transactions; Norcross May 1998, 30(5), pages 455-468. 172 Bernhut, S., Measuring the value of intellectual capital, Ivey Business Journal, London Mar/Apr 2001,
65(4), pages 16-20. 173 Bernhut, S., Measuring the value of intellectual capital, Ivey Business Journal, London Mar/Apr 2001, 65(4), pages 16-20. 174 Zimmerman, E., What are employees worth? Workforce, Costa Mesa Feb 2001, 80(2), pages 32-36 175 Zimmerman, E., What are employees worth? Workforce, Costa Mesa Feb 2001, 80(2), pages 32-36

176 Anonymous, The top 10 measures of Human Capital Management, HR Focus, New York May 2001, 78(5),
pages 8-10. 177 Echtering, J., Mueller, C., Rippetoe, T., Widestrand, J., Real options as an approach for company
valuation, Seminar paper, Valuation of start-ups, WHU Otto-Beishem-Hoschule, Vallendar, 20-22 December, 2000. 178 Black N., H., Shi, L., Park, C. S., Real option models for managing manufacturing system changes in the
new economy ,The Engineering Economist; Norcross 2000, 45(3), pages 232-258. 179 Jackwerth, J., C., Generalized binomial trees, Journal of Derivatives; New York; Winter 1997, 5(2), pages
7-17. 180 Disciplined Decisions: Aligning Strategy with the financial market, HBR Press, January-February 1999. 181 De Neuville, R., Clark, J., Field, F., R., Evaluation of real options, Massachusets Institute of Technology, department of strategic planning, 40 pages. 182 Echtering, J., Mueller, C., Rippetoe, T., Widestrand, J., Real options as an approach for company
valuation, Seminar paper, Valuation of start-ups, WHU Otto-Beishem-Hoschule, Vallendar, 20-22 December, 2000. 183 McGarry, S., Tracey, M., Murphy, J., A., Sahu, V., Healthcare; The European Biotech Sector, Goldman Sachs Investment research, 22 October 1999, 59 pages. 184 McGarry, S., Tracey, M., Murphy, J., A., Sahu, V., Healthcare; The European Biotech Sector, Goldman
Sachs Investment research, 22 October 1999, 59 pages. 185 Biotechnology review, WestLB Panmure, 10 May 2000, 76 pages. 186 Ernst &Young 's Seventh Annual European Life Sciences Report 2001, 70 pages 187 Gustafsson, J., Risk management in Finnish biopharmaceutical companies, Master’s thesis, Helsinki
University of Technology, 2000, 132 pages. 188 Lavoie, B. and Sheldon, I. M. (2000). The comparative advantage of real options: An Explanation for the
US specialization in biotechnology. AgBioForum, 3(1), 47-52. 189 Biotech 99: Bridging the Gap, Ernst & Young’s 13th Biotechnology Industry annual Report, 1998 190 Lavoie, B. and Sheldon, I. M. (2000). The comparative advantage of real options: An Explanation for the
US specialization in biotechnology. AgBioForum, 3(1), 47-52. 191 Lavoie, B.F. & Sheldon, I.M. (2000). The source of comparative advantage in the biotechnology industry:
A Real options approach. Agribusiness - An International Journal, 16(1), 56-67. 192 Bratic, W., V., Tilton, Patricia, Balakrishnan, Mira, Navigating through biotech valuation, pages 1-7. 193 Dixit, A.K. & Pindyck, R. (1994). Investment under uncertainty. Princeton, NJ: Princeton University Press 194 Vihervaara, J., Uuden talouden kasvuyritykst ja arvon määritys: Case Inion Oy, Pro-gradu study, Tampere University, 2001, 99 pages. 195 Kellogg, D., Charnes, J., M., Demier, R., Valuation of a biotechnology firm: An application of real options
methodologies, Financial Analysts Journal, 56(3), May-June 2000, pages 76-84. 196 Datamonitor, Lehman Brothers `New drug discovery Technologies´ 3/97. 197 Myers, Stewart, Hoewe, A life-cycle financial model of pharmaceutical R&D, Program in the pharmaceutical industry, MIT 1997. 198 Office of Technology Assessment 1993 199 DiMasi, J., A., R., W., Hansen, H., G., Grabowski, H., G., Lasagna, L., Cost of innovation in the
Pharmaceutical industry, Journal of Health Economics 10, 1991, pages 107-142 200 Kellogg, D., Charnes, J., M., Demier, R., Valuation of a biotechnology firm: An application of real options methodologies, Financial Analysts Journal, 56(3), May-June 2000, pages 76-84. 201 Harward Business School, Genset 1989, Teachning note 5299063, May 13, 1999, 15 pages. 202 Lander, Diane M., Pinches, George E., Challenges to the practical implementation of modeling and
valuing real options, Quarterly Review of Economics and Finance; Greenwich 1998, 38, Supplement: Real
Options: Developments and Application, pages 537-567. 203 Black N., H., Shi, L., Park, C., S., Real option models for managing manufacturing system changes in the
new economy ,The Engineering Economist; Norcross 2000, 45(3), pages 232-258. 204 Valuation of Multiple Real Options Using the Binomial Model

205 Echtering, J., Mueller, C., Rippetoe, T., Widestrand, J., Real options as an approach for company
valuation, Seminar paper, Valuation of start-ups, WHU Otto-Beishem-Hoschule, Vallendar, 20-22 December, 2000. 206 De Neuville, R., Clark, J., Field, F., R., Evaluation of real options, Massachusets Institute of Technology, department of strategic planning, 40 pages. 207 Kellogg, D., Charnes, J., M., Demier, R., Valuation of a biotechnology firm: An application of real options
methodologies, Financial Analysts Journal, 56(3), May-June 2000, pages 76-84. 208 Echtering, Jens, Mueller, Christiana, Rippetoe, Tanja, Widestrand, Johan, Real options as an approach for
company valuation, Seminar paper, Valuation of start-ups, WHU Otto-Beishem-Hoschule, Vallendar, 20-22 December, 2000. 209 BioTie (BTT I V.HE), Company update, Carnegie research, 21st September 2000. 210 Kulatinka, Nalin, Introduction to real options, March 1999. 211 Myers, S., C. and Howe, C., D., A financial lifecycle model for pharmaceutical R&D, Program on the
pharmaceutical industry, MIT. 212 Myers, S., C. and Howe, C., D., A financial lifecycle model for pharmaceutical R&D, Program on the
pharmaceutical industry, MIT. 213 Myers, S., C. and Howe, C., D., A financial lifecycle model for pharmaceutical R&D, Program on the
pharmaceutical industry, MIT. 214 Myers, S., C. and Howe, C., D., A financial lifecycle model for pharmaceutical R&D, Program on the pharmaceutical industry, MIT.