hecla tumazos presentation final...this presentation contains “forward-looking statements”...
TRANSCRIPT

NYSE: HL
RESPONSIBLE. SAFE. INNOVATIVE.
COMPANY OVERVIEW
United States’ Leading Silver Producer
June 2021

NYSE: HL
CAUTIONARY STATEMENTS
RESPONSIBLE. SAFE. INNOVATIVE. l 2
Cautionary Statement Regarding Forward Looking Statements
This presentation contains “forward-looking statements” within the meaning of Section 27A of the Securities Act of 1933, as amended, and Section 21E of the Securities Exchange Act of1934, as amended, which are intended to be covered by the safe harbor created by such sections and other applicable laws, including Canadian securities laws. When a forward-lookingstatement expresses or implies an expectation or belief as to future events or results, such expectation or belief is expressed in good faith and believed to have a reasonable basis.However, such statements are subject to risks, uncertainties and other factors, which could cause actual results to differ materially from future results expressed, projected or implied bythe forward-looking statements. Forward-looking statements often address our expected future business and financial performance and financial condition and often contain words such as“anticipate,” “intend,” “plan,” “will,” “could,” “would,” “estimate,” “should,” “expect,” “believe,” “project,” “target,” “indicative,” “preliminary,” “potential” and similar expressions. Forward-lookingstatements in this presentation may include, without limitation: (i) the Company will increase cash flow generation over the rest of the year; (ii) expected increase of the Company’s silverproduction to 15 million ounces by 2023; (iii) expected increase in Lucky Friday’s silver production to 5 million ounces by 2023; (iv) the new mining method being tested at Lucky Fridaycould improve safety and productivity at the mine beyond the 5 million ounces expected by 2023 due to grade; (v) Greens Creek estimates of full-year 2021 silver and gold productionreaffirmed at 9.5 -10.2 million and 40-43 thousand, respectively, estimated 2021 cost of sales updated to $213 million, estimated cash costs, after by-product credits, and AISC, after by-product credits, each per silver ounce updated to $1.50 - $2.25 and $6.50 - $7.25, respectively; (vi) ability of business improvement activities at Casa Berardi to reduce costs and increasecash flow over the next two years; (vii) expectation of the Company to process 22,000 ore tons through the Midas mill and roughly 12,000 tons through a third-party roasting facility, and anadditional 10,000 tons for processing at a third-party autoclave facility in the second half of the year with production in the range of 17,000 to 19,000 ounces of gold at the Nevadaoperations; and (viii) Company-wide estimates of future production, sales, costs of sales, cash costs, after by-product credits, AISC, after by-product credits, as well as estimated spendingon capital, exploration and pre-development for 2021. The material factors or assumptions used to develop such forward-looking statements or forward-looking information include that theCompany’s plans for development and production will proceed as expected and will not require revision as a result of risks or uncertainties, whether known, unknown or unanticipated, towhich the Company’s operations are subject..Estimates or expectations of future events or results are based upon certain assumptions, which may prove to be incorrect, which could cause actual results to differ from forward-lookingstatements. Such assumptions, include, but are not limited to: (i) there being no significant change to current geotechnical, metallurgical, hydrological and other physical conditions; (ii)permitting, development, operations and expansion of the Company’s projects being consistent with current expectations and mine plans; (iii) political/regulatory developments in anyjurisdiction in which the Company operates being consistent with its current expectations; (iv) the exchange rate for the USD/CAD and USD/MXN, being approximately consistent withcurrent levels; (v) certain price assumptions for gold, silver, lead and zinc; (vi) prices for key supplies being approximately consistent with current levels; (vii) the accuracy of our currentmineral reserve and mineral resource estimates; (viii) the Company’s plans for development and production will proceed as expected and will not require revision as a result of risks oruncertainties, whether known, unknown or unanticipated; (ix) counterparties performing their obligations under hedging instruments and put option contracts; (x) sufficient workforce isavailable and trained to perform assigned tasks; (xi) weather patterns and rain/snowfall within normal seasonal ranges so as not to impact operations; (xii) relations with interested parties,including Native Americans, remain productive; (xiii) economic terms can be reached with third-party mill operators who have capacity to process our ore; (xiv) maintaining availability ofwater rights; (xv) factors do not arise that reduce available cash balances; and (xvi) there being no material increases in our current requirements to post or maintain reclamation andperformance bonds or collateral related thereto.
NYSE: HL
CAUTIONARY STATEMENTS (cont’d)
RESPONSIBLE. SAFE. INNOVATIVE. l 3
Cautionary Statement Regarding Forward Looking Statements (Cont’d)In addition, material risks that could cause actual results to differ from forward-looking statements include, but are not limited to: (i) gold, silver and other metals price volatility; (ii) operatingrisks; (iii) currency fluctuations; (iv) increased production costs and variances in ore grade or recovery rates from those assumed in mining plans; (v) community relations; (vi) conflictresolution and outcome of projects or oppositions; (vii) litigation, political, regulatory, labor and environmental risks; (viii) exploration risks and results, including that mineral resources are notmineral reserves, they do not have demonstrated economic viability and there is no certainty that they can be upgraded to mineral reserves through continued exploration; (ix) the failure ofcounterparties to perform their obligations under hedging instruments; (x) we take a material impairment charge on our Nevada operations; (xi) we are unable to remain in compliance withall terms of the credit agreement in order to maintain continued access to the revolver, and (xii) we are unable to refinance the maturing senior notes. For a more detailed discussion of suchrisks and other factors, see the Company’s 2020 Form 10-K, filed on February 18, 2021, with the Securities and Exchange Commission (SEC), as well as the Company’s other SEC filings.The Company does not undertake any obligation to release publicly revisions to any “forward-looking statement,” including, without limitation, outlook, to reflect events or circumstances afterthe date of this news release or to reflect the occurrence of unanticipated events, except as may be required under applicable securities laws. Investors should not assume that any lack ofupdate to a previously issued “forward-looking statement” constitutes a reaffirmation of that statement. Continued reliance on “forward-looking statements” is at investors’ own risk.
Cautionary Note Regarding Estimates of Measured, Indicated and Inferred ResourcesThe disclosures herein regarding mineral reserves and resources are as of December 31, 2020. For disclosures prior to January 1, 2021, the SEC permits mining companies, in their filings with the SEC, to disclose only those mineral deposits that a company can economically and legally extract or produce. We use certain terms in this presentation, such as “resource,” “measured resources,” “indicated resources,” and “inferred resources” that are recognized by Canadian regulations, but that prior to January 1, 2021, SEC guidelines generally prohibited U.S. registered companies from including in their filings with the SEC. U.S. investors are urged to consider closely the disclosure in our most recent Form 10-K and Form 10-Q. You can review and obtain copies of these filings from the SEC’s website at www.sec.gov.
Qualified Person (QP) Pursuant to Canadian National Instrument 43-101Kurt D. Allen, MSc., CPG, Director - Exploration of Hecla Limited and Keith Blair, MSc., CPG, Chief Geologist of Hecla Limited, who serve as a Qualified Person under National Instrument 43-101("NI43-101"), supervised the preparation of the scientific and technical information concerning Hecla’s mineral projects. Information regarding data verification, surveys and investigations, qualityassurance program and quality control measures and a summary of analytical or testing procedures for the Greens Creek Mine are contained in a technical report titled “Technical Report for theGreens Creek Mine” effective date December 31, 2018, and for the Lucky Friday Mine are contained in a technical report titled “Technical Report for the Lucky Friday Mine Shoshone County, Idaho,USA” effective date April 2, 2014, for Casa Berardi are contained in a technical report titled "Technical Report on the mineral resource and mineral reserve estimate for Casa Berardi Mine,Northwestern Quebec, Canada" effective date December 31, 2018 (the "Casa Berardi Technical Report"), and for the San Sebastian Mine, Mexico, are contained in a technical report prepared forHecla titled “Technical Report for the San Sebastian Ag-Au Property, Durango, Mexico” effective date September 8, 2015 . Also included in these four technical reports is a description of the keyassumptions, parameters and methods used to estimate mineral reserves and resources and a general discussion of the extent to which the estimates may be affected by any known environmental,permitting, legal, title, taxation, socio-political, marketing, or other relevant factors. Information regarding data verification, surveys and investigations, quality assurance program and quality controlmeasures and a summary of sample, analytical or testing procedures for the Fire Creek Mine are contained in a technical report prepared for Klondex Mines, dated March 31, 2018; the Hollister Minedated May 31, 2017, amended August 9, 2017; and the Midas Mine dated August 31, 2014, amended April 2, 2015. Copies of these technical reports are available under Hecla's and Klondex'sprofiles on SEDAR at www.sedar.com. Mr. Allen and Mr. Blair reviewed and verified information regarding drill sampling, data verification of all digitally collected data, drill surveys and specific gravitydeterminations relating to all the mines. The review encompassed quality assurance programs and quality control measures including analytical or testing practice, chain-of-custody procedures,sample storage procedures and included independent sample collection and analysis. This review found the information and procedures meet industry standards and are adequate for MineralResource and Mineral Reserve estimation and mine planning purposes.
Mr. Allen and Mr. Blair reviewed and verified information regarding drill sampling, data verification of all digitally-collected data, drill surveys and specific gravity determinations relating to the Casa Berardi Mine. The review encompassed quality assurance programs and quality control measures including analytical or testing practice, chain-of-custody procedures, sample storage procedures and included independent sample collection and analysis. This review found the information and procedures meet industry standards and are adequate for Mineral Resource and Mineral Reserve estimation and mine planning purposes.
Cautionary Note Regarding Non-GAAP measuresCash cost per ounce of silver and gold, net of by-product credits, EBITDA, adjusted EBITDA, AISC, after by-product credits, and free cash flow represent non-U.S. Generally Accepted Accounting Principles (GAAP) measurements. A reconciliation of these non-GAAP measures to the most comparable GAAP measurements can be found in the Appendix.

NYSE: HL
Hecla: Unique Precious Metals Miner
RESPONSIBLE. SAFE. INNOVATIVE. l 4

NYSE: HL
WHY INVEST IN HECLA?
RESPONSIBLE. SAFE. INNOVATIVE. l 5
Hecla is unique to other silver miners, ETFs and physical silver
Primarily U.S based operations – the right jurisdiction for risk and ESG
Two of the largest and highest-grade silver mines in the world Silver dominates reserves and cash flow Long-lived mines with decades ahead of us
Silver production is growing
Consistent dividend payments and only dividend linked to silver price
Brand value – 130 years and over 50 years on NYSE

NYSE: HL
AMERICA NEEDS TO PRODUCE THE METALS AT HOME
• Biden Administration’s Build Back Better counts on shorter supply chain
• Hecla metals are the foundation of a low carbon future
• Silver, copper, and other metals are essential for wind, solar, batteries, and electric vehicles
• Hecla largest U.S. silver producer, third largest undeveloped copper deposit
If copper is the “new oil” - silver is like the spark
RESPONSIBLE. SAFE. INNOVATIVE. l 6

NYSE: HL
HECLA HAS A SMALL FOOTPRINT
Less than 3,900 acres = less than one large open pit mine in Nevada
• Very low energy use and greenhouse gas emissions• Total energy use = 1800 bitcoins (18.7 M in circulation)• GHG emissions = 9,500 cars (280M cars in the U.S)• We produce nearly 3X more silver equivalent ounces
per ton of GHG emissions as our peers• Low water use
• Use less water per ounce produced (63 gallons) than a typical person does per day (100 gallons)
• Safe industry, safer company
Small geographic, environmental & safety risk footprint
RESPONSIBLE. SAFE. INNOVATIVE. l 7

NYSE: HL
HECLA CHANGES LIVES
• Direct economic impact of $550+ million annually in 3 small communities
• More than a living wage – longevity, benefits • Each Hecla job creates more jobs - 3,000+ • Support for communities during COVID-19:
• $150,000 of food, personal protective equipment, supplies, and financial assistance
• $150,000 worth of “Hecla Bucks” for Hecla employees use at local businesses
• Hecla Charitable Foundation has provided $3+ million• First Nation/Native Americans are key beneficiaries
Largest employer with jobs and benefits that last a lifetime and charity too
RESPONSIBLE. SAFE. INNOVATIVE. l 8

NYSE: HL
HECLA IS THE LEADER IN METAL PRODUCED PER TON OF GHG
0
1
2
3
4
5
6
0
0.2
0.4
0.6
0.8
1
1.2
Hecla Coeur Pan American First Majestic Newmont
Gold-equivalent ounces/Ton GHG
0
50
100
150
200
250
300
350
400
450
500
0
0.2
0.4
0.6
0.8
1
1.2
Hecla Coeur Pan American First Majestic Newmont
Silver-equivalent ounces /Ton GHG
Highest grade silver mines generate more benefit with smaller footprint
RESPONSIBLE. SAFE. INNOVATIVE. l 9

NYSE: HL
0
5
10
15
20
25
30
35
40
0
50
100
150
200
250
300
350
400
Cannington Greens Creek Fresnillo Saucito Rochester Ying Lucky Friday La Colorada San Julian Uchucchacua
AgEq Grade(opt)
AgEq* (Moz)
Fresnillo Hecla South32 Coeur Pan American Compañía de Minas Buenaventura Silvercorp Metals Ag (opt)
HIGH-GRADE SILVER MINES OF SIZE ARE SCARCE
RESPONSIBLE. SAFE. INNOVATIVE. l 10
Hecla’s world’s second and seventh largest silver mines have the highest silver equivalent grade
*AgEq based on equivalency factors of 82 Au, 6 Cu, 20 Pb, 17 ZnSource: S&P Global Market Intelligence

NYSE: HL
HECLA MINES A THIRD OF ALL SILVER PRODUCED IN THE USA
RESPONSIBLE. SAFE. INNOVATIVE. l 11
Half of the world’s production is from Mexico, Peru and China; U.S. production is scarce
Source: Silver Institute; Company Reports
34.0%
66.0%
Hecla’s Share of U.S. Production
Hecla Other
.
23%
16%
13%
4%
45%
3 Countries Produce 50% of World Production U.S. Produces 4%
Mexico Peru China USA ROW
13.5
6.5
3.22.2
0.9
Hecla Teck* Coeur Rio Tinto Americas Gold &Silver
2020 U.S. Silver Production)(Moz)

NYSE: HL
HECLA IS INCREASING SILVER PRODUCTION
RESPONSIBLE. SAFE. INNOVATIVE. l 12
Lucky Friday production tripled over last year, expected to be 75% more in 2021 and 5 million ounces by 2023, 2.5 times 2020 production
< 1010 - 2020 - 3030 - 35> 35
30 Vein - *AgEq Grade (opt)
Oct. 12, 2020
*Ag Equivalent Values Based on metal prices of $16.50/oz Ag, $0.85/lb Pb, and $1.00/lb Zn** Cutoff grade 11 AgEq*** 2020 average grade 25 AgEq
1000 FeetLooking North
20 Years Past Mining
6500 Level
7500 Level
#4 Shaft
Almost 1000 feet @ +35 AgEq

NYSE: HL
LEADING DIVIDEND POLICY IS IMPROVED FURTHER
RESPONSIBLE. SAFE. INNOVATIVE. l 13
More cash returned to shareholders as dividend yield increases synchronously with silver prices
<$25/oz $25 - $30/oz $30 - $35/oz $35 - $40/oz $40 - $45/oz $45 - $50/oz
$-- $0.03/share $0.05/share $0.09/share $0.13/share $0.17/share
* Assumes 12 million ounces of silver production** Dividend yield as a basis of silver price calculated as: Dividend Paid per ounce of silver/Silver Price (Average of the range, for example: $27.50/oz used for $25-$30/oz range)
Silver Linked Dividends.
At $25/oz realized price, an implied dividend yield of 7.4% of silver price
$0.7 $2.0 $2.9 $4.7 $6.5 $8.3
7.4%9.0%
12.6%
15.4%17.5%
0.00%2.00%4.00%6.00%8.00%10.00%12.00%14.00%16.00%18.00%20.00%
$0.0$1.0$2.0$3.0$4.0$5.0$6.0$7.0$8.0$9.0
<$25/oz $25/oz to $30/oz $30/oz to $35/oz $35/oz to $40/oz $40/oz to $45/oz $45/oz to $50/oz
Dividends Paid per Silver Ounce Produced - $/oz* Dividend Yield as a % of Silver Price**
Annual Base dividend of $0.015 per share

NYSE: HL
REDDIT SILVER SQUEEZE DEMONSTRATED BRAND VALUE
RESPONSIBLE. SAFE. INNOVATIVE. l 14
Highest performer with a small short position and continued outperformance
Share Price Performance on February 1st & Shares Short as a % of Total Float*
28%
26%
23%
12%
2.8%
21.8%
2.1% 2.0%
0.0%
5.0%
10.0%
15.0%
20.0%
25.0%
0%
5%
10%
15%
20%
25%
30%
Hecla FirstMajestic
Coeur PanAmerican
Silver
*Source: Bloomberg, Share price performance shown as February 1st close over January 29th close
Coeur: +19%
Hecla: +59%
First MajesticSilver: -6%
Pan AmericanSilver: -3%
Share Price Performance on January 29th – June 11th
-30%
-20%
-10%
0%
10%
20%
30%
40%
50%
60%
70%
1/29/2021 2/28/2021 3/31/2021 4/30/2021 5/31/2021
Hecla First Majestic Pan American Silver Coeur

NYSE: HL
A VERY SHORT HISTORY OF SILVER DEMAND
Five distinct periods of silver demand, three that are strengthening • Monetary by governments (2000 BC to 1800 AD)• Photographic (1900 to 1999)• Industrial (1940 - )• Investment (2000 - )• Energy (2010 - )
RESPONSIBLE. SAFE. INNOVATIVE. l 15
Despite declining photography demand, silver industrial and investment demand has been in a secular bull market since 2000 and is stronger in 2021 and the future
Source – World Silver Survey 2020
20 YEAR CHANGE IN DEMANDMillion Ounces
1999 2019 % IncreaseIndustrial 343 511 49%Photography 246 34 -86%Jewelery/Silverware 260 260 0%Investment 26 268 931%Total 875 1073 23%
If the decrease in photographic demand is removed, silver demand
increases 441 million ounces or 61%

NYSE: HL
RENEWABLE ENERGY GAINS MOMENTUM – SOLAR PROJECTED FOR THE LARGEST GROWTH
• In the U.S., renewable energy accounts for 21% of total electricity generation and is projected to increase to 42% of total domestic electricity generation by 2050.
• Solar energy is projected to be largest component of U.S renewable electricity generation, increasing from 16% in 2020 to 47% by 2050.
RESPONSIBLE. SAFE. INNOVATIVE. l 16
Global policies are favoring renewable energy
* Source – U.S. Energy Information Administration (EIA), Annual Energy Outlook 2021 narrative, February 2021.
U.S. Electricity Generation* Annual Economic Outlook 2021, Reference Case
U.S. Renewable Electricity Generation* Annual Economic Outlook 2021, Reference Case

NYSE: HL
SILVER USE IN SOLAR PANELS
• Silver is key in solar panels because of its incredibly low electrical resistance and other closely related metals cannot sufficiently match silver’s conductivity for solar panels.
• Photovoltaic cells (PVs) are the building blocks of solar panels. A solar power panel is made up of photovoltaic cells (PVs) arranged in a configuration that can contain 32 to 96 PV cells. Currently, a PV cell uses ~111 mg (0.004 ounces) of silver.
• Thrifting is a threat to silver’s use in solar panels, but it has its limits as rate of silver reduction has decelerated since 2016. Silver content is expected to level out at around 80 mg (0.003 ounces) of silver per PV from the current use of ~111 mg (0.004 ounces)
RESPONSIBLE. SAFE. INNOVATIVE. l 17
Thrifting is a threat but has its limits, silver use in photovoltaics to be stabilized
* Source – The Silver Institute - CRU: Silver’s important role in solar power, June 2020
Silver usage per PV cell, 2009 – 2024*
Actual Forecast
CAGR of -12.9%
Decline slowed at CAGR of -5.1%
Expected to stabilize

NYSE: HL
SOLAR ENERGY & PHOTOVOLTAICS
• Photovoltaics (PVs) have significant support in renewable energy due to cost reductions and supportive policy measures. PVs have seen a CAGR of 15% over the past 5 years
• As PV applications grow and solar energy captures a larger portion of electricity generation, silver will be the beneficiary.
RESPONSIBLE. SAFE. INNOVATIVE. l 18
Infrastructure stimulus globally is tilting towards solar – silver is the beneficiary
* Source – CRU: Role of Silver in Green Revolution, July 2018** Source – Goldman Sachs Research – Quantifying silver upside from solar, October 8, 2020
Solar Capacity by Region* Silver - Solar Demand Projections**GS research expects 2% (base case) to 9% (bull case)
increase in silver demand in PVs

NYSE: HL
• 2019 saw a total supply of 1,023 Moz and total demand of 1,074 Moz• Silver’s total demand in 2030 is expected to reach ~1,147 Moz if demand stays on the last
decade trend and no increase in silver’s investment demand• Supply needs to grow by ~70 Moz per year to meet the on trend additional demand
expected in 2030
1,023
1,074
1,147
Total Supply2019
Total Demand2019
Demand Expected, Based on 10 Year GrowthRate
2030F*
SILVER – WIDENING GAP BETWEEN SUPPLY & DEMAND Gap expected to increase with continued trend of industrial demand growth of 2.0%
Million Ounces
Supply shortfall of 50 Moz in 2019 was filled by above
ground stocks
Silver Supply & Demand: 2019 and 2030E
* Demand assumptions: CAGR for industrial demand over the past 10 years has been 2.0%. Assume no increase or decrease in investment, jewelry or silverware demand.
RESPONSIBLE. SAFE. INNOVATIVE. l 19

NYSE: HL
Financial
RESPONSIBLE. SAFE. INNOVATIVE. l 20

NYSE: HL
SOLID FIRST QUARTER 2021: HIGHLIGHTS
RESPONSIBLE. SAFE. INNOVATIVE. l 21
Strong operational performance from steady production, low costs and high margins
• Record Adjusted EBITDA(1) of $86.1 million, Cash Gross Margin(2) of $114.1 million, second highest Sales of $210.9 millionRecord QuarterRecord Quarter
• Solid production, Lowering silver cash costs and all-in sustaining cash costs guidance for Greens Creek
Strong Operating Performance
Strong Operating Performance
• Strong balance sheet, $140 million in cash, $390 million in liquidity; $16.5 million of quarterly free cash flowFinancial StrengthFinancial Strength
• 50% increase in silver linked dividend at $25/oz to $0.03/year • 28% of Q1 2021 free cash flow returned to shareholders as dividends.
Leading & Enhanced Dividend Policy
Leading & Enhanced Dividend Policy
• Moody’s upgrade with Corporate Family Rating (CFR) to B2 from B3Ratings UpgradeRatings Upgrade
• Low AIFR of 1.71 in Q1; Small footprint, LARGE BENEFIT sustainability report; Efficient and safe COVID-19 managementESG FocusESG Focus

NYSE: HL
HECLA’S TAX CHARACTERIESTICS ARE UNIQUETax expense and paid taxes among the lowest and a tax asset that is not on the balance sheet
(121)(98)
(45)(7)
(23) (10)(39)
(149)
(92)
(25)(8)
(25) (16)(33)
(168)
(54)(33)
(5) (8) (2)(31)
(146)
(81)
(34)(7) (18) (10)
(34)
Fresnillo Pan American
Silver Coeur Hecla SSR Mining First Majestic Silver Fortuna Silver
Current Tax Expense: Hecla & Peers2018-2020($ millions)
2020 Current (Provision) Benefit 2019 Current (Provision) Benefit 2018 Current (Provision) Benefit 3 Year Average Current (Provision) Benefit
• Hecla has a $780m tax loss carryforward to reduce future US taxable income• $53 million in Canada
• US tax incentives for U.S. mines• Depletion deductions• Research and development credits• Mine safety training credits• Accelerated depreciation
RESPONSIBLE. SAFE. INNOVATIVE. l 22

NYSE: HL
Operations
RESPONSIBLE. SAFE. INNOVATIVE. l 23

NYSE: HL
OPERATIONAL REVIEW
RESPONSIBLE. SAFE. INNOVATIVE. l 24
Continued performance despite COVID-19 challenges

NYSE: HL
HECLA IS AMONG THE SAFEST OF MINING COMPANIES
• Reduced AIFR by 24%, the lowest in company history
• Reduced AIFR by 80% since 2012• Hecla 1.22 rate in 2020 nearly 50% better
than national average of 2.40• Aggressive health and safety protocols
even before COVID-19 was deemed a pandemic
• Week long quarantine before employees could work at Greens Creek now 80+% vaccination rate
Hecla’s commitment and NMA CORESafety started in 2012, moved from underperformance to industry leader
RESPONSIBLE. SAFE. INNOVATIVE. l 25

NYSE: HL
SILVER RESERVES (contained ounces of silver)
RESPONSIBLE. SAFE. INNOVATIVE. l 26
$0.00
$5.00
$10.00
$15.00
$20.00
$25.00
$30.00
$35.00
$40.00
-
0.50
1.00
1.50
2.00
2.50
3.00
3.50
4.00
2004 2005 2006 2007 2008 2009 2010 2011 2012 2013 2014 2015 2016 2017 2018 2019
Silver PricePer Ounce
World in BillionsHecla in 100Ms
World Reserves Hecla Reserves Silver Price
World 439 Million
Hecla 45 Million
World 1.9 Billion
Hecla 212 Million World 3.3 Billion
Hecla 150 Million
Hecla’s silver reserves continue to increase while world reserves react to current metal prices
*Data from Bloomberg

NYSE: HL RESPONSIBLE. SAFE. INNOVATIVE. l 27
SILVER RESERVE GRADE COMPARISON
0
2
4
6
8
10
12
14
16
2002 2004 2006 2008 2010 2012 2014 2016 2018 2020
Silver ReserveGrade (opt)
Fresnillo PLC
Hecla Mining Co
First Majestic Silver Corp
Fortuna Silver Mines Inc
Pan American Silver Corp
Coeur Mining Inc
Source: Bloomberg
Hecla’s reserves are stable and high grade

NYSE: HL
$7.11 $7.70$12.05
$1.59
$11.33$17.62
$13.11
$24.07
2Q 2020 3Q 2020 4Q 2020 1Q 2021
AISC* Realized Price Margin(7)
GREENS CREEK: CONTINUES STRONG
RESPONSIBLE. SAFE. INNOVATIVE. l 28
Consistent performance, low costs cement solid free cash flow generation
• 2021 estimated silver production of 9.5-10.2 million • Lowering guidance for Cash Costs and All-in
Sustaining Costs due to higher by-product credits, lower treatment charges, and the reclassification of mine license tax
• Cash Costs* at $1.50 - $2.25• All-in Sustaining Costs* at $6.50 - $7.25
Greens Creek - Silver All-in Sustaining Cost per ounce and Margins per ounce
($ millions)
109%223%159%
* Cash Costs and All-in sustaining cost is a non-GAAP measure, reconciliation to GAAP is shown in appendix.
Cost of Sales(4) $57.7 $51.1 $59.2 $53.2
(6)
1,514%

NYSE: HL
0
2
4
6
8
10
12
14
16
600
700
800
900
2005
2006
2007
2008
2009
2010
2011
2012
2013
2014
2015
2016
2017
2018
2019
2020
Ore R
eserves (Mt)O
re P
rodu
ctio
n (k
t)
Greens Creek Production and Reserves
Greens Creek Throughput has Grown 15% Since Purchase in 2008
Hecla becameoperator
(118) (11)
122 216 324 504 698 812 875 941 983 1,061 1,156 1,235 1,336 1,491 (10)
119
250
370 470
637
827
982 1,060
1,127 1,167 1,257
1,351 1,425
1,526
1,666
Cum
ulat
ive
Unt
il 20
05
2006
2007
2008
2009
2010
2011
2012
2013
2014
2015
2016
2017
2018
2019
2020
Cumulative Gross Profit and Net Cash Flow
Net Cash Flow* Gross Profit
HECLA’S STRONGEST MINE - GREENS CREEK IS GROWING
RESPONSIBLE. SAFE. INNOVATIVE. l 29
13.5 Moz silver production, $181.1 M in cash flow
• Automation drive beginning in 2017 leads to further efficiencies• Consistent exploration success enables reserves to be maintained*Net cash flow is a non-GAAP measure and reconciliation to Gross Profit (GAAP) is shown
in the Appendix.
Cumulative Gross Profit and Cumulative Net Cash Flow*
$ millions

NYSE: HL
GREENS CREEK: OVER 30 YEARS AND STILL EXPLORING AND ADDING RESERVES
RESPONSIBLE. SAFE. INNOVATIVE. l 30
Upgrading Resources (Upper Plate, 9A, and East Ore), Exploring (Gallagher and Lil’Sore)
From 1989 to 2020, Greens Creek has mined 20 million tons containing:
• 322m ounces of silver
• 2.7m ounces of gold
• 4b pounds of zinc
• 1.5b pounds of lead

NYSE: HL
96
470
636
830 864
1Q 2020 2Q 2020 3Q 2020 4Q 2020 1Q 2021
LUCKY FRIDAY: PERFORMING PER PLAN
RESPONSIBLE. SAFE. INNOVATIVE. l 31
On track to increase production to 5 million ounces by 2023
• Ramp-up to full production complete at year-end 2020
• 2021 production guidance exceeds 3.4 Moz• Grade increases at depth, pursuing initiatives
to increase productivity• Continue to test and optimize new mining
methods to improve safety and increase productivity
Lucky Friday Silver Production - Returned to historical production levels
(Koz)

NYSE: HL
HECLA IS INCREASING SILVER PRODUCTION
RESPONSIBLE. SAFE. INNOVATIVE. l 32
Lucky Friday production tripled over last year, expected to be 75% more in 2021 and 5 million ounces by 2023, 2.5 times 2020 production
< 1010 - 2020 - 3030 - 35> 35
30 Vein - *AgEq Grade (opt)
Oct. 12, 2020
*Ag Equivalent Values Based on metal prices of $16.50/oz Ag, $0.85/lb Pb, and $1.00/lb Zn** Cutoff grade 11 AgEq*** 2020 average grade 25 AgEq
1000 FeetLooking North
20 Years Past Mining
6500 Level
7500 Level
#4 Shaft
Almost 1000 feet @ +35 AgEq

NYSE: HL
30.826.4
37.6 36.2
280,420 288,682
382,981 368,403
-
50,000
100,000
150,000
200,000
250,000
300,000
350,000
400,000
450,000
0.05.0
10.015.020.025.030.035.040.0
Q2 2020 Q3 2020 Q4 2020 Q1 2021
Production Tons Ore Milled
CASA BERARDI: INVESTMENTS ARE DELIVERING RESULTS
RESPONSIBLE. SAFE. INNOVATIVE. l 33
Strong production coupled with cost improvements
• Business improvement activities continue in 2021; expected to reduce costs and increase cash flow over next two years
• Investments already yielding results as mill availability remains consistently >90%
• Cash Costs and All-in Sustaining Costs continue to improve, on track to meet guidance
$919$1,398 $1,019 $1,027
$1,077
$1,855
$1,330 $1,272
Q2 2020 Q3 2020 Q4 2020 Q1 2021
Cash Cost AISC(8) *(6)
Cost of Sales(4) $45.6 $45.9 $55.7 $62.5
($ millions)
* Cash Cost and AISC per gold ounce, after by-product credits. All-in sustaining cost is a non-GAAP measure, reconciliation to GAAP is shown in appendix.
Production and Throughput Gold Cash Cost and All-in Sustaining Cost per ounce(Production in Koz)

NYSE: HL
CASA BERARDI: FOCUSED ON LONG-TERM OPERATIONAL IMPROVEMENT
RESPONSIBLE. SAFE. INNOVATIVE. l 34
Investments in 2020 are yielding results
Broke monthly Mill throughput records for three consecutive months with >90% availability
~10% increase in UG active time, leading to improved productivity
Reduced UG maintenance backlog by 2.5 weeks, translates to higher equipment availability
Launched training for UG operators to improve pre/post-op (equipment reliability)
Increased operator accountability to decrease operator driven downtime
~10% Support Costs reduction ready to implement (in 2021)
Open Pits and Explosives RFP process well underway paves way to reduced external spend

NYSE: HL
CASA BERARDI ACQUIRED IN 2013 – EXPLORATION IS STILL NEW
RESPONSIBLE. SAFE. INNOVATIVE. l 35
Positive drilling results in the West, Principal, and East Mine areas
Positive Drilling Results
WMCP• Extending mineralization up dip
towards the Overburden-Bedrock surface.
123 Zone• Expanding mineralization up and
down dip148 Zone• Expanding mineralization down dip160 Zone• Increased confidence in resource
A’
A
C’
C

NYSE: HL
Exploration/Pre-development
RESPONSIBLE. SAFE. INNOVATIVE. l 36

NYSE: HL
HECLA’S EXPLORATION AND DEVELOPMENT ASSETS
RESPONSIBLE. SAFE. INNOVATIVE. l 37

NYSE: HL
GREEN RACER SINTER LONGITUDINAL SECTION
RESPONSIBLE. SAFE. INNOVATIVE. l 38
High-grade mineralization open for expansion along strike and at depth
4000 ft
5000 ft

NYSE: HL
MIDAS GREEN RACER SINTER – IDENTIFIED WITH FIELD WORKDetailed mapping and sampling led to the identification of the Spicular Geyserite Sinter Outcrop
Green Racer Sinter Discovery Outcrop
• Identified by detailed mapping and sampling
• Sinter forms at surface and indicates a fully preserved epithermal system below it
• Spicular Geyserite sinter is specific to hydrothermal vents on surface
• Sample - 0.56 ppm gold – Very anomalous for a sinter
• Generated by boiling fluids at depth; a mechanism for gold deposition
RESPONSIBLE. SAFE. INNOVATIVE. l 39

NYSE: HL
MIDAS: A 100-YEAR HISTORY OF DISCOVERY AND MINING
RESPONSIBLE. SAFE. INNOVATIVE. l 40
Green Racer Sinter is the newest discovery – first modern exploration on the East Graben Corridor

NYSE: HL
Target Areas
Green Racer Sinter Discovery Extensions• On strike extensions to the northwest and southeast
from currently known mineralization
CSAMT – Sinter Target• Intersection between CSAMT interpreted north-south
structural zone and Green Racer Sinter extensions to the northwest
• Similar relationship seen at Colorado Grande
South Green Racer Target• Mineralized north-northwest striking quartz breccia
structure
Little Opal Target• Range front fault in proximity to strong alteration and
opalite outcrop
MIDAS EXPLORATION IS JUST STARTING
RESPONSIBLE. SAFE. INNOVATIVE. l 41
Continue to advance Green Racer Sinter discovery and additional East Graben Corridor targets

NYSE: HL
SAN SEBASTIAN: 20 YEARS OF EXPLORATION, 10 YEARS OF MINING, DISCOVERING COMPLETELY NEW DEPOSITS
RESPONSIBLE. SAFE. INNOVATIVE. l 42
High-grade results at El Bronco, focusing in on favorable horizon at El Tigre

NYSE: HL
EL BRONCO VEIN – SILVER EQUIVALENT GRADE CONTOURSGrades and widths not previously seen
RESPONSIBLE. SAFE. INNOVATIVE. l 43

NYSE: HL
ROCK CREEK & MONTANORE
Overview
Permitting Overview
• Rock Creek ROD* for evaluation remanded by district court on ESA procedural issue
• Will step back at Rock Creek and focus on Montanore• Montanore final EIS and ROD for evaluation were expected mid-2021
• U.S. Fish and Wildlife Service will now revise Biological Opinion based on RC decision – early 2022 likely to be completed
• Montanore infrastructure in place for evaluation drilling so no significant environmental impacts
• Evaluation drilling at Montanore can also inform Rock Creek planning
Inferred Resources (at 12/31/20)
Metric Rock Creek MontanorePotential Mine Life 20 – 30 Years each
Hecla Stock Acquisition Cost $19 M $54 M
Advanced Permitting ROD* Final SEIS**
Well Located 50 miles from Lucky Friday
Land Position Great Exploration Potential
Final stages of permitting, expecting to advance subject to further litigation
Site Overview
*Record of Decision for underground resource evaluation and data collection.**Supplemental Environmental Impact Statement
RESPONSIBLE. SAFE. INNOVATIVE. l 44
Rock Creek Montanore
148.7 million oz. Silver 183 million oz. Silver
1.3 billion lbs. Copper 1.5 billion lbs. Copper
Combined, the projects are as large as Hecla’s current reserves

NYSE: HL
Guidance
RESPONSIBLE. SAFE. INNOVATIVE. l 45

NYSE: HL
Silver production to increase 2021 to 2023Production Outlook
Cost Outlook
(in millions) Original Current
2021E capital expenditures10 (excluding capitalized interest) $110 $110
2021E exploration expenditures10 (includes corporate development) $30 $30
2021E pre-development expenditures10 $4.5 $8.5
Silver Production (Moz) Gold Production (Koz) Silver Equivalent (Moz)9 Gold Equivalent (Koz)9
Greens Creek* 9.5 – 10.2 40 – 43 20.5 – 21.5 227 – 237
Lucky Friday* 3.4 – 3.8 n/a 6.2 – 6.4 67 – 70
Casa Berardi n/a 125 – 128 11.5 – 11.7 125 – 128
Nevada Operations n/a 20 – 22 1.8 – 2.0 20 – 22
2021 Total 12.9 – 14.0 185 - 193 40.0 – 41.6 439 – 457
2022 Total 13.7 – 14.5 173 - 181 40.1 – 42.5 430 – 450
2023 Total 14.2 – 15.0 177 - 186 42.5 – 44.5 467 – 485
*Equivalent ounces include lead and zinc production.
Costs of Sales and other direct production (“Cost of Sales”) (million)4
Cash cost, after by-product credits, per silver/gold ounce8
AISC, after by-product credits, per produced silver/gold ounce5
Original Current Original Current Original Current
Greens Creek $220 $213 $5.75 - $6.25 $1.50 - $2.25 $10.25 - $11.00 $6.50 - $7.25
Lucky Friday $91 $91 $775 - $9.75 $7.75 - $9.75 $13.75 - $16.50 $13.75 - $16.50
Total Silver $311 $304 $6.25 - $7.25 $3.25 - $4.25 $13.50 - $15.00 $10.75 - $12.50
Casa Berardi $176 $212 $900 - $975 $900 - $975 $1,185 - $1,275 $1,185 - $1,275
Nevada Operations $41 $41 $1,300 - $1,425 $1,300 - $1,425 $1,385 - $1,525 $1,385 - $1,525
Total Gold $217 $253 $950 - $1,050 $950-$1,050 $1,200 - $1,300 $1,200 - $1,300
GUIDANCE 2021-2023
RESPONSIBLE. SAFE. INNOVATIVE. l 46
Capital and Exploration Outlook

NYSE: HL
Appendix
RESPONSIBLE. SAFE. INNOVATIVE. l 47

NYSE: HL
ESG
RESPONSIBLE. SAFE. INNOVATIVE. l 48

NYSE: HL
ESG IS BUILT IN OUR CULTURE BUT IS STILL IMPROVING
RESPONSIBLE. SAFE. INNOVATIVE. l 49
Primary operations in the U.S. and Canada provides the strongest ESG commitment
Best Jurisdiction To Protect The Environment• Completed reclamation of 97% of the Troy Tailings Facility returning lands to productive
uses such as wildlife habitat• State released nearly $8M in financial assurance
• Advanced “Zero-Discharge” water reduction program at Lucky Friday• Green house gas emissions decreased 35% from 2019
Best Jurisdictions To Care For Workers’ Health & Safety• 2020 ended with AIFR of 1.22 - lowest AIFR in company history - 73% reduction over the
last six years• Industry leading COVID-19 response
• Greens Creek: 5-day quarantine and 3 PCR tests before at site – 5,137 tests, 29 positives identified, 1 on site with no spread
• “Take It Home” Safety campaign integrating our every day – every shift – home safe

NYSE: HL
ESG IS BUILT IN OUR CULTURE BUT IS STILL IMPROVING
RESPONSIBLE. SAFE. INNOVATIVE. l 50
Primary operations in the US and Canada provides the strongest ESG commitment
Best Jurisdictions For A Collaborative Social Engagement• Signed Collaboration Agreement with Pikogan First Nation at Casa Berardi Mine• Initiated a buy local voucher program in partnership with community chambers of
commerce to support local vendors during the economic difficulties caused by COVID-19• Furthered local education through financial donations and partnerships with the Pathways
to Mining Careers program in Alaska, the Hecla-Quebec Global Development Fund and the James Bay Vocational Training Center
Best Jurisdictions For Governance• Approved and published a human rights statement consistent with UN Universal
Declaration on Human Rights• Increased ESG disclosure around the Sustainability Accounting Standards Board (SASB)
metals and mining metrics and benchmarked against the Task Force on Climate-Related Financial Disclosures (TFCD)

NYSE: HL
SAFETY: STEADY FOCUS, EXCELLENT SAFETY RECORD
RESPONSIBLE. SAFE. INNOVATIVE. l 51
2020 lowest AIFR in Hecla’s history; improvements despite pandemic distractions
6.06
5.35 5.41
4.57
3.42
2.76
2.001.61
1.221.71
0
1
2
3
4
5
6
7
2012 2013 2014 2015 2016 2017 2018 2019 2020 Q1 2021
Freq
uenc
y R
ate
72% reduction since SHMS
inception
Hecla All Injury Frequency Rate (AIFR)

NYSE: HL
HECLA HAS SMALL ENERGY AND GHG EMISSIONS FOOTPRINT
• Achieved more than our multi-year 5% energy reduction goal
• Low Greenhouse Gas (GHG) Emissions • Achieved a 36% reduction in GHG emissions from
2019
• 32% of Total GHG Emissions from Line Power• 75% from hydropower• Naturally clean energy source
Hecla lowering our emissions per ton milled
While Hecla is improving focus on energy intensity and GHG emissions – it is the wrong measure!RESPONSIBLE. SAFE. INNOVATIVE. l 52

NYSE: HL
HECLA PROVIDES OVERSIZED BENEFITS
• Metals America needs• Silver, copper, zinc, lead, gold
• Embrace families• Good paying jobs and “uncommon” benefits• Multi-generations work for the company• Active community partner
• Develop innovations• Dry stack tailings• New technology that makes workers safe, more
productive
• Support communities• Taxes, economic impact, social engagement• First Nations/Native Americans• Hecla Charitable Foundation
• Improve the environment
Contributions to our world, country, communities and employees
RESPONSIBLE. SAFE. INNOVATIVE. l 53

NYSE: HL
INNOVATION THAT IMPROVES MINES AND SOCIETY
• Pioneered dry stack tailings management at Greens Creek is industry “best practice” today
• Hecla established internal tailings standard in 2014 and continues to improve our management systems
• Engines developed for underground mines have made air quality better for all
• Remote and automated machines put workers out of harms way and eliminate repetitive work
Lead the way for dry stack tailings, tier IV engines improved air quality for all, and better-safer jobs
2
RESPONSIBLE. SAFE. INNOVATIVE. l 54

NYSE: HL
ENVIRONMENTAL STEWARDSHIP FROM BEGINNING TO END
• Troy Tailings Storage Facility reclamation completed (300 acres). Nearly $8 million in financial assurance released by state
• More than 200,000 shrubs and trees planted at Troy; land returned to productive wildlife habitat
• Native plant collection and planting in partnership with Kootenai-Salish Tribes
• Reclamation and biodiversity efforts can also help sequester carbon
• Backfilling the San Sebastian pits• Closure of older Lucky Friday tailings dams
Troy tailings reclamation considered “gold standard” in Montana
2017
2020
RESPONSIBLE. SAFE. INNOVATIVE. l 55

NYSE: HL
Operations
RESPONSIBLE. SAFE. INNOVATIVE. l 56

NYSE: HL
Location/Fraser Ranking1 5 - Alaska, USA 6 - Quebec, Canada 9 - Idaho, USA
Primary Product Silver Gold Silver
2020 % Revenue Contribution
47 % 30% 9 %
2020 2P Reserves 111.1 Moz silver 1.5 Moz gold 77.0 Moz silver
2020 Production 10.5Moz Ag / 48.5Koz Au 121.5Koz Au / 24.1Koz Ag 2.0Moz Ag2020 Cash provided by
operating activities2 $182.6 M $68.5 M $4.8 M
2020 Cost of Sales3 $217.1 M $203.4 M $56.7 M
2020 Cash Cost4 $5.49 / oz Ag $1,131 / oz Au $9.34 / oz Ag
2020 AISC4 $8.57 / oz Ag $1,436 / oz Au $18.22 / oz Ag
2020 Sustaining Capex $28.8 M $34.4 M $7.2 M
2020 FCF4 $159.6 M $27.6 M $(21 M)
Start-Up Year 1989 1989 1942
Mine Life at Start-up 7 years 6 years 2 years
Remaining Reserve Life 11 years 13 years 17 years
Hecla’s flagship mine: ~$1bn in cumulative free cash flow over
last 10 years
Doubled tonnage for economies of scale with open pit
supplementing underground
Fundamental Operations
Greens Creek Casa Berardi Lucky Friday
Achieved full production fourth quarter of 2020
¹ Location ranking based on Fraser Institute Annual Survey of Mining 2020 Report (77 companies ranked - Lower is Better).2 Cash used by operating activities for Lucky Friday includes $2.4 million for suspension costs incurred during the ramp-up to historical production levels. Cash provided (used)
by operating activities for the operating segments excludes exploration expense, as it is a discretionary expenditure and not a component of the mines’ operatingperformance. Consolidated cash provided by operating activities for the twelve months ended December 31, 2020 includes exploration expense of $0.4 million for GreensCreek, $2.9 million for Casa Berardi, $6.5 million for Nevada Operations, and $3.5 million for San Sebastian.
3 Cost of sales and other direct production costs and depreciation, depletion and amortization.4 Cash Costs and AISC, after by-product credits, per produced silver/gold ounce. AISC and FCF are non-GAAP measures; please refer to appendix for reconciliation to GAAP.
DIVERSE ASSET PORTFOLIO IN MINING FRIENDLY JURISDICTIONS
RESPONSIBLE. SAFE. INNOVATIVE. l 57
Significant value in the fundamental operations, moving projects toward becoming fundamental operations

NYSE: HL
$1,200 $1,250 $1,250 $1,250 $1,275 $1,300 $1,300 $1,300 $1,320 $1,350 $1,400
Goldcorp/Newmont
AgnicoEagle
Fresnillo* SSR Mining* EndeavourSilver
Eldorado Hecla PanAmerican
Fortuna* FirstMajestic*
Coeur
Gol
d
$16.00 $16.00 $16.00$17.00 $17.00 $17.00 $17.00 $17.00
$18.00 $18.00 $18.25
Hecla Eldorado Goldcorp/Newmont
AgnicoEagle
Fresnillo* FirstMajestic*
Coeur EndeavourSilver
PanAmerican
SSR Mining* Fortuna*
Silv
er
LARGE RESERVES DESPITE CONSERVATIVE VALUATION
RESPONSIBLE. SAFE. INNOVATIVE. l 58
Hecla among the lowest marginal ounce in 2020 at $16.00 silver price
Price assumption is at the discretion of management
*Reserve prices updated Jun-30-2019; All others updated Dec-31-20; Peer assumptions are based on 2020 public filings.
Year HL Reserve Prices
2012 $1,4002013 $1,3002014 $1,2252015 $1,1002016 $1,2002017 $1,2002018 $1,2002019 $1,3002020 $1,300
Year HL Reserve Prices
2012 $26.502013 $20.002014 $17.252015 $14.502016 $14.502017 $14.502018 $14.502019 $14.502020 $16.00

NYSE: HL
SILVER/GOLD RESERVES GROWTH
RESPONSIBLE. SAFE. INNOVATIVE. l 59
Despite being more conservative: growth with low price assumptions is exceptional
* Silver reserves include approximately 139 Koz acquired through Klondex acquisition in July 2018* * Klondex acquisition in July 2018, Aurizon Mines acquired in June 2013*** Percentage growth calculated as: Beginning Reserves plus new reserves plus mining depletion divided by beginning reserves
147.7
131.0
188.4
(90.2)
2013 BeginningReserves
Reservesadded (2013-
2020)*
SilverProduced
(2013-2020)
2020 EndingReserves
Silver Reserves Growth (millions of ounces)
$26.50/oz $16.00/oz
250%**
0.7
2.0
1.5 2.4
(1.8)
2013 BeginningReserves
Reserves added(2013-2020)**
Gold Produced(2013-2020)
Additions throughacquisitions
2020 EndingReserves
Gold Reserves Growth (millions of ounces)
645%***
$1,400/oz $1,300/oz

NYSE: HL
211.2 188.4
183.6 201.1
51.5 48.7
2019 2020
THIRD HIGHEST RESERVES IN HECLA’S HISTORY
• COVID-19 disrupted exploration programs company wide with significant third-party assay laboratory delays• Reduction in silver reserves at Greens Creek and Lucky Friday due to limited access by drilling contractor,
changes to mine plans, less favorable smelter terms and mining depletion.• Measured & Indicated silver resources increased 5% to a record 228 million ounces
• Reduction in Casa Berardi’s gold reserves due to mining depletion and engineering changes.• Total gold reserves and Measured & Indicated and Inferred ounces at Casa Berardi remain unchanged
from 2019
RESPONSIBLE. SAFE. INNOVATIVE. l 60
Strong resource base; Reduction in reserves due to COVID-19 limitations, new mine plans and smelter terms
Greens Creek & Lucky Friday:Silver Resources
Casa Berardi: Gold Resources
(Million ounces)
(Million ounces)
1.7 1.5
1.1 1.2
1.0 1.0
2019 2020

NYSE: HL RESPONSIBLE. SAFE. INNOVATIVE. l 61
INCREASING SILVER RESERVES AND RESOURCES4x for reserves and M&I, almost 10x for inferred
0
50
100
150
200
250
2004 2005 2006 2007 2008 2009 2010 2011 2012 2013 2014 2015 2016 2017 2018 2019 2020
Ag (Moz)
Reserves Measured & Indicated
0
50
100
150
200
250
300
350
400
450
500
20042005200620072008200920102011201220132014201520162017201820192020
Ag(Moz)
Inferred

NYSE: HL
LABOR RELATIONS MUCH IMPROVED
• Smooth transition during the ramp-up • Training all employees on conflict resolution and
setting expectations made an impact• Improved communication and working relationship
with local union• More production than planned with 10% fewer
employees• 40% of hourly employees have progressed to a
higher skill level
RESPONSIBLE. SAFE. INNOVATIVE. l 62
Employee productivity and training increasing

NYSE: HL
Exploration Update
RESPONSIBLE. SAFE. INNOVATIVE. l 63

NYSE: HL
ADDING RESERVES FROM DISCOVERIES, EXTENSIONS224 million silver reserve ounces added since 2008; <1% from acquisitions
(200)
(150)
(100)
(50)
‐
50
100
150
200
250
2008 2009 2010 2011 2012 2013 2014 2015 2016 2017 2018 2019 2020
Silver Oun
ces (millions)
Reserves
Cumulative Production
168 Moz
188 Moz
Prod
uctio
n
G
ain
in R
eser
ve o
z(T
otal
Gai
n 22
4 M
oz)
RESPONSIBLE. SAFE. INNOVATIVE. l 64

NYSE: HL
GREENS CREEK – DISTRICT AND NEAR MINE GROWTH POTENTIAL
Continuation of resource expansion along mineralized trends
• Ore tons have doubled in the past 15 years
• Pace is driven by development access• 5250 exploration is accessed from surface• Multiple years of exploration planned
District targets have potential for a new deposit
• VMS deposits often are in clusters• Multiple untested mineralized targets
RESPONSIBLE. SAFE. INNOVATIVE. l 65
In-mine mineralization open for expansion and district potential for new deposits

NYSE: HL
CASA BERARDI – NEW DISCOVERY IN THE 160 ZONE
RESPONSIBLE. SAFE. INNOVATIVE. l 66
New intercept is 500 feet from current resource blocks and open in all directions

NYSE: HL
NEVADA: FOCUS ON LONG-TERM VALUE CREATION
RESPONSIBLE. SAFE. INNOVATIVE. l 67
Bulk sample test nearing completion
• Q1 Gold production of 2,548 ounces from stockpiled bulk sample
• Additional anticipated production of 17,000 – 19,000 ounces through the remaining year
• Nevada operations to go on care & maintenance in Q2/2021
• Activities focused on Hollister development for Hatter Graben and Midas exploration

NYSE: HL
HECLA EXPLORATION DRILLING
RESPONSIBLE. SAFE. INNOVATIVE. l 68
Mine/project exploration drilling expected to add mineral reserves and resources
Mine/Project Results/ExpectationsCasa Berardi, Quebec Will continue to add Mineral Resources to both underground and open-pit
mining areasMexico Further define two new vein discoveries south of the San Sebastian Mine –
test a fully preserved mineralized vein system northeast of the mineMidas, Nevada Follow-up to encouraging results from 2020 drilling and test new targets on
this large land positionHeva-Hosco, Quebec Test the trend of high-grade gold mineralization at depth below current open-
pit resourcesKinskuch, BC Focus on confirming and extending the currently known mineral trends to over
2 miles in lengthCreede, Colorado Update 3-D district geology model and rank exploration targets
Republic, Washington Continue district-wide reconnaissance of exploration targets and rank for follow-up work - update 3-D district geology model
Silver Valley, Idaho Continue detailed target modeling and exploration ranking in collaboration with Lucky Friday geology staff

NYSE: HL
Silver Market
RESPONSIBLE. SAFE. INNOVATIVE. l 69

NYSE: HL
U.S. CURRENT ELECTRICITY CONSUMPTION TRENDS
RESPONSIBLE. SAFE. INNOVATIVE. l 70
Solar is projected to be the largest beneficiary, currently accounts for 1.3% of total U.S. energy consumption

NYSE: HL
• 2019 saw a total supply of 1,023 Moz and total demand of 1,074 Moz• Silver’s total demand in 2030 is expected to reach ~1,147 Moz if demand stays on the last decade
trend and no increase in silver’s investment demand• Supply needs to grow by ~70 Moz per year to meet the on trend additional demand expected in
2030
1,023
1,074
1,147
Total Supply2019
Total Demand2019
Demand Expected, Based on 10 Year GrowthRate
2030F*
SILVER – WIDENING GAP BETWEEN SUPPLY & DEMAND Gap expected to increase with continued trend of industrial demand growth of 2.0%
Million Ounces
Supply shortfall of 50 Moz in 2019 was filled by above
ground stocks
Silver Supply & Demand: 2019 and 2030E
* Demand assumptions: CAGR for industrial demand over the past 10 years has been 2.0%. Assume no increase or decrease in investment, jewelry or silverware demand.
RESPONSIBLE. SAFE. INNOVATIVE. l 71

NYSE: HL
FEDERAL RESERVE’S GROWING BALANCE SHEET
RESPONSIBLE. SAFE. INNOVATIVE. l 72
Monetary policy expected to remain accommodative bullish for gold
.
Fed Balance Sheet 2007 - February 2021
Fed Balance Sheet as a % of GDP
05
101520253035
1/1/
2007
5/1/
2007
9/1/
2007
1/1/
2008
5/1/
2008
9/1/
2008
1/1/
2009
5/1/
2009
9/1/
2009
1/1/
2010
5/1/
2010
9/1/
2010
1/1/
2011
5/1/
2011
9/1/
2011
1/1/
2012
5/1/
2012
9/1/
2012
1/1/
2013
5/1/
2013
9/1/
2013
1/1/
2014
5/1/
2014
9/1/
2014
1/1/
2015
5/1/
2015
9/1/
2015
1/1/
2016
5/1/
2016
9/1/
2016
1/1/
2017
5/1/
2017
9/1/
2017
1/1/
2018
5/1/
2018
9/1/
2018
1/1/
2019
5/1/
2019
9/1/
2019
1/1/
2020
16% 19%
31%
8%
“Fair to say you simply flooded the system with money?” “Yes. We print it. We are not out of ammunition …there’s really no limit…we can move to make policy more accommodative.” Jerome Powell 5/17/20
Source: Bloomberg
“Fair to say you simply flooded the system with money?” “Yes. We print it. We are not out of ammunition …there’s really no limit…we can move to make policy more accommodative.” Jerome Powell 5/17/20

NYSE: HL
TRILLIONS OF GOVERNMENT SPENDING AND GROWING
RESPONSIBLE. SAFE. INNOVATIVE. l 73
Current programs are three times greater than the 2008-9 programs
Source: Morgan Stanley Research US economics team
$1.9 trillionStimulus bill:
$350bn: Aid to state & local governments, $225 bn: stimulus checks, $130 bn: school funding, Additional jobless benefits, Vaccine tracing and testing, Health insurance subsidies

NYSE: HL
SIGNIFICANT MONETARY GROWTH COMPARED TO 1970s
RESPONSIBLE. SAFE. INNOVATIVE. l 74
M2 money supply is highly correlated with inflation
Source: Reuters Eikon, Incrementum AG
US M2 year over year % change, Q1/1960 – Q4/2020

NYSE: HL
GOLD MARKETS SINCE NIXON CLOSED THE GOLD WINDOW
0
1
10
1971 1978 1985 1992 1999 2006 2013 2020Recession Bull Bear
31 months218%
4 months-21%
13 months94%
20 months-40%
49 months512%
53 months-56%
34 months62%
160 months-46%
125 months583%
51 months-40%
53 months59%
RESPONSIBLE. SAFE. INNOVATIVE. l 75Source: Reuters Eikon, Incrementum AG
Gold Bull and Bear Markets 01/1971-05/2020
Last Bull market driven by the Dot.com bust, 9/11 and Global Financial Crisis

NYSE: HL
REPLAYING THE PAST
0
100
200
300
400
500
600
12/1
/200
1
3/1/
2002
6/1/
2002
9/1/
2002
12/1
/200
2
3/1/
2003
6/1/
2003
9/1/
2003
12/1
/200
3
3/1/
2004
6/1/
2004
9/1/
2004
12/1
/200
4
3/1/
2005
6/1/
2005
9/1/
2005
12/1
/200
5
3/1/
2006
6/1/
2006
9/1/
2006
12/1
/200
6
3/1/
2007
6/1/
2007
9/1/
2007
12/1
/200
7
3/1/
2008
6/1/
2008
9/1/
2008
12/1
/200
8
3/1/
2009
6/1/
2009
9/1/
2009
12/1
/200
9
3/1/
2010
6/1/
2010
9/1/
2010
12/1
/201
0
3/1/
2011
6/1/
2011
9/1/
2011
12/1
/201
1
3/1/
2012
6/1/
2012
9/1/
2012
12/1
/201
2
Silver Gold
RESPONSIBLE. SAFE. INNOVATIVE. l 76
Very strong silver and gold performance from 2000 to 2011
Two major periods of monetary and fiscal stimulus – 2001 and 2008 • 1/1/2000 to 3/31/2004 – 50% appreciation• 1/1/2009 to 3/31/2011 – 230% for Silver, 62% for gold
Percentage Increase In Gold and Silver
Source: Bloomberg

NYSE: HL
GOLD AND SILVER LINKED THROUGHOUT HISTORY
RESPONSIBLE. SAFE. INNOVATIVE. l 77
Highest known ratio in last 300 years, close in 1941
Source: Nick Laird, goldchartsrus.com, Incrementum AGWorld Bank, Wheaton Precious Metals
0
20
40
60
80
100
120
1718 1738 1758 1778 1798 1818 1838 1858 1878 1898 1918 1938 1958 1978 1998 2018Gold/Silver ratio Average Median
2020: G/S ratio = 108~ 3x above average~ 5x above median

NYSE: HL
RISING INFLATION IS NEGATIVE FOR MOST ASSET CLASSES
RESPONSIBLE. SAFE. INNOVATIVE. l 78
Gold and mining shares are among the best performers in inflation regimes
Source: Wellington Asset Management, Incrementum AG
Compound annual growth rates of different asset classes in different inflation regimes

NYSE: HL
SILVER SUPPLY COMES FROM MINE PRODUCTION & RECYCLING
Mine production accounts for 80-85% of total silver supply• 2019 saw lower mine production due to grade declines and temporary mine suspensions due to community action • Greater challenges expected in 2020 due to COVID-19 pandemic. Per World Silver Survey, 6.5% decline expected as a
result of temporary mine closuresDecline in recycling expected in 2020 due to COVID-19 and lower silver prices
RESPONSIBLE. SAFE. INNOVATIVE. l 79
Significant disruptions expected in mine supply in 2020
Source: Bloomberg, Metals Focus
Net Hedging Supply
Recycling
Mine Production
1057.8 1032.1 1016.7 1021.3 1056.2976.2
million ounces

NYSE: HL
SILVER MINE PRODUCTION DECLINING FOR FOURTH YEAR
RESPONSIBLE. SAFE. INNOVATIVE. l 80
Despite strong U.S. dollar, silver production has peaked
Source: World Silver Survey 2020
Million Ounces

NYSE: HL
SILVER MINE SUPPLY DEPENDENT ON OTHER METALS
23% 22% 23% 26% 28% 31% 32% 32% 30% 30% 31% 31% 29% 27% 27% 28%
0%
10%
20%
30%
40%
50%
60%
70%
80%
90%
100%
2005 2006 2007 2008 2009 2010 2011 2012 2013 2014 2015 2016 2017 2018 2019 2020e
Silver Zinc & Lead Copper Gold Polymetallic, Other
Over half of supply is a by-product of copper, lead and zinc mines
Source: The Silver Institute, Incrementum AGRESPONSIBLE. SAFE. INNOVATIVE. l 81

NYSE: HL
SILVER MINE SUPPLY HAS JURISDICTION RISK
RESPONSIBLE. SAFE. INNOVATIVE. l 82
50% from four countries – 4% from the U.S.
Source: The Silver Institute, Incrementum AG
Troy Ounces mn

NYSE: HL
Consumer Products/Industrial*544.6 Moz
51%Jewelry & Silverware261.1 Moz
24%
Investment 267.8 Moz
25%
SILVER DEMAND HAS THREE MAIN COMPONENTS
RESPONSIBLE. SAFE. INNOVATIVE. l 83
Green energy demand is new and growing
Source: Bloomberg, Metals Focus
Electronics297.6 Moz
58%
Brazing Alloys50.3 Moz
10%
Photovoltaics98.7 Moz
19%
Other64.3 Moz
13%
Consumer Products/IndustrialSilver Demand
* Industrial demand includes photography demand Source: World Silver Survey 2020

NYSE: HL
SILVER IS OUTPERFORMING MANY METALSCaught up to gold in July, overshot in August, strong since February
Gold +18%
Silver +52%
Zinc +24%
Copper +48%
Price Performance since Jan 2, 2020
Source: BloombergRESPONSIBLE. SAFE. INNOVATIVE. l 84
-40%
-20%
0%
20%
40%
60%
80%
1/2/2020 2/2/2020 3/2/2020 4/2/2020 5/2/2020 6/2/2020 7/2/2020 8/2/2020 9/2/2020 10/2/2020 11/2/2020 12/2/2020 1/2/2021 2/2/2021
Zinc Lead Copper Gold Silver
Lead +13%

NYSE: HL
HECLA OUTPERFORMED IN THE LAST BULL MARKET
RESPONSIBLE. SAFE. INNOVATIVE. l 85
Hecla in the Last Bull Market
-200
-100
0
100
200
300
400
500
600
700
800
'00 '01 '02 '03 '04 '05 '06 '07 '08 '09 '10
Hecla Gold Silver
Percentage Appreciation
Source: Bloomberg
Very strong share reaction to the latest financial upheavals

NYSE: HL
Financial
RESPONSIBLE. SAFE. INNOVATIVE. l 86

NYSE: HL
2.5x
2.0x1.8x
1.4x
6/30/2020 9/30/2020 12/31/2020 3/31/2021
75.998.7
129.8 139.8
Q2 2020 Q3 2020 Q4 2020 Q1 2021
FINANCIAL STRENGTH AND FLEXIBILITY
RESPONSIBLE. SAFE. INNOVATIVE. l 87
Increasing cash balance driven by free cash flow generation, leverage below our target of 2.0x
Cash BalanceAvailable liquidity of $389.8 million(*)
Net Debt/Adjusted EBITDA(3)
Third quarter of meeting our target of ≤ 2.0x
* Liquidity of $389.8 million calculated as $250 million in available credit facility plus $139.8 million in cash equivalents on March 31, 2021.
($ millions)
Trailing 12 months ending

NYSE: HL
$9.33 $11.53 $15.35 $7.21
$9.11 $13.79 $9.81 $18.45
Q2 2020 Q3 2020 Q4 2020 Q1 2021
Silver AISC Realized Price Margin
Cash Flow from Operations $37.5 M $73.4 M $64.9 M $38.0 M
26.7
49.7
28.3
16.5
Q2 2020 Q3 2020 Q4 2020 Q1 2021
FOCUSED ON FREE CASH FLOW GENERATION
RESPONSIBLE. SAFE. INNOVATIVE. l 88
Free cash flow of $121 million over the past four quarters driven by superior margins and steady production
Solid Silver Margins
Free Cash Flow(5)
($ millions)
($ per silver ounce)
(6)
Cost of Sales(4) $73.1 M $78.5 M $86.0 M $76.1 M($ millions)
(7)

NYSE: HL
DIVERSE PORTFOLIO WITH MARGIN GENERATION
RESPONSIBLE. SAFE. INNOVATIVE. l 89
#1 silver and #3 lead and zinc producer in the U.S.
51%49%
35%
45%
7%
13%
Silver Gold Lead Zinc
54%
17%
6%
23%
Silver Production: 3.5 MozCost of Sales: $76.1 MCash Costs, after by-product credits(8): $1.40/ozAISC, after by-product credits(6): $7.21ozRealized Price: $25.66/oz
Gold Production: 52.0 KozCost of Sales: $70.0 MCash Costs, after by-product credits(8): $1,052/ozAISC, after by-product credits(6): $1,284/ozRealized Price: $1,770/oz
Lead Production: 10.7 KtonsRealized Price: $0.92/lb
Zinc Production: 16.1 KtonsRealized Price: $1.32/lb
Q1 2021 Margins(8)
Silver Margin: $18.45/ozGold Margin: $486/oz
Greens Creek Casa Berardi San Sebastian NevadaLucky Friday
98%
2%
47% of Total Revenue 35% of Total Revenue 14% of Total Revenue 0% of Total Revenue 2% of Total Revenue
58%27%
14%
100%
.Note: Based on Q4 2020 Revenue.
* Cash Costs after by-product credits, AISC after by-product credits and Margins are non-GAAP measures. Reconciliation to GAAP is provided in the appendix. Silver Margin for Q1 2021 is calculated as Realized Silver Price of $25.66/oz less AISC, after by-product credits of $7.21/oz. Gold Margin for Q1 2021 is calculated as Realized Gold Price of $1,770/oz less AISC, after by-product credits of $1,284/oz.

NYSE: HL
GENERATING SUBSTANTIAL MARGINS
RESPONSIBLE. SAFE. INNOVATIVE. l 90
Silver AISC expected to be lower in 2021 with Lucky Friday in full production
17%27%
4%
Cost of Sales (000s)4
Q1 2020 Q2 2020 Q3 2020 Q4 2020 Q1 2021 2021 Outlook
Silver $62,656 $73,137 $78,517 $85,967 $76,069 $304,000
Gold $65,239 $59,139 $67,698 $56,159 $69,971 $253,000
*Cost of sales and AISC, after by-product credits, are non-GAAP measures, please refer to appendix for reconciliation to GAAP.
Silver Margins Gold Margins
44%
AISC, After By-Product Credits, per Ag-Au/Oz6
Q1 2020 Q2 2020 Q3 2020 Q4 2020 Q1 2021 2021 Outlook
Silver $12.45 $9.33 $11.53 $15.35 $7.21 $10.75 - $12.50
Gold $1,323 $977 $1,855 $1,330 $1,284 $1,200 - $1,300
14% 49%
54%39%
72% 26%

NYSE: HL
Cash$130
~$380 M
Revolver$250
At 03/31/21
Liquidity Position
1
VERY LIQUID – VERY LONG DATED DEBT
RESPONSIBLE. SAFE. INNOVATIVE. l 91
Liquidity, tenor and coverage have improved
$250 $37
$475
2021 2022 2023 2024 2025 2026 2027 2028
Revolver IQ Notes 7.25%Senior Notes
Long Dated Debt Net Debt/Adjusted EBITDA(3)
*Net Debt/Adjusted EBITDA is a non-GAAP measure and reconciliation to GAAP is shown in the appendix.
2.0x
1.7x1.8x
1.4x
Q2 2020 Q3 2020 Q4 2020 Q1 2021

NYSE: HL* Cash Costs after by-product credits, AISC after by-product credits and Margins are non-GAAP measures. Reconciliation to GAAP is provided in the appendix. Silver Margin for 2020 is calculated as Realized Silver Price of $21.15/oz less AISC, after by-product credits of $11.89/oz. Gold Margin for 2020 is calculated as Realized Gold Price of $1,757/oz less AISC, after by-product credits of $1,302/oz.
DIVERSE PORTFOLIO WITH MARGIN GENERATION
RESPONSIBLE. SAFE. INNOVATIVE. l 92
#1 silver and #3 lead and zinc producer in the U.S.
61%
39%
34%
47%
6%
13%
Silver Gold Lead Zinc
51%
20%
7%
22%
Silver Production: 13.5 MozCost of Sales: $297.9 MCash Costs, after by-product credits(5): $5.70/ozAISC, after by-product credits(4): $11.89/ozRealized Price: $21.15/oz
Gold Production: 209 KozCost of Sales: $248.2 MCash Costs, after by-product credits(5): $1,045/ozAISC, after by-product credits(4): $1,302/ozRealized Price: $1,757/oz
Lead Production: 34.1 KtonsRealized Price: $0.84/lb
Zinc Production: 63.1 KtonsRealized Price: $1.03/lb
2020 Margins(4)
Silver Margin: $9.26/ozGold Margin: $455/oz
Greens Creek Casa Berardi San Sebastian Nevada Lucky Friday
98%
2%
47% of Total Revenue 30% of Total Revenue 5% of Total Revenue 9% of Total Revenue 9% of Total Revenue
59%27%
14%
100%
.

NYSE: HL
STRONG FREE CASH FLOW GENERATION
RESPONSIBLE. SAFE. INNOVATIVE. l 93
Positive free cash flow generation from all mines except Nevada in the fourth quarter
Greens Creek San Sebastian Lucky Friday
Casa Berardi Nevada*
($ millions)
($ millions)
* During the second half of 2020, all ore mined at Nevada Operations was stockpiled, with no ore milled and no production reported during the fourth quarter.
61.7
51.1
(10.5)
Cash Flow fromOperations
Capital Free Cash Flow
4.1 - 4.1
Cash Flow fromOperations
Capital Free Cash Flow
12.9
1.7 (11.1)
Cash Flowfrom
Operations
Capital Free CashFlow
18.2
1.8
(16.4)Cash Flow from
OperationsCapital Free Cash Flow
(3.4)(2.2) (5.6)
Cash Flow fromOperations
Capital Free Cash Flow
Silver: Total Q4/2020Cash Flow from Operations: $78.7 M
Free Cash Flow(1): $57.0 M
Gold: Total Q4/2020Cash Flow from Operations: $14.8 M
Free Cash Flow(1): $(3.8) M

NYSE: HL
Appendix
RESPONSIBLE. SAFE. INNOVATIVE. l 94

NYSE: HL
ENDNOTES
RESPONSIBLE. SAFE. INNOVATIVE. l 95
1. Adjusted EBITDA is a non-GAAP measurement, a reconciliation of which to net income, the most comparable GAAP measure, can be found in the Appendix. Adjusted EBITDA is a measure used by management to evaluate the Company's operating performance but should not be considered an alternative to net income, or cash provided by operating activities as those terms are defined by GAAP and does not necessarily indicate whether cash flows will be sufficient to fund cash needs. In addition, the Company may use it when formulating performance goals and targets under its incentive program.
2. Cash Gross Margin is a non-GAAP measurement, a reconciliation of which to Gross Profit the closest GAAP measurement, can be found in the end of the release. Cash Gross Margin is a measure used by management to evaluate the Company's operating performance but should not be considered an alternative to Gross Profit.
3. Net debt to adjusted EBITDA is a non-GAAP measurement, a reconciliation of adjusted EBITDA and net debt to the closest GAAP measurements of net income (loss) and debt can be found in the appendix. It is an important measure for management to measure relative indebtedness and the ability to service the debt relative to its peers. It is calculated as total debt outstanding less total cash on hand divided by adjusted EBITDA.
4. Cost of sales and other direct production costs and depreciation, depletion and amortization. 5. Free cash flow is a non-GAAP measure and is calculated as as cash flow from operations less additions to property, plant and equipment. Reconciliation to GAAP is shown in the
appendix.6. All-in sustaining cost (AISC), after by-product credits, is a non-GAAP measurement, a reconciliation of which to cost of sales and other direct production costs and depreciation,
depletion and amortization, the closest GAAP measurement, can be found in the appendix. AISC, after by-product credits, includes cost of sales and other direct production costs, expenses for reclamation and exploration, and sustaining capital costs at the mine sites. AISC, after by-product credits, for our consolidated silver properties also includes corporate costs for all general and administrative expenses, exploration and sustaining capital which support the operating properties. AISC, after by-product credits, is calculated net of depreciation, depletion, and amortization and by-product credits. Current GAAP measures used in the mining industry, such as cost of goods sold, do not capture all the expenditures incurred to discover, develop and sustain silver and gold production. Management believes that all in sustaining costs is a non-GAAP measure that provides additional information to management, investors and analysts to help in the understanding of the economics of our operations and performance compared to other producers and in the investor's visibility by better defining the total costs associated with production. Similarly, the statistic is useful in identifying acquisition and investment opportunities as it provides a common tool for measuring the financial performance of other mines with varying geologic, metallurgical and operating characteristics. In addition, the Company may use it when formulating performance goals and targets under its incentive program.
7. Realized price margin is a non-GAAP measure and is calculated as realized market price of silver less AISC.8. Cash cost, after by-product credits, per silver and gold ounce represents a non-GAAP measurement, a reconciliation of which to cost of sales and other direct production costs and
depreciation, depletion and amortization (sometimes referred to as "cost of sales" in this release), can be found in the Appendix. It is an important operating statistic that management utilizes to measure each mine's operating performance. It also allows the benchmarking of performance of each mine versus those of our competitors. As a primary U.S. silver mining company, management also uses the statistic on an aggregate basis - aggregating the Greens Creek, Lucky Friday and San Sebastian mines - to compare performance with that of other primary silver mining companies. With regard to Casa Berardi and Nevada Operations, management uses cash cost, after by- product credits, per gold ounce to compare its performance with other gold mines. Similarly, the statistic is useful in identifying acquisition and investment opportunities as it provides a common tool for measuring the financial performance of other mines with varying geologic, metallurgical and operating characteristics. In addition, the Company may use it when formulating performance goals and targets under its incentive program.
9. Silver and gold equivalent (include zinc and lead production) is calculated using the average market prices for the time period noted. 10. 2021E refers to Hecla’s estimates for 2021. Expectations for 2021 include silver, gold, lead and zinc production from Greens Creek, Lucky Friday, San Sebastian, Casa Berardi and
Nevada Operations converted using $1,525 gold, $17 silver, $0.85 lead, and $1.00 zinc; these haven’t changed from the first quarter.

NYSE: HL
FREE CASH FLOW (NON-GAAP) RECONCILIATON
RESPONSIBLE. SAFE. INNOVATIVE. l 96
Reconciliation of Cash provided by operating activities (GAAP) to Free Cash Flow (non-GAAP)
Dollars are in thousands 31-Mar-21 31-Dec-20 30-Sep-20 30-Jun-20 31-Mar-20 31-Dec-19 30-Sep-19
Greens Creek
Cash provided (used) by operating activities 44,350 61,652 69,795 37,789 13,397 41,412 39,430 Less: Additions to properties, plants equipment and mineral reserves (4,892) (10,521) (5,617) (1,402) (5,511) (12,886) (8,966)
Less: non-cash PP&E activity 3,120 Free Cash Flow 42,578 51,131 64,178 36,387 7,886 28,526 30,464
Lucky FridayCash provided (used) by operating activities 10,944 12,886 1,112 (7,575) (1,624) (837) (3,048) Less: Additions to properties, plants equipment and mineral reserves (5,912) (11,146) (5,547) (4,761) (4,295) (3,043) (2,739) Free Cash Flow 5,032 1,740 (4,435) (12,336) (5,919) (3,880) (5,787)
Casa BerardiCash provided (used) by operating activities 25,684 18,241 19,781 22,226 8,212 14,291 17,597 Less: Additions to properties, plants equipment and mineral reserves (13,847) (16,441) (11,629) (4,278) (8,506) (7,699) (13,239) Free Cash Flow 11,837 1,800 8,152 17,948 (294) 6,592 4,358
3 Months Ended

NYSE: HL
FREE CASH FLOW (NON-GAAP) RECONCILIATON
RESPONSIBLE. SAFE. INNOVATIVE. l 97
Reconciliation of Cash provided by operating activities (GAAP) to Free Cash Flow (non-GAAP)
in thousands
30-Jun-20 30-Sep-20 31-Dec-20 31-Mar-21
Cash Flow from Operations 37,526$ 73,439$ 64,901$ 37,936$ Less: Additions to properties, plants, equipment and mineral interests (10,819) (23,693) (36,634) (21,413) Free Cash Flow 26,707$ 49,746$ 28,267$ 16,523$

NYSE: HL
CASH GROSS MARGIN (NON-GAAP) RECONCILIATION
RESPONSIBLE. SAFE. INNOVATIVE. l 98
in thousands (except per ounce amounts)
31-Mar-21Sales of products 210,852$
Cost of sales and other direct production costs 96,709 Depreciation, depletion and amortization 49,331
Gross profit 64,812$
Add Back: Depreciation, depletion and other direct production costs $ 49,331
Cash Gross Margin $ 114,143
Reconciliation of Gross Profit (GAAP) to Cash Gross Margin (non-GAAP)

NYSE: HL
ADJUSTED EBITDA RECONCILIATION TO GAAP
RESPONSIBLE. SAFE. INNOVATIVE. l 99
Reconciliation of Net Income (Loss) (GAAP) and Debt (GAAP) to Adjusted EBITDA (non-GAAP)
in thousands (except per ounce amounts)
30-Jun-20 30-Sep-20 31-Dec-20 31-Mar-21Net income (loss) (58,705)$ (25,561)$ (16,790)$ 19,366$
Plus: Interest expense 54,587 53,589 49,569 44,002 Plus/(Less): Income taxes (6,142) (2,895) 135 5,831 Plus: Depreciation, depletion and amortization 190,343 179,807 157,130 166,795 Plus: Acquisition costs 246 65 20 20 Plus: Ramp-up and suspension costs 29,575 27,394 24,911 16,233 Less: Loss (gain) on disposition of properties, plants, equipment and mineral interests 574 536 572 572 Plus: Stock-based compensation 4,544 6,139 6,458 5,722 Plus: Provision for closed operations and environmental matters 6,798 6,254 6,189 9,170 Plus/(Less): Foreign exchange gain (loss) (2,709) 260 4,605 13,305 Plus/(Less): Unrealized losses (gains) on derivative contracts 17,128 4,272 5,578 5,053 Plus/(Less): Provisional price (gains) losses (5,487) (5,943) (8,008) (5,950) Plus/(Less): Unrealized loss (gain) on investments (4,075) (8,180) (10,268) (7,740) Plus: Foundation Grant 1,970 1,970 1,970 - Plus: Other 2,371 2,608 2,256 2,806
Adjusted EBITDA 231,018$ 240,315$ 224,327$ 275,185$
Total debt $ 531,054 $ 509,909 $ 523,007 $ 525,002 Less: Cash, cash equivalents, and short-term investments (75,923) (98,669) (129,830) (139,750)
Net debt 455,131$ 411,240$ 393,177$ 385,252$
Net debt/LTM adjusted EBITDA (non-GAAP) 2.0x 1.7x 1.8x 1.4x

NYSE: HL
CASH COST AND AISC RECONCILIATION TO GAAP
RESPONSIBLE. SAFE. INNOVATIVE. l 100
2021 Silver EstimatesReconciliation of Cost of Sales and Other Direct Production Costs and Depreciation, Depletion and Amortization (GAAP) to Cash
Cost, Before By-product Credits and Cash Cost, After By-product Credits (non-GAAP) and All-In Sustaining Costs, Before By-product Credits, per Ounce and All-In Sustaining Costs, After By-product Credits, per Ounce (non-GAAP)
1. Includes all direct and indirect operating costs related directly to the physical activities of producing metals, including mining, processing and other plant costs, third-party refining and marketing expense, on-site general and administrative costs,and royalties, after by-product revenues earned from all metals other than the primary metal produced at each unit. AISC, Before By-product Credits also includes on-site exploration, reclamation, and sustaining capital cost.3. AISC, Before By-product Credits for our consolidated silver properties includes corporate costs for general and administrative expense, exploration and sustaining capital.

NYSE: HL
CASH COST AND AISC RECONCILIATION TO GAAP
RESPONSIBLE. SAFE. INNOVATIVE. l 101
2021 Gold EstimatesReconciliation of Cost of Sales and Other Direct Production Costs and Depreciation, Depletion and Amortization (GAAP) to Cash
Cost, Before By-product Credits and Cash Cost, After By-product Credits (non-GAAP) and All-In Sustaining Costs, Before By-product Credits, per Ounce and All-In Sustaining Costs, After By-product Credits, per Ounce (non-GAAP)
(1) Includes all direct and indirect operating costs related to the physical activities of producing metals, including mining, processing and other plant costs, third-party refining and marketing expense, non-discretionary on-site general and administrative costs, royalties andmining production taxes, before by-product revenues earned from all metals other than the primary metal produced at each unit. AISC, Before By-product Credits also includes on-site exploration, reclamation, and sustaining capital costs.

NYSE: HL
CASH COST AND AISC RECONCILIATION TO GAAP
RESPONSIBLE. SAFE. INNOVATIVE. l 102
Total Silver and GoldReconciliation of Cost of Sales and Other Direct Production Costs and Depreciation, Depletion and Amortization (GAAP) to Cash Cost, Before By-product
Credits and Cash Cost, After By-product Credits (non-GAAP) and All-In Sustaining Costs, Before By-product Credits, per Ounce and All-In Sustaining Costs, After By-product Credits, per Ounce (non-GAAP)
(1) Excludes the discretionary portion of general and administrative costs for Greens Creek, Casa Berardi and corporate of $0.4 million, $0.4 million and $1.4 million, respectively, for the third quarter and first nine months of 2020. Also excludes estimated Q42020 discretionary general and administrative costs for Greens Creek, Casa Berardi and corporate of $0.2 million, $0.2 million, and $0.9 million respectively.
In thousands (except per ounce amounts) Three Months Ended March 31, 2021 Total Silver Total Gold Total Total cost of sales $ 76,069 $ 69,971 $ 146,040 Depreciation, depletion and amortization (21,157) (28,174) (49,331)
Treatment costs 15,519 725 16,244 Change in product inventory 308 (1,131) (823) Reclamation and other costs (588) (235) (823) Cash costs excluded — (115) (115) Cash Cost, Before By-product Credits (1) 70,151 41,041 111,192 Reclamation and other costs 1,112 235 1,347 Exploration 558 907 1,465 Sustaining capital 10,346 7,847 18,193 General and administrative 8,007 — 8,007 AISC, Before By-product Credits (1) 90,174 50,030 140,204 By-product credits:
Zinc (27,520) — (27,520) Gold (20,996) — (20,996) Lead (16,795) — (16,795) Silver — (278) (278) Total By-product credits (65,311) (278) (65,589)
Cash Cost, After By-product Credits $ 4,840 $ 40,763 $ 45,603
AISC, After By-product Credits $ 24,863 $ 49,752 $ 74,615
Divided by ounces produced 3,449 39 Cash Cost, Before By-product Credits, per Ounce $ 20.34 $ 1,059 By-product credits per ounce (18.94) $ (7) Cash Cost, After By-product Credits, per Ounce $ 1.40 $ 1,052
AISC, Before By-product Credits, per Ounce $ 26.15 $ 1,291 By-product credits per ounce (18.94) $ (7) AISC, After By-product Credits, per Ounce $ 7.21 $ 1,284

NYSE: HL
CASH COST AND AISC RECONCILIATION TO GAAP
1. Includes all direct and indirect operating cash costs related directly to the physical activities of producing metals, including mining, processing and other plant costs, third-party refining and marketing expense, on-site general and administrative costs, royalties and mining production taxes, before by-product revenues earned from all metals other than the primary metal produced at each unit.
2. All-in sustaining costs, before by-product credits for our consolidated silver properties includes corporate costs for all general and administrative expenses and exploration and sustaining capital which support the operating properties.
RESPONSIBLE. SAFE. INNOVATIVE. l 103
Silver OperationsReconciliation of Cost of Sales and Other Direct Production Costs and Depreciation, Depletion and Amortization (GAAP) to
Cash Cost, Before By-product Credits and Cash Cost, After By-product Credits (non-GAAP) and All-In Sustaining Costs, Before By-product Credits, per Ounce and All-In Sustaining Costs, After By-product Credits, per Ounce (non-GAAP)
In thousands (except per ounce amounts)
Q1 2020 Q2 2020 Q3 2020 Q4 2020 Q1 2021 2020Cost of sales and other direct production costs and depreciation, depletion and amortization (GAAP) 60,314$ 73,137$ 78,517$ 85,967$ 76,069$ 297,935$ Depreciation, depletion and amortization (14,204) (15,777) (15,472) (19,230) (21,157) (64,713) Treatment costs 16,362 23,095 26,794 23,250 15,519 81,999 Change in product inventory 4,037 (4,536) 3,736 (6,398) 308 (3,161) Reclamation and other costs (42) (203) (1,283) (1,552) (588) (3,080) Exclusion of Lucky Friday costs (3,876) (12,475) (22,593) - - (31,442) Cash Cost, Before By-product Credits(1) 62,591 63,241 69,699 82,007 70,151 277,538 Reclamation and other costs 902 903 902 1,087 1,112 3,794 Exploration 1,121 314 799 406 558 2,142 Sustaining capital 5,566 4,500 8,547 17,675 10,346 36,288 General and administrative 8,939 6,979 10,345 7,496 8,007 33,759 AISC, Before By-product Credits(1,2) 79,119 75,937 90,292 108,671 90,174 353,521 Total By-product credits (44,578) (48,760) (56,833) (57,330) (65,311) (207,501) Cash Cost, After By-product Credits, per Silver Ounce 18,013$ 14,481$ 12,866$ 24,677$ 4,840$ 70,037$ AISC, After By-product Credits 34,541$ 27,177$ 33,459$ 51,341$ 24,863$ 146,020$ Divided by ounces produced 3,123 2,912 2,901 3,344 3,440 12,280 Cash Cost, Before By-product Credits, per Silver Ounce 20.03$ 21.71$ 24.02$ 24.52$ 20.34$ 22.60$ By-product credits per Silver Ounce (14.27) (16.74) (19.59) (17.14) (18.94) (16.90) Cash Cost, After By-product Credits, per Silver Ounce 5.76$ 4.97$ 4.43$ 7.38$ 1.40$ 5.70$ AISC, Before By-product Credits, per Silver Ounce 27.24$ 26.07$ 31.12$ 32.49$ 26.15$ 28.79$ By-products credit per Silver Ounce (14.79) (16.74) (19.59) (17.14) (18.94) (16.90) AISC, After By-product Credits, per Silver Ounce 12.45$ 9.33$ 11.53$ 15.35$ 7.21$ 11.89$
Realized Silver Price 14.48$ 18.44$ 25.32$ 25.16$ 25.66$ 21.15$ Silver Margin (Realized Silver Price - AISC) 2.03$ 9.11$ 13.79$ 9.81$ 18.45$ 9.26$
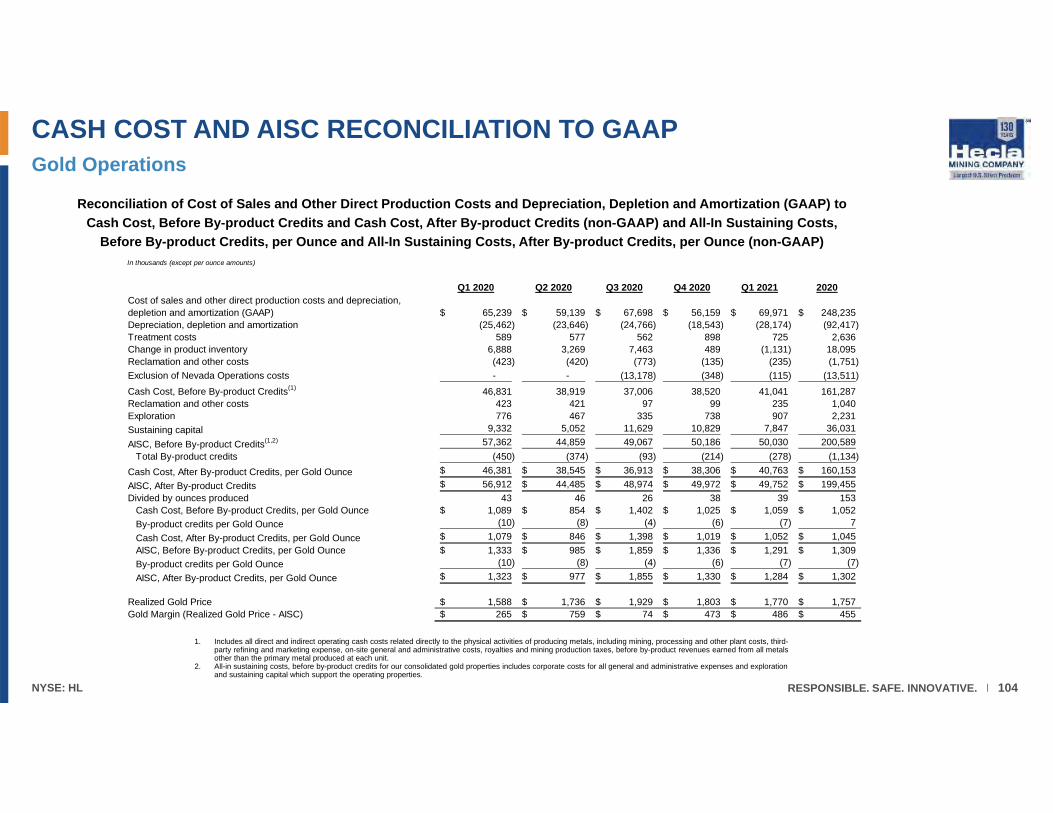
NYSE: HL
CASH COST AND AISC RECONCILIATION TO GAAP
RESPONSIBLE. SAFE. INNOVATIVE. l 104
Gold Operations
Reconciliation of Cost of Sales and Other Direct Production Costs and Depreciation, Depletion and Amortization (GAAP) to Cash Cost, Before By-product Credits and Cash Cost, After By-product Credits (non-GAAP) and All-In Sustaining Costs,
Before By-product Credits, per Ounce and All-In Sustaining Costs, After By-product Credits, per Ounce (non-GAAP)
1. Includes all direct and indirect operating cash costs related directly to the physical activities of producing metals, including mining, processing and other plant costs, third-party refining and marketing expense, on-site general and administrative costs, royalties and mining production taxes, before by-product revenues earned from all metals other than the primary metal produced at each unit.
2. All-in sustaining costs, before by-product credits for our consolidated gold properties includes corporate costs for all general and administrative expenses and exploration and sustaining capital which support the operating properties.
In thousands (except per ounce amounts)
Q1 2020 Q2 2020 Q3 2020 Q4 2020 Q1 2021 2020Cost of sales and other direct production costs and depreciation, depletion and amortization (GAAP) 65,239$ 59,139$ 67,698$ 56,159$ 69,971$ 248,235$ Depreciation, depletion and amortization (25,462) (23,646) (24,766) (18,543) (28,174) (92,417) Treatment costs 589 577 562 898 725 2,636 Change in product inventory 6,888 3,269 7,463 489 (1,131) 18,095 Reclamation and other costs (423) (420) (773) (135) (235) (1,751) Exclusion of Nevada Operations costs - - (13,178) (348) (115) (13,511) Cash Cost, Before By-product Credits(1) 46,831 38,919 37,006 38,520 41,041 161,287 Reclamation and other costs 423 421 97 99 235 1,040 Exploration 776 467 335 738 907 2,231 Sustaining capital 9,332 5,052 11,629 10,829 7,847 36,031 AISC, Before By-product Credits(1,2) 57,362 44,859 49,067 50,186 50,030 200,589 Total By-product credits (450) (374) (93) (214) (278) (1,134) Cash Cost, After By-product Credits, per Gold Ounce 46,381$ 38,545$ 36,913$ 38,306$ 40,763$ 160,153$ AISC, After By-product Credits 56,912$ 44,485$ 48,974$ 49,972$ 49,752$ 199,455$ Divided by ounces produced 43 46 26 38 39 153 Cash Cost, Before By-product Credits, per Gold Ounce 1,089$ 854$ 1,402$ 1,025$ 1,059$ 1,052$ By-product credits per Gold Ounce (10) (8) (4) (6) (7) 7 Cash Cost, After By-product Credits, per Gold Ounce 1,079$ 846$ 1,398$ 1,019$ 1,052$ 1,045$ AISC, Before By-product Credits, per Gold Ounce 1,333$ 985$ 1,859$ 1,336$ 1,291$ 1,309$ By-product credits per Gold Ounce (10) (8) (4) (6) (7) (7) AISC, After By-product Credits, per Gold Ounce 1,323$ 977$ 1,855$ 1,330$ 1,284$ 1,302$
Realized Gold Price 1,588$ 1,736$ 1,929$ 1,803$ 1,770$ 1,757$ Gold Margin (Realized Gold Price - AISC) 265$ 759$ 74$ 473$ 486$ 455$

NYSE: HL
CASH COST AND AISC RECONCILIATION TO GAAP
1. Includes all direct and indirect operating costs related to the physical activities of producing metals, including mining, processing and other plant costs, third-party refining and marketing expense, non-discretionary on-site general and administrative costs, royalties and mining production taxes, before by-product revenues earned from all metals other than the primary metal produced at each unit. AISC, Before By-product Credits also includes on-site exploration, reclamation, and sustaining capital costs.
RESPONSIBLE. SAFE. INNOVATIVE. l 105
Greens CreekReconciliation of Cost of Sales and Other Direct Production Costs and Depreciation, Depletion and Amortization (GAAP) to
Cash Cost, Before By-product Credits and Cash Cost, After By-product Credits (non-GAAP) and All-In Sustaining Costs, Before By-product Credits, per Ounce and All-In Sustaining Costs, After By-product Credits, per Ounce (non-GAAP)
In thousands (except per ounce amounts)
Q2 2020 Q3 2020 Q4/2020 Q1/2021Cost of sales and other direct production costs and depreciation, depletion and amortization (GAAP) 57,672$ 51,057$ 59,215$ 53,181$
Depreciation, depletion and amortization (12,988) (11,735) (12,540) (14,821) Treatment costs 20,016 22,675 18,605 10,541 Change in product inventory (4,020) 2,899 (4,893) 401 Reclamation and other costs 93 (891) (1,130) (261) Cash Cost, Before By-product Credits(1) 60,733 64,005 59,257 49,041 Reclamation and other costs 789 788 789 848 Exploration - 370 (20) 123 Sustaining capital 4,501 8,265 10,521 4,892 AISC, Before By-product Credits(1) 66,063 73,428 70,547 54,904 Total By-product credits (46,473) (53,147) (42,452) (50,783)
14,300$ 10,858$ 16,805$ (1,742)$ AISC, After By-product Credits 19,590$ 20,281$ 28,095$ 4,121$ Divided by ounces produced 2,754 2,634 2,331 2,585 Cash Cost, Before By-product Credits, per Silver Ounce 22.06$ 24.30$ 25.43$ 18.98$ By-products credits per Silver Ounce (16.87) (20.18) (18.22) (19.65) Cash Cost, After By-product Credits, per Silver Ounce 5.19$ 4.12$ 7.21$ (0.67)$ AISC, Before By-product Credits, per Silver Ounce 23.98$ 27.88$ 30.27$ 21.24$ By-product credits per Silver Ounce (16.87) (20.18) (18.22) (19.65) AISC, After By-product Credits, per Silver Ounce 7.11$ 7.70$ 12.05$ 1.59$
Realized Silver Price 18.44$ 25.32$ 25.16$ 25.66$ Silver Margin (Realized Silver Price - AISC) 11.33$ 17.62$ 13.11$ 24.07$
Cash Cost, After By-product Credits

NYSE: HL
CASH COST AND AISC RECONCILIATION TO GAAP
1. Includes all direct and indirect operating costs related to the physical activities of producing metals, including mining, processing and other plant costs, third-party refining and marketing expense, non-discretionary on-site general and administrative costs, royalties and mining production taxes, before by-product revenues earned from all metals other than the primary metal produced at each unit. AISC, Before By-product Credits also includes on-site exploration, reclamation, and sustaining capital costs.
RESPONSIBLE. SAFE. INNOVATIVE. l 106
Lucky FridayReconciliation of Cost of Sales and Other Direct Production Costs and Depreciation, Depletion and Amortization (GAAP) to
Cash Cost, Before By-product Credits and Cash Cost, After By-product Credits (non-GAAP) and All-In Sustaining Costs, Before By-product Credits, per Ounce and All-In Sustaining Costs, After By-product Credits, per Ounce (non-GAAP)
In thousands (except per ounce amounts)
Q2 2020 Q3 2020 Q4 2020 Q1 2021
11,455$ 21,500$ 20,919$ 22,794$
Depreciation, depletion and amortization (1,894) (2,956) (6,321) (6,336) Treatment costs 3,032 4,038 4,590 4,978 Change in product inventory (118) 11 1,533 (93) Reclamation and other costs - - (274) (233) Exclusion of Lucky Friday costs (12,475) (22,593) - - Cash Cost, Before By-product Credits(1) - - 20,447 21,110 Reclamation and other costs - - 222 264 Sustaining capital - - 7,154 5,454 AISC, Before By-product Credits(1) - - 27,823 26,828 Total By-product credits - - (12,694) (14,528)
- - 7,753$ 6,582$ AISC, After By-product Credits - - 15,129$ 12,300$ Divided by ounces produced - - 830 864 Cash Cost, Before By-product Credits, per Silver Ounce - - 24.63$ 24.43$ By-products credits per Silver Ounce - - (15.29)$ (16.81)$ Cash Cost, After By-product Credits, per Silver Ounce - - 9.34$ 7.62$ AISC, Before By-product Credits, per Silver Ounce - - 33.52$ 31.05$
By-products credits per Silver Ounce - - (15.29) (16.81) AISC, After By-product Credits, per Silver Ounce - - 18.22$ 14.24$
Cost of sales and other direct production costs and depreciation, depletion and amortization (GAAP)
Cash Cost, After By-product Credits, per Silver Ounce

NYSE: HL
CASH COST AND AISC RECONCILIATION TO GAAP
1. Includes all direct and indirect operating costs related to the physical activities of producing metals, including mining, processing and other plant costs, third-party refining and marketing expense, non-discretionary on-site general and administrative costs, royalties and mining production taxes, before by-product revenues earned from all metals other than the primary metal produced at each unit. AISC, Before By-product Credits also includes on-site exploration, reclamation, and sustaining capital costs.
RESPONSIBLE. SAFE. INNOVATIVE. l 107
Casa BerardiReconciliation of Cost of Sales and Other Direct Production Costs and Depreciation, Depletion and Amortization (GAAP) to
Cash Cost, Before By-product Credits and Cash Cost, After By-product Credits (non-GAAP) and All-In Sustaining Costs, Before By-product Credits, per Ounce and All-In Sustaining Costs, After By-product Credits, per Ounce (non-GAAP)
In thousands (except per ounce amounts)
Q2 2020 Q3 2020 Q4 2020 Q1 2021Cost of sales and other direct production costs and depreciation, depletion and amortization (GAAP) 45,582$ 53,821$ 55,706$ 62,518$
Depreciation, depletion and amortization (17,281) (17,471) (18,423) (25,541) Treatment costs 558 562 898 714 Change in product inventory (400) 543 474 (47) Reclamation and other costs (92) (449) (135) (208) Cash cost, before by-product credits(1) 28,367 37,006 38,520 37,434 Reclamation and other costs 94 97 99 208Exploration 467 335 738 907 Sustaining capital 4,278 11,629 10,829 7,758 AISC, Before By-product Credits(1) 33,206 49,067 50,186 46,307 Total By-products credits (92) (93) (214) (278)
28,275$ 36,913$ 38,306$ 37,156$ AISC, After By-product Credits 33,114$ 48,974$ 49,972$ 46,029$ Divided by ounces produced 31 26 38 36 Cash Cost, Before By-product Credits, per Gold Ounce 922$ 1,402$ 1,025$ 1,035$ By-product credits per Gold Ounce (3)$ (4)$ (6)$ (8)$ Cash Cost, After By-product Credits, per Gold Ounce 919$ 1,398$ 1,019$ 1,027$ AISC, Before By-product Credits, per Gold Ounce 1,080$ 1,859$ 1,335$ 1,280$ By-product credits per Gold Ounce (3)$ (4)$ (6)$ (8)$ AISC, After By-product Credits, per Gold Ounce 1,077$ 1,855$ 1,330$ 1,272$
Cash Cost, After By-product Credits

NYSE: HL
PROVEN & PROBABLE MINERAL RESERVES(1)
RESPONSIBLE. SAFE. INNOVATIVE. l 108
(On December 31, 2020 unless otherwise noted)
Investors are cautioned that Reserves and Resources are as of December 31, 2020, and are dynamic during the year due to mining depletion, changing metal prices, changing costs or projecteconomics, and new drill or mining information. These factors can impact Reserves and Resources either positively or negatively.
Proven Reserves Tons Silver Gold Lead Zinc Copper Silver Gold Lead Zinc Copper Asset (000) (oz/ton) (oz/ton) % % % (000 oz) (000 oz) Tons Tons Tons
Greens Creek (2) 3 21.8 0.10 3.7 7.8 - 70 0.3 120 250 -
Lucky Friday (2) 4,393 14.2 - 8.8 4.1 - 62,290 - 386,210 180,060 -
Casa Berardi Open Pit (3) 4,437 - 0.09 - - - - 410 - - -
Casa Berardi Underground (3) 1,038 - 0.15 - - - - 158 - - -
Fire Creek (2,4) 62 0.4 0.48 - - - 28 30 - - -
Total 9,933 62,388 598 386,330 180,310 -
Probable Reserves
Tons Silver Gold Lead Zinc Copper Silver Gold Lead Zinc Copper Asset (000) (oz/ton) (oz/ton) % % % (000 oz) (000 oz) (Tons) (Tons) Tons
Greens Creek (2) 8,975 12.4 0.09 2.8 7.3 - 111,333 827 254,840 652,170 -
Lucky Friday (2) 1,372 10.7 - 7.2 3.9 - 14,702 - 99,170 53,190 -
Casa Berardi Open Pit (3) 9,763 - 0.08 - - - - 744 - - -
Casa Berardi Underground (3) 1,533 - 0.15 - - - - 231 - - -
Fire Creek (2,4) 1 0.9 0.71 - - - 1 1 - - -
Total 21,643 126,036 1,802 354,010 705,360 -
Proven and Probable Reserves
Tons Silver Gold Lead Zinc Copper Silver Gold Lead Zinc Copper Asset (000) (oz/ton) (oz/ton) % % % (000 oz) (000 oz) (Tons) (Tons) Tons
Greens Creek (2) 8,978 12.4 0.09 2.8 7.3 - 111,404 828 254,960 652,420 -
Lucky Friday (2) 5,764 13.4 - 8.4 4.0 - 76,992 - 485,380 233,250 -
Casa Berardi Open Pit (3) 14,200 - 0.08 - - - - 1,153 - - -
Casa Berardi Underground (3) 2,571 - 0.16 - - - - 389 - - -
Fire Creek (2,4) 63 0.5 0.48 - - - 29 31 - - -
Total 31,576
188,424
2,400
740,340
885,670 - (1) The term “reserve” means that part of a mineral deposit that can be economically and legally extracted or produced at the time of the reserve determination. The term “economically,” as used in the definition of reserve, means that profitable extraction
or production has been established or analytically demonstrated to be viable and justifiable under reasonable investment and market assumptions. The term “legally,” as used in the definition of reserve, does not imply that all permits needed for miningand processing have been obtained or that other legal issues have been completely resolved. However, for a reserve to exist, Hecla must have a justifiable expectation, based on applicable laws and regulations, that issuance ofpermits or resolution of legal issues necessary for mining and processing at a particular deposit will be accomplished in the ordinary course and in a timeframe consistent with Hecla’s current mine plans.
(2) Mineral reserves are based on $1300 gold, $16.00 silver, $0.90 lead, $1.15 zinc, unless otherwise stated. The NSR cut-off grades are $205/ton for Greens Creek, $216.19 for the 30 Vein and $230.98 for the Intermediate Veins at Lucky Friday.(3) Mineral reserves are based on $1300 gold and a US$/CAN$ exchange rate of 1:1.35. Reserve diluted to an average of 18% or 23% depending on mining method. The average cut-off grades at Casa Berardi are 0.101 oz/ton gold (3.46 g/tonne) for
underground mineral reserves and 0.025 oz/ton gold (0.85 g/tonne) for open pit mineral reserves.(4) Fire Creek mineral reserves are based on a cut-off grade of 0.482 gold equivalent oz/ton and incremental cut-off grade of 0.106 gold equivalent oz/ton. Unplanned dilution of 10% to 17% included depending on mining method.
* Totals may not represent the sum of parts due to rounding

NYSE: HL
MEASURED AND INDICATED MINERAL RESOURCES
RESPONSIBLE. SAFE. INNOVATIVE. l 109
(On December 31, 2020 unless otherwise noted)
Investors are cautioned that Reserves and Resources are as of December 31, 2020, and are dynamic during the year due to mining depletion, changing metal prices, changing costs or projecteconomics, and new drill or mining information. These factors can impact Reserves and Resources either positively or negatively.
Measured Resources
Tons Silver Gold Lead Zinc Copper Silver Gold Lead Zinc Copper Asset (000) (oz/ton) (oz/ton) % % % (000 oz) (000 oz) (Tons) (Tons) Tons
Greens Creek (5) 297 12.9 0.11 3.1 10.3 - 3,837 33 9,310 30,500 - Lucky Friday (5,6) 9,007 7.6 - 4.8 2.4 - 68,543 - 30,950 218,740 - Casa Berardi Open Pit (7) 824 - 0.09 - - - - 71 - - - Casa Berardi Underground (7) 2,231 - 0.15 - - - - 331 - - - San Sebastian (5,8) - - - - - - - - - - - Fire Creek (5,9) 20 0.7 0.50 - - - 14 10 - - - Hollister (5,10) 18 4.9 0.59 - - - 87 10 - - - Midas (5,11) 2 7.6 0.68 - - - 14 1 - - - Heva (12) - - - - - - - - - - - Hosco (12) - - - - - - - - - - - Rio Grande Silver (13) - - - - - - - - - - - Star (14) - - - - - - - - - - - Total 12,399 72,495 456 440,260 249,240 -
Indicated Resources
Tons Silver Gold Lead Zinc Copper Silver Gold Lead Zinc Copper Asset (000) (oz/ton) (oz/ton) % % % (000 oz) (000 oz) (Tons) (Tons) Tons
Greens Creek (5) 8,599 12.9 0.10 3.0 8.2 - 110,844 848 256,790 708,520 - Lucky Friday (5,6) 2,275 7.8 - 5.3 2.2 - 17,844 - 120,390 50,970 - Casa Berardi Open Pit (7) 1,621 - 0.06 - - - - 97 - - - Casa Berardi Underground (7) 5,424 - 0.14 - - - - 750 - - - San Sebastian (5,8) 2,541 5.9 0.06 1.9 2.9 1.2 14,985 149 22,420 34,100 14,650 Fire Creek (5,9) 114 1.0 0.45 - - - 114 51 - - - Fire Creek - Open Pit (13) - - - - - - - - - - - Hollister (5,10) 70 1.9 0.58 - - - 130 40 - - - Midas (5,11) 76 5.7 0.42 - - - 430 32 - - - Heva (12) 1,266 - 0.06 - - - - 76 - - - Hosco (12) 29,287 - 0.04 - - - - 1,202 - - - Rio Grande Silver (13) 516 14.8 - 2.1 1.1 - 7,620 - 10,760 5,820 - Star (14) 1,126 2.9 - 6.2 7.4 - 3,301 - 69,900 83,410 - Total………………………….. 52,913 155,266 3,245 480,260 882,820 14,650
Measured & Indicated Resources
Tons Silver Gold Lead Zinc Copper Silver Gold Lead Zinc Copper Asset (000) (oz/ton) (oz/ton) % % % (000 oz) (000 oz) (Tons) (Tons) Tons
Greens Creek (5) 8,895 12.9 0.10 3.0 8.3 - 114,681 881 266,110 739,020 - Lucky Friday (5,6) 11,282 7.7 - 4.9 2.4 - 86,386 - 551,340 269,710 - Casa Berardi Open Pit (7) 2,445 - 0.07 - - - - 168 - - - Casa Berardi Underground (7) 7,656 - 0.14 - - - - 1,081 - - - San Sebastian (5,8) 2,541 5.9 0.06 1.9 2.9 1.2 14,985 149 22,420 34,100 14,650 Fire Creek (5,9) 134 1.0 0.46 - - - 128 61 - - - Fire Creek - Open Pit (13) - - - - - - - - - - - Hollister (5,10) 88 2.5 0.58 - - - 217 51 - - - Midas (5,11) 78 5.7 0.43 - - - 444 33 - - - Heva (12) 1,266 - 0.06 - - - - 76 - - - Hosco (12) 29,287 - 0.04 - - - - 1,202 - - - Rio Grande Silver (13) 516 14.8 - 2.1 1.1 - 7,620 - 10,760 5,820 - Star (14) 1,126 2.9 - 6.2 7.4 - 3,301 - 69,900 83,410 - Total………………………….. 65,312 227,760 3,701 920,530 1,132,060 14,650

NYSE: HL
INFERRED MINERAL RESOURCES
RESPONSIBLE. SAFE. INNOVATIVE. l 110
(On December 31, 2020 unless otherwise noted)
Investors are cautioned that Reserves and Resources are as of December 31, 2020, and are dynamic during the year due to mining depletion, changing metalprices, changing costs or project economics, and new drill or mining information. These factors can impact Reserves and Resources either positively or negatively.
Inferred Resources
Tons Silver Gold Lead Zinc Copper Silver Gold Lead Zinc Copper
Asset (000) (oz/ton) (oz/ton) % % % (000 oz) (000 oz) (Tons) (Tons) Tons
Greens Creek (5) 1,767 13.2 0.08 2.8 7.0 - 23,370 145 49,670 123,480 -
Lucky Friday (5,6) 3,069 8.3 - 6.3 2.7 - 25,359 - 192,200 83,350 -
Casa Berardi Open Pit (7) 9,229 - 0.06 - - - - 508 - - -
Casa Berardi Underground (7) 2,447 - 0.18 - - - - 445 - - -
San Sebastian (5,15) 2,923 5.9 0.05 1.6 2.3 0.9 17,188 133 6,070 8,830
3,330
Fire Creek (5,9) 765 0.5 0.51 - - - 394 392 - - -
Fire Creek - Open Pit (16) 74,584 0.1 0.03 - - - 5,232 2,178 - - -
Hollister (5,10) 642 3.0 0.42 - - - 1,916 273 - - -
Midas (5,11) 1,057 5.0 0.40 - - - 5,280 424 - - -
Heva (12) 2,787 - 0.08 - - - - 216 - - -
Hosco (12) 17,726 - 0.04 - - - - 663 - - -
Rio Grande Silver (17) 3,078 10.7 0.01 1.3 1.1 - 33,097 36 40,990 34,980 -
Star (14) 3,157 2.9 - 5.6 5.5 - 9,432 - 178,670 174,450 -
Monte Cristo (18) 913 0.3 0.14 - - - 271 131 - - -
Rock Creek (19) 100,086 1.5 - - - 0.7 148,736 - - - 658,680
Montanore (20) 112,185 1.6 - - - 0.7 183,346 - - - 759,420
Total………………………….. 336,416 453,621 5,543 467,600 425,090 1,421,430

NYSE: HL
MINERAL RESOURCES (NOTES)
RESPONSIBLE. SAFE. INNOVATIVE. l 111
(On December 31, 2020 unless otherwise noted)
Note: All estimates are in-situ except for the proven reserves at Greens Creek and Fire Creek which are in surface stockpiles. Resources are exclusive of reserves.
(5) Mineral resources are based on $1500 gold, $21 silver, $1.15 lead, $1.35 zinc and $3.00 copper, unless otherwise stated. Cut-off grades are as above unless otherwise stated.(6) Measured and indicated resources from Gold Hunter and Lucky Friday vein systems are diluted and factored for expected mining recovery using NSR cut-off grades of $170.18 for the 30 Vein, $184.97 for the Intermediate Veins
and $207.15 for the Lucky Friday Vein.(7) Measured, indicated and inferred resources are based on $1,500 gold and a US$/CAN$ exchange rate of 1:1.35 Underground resources are reported at a minimum mining width of 6.6 to 9.8 feet (2 m to 3 m). The average cut-off
grades at Casa Berardi are 0.087 oz/ton gold (3.0 g/tonne) for underground mineral resources and 0.025 oz/ton gold (0.85 g/tonne) for open pit mineral resources.(8) Indicated resources reported at a minimum mining width of 5.9 feet (1.8 m) for Hugh Zone, Middle Vein, North Vein, and East Francine Vein and 4.9 feet (1.5 m) for Andrea Vein using a cut-off grade of $90.72/ton ($100/tonne).San Sebastian lead, zinc and copper grades are for 1,187,000 tons of indicated resource within the Middle Vein and the Hugh Zone of the Francine Vein. (9) Fire Creek mineral resources are reported at a gold equivalent cut-off grade of 0.283 oz/ton. The minimum mining width is defined as four feet or the vein true thickness plus two feet, whichever is greater. (10) Hollister mineral resources, including the Hatter Graben are reported at a gold equivalent cut-off grade of 0.238 oz/ton. The minimum mining width is defined as four feet or the vein true thickness plus two feet, whichever is
greater. (11) Midas mineral resources are reported at a gold equivalent cut-off grade of 0.237 oz/ton. The minimum mining width is defined as four feet or the vein true thickness plus two feet, whichever is greater. (12) Measured, indicated and inferred resources are based on $1,500 gold The resources are in-situ without dilution and material loss at a cut-off grade of 0.01 oz/ton gold (0.33 g/tonne) for open pit and 0.088 oz/ton gold (3.0
g/tonne) for underground. (13) Indicated resources reported at a minimum mining width of 6.0 feet for Bulldog; resources based on $26.5 Ag, $0.85 Pb, and $0.85 Zn and a cut-off grade of 6.0 silver equivalent oz/ton.(14) Indicated and Inferred resources reported using $21 silver, $0.95 lead, $1.10 lead minimum mining width of 4.3 feet and a cut-off grade of $100/ton.(15) Inferred resources reported at a minimum mining width of 5.9 feet (1.8 m) for Hugh Zone, Middle Vein, North Vein, and East Francine Vein and 4.9 feet (1.5 m) for Andrea Vein using a cut-off grade of $90.72/ton ($100/tonne).
San Sebastian lead, zinc and copper grades are for 385,000 tons of inferred resource within the Middle Vein and the Hugh Zone of the Francine Vein. (16) Inferred open-pit resources for Fire Creek calculated November 30, 2017 using gold and silver recoveries of 65% and 30% for oxide material and 60% and 25% for mixed oxide-sulfide material. Indicated Resources reclassified
as Inferred for 2019. Open pit resources are calculated at $1400 gold and $19.83 silver and cut-off grade of 0.01 Au Equivalent oz/ton and is inclusive of 10% mining dilution and 5% ore loss. Open pit mineral resources exclusive of underground mineral resources.
NI43-101 Technical Report for the Fire Creek Project, Lander County, Nevada; Effective Date March 31, 2018; prepared by Practical Mining LLC, Mark Odell, P.E. for Hecla Mining Company, June28, 2018.(17) Inferred resources reported at a minimum mining width of 6.0 feet for Bulldog and a cut-off grade of 6.0 equivalent oz/ton silver and 5.0 feet for Equity and North Amethyst vein at a cut-off grade of $50/ton and $100/ton; based on
$1400 Au, $26.5 Ag, $0.85 Pb, and $0.85 Zn.(18) Inferred resource reported at a minimum mining width of 5.0 feet; resources based on $1400 Au, $26.5 Ag using a 0.06 oz/ton gold cut-off grade.(19) Inferred resource at Rock Creek reported at a minimum thickness of 15 feet and a cut-off grade of $24.50/ton NSR and adjusted given mining restrictions as defined by U.S. Forest Service, Kootenai National Forest in the June
2003 'Record of Decision, Rock Creek Project'.(20) Inferred resource at Montanore reported at a minimum thickness of 15 feet and a cut-off grade of $24.50/ton NSR and adjusted given mining restrictions defined by U.S. Forest Service, Kootenai National Forest, Montana DEQ in
December 2015 'Joint Final EIS, Montanore Project' * Totals may not represent the sum of parts due to rounding

NYSE: HL
Silver Gold Silver Gold2009 Proven Reserves Tons (oz/ton) (oz/ton) (ounces) (ounces)Greens Creek - - - - - Lucky Friday 1,358,200 12.30 - 16,640,300 -
2009 Probable ReservesGreens Creek 8,314,700 12.10 0.102 100,973,300 847,400 Lucky Friday 1,577,000 13.90 - 21,947,600 -
2010 Proven ReservesGreens Creek - - - - - Lucky Friday 1,642,100 12.40 - 20,387,600 -
2010 Probable ReservesGreens Creek 8,243,100 12.10 0.092 99,730,000 757,000 Lucky Friday 1,545,100 14.20 - 21,955,000 -
2011 Proven ReservesGreens Creek - - - - - Lucky Friday 2,345,500 12.60 - 29,573,900 -
2011 Probable ReservesGreens Creek 7,991,000 12.30 0.093 98,383,300 742,400 Lucky Friday 1,345,300 14.70 - 19,746,200 -
2012 Proven ReservesGreens Creek 12,000 9.30 0.095 112,500 1,100 Lucky Friday 2,206,600 12.10 - 26,778,900 -
2012 Probable ReservesGreens Creek 7,845,600 12.00 0.092 94,481,200 718,400 Lucky Friday 1,931,700 14.80 - 28,676,000 -
2013 Proven ReservesGreens Creek 14,000 12.90 0.130 182,000 2,000 Lucky Friday 3,708,000 12.10 - 44,892,000 -
2013 Probable ReservesGreens Creek 7,783,000 11.90 0.090 92,338,000 711,000 Lucky Friday 2,698,000 12.00 - 32,352,000 -
2014 Proven ReservesGreens Creek 4,700 15.70 0.100 74,000 5,000 Lucky Friday 3,840,000 13.70 - 52,556,000 -
2014 Probable ReservesGreens Creek 7,691,000 12.20 0.100 93,947,000 738,000 Lucky Friday 2,043,000 12.90 - 26,346,000 -
2015 Proven ReservesGreens Creek 10,000 20.80 0.120 210,000 1,000 Lucky Friday 3,510,000 16.50 - 57,961,000 -
2015 Probable ReservesGreens Creek 7,204,000 12.30 0.090 88,523,000 676,000 Lucky Friday 1,557,000 13.30 - 26,346,000 -
2009 – 2019 RESERVE TABLE
RESPONSIBLE. SAFE. INNOVATIVE. l 112
Silver Gold Silver Gold2016 Proven Reserves Tons (oz/ton) (oz/ton) (ounces) (ounces)Greens Creek 9,000 15.50 0.090 140,000 1,000 Lucky Friday 3,308,000 17.50 - 57,925,000 - San Sebastian 43,000 23.40 0.190 1,008,000 8,000 Casa Berardi 2,575,000 - 0.110 - 272,000
2016 Probable ReservesGreens Creek 7,585,000 11.70 0.090 88,729,000 672,000 Lucky Friday 1,542,000 12.90 - 19,912,000 - San Sebastian 283,000 16.20 0.100 4,593,000 29,000 Casa Berardi 7,752,000 - 0.130 - 1,037,000
2017 Proven ReservesGreens Creek 7,000 12.20 0.090 89,000 1,000 Lucky Friday 4,246,000 15.40 - 65,448,000 - San Sebastian 31,000 23.30 0.190 712,000 6,000 Casa Berardi 2,458,000 - 0.130 - 312,000
2017 Probable ReservesGreens Creek 7,543,000 11.90 0.100 90,130,000 725,000 Lucky Friday 1,387,000 11.40 - 15,815,000 - San Sebastian 368,000 13.10 0.100 4,809,000 37,000 Casa Berardi 11,413,000 - 0.100 - 1,181,000
2018 Proven ReservesGreens Creek 6,000 13.80 0.100 86,000 1,000 Lucky Friday 4,230,000 15.40 - 65,234,000 - San Sebastian 22,000 3.90 0.080 85,000 2,000 Casa Berardi 6,790,000 - 0.080 - 563,000 Fire Creek 24,000 1.10 1.210 27,000 29,000 Hollister 2,000 7.00 0.730 17,000 2,000
2018 Probable ReservesGreens Creek 9,270,000 11.50 0.090 106,972,000 840,000 Lucky Friday 1,387,000 11.40 - 15,815,000 - San Sebastian 206,000 12.30 0.100 2,790,000 23,000 Casa Berardi 16,954,000 - 0.080 - 1,343,000 Fire Creek 91,000 0.30 0.440 30,000 40,000 Hollister 9,000 7.20 0.650 66,000 6,000
2019 Proven ReservesGreens Creek 7,000,000 14.80 0.080 106,000,000 1,000,000 Lucky Friday 4,185,000 15.40 - 64,506,000 - San Sebastian 35,000 4.80 0.080 166,000,000 3,000,000 Casa Berardi Open Pit 5,873,000 - 0.080 - 447,000 Casa Berardi UG 974,000 - 0.060 - 156,000 Fire Creek 22,000 1.20 1.510 28,000 33,000
2019 Probable ReservesGreens Creek 10,713,000 12.20 0.090 130,791,000 932,000 Lucky Friday 1,386,000 11.40 - 15,815,000 - San Sebastian 66,000 10.90 0.070 716 5,000 Casa Berardi Open Pit 11,802,000 - 0.070 - 305,000 Casa Berardi UG 1,978,000 - 0.150 - 305,000 Fire Creek 37,000 0.60 0.560 23,000 21,000

NYSE: HL
RESPONSIBLE. SAFE. INNOVATIVE.
COMPANY OVERVIEW
END
June 2021