heavy metal contamination in muscle tissue of four key...
TRANSCRIPT

Heavy metal contamination in muscle
tissue of four key recreational fish
species from the Derwent Estuary
Jeremy Verdouw
Research Thesis submitted in partial fulfilment of the requirements for
Honours in Aquaculture
National Centre for Marine Conservation and Resource Sustainability
University of Tasmania
2008

2
Declaration
I hereby declare that this thesis contains no material which has been accepted for a degree or
diploma by the University or any other institution and that, to the best of my knowledge this
thesis contains no material previously published or written by another person, except where
due acknowledgment is made.
Jeremy Verdouw

3
Acknowledgements
I would like to thank Leigh Mackenzie, Alister Clarke, Plinio Taurian, Mark Stalker and
Andrew Hunt for providing invaluable field support in the collection of fish. Thanks must
also go to Graeme Ewing for his practical and theoretical advice on fish processing and aging.
I am very thankful to Alison Featherstone, Stuart Black and Damien Norman from Analytical
Services Tasmania for all their hard work, advice and cooperation (using their gear); to
Zinifex (Nystar) and Fishwise for their generous financial support in completing the heavy
metal analyses. Finally, I am very much indebted to my three supervisors, Catriona Macleod,
Jeremy Lyle and Barbara Nowak, firstly for the opportunity to undertake this project, and
secondly for their extensive and invaluable practical and theoretical advice which helped me
greatly in completing this study.

4
Table of Contents
1. ABSTRACT ................................................................................................................................................. 6
2. INTRODUCTION ....................................................................................................................................... 7
3. METHODS................................................................................................................................................. 13
3.1 STUDY SITE ......................................................................................................................................... 13
3.2 STUDY SPECIES ................................................................................................................................... 16
3.2.1 Sand flathead (Platycephalus bassensis)....................................................................................... 17
3.2.2 Black bream (Acanthopagrus butcheri) ........................................................................................ 18
3.2.3 Sea-run trout (Brown trout- Salmo trutta) ................................................................................... 19
3.2.4 Yellow-eye mullet (Aldrichetta forsteri) ....................................................................................... 19
3.3 SAMPLE COLLECTION AND PROCESSING.............................................................................................. 20
3.4 AGE DETERMINATION ......................................................................................................................... 22
3.4.1 Preparing of otolith sections ......................................................................................................... 22
3.4.2. Increment counting........................................................................................................................ 22
3.4.3 Validation and precision of age estimates..................................................................................... 24
3.5 HEAVY METAL ANALYSIS ................................................................................................................... 25
3.5.1 Analysis of general heavy metal suite .......................................................................................... 25
3.5.2 Analysis of mercury....................................................................................................................... 26
3.5.3 Quality control of metal analyses.................................................................................................. 27
3.6 DATA ANALYSIS ................................................................................................................................. 28
4. RESULTS................................................................................................................................................... 30
4.1 OVERALL HEAVY METAL LEVELS........................................................................................................ 30
4.2 INTER-SPECIFIC COMPARISONS ........................................................................................................... 33
4.3 INTRA-SPECIFIC COMPARISONS ........................................................................................................... 36
4.3.1 Gender........................................................................................................................................... 36
4.3.2 Fish age and length....................................................................................................................... 37
4.4 INTER-METAL RELATIONSHIPS ............................................................................................................ 39
4.5 FLATHEAD REGIONAL COMPARISON ................................................................................................... 40
4.6 TROPHIC STATUS OF SELECTED SPECIES .............................................................................................. 46
5. DISCUSSION............................................................................................................................................. 47
5.1 FACTORS INFLUENCING METAL LEVELS BETWEEN SPECIES ................................................................. 47
5.2 REGIONAL VARIABILITY IN FLATHEAD................................................................................................ 55
5.3 IMPLICATIONS FOR PUBLIC HEALTH .................................................................................................... 59
5.4 CONCLUSIONS..................................................................................................................................... 62

5
5.5 FUTURE RESEARCH AND MANAGEMENT IMPLICATIONS....................................................................... 62
6. REFERENCES .......................................................................................................................................... 65
APPENDIX 1....................................................................................................................................................... 72
HEAVY METAL ANALYSIS PROTOCOLS .............................................................................................................. 72
AST QUALITY CONTROL SAMPLES (AS OUTLINED BY AST METHODS) .............................................................. 72
APPENDIX 2....................................................................................................................................................... 74
PLOTS OF BETWEEN METAL CORRELATIONS ...................................................................................................... 74
APPENDIX 3....................................................................................................................................................... 77
MERCURY ACCUMULATION IN MARINE FISH: A LITERATURE REVIEW.................................... 77

6
1. Abstract
This study measured levels of mercury, arsenic, cobalt, chromium, copper, iron, manganese,
nickel, lead, selenium and zinc in the muscle tissue of four key recreational fish species;
yellow-eye mullet (Aldrichetta forsteri), black bream (Acanthopagrus butcheri), sand flathead
(Platycephalus bassensis) and sea-run trout (Salmo trutta) from the Derwent Estuary. The
effects of diet, age, length, gender and region on metal levels were examined for each species
and levels were compared to Australian food standards to examine the risk to human health of
consumption of these species. Mean mercury levels in the muscle tissue of black bream (1.57
mg/kg), sea-run trout (0.68 mg/kg) and sand flathead (0.53 mg/kg) exceeded the maximum
permitted level of 0.5 mg/kg for mercury in seafood as prescribed by Food Standards
Australia and New Zealand (FSANZ). The significantly (P<0.05) higher levels in black bream
were considered to be of a particular human health concern. Mean levels for all other metals
were below the maximum permitted and generally expected levels (FSANZ) for all species
and therefore pose little threat to human health. Significant (P<0.05) inter-species and intra-
species differences were apparent for mercury, arsenic, copper, iron, manganese, zinc and
lead. Diet and age were likely to have the largest influence on differences in metal levels
between species. Gender was found to significantly (P<0.05) influence levels of arsenic, iron
and copper within species, whilst age and length were found to significantly (P<0.05)
influence levels of mercury, zinc, and arsenic. Significant (P<0.05) regional differences were
apparent for mercury levels in the muscle tissue of sand flathead. In contrast to sediment
levels, the highest mercury concentrations were in sand flathead from Ralphs Bay which is
some distance from the most contaminated region of the estuary. Age was found to be the best
predictor of mercury in sand flathead from the Derwent Estuary.

7
2. Introduction
Heavy metals occur naturally in the environment. Some are essential for normal function in
humans and animals (Pourang, 1995) such as, copper, iron, manganese and zinc; whereas
other metals such as mercury, cadmium and lead are not required even in small amounts by
any organism (Laws, 2000). Almost all metals, including the essential ones, are toxic to
animals and humans if levels exceed certain thresholds (Laws, 2000; Carvalho et al., 2005).
The toxicity of metals varies substantially and is largely due to their ability to interfere with
enzyme-mediated processes and disruption of cellular structure (Laws, 2000). Health effects
in humans contaminated by elevated metal levels include neurological disorders, bone
deterioration, cancer and immune system disorders (Jarup, 2003). From a human health
perspective, the primary contaminants of concern are mercury, arsenic, cadmium and lead
(Burger, 2007). The major route of exposure of these metals to humans is either through
direct contact or indirectly through ingestion of food, particularly seafood (Jarup, 2003).
The potential for heavy metal contamination to negatively affect human health has resulted in
many studies into heavy metal levels in fish and shellfish species, particularly in regions
heavily impacted by anthropogenic inputs (Ratkowsky et al., 1975; Walker, 1982; Fabris et
al., 1992). Levels of contaminants in fish are of interest not only because of the potential
effects on the fish themselves, but also because of the effects on organisms that consume
them, such as higher order predators and humans (Hylland et al., 2006). Guidelines on the
maximum permitted levels of metals in seafood have been introduced in many parts of the
world for the safe consumption of fish species (Adams and McMichael, 1999). Studies and
monitoring programs examining heavy metal levels in fish are becoming more and more

8
important, especially in less developed parts of the world where fish provide the major source
of protein (Toth and Brown, 1997; Burger et al., 1999a; Burger et al., 1999b). Even in more
affluent areas, fish are being consumed increasingly as an essential health food (Gislason et
al., 2000; Carvalho et al., 2005). Fish is promoted as a healthy and nutritious component of a
balanced diet, and an important source of proteins and lipids, including long chain
polyunsaturated fatty acids, and also of liposoluble vitamins (Egeland and Middaugh, 1997;
Han, 1998; Carvalho et al., 2005). Studies indicate that people who include fish in their diet
have a lower risk of coronary heart disease, hypertension, and cancer (Egeland and Middaugh,
1997). Thus, globally, fish assume great importance and consumption is increasing (Carvalho
et al., 2005). However, in contrast fish can be a source of contamination. In some
circumstances they can contain amounts of heavy metals which are highly toxic (Egeland and
Middaugh, 1997; Carvalho et al., 2005).
The concentration of heavy metals in fish is influenced by several factors; in particular
biological differences (eg. species, size, age, gender, sexual maturity, diet) and environmental
differences (eg. water chemistry, salinity, temperature, and levels of contamination) (Carvalho
et al., 2005). Numerous studies have shown that heavy metal accumulation in fish is strongly
influenced by environmental concentrations, that is, the levels in the water and sediments
(Blevins and Pancorbo, 1986; Calta and Canpolat, 2006). However, metal accumulation has
been found to vary markedly between species in the same area, as a result of differences in
feeding habits (Calta and Canpolat, 2006) and position in the food chain (Asuquo et al.,
2004). Differences within species have been described in response to location (Asuquo et al.,
2004), fish age/size (Calta and Canpolat, 2006), gender (Pourang, 1995) and life history stage.

9
Metals may be introduced into aquatic systems in several ways; including natural weathering
of rocks and volcanic eruptions, and human activities such as mining, ore refining and other
metal-based industries (Laws, 2000). Human activity is increasingly contaminating aquatic
environments with heavy metals (Park and Curtis, 1997). Since some of the most heavily
industrialised areas of the world are sited on the banks of estuaries, these waters are
particularly at risk from heavy metal contaminates (Birch, 2000). In the past, metallic wastes
have been discharged into rivers and estuaries based on the assumption that they would be
carried to the open sea and dispersed (Bloom and Ayling, 1977; Birch 2000). The reality is
somewhat different, with studies showing that estuaries can efficiently trap heavy metals in
sediments (Bryan, 1980; Birch, 2000). The deposition of high concentrations of heavy metals
in the sediments of many estuaries (and other confined water bodies) provides a sink for
continued contamination even in the absence of further input (Bryan, 1980; Williamson and
Morrisey, 2000). Whilst estuaries may be subjected to significant water pollution, their
sheltered waters also support unique communities of aquatic plants and animals (Edgar et al.,
1999) and provide important nursery grounds and habitats for many fish species (Correll,
1978; Edgar et al., 1999; Jones et al., 2003). This is of particular concern because fish and
shellfish living in contaminated waters readily accumulate metals and pose a risk to human
health if consumed (Han et al., 1998).
The Derwent Estuary in south eastern Tasmania is surrounded by the city of Hobart and the
greater metropolitan area. The estuary is particularly important from a recreational and
environmental perspective (Green and Coughanowr, 2003). Many birds, mammals, fish and
invertebrates depend on the estuarine habitats of the Derwent for shelter, food and
reproduction (Green and Coughanowr, 2003). The Derwent Estuary is also used widely for
recreational activities; particularly swimming, water skiing, windsurfing, scuba diving,
snorkelling and fishing (Green and Coughanowr, 2003). In addition, the Derwent Estuary

10
supports a significant recreational fishery; with the upper estuary being extensively fished for
sea-run trout and black bream, whilst the lower reaches are fished for a range of species
including sand flathead, Australian salmon, yellow-eye mullet, whiting and flounder (Green
and Coughanowr, 2003; Lyle, 2005). It has been estimated that approximately 4,000
recreational anglers fish in the Derwent in any year (Green and Coughanowr, 2003). In
addition the lower reaches of the estuary are also open to commercial fishing, particularly for
whiting and flathead (Lyle, 2005).
Despite its natural values and many recreational uses the Derwent Estuary water, sediment
and biota are all severely contaminated with heavy metals (Bloom, 1975; Green and
Coughanowr, 2003). Metals enter the Derwent via a number of pathways including air
emissions, treated effluent, stormwater run off, ground water seepage and spills (Green and
Coughanowr, 2003). However, the main source is historical industrial effluent from the zinc
smelter in the mid estuary and paper mill in the upper estuary (Eustace, 1974; Bloom, 1975;
Green and Coughanowr, 2003). The main heavy metal pollutants from industry are mercury,
cadmium, lead and zinc (Green and Coughanowr, 2003). Metal levels in the Derwent
sediments are among the highest in the world and levels of cadmium, lead and zinc in oysters
and mussels are also extremely high in comparison to food standards (Bloom, 1975; Cooper
et al., 1982; Green and Coughanowr, 2003). Studies by Eustace (1974), Ratkowsky et al.
(1975) and Dix et al. (1975) were the first to examine metal levels in Derwent Estuary fish
and found that levels of most metals were well below maximum permitted levels for seafood,
with the exception of mercury which exceeded maximum permitted levels in several fish
species including flathead and various sharks. A 25-year monitoring program on mercury
levels in sand flathead (Platycephalus bassensis) in the Derwent Estuary as part of the Zinifex
(Nystar) Seafood Monitoring Program showed mercury levels in some regions to be markedly

11
higher than the safe maximum permitted level for consumption (Green and Coughanowr,
2003; FSANZ, 2007). However, there are no recent data on metal levels in other important
recreational fish species in the Derwent Estuary, or on the levels of any metals besides
mercury in flathead. To characterise the potential risk of heavy metals in fish to consumers, it
is essential to obtain contemporary data on the levels of a range of metals in a variety of fish
species, in particular those that are recreationally important. In addition, there is also a need to
understand how environmental conditions and biological factors might influence metal levels
in fish from the Derwent Estuary to identify other species which consumption may be a threat
to human health and to aid in the understanding of how metal levels are accumulated by fish.
Furthermore, no study has comprehensively compared metal levels with age in fish in the
Derwent Estuary. This is despite the fact that there is much evidence for the increased
accumulation of mercury and to a lesser extent arsenic with increasing age and/or size
(Mackay et al., 1975; Ashraf and Jaffar, 1988; Hornung et al., 1993). Understanding the
relationship of age/size with metal levels for a given species is particularly important from a
human health perspective as it may influence the metal loading, and hence, potential health
effects of consumption.
This study will firstly compare metal levels (mercury, arsenic, cobalt, chromium, copper, iron,
manganese, nickel, lead, selenium and zinc) in four key recreational species of fish from the
Derwent Estuary to Food Standards Australia and New Zealand (FSANZ) guidelines on fish
consumption. Secondly, it will examine inter-specific differences in metal levels in relation to
diet/trophic status and age/size as well as within species differences with respect to age, size,
gender and for sand flathead, region of capture.

12
The primary objectives of this study are to:
(1) Compare metal concentrations in four key recreational fish species (muscle tissue)
from the Derwent Estuary to Australian food standards.
(2) Examine relationships between heavy metal accumulation with and age/size,
diet/trophic position, gender and region (sand flathead).
(3) Provide a comprehensive baseline data set for future research and long-term
studies.

13
3. Methods
3.1 Study site
The present study was undertaken in the Derwent Estuary in southern Tasmania, Australia
(Figure 1). The city of Hobart surrounds the Derwent Estuary and approximately 40% of
Tasmania’s population live around the estuary (Green and Coughanowr, 2003). The estuary
effectively spans from the township of New Norfolk to Storm Bay, a distance of
approximately 52 km (Figure 1) (Green and Coughanowr, 2003). For the purposes of this
study the estuary was divided into four sampling regions consistent with those used by
Eustace (1974), Ratkowsky et al. (1975) and the Zinifex (Nystar) seafood sampling program
over the past 30 years (Green and Coughanowr, 2003). The regions were: 1) North of Tasman
Bridge (Tasman Bridge to New Norfolk), 2) Western shore, 3) Eastern shore, and 4) Ralphs
Bay (Figure 1) with two or more sampling sites within each region (Table 1). The regions
were distinguished on the basis of particular differences in their hydrography, sediment heavy
metal loading and previous biological information (Eustace, 1974; Ratkowsky et al; 1975;
Jones et al., 2003).
Region 1 (Tasman Bridge to New Norfolk) is a graduating zone of sea water to fresh water
and is the most heavily impacted from industrial inputs. Regions 2 (Western shore) and 3
(Eastern shore) are primarily marine and can be divided into east (Region 3) and west (Region
2) due to the fact that river flow is more distinct on the east (Jones et al., 2003). Ralphs Bay
can be considered a further subdivision of the marine zone, since it has distinct physical
differences to the other regions (Jones et al., 2003) and previous studies have shown it to
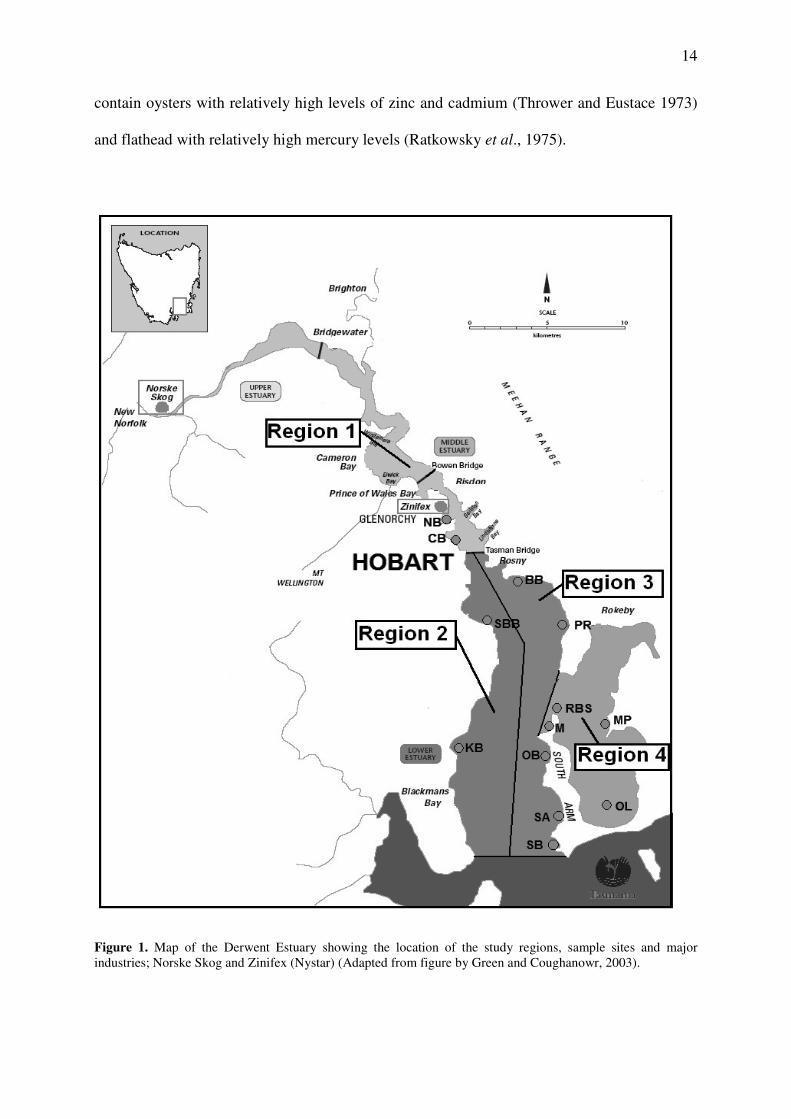
14
contain oysters with relatively high levels of zinc and cadmium (Thrower and Eustace 1973)
and flathead with relatively high mercury levels (Ratkowsky et al., 1975).
Figure 1. Map of the Derwent Estuary showing the location of the study regions, sample sites and major
industries; Norske Skog and Zinifex (Nystar) (Adapted from figure by Green and Coughanowr, 2003).

15
Sand flathead were also sampled from Mickey’s Bay off the south of Bruny Island (Figure 2).
Previous data have indicated that it is relatively unaffected by pollution (sand flathead
mercury levels are well below guidelines) and therefore can be considered a control region
(Green and Coughanowr, 2003).
Figure 2. Map of the D’Entrecasteaux Channel showing the location of the control region, Mickeys Bay off the
south of Bruny Island (Adapted by figure from www.wildthingadventures.com.au).

16
Table 1. Region and sites where sand flathead were sampled from during this study.
Region No. Region Name Sites
1 New Norfolk to Tasman Bridge Cornelian Bay- CB
Newtown Bay- NB
2 Western Shore Kingston Beach- KB
Sandy Bay Beach- SBB
3 Eastern Shore Seacroft Bay- SB
South Arm- SA
Opossum Bay- OB
Marralyne- M
Punches Reef- PR
Bellerive Beach- BB
4 Ralphs Bay Ralphs Bay Spit- RBS
Maria Point- MP
Old Lease- OL
5 (control) Mickeys Bay Mickeys Bay
3.2 Study species
Species were selected based on the following criteria:
1) Recreationally caught in the Derwent Estuary (Morton et al., 2005)
2) Recognised as good eating fish and commonly consumed (DPIW, 2007; IFS,
2007)
3) Relatively easily caught (DPIW, 2007; IFS, 2007)
4) Displaying markedly different foraging behaviours and life history traits
(Morton et al., 2005)
17
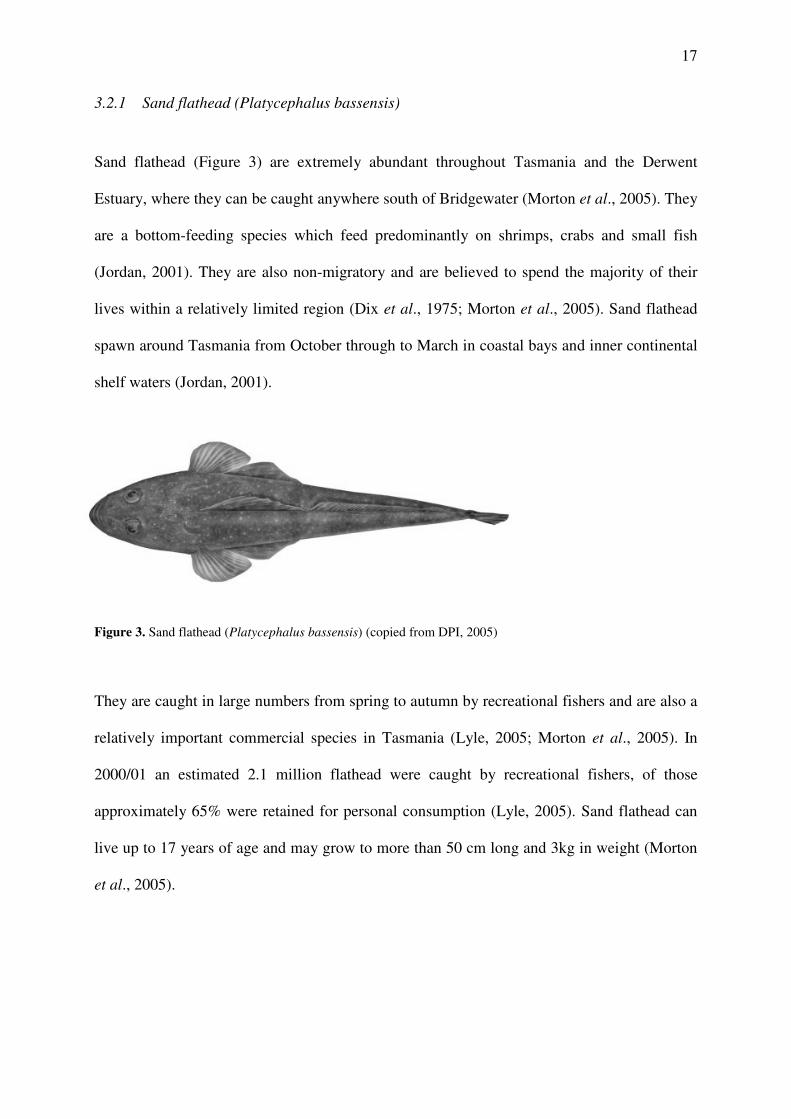
3.2.1 Sand flathead (Platycephalus bassensis)
Sand flathead (Figure 3) are extremely abundant throughout Tasmania and the Derwent
Estuary, where they can be caught anywhere south of Bridgewater (Morton et al., 2005). They
are a bottom-feeding species which feed predominantly on shrimps, crabs and small fish
(Jordan, 2001). They are also non-migratory and are believed to spend the majority of their
lives within a relatively limited region (Dix et al., 1975; Morton et al., 2005). Sand flathead
spawn around Tasmania from October through to March in coastal bays and inner continental
shelf waters (Jordan, 2001).
Figure 3. Sand flathead (Platycephalus bassensis) (copied from DPI, 2005)
They are caught in large numbers from spring to autumn by recreational fishers and are also a
relatively important commercial species in Tasmania (Lyle, 2005; Morton et al., 2005). In
2000/01 an estimated 2.1 million flathead were caught by recreational fishers, of those
approximately 65% were retained for personal consumption (Lyle, 2005). Sand flathead can
live up to 17 years of age and may grow to more than 50 cm long and 3kg in weight (Morton
et al., 2005).

18
3.2.2 Black bream (Acanthopagrus butcheri)
Black bream (Figure 4) are commonly found in estuaries and lower reaches of rivers in
southern Australia, including the Derwent Estuary (Edgar, 1997). They are euryhaline and
may sometimes be found in fresh water (Morton et al., 2005). Black bream are primarily a
bottom feeder, consuming prey such as sandworms, mussels, crabs and pilchards (Morton et
al., 2005; R. Sakabe, pers. comm., 2007). Evidence from tagging studies indicates that bream
largely remain within a river or estuary throughout their life with little movement between
systems (Potter and Hyndes, 1999; R. Sakabe, unpubl. data., 2007).
Figure 4. Black bream (Acanthopagrus butcheri) (DPI, 2005)
In Tasmania, black bream spawn from spring through to mid summer (R. Sakabe, pers.
comm., 2007). They are commonly targeted by anglers, particularly in the upper reaches of
the Derwent Estuary (Morton et al., 2005). In 2000/01 the estimated recreational catch was
estimated at 76,500 individuals with approximately 46,000 retained (Lyle, 2005). Black
bream are a long-lived species, with individuals in excess of 20 years being recorded
(Morison et al., 1998; R.Sakabe, pers.comm., 2007). Growth is slow and they mature at about
4 years reaching a maximum size of around 60 cm in length and 4 kg in weight (Morton et al.,
2005).

19
3.2.3 Sea-run trout (Brown trout- Salmo trutta)
The brown trout (Figure 5) is an introduced species keenly sought after by anglers in rivers
and lakes, but they also occur in estuarine and marine waters, then known as sea-run trout
(Edgar, 1997). They are commonly caught in the upper reaches of the Derwent Estuary, from
the Tasman Bridge and above (DPIW, 2007). Sea-run trout smoltify in spring and migrate to
salt water coastal areas to feed during summer (Cucherousset et al., 2005). They are
opportunistic consumers, predominantly feeding on whitebait (IFS, 2007).
Figure 5. Sea-run trout (Brown trout- Salmo trutta)
(http://pond.dnr.cornell.edu/nyfish/Salmonidae/brown_trout.html)
Sea-run trout are commonly caught by line from August to the end of summer (IFS, 2007).
They are known to reach a maximum size of 90 cm (14 kg) and live to around 9 years of age
(Graynoth, 1996; IFS, 2007).
3.2.4 Yellow-eye mullet (Aldrichetta forsteri)
Yellow-eye mullet (Figure 6) are the most common mullet species in Australia (Edgar, 1997).
They are extremely abundant in southern Australian estuaries, and are a popular fish for

20
human consumption, with around 1000 tonnes per year commercially caught in Victoria
(Edgar, 1997).
Figure 6. Yellow-eye mullet (Aldrichetta forsteri) (DPIW, 2007)
Yellow-eye mullet are a migratory species which are known to change diet with age; juveniles
feed on planktonic animals, medium sized fish feed on benthic crustaceans and molluscs and
the larger fish feed almost exclusively on algae (Edgar, 1997). They are highly abundant in
the inshore estuarine areas of the Derwent Estuary, from the Bridgewater Bridge and down
stream (DPIW, 2007). They can be caught all year round in gill nets and by line fishing. They
live to around 13 years of age and may attain a maximum size of 40 cm (DPIW, 2007).
3.3 Sample collection and processing
Sand flathead, black bream, sea-run trout and yellow-eye mullet were sampled both from the
shoreline and from research vessels in the Derwent Estuary between the 28th
of July and the
28th
of November, 2007 by TAFI staff and recreational fishers using both line fishing and gill
netting (Table 2). On each sampling trip the date, location, species and fishing method were
recorded. All fish were euthanized by immersion in a clove oil seawater solution (3 mL of
clove oil to 30 L of seawater) in accordance with University Ethics Approval.

21
Table 2. Collection dates, method of collection, region and number of fish sampled by species in the Derwent
Estuary.
Fish were labelled and held on ice after which they were transported to the Marine Research
Laboratories (MRL) in Taroona, and stored in a -18oC freezer until required for processing. In
addition several fish were collected by recreational fishers, and either whole fish or frames
(with muscle tissue attached and gut contents intact) bagged individually and frozen. Fish
sampling targeted a range of sizes for each species (including below legal size fish). Flathead
were sampled from all regions, bream and mullet were sampled from region 1 and sea-run
trout were sampled from regions 1 and 3 (Table 2).
Each fish was measured to the nearest millimetre (total and fork length) and weighed to the
nearest gram. Fish were dissected and stomach contents removed, weighed and then identified
into the lowest easily recognisable taxonomic groups. The fish were sexed and gonads
removed and weighed. A sample of muscle tissue (approximately 50 g) was removed from
each fish from the area posterior of and adjacent to the pectoral fin. The muscle tissue was
placed in a labelled plastic zip-lock bag and stored at -18oC until further processing. Sagittal
otoliths (here after ‘otoliths’) were extracted using fine tipped forceps, cleaned, dried and
stored in plastic sample containers.
Species Sampling Period Method Region n Total
Sand flathead 6/10/07 to 23/11/07 line 1 30
2 30
3 30
4 30
5 30 150
Black bream 12/9/07 to 29/10/07 line 1 28 28
Sea-run trout 16/8/07 to 11/10/07 line 1 20
3 5 25
Mullet 28/7/07 to 28/11/07 line and gill net 1 27 27

22
3.4 Age determination
3.4.1 Preparing of otolith sections
Methods used for fish aging were based on those reported by Ewing et al. (2007). One otolith
from each fish (either the right or left otolith) was mounted in a block of polyester casting
resin and sectioned with a diamond gem saw transversely through the primordium to a
thickness of 500 to 600 µm. Between 3 and 6 sections were cut from each otolith to ensure the
primordium was represented in at least one of the sections. Sections were cleaned and
mounted in polyester resin on glass microscope slides under cover slips.
3.4.2. Increment counting
The transverse otolith sections showed alternating bands of wide translucent and narrower
opaque zones extending from an inner zone when examined by a stereo-microscope (20× to
25× magnification) under transmitted light (Figure 7). The zones adjacent to the inner zone
were relatively broad and decreased in width out to the growing edge. Ages were estimated by
counting the opaque zones on the section closest to the primordium along a transect between
the primordium and the outer edge of the section on either the dorsal or ventral side of the
sulcus (Figure 7). Otoliths were rejected if the opaque zones were optically unreadable or if
the primordium could not be identified. Leica IM50 image analysis software was used to aid
in the counting and marking of increments and to make measurements on the image. To
eliminate bias, otoliths were examined with no knowledge of fish size, sex or date of capture.

23
Figure 7. A representative transverse otolith section from an Acanthopagrus butcheri sample (transmitted light).
Opaque zones are marked and numbered and the age calculated from this count was 25 years.
Counts of opaque zones commenced from, and included, the first opaque zone (zone
immediately after the first translucent zone) (Figure 7). To aid in the identification of the first
opaque zone, measurements were made from the primordium to the inner side of the first
opaque zone (the transverse radius). The first opaque zone in all species was dimensionally
stable. The mean transverse radius for the various species were; flathead 1300 µm (n = 150,
SE = 17), bream 1355 µm (n = 27, SE = 31), trout 1400 µm (n = 25, SE = 43) and mullet
1270 µm (n = 28, SE = 30). Counts of opaque zones were converted to age estimates (Table
3) by adding one year to the total count of opaque zones to take into account the date of
capture relative to the estimated closing date of the last opaque zone.
Primordium
Sulcus

24
3.4.3 Validation and precision of age estimates
Age determination by counting the increments of sectioned otoliths has been previously
validated for sand flathead (Jordan et al., 1998), black bream (Morison et al., 1998; R.
Sakabe, unpubl. data., 2007), sea-run trout (brown trout) (Graynoth, 1996; IFS, 2003) and
yellow-eye mullet (Curtis and Shima, 2005). This study therefore followed the methods of
increment interpretation used by these authors for the respective fish species.
Otoliths were read by a primary reader (author, Reader A) who examined all otoliths twice
(n=230). A second reader, experienced in examination of transverse sagittal otolith sections
(Reader B), read a random sub-sample of 80 otoliths (20 from each species). The age
estimates between and within readers were examined from tables of difference of readings
against age, and quantified with the index of average percent error (APE) as a recommended
measure of precision (Beamish and Fournier, 1981). APE scores for within reader differences
were all below 1% (flathead 0.57%, mullet 0.15%, trout 0.38%, and bream 0.00%) with a
maximum difference of 1 zone, indicating a very high mean level of agreement. The APE
scores for between reader differences were: flathead 5.53%, mullet 1.84%, trout 13.75% and
bream 1.18%. The maximum difference between counts was 3. These results indicate that age
estimates of all species except trout were accurate and, with little variation in the reading
process. Estimates of trout age differed between readers more so than the other species,
reflecting the sometimes unclear otolith sections. However, variability was still within
acceptable levels.

25
3.5 Heavy metal analysis
All tissue samples were analysed for the following metals: mercury, arsenic, cadmium, cobalt,
chromium, copper, iron, manganese, nickel, lead, selenium and zinc. All the metals, with the
exception of mercury, were analysed from a single tissue sample using the same method.
Mercury analysis required a different method and therefore was undertaken on a separate
tissue sample. All measurements of metal levels were recorded as milligrams per kilogram
(mg/kg) wet weight (wet wt.)
3.5.1 Analysis of general heavy metal suite
Tissue samples were defrosted by placing them in a fridge over-night. Approximately 12 g of
muscle tissue was removed from the anterior end of the fillet using a scalpel on a ceramic
chopping board. Skin and bones were removed from each tissue sample. Individual samples
were placed on weighed, acid washed watch glasses before being weighed on an electronic
balance (Mettler Pj3600 Balance, Switzerland) (all weights in grams to 2 decimal places).
Samples were then dried for a minimum of 18 hours in a 105oC oven (FSE Scientific OG24
SE3, Australia).
Samples were reweighed in order to calculate the dried matter fraction (DMF). The dried
tissue was scraped into an acid washed ceramic mortar and pestle and ground to a fine
powder. The ground sample was then placed in a labelled plastic zip-lock bag and stored
frozen prior to acid digestion. To minimise any chance of contamination, cutting utensils and
boards were thoroughly rinsed with deionised water and dried between samples. The mortar
and pestle were washed using the following process between samples: 1) rinsed with tap

26
water, 2) rinsed with 1% HNO3, 3) rinsed with deionised water, 4) rinsed with acetone, and 5)
dried with paper towel.
Approximately 1.00 g ±0.5 of dried sample was accurately weighed into a 50 mL digestion
tube to which 10 mL of concentrated (65%) nitric acid (HNO3) was added. The tube was
covered with a watch glass and left to stand for 12 h under a fume hood before digestion on
an Aim 500 Digestion Block using program number 2 (appendix 1). Up to 50 samples could
be digested at any one time. Each digestion run included a reagent blank, a laboratory
reference material (LRM), a blank matrix spike, two sample duplicates and two sample matrix
spikes (appendix 1). Once the program had ceased the samples were allowed to cool before 10
mL of hydrogen peroxide (H2O2) was added. The samples were then digested for a second
time using program number 3 (appendix 1). On completion of this program, samples were
again allowed to cool before filling the tubes up to the 50 mL mark with deionised water. The
sample solutions were then mixed thoroughly and transferred to a 50 mL Stardset tube.
Particulate matter was allowed to settle and then the sample was filtered through a 0.45 µm
filter to remove any suspensions. Heavy metals were analysed using an inductively coupled
plasma atomic emission spectrophotometer (Varian 730ES, Australia). All heavy metal
analyses were undertaken by Analytical Services Tasmania, a NATA accredited analytical
service provider. The method reporting limits were 0.1 mg/kg for all metals except selenium
which had a method reporting limit of 0.5 mg/kg.
3.5.2 Analysis of mercury
Samples were defrosted as previously described and approximately 1.00 g ± 0.5 of tissue was
weighed into a 50 mL digestion tube along with 5 mL of mercury digestion acid (HNO3 67%

27
v/v plus H2SO4 33% v/v). All tubes were capped with a small watch glass before being placed
on a digestion block set on program number 4 (appendix 1). As with the total metals, up to 50
samples could be digested at a time, with a reagent blank, a blank matrix spike, two sample
duplicates and two sample matrix spikes included in each digestion. Once the program was
completed, sample tubes were allowed to cool before adding 15 mL of KMnO4 solution and 5
mL of K2S2O8 solution and mixing with a vortex mixer. The sample solutions were left to
stand for 12 h prior to checking for colour change to purple. If the solutions were clear or
brown an additional 5 mL of KMnO4 solution was added and the samples were left to stand
for another 12 h. Sample solutions were then transferred to a 50 mL Stardset tube. Samples
were decolourised by the addition of 10 mL of hydroxylamine-HCl solution. They were then
made up to 50 mL with deionised water and mixed before being diluted 1:5 with 10%
digestion acid. Mercury samples were analysed by Cold Vapour Atomic Fluorescence
Spectrometry (CV- AFS) on an atomic fluorescence analyser (Melenium Merlin, United
Kingdom). All mercury analyses were undertaken by Analytical Services Tasmania and the
method reporting limit was 0.02 mg/kg.
3.5.3 Quality control of metal analyses
The analysis of the heavy metal suite met the quality control standards for all batches, whilst
analysis of mercury met the quality control standards with the exception of two minor
breaches. In one batch a blank matrix spike exceeded the theoretical value by 26% (25% is
allowed) (Appendix 1). This was considered a very marginal breach and no repeat analysis
was deemed necessary. In the same batch, the preparation blank exceeded the minimum
reportable level of (0.02 mg/kg) (Appendix 1). In this instance it was still determined that
blank subtraction was not appropriate as the levels were too low to have any measurable

28
effect on the results. The results of the quality control suggest that overall the metal levels
detected in all the samples were reliable (see Appendix 1 for full detail of quality controls).
3.6 Data analysis
Statistical computations were carried out using SPSS and PRIMER software. Analysis of
variance (ANOVA) was used to test for inter-species differences, intra-species differences
between sexes, and regional differences in metal levels in flathead. In all cases the type III
sums of squares was used to test the null hypothesis. This was appropriate for the study
because the experimental design was unbalanced. Assumptions of homogeneity and normality
of data were assessed through examination of residual plots and data were appropriately
transformed where assumptions of homogeneity were not met (transformations are identified
where applied). For all ANOVAs, significance value was set at P<0.05. Where effects were
significant, TUKEY pair-wise post hoc tests were used to further examine these differences.
Multivariate analysis of metal levels in flathead by region was performed using PRIMER.
Principle Components Analysis (PCA) was applied to the metal data for individuals. The data
were transformed to account for the large differences in the absolute values for mercury.
Regional differences were examined by superimposing the regions on the resultant
distribution plot. The relative contributions of the various metals to the overall differences
between fish groupings were examined in vector plots.
Preliminary evaluation of the absolute levels for each metal identified that only mercury, iron,
zinc, arsenic and lead were at sufficiently elevated levels to be of concern. Consequently,
correlation analysis was undertaken to further examine the relationships between these metals.

29
Linear regression analysis was carried out on the data with SPSS to examine how metal levels
within species responded to the variables of age and length. Regression analysis revealed a
strong positive, linear relationship of mercury concentration with age and length for flathead
and trout. As a result, regional differences in mercury levels in flathead were further
examined using ANCOVA (SPSS) in which fish age was the covariate. The interaction of
region and age was found to be insignificant; hence the covariate was the same for all
treatments. The analysis was then run again without the interaction term in the model and the
covariate was found to be significant (i.e. the covariate explained a significant amount of the
difference between regions). Population marginal means, also known as least-squares means
(LS means), for the mercury concentrations are presented in the results. These means are the
expected concentration in the muscle of the fish that could be expected for a balanced
statistical design with the covariate (age) at its mean value.

30
4. Results
4.1 Overall heavy metal levels
Overall heavy metal levels by species are summarised in Table 3 and compared with health
standard levels. There were significant differences in the levels of metals within and between
species, with several instances where levels were above recommended food standards. Of the
metals significant from a human health perspective (i.e. mercury, lead, arsenic, nickel,
chromium), mean mercury levels were relatively high in bream, trout and flathead, which all
had mean levels in excess of the maximum level (ML) of 0.5 mg/kg prescribed by Food
Standards Australia and New Zealand (FSANZ) (Table 3). An individual bream had a
mercury content of 2.3 mg/kg, almost five times the ML (Table 3), whilst the highest recorded
levels for individual trout and flathead were more than double the ML (Table 3). In contrast,
mullet had a mean mercury level of 0.23 mg/kg (max 0.25) which was well below the ML
(Table 3).
Arsenic concentrations were highly variable between species with the highest mean level in
sea run trout (5.13 mg/kg); one individual trout having a muscle tissue concentration of 11
mg/kg (Table 3). Arsenic concentrations in the other species were generally low with mullet
having the lowest levels (Table 3). However a flathead had the highest individual arsenic
level reported (16 mg/kg) (Table 3). Given the fact that inorganic arsenic represents
approximately 20% of total arsenic in fish, this level would be in excess of the ML.

31
Table 3. Summary of: mean age, fork length and weight, sex ratios and mean ± standard error and range (parenthesis) muscle tissue metal concentrations for sand flathead,
black bream, sea-run trout and yellow-eye mullet from the Derwent Estuary. Also shown are FSANZ maximum levels (ML), FSANZ generally expected levels (GEL; median
and 95th
percentile) and limit of reporting (LOR). Note: Muscle tissue levels of Cd, Co and Ni were all below the detectable level of the analysis and so are not included in
table.
Biometrics Heavy metal levels (mg/kg wet wt.)
Species n
age
(years)
FL
(mm)
weight
(g)
sex ratio
(M:F) Hg As Zn Pb Fe Cu Mn Se Cr
sand
flathead 150 6 284 161 61: 75 0.53 ± 0.05 3.91 ± 0.43 5.89 ± 0.26 0.06 ± 0.04 2.57 ± 0.29 0.16 ± 0.01 0.05 ± 0.01 0.02 ± 0.02 0.01 ± 0.01
(2-13) (0.1-1.4) (0.5-16.0) (3.7-12.0) (0.0-1.7) (1.1-13.0) (0.0-0.3) (0.0-0.3) (0.0-0.7) (0.0-0.5)
black
bream 28 19 342 994 18: 10 1.57 ± 0.08 1.80 ± 0.23 6.06 ± 0.91 0.02 ± 0.01 5.10 ± 0.95 0.21 ± 0.01 0.46 ± 0.09 0.25 ± 0.06 <0.1
(13-28) (0.57-2.30) (0.5-4.8) (2.7-22.0) (0.0-0.1) (2.5-29.0) (0.1-0.3) (0.2-2.7) (0.0-0.7)
sea-run
trout 25 4 426 709 2: 9 0.68 ± 0.08 5.13 ± 0.55 6.24 ± 0.58 0.01 ± 0.01 4.82 ± 0.25 0.39 ± 0.02 0.24 ± 0.03 <0.5 0.03 ± 0.01
(2-7) (0.08-1.70) (2.0-11.0) (3.4-17.0) (0.0-0.1) (2.9-7.1) (0.3-0.7) (0.0-0.8) (0.0-0.2)
yellow-
eye
mullet 27 7 295 335 9: 16 0.23 ± 0.05 1.06 ± 0.13 9.75 ± 0.72 0.35 ± 0.10 6.33 ± 0.29 0.32 ± 0.01 0.23 ± 0.06 <0.5 0.03 ± 0.01
(3-13) (0.05-0.25) (0.4-2.8) (6.2-16.0) (0.0-1.8) (4.8-10.0) (0.2-0.4) (0.0-0.9) (0.0-0.1)
ML 0.5 2.0 - 0.5 - - - - 1.0
GEL 5, 15 0.5, 2 0.5, 2
LOR 0.02 0.1 0.1 0.1 0.1 0.1 0.1 0.5 0.1
32
Zinc levels ranged from highest mean value of 9.75 mg/kg (mullet) to a lowest mean value of
5.89 mg/kg (flathead) (Table 3). The highest individual concentration of zinc was in bream
(22 mg/kg) (Table 3), with individuals of trout, mullet and bream all exceeding the generally
expected level (GEL) for zinc of 5 mg/kg (median) to 15 mg/kg (95th
percentile) (Table 3).
Lead levels were generally very low, with mean levels for all species falling below the ML of
0.5 mg/kg; however, once again there were individual fish that exceeded the requirements
with one mullet and one flathead being particularly high (1.8 mg/kg, 1.7 mg/kg respectively)
(Table 3).
Levels of the metals less significant from a human health perspective showed only slight
variation between species. Mean iron levels were the highest in mullet (6.33 mg/kg) and the
lowest in flathead (2.57 mg/kg) (Table 3). Mean copper levels were generally similar between
species with all mean levels below the GEL prescribed by FSANZ (Table 3). The highest
levels were in trout (0.39 mg/kg) (Table 3). Manganese concentrations were generally low;
bream had the highest levels (mean 0.46 mg/kg) with only one individual recording a muscle
tissue concentration of any significance (2.7 mg/kg) (Table 3). Only in flathead and bream
were levels of selenium above detection limits and in all cases were below or within the GEL
(Table 3). Similarly, concentrations of chromium were well below the ML (Table 3) and
cadmium, cobalt and nickel were below the limit of reporting (LOR) in all fish examined.
This study sampled across a range of sizes of each species in order to examine metal level
against age and size. However, since only legal size fish would generally be taken and
consumed by fishers, we adjusted the mean levels accordingly to fully evaluate the human
health risk. Table 4 shows that of the fish above legal size collected in this study, all of the
bream (100%), 60% of the trout and 46% of the flathead had mercury levels which exceeded

33
the ML (Table 4). In sharp contrast no individual mullet breached permissible mercury levels
(Table 4).
Table 4. Number and percentage of fish (total, above and below legal size) from each species which exceeded
the maximum mercury level of 0.5 mg/kg.
Flathead Bream Trout Mullet
Minimum legal size (Total length) (mm) 300 250 220 250
No. of legal fish 56 28 25 26
No. of legal fish exceeding mercury limit 26 28 15 0
% of legal sized fish over mercury limit 46 100 60 0
No. of sub-legal fish 94 0 0 1
No. of sub-legal fish exceeding mercury limit 24 0 0 0
% of sub-legal fish sized fish over mercury limit 26 0 0 0
Total no. of fish exceeding mercury limit 50 28 15 0
% of total fish exceeding mercury limit 33 100 60 4
4.2 Inter-specific comparisons
Levels of mercury, arsenic, zinc, lead, iron, copper and manganese were compared between
species, as these metals were all detected at elevated levels in the various fish species and
therefore could reflect biological and physiological differences. Region 1 was the only region
from which samples of all species were obtained, and hence the comparisons of metal levels
were made between fish collected from this region only.
Bream had a significantly higher mean mercury concentration than the other species, almost
three times higher than flathead and mullet (Figure 8a and Table 5), whilst trout and flathead
had significantly higher mercury levels than mullet, again almost three times higher (Figure
8a). Flathead, trout and bream on average, all exceed the recommended maximum permitted
mercury level (Figure 8a).

34
Figure 8. Mean muscle tissue metal concentrations ± SE (Flathead n=30, Bream n=28, Trout n=25, Mullet
n=27) for mercury, arsenic, zinc, lead, iron, copper and manganese between species. Different letters indicate
statistically significant (P<0.05) differences between means from post hoc pooling analysis. Graph (a) also has a
broken line indicating the maximum permitted mercury level 0.5 mg/kg (FSANZ, 2007).
a) Hg
0.0
0.5
1.0
1.5
2.0
Trout Mullet Flathead Bream
Hg
(m
g/k
g)
b) As
0.0
1.0
2.0
3.0
4.0
5.0
6.0
Trout Mullet Flathead Bream
As (
mg
/kg
)
c) Zn
0.0
2.0
4.0
6.0
8.0
10.0
Trout Mullet Flathead Bream
Zn
(m
g/k
g)
d) Pb
0.0
0.1
0.2
0.3
0.4
0.5
Trout Mullet Flathead Bream
Pb
(m
g/k
g)
e) Fe
0.0
1.0
2.0
3.0
4.0
5.0
6.0
7.0
Trout Mullet Flathead Bream
Fe (
mg
/kg
)
f) Cu
0.0
0.1
0.2
0.3
0.4
0.5
Trout Mullet Flathead Bream
Cu
(m
g/k
g)
g) Mn
0.0
0.1
0.2
0.3
0.4
0.5
0.6
Trout Mullet Flathead Bream
Mn
(m
g/k
g)
B
A B
C C
A
C
B
A
B
A A
A
B
A A
BC
C
A
B C C
A
B
AB B
A
B

35
Table 5. Species comparisons of concentrations of mercury, arsenic, zinc, lead and selenium in muscle tissue
from fish collected from Region 1 by one-way ANOVA. Shown are degrees freedom (df), mean squares (MS), F
values (F) and significance (P).
* Indicates data were (Ln) transformed
Trout and flathead had a significantly higher mean concentration of arsenic than the other
species, twice the levels found in bream and more than three times the mean levels in mullet
(Figure 8b and Table 5). Bream had a significantly higher mean arsenic levels than mullet,
almost twice as high (Figure 8b).
Zinc and lead concentrations were significantly higher in mullet than other species (Figure 8c,
d and Table 5). Zinc levels in bream, trout and flathead were similar, with standard errors
within all species being small (Figure 8c). Lead levels were noticeably higher in flathead in
comparison to bream and trout (Figure 8d). Iron levels were significantly higher in mullet
than the other species, whilst trout and bream had higher levels than flathead (Figure 8e and
Table 5). Copper levels were significantly higher in trout and mullet than the other species,
whilst bream had higher levels than flathead (Figure 8f and Table 5). Manganese levels in
mullet and bream were significantly higher than the other species whilst trout had higher
levels than flathead (Figure 8g and Table 5).
Metal Source df MS F P
Hg* Species 3 25.63 92.79 0.000
As* Species 3 14.91 55.71 0.000
Zn Species 3 68.69 6.80 0.000
Pb Species 3 1.90 3.87 0.000
Fe* Species 3 5.59 38.62 0.000
Cu Species 3 0.48 71.99 0.000
Mn* Species 3 0.65 4.60 0.005
36
4.3 Intra-specific comparisons
4.3.1 Gender
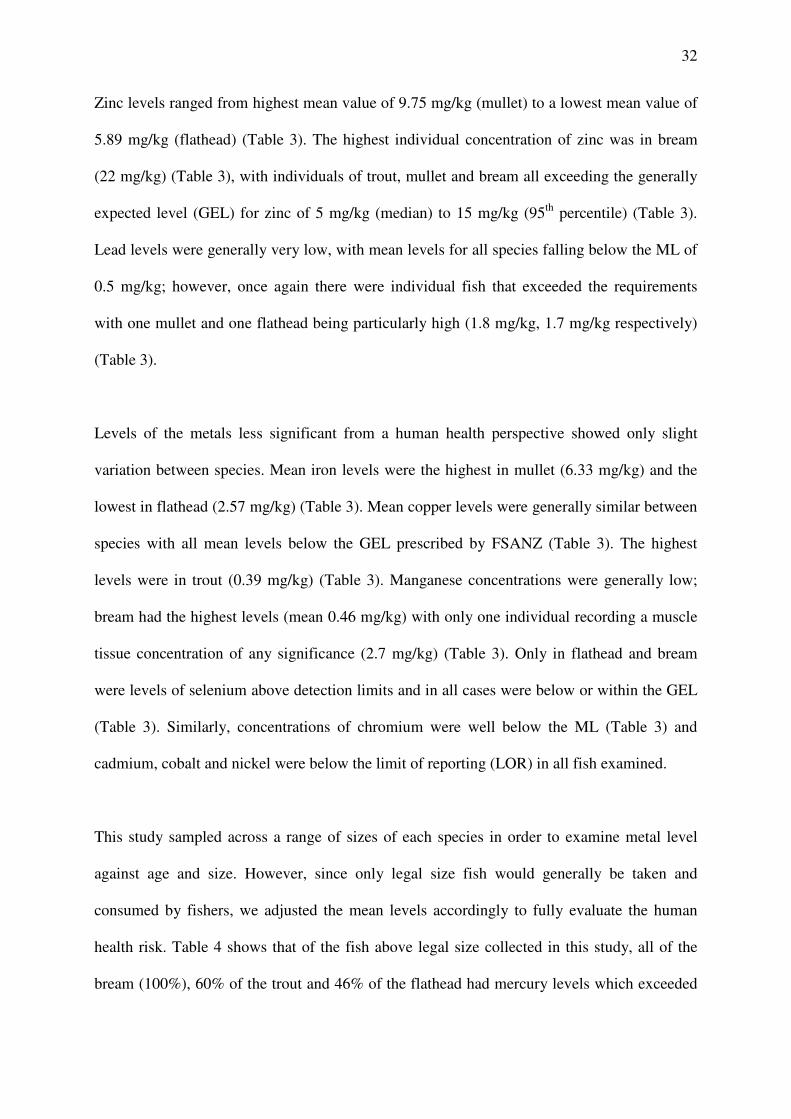
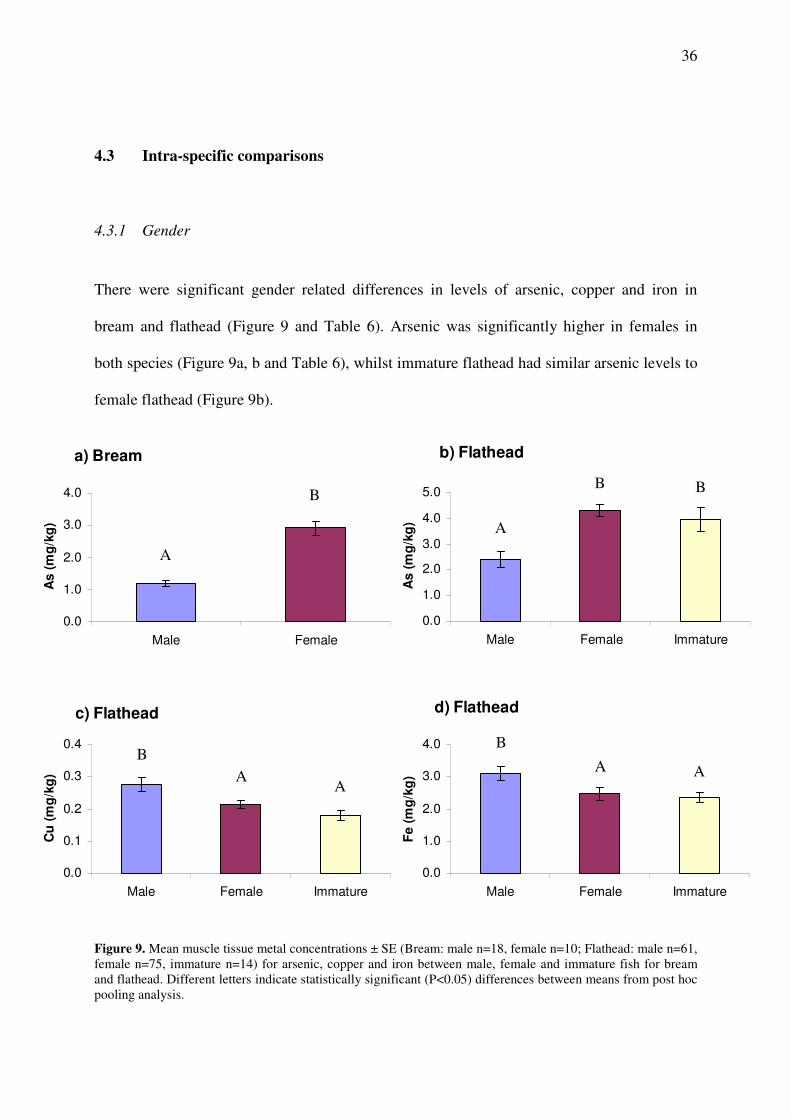
There were significant gender related differences in levels of arsenic, copper and iron in
bream and flathead (Figure 9 and Table 6). Arsenic was significantly higher in females in
both species (Figure 9a, b and Table 6), whilst immature flathead had similar arsenic levels to
female flathead (Figure 9b).
Figure 9. Mean muscle tissue metal concentrations ± SE (Bream: male n=18, female n=10; Flathead: male n=61,
female n=75, immature n=14) for arsenic, copper and iron between male, female and immature fish for bream
and flathead. Different letters indicate statistically significant (P<0.05) differences between means from post hoc
pooling analysis.
d) Flathead
0.0
1.0
2.0
3.0
4.0
Male Female Immature
Fe (
mg
/kg
)
c) Flathead
0.0
0.1
0.2
0.3
0.4
Male Female Immature
Cu
(m
g/k
g)
b) Flathead
0.0
1.0
2.0
3.0
4.0
5.0
Male Female Immature
As (
mg
/kg
) A
B B
B
A A
B
A A
a) Bream
0.0
1.0
2.0
3.0
4.0
Male Female
As (
mg
/kg
)
A
B

37
Levels of copper (Figure 9c) and iron (Figure 9d) in flathead were both significantly higher in
males than in females or immature fish (Table 6). However, there were no significant
differences with respect to gender between mercury and lead levels for any of the species.
Table 6. Gender comparisons of concentrations of arsenic, iron and copper in muscle tissue from bream and
flathead by one-way ANOVA. Shown are degrees freedom (df), mean squares (MS), f values (F) and
significance (P).
Metal Species Source df MS F P
As* Bream Sex 1 5.06 21.52 0.000
As Flathead Sex 2 57.74 12.47 0.000
Fe Flathead Sex 2 10.60 5.70 0.004
Cu Flathead Sex 2 0.96 3.58 0.030
* Indicates data were (Ln) transformed
4.3.2 Fish age and length
Age and length were found to influence metal concentration (Figure 10 and Table 7).
Significant, positive, linear relationships were observed for both age and length with mercury
concentration for flathead and trout (Figure 10a, b, c, d and Table 7). Length explained more
within species variation in mercury levels than age for both flathead and trout. Length
accounted for more than 10% of variation (highly significant) in flathead as opposed to 3%
for age, whilst for trout length accounted for more than 53% (highly significant) of the
variation as opposed to 48% (also highly significant) for age (Table 7). The large proportion
of the variation in mercury levels in trout explained by both age and length indicates a high
degree of autocorrelation between age and length in trout. Similarly, arsenic levels in bream
and trout were found to significantly (P<0.05) increase with length (Figure 10e, f and Table
7). The relationship was stronger in bream than trout (Figure 10e, f and Table 7).

38
Figure 10. Relationships for species with significant regressions of mercury, arsenic and zinc concentrations
with age and length.
a) Trouty = 0.1962x - 0.0066
R2 = 0.4746
0.0
0.5
1.0
1.5
2.0
0 2 4 6 8
Age (years)
Hg
(m
g/k
g)
b) Trout
y = 0.0037x - 0.8832
R2 = 0.5376
0.0
0.5
1.0
1.5
2.0
200 300 400 500 600
Fork length (mm)
Hg
(m
g/k
g)
c) Flathead
y = 0.0173x + 0.3789
R2 = 0.0264
0.0
0.5
1.0
1.5
0 5 10 15
Age (years)
Hg
(m
g/k
g)
d) Flathead
y = 0.0019x - 0.0646
R2 = 0.1055
0.0
0.5
1.0
1.5
150 200 250 300 350 400 450
Fork length (mm)
Hg
(m
g/k
g)
e) Trout
y = 0.0145x - 1.0615
R2 = 0.1942
0.0
2.0
4.0
6.0
8.0
10.0
12.0
200 300 400 500 600
Fork length (mm)
As (
mg
/kg
)
f) Breamy = 0.0392x - 11.599
R2 = 0.3502
0.0
1.0
2.0
3.0
4.0
5.0
6.0
300 320 340 360 380 400
Fork length (mm)
As (
mg
/kg
)
g) Flathead
y = -0.1812x + 7.0734
R2 = 0.0401
0.0
5.0
10.0
15.0
20.0
0 5 10 15
Age (years)
Zn
(m
g/k
g)

39
In contrast, zinc levels in flathead significantly decreased with age (Figure 10g and Table 7).
Although this relationship was significant, it only explained less than 5% of the variability in
zinc concentrations (Figure 10g and Table 7). Metal levels in mullet were not significantly
correlated with either age or length.
Table 7. Significant (P<0.05) linear regressions for metal concentration and age or length for all metals and all
species by regression analysis. Age and length as independent variables and metal concentration the dependent
variable.
Bream Trout Flathead
Regression R2 P R
2 P R
2 P
Hg*Age 0.475 0.000 0.030 0.036
Hg*Length 0.538 0.000 0.103 0.000
Zn*Age - 0.040 0.014
As*Length 0.350 0.001 0.194 0.027
(-) refers to negative correlation
4.4 Inter-metal relationships
Significant, positive correlations were found between zinc and iron in trout, bream and
flathead; iron and copper in trout, mullet and flathead; zinc and lead in mullet; lead and
manganese in mullet; zinc and copper in flathead and iron and mercury in flathead (Table 8
and Appendix 2). There were also negative correlations between iron and arsenic in flathead
and mercury and copper in bream (Table 8). The strongest correlations were between zinc and
iron for trout, bream and flathead as well as iron and copper for trout, mullet and flathead
(Table 8 and Appendix 2).

40
Table 8. Significant (P<0.05) inter-metal correlations within species.
Trout Bream Mullet Flathead
Correlation R2 P R
2 P R
2 P R
2 P
Zn*Fe 0.264 0.009 0.163 0.033 0.250 0.000
Zn*Pb 0.377 0.001
Zn* Cu 0.062 0.002
Zn*Mn 0.164 0.036
Cu*Fe 0.211 0.021 0.261 0.006 0.095 0.000
Cu*Hg - 0.160 0.035
As*Fe - 0.054 0.005
Pb*Mn 0.478 0.000
Fe*Hg 0.053 0.006
(-) refers to negative correlation
4.5 Flathead regional comparison
Mercury, arsenic, zinc, iron and copper were detected in muscle tissue of all flathead from all
of the five regions sampled. Spatial comparison of these key heavy metal levels between the
five regions indicated significant regional differences (Figure 11).
Mercury levels in flathead from the control region (mean 0.22 mg/kg) were significantly
(P<0.05) lower than in flathead from all other regions (Region 5), whereas levels in flathead
from Region 2 were significantly lower (0.33 mg/kg) than in flathead from Regions 1, 3 and
4, which all had similar mean mercury levels (0.62, 0.57 and 0.64 mg/kg respectively) (Figure
11a, Table 9 and 10). Levels in Regions 1, 3 and 4 all exceeded the FSANZ maximum
permitted level (Figure 11a).

41
Table 9. Summary of: mean age, fork length and weight, sex ratios and mean ± standard error and range (parenthesis) muscle tissue metal concentrations for sand flathead
from the five sample regions of the Derwent Estuary. BDL refers to below detectable level of analysis. Note: Muscle tissue levels of Cd, Co and Ni were all below the
detectable level of the analysis and so are not included in the table.
Biological Heavy metal levels (mg/kg wet wt.)
Region n
age
(years)
FL
(mm)
weight
(g)
sex ratio
(M:F) Hg As Zn Pb Fe Cu Mn Se Cr
1 30 6.3 293 195 8:15 0.62 3.74 5.22 0.07 2.23 0.12 0.01 <0.5 0.01
(3-12) (0.25-1.1) (1.0-7.6) (3.7-7.5) (0.0-1.0) (1.1-4.1) (0.0-0.3) (0.0-0.1) (0.0-0.2)
2 30 5.3 272 135 5: 8 0.33 4.54 5.61 0.01 1.74 0.12 0.00 <0.5 <0.1
(3-11) (0.03-0.66) (1.1-13.0) (4.2-7.3) (0.0-0.3) (1.1-4.3) (0.0-0.3) (0.0-0.1)
3 30 4.8 274 140 5: 9 0.57 4.42 6.21 0.11 2.96 0.21 0.12 <0.5 0.03
(2-7) (0.18-1.3) (0.5-16.0) (4.1-12.0) (0.0-1.7) (1.9-5.1) (0.1-0.3) (0.0-0.3) (0.0-0.5)
4 30 4.4 288 159 16: 13 0.64 2.44 7.60 0.08 3.31 0.33 0.12 0.06 0.01
(2-8) (0.27-1.4) (0.7-4.5) (4.9-17.0) (0.0-0.6) (1.7-8.9) (0.1-1.0) (0.0-0.8) (0.0-0.7) (0.0-0.2)
5 30 7.1 294 174 17: 13 0.22 2.39 5.69 0.11 3.01 0.35 0.31 0.06 <0.1
(3-13) (0.06-0.43) (0.5-9.4) (2.2-13.0) (0.0-0.3) (0.8-9.1) (0.2-0.7) (0.0-3.1) (0.0-0.6)
TOTAL 150 5.6 284 161 61: 75 0.53 3.91 5.89 0.06 2.57 0.16 0.05 0.02 0.01
(2-13) (0.1-1.4) (0.5-16.0) (3.7-12.0) (0.0-1.7) (1.1-13.0) (0.0-0.3) (0.0-0.3) (0.0-0.7) (0.0-0.5)

Figure 11. Mean muscle tissue metal concentrations ± SE (n = 30 flathead per region) for mercury, arsenic, zinc,
iron and copper between Regions 1 to 5 for flathead. Different letters indicate statistically significant (P<0.05)
differences between means from post hoc pooling analysis. Graph (a) also has a line indicating the FSANZ
maximum mercury level (0.5 mg/kg).
Mean arsenic levels were significantly lower in flathead from Regions 4 and 5 (2.44 and 2.39
mg/kg respectively) than Region 1 (3.74 mg/kg), while Regions 2 and 3 were significantly
higher (4.54 and 4.42 mg/kg respectively) (Figure 11b, Table 9 and 10). There was less
b) As
0
1
2
3
4
5
6
Region 1 Region 2 Region 3 Region 4 Region 5
As (
mg
/kg
)
a) Hg
0.0
0.2
0.4
0.6
0.8
1.0
Region 1 Region 2 Region 3 Region 4 Region 5
Hg
(m
g/k
g)
e) Cu
0.0
0.1
0.2
0.3
0.4
0.5
Region 1 Region 2 Region 3 Region 4 Region 5
Cu
(m
g/k
g)
d) Fe
0
1
2
3
4
Region 1 Region 2 Region 3 Region 4 Region 5
Fe (
mg
/kg
)
c) Zn
0
2
4
6
8
10
Region 1 Region 2 Region 3 Region 4 Region 5
Zn
(m
g/k
g)
C
B
C C
A
AB B B
A A
A A AB
B
A AB A
C C
BC
A A
B
C C

43
variability in mean zinc levels across the regions, however, Regions 3 and 4, were still
significantly (P<0.05) higher than the other regions, with Region 4 being higher (7.60 mg/kg)
than Region 3 (6.21 mg/kg) (Figure 11c, Table 9 and 10). Mean iron levels in Regions 3 and 4
were significantly (P<0.05) higher than Regions 1, 2 and 5 (Figure 11d and Table 10), and
mean copper levels were significantly higher in Regions 4 and 5 than the other regions
(Figure 11e and Table 10). Manganese, selenium and chromium were detected in only a few
individual flathead resulting in low mean levels (Table 9).
Table 10. Regional comparisons of concentrations of mercury, arsenic, zinc and lead in muscle tissue from
flathead by one-way ANOVA. Shown are mean squares, degrees freedom, f values and significance (p<0.05).
Metal Source df MS F P
Hg* Region 4 7.30 34.77 0.000
As Region 4 32.36 7.04 0.000
Zn Region 4 0.56 7.06 0.000
Fe Region 4 1.88 12.19 0.000
Cu Region 4 5.47 42.90 0.000
* Indicates data were (Ln) transformed
Principle components analysis shows the complexity of the relationships between the
individual flathead sampled. It was not possible to differentiate regions with respect to the full
metal suite (Figure 12). However, PCA did reveal that the greatest source of the variation
between individual fish was associated with differences in mercury levels, and to a lesser
extent levels of arsenic and zinc (Figure 12) which corresponds with the individual
comparisons (ANOVA) of metals across regions (Figure 11 and Table 10).

44
Figure 12. Ordination of sample sets using principal components analysis (PCA) on the similarity matrix
produced from the raw data. Vector plots show proportional influence of main metals on sample separation.
Mercury data transformed (×10).
Mercury was the only metal for which levels in flathead regularly exceeded maximum
permitted levels (Figure 11). This therefore is the most significant from a human health point
of view. Hence, in this section the interaction of mercury levels with age and length is
explored further. However, age/size ranges varied markedly between regions, for instance
flathead samples from Regions 1 and 5 were represented by a much larger range of age/sizes
than other regions, thus potentially confounding regional comparisons (Table 9). Size and age
structure of samples were not consistent between regions and as mercury is a function of these
parameters they need to be standardised in making valid regional comparisons. Regional
comparisons show that age was a better indicator of mercury concentration (Table 11). Thus,
in order to make valid comparisons between regions, age needed to be taken into account.
This was achieved by ANCOVA with age as the covariate. Results of the ANCOVA showed
that the slopes were not significantly different and that the age accounted for significant
variation between the regions (Table 12).
As Hg
Zn
Fe

45
Table 11. Linear regression results for mercury concentration in response to age and length for flathead from
different regions. Age and length as independent variables and mercury concentration the dependent variable.
Region 1 Region 2 Region 3 Region 4 Region 5
Regression R2 P R
2 P R
2 P R
2 P R
2 P
Hg*Age 0.442 0.000* 0.588 0.000* 0.222 0.012* 0.159 0.029* 0.721 0.000*
Hg*Length 0.519 0.000* 0.282 0.003* 0.160 0.054 0.036 0.317 0.333 0.001*
* Indicates significance at the P<0.05 level
Table 12. Comparison of mercury levels in muscle tissue of flathead caught in different regions by one-way
ANCOVA, with length as the covariate and region as a fixed factor. Shown are, degrees of freedom (df), mean
square (MS), f value (F) and significance (P).
Source df MS F P
Region 4 1.81 13.92 0.000
Age (cov) 1 6.81 52.48 0.000
Region × Age
(cov) 4 0.256 1.97 0.102
ANCOVA without interaction term
Source df MS F P
Region 4 9.44 70.80 0.000
Age 1 10.93 81.95 0.000
Data were (Ln) transformed
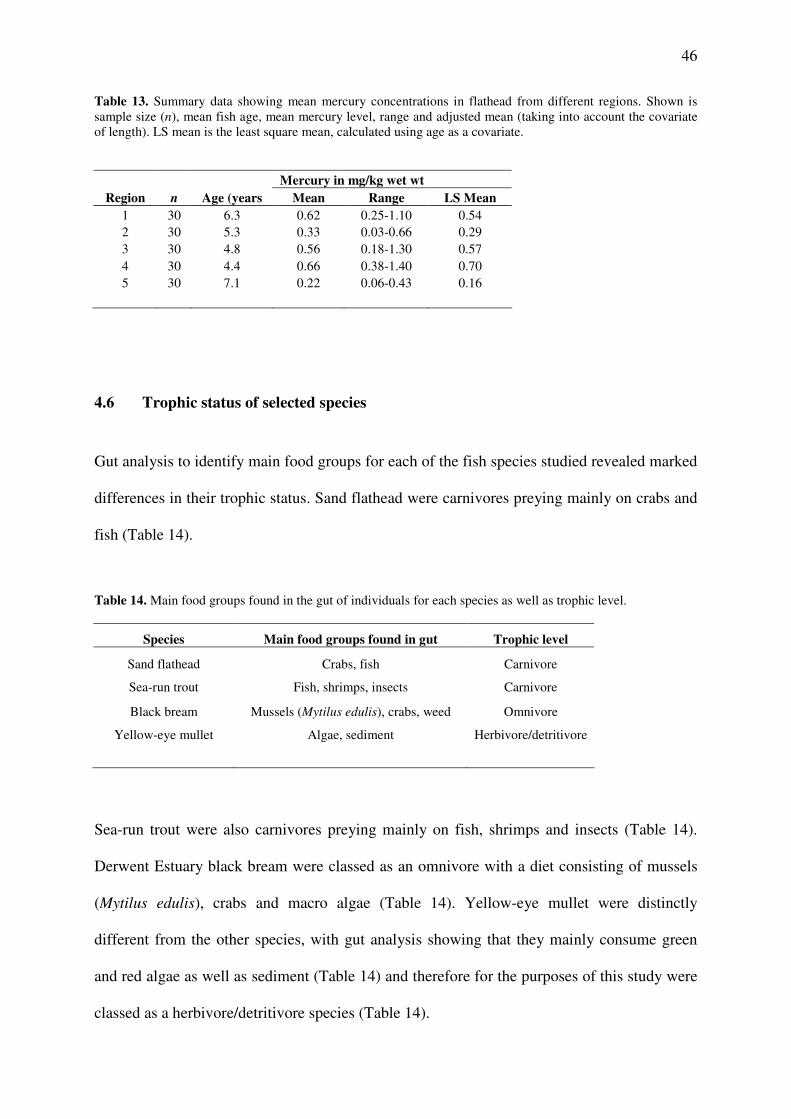
Furthermore, mercury concentrations in flathead muscle were significantly different between
regions when age was taken into account (Table 12). A summary of the recorded means and
the ANCOVA adjusted means can be seen in Table 13. Examination of the adjusted means
revealed that when age was taken into account, the regional differences were more
pronounced and importantly the adjusted mean mercury levels for Regions 3 and 4 exceeded
the mean for region 1 (Table 13).
46
Table 13. Summary data showing mean mercury concentrations in flathead from different regions. Shown is
sample size (n), mean fish age, mean mercury level, range and adjusted mean (taking into account the covariate
of length). LS mean is the least square mean, calculated using age as a covariate.
Mercury in mg/kg wet wt
Region n Age (years Mean Range LS Mean
1 30 6.3 0.62 0.25-1.10 0.54
2 30 5.3 0.33 0.03-0.66 0.29
3 30 4.8 0.56 0.18-1.30 0.57
4 30 4.4 0.66 0.38-1.40 0.70
5 30 7.1 0.22 0.06-0.43 0.16
4.6 Trophic status of selected species
Gut analysis to identify main food groups for each of the fish species studied revealed marked
differences in their trophic status. Sand flathead were carnivores preying mainly on crabs and
fish (Table 14).
Table 14. Main food groups found in the gut of individuals for each species as well as trophic level.
Species Main food groups found in gut Trophic level
Sand flathead Crabs, fish Carnivore
Sea-run trout Fish, shrimps, insects Carnivore
Black bream Mussels (Mytilus edulis), crabs, weed Omnivore
Yellow-eye mullet Algae, sediment Herbivore/detritivore
Sea-run trout were also carnivores preying mainly on fish, shrimps and insects (Table 14).
Derwent Estuary black bream were classed as an omnivore with a diet consisting of mussels
(Mytilus edulis), crabs and macro algae (Table 14). Yellow-eye mullet were distinctly
different from the other species, with gut analysis showing that they mainly consume green
and red algae as well as sediment (Table 14) and therefore for the purposes of this study were
classed as a herbivore/detritivore species (Table 14).

47
5. Discussion
The results clearly showed that metal levels varied both between and within species, and in
relation to age, length and gender, and that regional differences in metal levels in flathead
muscle tissue and levels of mercury in three key recreational species exceeded Australian
seafood guidelines.
5.1 Factors influencing metal levels between species
Fish are exposed to heavy metal contamination both directly via the water column through
respiration (gills) and indirectly through diet (Burger et al., 2002; Bu-Olayan and Thomas,
2005). Of the two pathways, direct exposure from the water is thought to account for only a
minor proportion of the metal uptake by fish for most metals (Burger et al., 2002). Metal
levels in Derwent Estuary water are relatively low in comparison to sediments (Green and
Coughanowr, 2003), and therefore it could be concluded that water column uptake would
represent a relatively small component of overall uptake. Since the species comparison was
between fish sampled from only from Region 1 (Tasman Bridge to New Norfolk), it might be
expected (assuming they are non-migratory and stay within this region for the majority of
their lives) that they would be exposed to similar levels of water borne contaminants and that
any species differences would not be as a result of different metal exposures through the
water column. In this instance, species variability in metal levels is likely to be a result of
differences in dietary exposure (dietary preferences, trophic level), time of exposure (age) and
fish physiology (elimination) (Watras and Bloom, 1992).

48
From a human health perspective differences in mercury levels between species are the most
important comparison. Mercury is the one metal for which there is substantial evidence for
bioaccumulation and biomagnification in fish (Mason et al., 1995; Hill et al., 1996). It is
highly persistent and readily absorbed by most organisms and its accumulation in fish is
largely a result of exposure through diet (Mason et al., 1995). Trophic level has been found to
strongly influence mercury levels in fish, with species of high trophic level generally having
higher mercury concentrations than species of lower trophic status (Ratkowsky et al., 1975;
Mason et al., 1995).
Although bream were not the highest trophic species in this study, they had a substantially
higher mean mercury level than the other three species, suggesting that trophic level alone is
not the primary influence on different mercury levels between species. It is possible however,
that specific prey items within the bream diet may be particularly susceptible to mercury
accumulation and hence may have particularly influenced levels in this species. This study
suggested that the diet of bream primarily consisted of crabs, bivalves (blue mussels; Mytilus
edulis planulatus) and macrophytes, which is consistent with previous findings (Sarre et al.,
2000; R. Sakabe, pers. comm.). Consumption of the blue mussel was unique to the diet of
bream, and may be an important source of the resultant high mercury levels in this species.
Blue mussels are abundant throughout the Derwent and have been found to contain very high
levels of cadmium, lead and mercury (Bloom and Ayling, 1977; Green and Coughanowr,
2003). Bloom and Ayling (1977) reported the concentration of mercury in the blue mussel
from the Derwent Estuary as 0.02-1.3 mg/kg (mean 0.35 mg/kg) which is relatively high for a
small invertebrate (Bloom and Ayling, 1977). Consequently, the diet of blue mussels could be
a major contributor to the higher than expected mercury contamination levels in bream.

49
Given that both trout and flathead are regarded as carnivorous, opportunistic feeders it might
be expected that the metal levels in these species would be similar; indeed levels of mercury,
arsenic and zinc were not significantly different between the two species. However, levels of
iron, copper and manganese were all significantly higher in trout and these differences may
again be due to a preference towards particular dietary items. Flathead and trout both
consumed fish as part of their diets, but fish appeared to be a bigger component of the trout
diet than the flathead diet. This is supported by research which suggests that sea-run trout
follow whitebait runs and feed largely on other fish (DPIW, 2007). Assuming that metals are
accumulated through the food chain, then the higher proportion of fish in the trout diet could
account for the higher levels of copper, iron and manganese.
The status of mullet as the lowest trophic level of the four species was supported by the
significantly lower levels of mercury and arsenic recorded; for both metals there is evidence
of increased levels in higher trophic species. In contrast, trophic level cannot explain the
higher levels of lead and zinc found in this mullet, but again it may be due to specific dietary
differences relative to the other three species. Previous studies suggest that the diet of yellow-
eye mullet consists primarily of sediment, algae, detritus and small benthic zooplankton
(Eustace, 1974; Edgar, 1997). In the present study the stomachs of mullet were filled with
green algae and some contained small amounts of sediment, reflecting the fact that when
feeding, mullet suck up the surface layer of mud or graze on submerged rock and plant
surfaces (Eustace, 1974). Metals including lead and zinc are strongly tied in with sediments
(Eustace, 1974; Campbell, 1994) and as a result the high levels of these metals in mullet may
be a result of direct ingestion of these metals along with sediment. The strong, positive
correlation between lead and zinc levels in mullet found in this study would tend to support
this hypothesis. It has been proposed that significant correlations of metal concentrations in

50
tissues may reflect similar pathways of accumulation (Brooks and Rumsey, 1974) and as a
result may be associated with related sources of exposure, excretion or sequestration (Kirby,
2001). In addition, mullet may be exposed to higher levels of particular metals as a
consequence of the organisms they consume (plant and animal) being unable or having a
limited ability to regulate metals. In his review on heavy metal accumulation in marine
animals, Bryan (1980), suggested that in the accumulation of metals through the food chain, it
is of some importance whether or not a predator regulates metals and whether its diet consists
of organisms which do or do not regulate (Bryan, 1980). For example, flounder (Platichthys
flesus) from the Severn Estuary (Great Britain) which had a diet of Macoma balthica, a
marine bivalve which is unable to regulate metal levels, contained higher levels of zinc than
those having a diet of crustaceans and small fish which can regulate zinc (Hardisty et al.,
1974). The algae and small zooplankton consumed by mullet would only have a limited
capacity to regulate metal levels (Bryan, 1980) and as a result mullet may have a greater
exposure to metals through its diet than the other species.
The present study suggests that specific differences in diet are likely to be a major factor in
determining differences in metal levels between species. In particular it highlights the strong
influence trophic level may have on the levels of mercury and arsenic in a given species. It
also illustrates the importance of identifying primary prey groups of a particular species as
some prey items may account for a larger proportion of metal exposure than others.
Whilst fish diet on its own may explain a substantial amount of the variation in metal levels
between species, the length of time which a particular fish is exposed to heavy metals will
also greatly influence the final concentration of any given metal. Relationships between metal
concentration (in particular mercury, arsenic and zinc) and age and/or size have been reported
51
previously in many species of fish including; lake trout (Bache et al., 1971), black marlin
(Mackay et al., 1975), deep water sharks (Hornung et al., 1993), largemouth bass (Park &
Curtis, 1997) and pacific cod (Burger et al., 2007). Generally, muscle metal levels have been
shown to increase with age and size (Mackay et al., 1975; Hornung et al., 1993). However,
the one notable exception to this trend, is the negative relationship which has been observed
for zinc (Kirby et al., 2001; Farkas et al., 2003). In this study there were age/size related
differences in zinc, arsenic and mercury levels within flathead, bream and trout.
As a consequence of the persistent nature of mercury, excretion of this metal in fish is slow
(Miettinen, 1973; Sorensen, 1991). Mercury has a strong ability to accumulate over time,
reaching very high levels in long lived fish (Morel et al., 1998; Wiener et al., 2003). In the
present study, mercury levels in flathead and trout increased with age and length. This
relationship is consistent with findings of the majority of studies which have looked at the
influence of age on mercury levels (Hournung et al., 1993; Heuter et al., 1995; Szefer et al.,
2003). The relationship between length and mercury concentration was stronger for trout than
flathead, and this may simply be a reflection of the large size range of trout collected. The
relationships between age, length and mercury concentration in bream may have been clearer
had a larger size range of fish been collected for this species; all bream collected in this study
were in the age range of 13 to 28 years of age (Table 3). Although mercury levels were not
found to significantly increase with age in bream, the higher mercury levels found in this
species may be due to the relatively old age of the species examined. Longevity has been
attributed to the high mercury levels in many species including deep water shark (Hornung et
al., 1993), black marlin in Australia (Mackay et al., 1975), and perch in the Baltic Sea (Szefer
et al., 2003). Bream collected in this study were on average almost three times the age of
other species. However, the fish sampled may not have adequately represented the full age

52
range and future studies should seek to include a wider size range of fish including some
small, young bream. This would allow for a more thorough examination of age/length
relationships with mercury. The lack of any relationship between mercury concentration and
age or length for mullet is probably due to the low overall levels found in this species. Park
and Curtis (1997) suggested that size relationships may not hold for fish species with low
contaminant levels (Park and Curtis, 1997).
Although zinc levels were significantly higher in mullet than the other species this study
found no age/size relationship of zinc levels in mullet. However, zinc levels were found to
significantly decrease with increasing age in flathead. This trend has been previously noted by
several authors including Farkas et al. (2003) who found that zinc levels decreased
significantly with age in bream (Abramis brama L.) and Kirby et al. (2001) whose study
reported that zinc levels decreased with size (weight) in sea mullet (Mugil cephalus).
Negative trends may be due to older/larger fish being more effective in regulating zinc levels
(Farkas et al., 2003).
There are mixed reports in the literature regarding the relationship between age/size and
arsenic. Ashraf and Jaffar (1988) found arsenic levels in tuna increased with size (weight),
whilst, Liao et al. (2003) and Burger et al. (2007) found that arsenic levels in tilapia
(Oreochromis mossambicus) and pacific cod (Gadus macrocephalus) respectively, decreased
with fish size (weight and length). In the present study, arsenic levels increased significantly
with increasing length in bream and trout. If arsenic is being accumulated through diet and
hence increasing through the food chain, then levels would be expected to increase with size
or age. Ongoing conflicting findings on the accumulation of arsenic in fish with age, size and
trophic level, highlights this as a particular area for which more research is needed.

53
Gender specific differences in heavy metal concentration have been described for several
species of fish (Parks and Curtis, 1997; Alquezar et al., 2006). Gender may alter the metal
concentration in a particular species of fish through a combination of factors including dietary
preferences (Parks and Curtis, 1997; Peakall and Burger, 2003) and physiological differences
related to the reproductive cycle (Olsson et al., 1996). The results of this study showed
significant gender related differences in levels of arsenic, iron, copper and zinc in different
species.
Levels of arsenic were almost twofold higher in female fish for both flathead and bream. This
finding is in direct contradiction with several studies. Glover (1979) and Burger et al. (2004)
who studied school and gummy sharks from south eastern Australia, and Florida char
(Lepisosteus platyrhincus), respectively, found that arsenic levels did not differ significantly
with gender. It was suggested that this could simply be a reflection of the generally low levels
of arsenic in the fish (Burger et al., 2004). Arsenic levels in the present study appeared quite
high and therefore the differences may have been more apparent as a result. The opposite
relationship was present for levels of iron and copper, which were significantly higher for
male flathead than female or immature flathead. Higher iron levels in male fish, has been
noted by Alquezar et al. (2006) for toadfish (Tetractenos glaber), who suggested that this
might be due to a combination of factors including; dietary preference, reproductive
metabolism and foraging behaviour (Alquezar et al., 2006). Gender differences can be
expected to occur when one gender is less efficient at regulating essential metal levels than
another, this may be because more energy is being used to meet the demands for sexual
formation or development (Chernoff and Dooley, 1979; Kirby et al., 2001). At the time of
sampling, each of the study species was in reproductive condition and many females were

54
fully mature with ripe ovaries. The additional requirement for iron and copper by female
flathead in egg production, may account for the resultant lower muscle levels than in male
fish (Kirby et al., 2001). There were no gender related differences for mercury, the most toxic
of the metals, and hence it might be concluded that the gender differences were of little
importance from a human health perspective.
Life history, environmental and physiological requirements of certain species of fish mean
that fish may migrate or move over a range of spatial scales (Kestemont et al., 1999;
Cucherousset et al., 2005). As a result, more mobile species of fish may only spend a small
proportion of their time within any given region and therefore would not be exposed to the
same metal contamination, either through food or water, of less mobile species (Blevins and
Pancorbo, 1986). Consequently, comparisons of species from a particular region require
knowledge of the species mobility in order to accurately examine metal differences
(Francesconi et al., 1997). It is considered that sand flathead are a non-migratory species
which remain within relatively localised areas for their entire life cycle (Dix et al., 1975;
Francesconi et al., 1997; Jordan, 2001) and the significant regional differences in metal levels
in flathead from this study provides more evidence that this is indeed the case. If flathead in
the Derwent Estuary were highly mobile, spatial variability in mercury levels would have
been very small. Bream are thought to be restricted to a particular estuary though move
throughout the system (Potter and Hyndes, 1999) and a similar movement pattern is thought
to be occurring with bream in the Derwent Estuary (R. Sakabe, pers. comm.). The lack of
movement of this species out of the Derwent Estuary would suggest that high mercury levels
in the fish sampled are ultimately due to the contamination in the estuary. Examining mercury
levels in bream from other “uncontaminated” estuaries from around Tasmania to provide
background levels would determine if this is indeed the case. However, as a reference, bream

55
from the relatively uncontaminated Gippsland Lakes in Victoria had a mean mercury level of
0.22 mg/kg (Fabris et al., 1999). The comparative mean levels in bream in this study were
1.57 mg/kg further highlighting the extreme nature of mercury levels in bream from this
study. While there is some information on the movements of bream and flathead in the
Derwent Estuary, little is known about the movements of the other two species studied.
Mullet are primarily an estuarine species (Edgar, 1997) but little is known about their
movements within an estuary and the migratory patterns and movements up and down stream
of sea-run trout are poorly understood. Metal levels in these species may be influenced by
mobility, however, due a lack of knowledge of their movement it cannot be known how much
of a factor fish mobility is.
5.2 Regional variability in flathead
A multitude of studies have looked at metal levels in fish from contaminated sites around the
world and the general conclusion is that environment has a large influence on levels (Weiner
et al., 2003; Calta and Canpolat, 2006). The aquatic environment is highly susceptible to
contamination by heavy metals and other pollutants due to land run-off, industry effluent and
other forms of human activity and natural weathering (Laws, 2000; Calta and Canpolat,
2006). Aquatic sediments can act as both a sink and a source of heavy metal contaminants,
and long term input of heavy metals into an aquatic environment can lead to sediment
concentrations which greatly exceed the levels in the water column (Burton et al., 2003). The
Derwent Estuary has been subjected to long term heavy metal contamination from past
industrial practices which released highly contaminated effluent directly into the estuary for
many years (Green and Coughanowr, 2003). Consequently sediment metal levels in the
Derwent Estuary are among the highest in the world (Bloom, 1975). Sediment levels of zinc,

56
cadmium, lead, arsenic, copper and mercury all exceed national sediment standards by
considerable amounts in several regions, particularly in the area immediately adjacent to the
Zinifex Hobart Zinc Smelter (Region 1) (Table 15). In summary there is substantial variability
in metal loads in the sediments of the Derwent and it is likely that this spatial variability
would be reflected in the metal levels of fauna that are associated with the area.
Table 15. Mean sediment heavy metal levels in regions of the Derwent Estuary in mg/kg dry wt. Also shown are
Interim Sediment Quality Guidelines (ISQG). ISQG low, equivalent to effects range low- causing adverse effects
10% of the time. ISQG high, equivalent to effects range median- causing adverse effects 50% of the time. Data
courtesy of the Derwent Estuary Program, 2003. n refers to number of samples taken from each region.
Region n Hg As Cd Cu Fe Mn Pb Zn
1 14 27 316 115 479 44594 1521 2406 15257
2 8 5 14 4 51 18685 171 367 1003
3 7 2 10 2 19 10293 84 128 361
4 13 2 7 2 17 7140 33 124 325
ISQG low 0.15 20 1.5 65 50 200
ISQG high 1 70 10 270 220 410
If metal levels were a direct reflection of sediment levels then we would expect to see very
high metal levels from Region 1 (the most contaminated region) and a substantial decline in
levels as one progresses towards the mouth of the estuary. Supporting this is the significantly
lower mercury levels in flathead from the control region (Mickey’s Bay) than the other
regions. The mean mercury levels in flathead from the control region of 0.22 mg/kg compared
similarly with the levels found in flathead collected from the relatively pristine east coast of
Tasmania (0.24 mg/kg) (Thomson, 1985) suggesting that this region was indeed a good
reflection of background metal levels and reflected low sediment levels. However, within the
Derwent Estuary levels of mercury, zinc, iron and copper in flathead did not follow the
expected pattern apparent in the sediments. Ralphs Bay (Region 4) which is some distance
downstream from Region 1 had the highest levels of mercury, zinc and iron, whilst Region 1
which is the most contaminated region had moderately high levels. Furthermore, mercury

57
levels in fish from Region 2 (western shore) were significantly lower than Regions 1, 3 and 4.
Ratkowsky et al. (1975) also found significant differences in mercury levels between regions
and similar to this study, percentages of fish having mercury concentrations in excess of the
permissible value were higher in Ralph’s Bay (Region 4) and the surrounding eastern shore of
the estuary (Region 3) than in the remainder of the estuary. This trend has since been
observed consistently in seafood monitoring of mercury levels in flathead by Zinifex (Nystar)
in recent years (Green and Coughanowr, 2003). Furthermore, metal levels in bivalve molluscs
in the estuary, particularly oysters (Crassostrea gigas) and mussels (Mytilus edulis
planulatus) show similar regional trends to metal levels in flathead (Green and Coughanowr,
2003). Data on lead levels in mussels from the Derwent Estuary show that levels in Region 1
and Region 4 (Ralphs Bay) are much higher than levels in mussels from the other regions
(Green and Coughanowr, 2003). A similar trend is apparent for metal levels in oysters from
the Derwent Estuary (Green and Coughanowr, 2003) with oysters from Ralphs Bay typically
having the highest lead and mercury levels of the regions (Green and Coughanowr, 2003).
The findings of the present study on metal levels in Derwent Estuary fish and other studies on
metal levels in Derwent Estuary shellfish all highlight Ralphs Bay as a particular anomaly.
All of these studies have shown that the levels of mercury contamination in the Derwent are
not linked to sediment levels. Clearly other factors such as regional differences in diet, age
and metal bioavailability are of importance.
It is now well understood that the underlying factor behind mercury accumulation in fish is
the methylation of inorganic mercury to organic mercury (methylmercury) making it
bioavailable for uptake by fish (Weiner et al., 2003). Methylation is influenced by several
factors including temperature, pH, organic matter and sediment type (Jernelov and Ansell,
1973; Foster et al., 2000). While there is no simple relationship, it appears that enhanced rates

58
of methylation are linked in particular with low pH, low salinity, high temperature and the
presence of decomposable organic matter in reducing environments (Ullrich et al., 2001). It is
possible that some of these factors may be more favourable in Ralphs Bay than the other
regions of the Derwent Estuary and this may be favouring methylmercury production and
hence uptake and accumulation by flathead. Supporting this is that Ralphs Bay has some
distinct physical differences to the other regions in the Derwent Estuary. Firstly, much of the
bay is very shallow (less than 2m in depth) and the sediment at the mouth of the bay consists
largely of fine silt whilst within the bay sediments primarily consist of coarser sand (Jones et
al., 2003). The shallow waters of Ralphs Bay may allow for warmer sediments than the other
regions which in turn may be increasing methylation and hence bioavailability of
methylmercury (Foster et al., 2000; Filazi et al., 2003). Indeed, Jones et al. (2003) reported
that the water in the shallow areas of Ralphs Bay recorded higher salinities and temperatures
than the rest of the rest of the estuary. Furthermore, sediment temperatures were on average 4-
7oC higher in the shallows of Ralphs Bay compared with the rest of the estuary (Jones et al.,
2003). Sediments in Ralphs Bay were also found to be strongly reduced compared with the
cleaner sands of the estuary mouth (Jones et al., 2003). The more reduced sediments of
Ralphs Bay, which are also rich in organic matter, all provide an environment where
methylation rates can increase (Choi and Bartha, 1994) and could be contributing to greater
metal availability and thus higher rates of uptake by fish and shellfish.
The unique physical attributes of Ralphs Bay may mean that the waters in this region are
home to a different group of prey items to the other regions. Different prey items may have
higher metal levels and so be contributing to increased levels in fish. Preliminary findings on
the trophic transfer of metals to sand flathead from prey items by Hunt (unpublished data,
2008) suggest that this could indeed be contributing to higher mercury levels. His findings
59
also suggest that flathead in this Ralphs Bay may be selectively feeding on a certain prey
group which are more inclined to accumulate high metal levels than other species. This could
also be a contributing factor to the comparatively high mercury levels in flathead in Ralphs
Bay.
5.3 Implications for public health
From a public health perspective, mercury, cadmium and lead are considered the most
hazardous metals, however, several others including copper, zinc, silver, arsenic and
chromium may be of equal or greater hazard to the health of humans (Bryan, 1980; Jarup,
2003). Of these, mercury, lead, arsenic, copper and zinc were all detected in muscle tissue of
fish species from the Derwent Estuary. However, only mercury regularly exceeded maximum
permitted levels for human consumption, although levels of arsenic and lead occasionally
exceeded the guidelines. Consequently the major health concern for consumption of Derwent
Estuary fish would be mercury contamination.
Methylmercury contamination was responsible for large human casualties in Minimata, Japan
in the 1950’s where over 100 people died from mercury poisoning after ingesting
contaminated fish and shellfish (Kurland et al., 1960). From incidents such as these, health
experts have been able to reliably predict maximum allowable levels for safe human
consumption. For the majority of countries including Australia the maximum levels for all
fish with the exception of long lived and exceptionally large fish has been set at 0.5 mg/kg
(FSANZ, 2007). Mercury levels in flathead (Regions 1, 3 and 4), trout and bream exceeded
recommended mercury levels of 0.5 mg/kg. As a result of the long term monitoring of
mercury levels in flathead by the Zinifex (Nystar) monitoring program, a health advisory has
60
been issued regarding the consumption of flathead from the Derwent Estuary (DEP, 2007).
The advisory recommends that flathead from the Derwent Estuary should be consumed no
more than three times a week and pregnant women and children should limit their
consumption of the species to one meal per week. Levels in flathead from the sampling
program are consistent with those found in this study (Green and Coughanowr, 2003),
however, the findings of this study as well as data from the monitoring program suggest that
flathead from the western shore (including Kingston Beach and Sandy Bay) and from the
southern most end of South Arm (Seacroft Bay) pose a much smaller risk to human health
than the other areas. In contrast, flathead taken from Ralphs Bay probably pose the highest
risk to consumers. The present study has also highlighted the importance of standardising
mercury levels in flathead with age (or length) in order to provide accurate regional and
temporal comparisons. The fact that mercury levels identified in bream were threefold higher
than levels in flathead (for which a health advisory has been issued for) suggests that bream
from the Derwent Estuary are of particular concern to public health. Adding to the risk is the
fact that bream are highly sought after sport fish and are regularly consumed by anglers and
recreational fishers (Lyle, 2005). The present study has also identified that consumption of
trout may be a risk to consumers with mercury levels similar to those in flathead from the
most contaminated regions of the Derwent. However, it must also be noted that yellow-eye
mullet from the Derwent Estuary had relatively low mercury levels and are unlikely to pose a
health risk to humans.
The majority of arsenic (80% or more) in fish is the relatively non-toxic, organic arsenic,
arsenobetaine (Edmonds et al., 1977; Larsen et al., 1993), however, some individuals of
flathead and trout had arsenic levels which may have exceeded the maximum permitted level
of 2 mg/kg of inorganic arsenic. If the ratio of organic to inorganic arsenic is taken into

61
account, the average levels fell well below the ML. Consequently the health threats associated
with arsenic toxicity would be minimal in relation to the species examined in this study.
However, in future studies it would be desirable to undertake analysis of inorganic arsenic in
tissue samples to see whether the inorganic to organic arsenic ratio is comparable to findings
from previous studies. It may also be worthwhile to consider whether it is appropriate to base
the Australian guidelines on inorganic arsenic considering that analysis of total arsenic is both
expensive and time consuming and that the ratio of inorganic arsenic to organic arsenic is
well known in most fish.
The health effects of lead contamination in humans are potentially severe, and may include
behavioural disturbances, learning and concentration difficulties, with severe cases of
psychosis and reduced consciousness in worst case scenarios (Jarup, 2003). Consequently
elevated levels of lead recorded in mullet in this study may warrant some concern. Despite a
mean lead level in the species of 0.35 mg/kg which fell below maximum recommended lead
levels of 0.5 mg/kg, several individual fish had levels which exceeded this value, suggesting
that there could potentially be some negative health affects to humans eating yellow-eye
mullet. Whilst the risk could be considered minimal, it should be noted that the skin and
bones of this fish may have much higher levels of lead. Studies have reported higher lead
concentrations in fish scales and bones than in the other parts of the fish, as lead preferentially
accumulates in bone and calcium structures (Rashed, 2001). Consequently, people who eat
the skin of the fish as well as the muscle may be exposed to higher levels of lead, and
potentially be at greater risk to their health.

62
5.4 Conclusions
In summary, this study has revealed that metal levels varied between the different species
with diet/trophic level, age and mobility the key factors. Gender differences were apparent but
only for arsenic, iron and zinc and consequently gender was of minor importance with respect
to human health risk. Regional differences in several metal levels were apparent for flathead
but these differences did not reflect regional differences in sediment levels. Metal levels in
flathead from Ralphs Bay were particularly high, with mercury and zinc highest in fish from
this region despite the sediment levels of these metals being comparatively low. It was
hypothesised that diet and mechanisms influencing metal bioavailability were likely to be the
main factors in the regional differences, particularly for mercury. Mercury in three of the
species studied (black bream, sea-run trout and sand flathead) consistently exceeded
Australian guidelines for levels in seafood and may pose a health risk. However, reported
levels of arsenic and lead are likely of little concern to human health.
5.5 Future research and management implications
This study has identified some particular areas that require more research in order to improve
our overall understanding of metal accumulation and to better aid the management of
Derwent Estuary fish, human health and estuary health. Perhaps the most significant finding
of the study was the high mercury levels in bream. The levels found in this species were three
times higher than levels in flathead from the same region where there are already advisories
regarding their consumption. As a result of these findings a public health advisory from the
Tasmanian Department of Health was issued recommending that bream not be consumed at
all and that consumption of trout and flathead from the Derwent Estuary should be limited. As
a consequence of this study, the Department of Health and other Derwent Estuary

63
stakeholders are keen to identify any additional species that may represent a risk to human
health. This study has indicated that susceptible species would be those which are long lived,
high trophic order species and which live in highly contaminated regions. This study has
identified a need to better understand the influences of metal levels in the species studied in
this project. Although the present study has provided evidence for the influence of various
factors such as diet and mobility on metal levels in a particular species, further research is
needed to better understand the mechanisms behind accumulation. Further studies should look
to compare mercury levels found in Derwent Estuary trout and bream to levels in these
species from other areas in the state not impacted by metal contamination to determine
whether or not the high mercury levels are site specific or species specific. Further work
should also look to better categorise the diets of bream and trout and also measure metal
levels in key prey items of each species to examine trophic transfer. Finally, this study has
highlighted the need to better understand the movements and dispersal patterns of fish species
both within the Derwent Estuary and in other waters if applicable. Researchers at the Marine
Research Laboratories are currently undertaking an acoustic tagging study for bream and
flathead which should shed some light on the movements of these species.
The higher mercury levels observed in flatheads from Ralphs Bay compared to other regions
of the Derwent Estuary is of particular interest. This study has put forward several possible
explanations for this anomaly, and these should be explored further. Research in this area
would be best focused on identifying environmental and biological parameters which are
unique to the region and which may be favouring the bioavailability of metals. Parameters to
be measured should include: water depth, water and sediment temperature, organic matter
levels in the water column and sediments, and identification of metal input sources. This will
enable a better understanding of the pathways by which accumulation is occurring in fish

64
species from the Derwent Estuary as well as the underlying mechanisms which influence
uptake rates of metals. In addition there is also a need to determine metal levels in other
species such as flounder which are commonly taken from the area and may be a particular
“risk” species to human health due to their benthic habitat and the fact that they are regularly
taken and consumed from Ralphs Bay.
In conclusion this study has clearly identified some significant management issues for the
Derwent Estuary. Health management research priorities may involve identifying “at risk”
groups of people and determining how best to make the health risks known to these people.
Whilst, environmental management research may involve looking at the potential affects of
any proposed activity on the bioavailability of metals and the uptake by fish.
65
6. References
Adams, D.H., McMichael, R.H., 1999. Mercury levels in four species of sharks from the Atlantic coast
of Florida. Fisheries Bulletin 97, 372-379.
Alquezar, R., Markich, S.J., Booth, D.J., 2006. Metal accumulation in the smooth toadfish,
Tetractenos glaber, in estuaries around Sydney, Australia. Environmental Pollution 142, 123-
131.
Ashraf, M., Jaffar, M., 1988. Weight dependence of arsenic concentration in the Arabian Sea tuna fish.
Bulletin of Environmental Contamination and Toxicology 40, 219-225.
Asuquo, F.E., Ewa-Oboho, I., Asuquo, E.F., Udo, P.J., 2004. Fish species used as biomarker for heavy
metal and hydrocarbon contamination for Cross River, Nigeria. The Environmentalist 24, 29-
37.
Bache, C.A., Gutemann, W.H., Lisk, D.J., 1971. Residues of total mercury and methylmercuric salts
in lake trout as a function of age. Science 172, 951-952.
Beamish, R.J., Fournier, D.A., 1981. A method for comparing the precision of a set of age
determinations. Canadian Journal of Fisheries and Aquatic Sciences 38, 982-983.
Birch, G.F., 2000. Marine pollution in Australia, with special emphasis on central New South Wales
estuaries and adjacent continental margin. International Journal of Environment and Pollution
13, 573-607.
Blevins, R.D., Pancorbo, O.C., 1986. Metal concentrations in muscle of fish from aquatic systems in
east Tennessee, USA. Water, Air, & Soil Pollution 29, 361-371.
Bloom, H., 1975. Heavy metals in the Derwent Estuary. Chemistry Department, University of
Tasmania, pp. 1-121.
Bloom, H., Ayling, G.M., 1977. Heavy metals in the Derwent Estuary. Environmental Geology 2, 3-
22.
Brooks, R.R., Rumsey, D., 1974. Heavy metals in some New Zealand commercial sea fishes. NZ J.
Mar. Freshw. Res. 8, 155-166.
Bryan, G.W., 1980. Recent trends in research on heavy-metal contamination in the sea. Helgoland
Marine Research 33, 6-25.
Bu-Olayan, A.H., Thomas, B.V., 2005. Toxicity and bioaccumulation of heavy metals in mullet fish
Liza klunzingeri (Mugilidae: Perciformes). Chemistry in Ecology 21, 191-197.
Burger, J., 2007. Heavy Metals in Pacific Cod (Gadus macrocephalus) from the Aleutians: Location,
Age, Size, and Risk. Journal of Toxicology and Environmental Health, Part A 70, 1897-1911.

66
Burger, J., Gaines, K.F., Boring, C.S., Stephens, W.L., Snodgrass, J., Dixon, C., McMahon, M.,
Shukla, S., Shukla, T., Gochfeld, M., 2002. Metal levels in fish from the Savannah River:
Potential hazards to fish and other receptors. Environmental Research 89, 85-97.
Burger, J., Gochfeld, M., 2007. Knowledge about fish consumption advisories: A risk communication
failure within a university population. Science of the Total Environment, The.
Burger, J., Orlando, E.F., Gochfeld, M., Binczik, G.A., Guillette, L.J., 2004. Metal levels in tissues of
Florida gar (Lepisosteus Platyrhincus) from Lake Okeechobee. Environmental Monitoring and
Assessment 90, 187-201.
Burger, J., Pflugh, K.K., Lurig, L., Von Hagen, L.A., Von Hagen, S., 1999b. Fishing in urban New
Jersey: Ethnicity affects information sources, perception, and compliance. Risk Analysis 19,
217-229.
Burger, J., Stephens, W.L., Boring, C.S., Kuklinski, M., Gibbons, J.W., Gochfeld, M., 1999a. Factors
in exposure assessment: ethnic and socioeconomic differences in fishing and consumption of
fish caught along the Savannah River. Risk Analysis 19, 427-438.
Burton, G.A., Denton, D.L., Ho, K., Ireland, D.S., 2003. Sediment toxicity testing: issues and
methods. In: Hoffman, D.J., Rattner, B.A., Burton, G.A., Cairns, J. (Eds), Handbook of
Ecotoxicology (2nd
edition). Lewis Publishers, New York, pp. 111-150.
Calta, M., Canpolat, O., 2006. The comparison of three cyprinid species in terms of heavy metals
accumulation in some tissues. Water Environment Research 78, 548-551.
Campbell, K.R., 1994. Concentrations of heavy metals associated with urban runoff in fish living in
stormwater treatment ponds. Archives of Environmental Contamination and Toxicology 27,
352-356.
Carvalho, M.L., Santiago, S., Nunes, M.L., 2005. Assessment of the essential element and heavy metal
content of edible fish muscle. Analytical and Bioanalytical Chemistry 382, 426-432.
Chernoff, B., Dooley, J., 1979. Heavy metals in relation to the biology of the mummichog, Fundulus
heteroclitus. Journal of Fisheries Biology 14, 309-328.
Choi, S.C., Bartha, R., 1994. Environmental factors affecting mercury methylation in estuarine
sediments. Bulletin of Environmental Contamination and Toxicology 53, 805-812.
Cooper, R.J., Langlois, D., Olley, J., 1982. Heavy metals in Tasmanian shellfish. Journal of Applied
Toxicology 2, 99-109.
Correll, D.L., 1978. Estuarine productivity. BioScience 28, 646-650.
Cucherousset, J., Ombredane, D., Charles, K., Marchand, F., Bagliniere, J.L., 2005. A continuum of
life history tactics in a brown trout (Salmo trutta) population. Canadian Journal of Fisheries
and Aquatic Sciences 62, 1600-1610.
Curtis, T.D., Shima, J.S., 2005. Geographic and sex-specific variation in growth of yellow-eyed
mullet, Aldrichetta forsteri, from estuaries around New Zealand. New Zealand Journal of
Marine and Freshwater Research 39, 1277-1285.

67
DEP (Derwent Estuary Program), Should I eat shellfish and flathead from the Derwent?, Health
advisory for recreational fishers, July 2007.
Dix, T.G., Martin, A., Ayling, G.M.., Wilson, K.C., Ratkowsky, D.A., 1975. Sand flathead
(Platycephalus bassensis) an indicator species for mercury pollution in Tasmanian waters.
Marine Pollution Bulletin 6, 142-143.
DPI (New South Wales Department of Primary Industries), Fishing and Aquaculture, Common
Recreational Fish Species. Dec 2005.
<http://www.dpi.nsw.gov.au/fisheries/recreational/saltwater-fishing/sw-species/tiger-
flathead2 >. [accessed 2007 Dec 10]
DPIW (Tasmania Department of Primary Industries and Water), Sea Fishing and Aquaculture Fish
Fact Sheets- Species Information. October 2007.
< http://www.dpiw.tas.gov.au/inter.nsf/WebPages/LVAE-57H8NL?open>. [accessed 2007 Dec
10]
DPIW (Tasmanian Department of Primary Industries and Water), Sea Fishing and Aquaculture Hot
Fishing Spots- Southern Tasmania. October 2007.
< http://www.dpiw.tas.gov.au/inter.nsf/WebPages/ALIR-4YB6HE?open> [accessed 2007 Nov
10]
DPIW (Tasmanian Department of Primary Industries and Water), Sea Fishing and Aquaculture Size
Limits. January 2008.
< http://www.dpiw.tas.gov.au/inter.nsf/WebPages/ALIR-4YAVA8?open> [accessed 2008 Feb
8]
Edgar, G.J., 1997. Australian Marine Life; the plants and animals of temperate waters. Reed Books,
Victoria, 402-500.
Edgar, G.J., Barrett, N.S., Graddon, D.J., 1999. A classification of Tasmanian estuaries and
assessment of their conservation significance using ecological and physical attributes,
population and land use. Technical Report. Marine Research Laboratories, TAFI,
Tasmania.
Edmonds, J.S., Francesconi, K.A., Cannon, J.R., Raston, C.L., Skelton, B.W., White, A.H., 1977.
Isolation, crystal structure and synthesis of arsenobetaine, the arsenical constituent of the
western rock lobster Panulirus longipes cygnus George. Tetrahedron Letters 18, 1543-1546.
Egeland, G.M., Middaugh, J.P., 1997. Balancing fish consumption benefits with mercury exposure.
Science 278, 1904.
Eustace, I.J., 1974. Zinc, cadmium, copper and manganese in species of finfish and shellfish caught in
the Derwent Estuary, Tasmania. Australian Journal of Marine and Freshwater Research 25,
209-220.
Ewing, G.P., Lyle, J.M., Murphy, R.J., Kalish, J.M., Ziegler, P.E., 2007. Validation of age and growth
in a long-lived temperate reef fish using otolith structure, oxytetracycline and bomb
radiocarbon methods. Marine and Freshwater Research 58, 1-12.
Fabris, G.J., Monahan, C., Nicholson, G., Walker, T.I., 1992. Total mercury concentrations in sand
flathead, Platycephalus bassensis Cuvier & Valenciennes, from Port Phillip Bay, Victoria.
Australian Journal of Marine and Freshwater Research 43, 1393-1402.

68
Fabris, G.J., Theodoropoulos, T., Sheehan, A., Abbott, B., 1999. Mercury levels and organochlorines
in black bream, Acanthopagrus butcheri, from the Gippsland Lakes, Victoria, Australia:
Evidence for temporal increases in mercury levels. Marine Pollution Bulletin 38, 970-976.
Farkas, A., Salánki, J., Specziár, A., 2003. Age-and size-specific patterns of heavy metals in the
organs of freshwater fish Abramis brama L. populating a low-contaminated site. Water
Research 37, 959-964.
Filazi, A., Baskaya, R., Kum, C., Hismiogullari, S.E., 2003. Metal concentrations in tissues of the
Black Sea fish Mugil auratus from Sinop-Icliman, Turkey. Human & Experimental
Toxicology 22, 85.
Foster, E.P., Drake, D.L., DiDomenico, G., 2000. Seasonal changes and tissue distribution of mercury
in Largemouth bass (Micropterus salmoides) from Dorena Reservoir, Oregon. Archives of
Environmental Contamination and Toxicology 38, 78-82.
Francesconi, K.A., Lenanton, R.C.J., Caputi, N., Jones, S., 1997. Long-term study of mercury
concentrations in fish following cessation of a mercury-containing discharge. Marine
Environmental Research 43, 27-40.
FSANZ (Food Standards Australia and New Zealand). Regulations for mercury in fish. March 2004.
<http://www.foodstandards.gov.au/newsroom/factsheets/factsheets2004/mercuryinfishfurther2
394.cfm>. [accessed 2008 Feb 2]
Gislason, H., Sinclair, M., Sainsbury, K., O’Boyle, R., 2000. Symposium overview: incorporating
ecosystem objectives within fisheries management. Journal of Marine Science 57, 468-475.
Glover, J.W., 1979. Concentrations of arsenic, selenium and ten heavy metals in School shark,
Galeorhinus australis (Macleay), and Gummy shark, Mustelus antarcticus Günther, from
south-eastern Australian Waters. Australian Journal of Marine and Freshwater Research 30,
505-510.
Graynoth, E., 1996. Determination of the age of Brown and Rainbow trout in a range of New Zealand
lakes. Marine & Freshwater Research 47, 749-756.
Green, G., Coughanowr, C., 2003. State of the Derwent Estuary 2003: a review of pollution sources,
loads and environmental quality data from 1997 - 2003. Derwent Estuary Program, DPIWE,
Tasmania.
Han, B.C., 1998. Estimation of target hazard quotients and potential health risks for metals by
consumption of seafood in Taiwan. Archives of Environmental Contamination and
Toxicology 35, 711-720.
Hardisty, M.W., Huggins, R.J., Kartar, S., Sainsbury, M., 1974. Ecological implications of heavy
metal in fish from the Severn Estuary. Marine Pollution Bulletin 5, 12-15.
Hill, W.R., Stewart, A.J., Napolitano, G.E., 1996. Mercury speciation and bioaccumulation in lotic
primary producers and primary consumers. Canadian Journal of Fisheries and Aquatic
Sciences 53, 812-819.
Hornung, H., Krom, M.D., Cohen, Y., Bernhard, M., 1993. Trace metal content in deep-water sharks
from the eastern Mediterranean Sea. Marine Biology 115, 331-338.

69
Hueter, R.E., Fong, W.G., Henderson, G., French, M.F., Manire, C.A., 1995. Methylmercury
concentration in shark muscle by species, size and distribution of sharks in Florida coastal
waters. Water, Air, & Soil Pollution 80, 893-899.
Hylland, K., Beyer, J., Berntssen, M., Klungsøyr, J., Lang, T., Balk, L., 2006. May organic pollutants
affect fish populations in the North Sea? Journal of Toxicology and Environmental Health,
Part A 69, 125-138.
IFS (Inland Fisheries Service), Fact Sheet for Brown Trout. August 2006. <http://www.ifs.tas.gov.au/ifs/IFSDatabaseManager/SpeciesDatabase/brown-trout> [accessed
2007 Oct 23]
IFS (Inland Fisheries Service), Fisheries Performance Assessment Program Report- Tombs Lake
2003.
Järup, L., 2003. Hazards of heavy metal contamination. British Medical Bulletin 68, 167-182.
Jernelov, A., Asell, B., 1973. The feasibility of restoring mercury-contaminated waters. In: Krenkel,
P.A. (Ed), Heavy Metals in the Aquatic Environment. Pergamon Press, New York, pp. 299-
309.
Jones, B.G., Chenhall, B.E., Debretsion, F., Hutton, A.C., 2003. Geochemical comparisons between
estuaries with non-industrialised and industrialised catchments: the Huon and Derwent River
estuaries, Tasmania. Australian Journal of Earth Sciences 50, 653-667.
Jordan, A.R., 2001. Reproductive biology, early life-history and settlement distribution of sand
flathead (Platycephalus bassensis) in Tasmania. Marine & Freshwater Research 52, 589-601.
Jordan, A.R., Mills, D.M., Ewing, G.P., Lyle, J.M., 1998. Assessment of inshore habitats around
Tasmania for life-history stages of commercial finfish species.
Kestemont, P., 1999. Spawning migrations, sexual maturity and sex steroid levels in female roach
Rutilus rutilus from the River Meuse. Aquatic Sciences-Research Across Boundaries 61, 111-
121.
Kirby, J., 2001. Changes in selenium, copper, cadmium, and zinc concentrations in Mullet (Mugil
cephalus) from the southern basin of Lake Macquarie, Australia, in response to alteration of
coal-fired power station fly ash handling procedures. Archives of Environmental
Contamination and Toxicology 41, 171-181.
Kurland, L.T., Faro, S.N., Seidler, H., 1960. Minamata disease. World Neurology, 1, 370-390.
Larsen, E.H., Pritzl, G., Hansen, S.H., 1993. Arsenic speciation in seafood samples with emphasis on
minor constituents: An investigation using high-performance liquid chromatography with
detection by inductively coupled plasma mass spectrometry. Journal of Analytical Atomic
Spectrometry 8, 1075-1084.
Laws, E.A., 2000. Aquatic Pollution: An Introductory Text (3rd
Edition). John Wiley & Sons, Inc.
New York, pp. 369-425.
Liao, C.M., Chen, B.C., Singh, S., Lin, M.C., Liu, C.W., Han, B.C., 2003. Acute toxicity and
bioaccumulation of arsenic in tilapia (Oreochromis mossambicus) from a blackfoot disease
area in Taiwan. Environmental Toxicology 18, 252-259.

70
Lyle, J.M., 2005. 2000/01 Survey of Recreational Fishing in Tasmania. Tasmanian Aquaculture and
Fisheries Institute.
MacKay, N.J., Kazacos, M.N., Williams, R.J., Leedow, M.I., 1975. Selenium and heavy metals in
black marlin. Marine Pollution Bulletin 6, 57-61.
Mason, R.P., Reinfelder, J.R., Morel, F.M.M., 1995. Bioaccumulation of mercury and methylmercury.
Water, Air, & Soil Pollution 80, 915-921.
Miettinen, J.K., 1973. The accumulation and excretion of heavy metals in organisms. In: Krenkel, P.A.
(Ed), Heavy Metals in the Aquatic Environment. Pergamon Press, New York, pp. 163-165.
Morel, F.M.M., Kraepiel, A.M.L., Amyot, M., 1998. The chemical cycle and bioaccumulation of
mercury. Annual Review of Ecology and Systematics 29, 543-566.
Morison, A.K., Coutin, P.C., Robertson, S.G., 1998. Age determination of black bream,
Acanthopagrus butcheri (Sparidae), from the Gippsland Lakes of south-eastern Australia
indicates slow growth and episodic recruitment. Marine & Freshwater Research 49, 491-498.
Morton, A., Lyle, J.M., Welsford, D.C., 2005. Biology and status of key recreational finfish in
Tasmania. TAFI report No. 25.
Olsson, P.E., Larsen, A., Haux, A., 1996. Influence of seasonal changes in water temperature on
cadmium inducibility of hepatic and renal metallothionein in Rainbow Trout. Marine
Environmental Research 42, 41-44.
Park, J.G., Curtis, L.R., 1997. Mercury distribution in sediments and bioaccumulation by fish in two
Oregon reservoirs: Point-source and nonpoint-source impacted systems. Archives of
Environmental Contamination and Toxicology 33, 423-429.
Peakall, D., Burger, J., 2003. Methodologies for assessing exposure to metals: speciation,
bioavailability of metals and ecological host factors. Ecotoxicology and Environmental Safety
56, 110-121.
Pond.dnr.cornell.Edu: Sep 2007.
<http://pond.dnr.cornell.edu/nyfish/Salmonidae/brown_trout.html&h=382&w=1000&sz=262
&hl=en&start=1&um=1&tbnid=B6JmNrY3tp1gPM:&tbnh=57&tbnw=149&prev=/images%
3Fq%3Dbrown%2Btrout%26um%3D1%26hl%3Den%26sa%3DG>. [accessed 2007 Dec 10]
Potter, I.C., Hyndes, G.A., 1999. Characteristics of the ichthyofaunas of southwestern Australian
estuaries, including comparisons with holarctic estuaries and estuaries elsewhere in temperate
Australia: a review. Australian Journal of Ecology 24, 395-421.
Pourang, N., 1995. Heavy metal bioaccumulation in different tissues of two fish species with regards
to their feeding habits and trophic levels. Environmental Monitoring and Assessment 35, 207-
219.
Rashed, M.N., 2001. Cadmium and lead levels in fish (Tilapia Nilotica) tissues as biological indicator
for lake water pollution. Environmental Monitoring and Assessment 68, 75-89.
Ratkowsky, D.A., Dix, T.G., Wilson, K.C., 1975. Mercury in fish in the Derwent Estuary, Tasmania,
and its relation to the position of the fish in the food chain. Australian Journal of Marine and
Freshwater Research 26, 223-231.

71
Sarre, G.A., Platell, M.E., Potter, I.C., 2000. Do the dietary compositions of Acanthopagrus butcheri
in four estuaries and a coastal lake vary with body size and season and within and amongst
these water bodies? Journal of Fish Biology 56, 103-122.
Sorensen, E.M.B., 1991. Metal Poisoning in Fish, CRC Press, Boston, pp. 1-353.
Szefer, P., Domagala-Wieloszewska, M., Warzocha, J., Garbacik-Wesolowska, A., Ciesielski, T.,
2003. Distribution and relationships of mercury, lead, cadmium, copper and zinc in perch
(Perca fluviatilis) from the Pomeranian Bay and Szczecin Lagoon, southern Baltic. Food
Chemistry 81, 73-83.
Thomson, J.D., 1985. Mercury concentrations of the axial muscle tissue of some marine fishes of the
continental shelf adjacent to Tasmania. Australian Journal of Marine and Freshwater Research
36, 509-517.
Thrower, S., Eustace, I., 1973. Heavy metals in Tasmanian oysters in 1972. Australian Fisheries, Oct
1973, 7-10.
Toth, J.F., Jr., and R.B., Brown., 1997. Racial and gender meanings of why people participate in
recreational fishing. Leisure Science 19, 129 –136.
Ullrich, S.M., Tanton, T.W., Abdrashitova, S.A., 2001. Mercury in the aquatic environment: A review
of factors affecting methylation. Critical Reviews in Environmental Science and Technology
31, 241-293.
Walker, T. I.., 1982. Effects of length and locality on the mercury content of blacklip abalone,
Notohaliotis ruber (Leach), blue mussel, Mytilus edulis planulatus (Lamarck), sand flathead,
Platycephalus bassensis Cuvier and Valenciennes, and yank flathead, Platycephalus
caeruleopuntatus (McCulloch), from Port Phillip Bay, Victoria. Australian Journal of Marine
and Freshwater Research 33, 553-560.
Watras, C.J., Bloom, N.S., 1992. Mercury and methylmercury in individual zooplankton: Implications
for bioaccumulation. Limnology and Oceanography 37, 1313-1318.
Wiener, J.G., Krabbenhoft., D.P., Heinz, G.H., Scheuhammer, A.M., 2003. Ecotoxicology of mercury.
In: Hoffman, D.J., Rattner, B.A., Burton, G.A., Cairns, J. (eds), Handbook of Ecotoxicology
(2nd
Edition). Lewis Publishers, New York, pp. 409-443.
Wild Thing Adventures, Map of Bruny Island. 2008.
< http://www.wildthingadventures.com.au/ >. [accessed 2008 Jan 15]
Williamson, R.B., Morrisey, D.J., 2000. Stormwater contamination of urban estuaries. 1. Predicting
the build-up of heavy metals in sediments. Estuaries 23, 56-66.

72
Appendix 1
Heavy metal analysis protocols
Program No. 2
1. Step to 30oC
2. Hold for 600 mins
3. Ramp to 100oC at 1
oC/min
4. Hold for 120 mins
5. Cool to room temperature
Program No. 3
1. Step to 30oC
2. Hold for 180 mins
3. Ramp to 100oC at 1
oC/min
4. Hold for 120 mins
5. Cool to room temperature
Program No. 4
1. Step to 30oC
2. Hold 600 mins
3. Ramp 97oC at 1
oC/min
4. Hold 180 mins
5. Cool to room temperature
AST quality control samples (as outlined by AST methods)
Heavy metal suite- quality control samples run:
One standard reference material (SRM) with each batch of samples
One reagent blank per batch
One blank matrix spike per batch by addition of 1000 µL of Multi-element
standard to blank reagents
One sample duplicate per batch (min)
One sample matrix spike per batch (min) by addition of 1000 µL of multi-
element spiking standard to a sample
Acceptance/rejection of results:
Sample preparation blanks should be less than the MRL (minimum readable
level)
Blank matrix spikes must be within 25% of the theoretical value
Matrix spikes must be within 25% of the theoretical value

73
Duplicates must be within 20% of each other
SRM must be within three standard deviations from the mean with no more
than two consecutive results between two and three standard deviations from
the mean value
Mercury- quality control samples run:
One preparation blank per analysis batch
One blank recovery per analysis batch
One duplicate sample for every 20 samples
One sample recovery for every 20 samples (sample recoveries spiked with 500
µL of spiking standard
A calibration verification standard is to be run immediately after the
calibration at intervals of at least 20 samples
Acceptance/rejection of results:
The preparation blank should be less than or equal to the MRL
Duplicates should agree to within 20% of the mean
Samples and blank recoveries should be within 25% of the theoretical value of
1.00 µg/L
Calibration verification standards must be within three standard deviations
from the mean with no more than two consecutive results between two and
three standard deviations from the mean value
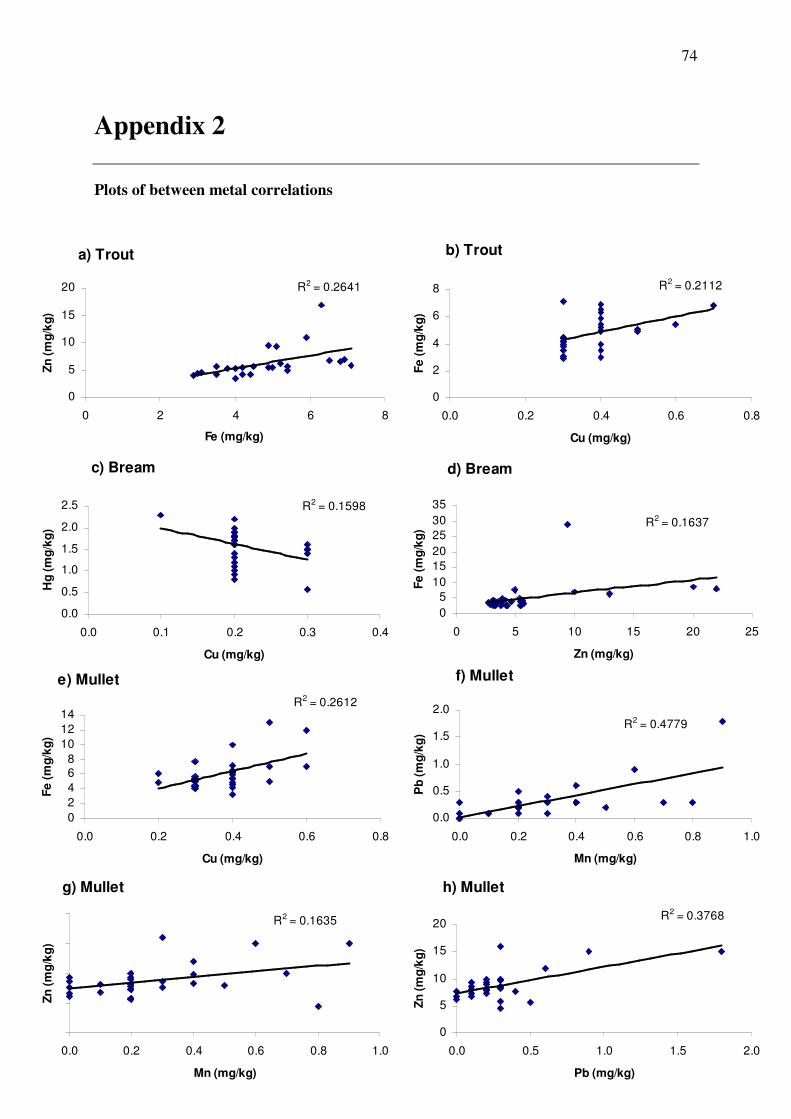
74
Appendix 2
Plots of between metal correlations
d) Bream
R2 = 0.1637
0
5
10
15
20
25
30
35
0 5 10 15 20 25
Zn (mg/kg)
Fe
(m
g/k
g)
b) Trout
R2 = 0.2112
0
2
4
6
8
0.0 0.2 0.4 0.6 0.8
Cu (mg/kg)
Fe
(m
g/k
g)
c) Bream
R2 = 0.1598
0.0
0.5
1.0
1.5
2.0
2.5
0.0 0.1 0.2 0.3 0.4
Cu (mg/kg)
Hg
(m
g/k
g)
a) Trout
R2 = 0.2641
0
5
10
15
20
0 2 4 6 8
Fe (mg/kg)
Zn
(m
g/k
g)
e) Mullet
R2 = 0.2612
0
2
4
68
10
12
14
0.0 0.2 0.4 0.6 0.8
Cu (mg/kg)
Fe
(m
g/k
g)
f) Mullet
R2 = 0.4779
0.0
0.5
1.0
1.5
2.0
0.0 0.2 0.4 0.6 0.8 1.0
Mn (mg/kg)
Pb
(m
g/k
g)
g) Mullet
R2 = 0.1635
0.0 0.2 0.4 0.6 0.8 1.0
Mn (mg/kg)
Zn
(m
g/k
g)
h) Mullet
R2 = 0.3768
0
5
10
15
20
0.0 0.5 1.0 1.5 2.0
Pb (mg/kg)
Zn
(m
g/k
g)
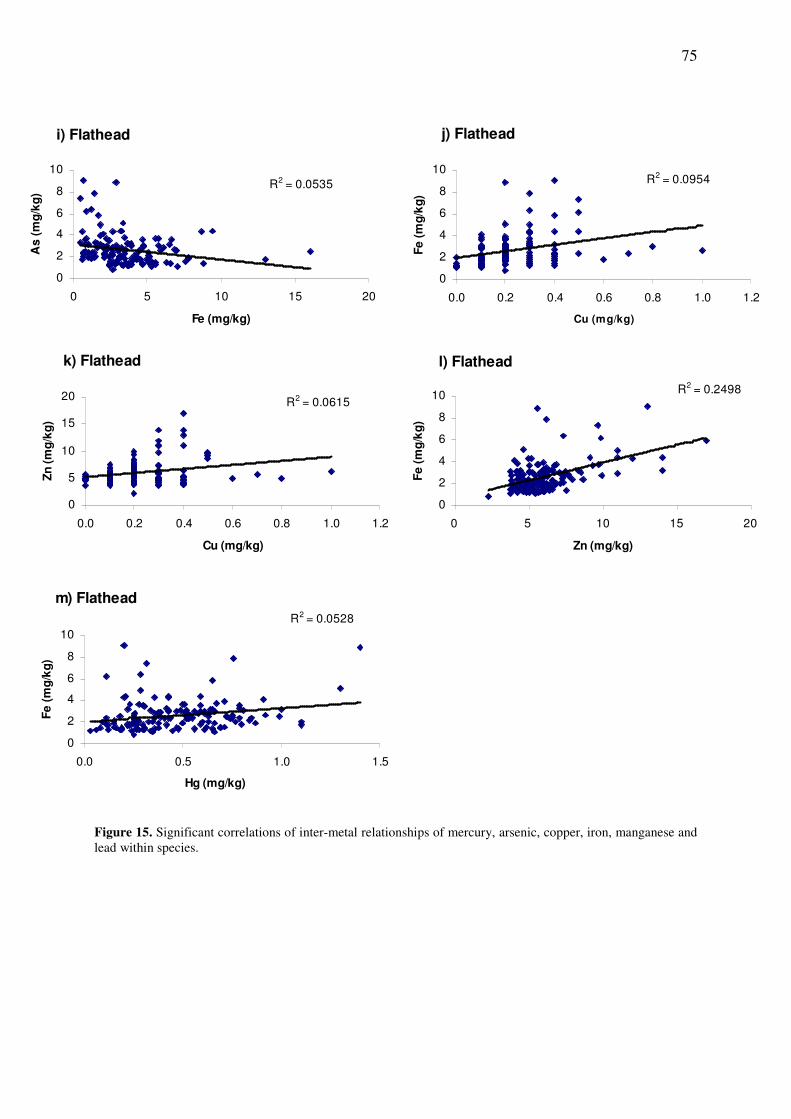
75
Figure 15. Significant correlations of inter-metal relationships of mercury, arsenic, copper, iron, manganese and
lead within species.
i) Flathead
R2 = 0.0535
0
2
4
6
8
10
0 5 10 15 20
Fe (mg/kg)
As
(m
g/k
g)
j) Flathead
R2 = 0.0954
0
2
4
6
8
10
0.0 0.2 0.4 0.6 0.8 1.0 1.2
Cu (mg/kg)
Fe
(m
g/k
g)
k) Flathead
R2 = 0.0615
0
5
10
15
20
0.0 0.2 0.4 0.6 0.8 1.0 1.2
Cu (mg/kg)
Zn
(m
g/k
g)
l) Flathead
R2 = 0.2498
0
2
4
6
8
10
0 5 10 15 20
Zn (mg/kg)
Fe
(m
g/k
g)
m) Flathead
R2 = 0.0528
0
2
4
6
8
10
0.0 0.5 1.0 1.5
Hg (mg/kg)
Fe
(m
g/k
g)

76

77
Appendix 3
Mercury accumulation in marine fish: A literature
review
Jeremy Verdouw
Literature Review submitted in partial fulfilment of the requirements
for Honours in Aquaculture
National Centre for Marine Conservation and Resource Sustainability
University of Tasmania
2008
Word count: 4200

78
1. Introduction
Heavy metals include the transitional metals (eg. cobalt, copper, iron and manganese) and the
metalloids (eg. arsenic, cadmium, lead, mercury, selenium and tin) (Kennish, 2001). The
transitional metals are essential in low concentrations for normal function in organisms but
may be toxic at high concentrations (Kennish, 2001; Carvalho et al., 2005), whereas the
metalloids are not generally required for normal function in organisms and are toxic at low
concentrations (Kennish, 2001; Jarup, 2003). Another group of metal compounds called
organometals (eg. alkylated lead, tributyl tin and methylmercury) are particularly toxic and
present a danger to marine organisms as well as humans consuming seafood (Kennish, 2001).
Of all the heavy metals, mercury and its compounds are considered the most toxic and hence
have been the most studied (Morel et al., 1998; Carvalho et al., 2005).
Mercury is a volatile metal which occurs in a liquid state at room temperature (Berlin, 1979).
It is found in minute concentrations in all natural systems; however, it is a non essential heavy
metal which is toxic to humans and animals in trace amounts (Holden, 1973; Berlin, 1979).
Mercury is easily evaporated into the atmosphere and is also highly persistent when in the
natural environment. These properties mean that it can be atmospherically transported over
wide areas and thus it is an important environmental contaminant (Foster et al., 2000;
Carvalho et al., 2005). This, along with the fact that mercury and its compounds are readily
absorbed and retained, means human exposure and possible toxicity is likely.
The known health effects of mercury on humans are many and varied (Berlin, 1979; Table 1).
All forms of mercury are toxic and have been associated with a range of serious human health

79
problems and in the most severe cases, even human mortalities (Kurland et al., 1960; Table
1). The most severe human health hazards are associated with the organic mercury compound
methylmercury (MeHg), which is readily absorbed and has a long retention time in the body
(Berlin, 1979; Table 1).
Table 1. The human health effects of mercury poisoning.
MERCURY
FORM
BIOLOGICAL
ACTION HEALTH IMPACTS REFERENCE
methylmercury
efficiently absorbed
through intestinal tract
neurological damage including
hearing and visual impairment,
damage to fetuses
Berlin, 1979; Egeland
and Middaugh, 1997;
Foster et al., 2000
mercury
vapour
lipid soluble, penetrates
membranes of body and is
easily absorbed
neurological damage, kidney toxicity
and immune system deficiency
Berlin, 1979; Bernier et
al., 1995; Goldman and
Shannon, 2001
mercury salts
formed from oxidation of
elemental mercury- little
absorbed
gastrointestinal disturbance and renal
(kidney) failure
Berlin, 1979; Goldman
and Shannon, 2001
The effects of MeHg on humans may be neurotoxic, teratologic (embryotoxic) and genetic
(Clarkson et al., 1973; Jarup, 2003). Neurotoxic effects arise from damage to the central
nervous system especially the visual cortex and the cerebellum (Clarkson et al., 1973).
Symptoms include: loss of vision, loss of hearing, difficulties with speech and loss of
sensation in the hands and feet (Berlin 1979). Children, fetuses and embryos are extremely
sensitive to the neurotoxic effects of MeHg which can lead to deformities in the developing
nervous systems in early life stages (Foster et al., 2000; Jarup, 2003).
Mercury exposure in humans may occur through water, air and food items (Jarup, 2003).
Although the primary route of exposure is through the consumption of contaminated food, in
particular fish (Foster et al., 2000; Jarup, 2003). Fish are increasingly being perceived as a
healthy and nutritious food source and as a result human consumption is increasing (Egeland
and Middaugh, 1997; Han et al., 1998; Carvalho et al., 2005). Fish contain essential fatty

80
acids and omega-3 which have been shown to benefit health in several ways including
reduced risk of cardiovascular disease (Egeland and Middaugh, 1997; Han et al., 1998;
Carvalho et al., 2005). However, at the same time it is well known that fish can be
contaminated with toxins, including mercury (Sweet and Zelikoff, 2001; Carvalho et al.,
2005). Elevated mercury concentrations in fish (ie. muscle tissue concentrations of 6 to
20ug/g or greater) may be toxic for the fish themselves and hazardous for human consumption
(Greenfield et al., 2001; Weiner et al., 2003). The potential for devastating effects associated
with the transfer of mercury from fish to humans first came to light in the Minamata Bay
disaster in Japan in 1953 where 46 people died and 100 were left seriously ill as a result of
mercury poisoning from contaminated seafood (Kurland et al., 1960). This tragic incident
sparked numerous studies into mercury levels in fish and the concomitant health effects on
humans (Wang, 2002). The fact that mercury exposure primarily occurs through consumption
of contaminated fish (Figure 1), places certain populations at greater risk.
Figure 1. Human exposure to methylmercury (adapted from Hartung, 1972).
Water: Methylation by bacteria in sediments
Uptake of methylmercury by aquatic organisms and food chain
FISH
Pathways: Air, water
Human exposure through consumption
Source of mercury: Volcanoes, rocks and soil; industrial processes, mining, fossil fuels, incineration

81
People who live in coastal areas and who consume large amounts of fish are particularly at
risk as they are more likely to accumulate high levels of mercury (Han et al., 1998).
Monitoring of mercury levels in fish is increasing throughout the world and fish consumption
advisories have been issued for areas where mercury concentrations have been found to be
excessively high (Foster et al., 2000). Efforts to understand the mechanisms and factors which
affect accumulation in fish should be a priority, in order to predict and prevent human health
risks associated with the consumption of fish.
1.1. Scope of literature review
The potential of mercury contamination to cause detrimental health affects in humans, the fact
that mercury concentrations are increasing in the environment and the ability of mercury to
bioaccumulate through food chains are the main reasons why mercury has been so widely
studied (Asuquo et al., 2004). Current research efforts are increasingly focusing on the
mechanisms behind mercury accumulation in fish and the influences on these processes
(Asuquo et al., 2004). There is a great need to understand the factors which influence mercury
accumulation in fish in order to predict the environmental conditions, species of fish and life
history characteristics of fish likely to cause human health problems. Studies into mercury
accumulation in marine fish is of great importance as they comprise the majority of fish
consumed by humans (Tidwell and Allan, 2001) and because some marine species have been
found to contain very high levels even in so called pristine locations (Hornung et al., 1993).
Understanding of mercury bioaccumulation in marine fish is therefore of great importance to
protection of human health. However, the most recent and most thorough review on mercury
bioaccumulation in fish was by Downs et al. (1998) which examined mercury in precipitation
and how it influences accumulation, with much of the reviewed research from freshwater
studies. Freshwater systems provide particularly useful study sites for research into

82
contamination because; 1) they tend to be highly impacted (Campbell, 1994), and 2) they are
often relatively closed systems from which trends can be easily observed. As this review is
primarily concerned with bioaccumulation in marine fish, it will overview the studies on
freshwater fish and discuss the findings and observations in terms of their relevance to marine
fish. The aims of this review are to look at the main factors which govern the accumulation of
mercury in marine fish including: levels in the environment; bioavailability, as well as uptake
and excretion and biological factors influencing mercury levels, and to discuss any recent
findings in this area and consider their importance for future research.
2. Mercury in the environment
The main factor which influences mercury accumulation in fish is the level in the
environment (Weiner et al., 2003). In order to be contaminated with mercury, fish must firstly
come into contact with it. The higher the concentration of mercury in the environment the
more an organism will be in contact with the toxin and hence the greater the chance of
accumulation (Weiner et al., 2003).
2.1. Sources of mercury in the environment
Mercury enters the environment naturally through geological weathering (Table 2; 1.1-1.3)
but human activities such as burning of fossil fuels, waste incineration, industry emissions
and mining have all increased its input (Table 2; 2.1-2.8). Mining is the main means by which
mercury enters the environment; both through ore wastes and via atmospheric deposition of
mercury vapour during roasting processes (Table 2; 2.2, 2.3). The ability of mercury to be
transported atmospherically over large distances (Rolfhus and Fitzgerald, 1995; Morel et al.,

83
1998; Boening, 2000) and its capacity to persist in the environment, mean that even
undisturbed waterways may have elevated levels of mercury in fish and wildlife and there is
potential for bioaccumulation in aquatic food webs (Morel et al., 1998; Clarkson and Strain,
2003).
Table 2. References citing natural and anthropogenic inputs of mercury into the aquatic environment.
SOURCE OF INPUT REFERENCE
1. natural input
1.1 geological weathering Thomson, 1985; Park and Curtis, 1997; Calta and Canpolat, 2006
1.2 leaching from soils Thomson, 1985; Sweet and Zelikoff, 2001; Calta and Canpolat, 2006
1.3 volcanic activity Boening, 2000; Sweet and Zelikoff, 2001
2. anthropogenic input
2.1 smelting processes Bloom and Ayling, 1977; Birch, 2000; Calta and Canpolat, 2006
2.2 mining Park and Curtis, 1997
2.3 atmospheric fallout Park and Curtis, 1997; Greenfield et al., 2001
2.4 paper mill effluent Bloom and Ayling, 1977
2.5 pesticides Forstner and Wittmann, 1979
2.6 urban stormwater Thomson, 1985; Campbell, 1994; Fabris et al., 2006
2.7 burning of fossil fuels Egeland and Middaugh, 1997; Boening, 2000; Sanzo et al., 2001
2.8 industrial wastes Holden, 1973; Egeland and Middaugh, 1997; Sanzo et al., 2001
2.2. Forms of mercury in the environment
Several forms of mercury occur in the environment; with varying degrees of toxicity
according to solubility, reactivity and biological effects (Berlin, 1979; Goldman and Shannon,
2001). Mercury occurs as elemental mercury (mercury vapour and mercury liquid), inorganic
compounds (mercury salts) and organic compounds (alkylmercury, alkoxyalkylmercury and
phenylmercury compounds) (Berlin, 1979; Goldman and Shannon, 2001; Sanzo et al., 2001).
In its inorganic forms (metal or metallic salts) mercury is moderately toxic, but it is highly
toxic in organically bound forms such as MeHg (Holden, 1973). Elemental mercury is
transformed into the organic mercury compound MeHg by microbial activity when it enters

84
the marine environment (Berlin, 1979). As well as being one of the most toxic mercury
compounds, MeHg is very efficiently taken up by biota (Jernelov and Asell, 1973; Boening,
2000) and is readily bioaccumulated through aquatic food chains. As a result MeHg may be
found in high levels and generally accounts for 80 to 100% of the total mercury content in
high trophic order fish ie. those which are often among the top predators in aquatic food
chains (Cappon and Smith, 1981; Dallinger et al., 1987; Wiener et al., 2003). The increase in
input of inorganic mercury into the environment means that an increase in MeHg is likely
(Holden, 1973).
3. Bioavailability of mercury
In order to be accumulated by fish and other biota, mercury must be present in an accessible
form. Most forms of mercury in the aquatic environment are readily taken up by marine
animals and are therefore bioavailable. However, the form which is most bioavailable is
MeHg (Wiener et al., 2003). This is primarily because MeHg has a strong affinity for lipids
and proteins and has a rather unique ability among mercury compounds to easily cross cell
membranes (Berlin, 1997). Therefore when it is produced in the sediments of the aquatic
environment, it is readily taken up by the surrounding biota (Forstner and Wittmann, 1979).
The level of MeHg in the environment will greatly influence the uptake of mercury by fish.
3.1 Mercury methylation
In the marine environment, MeHg is produced from the transformation of inorganic mercury
through a process known as methylation (Greenfield et al., 2001), which involves the
reduction of elemental mercury by microbial activity (Foster et al., 2000). This process

85
primarily occurs in the sediments, but has also been thought to occur below the mixed layer in
the oceans by bacteria which are present on marine snow (Downs et al., 1998). The
methylation of inorganic mercury to MeHg strongly influences the accumulation in fish
because it greatly increases the bioavailability and toxicity of mercury and increases the
potential for human exposure to MeHg. The processes which govern MeHg production will
greatly affect its uptake in fish (Wiener et al., 2003). MeHg production is strongly influenced
by factors which favour mercury methylating bacteria such as warmer sediment temperature
and low pH (Jernelov and Asell, 1973; Foster et al., 2000). The processes that govern
methylation rate should therefore be taken into account in studies and monitoring programs to
better understand them.
3.1.1. Affect of Temperature
Water temperature has a significant influence on many environmental and biological
processes including metabolism in fish and the production of MeHg and hence accumulation
of mercury in fish (Filazi et al., 2003; Foster et al., 2000). Warmer temperatures increase the
rate of microbial processes which leads to an increase in the production of the highly toxic
methylmercury which is readily taken up by biota (Foster et al., 2000). Therefore warmer
temperatures may lead to an increase in the accumulation of mercury by increasing the
bioavailability of the metal. Temperature changes are largely seasonal and result in increased
concentrations of MeHg in summer which may be reflected in fish tissue concentrations of
mercury (Foster et al., 2000). Consequently, seasonal/temperature differences in uptake need
to be included in any monitoring program.

86
3.1.2. Affect of pH
Water pH has been found to strongly influence mercury concentrations in fish in freshwater
lakes, with low pH water favouring MeHg production and hence bioavailabilty of mercury
(Suns and Hitchin, 1990). However this is unlikely to be a factor in marine fish as marine
systems maintain relatively constant pH levels (Greenfield et al., 2001). It may however, be a
factor in coastal marine areas and estuaries which are more subject to terrestrial inputs which
can alter water chemistry.
4. Uptake of mercury by fish
Fish readily uptake MeHg from the water column, sediments and dietary items however, diet
is the primary source (Wiener et al., 2003) with absorption rates estimated to be
approximately 90% (Goldman and Shannon, 2001). Consequently this review will be
restricted only to discussion of uptake via diet. Mercury concentrations have been strongly
linked with the feeding behaviour of fish (Ratkowsky et al., 1975; Pourang, 1995), with
specific aspects of feeding behaviour and diet affecting uptake (ie. feeding preference (benthic
versus pelagic) and trophic level).
4.1. Feeding preference
Both the habitat in which a species of fish resides and its source of food will have a large
influence on the levels of mercury it will be exposed to and hence how much it may
accumulate. For example, fish which dwell and feed primarily in the sediments are likely to
uptake more mercury, as aquatic sediments serve as both a sink and a source of organic and

87
inorganic pollutants (Burton et al., 2003), most notably heavy metals, which enter the system
(Campbell, 1994). The majority of benthic invertebrates (which are common prey items of
benthic fish species) obtain nutrition through the digestion of sediment material (Campbell,
1994). Prey items are often relatively unaffected by high levels of mercury and consequently
can obtain very high concentrations (Rainbow, 1990). As a result fish that feed on benthic
invertebrates (benthic feeders) are likely to accumulate high levels of mercury (Blevins and
Pancorbo, 1986). In contrast to this, the pelagic food chain has little or no interaction with the
sediments and mercury uptake begins with the uptake of trace amounts present in the water by
phytoplankton (Burton and Statham, 1990; Wiener et al., 2003). Mercury is still accumulated
in the pelagic food chain but at much lower levels; high levels only occurring in large, long
lived species. Benthic feeders therefore have a much greater potential to accumulate high
levels of mercury than pelagic feeders.
4.2. Trophic level
Uptake and hence accumulation of mercury in fish has also been found to be affected by
trophic level (Watras and Bloom, 1992; Pourang, 1995; Hill et al., 1996). Aquatic systems are
particularly susceptible to pollution due mainly to the structure of their food chains (Forstner
and Wittmann, 1979). The small biomass in aquatic environments is produced through a
greater variety of trophic levels than land systems, allowing for greater accumulation of toxic
substances (Forstner and Wittmann, 1979). All fish contain small natural levels of mercury
and other essential heavy metals in their bodies which have no measurable affect on the fish
(Hornung et al., 1993). Mercury is therefore concentrated in prey items and up though the
food chain (Watras and Bloom, 1992), and the result is accumulation in top order predator
species (Figure 2).

88
Figure 2. Food chain model for mercury accumulation (adapted from Goldman and Shannon, 2001).
This is known as biomagnification where contaminant levels increase through successive
links in the food chain (Blevins and Pancorbo, 1986; Dallinger et al., 1987; Downs et al.,
1998). High levels can be obtained in species of shark even in pristine environments
(Hornung et al., 1993). This is simply a reflection of their high trophic status and size (Adams
and McMichael, 1999). Human consumption of high trophic species such as sharks can
therefore be considerably risky from a health point of view (Hornung et al., 1993; Adams and
McMichael, 1999). Top predator fish species should only be consumed if comprehensive
monitoring and testing of edible tissue for mercury levels has taken place, otherwise they
should be avoided or their intake limited to reduce the risk of mercury poisoning.
Sediment
Water
Algae
Zooplankton
Fish
Predatory Fish
Birds
Mammals
Man

89
5. Excretion of mercury by fish
The potential for heavy metal accumulation is largely governed by the ability of the organism
to either excrete or, store (partition) pollutants (Bryan, 1979). Fish are generally able to
regulate essential metals to maintain optimum levels and prevent toxicity (Giesy and Wiener,
1977), but, like most other animals they are unable to regulate levels of non essential metals
including mercury (Giesy and Wiener, 1977) and particularly MeHg, which is very persistent.
Of all the various forms of mercury, MeHg has the slowest rate of elimination (Miettinen,
1973), with a half life in the muscle of some fish species estimated at 2-3 years (Sorensen,
1991). The highest levels will often be found in the edible muscle tissue as opposed to other
organs because fish are able to move MeHg from organs, such as the liver and kidney, to the
muscle where it tends to accumulate (Wiener et al., 2003). Therefore mercury detoxification
in fish is by sequestration rather than elimination (Arnac and Lassus, 1985). This may be a
protective mechanism by fish to prevent the toxic effects on the nervous system (Wiener et
al., 2003). However, this makes accumulation of MeHg in fish an even greater human health
concern as fish muscle tissue is generally the part of the fish which is consumed.
6. Biological factors influencing mercury levels in fish
Once mercury has been taken up by fish there are two main biological factors which then
govern the final concentration. These are growth rate and age/size of the fish (Hornung et al.,
1993; Harris and Bodaly, 1998).

90
6.1. Growth rate
Fish growth rate can greatly influence mercury levels in fish (Harris and Bodaly, 1998). Most
of the studies which have looked at the effects of growth rate on mercury accumulation in fish
have been on freshwater species, however, the trends/findings are as applicable to marine
species. Higher growth rates in fish can result in reduced mercury concentrations due to
growth dilution (Arnac and Lassus, 1985; Park and Curtis, 1997; Simoneau et al., 2005).
Whereby faster growth means that less time is required to reach a given size, consequently
less time is spent metabolising and eating food for metabolic needs, and therefore both
cumulative mercury exposure and concentration in faster growing fish is lower (Harris and
Bodaly, 1998). The converse is true for slower growth rates; in temperate systems, which
experience cooler water temperatures, fish metabolism is slowed and fish eat less resulting in
a reduction in, or cessation of, growth (Kehrig et al., 1998). Furthermore, studies have shown
that some species of fish will actually lose body mass during winter when using up existing
energy reserves (Kehrig et al., 1998). When body mass is lost any mercury present in the flesh
will become more concentrated (Kehrig), this is known as starvation concentration (Cizdziel
et al., 2002). As undernourished fish catabolise muscle tissue for energy the overall muscle
mass is reduced faster than the bound MeHg therefore effectively increasing the concentration
of mercury in the remaining tissue resulting in internal bioconcentration (Cizdziel et al.,
2002). Muscle tissue may receive MeHg from organs during decontamination periods
(Cizdziel et al., 2003). Therefore in temperate waters where there are distinct seasons, it is
highly likely that fish growth may be reduced and MeHg levels increased. Starvation
concentration can also be observed in dwarf fish. Dwarf fish are individuals which have
slower growth rates than fish of the same species and are much smaller in size than fish of a
similar age (Doyon et al., 1998). Dwarf fish tend to allocate more energy towards
maintenance and less to flesh production and therefore growth rates of dwarf fish are much

91
slower (Doyon et al., 1998). As a result dwarf fish produce proportionally less flesh than
normal fish which means higher mercury concentrations can be found in body tissues (Doyon
et al., 1998). This once again identifies the need for monitoring and testing of fish to be
carried out across different seasons especially in temperate regions of the world as seasonal
temperature changes are likely to have a strong influence on accumulation in marine fish.
6.2. Age / size
Also influencing the accumulation of mercury in a particular fish is age and or size.
Contamination of mercury tends to increase with age and size (Hornung et al., 1993). This
trend is unique to mercury and is simply due to the fact that it is able to bioaccumulate
through the food chain (Hornung et al., 1993) which in turn can be attributed to MeHg’s
affinity for organic matter and high half life (Szefer et al., 2003). The larger a fish is, the more
prey it will consume and hence the higher the concentration of mercury in the body. In
addition, long lived species of fish have more time to accumulate heavy metals throughout
their lifetime (Hornung et al., 1993). Because mercury concentration increases with age,
marine organisms with a long life span (e.g. tuna, sharks, marine mammals) have higher
concentrations then short lived organisms (Hornung et al., 1993). Extremely high levels have
been measured in black marlin (Makaira indica) in Australia (Mackay et al., 1975). These
fish were caught from un-impacted waters yet still attained some of the highest levels of
mercury ever measured in teleost fish with concentrations in muscle tissue ranging from
0.5ppm to 16.5ppm (mean 7.3ppm) (Mackay et al., 1975). These values greatly exceed the
recommended Australian level for safe consumption of 1ppm for large fish (FSANZ). The
high mercury content in muscle tissue in the black marlin from this particular study was
explained by the longevity of the black marlin which enables weight-age related

92
bioaccumulation (ie. accumulation over time) (Mackay et al., 1975). However, it is also likely
to be a function of their high trophic status as well (black marlin being a top predator species).
Table 3. Increase in mercury concentration in fish with age/size.
FISH / LOCATION
EFFECT OF AGE / SIZE ON
ACCUMULATION REFERENCE
Black marlin Extremely high Hg levels explained by longevity Mackay et al., 1975
Atlantic herring, Canada Positive correlations with age, weight, and length Braune, 1987
Deep water sharks High levels of Hg attributed to longevity of species Hornung et al., 1993
Sharks from Florida Positive correlation of Hg levels and shark size Hueter et al., 1995
Fish from Brazilian
estuaries Hg increased with length and weight Kehrig et al., 1998
Perch in Baltic Sea Hg in muscle increased with age Szefer et al., 2003
In another more recent study on various species of shark in Florida, USA, 33.1% of the
samples exceeded the U.S. food guidelines for mercury concentration of (1ppm) (Hueter et
al., 1995). Consequently human consumption of long lived or large fish especially tuna,
marlin and sharks (Hornung et al., 1993) carries with it a significant human health risk in
some cases (Hornung et al., 1993; Hueter et al., 1995). Many fisheries advisories now take
into account fish size and age with limits set on the maximum size of fish which can be safely
consumed as well as some species which should simply not be eaten (Hueter et al., 1995).
Understanding the relationship between mercury concentration and body size/age within a
population is also extremely important for comparison of mercury concentration in fish to
assess variations in contamination levels (Arnac and Lassus, 1985; Francesconi et al., 1997).

93
7. Summary and future research
Mercury and mercury compounds are extremely toxic in low concentrations, with human
exposure responsible for a range of detrimental health effects. The primary route of human
exposure is via consumption of MeHg in contaminated fish. MeHg is produced in aquatic
environments through methylation and is readily taken up by biota. This along with the fact
that it is very persistent means that MeHg will accumulate up aquatic food chains. There are
several environmental factors which influence the accumulation of MeHg in marine fish; 1)
the amount of elemental mercury in the environment, 2) the microbial activity in the
sediments which is responsible for the production of MeHg and 3) environmental temperature
which affects MeHg production, and therefore may increase mercury bioavailability and
hence accumulation by fish. The uptake of MeHg in any particular fish is primarily a factor of
diet. Fish in high trophic orders and benthic feeders are more likely to accumulate high levels
of mercury. Once taken up, mercury levels in fish are governed mainly by size/age of the fish
and growth rate. Increased growth rates may dilute mercury concentration through a process
known as growth dilution and reduced growth rate may increase mercury concentration
through a process known as starvation concentration. Long lived or large fish are likely to
obtain high levels of mercury due to the fact that they consume large amounts of slightly
mercury contaminated prey throughout their lifetimes in a process referred to as
bioaccumulation. The ever increasing world population growth and the increased perception
of fish as a health food means that more fish will be consumed in the future. This along with
the continued input of mercury into the environment through human activity means that
humans will increasingly be exposed to high levels of mercury in the future. This review
highlights several areas which require further attention. Specifically a need to: 1) continue and
increase monitoring of mercury levels in marine fish species, particularly in coastal regions

94
and in less developed countries 2) expand existing monitoring to include seasons and age of
fish and 3) identify at risk marine areas and fish species based on human input, trophic level
and feeding preference and monitor, assess and impose restrictions on fishing from these
areas to protect human health.
References
Adams, D.H., McMichael, R.H., 1999. Mercury levels in four species of sharks from the Atlantic coast
of Florida. Fisheries Bulletin, 97, 372-379.
Arnac, M., Lassus, C., 1985. Heavy metal accumulation (Cd, Cu, Pb and Zn) by smelt (Osmerus
mordax) from the north shore of the St Lawrence Estuary. Water Research, 19, 6, 725-734.
Asuquo, F.E., Ewa-Oboho, I., Asuquo, E.F., Udo, P.J., 2004. Fish species used as biomarker for heavy
metal and hydrocarbon contamination for Cross River, Nigeria. The Environmentalist, 24,
29-37.
Berlin, M., 1979. Mercury. In: Friberg, L., Nordberg, G.F., Vouk, V.B. (Eds), Handbook on the
Toxicology of Metals, Elsevier/North-Holland Biomedical Press, pp. 503-530.
Bernier, J., Brousseau, P., Krzystyniak, K., Tryphonas, H., Fournier, M., 1995. Immunotxicology of
heavy metals in relation to great lakes. Environmental Health Perspectives, 103, 23-32.
Birch, G.F., 2000. Marine pollution in Australia, with special emphasis on central New South Wales
Estuaries and adjacent continental margin. International Journal of Environmental Pollution,
13, 573-607.
Blevins, R.D., Pancorbo, O.C., 1986. Metal concentrations in muscle of fish from aquatic systems in
East Tennessee, USA. Water, Air, and Soil Pollution, 29, 361-371.
Bloom, H., Ayling, G.M., 1977. Heavy metals in the Derwent Estuary. Environmental Geology, 2, 3-
22.
Boening, D.W., 2000. Ecological effects, transport, and fate of mercury: a general review.
Chemosphere, 40, 1335-1351.
Braune, B.M., 1987. Mercury accumulation in relation to size and age of Atlantic herring (Clupea
harengus) from the Southwestern Bay of Fundy, Canada. Archives of Environmental
Contamination and Toxicology, 16, 311-320.
Bryan, G.W., 1979. Bioaccumulation of marine pollutants [and discussion]. Philosophical
Transactions of the Royal Society of London. Series B. Biological Sciences, 286, 483-505.
Burton, G.A., Denton, D.L., Ho, K., Ireland, D.S., 2003. Sediment toxicity testing: issues and
methods. In: Hoffman, D.J., Rattner, B.A., Burton, G.A., Cairns, J. (Eds), Handbook of
Ecotoxicology (2nd
edition). Lewis Publishers, New York, pp. 111-150.
Burton, J.D., Statham, P.J., 1990. Trace metals in seawater. In: Furness, R.W., Rainbow, P.S. (Eds),
Heavy Metals in the Marine Environment, CRS Press, Florida, pp. 5-7.
Calta, M., Canpolat, O., 2006. The comparison of three cyprinid species in terms of heavy metals
accumulation in some tissues. Water Environment Research, 78, 5, 548-551.

95
Campbell, K.R., 1994. Concentrations of heavy metals associated with urban runoff in fish living in
stormwater treatment ponds. Archives of Environmental Contamination and Toxicology, 27,
352-356.
Cappon, C.J., Smith, J., 1981. Mercury and selenium content and chemical form in fish muscle.
Archives of Environmental Contamination and Toxicology, 10, 305-319
Carvalho, M.L., Santiago, S., Nunes, M.L., 2005. Assessment of the essential element and heavy metal
content of edible fish muscle. Analytical Bioanalytical Chemistry, 382, 426-432.
Cizdziel, J.J., Hinners, T.A., Pollard, J.E., Heithmar, E.M., Cross, C.L., 2002. Mercury concentrations
in fish from Lake Mead, USA, related to fish size, condition, trophic level, location, and
consumption risk. Archives of Environmental Contamination and Toxicology, 43, 309-317.
Cizdziel, J., Hinners, T., Cross, C., Pollard, J., 2003. Distribution of mercury in the tissues of five
species of freshwater fish from Lake Mead, USA. Journal of Environmental Monitoring, 5,
802-807.
Clarkson, T.W., Smith, J.C., Marsh, D.O., Turner, M.D., 1973. A review of dose-response
relationships resulting from human exposure to methylmercury compounds. In: Krenkel,
P.A. (Ed), Heavy Metals in the Aquatic Environment. Pergamon Press, New York, pp. 1-9.
Clarkson, T.W., Strain, J.J., 2003. Nutritional factors may modify the toxic action of methyl mercury
in fish eating populations. The Journal of Nutrition, 1539-1543.
Dallinger, R., Prosi, F., Segner, H., Back, H., 1987. Contaminated food and uptake of heavy metals by
fish: a review and a proposal for further research. Oecologia, 73, 91-98.
Downs, S.G., Macleod, C.L., Lester, J.N., 1998. Mercury in precipitation and its relation to
bioaccumulation in fish: a literature review. Water, Air, and Soil Pollution, 108, 149-187.
Doyon, J.F., Schetagne, R., Verdon, R., 1998. Different mercury bioaccumulation rates between
sympatric populations of dwarf and normal lake whitefish (Coregonus clupeaformis) in the
La Grande complex watershed, James Bay, Quebec. Biogeochemistry, 40 203-216.
Egeland, G.M., Middaugh, J.P., 1997. Balancing fish consumption benefits with mercury exposure.
Science, 278, 1904-1905.
Fabris, G., Turoczy, N.J., Stagnitti, F., 2006. Trace metal concentrations in edible tissue of snapper,
flathead, lobster, and abalone from the coastal waters of Victoria, Australia. Ecotoxicology
and Environmental Safety, 63, 2, 286-292.
Filazi, A., Baskaya, R., Kum, C., Hismiogullari, S.E., 2003. Metal concentrations in tissues of the
Black Sea fish Mugil auratus from Sinop-Icliman, Turkey. Human & Experimental
Toxicology, 22, 85-87.
Forstner, U., Wittmann, G.T.W. (Eds), 1979. Metal Pollution in the Aquatic Environment. Springer-
Verlag, New York, 485 p.
Foster, E.P., Drake, D.L., DiDomenico, G., 2000. Seasonal changes and tissue distribution of mercury
in largemouth bass (Micropterus salmoides) from Dorena Reservior, Oregon. Archives of
Environmental Contamination and Toxicology, 38, 78-82.
Francesconi, K.A., Lenanton, R.C.S., Caputi, N., Jones, S., 1997. Long-term study of mercury
concentrations in fish following cessation of a mercury-containing discharge. Marine
Environment Research, 43, 27-40.
FSANZ (Food Standards Australia and New Zealand). Regulations for mercury in fish. March 2004.
<http://www.foodstandards.gov.au/newsroom/factsheets/factsheets2004/mercuryinfishfurther2
394.cfm>. [accessed 2007 Nov 2]
Giesy, J.P., Wiener, J.G., 1977. Frequency distributions of trace metal concentrations in five
freshwater fishes. Transactions of the American Fisheries Society, 106, 393-403.

96
Goldman, L.R., Shannon, M.W., 2001. Technical report: mercury in the environment: implications for
pediatricians. American Academy of Pediatrics, 108, 197-205.
Greenfield, B.K., Hrabik, T.R., Harvey, C.J., Carpenter, S.R., 2001. Predicting mercury levels in
yellow perch: use of water chemistry, trophic ecology, and spatial traits. Canadian Journal of
Fisheries and Aquatic Sciences, 58, 1419-1429.
Han, B.C., Jeng, W.L., Chen, R.Y., Fang, G.T., Hung, T.C., Tseng, R.J., 1998. Estimation of target
hazard quotients and potential health risks for metals by consumption of seafood in Taiwan.
Archives of Environmental Contamination and Toxicology, 35, 711-720.
Harris, R.C., Bodaly, R.A., 1998. Temperature, growth and dietary effects on fish mercury dynamics
in two Ontario lakes. Biogeochemistry, 40, 175-187.
Hartung, R., Dinman, B.D. (eds), 1972. Environmental Mercury Contamination. Ann Arbor Science
Publishers, Inc., Michigan, pp. 1-349.
Hill, W.R., Stewart, A.J., Napolitano, E., 1996. Mercury speciation and bioaccumulation in lotic
primary producers and primary consumers. Canadian Journal of Fisheries and Aquatic
Sciences, 53, 812-819.
Holden, A.V., 1973. Mercury in fish and shellfish a review. Journal of Food Technology, 8, 1-25.
Hornung, H., Krom, M.D., Cohen, Y., Bernhard, M., 1993. Trace metal content in deep-water sharks
from the eastern Mediterranean Sea. Marine Biology, 115, 331-338.
Hueter, R.E., Fong, W.G., Henderson, G., French, M.F., Manire, C.A., 1995. Methylmercury
concentration in shark muscle by species, size and distribution of sharks in Florida coastal
waters. Water, Air and Soil Pollution, 80, 893-899.
Jarup, L., 2003. Hazards of heavy metal contamination. British Medical Bulletin, 68, 167-182.
Jernelov, A., Asell, B., 1973. The feasibility of restoring mercury-contaminated waters. In: Krenkel,
P.A. (Ed), Heavy Metals in the Aquatic Environment. Pergamon Press, New York, pp. 299-
309.
Kehrig, H.A., Malm, O., Moreira, I., 1998. Mercury in a widely consumed fish Micropogonias
furnieri (Demarest, 1823) from four main Brazilian estuaries. The Science of the Total
Environment, 213, 263-271.
Kennish, M.J. (Ed), 2001. Practical Handbook of Marine Science (3rd
Edition), CRC Press, New York,
pp. 630-631.
Kurland, L.T., Faro, S.N., Seidler, H., 1960. Minamata disease. World Neurology, 1, 370-390.
Lizama, M. Delos A.P., Ambrosio, A.M., 2002. Condition factor in nine species of fish of the
characidae family in the upper Parana River floodplain, Brazil. Brazilian Journal of Biology,
62, 113-124.
MacKay, N.J., Kazacos, M.N., Williams, R.J., Leedow, M.I., 1975. Selenium and heavy metals in
black marlin. Marine Pollution Bulletin, 6, 57-61.
Miettinen, J.K., 1973. The accumulation and excretion of heavy metals in organisms. In: Krenkel, P.A.
(Ed), Heavy Metals in the Aquatic Environment. Pergamon Press, New York, pp. 163-165.
Morel, F.M.M., Kraepiel, A.M.L., Amyot, M., 1998. The chemical cycle and bioaccumulation of
mercury. Annual Review of Ecological Systems, 29, 543-566.
Park, J.G., Curtis, L.R., 1997. Mercury distribution in sediments and bioaccumulation by fish in two
Oregon reservoirs: point-source and nonpoint-source impacted systems. Archives of
Environmental Contamination and Toxicology, 33, 423-429.
Pourang, N., 1995. Heavy metal accumulation in different tissues of two fish species with regards to
their feeding habits and trophic levels. Environmental Monitoring and Assessment, 35, 207-
219.
97
Rainbow, P.S., 1990. Heavy metal levels in marine invertebrates. In: Furness, R.W., Rainbow, P.S.
(Eds), Heavy Metals in the Marine Environment, CRS Press, Florida, pp. 67-71.
Ratkowsky, D.A., Dix, T.G., Wilson, K.C., 1975. Mercury in fish in the Derwent Estuary, Tasmania,
and its relation to the position in the food chain. Australian Journal of Marine and
Freshwater Research, 26, 223-231.
Rolfhus, K.R., Fitzgerald, W.F., 1995. Linkages between atmospheric mercury deposition and the
methylmercury content of marine fish. Water, Air and Soil Pollution, 80, 291-297.
Sanzo, J.M., Dorronsoro, M., Amiano, P., Amurrio, A., Aguinagalde, F.X., Azpiri, M.A., 2001.
Estimation and validation of mercury intake associated with fish consumption in an EPIC
cohort of Spain. Public Health Nutrition, 4, 981-988.
Simoneau, M., Lucotte, M., Garceau, S., Laliberte. D., 2005. Fish growth rates modulate mercury
concentrations in walleye (Sander vitreus) from eastern Canadian lakes. Environmental
Research, 98, 73-82.
Sorensen, E.M.B., 1991. Metal Poisoning in Fish, CRC Press, Boston, pp. 1-353.
Suns, K., Hitchin, G., 1990. Interrelationships between mercury levels in yearling yellow perch, fish
condition and water quality. Water, Air, and Soil Pollution, 650, 255-265.
Sweet, L.I., Zelikoff, J.T., 2001. Toxicology and immunotoxicology of mercury: a comparative review
in fish and humans. Journal of Toxicology and Environmental Health, Part B. 4, 161-205.
Szefer, P., Domagala-Wieloszewska, M., Warzocha, J., Garbacik-Wesolowska, A., Ciesielski, T.,
2003. Distribution and relationships of mercury, lead, cadmium, copper and zinc in perch
(Perca fluviatilis) from the Pomeranian Bay and Szczecin Lagoon, southern Baltic. Food
Chemistry, 81, 1, 73-83.
Thomson, J.D., 1985. Mercury concentrations of the axial muscle tissues of some marine fishes of the
continental shelf adjacent to Tasmania. Australian Journal of Marine and Freshwater
Research, 36, 509-517.
Tidwell, J.H., Allan, G.L., 2001. Fish as food: aquaculture’s contribution- ecological and economic
impacts and contributions of fish farming and capture fisheries. EMBO reports, 21, 958-963.
Wang, W., 2002. Interactions of trace metals and different marine food chains. Marine Ecology
Progress Series, 243, 295-309.
Watras, C.J., Bloom, N.S., 1992. Mercury and methylmercury in individual zooplankton: implications
for bioaccumulation. Limnology and Oceanography, 37, 1313-1318.
Wiener, J.G., Krabbenhoft., D.P., Heinz, G.H., Scheuhammer, A.M., 2003. Ecotoxicology of Mercury.
In: Hoffman, D.J., Rattner, B.A., Burton, G.A., Cairns, J. (eds), Handbook of Ecotoxicology
(2nd
Edition). Lewis Publishers, New York, pp. 409-443.