heat transfer in turbocharger turbines under …opus.bath.ac.uk/43040/9/accepted_version.pdf · 1...
TRANSCRIPT
1
HEAT TRANSFER IN TURBOCHARGER TURBINES UNDER STEADY, PULSATING 1
AND TRANSIENT CONDITIONS 2
3
RD Burkea*, C Vagga, D Chaletb and P Chesseb 4
a. Department of Mechanical Engineering, University of Bath, BA2 7AY, Bath, UK 5
b. LUNAM Université, École Centrale de Nantes, LHEEA UMR CNRS 6598, 1 rue de la Noë, BP 92101, 44321 Nantes Cedex 3, France 6
*Corresponding Author contact. Email: [email protected], Tel: +441225383481 7
ABSTRACT 8
Heat transfer is significant in turbochargers and a number of mathematical models have been 9
proposed to account for the heat transfer, however these have predominantly been validated under 10
steady flow conditions. A variable geometry turbocharger from a 2.2L Diesel engine was studied, 11
both on gas stand and on-engine, under steady and transient conditions. The results showed that 12
heat transfer accounts for at least 20% of total enthalpy change in the turbine and significantly more 13
at lower mechanical powers. A convective heat transfer correlation was derived from experimental 14
measurements to account for heat transfer between the gases and the turbine housing and proved 15
consistent with those published from other researchers. This relationship was subsequently shown 16
to be consistent between engine and gas stand operation: using this correlation in a 1D gas dynamics 17
simulation reduced the turbine outlet temperature error from 33oC to 3oC. Using the model under 18
transient conditions highlighted the effect of housing thermal inertia. The peak transient heat flow 19
was strongly linked to the dynamics of the turbine inlet temperature: for all increases, the peak heat 20
flow was higher than under thermally stable conditions due to colder housing. For all decreases in 21
gas temperature, the peak heat flow was lower and for temperature drops of more than 100oC the 22
heat flow was reversed during the transient. 23
Keywords: Turbocharger, Heat transfer, Transient, Thermal modelling 24
2
1 INTRODUCTION 25
Turbocharging internal combustion engines is set to increase rapidly as this is a key technology to 26
deliver fuel economy savings for both Diesel and spark ignition engines [1]. Using a compressor to 27
provide higher air flows to an internal combustion engine increases the power density and allows 28
smaller engines to be used in more high power applications, reducing overall weight and friction. 29
The matching of a turbocharger with an internal combustion engine is a crucial step in the 30
development process and relies on simulation of the engine air path system. In these models, 31
turbochargers are represented by characteristic maps, which are defined from measurements of 32
pressure ratio, shaft speed, mass flow and isentropic efficiency taken from a gas stand. Whilst the 33
mass flow, pressure ratio, and speed can be measured directly, the efficiency has to be calculated 34
from measured gas temperatures. For both turbine and compressor, enthalpy changes in the 35
working fluids are equated to work changes during the characterisation process1. Any heat transfer 36
affecting these gas temperature measurements will cause errors in the characterisation process. 37
Conversely, when the characteristic maps are subsequently used in engine simulations to predict 38
engine performance; if heat transfers are ignored then a poor prediction of gas temperatures for 39
inter-cooling and after-treatment will arise. Consequently there is a two-fold interest in 40
understanding and modelling heat transfer in turbochargers: 41
1. To improve the accuracy of work transfer measurements during characterisation. 42
2. To improve the prediction of gas temperatures in engine simulations. 43
Current practice ignores heat transfers and limits investigations to operating conditions where heat 44
transfer are small compared to work transfers; these conditions prevail for the compressor at higher 45
turbocharger speeds but heat transfer is always significant in the turbine. Parametric curve fitting 46
techniques are then used to extrapolate to the lower speed region [2]. 47
1 Some specialist facilities use a turbine dynamometer to measure turbine work directly, however these rarely used for automotive turbochargers in industrial applications.
3
This work focuses on heat transfer in the turbine which represents the principal heat source for 48
turbocharger heat transfer and strongly affects the gas temperature entering after-treatment 49
systems. In particular, this paper aims to assess the applicability of gas-stand derived heat transfer 50
models to on-engine conditions where flows are hotter, pulsating and highly transient. 51
2 BACKGROUND 52
A number of studies into heat transfer in turbochargers have been presented over the past 15 years. 53
The first studies focussed on quantifying the effects of heat transfer on steady flow gas stands by 54
comparing the work transfers that would be measured based on temperature changes for different 55
turbine inlet temperatures [3-8]. Cormerais et al. [4] presented the most extreme changes in 56
operating conditions, varying turbine inlet temperature from 50oC to 500oC with a thermally 57
insulated turbocharger and observed up to 15%points change in apparent compressor efficiency . 58
Baines et al. [7] measured losses of 700W at 250oC turbine inlet gas temperature (TIT) which is 59
considerably lower than the 2.7kW measured for a similar turbocharger by Aghaali and Angstrom 60
with turbine inlet temperatures ranging 620-850oC [8]. Baines et al. [7] also estimated heat transfer 61
to ambient as 25% of total turbine heat transfer, however at 700oC TIT, where temperature 62
gradients to ambient were much higher, Shaaban [5] estimated this at 70%. 63
A number of modelling approaches have been used ranging from 3D conjugate heat transfer, giving 64
a detailed insight to the heat transfer processes [9, 10], to simple 1D models for use with engine 65
simulations. The most basic approach adopted to improve the correlation of engine models to 66
experimental data consists of empirically adapting or correcting turbine maps using efficiency 67
multipliers [8, 11]. This approach is typically parameterized to estimate heat energy directly using an 68
exponential function that decays with increasing mass flow or turbine power and is tuned to match 69
measured data from an engine or vehicle dynamometer. Whilst this approach can improve the 70
accuracy of engine models, it is not predictive and alternative models have been proposed. 71

4
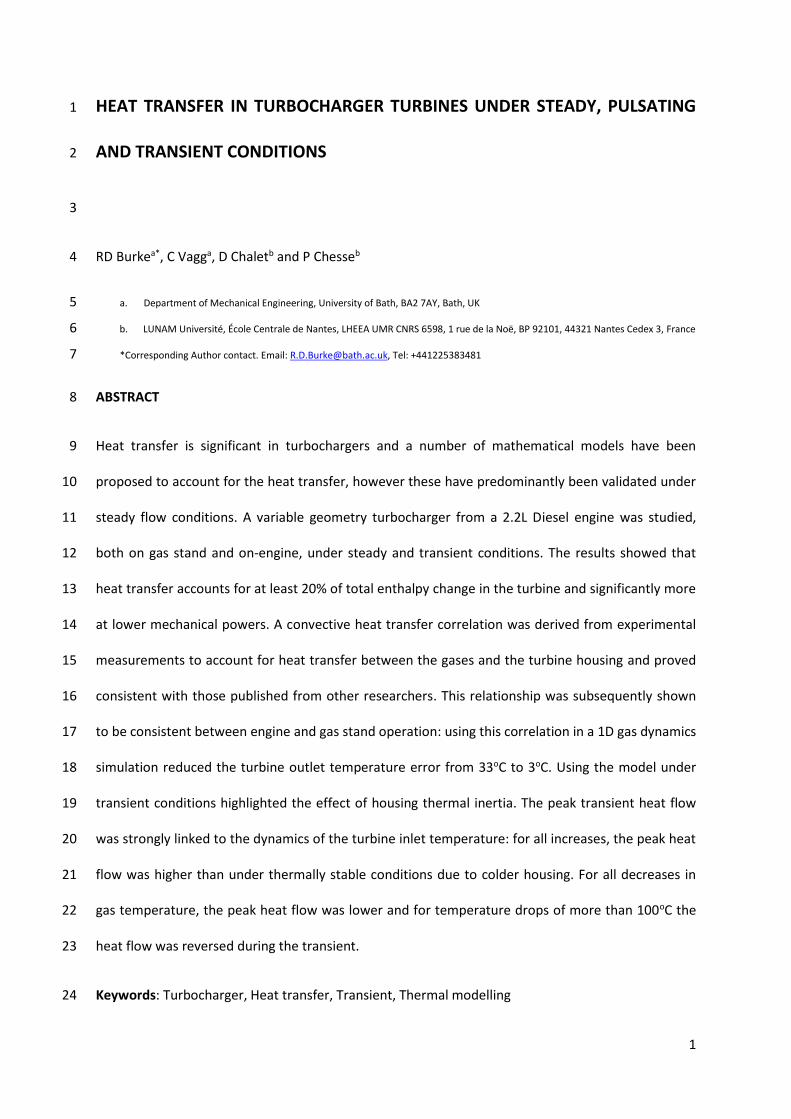
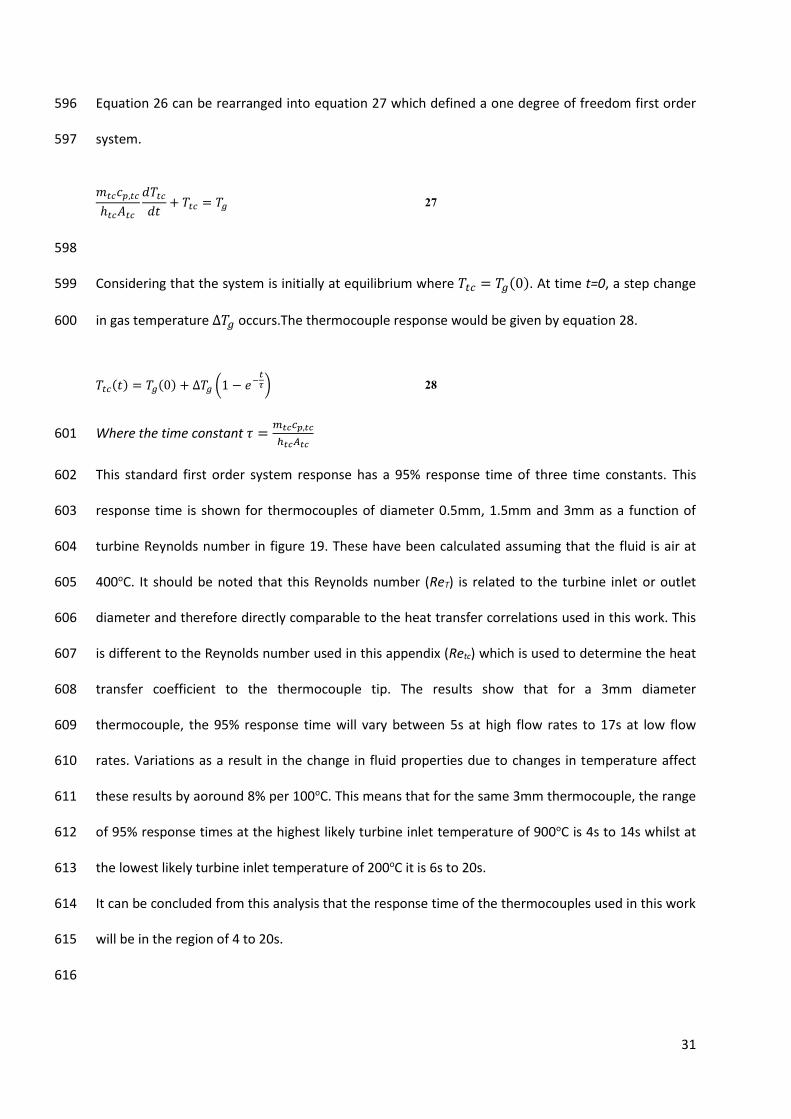
In practice heat transfer will occur through the turbocharger stage [12], however a common 72
assumption in 1D models assumes that heat transfer and work transfer occur independently [13-15]; 73
this is represented schematically on enthalpy-entropy diagrams in figure 1. The actual processes 74
undergone by the gases are shown between states 1-2 and 3-4 for compressor and turbine 75
respectively. The split of work and heat transfer is shown by the intermediate states 1’, 2’, 3’ and 4’ 76
such that flow through the turbine is composed of the following stages: 77
1. A heating or cooling at constant pressure (processes 1-1’ and 3’-3), 78
2. An adiabatic compression/expansion (processes 1’-2’ and 3’-4’) 79
3. A heating or cooling at constant pressure (processes 2’-2 and 4’-4) 80
Based on this analysis it is obvious that any measurement of temperature change across the turbine 81
or compressor will include both the work and heat transfers, and that any estimate of work based on 82
the total enthalpy change will include an error equal to the net heat transfer (equation 1). 83
Δh𝑎𝑐𝑡 = Δh𝑤𝑜𝑟𝑘 + 𝑞𝑏 + 𝑞𝑎 1
84
The isentropic efficiencies used in engine simulation codes are described for compressor and turbine 85
in equations 2 and 3 respectively. These equations describe the transitions between 1’-2’ and 3’-4’. 86
𝜂𝑠,𝑐 =Δh𝑠′
Δh𝑤𝑜𝑟𝑘,𝑐=
𝑐𝑝,𝑐 [𝑇01′ ((𝑃02𝑃01)
𝛾−1𝛾− 1)]
Δℎ𝑎𝑐𝑡,𝑐 − 𝑞𝑏,𝑐 − 𝑞𝑎,𝑐
2
𝜂𝑠,𝑡 =Δh𝑤𝑜𝑟𝑘,𝑡Δh𝑠′,𝑡
=Δℎ𝑎𝑐𝑡,𝑡 − 𝑞𝑏,𝑡 − 𝑞𝑎,𝑡
𝑐𝑝,𝑡 [𝑇03′ (1 − (𝑃4𝑃03)
𝛾−1𝛾)]
3
87
5
In equations 2 and 3 it is common to define efficiencies using total conditions at points 1, 2 and 3 88
(and hence 1’, 2’ and 3’) and static conditions at point 4 (and 4’). For clarity, these distinctions have 89
been omitted from figure 1. 90
The major issue that arises in applying equations 2 and 3 is that it is not possible to directly measure 91
T1’ T2’, T3’ and T4’ because they are not well defined spatially within the turbocharger. Consequently, 92
for industrial mapping, operation is assumed to be adiabatic, i.e. qa=qb=0, T1=T1’; T2=T2’, T3=T3’ and 93
T4=T4’. This assumption holds for a compressor operating at higher shaft speeds where the heat 94
transfer is small compared to the work transfer [16]. On the turbine side, the condition of adiabatic 95
operation can only be achieved in special laboratory conditions and commonly turbine work is 96
estimated either through compressor enthalpy rise or using a turbine dynamometer [17]. 97
The 3D conjugate heat transfer modelling undertaken by Bohn et al [9] showed that heat transfers 98
between the working fluids and the housing could occur in either direction and could change 99
direction as the flow passed through the rotor and diffuser depending on the magnitude of 100
temperature change due to compression or expansion. To capture this in a simplified model, the full 101
problem described by figure 1 should be considered where heat transfers can occur both before and 102
after the compression and expansion processes. However, most authors [14, 18, 19] prefer to group 103
all heat transfers after the compression in the compressor or before the expansion in the turbine: 104
i.e. in figure 1 (a) qb = 0 and in figure 1 (b) qa = 0. This simpler approach stems from a limitation in the 105
parameterisation method. This is performed either by comparing hot operation of the turbocharger 106
with special conditions where temperature gradients are minimised by matching T2 and T32, or by 107
using the turbocharger bearing housing as a heat flux probe [15]. In both cases further assumptions 108
are required for separating the heat flows before and after work transfers [20] and these are 109
deemed not to provide any further accuracy benefits over lumping all heat transfers into a single 110
process. The convective heat transfer between the working fluid and the housing within the turbine 111
2 The turbocharger cooling fluids (oil and water if present) are also matched to the compressor outlet and turbine inlet gas temperatures.

6
and compressor housing is always modelled by assuming or adapting convective correlations for 112
flows in pipes such as Dittus-Boelter or Seider-Tate [21]. A number of correlations proposed in the 113
literature are presented in table 1. It is difficult to compare these correlations in equation forms 114
because of differences in defining the characteristic lengths. Therefore a graphical representation is 115
given in the results section of this paper (figure 12). 116
Table 1: Comparison of internal convective heat transfer correlations for turbines 117
Authors Source Correlation Characteristic
Length
Constants
a b c
Baines et al.
[7] Gas
stand 𝑁𝑢 = 𝑎𝑅𝑒𝑏𝑃𝑟𝑐
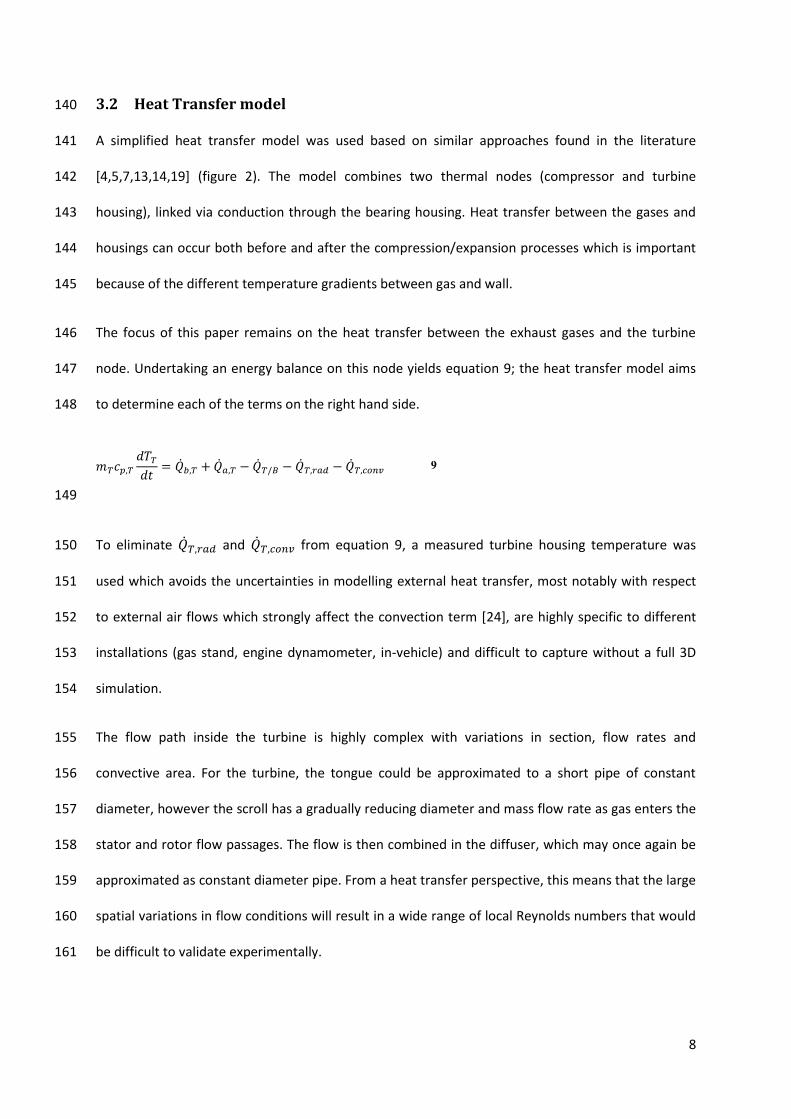
Lvolute 0.032 0.7 0.43
Cormerais
[18]
Dinlet 0.14 0.75 1/3
Reyes-
Belmonte [22]
Gas
Stand
𝑁𝑢 = 𝑎𝑅𝑒𝑏𝑃𝑟1/3 (𝜇𝑏𝑢𝑙𝑘𝜇𝑠𝑘𝑖𝑛
)0.14
𝐹
where
𝐹 = 1 + 0.9756(
𝐷𝑖𝑛𝑙𝑒𝑡𝜂𝑚𝑎𝑥
(𝐿𝑣𝑜𝑙𝑢𝑡𝑒)2
4𝐷𝑖𝑛𝑙𝑒𝑡
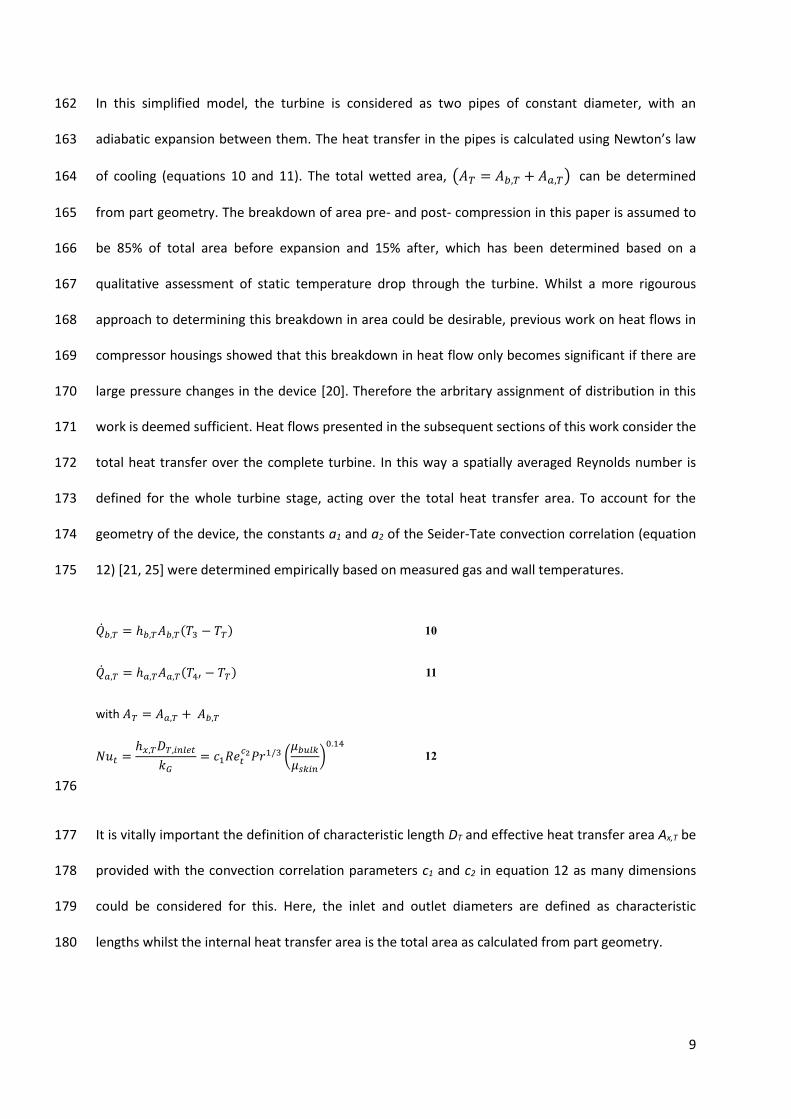
)
0.76
(𝐿𝑣𝑜𝑙𝑢𝑡𝑒)2
4𝐷𝑖𝑛𝑙𝑒𝑡
1.07 0.57 1/3
5.34 0.48 1/3
0.101 0.84 1/3
Romagnoli
and Martinez-
Botas [19]
Theory 𝑁𝑢 = 𝑎𝑅𝑒𝑏𝑃𝑟𝑐
𝐷𝑖𝑛𝑙𝑒𝑡2
0.046 0.8 0.4
118
The heat transfer models have been shown to improve the accuracy of turbine outlet temperature 119
prediction from an over prediction of 20-40oC to within ±10oC [16]. However, no direct comparison 120
has been made for the same device between gas stand and engine operation. In this paper, an 121
investigation with the same turbocharger and crucially the same instrumentation was conducted in 122
both environments. 123

7
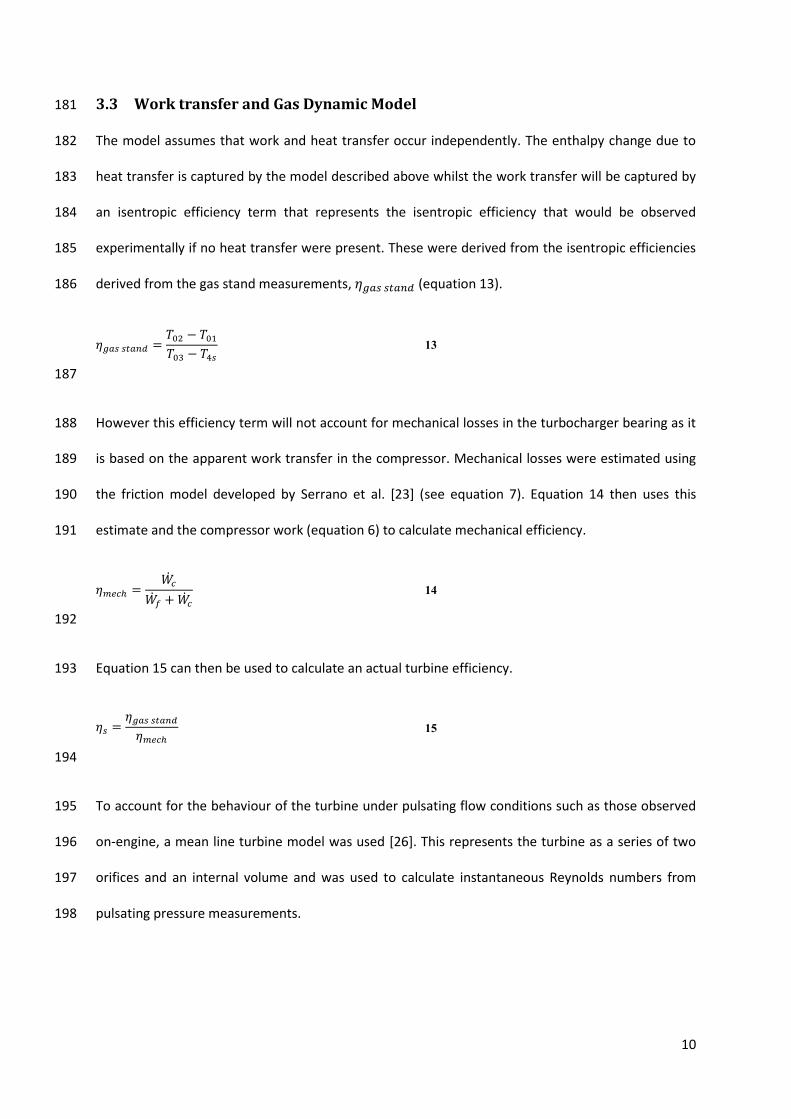
3 MODELLING AND DATA ANALYSIS 124
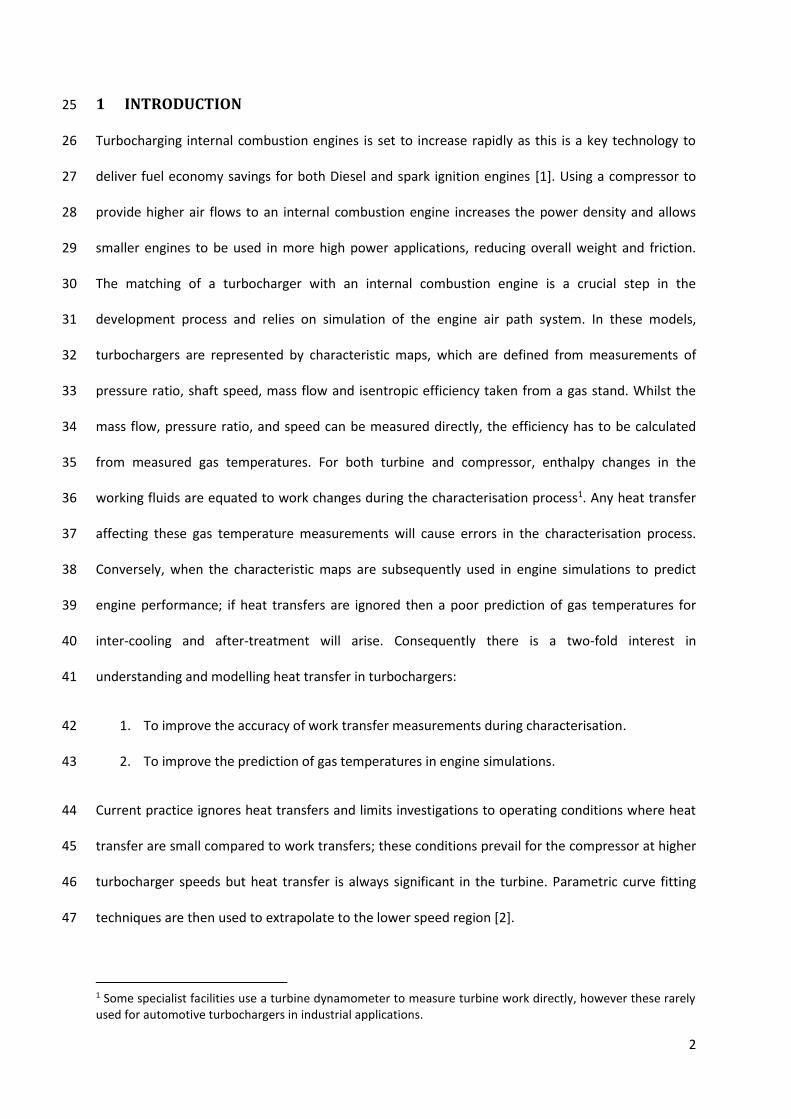
3.1 Total Heat Transfer 125
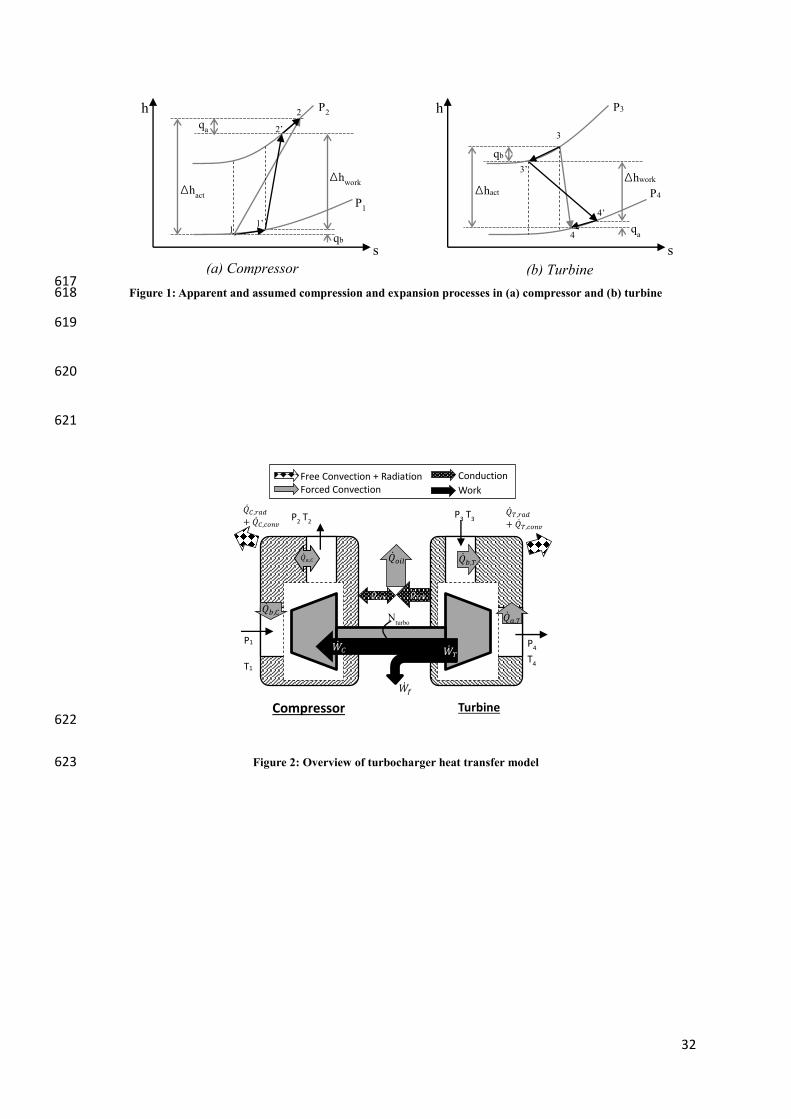
An overview of the heat and work flows inside the turbocharger is shown in figure 2. By applying the 126
conservation of energy, the change in enthalpy in the turbine can be related to the work and heat 127
transfer rates using equation 4, with T0i the stagnation or total temperatures. 128
�̇�𝑡 + �̇�𝑏,𝑡 + �̇�𝑎,𝑡 = �̇�𝑡𝑐𝑝,𝑡(𝑇03 − 𝑇04) 4
129
Where the turbine work transfer rate can be derived from a power balance on the shaft (equation 130
5). 131
�̇�𝑡 = �̇�𝑐 + �̇�𝑓 5
132
The compressor work transfer rate is estimated using equation 6; this effectively ignores heat 133
transfers on the compressor side. This will cause errors, notably at low speeds and a full analysis of 134
the uncertainties caused by this assumption are given in section 4.4. The friction work was estimated 135
using the model developed by Serrano et al [23] , summarized by equation 7. 136
�̇�𝑐 = �̇�𝑐𝑐𝑝,𝑐(𝑇02 − 𝑇01) 6
�̇�𝑓 = 𝐶𝑓𝑟𝑁𝑡2 7
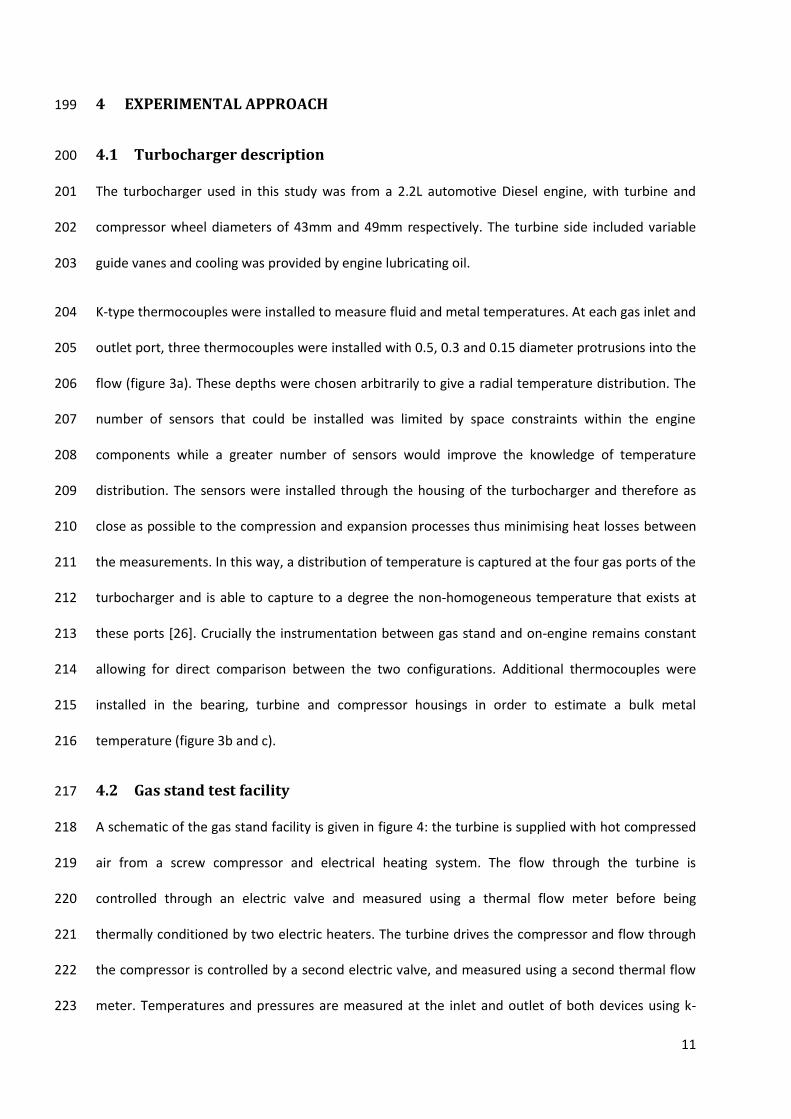
Combining equations 4 with equations 5-7 and rearranging yields the expression for total heat 137
transfer from the gas to turbine housing: 138
�̇�𝐺/𝑇 = �̇�𝑏,𝑡 + �̇�𝑎,𝑡= �̇�𝑡𝑐𝑝,𝑡(𝑇03 − 𝑇04) − 𝐶𝑓𝑟𝑁𝑡
2
− �̇�𝑐𝑐𝑝,𝑐(𝑇02 − 𝑇01)
8
139
8
3.2 Heat Transfer model 140
A simplified heat transfer model was used based on similar approaches found in the literature 141
[4,5,7,13,14,19] (figure 2). The model combines two thermal nodes (compressor and turbine 142
housing), linked via conduction through the bearing housing. Heat transfer between the gases and 143
housings can occur both before and after the compression/expansion processes which is important 144
because of the different temperature gradients between gas and wall. 145
The focus of this paper remains on the heat transfer between the exhaust gases and the turbine 146
node. Undertaking an energy balance on this node yields equation 9; the heat transfer model aims 147
to determine each of the terms on the right hand side. 148
𝑚𝑇𝑐𝑝,𝑇𝑑𝑇𝑇𝑑𝑡
= �̇�𝑏,𝑇 + �̇�𝑎,𝑇 − �̇�𝑇/𝐵 − �̇�𝑇,𝑟𝑎𝑑 − �̇�𝑇,𝑐𝑜𝑛𝑣 9
149
To eliminate �̇�𝑇,𝑟𝑎𝑑 and �̇�𝑇,𝑐𝑜𝑛𝑣 from equation 9, a measured turbine housing temperature was 150
used which avoids the uncertainties in modelling external heat transfer, most notably with respect 151
to external air flows which strongly affect the convection term [24], are highly specific to different 152
installations (gas stand, engine dynamometer, in-vehicle) and difficult to capture without a full 3D 153
simulation. 154
The flow path inside the turbine is highly complex with variations in section, flow rates and 155
convective area. For the turbine, the tongue could be approximated to a short pipe of constant 156
diameter, however the scroll has a gradually reducing diameter and mass flow rate as gas enters the 157
stator and rotor flow passages. The flow is then combined in the diffuser, which may once again be 158
approximated as constant diameter pipe. From a heat transfer perspective, this means that the large 159
spatial variations in flow conditions will result in a wide range of local Reynolds numbers that would 160
be difficult to validate experimentally. 161
9
In this simplified model, the turbine is considered as two pipes of constant diameter, with an 162
adiabatic expansion between them. The heat transfer in the pipes is calculated using Newton’s law 163
of cooling (equations 10 and 11). The total wetted area, (𝐴𝑇 = 𝐴𝑏,𝑇 + 𝐴𝑎,𝑇) can be determined 164
from part geometry. The breakdown of area pre- and post- compression in this paper is assumed to 165
be 85% of total area before expansion and 15% after, which has been determined based on a 166
qualitative assessment of static temperature drop through the turbine. Whilst a more rigourous 167
approach to determining this breakdown in area could be desirable, previous work on heat flows in 168
compressor housings showed that this breakdown in heat flow only becomes significant if there are 169
large pressure changes in the device [20]. Therefore the arbritary assignment of distribution in this 170
work is deemed sufficient. Heat flows presented in the subsequent sections of this work consider the 171
total heat transfer over the complete turbine. In this way a spatially averaged Reynolds number is 172
defined for the whole turbine stage, acting over the total heat transfer area. To account for the 173
geometry of the device, the constants a1 and a2 of the Seider-Tate convection correlation (equation 174
12) [21, 25] were determined empirically based on measured gas and wall temperatures. 175
�̇�𝑏,𝑇 = ℎ𝑏,𝑇𝐴𝑏,𝑇(𝑇3 − 𝑇𝑇) 10
�̇�𝑎,𝑇 = ℎ𝑎,𝑇𝐴𝑎,𝑇(𝑇4′ − 𝑇𝑇) 11
with 𝐴𝑇 = 𝐴𝑎,𝑇 + 𝐴𝑏,𝑇
𝑁𝑢𝑡 =ℎ𝑥,𝑇𝐷𝑇,𝑖𝑛𝑙𝑒𝑡
𝑘𝐺= 𝑐1𝑅𝑒𝑡
𝑐2𝑃𝑟1/3 (𝜇𝑏𝑢𝑙𝑘𝜇𝑠𝑘𝑖𝑛
)0.14
12
176
It is vitally important the definition of characteristic length DT and effective heat transfer area Ax,T be 177
provided with the convection correlation parameters c1 and c2 in equation 12 as many dimensions 178
could be considered for this. Here, the inlet and outlet diameters are defined as characteristic 179
lengths whilst the internal heat transfer area is the total area as calculated from part geometry. 180
10
3.3 Work transfer and Gas Dynamic Model 181
The model assumes that work and heat transfer occur independently. The enthalpy change due to 182
heat transfer is captured by the model described above whilst the work transfer will be captured by 183
an isentropic efficiency term that represents the isentropic efficiency that would be observed 184
experimentally if no heat transfer were present. These were derived from the isentropic efficiencies 185
derived from the gas stand measurements, 𝜂𝑔𝑎𝑠 𝑠𝑡𝑎𝑛𝑑 (equation 13). 186
𝜂𝑔𝑎𝑠 𝑠𝑡𝑎𝑛𝑑 =𝑇02 − 𝑇01𝑇03 − 𝑇4𝑠
13
187
However this efficiency term will not account for mechanical losses in the turbocharger bearing as it 188
is based on the apparent work transfer in the compressor. Mechanical losses were estimated using 189
the friction model developed by Serrano et al. [23] (see equation 7). Equation 14 then uses this 190
estimate and the compressor work (equation 6) to calculate mechanical efficiency. 191
𝜂𝑚𝑒𝑐ℎ =�̇�𝑐
�̇�𝑓 + �̇�𝑐 14
192
Equation 15 can then be used to calculate an actual turbine efficiency. 193
𝜂𝑠 =𝜂𝑔𝑎𝑠 𝑠𝑡𝑎𝑛𝑑
𝜂𝑚𝑒𝑐ℎ 15
194
To account for the behaviour of the turbine under pulsating flow conditions such as those observed 195
on-engine, a mean line turbine model was used [26]. This represents the turbine as a series of two 196
orifices and an internal volume and was used to calculate instantaneous Reynolds numbers from 197
pulsating pressure measurements. 198
11
4 EXPERIMENTAL APPROACH 199
4.1 Turbocharger description 200
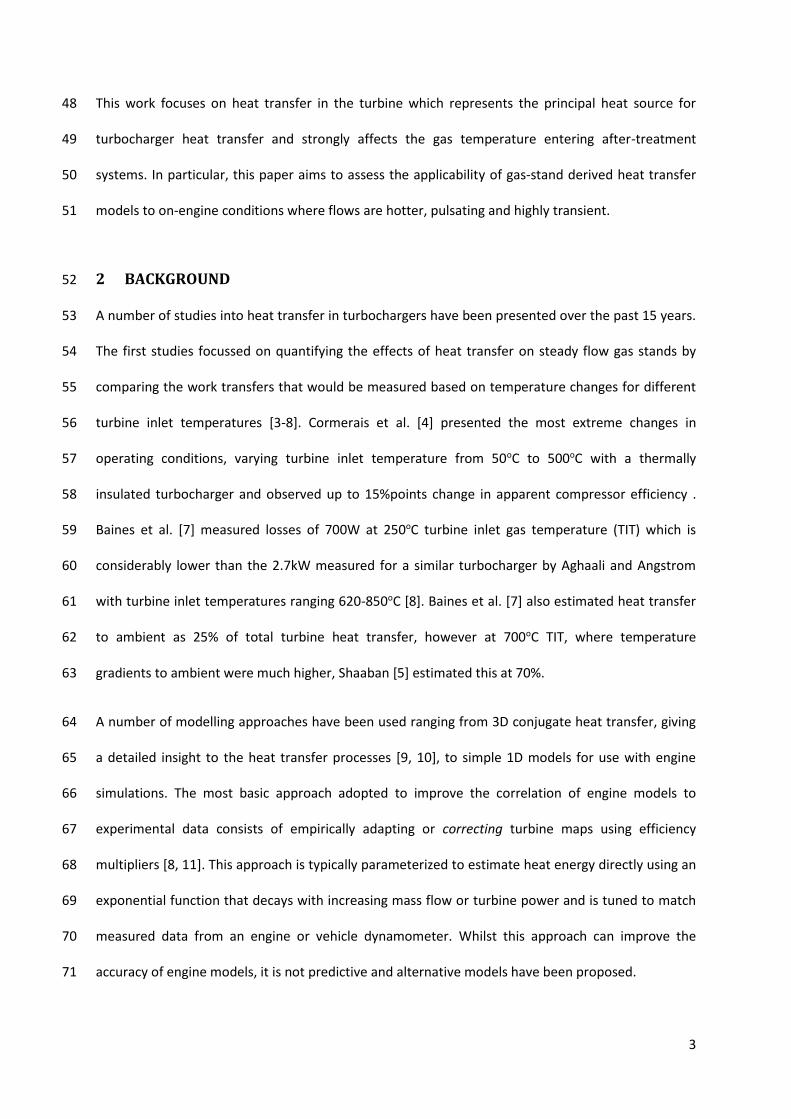
The turbocharger used in this study was from a 2.2L automotive Diesel engine, with turbine and 201
compressor wheel diameters of 43mm and 49mm respectively. The turbine side included variable 202
guide vanes and cooling was provided by engine lubricating oil. 203
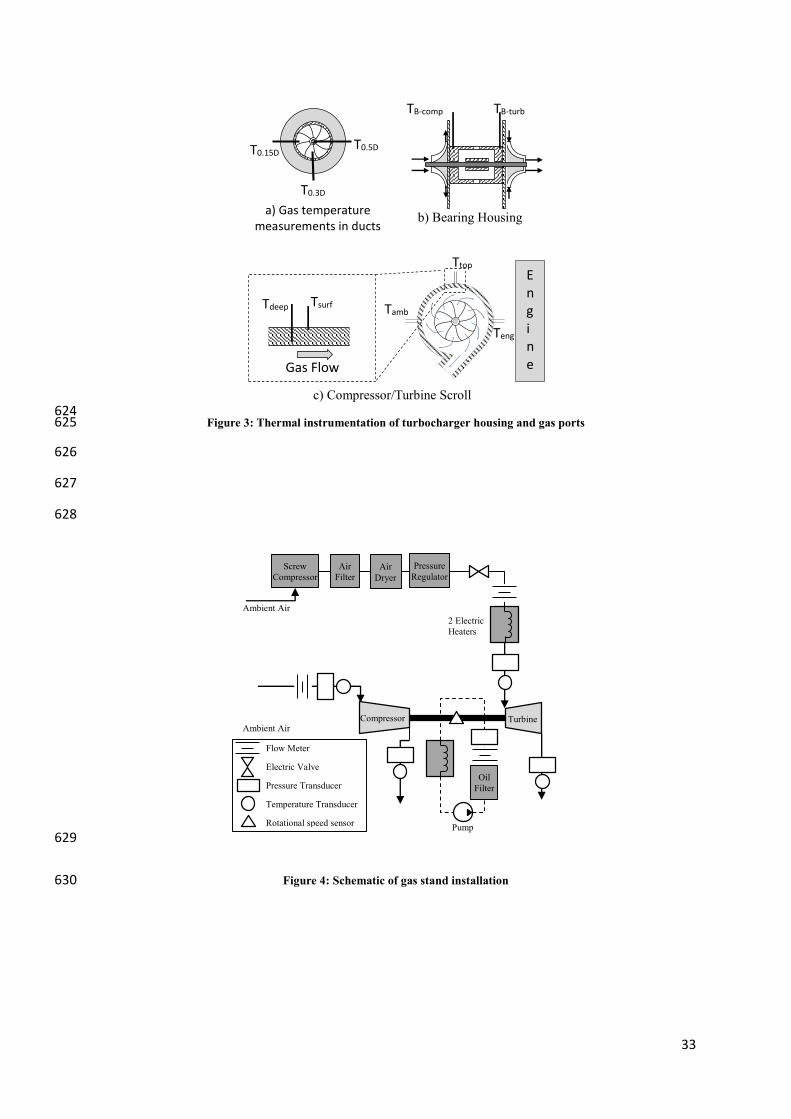
K-type thermocouples were installed to measure fluid and metal temperatures. At each gas inlet and 204
outlet port, three thermocouples were installed with 0.5, 0.3 and 0.15 diameter protrusions into the 205
flow (figure 3a). These depths were chosen arbitrarily to give a radial temperature distribution. The 206
number of sensors that could be installed was limited by space constraints within the engine 207
components while a greater number of sensors would improve the knowledge of temperature 208
distribution. The sensors were installed through the housing of the turbocharger and therefore as 209
close as possible to the compression and expansion processes thus minimising heat losses between 210
the measurements. In this way, a distribution of temperature is captured at the four gas ports of the 211
turbocharger and is able to capture to a degree the non-homogeneous temperature that exists at 212
these ports [26]. Crucially the instrumentation between gas stand and on-engine remains constant 213
allowing for direct comparison between the two configurations. Additional thermocouples were 214
installed in the bearing, turbine and compressor housings in order to estimate a bulk metal 215
temperature (figure 3b and c). 216
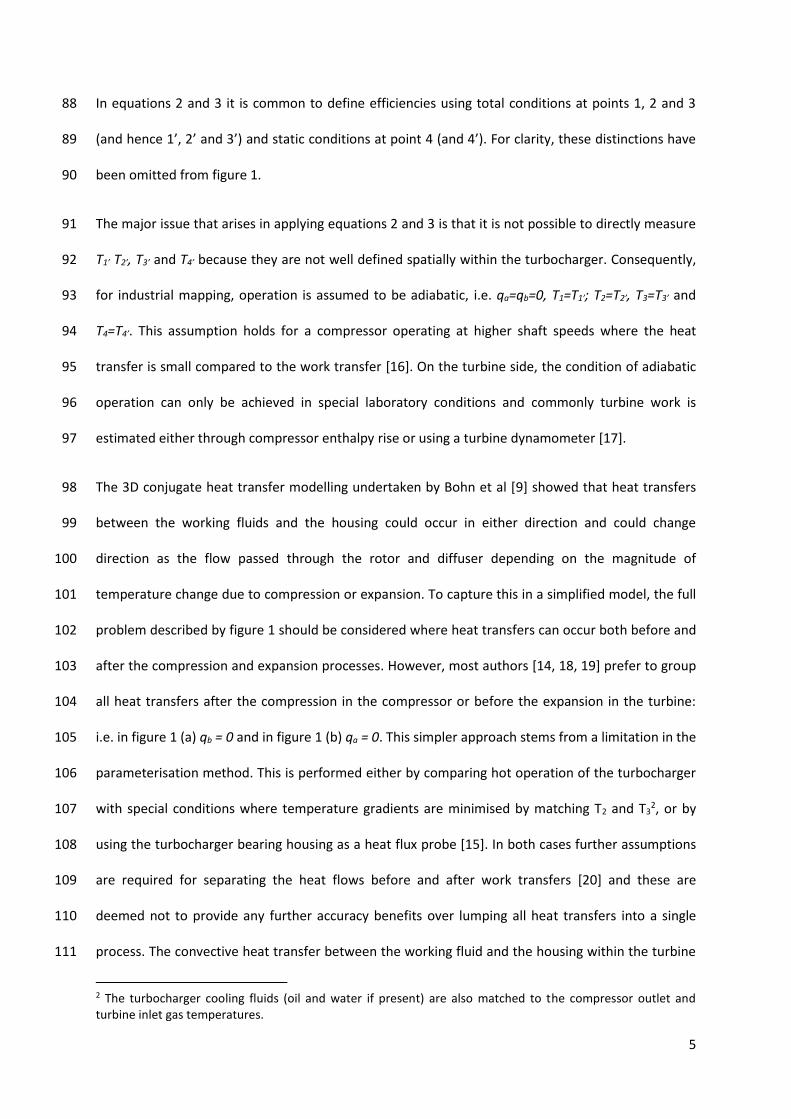
4.2 Gas stand test facility 217
A schematic of the gas stand facility is given in figure 4: the turbine is supplied with hot compressed 218
air from a screw compressor and electrical heating system. The flow through the turbine is 219
controlled through an electric valve and measured using a thermal flow meter before being 220
thermally conditioned by two electric heaters. The turbine drives the compressor and flow through 221
the compressor is controlled by a second electric valve, and measured using a second thermal flow 222
meter. Temperatures and pressures are measured at the inlet and outlet of both devices using k-223
12
type thermocouples and piezo-resistive sensors respectively. Additional k-type temperature sensors 224
integral to the gas stand facility were also available for these experiments. The turbocharger is 225
lubricated using a dedicated oil supply and conditioning system, ensuring oil temperature remains 226
above 70oC during all experiments. 227
Turbine maps were measured under thermally stable conditions for two turbine inlet temperatures 228
(100oC and 500oC) and three variable geometry turbine (VGT) positions (20%, 50% and 80%). The 229
operating points are shown on the compressor and turbine maps in figure 5. Corrected flow 230
conditions for compressor and turbine were obtained from equations 16 and 17 respectivly. 231
�̇�𝑐,𝑐𝑜𝑟𝑟 = �̇�𝑐
√𝑇01298𝑃011
16
�̇�𝑡,𝑐𝑜𝑟𝑟 = �̇�𝑡
√𝑇02288𝑃03
1.01325
17
232
4.3 Engine test facility 233
A 2.2L Diesel engine was installed on a transient AC dynamometer and was used to control 234
turbocharger operating point by varying speed and load conditions. The air flow through the 235
compressor was measured directly using an ABB Sensyflow hot wire flow meter. The flow through 236
the turbine was estimated from the compressor air flow and the fuel flow, measured from a CP 237
Engineering FMS1000 gravimetric fuel balance. Pressure measurements were made on a 10Hz basis 238
using Druck PTX sensors at the inlet and outlet of both turbine and compressor. At the inlet and 239
outlet of the turbine pressures were also measured on an engine crank angle basis using Kistler 4049 240
piezo-resistive sensors. 241
The following experiments were repeated three times to increase confidence in results: 242
14 thermally stable conditions following 8min stabilisation period (figure 6a) 243
13
Transient step experiments (series of step changes in engine operating point with three 244
minute hold time (see figure 6b). Three minutes was chosen as this allows for the system to 245
stabilise between transients thus allowing for the individual analysis of each step transient. 246
The steady and transient engine operating conditions are also shown on the turbine and compressor 247
maps in figure 5. 248
4.4 Measurement Uncertainty 249
Measurement uncertainty has been carried out for total heat transfer and convection coefficients. 250
This combines uncertainty of individual measurement instruments (see table 2) into the calculated 251
values used in the results section using equation 18 [28]. 252
𝑢𝑦 = (∑(𝜕𝑦
𝜕𝑥𝑖𝑢𝑥𝑖)
2𝑛
𝑖=1
)
0.5
18
253
As an example, applying equation 18 to equation 4 for the uncertainty of the heat transferred from 254
gas to turbine casing yields: 255
𝑢𝑄𝐺/𝑇 =
(
(�̇�𝑡𝑐𝑝,𝑇𝑢𝑇03)2+ (−�̇�𝑡𝑐𝑝,𝑇𝑢𝑇4)
2
+(𝑐𝑝,𝑡(𝑇03 − 𝑇04)𝑢�̇�𝑡)2
+(�̇�𝑡(𝑇03 − 𝑇04)𝑢𝑐𝑝,𝑡)2
+(−𝑢𝑊𝑡)2
)
0.5
19
Where the uncertainty in the work transfer, uWT, is estimated in a similar manner by applying 256
equation 18 to equations 5-7. Uncertainties arising solely as a result of sensor uncertainties are 257
given as the solid square points in the upper graphs of figure 7 (a-c) for turbine work, turbine heat 258
transfer rate and turbine Nusselt number. The uncertainty for turbine work increases at lower 259
turbine speeds because the measurement is dependent on the difference in temperatures before 260
and after the compressor: as the speed and power reduce, this difference becomes considerably 261
small. In contrast, heat transfer rate and Nusselt number have increasing uncertainties at higher 262
14
shaft speeds. This is because the uncertainties for both these quantities is highly sensitive to mass 263
flow rate and therefore higher uncertainty results at higher mass flows. 264
Table 2: Measurement accuracy of various quantities measured on the gas stand/engine stand 265
Measurement Unit Sensor Accuracy
Temperature oC k-type thermocouple +/-2oC
Air Mass flow kg/h ABB Sensyflow <1%
Pressure kPa Piezo-resistive +/-0.04%
266
In addition to the measurement uncertainty, of particular importance is the calculation of 267
compressor work based on the temperature measurements at compressor inlet and outlet (equation 268
6). As stated, this approach ignores heat transfer effects in the compressor for the determination of 269
heat transfer in the turbine. To quantify the uncertainty in the proposed approach, it will be 270
assumed that the magnitude of heat transfer rate in the compressor is similar to that presented by 271
Serrano et al [16]: the ratio of heat transfer rate to total enthalpy rate change in the compressor was 272
presented as a function of total enthalpy rate change in the turbine (equation 20). The estimated 273
compressor heat transfer is directly equated to an additional uncertainty source for compressor 274
work equation 21). 275
�̇�𝑐
∆�̇�𝑐= 𝑓(∆�̇�𝑡) 20
𝑢𝑊𝑐,𝐻𝑇 = �̇�𝑐 21
276
The uncertainty due to heat transfer is combined with the sensor uncertainties to calculate the 277
influence on key uncertainties using equation 18. These are presented alongside the sensor only 278
uncertainties in figure 7. For turbine work, the increased uncertainty as a result of ignoring heat 279
transfer is significant for turbocharger speeds below 100krpm and at 50krpm the increased 280
uncertainty through ignoring heat transfer is around 30% of the measured value. Clearly this is a 281
15
severe limitation and illustrates why turbine maps measured in this way are only provided at higher 282
shaft speeds. The effect on uncertainty for turbine heat transfer and Nusselt number is considerably 283
less and at 50krpm the uncertainty increase is only 6% of the measurement. It is these latter two 284
quantities that are most important and high uncertainties for the turbine work will be tolerated. 285
5 RESULTS AND DISCUSSION 286
5.1 Overview of Heat transfer 287
The ratio of heat to work transfer gives an indication of the importance of heat transfer for turbine 288
performance prediction. This is shown over the engine operating map in figure 8, against turbine 289
mechanical power in figure 9 and over the turbine map in figure 10. This highlights the problem that 290
heat transfer is more significant a lower turbine powers where they are not typically mapped, 291
corresponding to lower engine powers. The results in figures 9 and 10 are obvious because they 292
show that heat transfer is strongly linked to temperature and operating point. It is interesting to 293
note that heat transfer accounts for at least 20% of the enthalpy drop over the turbine but that at 294
low turbine powers, this proportion can be significantly higher, even with low turbine gas 295
temperatures. Through figure 9, the exponential correction curves used to correct turbine maps for 296
correlating engine models to measured data [8, 11] are clearly visible. 297
5.2 Internal Convection 298
5.2.1 Steady Flow Results 299
Measured Reynolds and Nusselt numbers are plotted for different VGT positions and turbine inlet 300
temperatures in figure 11; 95% confidence intervals are also shown. The results show that the range 301
of Re numbers under cold and hot flow conditions are an order of magnitude different due to 302
changes in density and mass flow. For a turbine inlet temperature of 500oC (figure 11 a), the Nu/Re 303
relationship has a similar shape to the Seider-Tate correlation for straight pipes. There is also very 304
little distinction within the error margins with respect to VGT position. The 95% uncertainty margins 305
16
are acceptable but grow with increasing Reynolds number. In contrast, at 100oC TIT, (figure 11 b), 306
the measured Nu/Re relationship has an exponential shape and very high uncertainty. This is 307
because the largest uncertainty is associated with the temperature measurements, and the 308
sensitivity of this uncertainty is linked to mass flow (equation 8). As mass flow is higher under colder 309
conditions, the uncertainty is also higher. 310
The data measured for turbine inlet temperature of 500oC was used to fit coefficients to equation 311
12. Initially these correlations have been established using the gas stand specific temperature 312
measurements rather than the thermocouples mounted onto the turbocharger as this provided 313
consistency with other published works, assumed to use these emasurements, which allows a direct 314
comparaison. In figure 12, these new convective correlations are compared to the other published 315
correlations previously presented in table 1. Cormerais et al. [18] and Reyes [22] established 316
turbocharger-specific correlations (three different devices for Reyes) resulting in an individual 317
correlation for each device. These devices were of varying size but all aimed at passenger car 318
applications ranging from 1.2 to 2.0L displacement. Baines et al [7] derived a single correlation, 319
validated for three turbochargers of similar size for automotive truck applications (hence larger than 320
those studied by Reyes and Cormerais et al.). In contrast, Romagnoli et al. [19] proposed to use an 321
established correlation for flow in pipes. 322
It can be seen that the pipe flow correlation (Romagnoli) agrees well with two of the correlations 323
proposed by Reyes (1 and 2). In contrast the Reyes 3 correlation estimates higher convective heat 324
transfer and agrees better with the correlation proposed by Cormerais et al. Baines’ correlation sits 325
in between these two extremes. The correlations derived from the present work give a similar 326
magnitude to the correlations from Cormerais and Reyes (3). There is significant variation 327
depending on the VGT guide vane angle which could be expected because of the way these guide 328
vanes will affect the flow characteristics within the volute and wheel. It should be remembered that 329
the coefficients of the correlation are required to capture the complex 3D flow phenomenon 330

17
occuring within the device. Reyes [22] also observed this influence of VGT with similar magnitudes 331
difference. However, in this study it is observed a gradual decrease with VGT opening, Reyes 332
observed a correlation with peak turbine efficiency, meaning peak convective heat transfer was 333
observed at intermediate VGT vane angles with lower correlations as the vanes were opend or 334
closed. 335
There are no obvious links between the correlations and the characteristics of each of the 336
turbochargers based on the available data. 337
1. When considering the size of the different turbochargers, the correlations proposed by 338
Reyes [22] rank with device size, with Reyes 1 the largest (from 2.0L engine) and Reyes 3 339
smallest from a 1.2L engine. However the correlation proposed by Baines [7] is for 340
considerably larger commercial vehicles and the device used in the present paper is taken 341
from a 2.2L engine. 342
2. When considering the inclusion of variable geometry guide vanes, the turbochargers used to 343
derive correlations Reyes 1 and 2, Cormerais and those from the present paper were all 344
fitted with the VGT devices and span the full range of observed convective heat transfer. 345
The wide range of values proposed in the literature show that it is not yet possible to derive a single, 346
simple convective heat transfer correlation applicable across different turbocharger devices. Whilst 347
this highlights the need for further study in this area, for the purpose of the present study it 348
demonstrates consistency with other research findings. 349
Turbine Nusselt numbers were also calculated based on the gas stand data using the thermocouples 350
located on the turbocharger inlet and outlet port, and identical to the measurements used on-351
engine. These are compared to those obtained previously and to results from the engine 352
experiments in figure 13. These will be discussed in the next section. 353
18
5.2.2 On-engine results 354
The analysis was repeated for engine based experiments and results are shown in figure 13. To allow 355
direct comparison of engine conditions with exhaust gases and gas stand conditions with air, the 356
results have been adjusted to a Prandtl number of 0.7 using equation 22. 357
𝑁𝑢(𝑃𝑟=0.7) = 𝑁𝑢(𝑃𝑟=𝑥)0.71/3
𝑃𝑟𝑥1/3
22
358
The results in figure 13 shows good agreement between the engine and gas stand data when the 359
same temperature sensors are used in both cases. The agreement is worst when comparing the 360
engine data with that obtained from the gas stand using gas stand standard instrumentation, 361
especially at low Reynolds numbers. The discrepancy between gas stand and engine Nusselt number 362
at low Reynolds number can primarily be attributed to the measurements of temperatures at inlet 363
and outlet of the turbine. On the gas stand, conditions for this measurement are more favourable as 364
the flow is both steady and enters and leaves the turbine long straight pipes. On the engine, the 365
flows are both pulsating and the geometry of the exhaust manifold and subsequent exhaust system 366
make the temperature measurement particularly complex. Future studies should consider further 367
measures to promote the accuracy in an engine situation such as the inclusion of bespoke 368
measurement sections replicating to some extent the gas stand layout. It is interesting to note that 369
when using the same instrumentation on-engine and on gas stand, there is strong agreement 370
despite the differences in flow conditions showing that sensor location is a dominant effect. 371
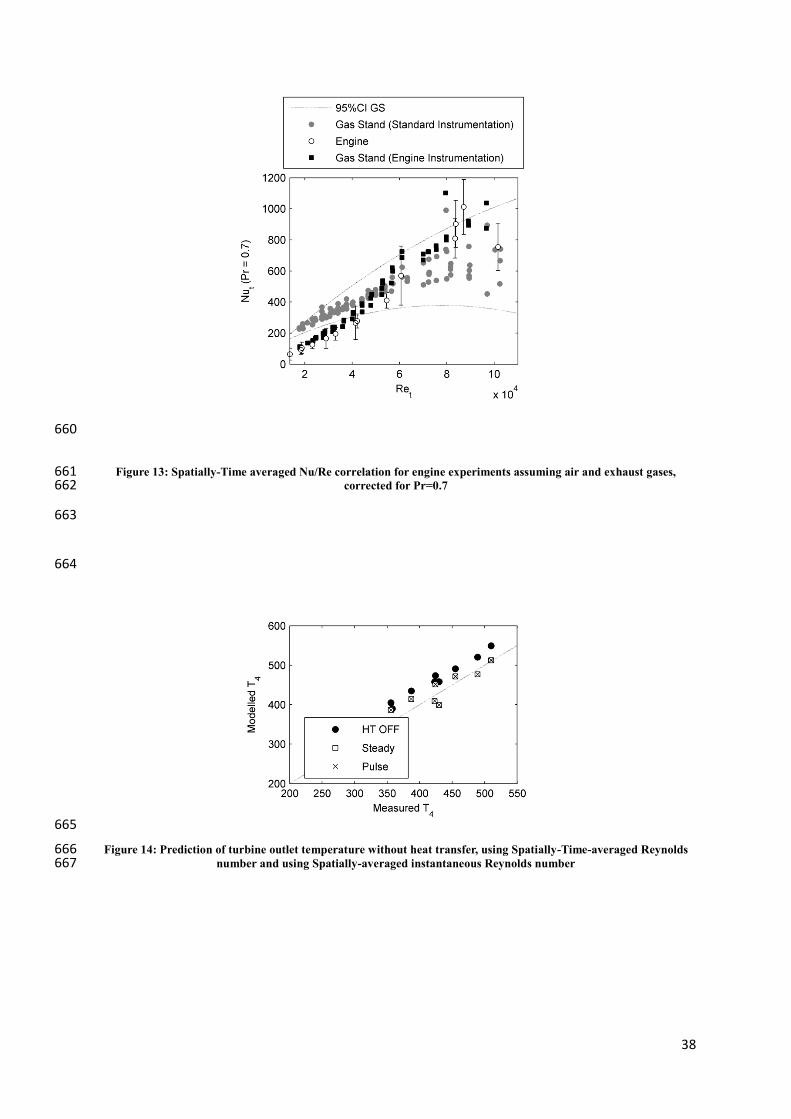
Using the gas-stand derived correlation with standard instrumentation to predict the turbine outlet 372
temperature on-engine, improved turbine outlet temperature prediction as shown in figure 14. This 373
equates to a reduction of mean error from 33oC to -3oC but an increase in standard deviation of 374
error from 10oC to 20oC. 375
19
The model was also used to investigate the effect of pulsating flows on the internal convection. Until 376
now, the Re and Nu numbers have been considered both spatially and time averaged. Pulsating 377
flows equate to pulsating Reynolds numbers as illustrated in figure 15 (obtained from the 1D turbine 378
flow model). Figure 16 compared three different Nusselt/Reynolds relationships obtained as follows: 379
1. Raw Measurement: obtained using the raw measurements of mass flow from the engine 380
test bench (from the intake air flow and fuel flow measurements). 381
2. Pulsating Simulation: obtained by using a simulated mass flow based obtained by applying 382
measured instantaneous pressure measurements from the turbine inlet and outlet and 383
applying these to a double orifice model proposed by Serrano et al. [26]. 384
3. Arithmetic mean of pulsating simulation: average Nusselt and Reynolds number over two 385
engine revolutions corresponding to four pulsations, one from each of the engine cylinders. 386
There is a small offset between the arithmetic mean and the point that results from the physical 387
averaging due to slow sensors response. However, as shown in figure 14, this has little effect on the 388
accuracy of turbine outlet temperature prediction. 389
5.3 Effect of transient operation 390
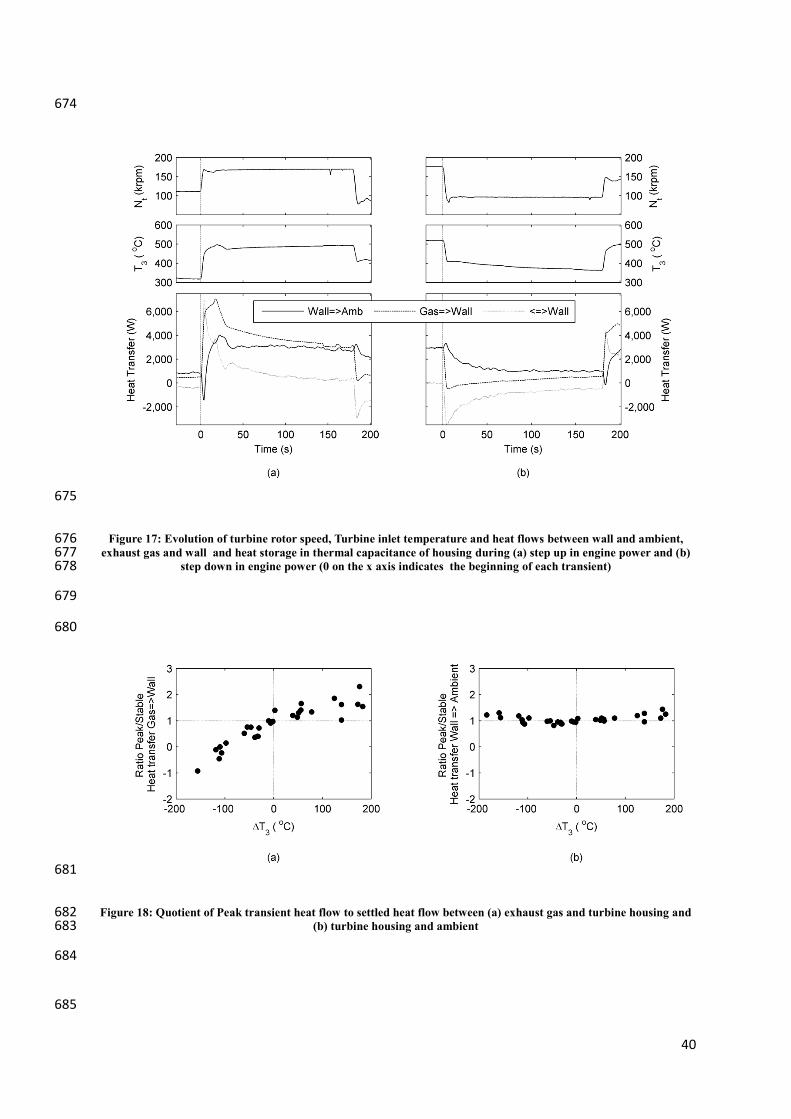
The transient events on engine affect the turbocharger at a range of timescales [29]. It has been 391
shown in the previous section that the flow pulsations have only a small impact on the heat transfer 392
phenomenon. This is explained by the large time constant associated with the thermal inertia of the 393
turbine housing compared with the frequency of the exhaust pulsations. Engine transients occur 394
over a longer timescale and the dynamics of heat transfer will become significant as illustrated in 395
figure 17. The figure shows measured turbine inlet temperature and rotational speed and calculated 396
heat flows following two near step changes in engine power. The calculated heat flows are obtained 397
by the heat transfer model whilst applying measured boundary conditions of turbine inlet and outlet 398
pressure, turbine inlet temperature and turbine rotational speed. 399
20
Figure 17 (a) illustrates the case of a step up in engine power. Initially the engine is operating under 400
stable conditions: heat flow from gas to the turbine housing almost equals the heat flow out of the 401
housing and the net heat flow into or out of the housing wall (heat storage) is null. The engine 402
undergoes a rapid power transient at time t=0s causing a rise in turbine inlet temperature through 403
higher fuelling levels. Other control actions also occur such as closing of variable geometry guide 404
vanes. The turbine rotation speed increases sharply over the next 5 seconds with the dynamics 405
controlled by the mechanical inertia of the shaft and loadings on the compressor. The measured 406
turbine inlet temperature undergoes two distinct phases: over the first 30s the temperature rise is 407
relatively large, increasing from 320oC to 474oC. The temperature overshot in this period can be 408
explained by a particular transient characteristic of the engine control which allows a temporary 409
overboosting of the engine. From 30s to 150s after the change in engine power, the temperature 410
rise is much slower with an increase to 492oC. These temperature measurements, which are also 411
used to calculate the heat flows in figure 17 will be affected by the response of the thermocouples 412
used in the measurement. The response of the thermocouple is dependent on the thermal inertia, 413
and therefore the size of the thermocouples, but also the flow conditions and notably the Reynolds 414
number in the pipe. Analysis presented in appendix 1 for 3mm diameter thermocouples shows that 415
the 95% response time for turbocharger inlet and outlet conditions is in the range of 4-20s. Clearly 416
this will affect the accuracy during the initial rapid response corresponding to the first 30s of the 417
response. However, this will have a much smaller impact on the accuracy of the second phase of the 418
response 30-150s. The heat flow from gas to housing peaks at the beginning of the transient (in this 419
case at around 7kW) before slowly falling to a value of around 3.6kW three minutes later. This spike 420
in heat flow is accounted for by the accumulation of heat in the turbine housing as it warms up. 421
Figure 17 (b) shows the opposite case for a step down in engine load. The heat loss from the gas to 422
housing has a minimum which, in this particular case, is -200W before tending to around +200W 423
three minutes after the transient. This indicates that the heat flow is reversed just after the 424

21
transient, flowing from the housing to the gas. The same comments for figure 17 (a) with regard to 425
thermocouple response time equally apply to figure 17 (b). 426
For a series of steps in engine power of different magnitude, the peak and settled heat transfers 427
have been defined as follows: 428
ΔT3: The temperature difference between instances just prior to step change in engine 429
power and three minutes after the step change. 430
�̇�𝑷𝒆𝒂𝒌: Maximum or minimum measured heat flow during first 60s following step change in 431
engine power 432
�̇�𝑺𝒆𝒕𝒕𝒍𝒆: Mean measured heat flow between 160 and 180 seconds following step change in 433
engine power 434
The quotient of these two heat flow values have been plotted against step change in turbine inlet 435
temperature in figure 18. 436
For heat flow between the exhaust gases and the turbine casing, figure 18a shows that larger TIT 437
transients result in larger ratio of initial to settled heat transfer. It is important to bear in mind that 438
Qsettle was always a positive, as ultimately the exhaust gases are always hotter than the ambient. 439
Points in the upper right quadrant correspond to a positive step in exhaust gas temperature. 440
Every case in this quadrant has a Qpeak/Qsettle ratio greater than 1 meaning the peak heat flow 441
is larger than the settled flow. 442
Points located in the upper left quadrant correspond to step reductions in TIT temperature 443
and all have a Qpeak/Qsettle value between 0 and 1. These points all correspond to step 444
reductions in exhaust gas temperature of less than 100oC. 445
Points located in the lower left quadrant correspond to situations where the peak heat flow 446
is reversed (i.e. from the casing to the exhaust gases). These correspond to larger reductions 447
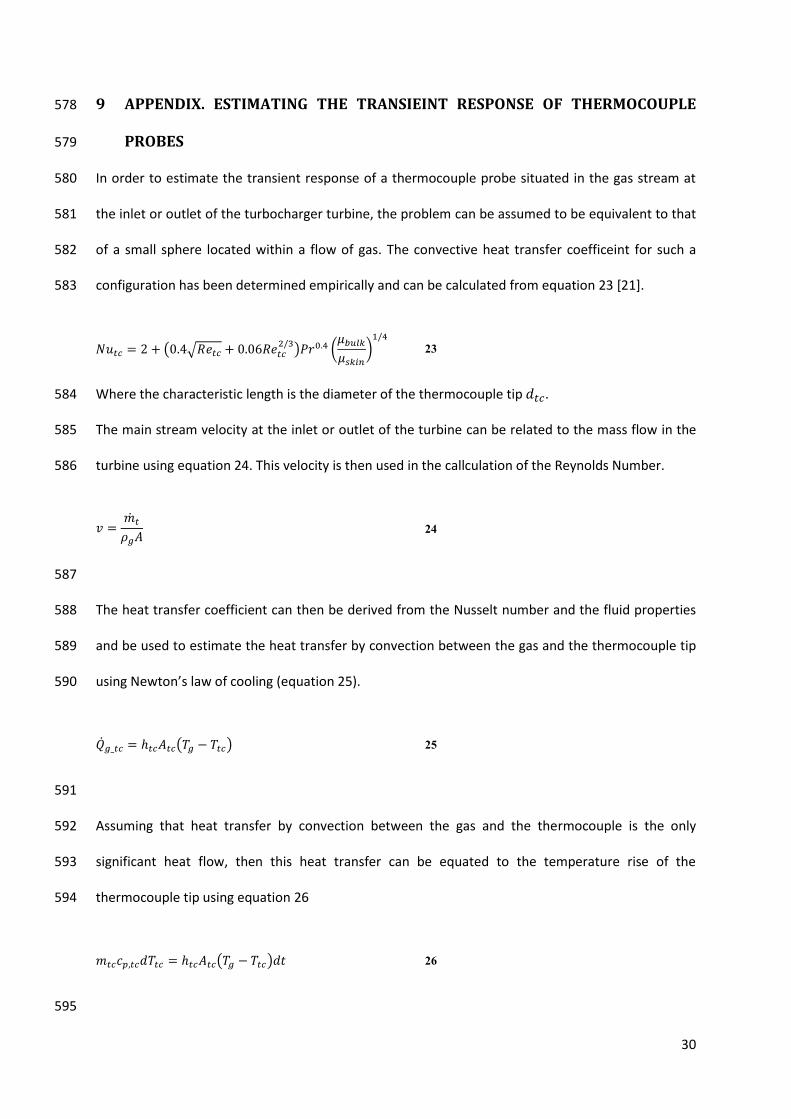
in TIT of more than 100oC. 448
22
Figure 18b shows the same ratio for heat transfer from the turbine housing to its surroundings 449
(ambient and bearing housing). For all steps, positive and negative, of less than 100oC this ratio is 450
approximately equal to 1 meaning there is no significant peak in heat flow. This is because the 451
turbine housing temperature does not change significantly and ambient temperature remains 452
constant, therefore heat transfers with the surroundings are not affected. It is only when much 453
larger step changes in turbine inlet temperature are induced that peak heat flow begins to appear. 454
6 CONCLUSIONS 455
In this paper, an experimental and lumped capacity modelling approach was used to assess heat 456
transfer characteristics in turbocharger turbines. Through this work, the following conclusions have 457
been drawn: 458
1. Heat transfer in the turbine always represents at least 20% of enthalpy change in the 459
turbine, however it can be significantly more under low turbine power conditions. This 460
corresponds to the low power operating conditions of the engine in the low speed/low 461
torque region 462
2. It is difficult to compare the fitted curves for Nusselt /Reynolds correlations at different 463
turbine inlet temperatures because the Reynolds numbers vary by an order of magnitude 464
due to changes in fluid density. Consequently direct comparison relies on considerable 465
extrapolation away from the measured data. 466
3. Heat transfer correlations determined on-engine and gas stand can be significantly different 467
due to different instrumentation layouts, however when consistent sensors are used across 468
facilities, good agreement is obtained despite the differences in flow conditions. 469
4. Despite the discrepancies incurred due to instrumentation differences, the use of heat 470
transfer correlations obtained from the gas stand to simulate on-engine conditions will 471
provide a significant improvement in prediction accuracy using either averaged or pulsating 472
flow Reynolds numbers. This shows quasi-steady behaviour can be assumed for convective 473
23
heat transfer coefficient. Care should be taken to account for the change in Prandtl number 474
due to variations in gas composition between air and exhaust gases. Application of the gas 475
stand derived heat transfer correlation reduced the turbine outlet temperature prediction 476
error from 33oC to -3oC. 477
5. Operation under transient conditions shows that the thermal inertia of the housing 478
significantly influences the heat flow because of the change in temperature difference 479
between gas and wall. For large reductions in turbine inlet temperature (greater than 480
100oC), the heat flow was reversed during the transient. 481
7 GLOSSARY 482
7.1 Nomenclature 483
A Area m2
c Empirical Constant
Cfr Friction Constant W/rpm2
cp Heat capacity at constant pressure J/kgK
D Diameter m
h Specific enthalpy,
Convective Heat Transfer
coefficient
kJ/kg,
W/m2K
k Thermal Conductivity W/mK
L Characteristic length m
m Mass kg
�̇� Mass flow kg/s
N Shaft Speed 1/min
Nu Nusselt Number
P Pressure Bar
Pr Prandtl Number
24
q Specific heat flow kJ/kg
�̇� Heat transfer rate W
Re Reynolds Number
T Temperature K
t time s
u Uncertainty
v velocity m/s
W Work J
�̇� Work transfer rate W
x Length (Conduction)
Independent Variable (uncertainty
analysis)
m
y Dependent Variable (uncertainty
analysis)
𝛾 ratio of specific heats
𝜂 Efficiency
𝜇 Dynamic Viscosity kg s-1 m-1
𝜌 Density Kg/m3
𝜏 Thermocouple Time Constant s
484
7.2 Subscripts 485
0 Stagnation (temperature)
1 Pre Compressor
1’ Pre compression
2 Post Compressor
2’ Post Compression
3 Pre Turbine
3’ Pre Expansion

25
4 Post Turbine
4’ Post Expansion
a After compression/expansion
act Actual
b Before compression/expansion
B Bearing Housing
bulk Fluid bulk property
c Compressor
conv Convective
corr Corrected
d inlet diameter
f friction
g Gas
rad Radiation
s Isentropic (Efficiency)
skin Fluid film skin property
t Turbine
tc thermocouple
T Turbine Housing
work Mechanical Work
486
7.3 Abbreviations 487
BMEP Brake Mean Effective Pressure
CO2 Carbon Dioxide
EGR Exhaust Gas Recirculation
RMSE Root mean square error
TIT Turbine Inlet Temperature
VGT Variable Geometry Turbine
488
26
8 REFERENCES 489
[1] Taylor, A.M.K.P., Science review of internal combustion engines, Energy Policy, vol. 36, pp. 490
4657-4667, 2008, DOI: 10.1016/j.enpol.2008.09.001 491
[2] Moraal, P. and Kolmanovsky, I., Turbocharger Modelling for Automotive Control 492
Applications, SAE Paper Number 1999-01-0908, 1999 493
[3] Chesse, P., Chalet, D., and Tauzia, X., Impact of the heat transfer on the performance 494
calculations of automotive turbocharger compressor (Influence des transferts thermiques 495
sur le calcul des performances des compresseurs de suralimentation), Oil and Gas Science 496
and Technology, vol. 66, pp. 791-800, 2011, DOI: 10.2516/ogst/2011129 497
[4] Cormerais, M., Hetet, J.F., Chesse, P., and Maiboom, A., Heat Transfer Analysis in a 498
Turbocharger Compressor: Modeling and Experiments, SAE Paper Number 2006-01-0023, 499
2006, DOI: 10.4271/2006-01-0023 500
[5] Shaaban, S., Experimental investigation and extended simulation of turbocharger non-501
adiabatic performance, PhD, Fachbereich Maschinenbau, Universität Hannover, Germany, 502
2004. 503
[6] Serrano, J.R., Guardiola, C., Dolz, V., Tiseira, A., and Cervelló, C., Experimental Study of the 504
Turbine Inlet Gas Temperature Influence on Turbocharger Performance, SAE Paper Number 505
2007-01-1559, 2007, DOI: 10.4271/2007-01-1559 506
[7] Baines, N., Wygant, K.D., and Dris, A., The analysis of heat transfer in automotive 507
turbochargers, Journal of Engineering for Gas Turbines and Power, vol. 132(4), 2010, DOI: 508
10.1115/1.3204586. 509
[8] Aghaali, H. and Angstrom, H.-E., Improving Turbocharged Engine Simulation by Including 510
Heat Transfer in the Turbocharger, SAE Paper Number 2013-01-0703, 2012, DOI: 511
10.4271/2012-01-0703 512
27
[9] Bohn, D., Heuer, T., and Kusterer, K., Conjugate flow and heat transfer investigation of a 513
turbo charger, Journal of Engineering for Gas Turbines and Power, vol. 127(3), pp. 663-669, 514
2005, DOI: 10.1115/1.1839919. 515
[10] Heuer, T. and Engels, B., Numerical analysis of the heat transfer in radial turbine wheels of 516
turbo chargers, proceedings of the 2007 ASME Turbo Expo, pp. 959-968, May 14-17, 2007, 517
Montreal, Que., Canada, 2007 518
[11] Jung M., Ford R.G., Glover K., Collings N., Christen U. and Watts M.J. Parameterization and 519
Transient Validation of a Variable Geometry Turbocharger for Mean-Value Modeling at Low 520
and Medium Speed-Load Points. SAE Paper 2002-01-2729, 2002. 521
[12] Casey, M.V. and Fesich, T.M., The efficiency of turbocharger compressors with diabatic 522
flows, Journal of Engineering for Gas Turbines and Power, vol. 132, 2010, DOI: 523
10.1115/1.4000300 524
[13] Cormerais, M., Chesse, P., and Hetet, J.-F., Turbocharger heat transfer modeling under 525
steady and transient conditions, International Journal of Thermodynamics, vol. 12, pp. 193-526
202, 2009, ISSN: 1301-9724 527
[14] Olmeda, P., Dolz, V., Arnau, F.J., and Reyes-Belmonte, M.A., Determination of heat flows 528
inside turbochargers by means of a one dimensional lumped model, Mathematical and 529
Computer Modelling, vol. 57, pp. 1847-1852, 2013, DOI: 10.1016/j.mcm.2011.11.078. 530
[15] Serrano, J.R., Olmeda, P., Paez, A., and Vidal, F., An experimental procedure to determine 531
heat transfer properties of turbochargers, Measurement Science & Technology, vol. 21, Mar 532
2010, DOI: 10.1088/0957-0233/21/3/035109. 533
[16] Serrano, J., Olmeda, P., Arnau, F., Reyes-Belmonte, M., and Lefebvre, A., Importance of Heat 534
Transfer Phenomena in Small Turbochargers for Passenger Car Applications, SAE Int. J. 535
Engines, vol. 6, pp. 716-728, 2013, DOI: 10.4271/2013-01-0576. 536
[17] Szymko, S., Mcglashan, N.R., Martinez-Botas, R., and Pullen, K.R., The development of a 537
dynamometer for torque measurement of automotive turbocharger turbines, Proceedings of 538
28
the Institution of Mechanical Engineers, Part D: Journal of Automobile Engineering, vol. 221, 539
pp. 225-239, 2007, DOI: 10.1243/09544070JAUTO401. 540
[18] Cormerais, M., Caractérisation expérimentale et modélisation des transferts thermiques au 541
sein d’un turbocompresseur automobile. Application à la simulation du comportement 542
transitoire d’un moteur Diesel à forte puissance spécifique, Thèse de Doctorat, École 543
Doctorale Mecanique, Thermique et Genie Civil, École Centrale de Nantes et Université de 544
Nantes, Nantes, France, 2007. 545
[19] Romagnoli, A. and Martinez-Botas, R., Heat transfer analysis in a turbocharger turbine: An 546
experimental and computational evaluation, Applied Thermal Engineering, vol. 38, pp. 58-77, 547
2012, DOI: 10.1016/j.applthermaleng.2011.12.022. 548
[20] Burke R.D., Copeland C.D. and Duda T. Investigation into the Assumptions for Lumped 549
Capacitance Modelling of Turbocharger Heat Transfer. 6th International Conference on 550
Simulation and Testing. Berlin, Germany: Expert-Verlag, 2014. 551
[21] Incropera, F.P. and De Witt, D.P., Introduction to Heat transfer, 2nd ed. New York: John 552
Wiley and sons Inc., ISBN: 0-471-51728-3, 1985. 553
[22] Reyes-Belmonte M.A. Contribution to the Experimental Characterization and 1-D Modelling 554
of Turbochargers for Ic Engines. Departamento de Máquinas y Motores Térmicos. València: 555
Universitat Politècnica de València, 2013. 556
[23] Serrano, J.R., Olmeda, P., Tiseira, A., Garcia-Cuevas, L.M., and Lefebvre, A., Theoretical and 557
experimental study of mechanical losses inautomotive turbochargers, Energy, vol. 55, pp. 558
888-898, 2013, DOI: 10.1016/j.energy.2013.04.042. 559
[24] Payri F., Olmeda P., Arnau F.J., Dombrovsky A. and Smith L. External Heat Losses in Small 560
Turbochargers: Model and Experiments. Energy. 2014; 71: 534-46. 561
[25] Rohsenow, W.M., Hartnett, J.P., and Cho, Y.I., Handbook of Heat Transfer, Third Edition ed. 562
New York: McGraw-Hill, ISBN: 1998 563
29
[26] Serrano, J.R., Arnau, F.J., Dolz, V., Tiseira, A., and Cervelló, C., A model of turbocharger radial 564
turbines appropriate to be used in zero- and one-dimensional gas dynamics codes for 565
internal combustion engines modelling, Energy Conversion and Management, vol. 49, pp. 566
3729-3745, 2008, DOI: 10.1016/j.enconman.2008.06.031 567
[27] Baar R., Biet C., Boxberger V. and Zimmermann R. New Evaluation of Turbocharger 568
Components Based on Turbine Outlet Temperature Measurements in Adiabatic Conditions. 569
IQPC-Tagung DOWNSIZING & TURBOCHARGING. Dusseldorf, Germany2014. 570
[28] Anon, JCGM 100:2008(E) Guide to the expression of uncertainty in measurement (GUM), 571
JCGM, 2008, Available: http://www.iso.org/sites/JCGM/GUM/JCGM100/C045315e-572
html/C045315e.html?csnumber=50461 (accessed 30/07/2010) 573
[29] Copeland, C.D., Newton, P., Martinez-Botas, R.F., and Seiler, M., A comparison of timescales 574
within a pulsed flow turbocharger turbine, in 10th International Conference on 575
Turbochargers and Turbocharging, pp. 389-404, May 15-16, 2012, London, United kingdom, 576
2012 577
30
9 APPENDIX. ESTIMATING THE TRANSIEINT RESPONSE OF THERMOCOUPLE 578
PROBES 579
In order to estimate the transient response of a thermocouple probe situated in the gas stream at 580
the inlet or outlet of the turbocharger turbine, the problem can be assumed to be equivalent to that 581
of a small sphere located within a flow of gas. The convective heat transfer coefficeint for such a 582
configuration has been determined empirically and can be calculated from equation 23 [21]. 583
𝑁𝑢𝑡𝑐 = 2 + (0.4√𝑅𝑒𝑡𝑐 + 0.06𝑅𝑒𝑡𝑐2/3)𝑃𝑟0.4 (
𝜇𝑏𝑢𝑙𝑘𝜇𝑠𝑘𝑖𝑛
)1/4
23
Where the characteristic length is the diameter of the thermocouple tip 𝑑𝑡𝑐. 584
The main stream velocity at the inlet or outlet of the turbine can be related to the mass flow in the 585
turbine using equation 24. This velocity is then used in the callculation of the Reynolds Number. 586
𝑣 =�̇�𝑡𝜌𝑔𝐴
24
587
The heat transfer coefficient can then be derived from the Nusselt number and the fluid properties 588
and be used to estimate the heat transfer by convection between the gas and the thermocouple tip 589
using Newton’s law of cooling (equation 25). 590
�̇�𝑔_𝑡𝑐 = ℎ𝑡𝑐𝐴𝑡𝑐(𝑇𝑔 − 𝑇𝑡𝑐) 25
591
Assuming that heat transfer by convection between the gas and the thermocouple is the only 592
significant heat flow, then this heat transfer can be equated to the temperature rise of the 593
thermocouple tip using equation 26 594
𝑚𝑡𝑐𝑐𝑝,𝑡𝑐𝑑𝑇𝑡𝑐 = ℎ𝑡𝑐𝐴𝑡𝑐(𝑇𝑔 − 𝑇𝑡𝑐)𝑑𝑡 26
595
31
Equation 26 can be rearranged into equation 27 which defined a one degree of freedom first order 596
system. 597
𝑚𝑡𝑐𝑐𝑝,𝑡𝑐
ℎ𝑡𝑐𝐴𝑡𝑐
𝑑𝑇𝑡𝑐𝑑𝑡
+ 𝑇𝑡𝑐 = 𝑇𝑔 27
598
Considering that the system is initially at equilibrium where 𝑇𝑡𝑐 = 𝑇𝑔(0). At time t=0, a step change 599
in gas temperature ∆𝑇𝑔 occurs.The thermocouple response would be given by equation 28. 600
𝑇𝑡𝑐(𝑡) = 𝑇𝑔(0) + ∆𝑇𝑔 (1 − 𝑒−𝑡𝜏) 28
Where the time constant 𝜏 =𝑚𝑡𝑐𝑐𝑝,𝑡𝑐
ℎ𝑡𝑐𝐴𝑡𝑐 601
This standard first order system response has a 95% response time of three time constants. This 602
response time is shown for thermocouples of diameter 0.5mm, 1.5mm and 3mm as a function of 603
turbine Reynolds number in figure 19. These have been calculated assuming that the fluid is air at 604
400oC. It should be noted that this Reynolds number (ReT) is related to the turbine inlet or outlet 605
diameter and therefore directly comparable to the heat transfer correlations used in this work. This 606
is different to the Reynolds number used in this appendix (Retc) which is used to determine the heat 607
transfer coefficient to the thermocouple tip. The results show that for a 3mm diameter 608
thermocouple, the 95% response time will vary between 5s at high flow rates to 17s at low flow 609
rates. Variations as a result in the change in fluid properties due to changes in temperature affect 610
these results by aoround 8% per 100oC. This means that for the same 3mm thermocouple, the range 611
of 95% response times at the highest likely turbine inlet temperature of 900oC is 4s to 14s whilst at 612
the lowest likely turbine inlet temperature of 200oC it is 6s to 20s. 613
It can be concluded from this analysis that the response time of the thermocouples used in this work 614
will be in the region of 4 to 20s. 615
616
32
617 Figure 1: Apparent and assumed compression and expansion processes in (a) compressor and (b) turbine 618
619
620
621
622
Figure 2: Overview of turbocharger heat transfer model 623
h
s
P4
P3
qb
qa
Δhact Δhwork
h
s
P1
P2
qa
qb
Δhact
Δh
work
(a) Compressor (b) Turbine
1 1’
2 2’
4
4’
3’
3
Compressor Turbine
Free Convection + Radiation Forced Convection
P1
T1
P2 T2 P3 T
3
P4
T4
Nturbo
Conduction
Work
�̇�𝑜𝑖𝑙
�̇�𝐶 �̇�𝑇
�̇�𝑓
�̇�𝑏,𝑇
�̇�𝑎,𝑇
�̇�𝑇,𝑟𝑎𝑑+ �̇�𝑇,𝑐𝑜𝑛𝑣
�̇�𝐶,𝑟𝑎𝑑+ �̇�𝐶,𝑐𝑜𝑛𝑣
�̇�𝑇/𝐵 �̇�𝐶/𝐵 �̇�𝑏,𝐶
�̇�𝑎,𝐶
33
624 Figure 3: Thermal instrumentation of turbocharger housing and gas ports 625
626
627
628
629
Figure 4: Schematic of gas stand installation 630
T0.5D
T0.3D
T0.15D
Engine
Teng
Ttop
Tamb
Tdeep Tsurf
Gas Flow
a) Gas temperature measurements in ducts
b) Bearing Housing
c) Compressor/Turbine Scroll
TB-turb TB-comp
Ambient Air
Screw
Compressor Air
Filter Air
Dryer Pressure
Regulator
2 Electric
Heaters
Oil
Filter
Compressor Turbine
Ambient Air
Pump
Flow Meter
Electric Valve
Pressure Transducer
Temperature Transducer
Rotational speed sensor

34
631
Figure 5: Compressor and Turbine operating points during steady flow gas stand experiments 632
633
634
635
Figure 6: Compressor, Turbine and engine operating points for steady and transient experiments 636
637

35
638
639
640
Figure 7: Estimated combined uncertainty for (a) turbine work transfer rate, (b) turbine heat transfer rate and (c) 641 turbine Nusselt number. Uncertainties due only to sensor uncertainty are compared with uncertainty due to sensors 642
and ignoring heat transfer in the compressor side. 643

36
644
Figure 8: QG/T/WT over the engine operating map 645
646
Figure 9: Ratio of turbine total heat loss to turbine work from gas stand testing with TIT 100oC and 500oC 647
648
Figure 10: Ratio of turbine total heat loss to turbine work over the turbine operating map for turbine inlet 649 temperature (a) 100oC and (b) 500oC 650
651
0.2
0.5
1.5
0.2
0.3
0.5

37
652
Figure 11: Spatially averaged Nu/Re correlation based on steady flow gas stand experiments for turbine inlet 653 temperature (a) 500oC and (b) 100oC 654
655
656
657
Figure 12: Comparison of fitted convection correlations with selected correlations from published literature 658
659
38
660
Figure 13: Spatially-Time averaged Nu/Re correlation for engine experiments assuming air and exhaust gases, 661 corrected for Pr=0.7 662
663
664
665
Figure 14: Prediction of turbine outlet temperature without heat transfer, using Spatially-Time-averaged Reynolds 666 number and using Spatially-averaged instantaneous Reynolds number 667

39
668
Figure 15: Predicted turbine flow rate, constant gas temperature, instantaneous Reynolds and Nusselt numbers and 669 predicted pulsating turbine outlet temperature 670
671
Figure 16: Nusselt/Reynolds relationship for Spatially-Time averaged Reynolds number and spatially averaged 672 instantaneous Reynolds number 673
40
674
675
Figure 17: Evolution of turbine rotor speed, Turbine inlet temperature and heat flows between wall and ambient, 676 exhaust gas and wall and heat storage in thermal capacitance of housing during (a) step up in engine power and (b) 677
step down in engine power (0 on the x axis indicates the beginning of each transient) 678
679
680
681
Figure 18: Quotient of Peak transient heat flow to settled heat flow between (a) exhaust gas and turbine housing and 682 (b) turbine housing and ambient 683
684
685

41
686
687
688
Figure 19: Estimated Thermocouple 95% response time for thermocouple diameters 0.5mm to 3mm as a function of 689 turbine Reynolds number 690
691