heat and health in adelaide, south australia: assessment of heat thresholds and temperature...
TRANSCRIPT

Science of the Total Environment 414 (2012) 126–133
Contents lists available at SciVerse ScienceDirect
Science of the Total Environment
j ourna l homepage: www.e lsev ie r .com/ locate /sc i totenv
Heat and health in Adelaide, South Australia: Assessment of heat thresholds andtemperature relationships
Susan Williams a,⁎, Monika Nitschke b, Thomas Sullivan c, Graeme R. Tucker b, Philip Weinstein d,Dino L. Pisaniello a, Kevin A. Parton e, Peng Bi a
a Discipline of Public Health, School of Population Health and Clinical Practice, The University of Adelaide, South Australia 5005, Australiab South Australian Department of Health, Adelaide, South Australia 5000, Australiac Data Management and Analysis Centre, Discipline of Public Health, School of Population Health and Clinical Practice, The University of Adelaide, South Australia 5005, Australiad Graduate Research Centre, University of South Australia, Adelaide, South Australia 5000, Australiae Institute for Land, Water and Society, Charles Sturt University, PO Box 883 Orange, New South Wales 2800, Australia
Abbreviations: ED, emergency department; GEE, geO3, ozone; PM10, particulate matterb10 μm in mass mIRR, incidence rate ratio; ppb, parts per billion.⁎ Corresponding author: Discipline of Public Health,
Clinical Practice, The University of Adelaide, Level 9, 1DX 650 207), Adelaide, SA 5005, Australia. Tel.: +8 83036885.
E-mail addresses: [email protected] ([email protected] (M. Nitschke), thoma(T. Sullivan), [email protected] (G.R. [email protected] (P. Weinstein), dino.pisa(D.L. Pisaniello), [email protected] (K.A. Parton), pen
0048-9697/$ – see front matter © 2011 Elsevier B.V. Alldoi:10.1016/j.scitotenv.2011.11.038
a b s t r a c t
a r t i c l e i n f oArticle history:
Received 17 August 2011Received in revised form 9 November 2011Accepted 14 November 2011Available online 12 December 2011Keywords:TemperatureMortalityMorbidityAir pollutionExtreme heatPublic health
Background: Climate change projections have highlighted the need for public health planning for extremeheat. In Adelaide, South Australia, hot weather is characteristic of summer and heatwaves can have a signif-icant health burden. This study examines the heat thresholds and temperature relationships for mortalityand morbidity outcomes in Adelaide.Methods: Daily maximum and minimum temperatures, daily mortality, ambulance call-outs, emergency de-partment (ED) presentations and hospital admissions were obtained for Adelaide, between 1993 and 2009.Heat thresholds for health outcomes were estimated using an observed/expected analysis. Generalized esti-mating equations were used to estimate the percentage increase in mortality and morbidity outcomes abovethe threshold temperatures, with adjustment for the effects of ozone (O3) and particulate matterb10 μm inmass median aerodynamic diameter (PM10). Effect estimates are reported as incidence rate ratios (IRRs).Results: Heat-related mortality and morbidity become apparent above maximum and minimum temperaturethresholds of 30 °C and 16 °C for mortality; 26 °C and 18 °C for ambulance call-outs; and 34 °C and 22 °C for
heat-related ED presentations. Most health outcomes showed a positive relationship with daily temperaturesover thresholds. When adjusted for air pollutants, a 10 °C increase in maximum temperature was associatedwith a 4.9% increase in daily ambulance call-outs (IRR 1.049; 95% CI 1.027–1.072), and a 3.4% increase inmental health related hospital admissions (IRR 1.034; 95% CI 1.009–1.059) for the all-age population. Heat-related ED presentations increased over 6-fold per 10 °C increase in maximum temperature. Daily tempera-tures were also associated with all-cause and mental health related ED presentations. Associations betweentemperature over thresholds and daily mortality and renal hospital admissions were not significant when ad-justed for ozone and PM10; however at extreme temperatures mortality increased significantly with increas-ing heat duration.Conclusions: Heat-attributable mortality and morbidity are associated with elevated summer temperatures inAdelaide, particularly ambulance call-outs, mental health and heat-related illness.© 2011 Elsevier B.V. All rights reserved.
neralized estimating equation;edian aerodynamic diameter;
School of Population Health &0 Pulteney Street (Mail Drop61 8 83131043; fax: +61
. Williams),[email protected]),[email protected]@adelaide.edu.au (P. Bi).
rights reserved.
1. Introduction
Climate change is predicted to increase the frequency and dura-tion of heat events across Australia, with a strong increase in the fre-quency of warm nights (CSIRO, Bureau of Meteorology, AustralianGovernment, 2007). Studies of major Australian cities have reportedincreased mortality or morbidity from mental and behavioural,renal, cardiovascular, respiratory and cerebrovascular disease, in rela-tion to high ambient temperatures or heatwaves (Bi et al., 2011;Khalaj et al., 2010; Loughnan et al., 2010; Nicholls et al., 2008; Tonget al., 2010a,b; Vaneckova et al., 2008a,b). Whether air pollution hasa modifying influence on temperature–health relationships is less

127S. Williams et al. / Science of the Total Environment 414 (2012) 126–133
well characterised, although a number of studies have demonstratedconfounding or interactive effects of air pollutants (Hu et al., 2008;Ren et al., 2006; Tong et al., 2010a,b; Vaneckova et al., 2008a).
The relationship between temperature and mortality typically ex-hibits a U- or J-shaped curve, with a location specific heat thresholdabove which mortality increases. The identification of heat thresholdscan assist in local planning for extreme heat. In Victoria, thresholdtemperatures for the populations of Melbourne and regional citieshave been incorporated into the Victorian heatwave plan (VictorianGovernment Department of Health, 2009). For the population of Bris-bane, Queensland, deaths and emergency hospital admissions beginto rise at a temperature threshold of around 27 °C (Tong et al.,2010b). The estimated health impact of heat depends on whether es-timates are adjusted for humidity and air pollutants (Tong et al.,2010b), including ozone (Tong et al., 2010a) and PM10 (Ren et al.,2006). Heat thresholds for mortality in Sydney, New South Wales,have been estimated in the range 23–26 °C (Gosling et al., 2007;Guest et al., 1999; Vaneckova et al., 2008a); and confounding or inter-action between temperature and air pollutants, including ozone,PM10 and SO2, have been reported to influence the relationship withmortality (Hu et al., 2008; Vaneckova et al., 2008a,b). Other studieshave estimated temperature thresholds and temperature-attributable mortality for other major Australian cities (Bambrick etal., 2008; Guest et al., 1999).
The city of Adelaide, population 1.2 million, is located in a temperateregion of South Australia. Previous studies have shown significantly in-creased rates of ambulance call-outs andhospital admissions during heat-waves of three ormore consecutive days of≥35 °C (Nitschke et al., 2007).Increases in hospital admissions were most notable for mental health(13%), renal illness (7%), and ischaemic heart disease in the 65–74 yearsgroup (8%) (Hansen et al., 2008a,b; Nitschke et al., 2007). A recent un-precedented heatwave in January–February 2009, including 9 days oftemperatures over 35 °C and 6 consecutive days over 40 °C, was associat-ed with increasedmortality in the 15–65 years age group (Nitschke et al.,2011). With the risk of extreme heat increasing in Adelaide, the purposeof this study was to estimate heat thresholds for different health out-comes, and to examine the relationships betweenwarm season tempera-tures and health outcomes when adjusted for air quality.
2. Materials and methods
2.1. Health data
Daily mortality (1 July 1993–31 March 2009), hospital admissions(1 July 1993–31March 2009) and emergency department (ED) presenta-tions data (1 July 2003–31 March 2009) were acquired from the SouthAustralianDepartment of Health. Hospital admissions datawere availablefor all public and private hospitals in the Adelaide metropolitan area, andincluded emergency and elective admissions. Data for ED presentationswere from major public hospitals. For mortality, hospital admissions,and ED presentations, the following international classifications of dis-eases (ICD, revisions 9 and 10) were used: renal (ICD-9, 580–599.9;ICD-10, N00–N399), mental (ICD-9, 290–294.9; ICD-10, F00–F99), totalcardiovascular (ICD-9, 390–459.9; ICD-10, I00 -I99), ischaemic (ICD-9,410–414.9; ICD-10, I20–I25), respiratory (ICD-9, 460–519.9; ICD-10,J00–J99), and a direct heat-related category comprising dehydration,heat and sunstroke and exposure to excessive heat (ICD-9, 276.5, 992,E900; ICD-10, E86, T67, X30). Ambulance call-out data (1 July 1993–31March 2009) were provided by the South Australian Ambulance Service(SAAS), using SAAS defined categories of cardiac, respiratory and neuro-logical conditions, and excluding patient transfers between hospitals.
2.2. Meteorological and air quality data
Daily maximum and minimum temperature data (°C) were pro-vided by the Australian Bureau of Meteorology. Data were measured
at the Kent Town station (023090) which is representative of theAdelaide metropolitan area. Air quality data for ozone (O3, daily max-imum 1 h average in ppb) and PM10 (daily 24-hour average in μg/m3)from 1 January 2002–31 March 2009 were provided by the Environ-mental Protection Agency, South Australia. These data were recordedat a centrally located metropolitan site (Netley).
2.3. Data analysis
Analysis was conducted in StataIC10 and 11 (StataCorp. CollegeStation, TX). Estimation of heat thresholds used an observed/expected analysis (Dessai, 2002), which accounts for time and sea-sonal trends in the data. A 31-day moving average, including15 days before and after the index day, was used to provide an esti-mate of expected daily outcome events. Daily excess events were cal-culated as the difference between the observed daily values and theexpected values. Mortality, ambulance call-outs and ED presentationswere suitable outcomes for this approach because the daily distribu-tions were similar across the week. Hospital admissions varied sub-stantially by day of the week, largely because of elective admissions,and so were not analysed by this approach.
To relate excess outcome events to daily temperatures, days weregrouped into 2 °C intervals of daily maximum or minimum temperatureafter rounding to the nearest whole degree, and mean daily excess out-comeswere calculated for each temperature interval. Using 2 °C intervalsreduced the resolution at which thresholds could be identified, buthelped to smooth the high variability in daily mortality and morbidityat higher temperatures, where the number of days in each group werelimited. The heat threshold is defined as the temperature interval belowwhich excess events are not discernible (Dessai, 2002). Analyses includeddays within the warmer months, 1 October through 31 March, from theperiod 1 October 1993 to 31 March 2009 (mortality and ambulancecall-outs) or 1 October 2003 to 31 March 2009 (ED presentations).
Generalized estimating equations (GEEs) (Diggle et al., 1994) wereused to examine the associations between daily temperatures overthresholds and mortality and morbidity outcomes, including ambu-lance call-outs, ED presentations and specific-cause hospital admis-sions (renal, mental, cardiovascular and respiratory). Only thewarmer months, 1 October through 31 March were considered inthese analyses. A negative binomial distribution was assumed formortality and morbidity outcomes. We assumed independence be-tween successivewarm seasons and specified a first-order autoregres-sive structure to account for the correlation of daily outcomes withineach warm season, as observed in other studies (Baccini et al., 2008;Fouillet et al., 2007). Models took into account the following potentialconfounders: day of theweek,month, year (from1 July to 30 June), O3,and PM10. Linear terms for elevated (over threshold) and extremetemperatures were included, to allow for non-linear relationships. Ifthe change in slope associated with extreme temperatures was notstatistically significant, results were reported for elevated tempera-tures only. The temperature terms were: (i) elevated temperature(maximum or minimum minus threshold temperature, set as 0 ifTb threshold) and (ii) extreme temperature (maximum minus 40 °C,set as 0 if Tb40 °C; or minimum minus 26 °C, set as 0 if Tb26 °C).The pairwise Pearson correlation coefficients for the different maxi-mum temperature terms ranged from 0.36 to 0.52, and for minimumtemperature terms from 0.48 to 0.56, thus multicollinearity was nota major concern. Since temperature thresholds were not estimatedfor hospital admissions, to model this outcome we used the thresholdestimates for ED presentations. The incidence rate ratios (IRRs) and95% confidence intervals (CI) are reported for 1 °C or 10 °C increasesin temperature, as indicated.
To examine the effects of heat duration we used a variable coded as 1through n for consecutive days above a hot day temperature cut-point,and 0 for all days below the cut-point. Hot days were defined by maxi-mum temperature >90th, >95th, or >99th percentile for warm seasons
128 S. Williams et al. / Science of the Total Environment 414 (2012) 126–133
over the period 1994–2009. In this case the reported IRRs are for hot dayscompared to all other days during the warm season.
When adjusting for air pollutants the periods of data analysedwere: 1 January 2002 to 31 March 2009 for mortality, ambulancecall-outs, and hospital admissions; and 1 October 2003–31 March2009 for ED presentations; with unadjusted analyses for the corre-sponding periods for comparison. Days with missing data for maxi-mum temperature (2 days), minimum temperature (2 days), and O3
(3 days) were omitted from the analysis. The level of missing data forPM10 (5.5%) meant that interpolation was necessary to generate a
(a)
(c)
(e)
(
(
(
010
2030
Mea
n da
ily h
eat E
D p
rese
ntat
ions
10 15 20 25 30 35 40 45
150
200
250
300
Mea
n da
ily a
mbu
lanc
e ca
ll-ou
ts
10 15 20 25 30 35 40 45
2025
3035
Mea
n da
ily d
eath
s
10 15 20 25 30 35 40 45
Maximum temperature oC
Maximum temperature oC
Maximum temperature oC
(g) (
800
850
900
950
1000
Mea
n da
ily E
D p
rese
ntat
ions
10 15 20 25 30 35 40 45
Maximum temperature oC
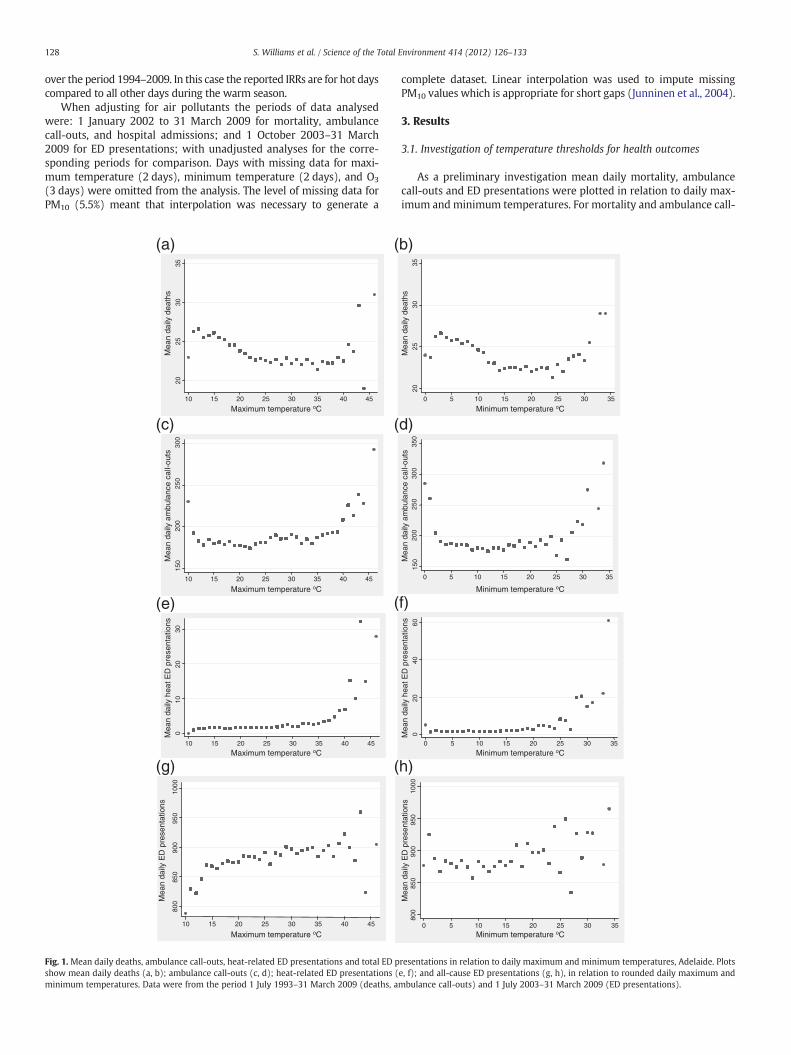
Fig. 1. Mean daily deaths, ambulance call-outs, heat-related ED presentations and total ED pshow mean daily deaths (a, b); ambulance call-outs (c, d); heat-related ED presentations (minimum temperatures. Data were from the period 1 July 1993–31 March 2009 (deaths, a
complete dataset. Linear interpolation was used to impute missingPM10 values which is appropriate for short gaps (Junninen et al., 2004).
3. Results
3.1. Investigation of temperature thresholds for health outcomes
As a preliminary investigation mean daily mortality, ambulancecall-outs and ED presentations were plotted in relation to daily max-imum andminimum temperatures. For mortality and ambulance call-
b)
d)
f)
020
4060
Mea
n da
ily h
eat E
D p
rese
ntat
ions
0 5 10 15 20 25 30 35
150
200
250
300
350
0 5 10 15 20 25 30 35
2025
3035
Mea
n da
ily d
eath
s0 5 10 15 20 25 30 35
Mea
n da
ily a
mbu
lanc
e ca
ll-ou
tsMinimum temperature oC
Minimum temperature oC
Minimum temperature oC
h)
800
850
900
950
1000
Mea
n da
ily E
D p
rese
ntat
ions
0 5 10 15 20 25 30 35Minimum temperature oC
resentations in relation to daily maximum and minimum temperatures, Adelaide. Plotse, f); and all-cause ED presentations (g, h), in relation to rounded daily maximum andmbulance call-outs) and 1 July 2003–31 March 2009 (ED presentations).

(a)
(c)
(e)
(b)
(d)
(f)
0
10
20
30
40
Mea
n ex
cess
hea
t-re
late
d E
Ds
6 8 10 12 14 16 18 20 22 24 26 28 30 32 34
7
2
2
0
10
20
30
40
Mea
n ex
cess
am
bula
nce
call-
outs
6 8 10 12 14 16 18 20 22 24 26 28 30 32 34
12
2
2
-2
0
2
4
6
6 8 10 12 14 16 18 20 22 24 26 28 30 32 34
Minimum temperature interval oC
12
2
2
0
5
10
15
20
Mea
n ex
cess
hea
t-re
late
d E
Ds
14 16 18 20 22 24 26 28 30 32 34 36 38 40 42 44 46
21
8
1
-10
0
10
20
30
Mea
n ex
cess
am
bula
nce
call-
outs
14 16 18 20 22 24 26 28 30 32 34 36 38 40 42 44 46
30
11
1
-1
0
1
2
3
4
Mea
n ex
cess
dea
ths
14 16 18 20 22 24 26 28 30 32 34 36 38 40 42 44 46
Maximum temperature interval oC
Minimum temperature interval oC Maximum temperature interval oC
Minimum temperature interval oC Maximum temperature interval oC
11
30
Mea
n ex
cess
dea
ths
1
Fig. 2.Mean excess daily deaths, ambulance call-outs and heat-related ED presentations in relation to daily temperatures, Adelaide. Plots show excess daily deaths (a, b); ambulancecall-outs (c, d); and heat-related ED presentations (e, f), in relation to 2 °C intervals of maximum and minimum temperature on days within Adelaide warm seasons, 1 Octoberthrough 31 March. Data were from 1 October 1993–31 March 2009 (mortality and ambulance call-outs) and 1 October 2003–31 March 2009 (ED presentations). For the highesttemperature intervals, the number of days represented is indicated above the columns.
129S. Williams et al. / Science of the Total Environment 414 (2012) 126–133
outs a J-shaped relationship with temperature was evident (Fig. 1(a–d)). Plots of mortality due to respiratory, cardiovascular or ischaemicheart disease were similar to all-cause mortality (not shown). Meandaily ED presentations, particularly heat-related, increased with in-creasing temperature (Fig. 1(e–h)). An increase was also apparentfor mental and renal-related ED presentations, but no positive rela-tionship was observed for respiratory, cardiovascular or ischaemicheart disease ED presentations (not shown).
An observed/expected descriptive analysis was undertaken to es-timate heat thresholds for different outcomes. Fig. 2 shows plots ofmean daily excess mortality, ambulance call-outs, and heat-relatedED presentations against 2 °C intervals of daily maximum or mini-mum temperature. These plots indicate that heat-related mortalityandmorbidity become apparent above maximum andminimum tem-perature thresholds of 30 °C and 16 °C for mortality, 26 °C and 18 °Cfor ambulance call-outs, and 34 °C and 22 °C for heat-related ED
presentations. Table 1 shows the heat threshold estimates for specifichealth outcomes, for the all-age and ≥65-years age groups.
3.2. Relationships between daily temperatures and health outcomes
The relationships between health outcomes and temperaturesover thresholds were examined using linear terms for (i) elevated(over threshold) and (ii) extreme temperatures, because of the ob-served non-linearity in Figs. 1 and 2. The cut-points for extreme tem-peratures were set at 40 °C (maximum) and 26 °C (minimum), assuggested from Figs. 1 and 2. The results are summarised in Table 2,and represent analysis of the full period of available data for eachhealth outcome. For most outcomes there was a positive associationwith elevated temperatures (over threshold) but the change inslope at extreme temperatures was not statistically significant. Forheat-related ED presentations however there was a further increase
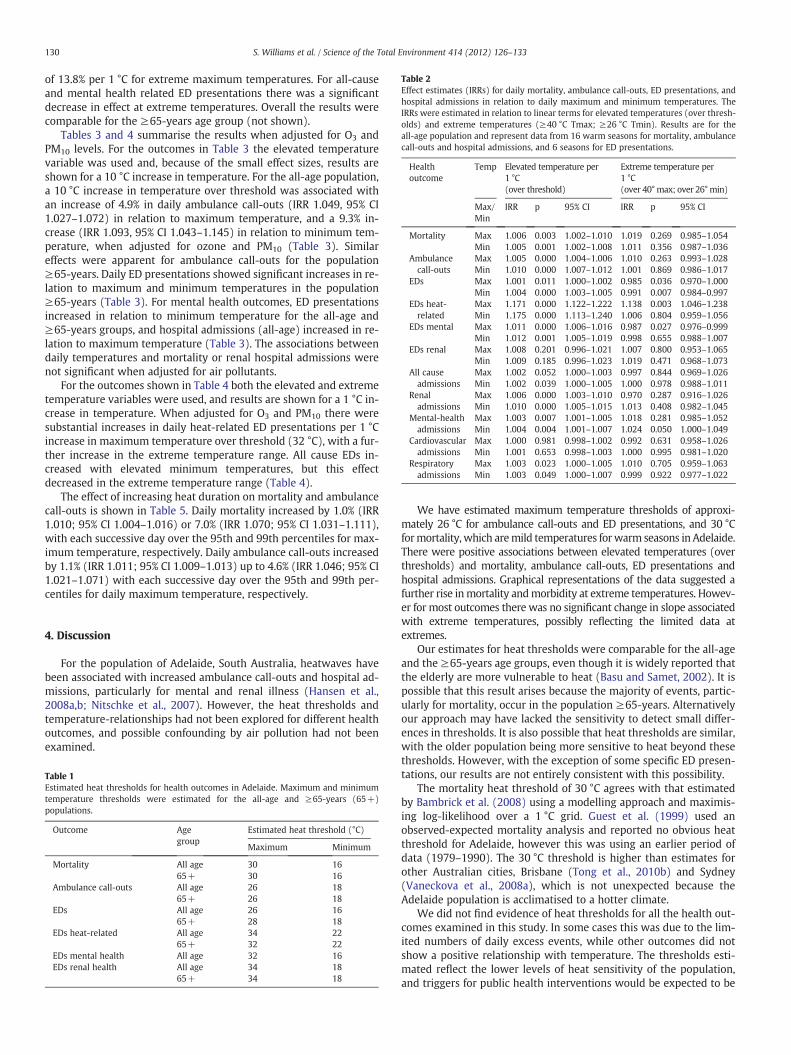
Table 2Effect estimates (IRRs) for daily mortality, ambulance call-outs, ED presentations, andhospital admissions in relation to daily maximum and minimum temperatures. TheIRRs were estimated in relation to linear terms for elevated temperatures (over thresh-olds) and extreme temperatures (≥40 °C Tmax; ≥26 °C Tmin). Results are for theall-age population and represent data from 16 warm seasons for mortality, ambulancecall-outs and hospital admissions, and 6 seasons for ED presentations.
Healthoutcome
Temp Elevated temperature per1 °C(over threshold)
Extreme temperature per1 °C(over 40°max; over 26°min)
Max/Min
IRR p 95% CI IRR p 95% CI
Mortality Max 1.006 0.003 1.002–1.010 1.019 0.269 0.985–1.054Min 1.005 0.001 1.002–1.008 1.011 0.356 0.987–1.036
Ambulancecall-outs
Max 1.005 0.000 1.004–1.006 1.010 0.263 0.993–1.028Min 1.010 0.000 1.007–1.012 1.001 0.869 0.986–1.017
EDs Max 1.001 0.011 1.000–1.002 0.985 0.036 0.970–1.000Min 1.004 0.000 1.003–1.005 0.991 0.007 0.984–0.997
EDs heat-related
Max 1.171 0.000 1.122–1.222 1.138 0.003 1.046–1.238Min 1.175 0.000 1.113–1.240 1.006 0.804 0.959–1.056
EDs mental Max 1.011 0.000 1.006–1.016 0.987 0.027 0.976–0.999Min 1.012 0.001 1.005–1.019 0.998 0.655 0.988–1.007
EDs renal Max 1.008 0.201 0.996–1.021 1.007 0.800 0.953–1.065Min 1.009 0.185 0.996–1.023 1.019 0.471 0.968–1.073
All causeadmissions
Max 1.002 0.052 1.000–1.003 0.997 0.844 0.969–1.026Min 1.002 0.039 1.000–1.005 1.000 0.978 0.988–1.011
Renaladmissions
Max 1.006 0.000 1.003–1.010 0.970 0.287 0.916–1.026Min 1.010 0.000 1.005–1.015 1.013 0.408 0.982–1.045
Mental-healthadmissions
Max 1.003 0.007 1.001–1.005 1.018 0.281 0.985–1.052Min 1.004 0.004 1.001–1.007 1.024 0.050 1.000–1.049
Cardiovascularadmissions
Max 1.000 0.981 0.998–1.002 0.992 0.631 0.958–1.026Min 1.001 0.653 0.998–1.003 1.000 0.995 0.981–1.020
Respiratoryadmissions
Max 1.003 0.023 1.000–1.005 1.010 0.705 0.959–1.063Min 1.003 0.049 1.000–1.007 0.999 0.922 0.977–1.022
130 S. Williams et al. / Science of the Total Environment 414 (2012) 126–133
of 13.8% per 1 °C for extreme maximum temperatures. For all-causeand mental health related ED presentations there was a significantdecrease in effect at extreme temperatures. Overall the results werecomparable for the ≥65-years age group (not shown).
Tables 3 and 4 summarise the results when adjusted for O3 andPM10 levels. For the outcomes in Table 3 the elevated temperaturevariable was used and, because of the small effect sizes, results areshown for a 10 °C increase in temperature. For the all-age population,a 10 °C increase in temperature over threshold was associated withan increase of 4.9% in daily ambulance call-outs (IRR 1.049, 95% CI1.027–1.072) in relation to maximum temperature, and a 9.3% in-crease (IRR 1.093, 95% CI 1.043–1.145) in relation to minimum tem-perature, when adjusted for ozone and PM10 (Table 3). Similareffects were apparent for ambulance call-outs for the population≥65-years. Daily ED presentations showed significant increases in re-lation to maximum and minimum temperatures in the population≥65-years (Table 3). For mental health outcomes, ED presentationsincreased in relation to minimum temperature for the all-age and≥65-years groups, and hospital admissions (all-age) increased in re-lation to maximum temperature (Table 3). The associations betweendaily temperatures and mortality or renal hospital admissions werenot significant when adjusted for air pollutants.
For the outcomes shown in Table 4 both the elevated and extremetemperature variables were used, and results are shown for a 1 °C in-crease in temperature. When adjusted for O3 and PM10 there weresubstantial increases in daily heat-related ED presentations per 1 °Cincrease in maximum temperature over threshold (32 °C), with a fur-ther increase in the extreme temperature range. All cause EDs in-creased with elevated minimum temperatures, but this effectdecreased in the extreme temperature range (Table 4).
The effect of increasing heat duration on mortality and ambulancecall-outs is shown in Table 5. Daily mortality increased by 1.0% (IRR1.010; 95% CI 1.004–1.016) or 7.0% (IRR 1.070; 95% CI 1.031–1.111),with each successive day over the 95th and 99th percentiles for max-imum temperature, respectively. Daily ambulance call-outs increasedby 1.1% (IRR 1.011; 95% CI 1.009–1.013) up to 4.6% (IRR 1.046; 95% CI1.021–1.071) with each successive day over the 95th and 99th per-centiles for daily maximum temperature, respectively.
4. Discussion
For the population of Adelaide, South Australia, heatwaves havebeen associated with increased ambulance call-outs and hospital ad-missions, particularly for mental and renal illness (Hansen et al.,2008a,b; Nitschke et al., 2007). However, the heat thresholds andtemperature-relationships had not been explored for different healthoutcomes, and possible confounding by air pollution had not beenexamined.
Table 1Estimated heat thresholds for health outcomes in Adelaide. Maximum and minimumtemperature thresholds were estimated for the all-age and ≥65-years (65+)populations.
Outcome Agegroup
Estimated heat threshold (°C)
Maximum Minimum
Mortality All age 30 1665+ 30 16
Ambulance call-outs All age 26 1865+ 26 18
EDs All age 26 1665+ 28 18
EDs heat-related All age 34 2265+ 32 22
EDs mental health All age 32 16EDs renal health All age 34 18
65+ 34 18
We have estimated maximum temperature thresholds of approxi-mately 26 °C for ambulance call-outs and ED presentations, and 30 °Cformortality, which aremild temperatures forwarm seasons in Adelaide.There were positive associations between elevated temperatures (overthresholds) and mortality, ambulance call-outs, ED presentations andhospital admissions. Graphical representations of the data suggested afurther rise inmortality andmorbidity at extreme temperatures. Howev-er for most outcomes there was no significant change in slope associatedwith extreme temperatures, possibly reflecting the limited data atextremes.
Our estimates for heat thresholds were comparable for the all-ageand the ≥65-years age groups, even though it is widely reported thatthe elderly are more vulnerable to heat (Basu and Samet, 2002). It ispossible that this result arises because the majority of events, partic-ularly for mortality, occur in the population ≥65-years. Alternativelyour approach may have lacked the sensitivity to detect small differ-ences in thresholds. It is also possible that heat thresholds are similar,with the older population being more sensitive to heat beyond thesethresholds. However, with the exception of some specific ED presen-tations, our results are not entirely consistent with this possibility.
The mortality heat threshold of 30 °C agrees with that estimatedby Bambrick et al. (2008) using a modelling approach and maximis-ing log-likelihood over a 1 °C grid. Guest et al. (1999) used anobserved-expected mortality analysis and reported no obvious heatthreshold for Adelaide, however this was using an earlier period ofdata (1979–1990). The 30 °C threshold is higher than estimates forother Australian cities, Brisbane (Tong et al., 2010b) and Sydney(Vaneckova et al., 2008a), which is not unexpected because theAdelaide population is acclimatised to a hotter climate.
We did not find evidence of heat thresholds for all the health out-comes examined in this study. In some cases this was due to the lim-ited numbers of daily excess events, while other outcomes did notshow a positive relationship with temperature. The thresholds esti-mated reflect the lower levels of heat sensitivity of the population,and triggers for public health interventions would be expected to be
Table 3Effect estimates (IRRs) for daily mortality, ambulance call-outs, ED presentations and hospital admissions in relation to daily temperatures, adjusted for ozone and PM10. The IRRswere estimated in relation to 10 °C increases in daily maximum and minimum temperatures over thresholds (thresh °C), with and without adjustment for ozone and PM10. Resultsfor the all-age and ≥65-years (65+) age groups are shown, for the period Jan 2002 to March 2009; or Oct 2003 to March 2009 for ED presentations.
Health outcome Agegroup
Temp(thresh °C)
Unadjusted Adjusted O3, PM10
IRR p 95% CI IRR p 95% CI
Mortality All age Max (30) 1.045 0.069 0.996–1.097 1.028 0.567 0.934–1.13265+ Max (30) 1.037 0.034 1.003–1.071 1.027 0.548 0.941–1.123All age Min (16) 1.054 0.020 1.008–1.102 1.042 0.259 0.970–1.11965+ Min (16) 1.044 0.004 1.014–1.074 1.037 0.200 0.981–1.095
Ambulance call-outs All age Max (26) 1.060 0.000 1.046–1.074 1.049 0.000 1.027–1.07265+ Max (26) 1.061 0.000 1.044–1.079 1.065 0.000 1.041–1.090All age Min (18) 1.117 0.000 1.077–1.158 1.093 0.000 1.043–1.14565+ Min (18) 1.116 0.001 1.048–1.187 1.103 0.014 1.020–1.193
EDs 65+ Max (26) 1.039 0.000 1.028–1.051 1.036 0.004 1.011–1.06265+ Min (18) 1.071 0.000 1.038–1.106 1.058 0.016 1.011–1.108
EDs heat-related All age Min (22) 6.486 0.000 3.033–13.87 6.511 0.000 2.785–15.2265+ Min (22) 11.26 0.000 4.489–28.24 9.101 0.000 3.201–25.88
EDs renal All age Max (34) 1.105 0.314 0.910–1.342 1.076 0.482 0.877–1.32165+ Max (34) 1.298 0.069 0.979–1.719 1.222 0.145 0.933–1.600All age Min (18) 1.127 0.093 0.980–1.300 1.120 0.088 0.983–1.27765+ Min (18) 1.235 0.060 0.991–1.540 1.190 0.087 0.975–1.453
EDs mental health 65+ Max (32) 1.293 0.007 1.074–1.556 1.154 0.108 0.970–1.373All age Min (16) 1.122 0.002 1.043–1.207 1.079 0.002 1.027–1.13365+ Min (16) 1.242 0.001 1.090–1.416 1.143 0.026 1.016–1.285
All cause admissions All age Max (26) 1.015 0.095 0.997–1.034 0.988 0.370 0.962–1.015All age Min (16) 1.030 0.244 0.980–1.082 1.009 0.782 0.949–1.073
Renal admissions All age Max (26) 1.066 0.000 1.032–1.101 1.024 0.312 0.978–1.071All age Min (16) 1.108 0.019 1.017–1.208 1.064 0.172 0.973–1.163
Mental health admissions All age Max (26) 1.027 0.001 1.011–1.044 1.034 0.007 1.009–1.059All age Min (16) 1.038 0.001 1.015–1.061 1.024 0.238 0.984–1.065
Cardiovascular admissions All age Max (26) 0.990 0.292 0.972–1.008 0.974 0.097 0.945–1.005All age Min (16) 1.032 0.154 0.988–1.078 1.035 0.240 0.977–1.096
Respiratory admissions All age Max (26) 1.025 0.160 0.990–1.061 0.996 0.880 0.944–1.051All age Min (16) 1.026 0.267 0.980–1.075 1.004 0.858 0.957–1.054
131S. Williams et al. / Science of the Total Environment 414 (2012) 126–133
set at higher temperatures. The current extreme heat warning forAdelaide is triggered by forecast average daily temperatures of≥32 °C for three or more consecutive days (South Australian StateEmergency Service, 2009). In a separate study we have found thatevents reaching this level are associated with significant increases inmortality and morbidity (Williams et al., 2011).
In relation to disease specific outcomes, both renal and mentalhealth outcomes were associated with elevated temperatures, consis-tent with results for heatwave days in Adelaide (Hansen et al., 2008a,b; Nitschke et al., 2007, 2011). The increase in mental health relatedoutcomes reflects the heightened vulnerability to heat among thosewith mental disorders; which is attributed to behavioural and socialfactors, or the use of medications which interfere with the thermoregu-latory process (Hansen et al., 2008a; Nordon et al., 2009). The risks torenal health are attributed to dehydration and electrolyte andwater im-balance causing stress on the kidneys (Hansen et al., 2008b). Renalhospital admissions, but not ED presentations, were significantly
Table 4Effect estimates (IRRs) for daily ED presentations in relation to temperature, adjusted for ozimum temperatures using linear terms for (i) elevated (elev) temperatures (over thresholdOct 2003 to Mar 2009, are shown for comparison. Results are for the all-age or ≥65-years
Health outcome Agegroup
Temp(threshold °C)
Tempvar
Unadjus
IRR
EDs All age Max (30) elev 1.001ext 0.985
All age Min (16) elev 1.004ext 0.991
EDs heat-related All age Max (32) elev 1.171ext 1.138
65+ Max (32) elev 1.164ext 1.183
EDs mental health All age Max (32) elev 1.011ext 0.987
associated with daily temperatures in this study. This difference couldbe explained if codingwithin emergency departments does not identifyall renal-related presentations, leading to possible under-reporting forthis outcome. In relation to other disease specific outcomes, our resultsindicate a weak association between temperature and respiratory hos-pital admissions, but no effects on cardiovascular admissions wereapparent.
When ozone and PM10were included inmodels the associations be-tween daily temperatures and mortality and renal hospital admissionswere no longer significant, suggesting confounding of these relation-ships. Alternatively, this may be a consequence of the reduced predic-tive power of the adjusted models, compounded by the shorter periodof air quality data available for analysis. Ozone levels increase on ex-tremely hot days due to the effect of sunlight on photochemical smogformation; and studies have consistently reported that high ozonelevels contributed to mortality during heatwaves in Europe (Dear etal., 2005; Filleul et al., 2006; Fischer et al., 2004; Stedman, 2003),
one and PM10. The IRRs were estimated per 1 °C increase in daily maximum and min-s) and (ii) extreme (ext) temperatures. Unadjusted analyses for the equivalent period,(65+) age groups.
ted Adjusted O3, PM10
p 95% CI IRR p 95% CI
0.011 1.000–1.002 1.001 0.490 0.999–1.0020.036 0.970–0.999 0.986 0.068 0.972–1.0010.000 1.003–1.005 1.004 0.000 1.002–1.0050.007 0.984–0.997 0.991 0.010 0.984–0.9980.000 1.122–1.222 1.150 0.000 1.084–1.2200.003 1.046–1.238 1.177 0.003 1.056–1.3130.000 1.105–1.227 1.139 0.001 1.055–1.2290.001 1.068–1.310 1.231 0.002 1.080–1.4040.000 1.006–1.016 1.001 0.792 0.993–1.0100.027 0.976–0.999 1.006 0.680 0.978–1.034
Table 5Effect estimates (IRRs) for daily mortality and ambulance call-outs in relation to heatduration. The IRRs are for increasing number of days over maximum temperaturecut-offs (>90th, >95th and >99th percentiles for warm seasons; equivalent to≥35 °C; ≥37 °C and ≥41 °C, respectively), with adjustment for O3 and PM10. Thetotal number of days in each hot day category was; >90th (181 days), >95th(111 days), >99th (25 days) out of 1359 days analysed in the period 1 January 2002to 31 March 2009. Results are for the all-age population.
Outcome Hot day category IRR p-value 95% CI
Mortality >90th 1.009 0.185 0.996–1.023>95th 1.010 0.001 1.004–1.016>99th 1.070 0.000 1.031–1.111
Ambulance call-outs >90th 1.014 0.002 1.005–1.023>95th 1.011 0.000 1.009–1.013>99th 1.046 0.000 1.021–1.071
132 S. Williams et al. / Science of the Total Environment 414 (2012) 126–133
and in Australia (Tong et al., 2010a; Vaneckova et al., 2008a). Studies inAustralian cities have also identified associations between ozone andrespiratory mortality and hospital admissions (Simpson et al., 2005a,b), and urgent emergency department visits for cardiovascular andchest pain syndromes (Turner et al., 2007). In relation to PM10 levels,the effect of temperature is less clear, although bushfires during sum-mer can lead to sustained high levels of PM10 (Spickett et al., 2011). As-sociations between PM10 and total mortality (Simpson et al., 2005b),childhood respiratory emergencies (Barnett et al., 2005) and cardiovas-cular emergencies in the elderly (Jalaludin et al., 2006) have been iden-tified in Australian cities. Although PM has not been associated withrenal outcomes, it is biologically plausible that the inflammation andoxidative stress linked to PM exposure could underlie a range of com-mon diseases (Brook, 2008).
In terms of heat duration, there was an association between thenumber of days of extreme heat and increased mortality and ambu-lance call-outs, most notably when considering days over the 99thpercentile of warm season maximum temperatures. This is consistentwith previously reported results for morbidity outcomes during heat-waves in Adelaide (Nitschke et al., 2011). The effect of heat durationon mortality could also be related to increased heat intensity, becauseof the strong correlation with duration.
This study extends our understanding of the relationships be-tween temperature and health outcomes in Adelaide. There are anumber of limitations, including the possible misclassification of ex-posures inherent in ecological studies. The estimation of excessdaily mortality and morbidity, using a 31-day moving average base-line, was not applicable to hospital admissions, as has been discussed.Furthermore, it is possible that heatwaves of extended duration mayinflate this baseline, leading to an underestimation of excess eventsfor days within or near to heatwaves. Although the availability of airquality data was limited, our analysis across 8 warm seasons indicatesthat ozone and PM10 may contribute to mortality and morbidity dur-ing hot weather in Adelaide. Along with more extreme hot weather,an increase in air pollution in urban areas is a likely consequence ofglobal warming (Harlan and Ruddell, 2011; Spickett et al., 2011). Fur-ther investigation of the complex associations between temperature,air quality and health will be important in reducing the impacts ofthese environmental risk factors.
5. Conclusions
The estimation of heat thresholds and temperature relationshipsfor mortality and morbidity outcomes in Adelaide has identified a sig-nificant health burden at elevated temperatures for this population.Daily rates of ambulance call-outs and ED presentations, particularlyfor mental health and heat-related illness, show the strongest associ-ations with daily temperatures when adjusted for ozone and PM10.The results have important implications for ongoing public healthplanning for extreme heat in Adelaide.
Acknowledgements
We acknowledge the Department of Health, South Australia, andSouth Australian Ambulance Service for providing health outcomedata; the Bureau of Meteorology, South Australia, for temperaturedata; and the Environment Protection Authority, South Australia, forproviding air quality data for this project. This work was supportedby the Australian Research Council [grant number DP0880933 to P.B.]
References
Baccini M, Biggeri A, Accetta G, Kosatsky T, Katsouyanni K, Analitis A, et al. Heat effectson mortality in 15 European cities. Epidemiology 2008;19:711–9.
Bambrick H, Dear K,Woodruff R, Hanigan I,McMichael A. The impacts of climate change onthree health outcomes: temperature-relatedmortality and hospitalisations, salmonel-losis and other bacterial gastroenteritis, and population at risk from dengue.Commissioned Report for the Garnaut Climate Change Review; 2008. Available at:http://www.garnautreview.org.au/CA25734E0016A131/pages/all-reports–resources-commissioned-reports.html. [accessed 12 August 2011].
Barnett AG, Williams GM, Schwartz J, Neller AH, Best TL, Petroeschevsky AL, et al. Airpollution and child respiratory health: a case-crossover study in Australia andNew Zealand. Am J Respir Crit Care Med 2005;171:1272–8.
Basu R, Samet JM. Relation between elevated ambient temperature and mortality: a re-view of the epidemiologic evidence. Epidemiol Rev 2002;24:190–202.
Bi P, Williams S, Loughnan M, Lloyd G, Hansen A, Kjellstrom T, et al. The effects of ex-treme heat on human mortality and morbidity in Australia: implications for publichealth. Asia Pac J Public Health 2011;23:27S–36S.
Brook RD. Potential health risks of air pollution beyond triggering acute cardiopulmo-nary events. JAMA 2008;299:2194–6.
CSIRO, Bureau of Meteorology, Australian Government. Climate change in Australia.Technical report; 2007. Available at: http://www.climatechangeinaustralia.gov.au/technical_report.php. [accessed 7 November, 2008].
Dear K, Ranmuthugala G, Kjellstrom T, Skinner C, Hanigan I. Effects of temperature andozone on daily mortality during the August 2003 heat wave in France. Arch Envi-ron Occup Health 2005;60:205–12.
Dessai S. Heat stress and mortality in Lisbon part 1: model construction and validation.Int J Biometeorol 2002;47:6-12.
Diggle PJ, Liang KY, Zeger SL. Analysis of longitudinal data. Oxford: Clarendon Press;1994.
Filleul L, Cassadou S, Médina S, Fabres P, Lefranc A, Eilstein D, et al. The relation be-tween temperature, ozone, and mortality in nine French cities during the heatwave of 2003. Environ Health Perspect 2006;114:1344–7.
Fischer PH, Brunekreef B, Lebreta E. Air pollution related deaths during the 2003 heatwave in the Netherlands. Atmos Environ 2004;38:1083–5.
Fouillet A, Rey G, Jougla E, Frayssinet P, Bessemoulin P, Hemon D. A predictive modelrelating daily fluctuations in summer temperatures and mortality rates. BMCPublic Health 2007;7:114.
Gosling SN, McGregor GR, Páldy A. Climate change and heat-related mortality in six citiespart 1: model construction and validation. Int J Biometeorol 2007;51:525–40.
Guest CS, Willson K, Woodward AJ, Hennessy K, Kalkstein LS, Skinner C, et al. Climateand mortality in Australia: retrospective study, 1979–1990, and predicted impactsin five major cities in 2030. Clin Res 1999;13:1-15.
Hansen A, Bi P, Nitschke M, Ryan P, Pisaniello D, Tucker G. The effect of heat waves onmental health in a temperate Australian city. Environ Health Perspect 2008a;116:1369–75.
Hansen AL, Bi P, Ryan P, Nitschke M, Pisaniello D, Tucker G. The effect of heat waves onhospital admissions for renal disease in a temperate city of Australia. Int J Epide-miol 2008b;37:1359–65.
Harlan S, Ruddell D. Climate change and health in cities: impacts of heat and air pollu-tion and potential co-benefits from mitigation and adaptation. Curr Opin EnvironSustain 2011;3:1–9.
HuW, Mengersen K, McMichael A, Tong S. Temperature, air pollution and total mortal-ity during summers in Sydney, 1994–2004. Int J Biometeorol 2008;52:689–96.
Jalaludin B, Morgan G, Lincoln D, Sheppeard V, Simpson R, Corbett S. Associations be-tween ambient air pollution and daily emergency department attendances for car-diovascular disease in the elderly (65+ years), Sydney, Australia. J Expo SciEnviron Epidemiol 2006;16:225–37.
Junninen H, Niskaa H, Tuppurainenc K, Ruuskanena J, Kolehmainen M. Methods for im-putation of missing values in air quality data sets. Atmos Environ 2004;38:2895–907.
Khalaj B, Lloyd G, Sheppeard V, Dear K. The health impacts of heat waves in five regionsof New South Wales, Australia: a case-only analysis. Int Arch Occup Environ Health2010;83:833–42.
Loughnan ME, Nicholls N, Tapper NJ. When the heat is on: threshold temperatures forAMI admissions to hospital in Melbourne Australia. Appl Geogr 2010;30:63–9.
Nicholls N, Skinner C, Loughnan M, Tapper N. A simple heat alert system for Mel-bourne, Australia. Int J Biometeorol 2008;52:375–84.
Nitschke M, Tucker G, Bi P. Morbidity and mortality during heatwaves in metropolitanAdelaide. Med J Aust 2007;187:662–5.
Nitschke M, Tucker GR, Hansen AL, Williams S, Zhang Y, Bi P. Impact of two recent ex-treme heat episodes on morbidity and mortality in Adelaide, South Australia: acase-series analysis. Environ Health 2011;10:42.

133S. Williams et al. / Science of the Total Environment 414 (2012) 126–133
Nordon C, Martin-Latry K, de Roquefeuil L, Latry P, Begaud B, Falissard B, et al. Risk ofdeath related to psychotropic drug use in older people during the European 2003heatwave: a population-based case–control study. Am J Geriatr Psychiatry2009;17:1059–67.
Ren C, Williams GM, Tong S. Does particulate matter modify the association betweentemperature and cardiorespiratory diseases? Environ Health Perspect 2006;114:1690–6.
Simpson R, Williams G, Petroeschevsky A, Best T, Morgan G, Denison L, et al. The short-term effects of air pollution on hospital admissions in four Australian cities. Aust NZ J Public Health 2005a;29:213–21.
Simpson R, Williams G, Petroeschevsky A, Best T, Morgan G, Denison L, et al. The short-term effects of air pollution on daily mortality in four Australian cities. Aust N Z JPublic Health 2005b;29:205–12.
South Australian State Emergency Service. Extreme heat arrangements. Available at: http://www.ses.sa.gov.au/site/community_safety/heatwave_information/extreme_heat_plan.jsp 2009. [accessed 15 August 2011].
Spickett JT, Brown HL, Rumchev K. Climate change and air quality: the potential impacton health. Asia Pac J Public Health 2011;23:37S–45S.
Stedman JR. The predicted number of air pollution related deaths in the UK during theAugust 2003 heatwave. Atmos Environ 2003;38:1087–90.
Tong S, Ren C, Becker N. Excess deaths during the 2004 heatwave in Brisbane, Australia.Int J Biometeorol 2010a;54:393–400.
Tong S, Wang XY, Barnett AG. Assessment of heat-related health impacts in Brisbane,Australia: comparison of different heatwave definitions. PLoS One 2010b;5:e12155.
Turner RM, Muscatello DJ, Zheng W, Willmore A, Arendts G. An outbreak of cardiovas-cular syndromes requiring urgent medical treatment and its association with envi-ronmental factors: an ecological study. Environ Health 2007;6:37.
Vaneckova P, Beggs PJ, de Dear RJ, McCracken KW. Effect of temperature on mortalityduring the six warmer months in Sydney, Australia, between 1993 and 2004. Envi-ron Res 2008a;108:361–9.
Vaneckova P, Hart MA, Beggs PJ, de Dear RJ. Synoptic analysis of heat-related mortalityin Sydney, Australia, 1993–2001. Int J Biometeorol 2008b;52:439–51.
Victorian Government Department of Health. Heatwave plan for Victoria 2009–2010protecting health and reducing harm from heatwaves. Available at:www.health.vic.gov.au/environment/heatwave 2009. [accessed 5 Feb 2010].
Williams S, Nitschke M, Tucker G, Bi P. Extreme heat arrangements in South Australia:an assessment of trigger temperatures. Health Promot J Austr 2011;22:S22–8.