healthy people 2010 focus area 10: food safety progress review december 20, 2007 edward j. sondik...
TRANSCRIPT
Healthy People 2010 Focus Area 10:
Food Safety
Progress ReviewDecember 20, 2007
Edward J. Sondik National Center for Health
Statistics

Estimated Annual Burden ofFoodborne Disease
• 76 million illnesses
• 325,000 hospitalizations
• 5,000 deaths
• $23 billion in costs
Source: Mead PS, Slutsker L, Dietz V, McCaig LF, Bresee JS, Shapiro C, Griffin PM, Tauxe RV. Food-RelatedIllness and Death in the United States. Emerging Infectious Diseases 5(5):607-625. 1999.
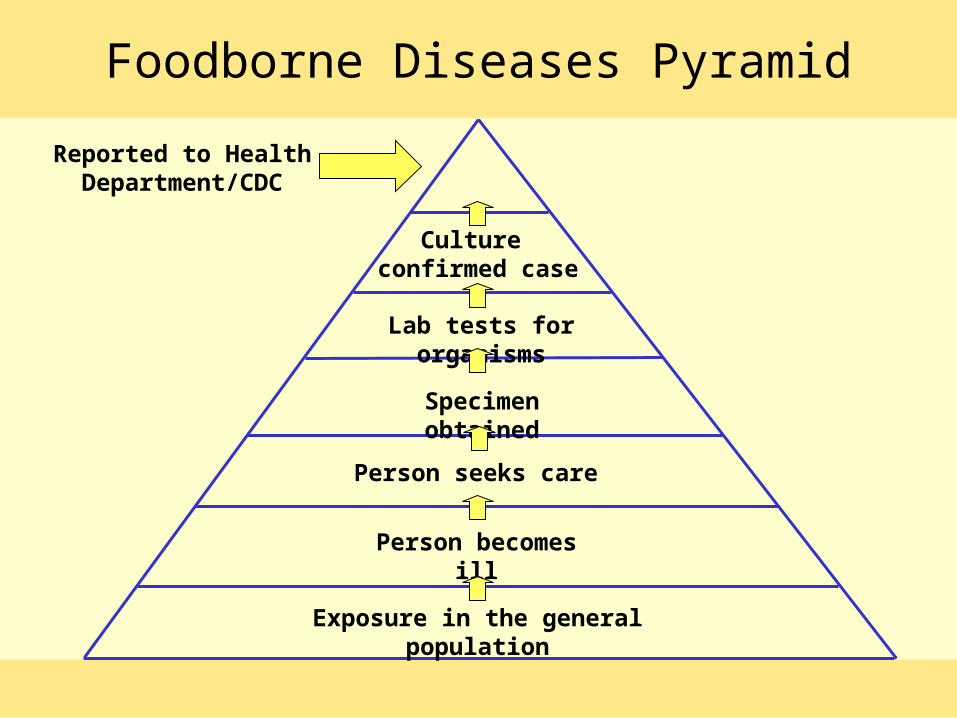
Foodborne Diseases Pyramid
Exposure in the general population
Person becomes ill
Person seeks care
Specimen obtained
Culture confirmed case
Reported to Health Department/CDC
Lab tests for organisms

Food Safety Focus Area ObjectivesA Framework for Reducing Foodborne Illness
Through Prevention, Intervention and Response
Production
PreparationTransportation
Retail
Consumer
Processing
Regulations, Enforcement, and Guidance
Consumption
Distributionand
Storage
Illness
?
Obj 10-5
Objs 10-6, 7
Objs 10-1, 2,3, and 4
EducationTrainingSurveillanceResearch
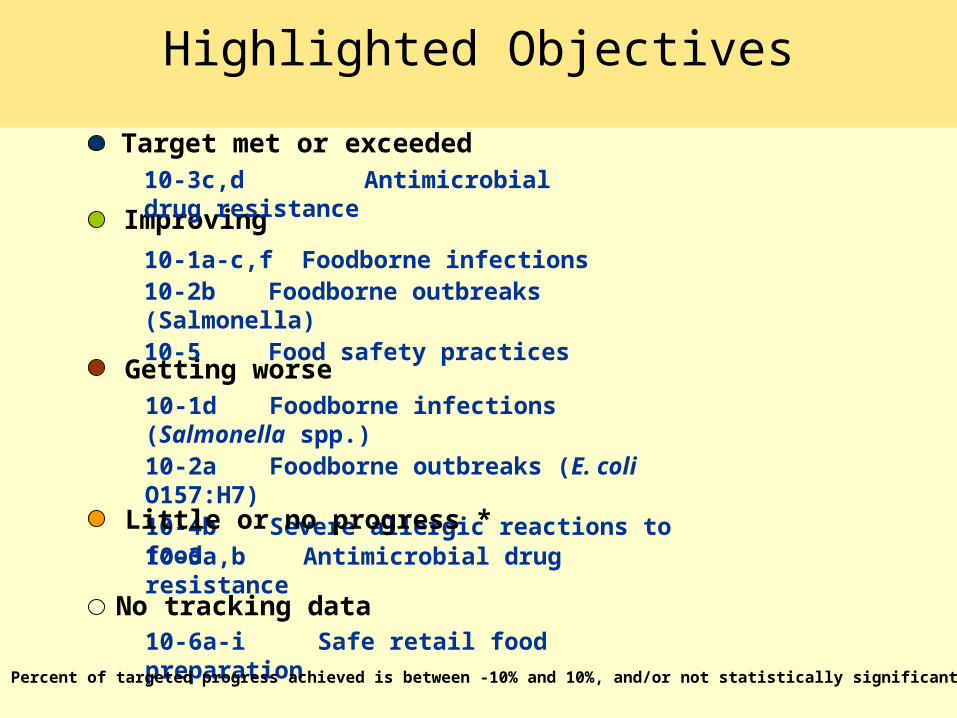
Highlighted Objectives
Getting worse10-1d Foodborne infections (Salmonella spp.)10-2a Foodborne outbreaks (E. coli O157:H7)10-4b Severe allergic reactions to food
10-1a-c,f Foodborne infections 10-2b Foodborne outbreaks (Salmonella)10-5 Food safety practices
Improving
Target met or exceeded10-3c,d Antimicrobial drug resistance
Little or no progress *10-3a,b Antimicrobial drug resistance
No tracking data10-6a-i Safe retail food preparation
* Percent of targeted progress achieved is between -10% and 10%, and/or not statistically significant.
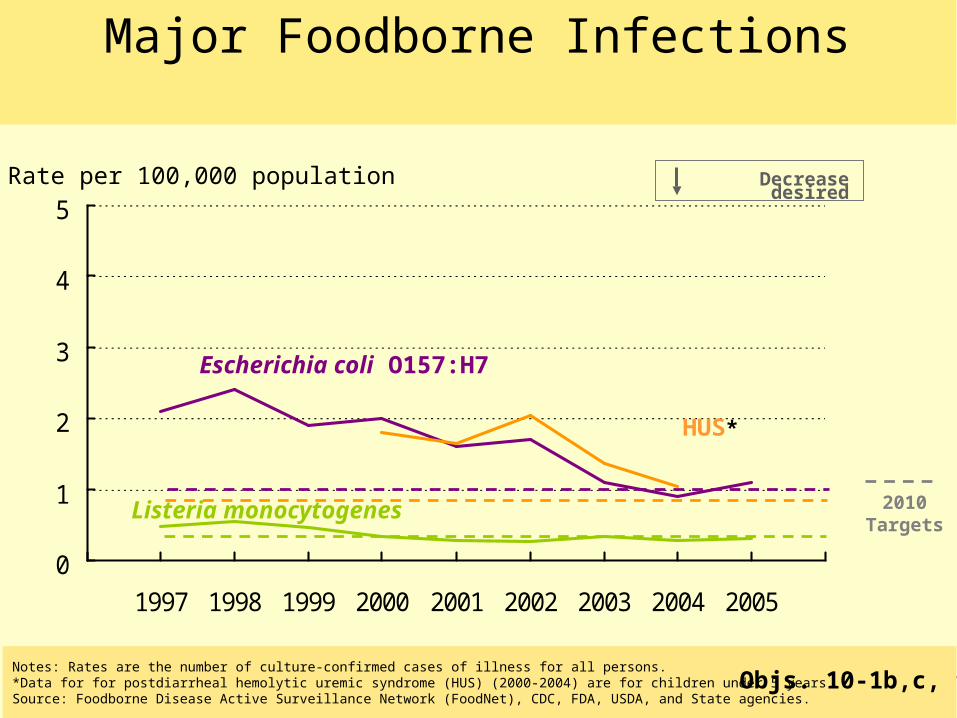
Notes: Rates are the number of culture-confirmed cases of illness for all persons.*Data for for postdiarrheal hemolytic uremic syndrome (HUS) (2000-2004) are for children under 5 years.Source: Foodborne Disease Active Surveillance Network (FoodNet), CDC, FDA, USDA, and State agencies.
0
1
2
3
4
5
1997 1998 1999 2000 2001 2002 2003 2004 2005
Rate per 100,000 population
Escherichia coli O157:H7
Listeria monocytogenes 2010Targets
HUS*
Objs. 10-1b,c, f
Major Foodborne Infections
Decrease desired

Notes: Rates are the number of culture-confirmed cases of illness for all persons.Source: Foodborne Disease Active Surveillance Network (FoodNet), CDC, FDA, USDA, and State agencies.
0
5
10
15
20
25
1997 1998 1999 2000 2001 2002 2003 2004 2005
Rate per 100,000 population
Campylobacter species
Salmonella species
Objs. 10-1a,d
Major Foodborne Infections
Decrease desired
2010Targets
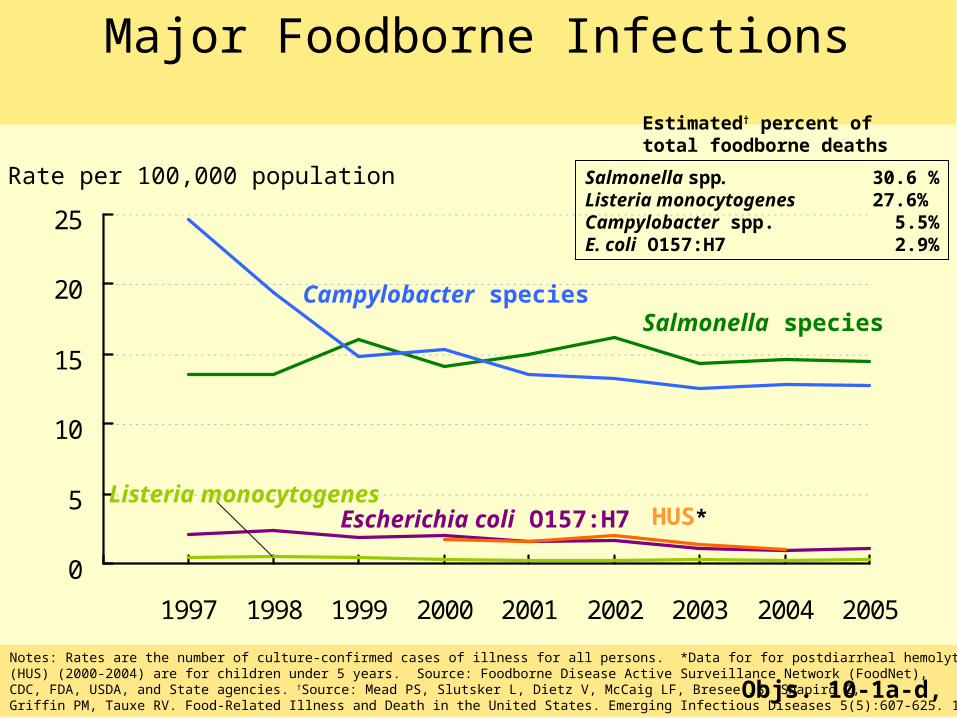
Notes: Rates are the number of culture-confirmed cases of illness for all persons. *Data for for postdiarrheal hemolytic uremic syndrome (HUS) (2000-2004) are for children under 5 years. Source: Foodborne Disease Active Surveillance Network (FoodNet), CDC, FDA, USDA, and State agencies. †Source: Mead PS, Slutsker L, Dietz V, McCaig LF, Bresee JS, Shapiro C, Griffin PM, Tauxe RV. Food-Related Illness and Death in the United States. Emerging Infectious Diseases 5(5):607-625. 1999.
0
5
10
15
20
25
1997 1998 1999 2000 2001 2002 2003 2004 2005
Rate per 100,000 population
Campylobacter speciesSalmonella species
Objs. 10-1a-d, f
Major Foodborne Infections
Escherichia coli O157:H7Listeria monocytogenes
HUS*
Estimated† percent oftotal foodborne deaths
Salmonella spp. 30.6 %Listeria monocytogenes 27.6%Campylobacter spp. 5.5%E. coli O157:H7 2.9%
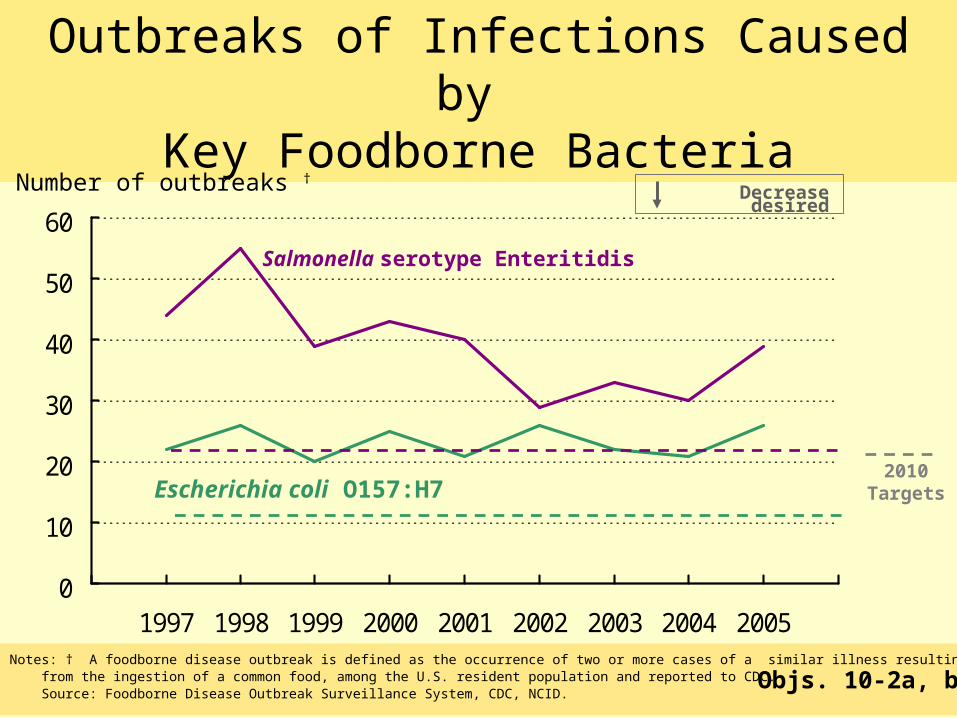
Notes: † A foodborne disease outbreak is defined as the occurrence of two or more cases of a similar illness resulting from the ingestion of a common food, among the U.S. resident population and reported to CDC. Source: Foodborne Disease Outbreak Surveillance System, CDC, NCID.
Outbreaks of Infections Caused by Key Foodborne Bacteria
0
10
20
30
40
50
60
1997 1998 1999 2000 2001 2002 2003 2004 2005
Salmonella serotype Enteritidis
Number of outbreaks †
Objs. 10-2a, b
Decrease desired
Escherichia coli O157:H72010
Targets
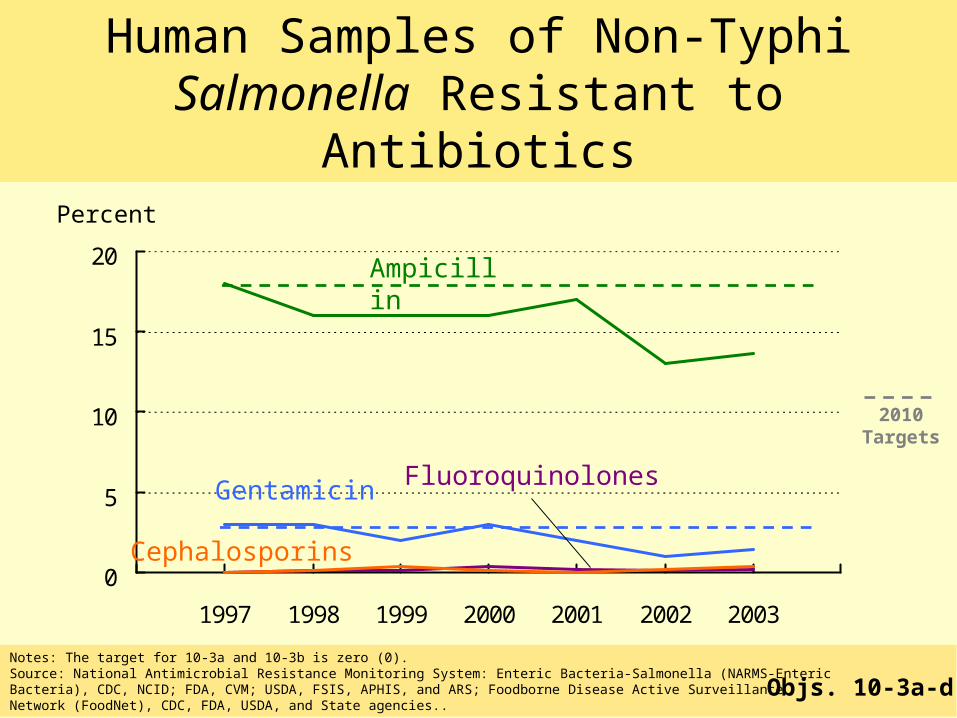
Human Samples of Non-Typhi Salmonella Resistant to Antibiotics
Notes: The target for 10-3a and 10-3b is zero (0). Source: National Antimicrobial Resistance Monitoring System: Enteric Bacteria-Salmonella (NARMS-EntericBacteria), CDC, NCID; FDA, CVM; USDA, FSIS, APHIS, and ARS; Foodborne Disease Active SurveillanceNetwork (FoodNet), CDC, FDA, USDA, and State agencies..
0
5
10
15
20
1997 1998 1999 2000 2001 2002 2003
Objs. 10-3a-d
Percent
Ampicillin
Gentamicin
Cephalosporins
Fluoroquinolones
2010Targets
0
10
20
30
40
50
60
70
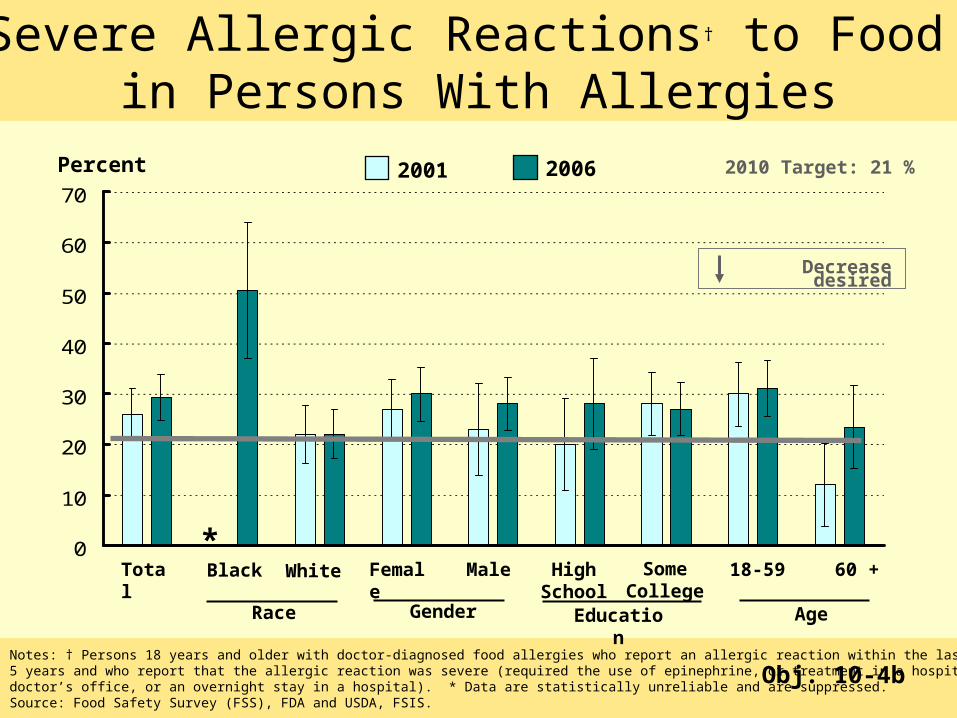
Severe Allergic Reactions† to Food in Persons With Allergies
Notes: † Persons 18 years and older with doctor-diagnosed food allergies who report an allergic reaction within the last 5 years and who report that the allergic reaction was severe (required the use of epinephrine, or treatment in a hospital or doctor’s office, or an overnight stay in a hospital). * Data are statistically unreliable and are suppressed.Source: Food Safety Survey (FSS), FDA and USDA, FSIS.
Percent
Decrease desired
2010 Target: 21 %
Obj. 10-4b
2001 2006
EducationGender
*Black High
SchoolTotal White Female Male Some
College60 +18-59
AgeRace
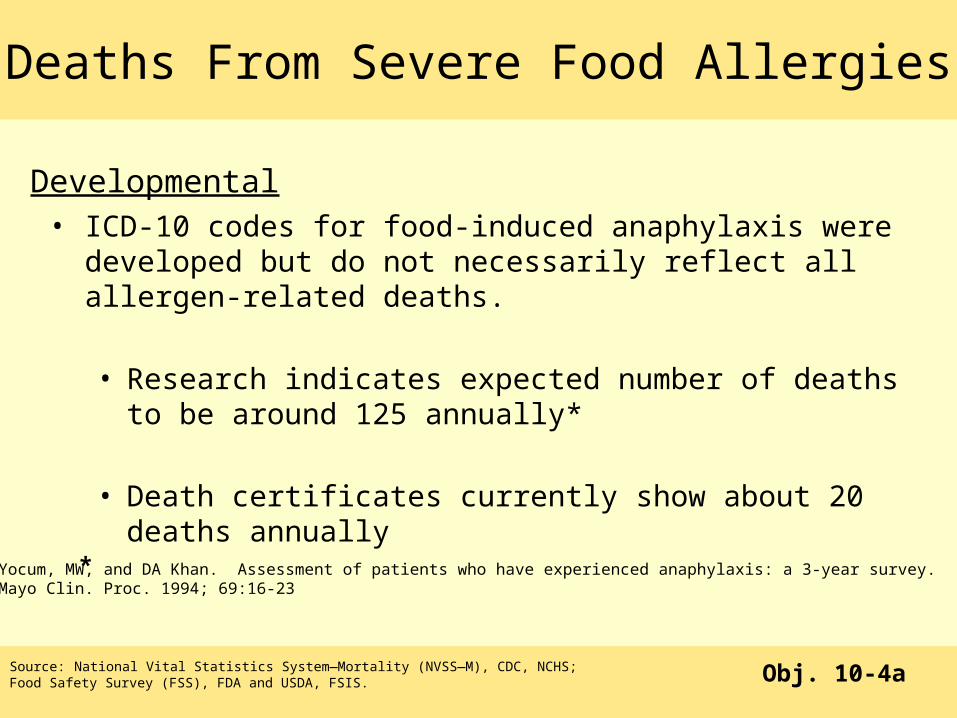
Deaths From Severe Food Allergies
Source: National Vital Statistics System—Mortality (NVSS—M), CDC, NCHS;Food Safety Survey (FSS), FDA and USDA, FSIS. Obj. 10-4a
• ICD-10 codes for food-induced anaphylaxis were developed but do not necessarily reflect all allergen-related deaths.
• Research indicates expected number of deaths to be around 125 annually*
• Death certificates currently show about 20 deaths annually
Developmental
Yocum, MW, and DA Khan. Assessment of patients who have experienced anaphylaxis: a 3-year survey.Mayo Clin. Proc. 1994; 69:16-23*
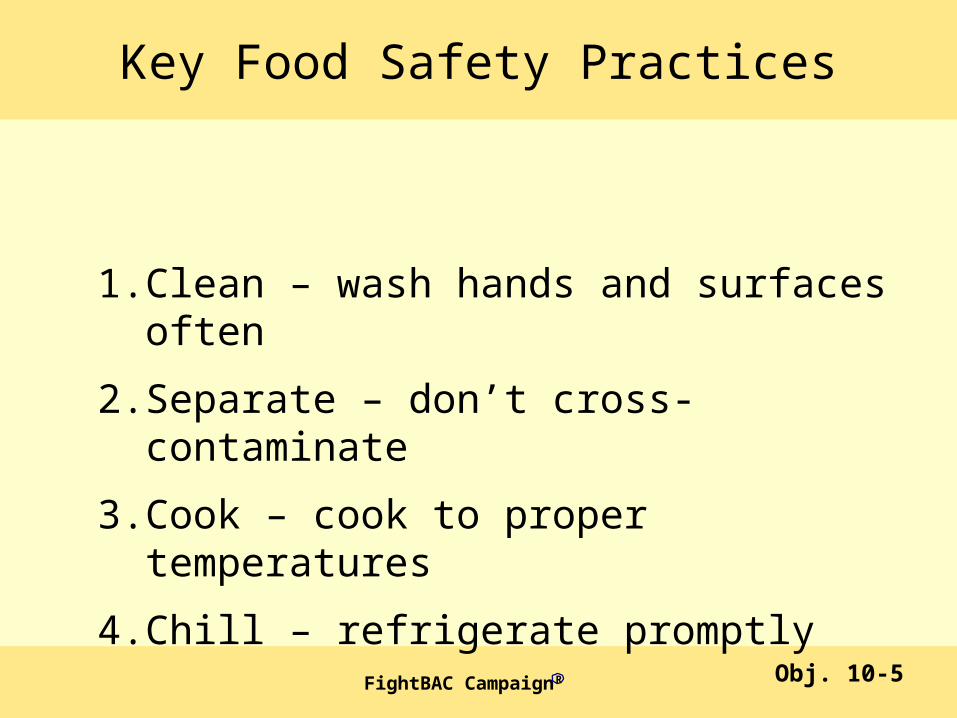
Key Food Safety Practices
Obj. 10-5
1. Clean – wash hands and surfaces often
2. Separate – don’t cross-contaminate
3. Cook – cook to proper temperatures
4. Chill – refrigerate promptly
FightBAC Campaign R

50
60
70
80
90
100
Consumer Food Safety Practices†
Notes: † The percents of consumers over 18 years of age who report they follow each of 4 key food safety practices,Clean, separate, cook, and chill, among the U.S. civilian non-institutionalized population.Source: Food Safety Survey (FSS), FDA and USDA, FSIS.
Obj. 10-5
2010 Target: 79 %
Increase desired1998 2006
Black HighSchool
Total White Female Male SomeCollege
Less thanHigh School
Percent
EducationGenderRace
0

Notes: Percent of employee behaviors and food preparation practices, directly related to foodborne illness risk, that areobserved to be in compliance during observational, non-regulatory inspections by FDA.Source: Retail Food Database of Foodborne Illness Risk Factors, FDA, CFSAN.
0 20 40 60 80 100
Seafood departments
Produce departments
Meat/Poultry departments
Deli departments
Full-service restaurants
Fast food restaurants
Elementary schools
Nursing homes
Hospitals
Percent
82
80
80
60
74
81
76
83
73
Objs. 10- 6a-i
Retail Food Establishment Compliance with FDA Guidelines, 1998
2010 Targets
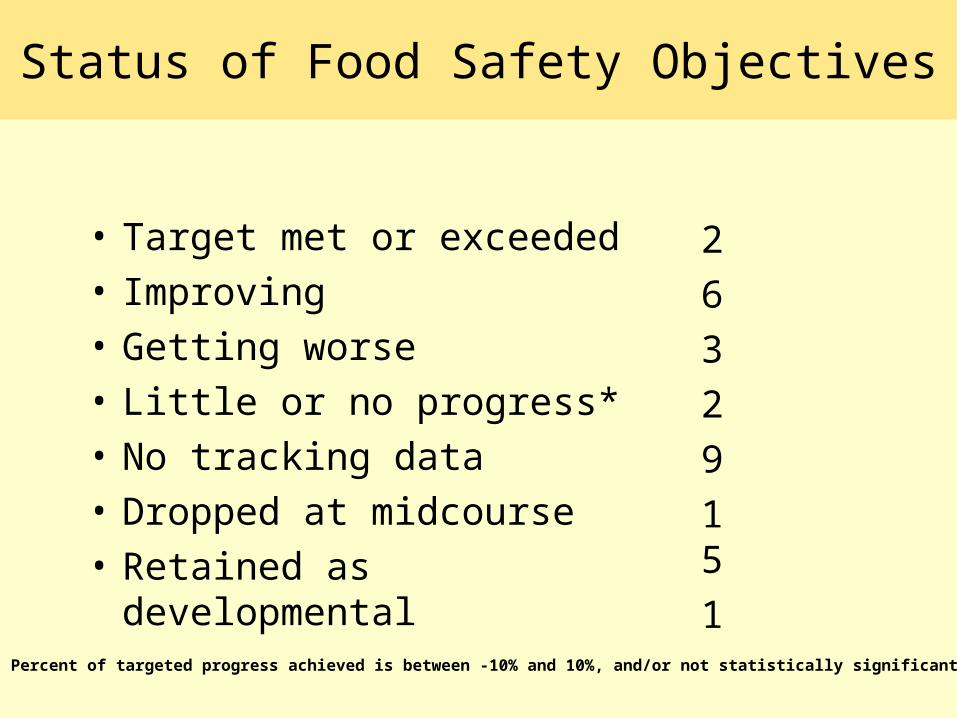
Status of Food Safety Objectives
• Target met or exceeded
• Improving
• Getting worse
• Little or no progress*
• No tracking data
• Dropped at midcourse
• Retained as developmental
2
6
3
2
9
15
1
* Percent of targeted progress achieved is between -10% and 10%, and/or not statistically significant.

Contributors:
Elisa Elliot, FDA Sara Fein, FDA
Delila Parham, USDA Katherine Vierk, FDA
Holly McPeak, ODPHP Glenda Lewis, FDA
Elizabeth Jackson, CDC Olga Henao, CDC
Jeffrey Pearcy, CDC Ellis Davis, ODPHP

Progress Review data and slides
can be accessed on the web at:
http://www.cdc.gov/nchs/hphome.htm