healthy indiana plan 2 - in.gov approach ... hip benefit plan data ..... 10 managed care entity...
TRANSCRIPT

Page 1 of 176
Healthy Indiana Plan 2.0
Final Evaluation Plan
12/28/2015

Page 2 of 176
Contents Demonstration Overview......................................................................................................................... 4
HIP 2.0 Eligibility and Program Features .................................................................................................. 4
Evaluation Approach ............................................................................................................................... 7
Evaluation Overview ................................................................................................................................ 7
Evaluation Strategy ................................................................................................................................. 7
Data Sources and Collection .................................................................................................................... 8
External Data Sources .............................................................................................................................. 9
Current Population Survey .......................................................................................................... 9 American Community Survey ...................................................................................................... 9 Consumer Assessment of Healthcare Providers and Systems (CAHPS) Surveys ............................ 9
Internal Data Sources ............................................................................................................................ 10
Indiana Medicaid Historical Data ............................................................................................... 10 HIP Benefit Plan Data ................................................................................................................ 10 Managed Care Entity (MCE) Health Plan Network and Geo-access Data .................................... 10 Member Eligibility, Application, and Enrollment Data................................................................ 11 Employer Eligibility, Application, and Enrollment Data .............................................................. 11 Surveys ............................................................................................................................ 11 Provider Enrollment Data .......................................................................................................... 15 Claims Data ............................................................................................................................ 15 Administrative Data .................................................................................................................. 16 Internal Financial Data .............................................................................................................. 17 Analyzing Data .......................................................................................................................... 17 Mechanisms to Ensure Quality Data and Reporting ................................................................... 18
Generalizability of Results ..................................................................................................................... 19
Evaluation Deliverables ......................................................................................................................... 20
Quarterly Reports – Overview and Timelines ......................................................................................... 20
Annual Reports – Overview and Timelines ............................................................................................. 21
Interim and Final Reports – Overview and Timelines.............................................................................. 21
Policy-specific Reports – Overview and Timelines .................................................................................. 22
Evaluation Structure .............................................................................................................................. 24
Goal 1: Reduce the Number of Uninsured Low Income Indiana Residents and Increase Access to
Healthcare Services ............................................................................................................................... 25
1.1. HIP Will Reduce the Number of Uninsured Indiana Residents with Income Under 138% FPL Over the Course of the Demonstration ....................................................................... 25
1.2. HIP will Increase Access to Healthcare Services Among the Target Population .................... 26 1.3. POWER Account Contributions (PACs) for Individuals in the HIP Plus Plan are Affordable
and Do Not Create a Barrier to Healthcare Access............................................................. 27

Page 3 of 176
1.4. Presumptive Eligibility (PE) and Fast track Prepayments Will Provide the Necessary Coverage so as Not to have Gaps in Healthcare Coverage ................................................. 28
1.5. Waiver of NEMT to the Non-pregnant and Non-medically Frail Population Does Not Pose a Barrier to Accessing Care ............................................................................................... 29
Goal 2: Promote Value-based Decision Making and Personal Health Responsibility .............................. 41
2.1. HIP Policies will Encourage Member Compliance with Required Contributions and Provide Incentives to Actively Manage POWER Account Funds ......................................... 41
2.2. HIP Plus Members will Exhibit More Cost-conscious Healthcare Consumption Behavior than: a) HIP Basic Members; and b) Traditional Hoosier Healthwise Members in the Areas of Primary, Specialty, and Pharmacy Service Utilization Without Harming Beneficiary Health ............................................................................................................ 43
Goal 3: Promote Disease Prevention and Health Promotion to Achieve Better Health Outcomes .......... 54
Goal 4: Promote Private Market Coverage and Family Coverage Options to Reduce Network and
Provider Fragmentation within Families. ............................................................................................... 59
4.1. HIP’s defined contribution premium assistance program (HIP Link) will increase the proportion of adults with incomes under 138% FPL who are enrolled in ESI since the previous demonstration period ........................................................................................ 59
Goal 5: Provide HIP Members with Opportunities to Seek Job Training and Stable Employment to
Reduce Dependence on Public Assistance ............................................................................................. 66
Goal 6: Assure State Fiscal Responsibility and Efficient Management of the Program ........................... 69
Appendix A – Summary Table of Research Questions, Metrics, and Analytic Methods ........................... 73
Appendix B – HIP Members Survey (Basic) ........................................................................................... 109
Appendix C – HIP Member Survey (Plus) .............................................................................................. 120
Appendix D – Previous HIP Member Survey ......................................................................................... 129
Appendix E – Never HIP Member Survey (No PAC) ............................................................................... 136
Appendix F – Never HIP Member (Presumptive Eligibility) ................................................................... 142
Appendix G – HIP Providers Survey ...................................................................................................... 148
Appendix H – Survey Analysis Plan ....................................................................................................... 155
Appendix I – Quarterly Report for Demonstration Year I, Quarter 2 ..................................................... 165
Appendix J – Survey Notification Letter Sent to HIP Members ............................................................. 175
Appendix K – Survey Notification Letter Sent to HIP Providers ............................................................. 176

Page 4 of 176
Demonstration Overview Traditional Medicaid programs offer healthcare coverage to vulnerable individuals, but numerous
studies indicate poor health outcomes in spite of high spending. A University of Virginia study found
that Medicaid patients are almost twice as likely to die after an inpatient surgery, stay in the hospital
42% longer, and cost 26% more than individuals with private insurance.1 A study conducted by Johns
Hopkins similarly found higher mortality rates among Medicaid patients, indicating they are 29% more
likely to die within three years following receipt of a lung transplant.2
The Healthy Indiana Plan (HIP) model was developed as an alternative to traditional Medicaid. HIP,
which passed the Indiana General Assembly in 2007 with bipartisan support, builds upon the State’s long
and successful history with consumer-driven health plans. Indiana pioneered the concept of medical
savings accounts in the commercial market, and is also the first and only state to apply the consumer-
driven model to a Medicaid population. Provided by private health insurance carriers, HIP offers its
members a High Deductible Health Plan (HDHP) paired with a Personal Wellness and Responsibility
(POWER) account, which operates similarly to a Health Savings Account (HSA).
The private health insurance experience provides an alternative to traditional Medicaid and promotes
consumerism by requiring members to make contributions into their accounts. The contributions are
designed to preserve dignity among members receiving public assistance and provide them with “skin in
the game,” which empowers them to demand price and quality transparency as they make cost-
conscious healthcare decisions and take responsibility for improving their health. In addition, the
infusion of market principles works to educate members and prepares them to participate in the private
market when they are able to transition off the program.
HIP 2.0 Eligibility and Program Features After six years of demonstrated success with HIP, the Centers for Medicare and Medicaid Services (CMS)
granted the State of Indiana the opportunity to replace traditional Medicaid for all non-disabled adults
ages 19-64 and expand HIP to those who fall below 138% of the federal poverty level (FPL). This section
1115 demonstration, known as HIP 2.0, seeks to further HIP’s core goals:
1. Reduce the number of uninsured low income Indiana residents and increase access to
healthcare services.
2. Promote value-based decision making and personal health responsibility.
3. Promote disease prevention and health promotion to achieve better health outcomes.
4. Promote private market coverage and family coverage options to reduce network and provider
fragmentation within families.
5. Assure State fiscal responsibility and efficient management of the program.
1 LaPar, D. J., et al (2010). Primary Payer Status Affects Mortality for Major Surgical Operations. Annals of Surgery, 252(3), 544–551. Retrieved from http://www.ncbi.nlm.nih.gov/pmc/articles/PMC3071622/. 2 Id.

Page 5 of 176
These five goals address various aspects of CMS’s Three-Part Aim of better care, better health, and
reduced costs; and the success of those goals will be evaluated through the hypotheses detailed in the
following table.
# Goal Hypotheses
1
Reduce the number of uninsured low income Indiana residents and increase access to healthcare services
1.1 HIP will reduce the number of uninsured Indiana residents with income under 138% FPL over the course of the demonstration (HIP 2.0 Waiver, Section 5 and STCs, Section XIII, Paragraph 3i).
1.2 HIP will increase access to healthcare services among the target population (HIP 2.0 Waiver, Section 5 and STCs, Section XIII, Paragraph 3ii).
1.3 POWER account contributions for individuals in the HIP Plus plan are affordable and do not create a barrier to healthcare access (STCs, Section XIII, Paragraph 3v).
Few individuals will experience the lockout period because the policy will deter nonpayment of POWER account contributions policy for HIP Plus beneficiaries (STCs, Section XIII, Paragraph 3vi).
1.4 Presumptive eligibility and fast track prepayments will provide the necessary coverage so as not to have gaps in healthcare coverage (STCs, Section XIII, Paragraph 3vii).
1.5 Waiver of non-emergency transportation to the non-pregnant and non-medically frail population does not pose a barrier to accessing care (STCs, Section XIII, Paragraph 3ix).
2
Promote value-based decision making and personal health responsibility
2.1 HIP policies will 1) encourage member compliance with required contributions and 2) provide incentives to actively manage POWER account funds (HIP 2.0 Waiver, Section 5)
HIP policies surrounding rollover and preventive care will encourage beneficiaries’ compliance with required contributions and provide incentives to actively manage POWER account funds (STCs, Section XIII, Paragraph 3viii).
2.2 HIP Plus members will exhibit more cost-conscious healthcare consumption behavior than: a) HIP Basic members; and b) traditional Hoosier HealthWise members in the areas of primary, specialty, and pharmacy service utilization without harming beneficiary health (HIP 2.0 Waiver, Section 5 and STCs, Section XIII, Paragraph 3iv).
2.3 HIP’s (i) graduated copayments required for non-emergency use of the emergency department (ED), (ii) ED prior authorization process, and (iii) efforts to expand access to other urgent care settings will together effectively deter inappropriate ED utilization without harming beneficiary health (HIP 2.0 Waiver, Section 5).
The graduated copayment structure for non-emergency use of the emergency department will decrease inappropriate ED utilization without harming beneficiary health (STCs, Section XIII, Paragraph 3x).

Page 6 of 176
# Goal Hypotheses
The prior authorization process for hospital emergency department use and efforts to expand access to other urgent care settings will decrease inappropriate ED utilization without harming beneficiary health (STCs, Section XIII, Paragraph 3xi).
3
Promote disease prevention and health promotion to achieve better health outcomes
3.1 HIP will effectively promote member use of preventive, primary, and chronic disease management care to achieve improved health outcomes (HIP 2.0 Waiver, Section 5 and STCs, Section XIII, Paragraph 3iii).
4
Promote private market coverage and family coverage options to reduce network and provider fragmentation within families
4.1 HIP’s defined contribution premium assistance program (HIP Link) will increase the proportion of Indiana residents under 138% FPL covered by employer-sponsored insurance (ESI) (HIP 2.0 Waiver, Section 5 and STCs, Section XIII, Paragraph 3xii).
5
Provide HIP members with opportunities to seek job training and stable employment to reduce dependence on public assistance (Separate from 1115 Demonstration)
5.1 Referrals to Department of Workforce Development (DWD) employment resources at the time of application will increase member employment rates over the course of the demonstration (HIP 2.0 Waiver, Section 5).
6
Assure State fiscal responsibility and efficient management of the program
5.1 HIP will remain budget-neutral for both the federal and state governments (HIP 2.0 Waiver, Section 5 and STCs, Section XII).

Page 7 of 176
Evaluation Approach
Evaluation Overview Throughout the previous HIP demonstration, the State tracked meaningful measures of quality, access
to care, health outcomes, member satisfaction, and budget neutrality. The State of Indiana looks to
leverage this experience and data as a part of its evaluation for HIP 2.0. The State will gather and review
many of the same data metrics it used in the previous HIP demonstration, modifying existing previous
evaluation tools such as the member survey and retaining much of the direct question and response
wording, as appropriate. Data collected as a part of the previous HIP demonstration will serve as
baseline data against which HIP 2.0 will be compared, and will provide insights on the generalizability of
core program goals.
In addition to previous HIP demonstration data, the State will also use data from its traditional Medicaid
populations, as well as data from national studies and other publicly available data. This data will serve
as additional points of comparison to evaluate the demonstration’s success in meeting its goals. The
evaluation will also look at current data sources and collect its own data to evaluate processes and
outcomes throughout the demonstration. The State will build quality control (QC) measures into all
phases of data collection, including computer-assisted telephone interviewing (CATI) development, data
collection, data coding and editing, and final file production.
Evaluation of this demonstration and reports will be released on three different time intervals:
quarterly, annual, and a final culminating report. There will also be some policy-specific reports
released outside of the standard reporting schedule in accordance with the HIP 2.0 Special Terms and
Conditions (STCs).
Evaluation Strategy To ensure an unbiased evaluation of the program aims, the State has contracted with a neutral third
party evaluator – The Lewin Group – selected through a competitive bidding process. The evaluation
strategy includes the goals, hypotheses, and domains of focus detailed in the HIP 2.0 waiver and (STCs).
The evaluation strategy includes a combination of qualitative and quantitative data to evaluate HIP 2.0,
including the use of eligibility and enrollment, claims, and survey data to report metrics such as program
enrollment and service utilization. The evaluation strategy also includes a series of comparisons, using
data-driven metrics for the HIP 2.0 population and comparing those to internal populations (e.g. HIP
Plus member characteristics vs. HIP Basic member characteristics) and external populations (e.g. HIP 2.0
member characteristics vs. previous HIP demonstration members, traditional Medicaid members).
The collection strategy for each data source is described in the following section. Data will be used to
analyze the hypotheses and corresponding research questions, which are detailed in Appendix A. Taken
together, the data and corresponding analyses will provide a comprehensive picture of HIP 2.0.

Page 8 of 176
Data Sources and Collection This section includes a discussion of data sources and collection strategies that will be employed. Data
will be used to analyze each hypothesis and corresponding research questions, which are detailed in
Appendix A.
The evaluation strategy considers a number of factors for data collection, including the populations
under consideration for each data metric and comparison to ensure the evaluation is able to draw
accurate and representative conclusions from the data. Some particular populations and subgroups that
the evaluation strategy considers include:
Health coverage differences: HIP Plus, HIP Basic, HIP Link;
Benefit package differences: State plan benefits for groups like the Medically Frail and low-
income caretakers;
Cost sharing differences:
o No cost sharing for groups like Pregnant Women and American Indians/Alaska Natives;
o POWER account contributions for HIP Plus;
o Copayments for HIP Basic; and
o Deductions related to HIP Link;
Enrollment differences: Eligible individuals selecting HIP Plus, HIP Basic, HIP Link, or choosing
not to enroll;
Socio-demographic differences: Behavior variation across socio-demographic metrics.
Data collection for the evaluation strategy is based on standard data assessment principles, such as
simple random sampling, probability-based sampling, and stratified random sampling.
The evaluation strategy includes a variety of data sources from both external and internal entities.
External data sources include information generated by federal and local authorities that are not
affiliated with the State of Indiana, including the Current Population Survey (CPS), the American
Community Survey (ACS), the Consumer Assessment of Healthcare Providers and Surveys (CAHPS
administered by Managed Care Entities [MCEs]) and data from other regulatory authorities. Internal
data sources will include data generated and owned by the State of Indiana, including, but not limited
to, historical Medicaid data; MCE plan network and geo-access data; HIP 2.0 eligibility, application, and
enrollment data; member, non-member, and provider survey data; claims data; administrative data; and
internal financial data. The combination and comparison of these different data sources contribute to a
detailed analysis plan that will answer a series of research questions associated with each
demonstration goal and hypothesis.
The State identified research questions and key metrics to assess whether each goal was achieved. To
help clarify the research questions, metrics were outlined according to “process” measures and
“outcomes” measures. All measures will be evaluated in the context of an appropriate comparison
population. For example, to allow for meaningful analysis, the comparison population should have a
similar composition to the population being evaluated (the experimental group) to ensure comparability
across socio-demographic factors and other relevant covariates. Each research question includes

Page 9 of 176
analysis at the member, provider, and aggregate program level, as appropriate, and includes population
stratifications, to the extent feasible, for further examination and to glean potential non-equivalent
effects on different subgroups.
External Data Sources A description of each potential external data source and its associated metrics is included below.
Current Population Survey
The Current Population Survey (CPS) is sponsored jointly by the U.S. Census Bureau and the U.S. Bureau
of Labor Statistics (BLS) and is a monthly survey of households in the United States. The CPS is the
source of numerous high-profile socio-economic statistics, including rates of health insurance coverage.
The CPS also collects extensive demographic data that complements and enhances the State’s
understanding of health insurance coverage in the nation overall, and across many different populations
according to race, ethnicity, gender, education, income, and geographic location.3
The CPS will be used to assess the following data metrics:
Health insurance coverage estimates, by age and by income;
Total health insurance coverage estimates (all ages and income levels); and
Employer-sponsored insurance (ESI) coverage rate estimates (all ages).
American Community Survey
The American Community Survey (ACS), sponsored jointly by the U.S. Census Bureau and the U.S.
Department of Commerce, is a nationwide survey that collects and produces information on
demographic, social, economic, and health insurance coverage characteristics of the U.S. population
each year. Information from the survey generates data that help determine how more than $400 billion
in federal and state funds are distributed each year.4
The American Community Survey will be used to assess the following data metrics:
Health insurance coverage estimates, by age and by income;
Total health insurance coverage estimates (all ages and income levels); and
Employer-sponsored insurance (ESI) coverage rate estimates (all ages).
Consumer Assessment of Healthcare Providers and Systems (CAHPS) Surveys
CAHPS surveys, developed and implemented by the Agency for Healthcare Research and Quality (AHRQ)
and administered by the MCEs, ask patients about their healthcare providers and plans, including
hospitals, home health care agencies, doctors, and health and drug plans, among others. CAHPS surveys
follow scientific principles in survey design and development. The surveys are designed to reliably
assess the experiences of a large sample of patients. They use standardized questions and data
collection protocols to ensure information can be compared across healthcare settings, and are
3 U.S. Census. Current Population Survey. Available at http://www.census.gov/cps/. Accessed 05/07/15. 4 American Community Survey Information Guide. Available at http://www.census.gov/acs/www/about_the_survey/acs_information_guide/. Accessed 05/07/15.

Page 10 of 176
statistically adjusted to correct for differences in the mix of patients across providers and the use of
different survey modes.5 Data will be collected by MCEs through annual CAHPS surveys starting in Year
Two.
The CAHPS survey will be used to assess the following data metrics (member ratings):
Rating of plan overall;
Ability to get needed care quickly;
Provider communication;
Coordination of care; and
Other relevant CAHPS indicators.
Internal Data Sources Since the inception of the previous HIP demonstration, Indiana has maintained a multitude of datasets
to track and monitor the program’s success. With the implementation of HIP 2.0, the State has added
more dimensions to those datasets and continued to collect data from and about members. Below is a
description of each of the internal State data sources and a high-level summary of how the data will be
used. More detail on how the data sources will address specific hypotheses and research questions is
included in Appendix A.
Indiana Medicaid Historical Data
Indiana historical data refers to data that the State has developed over previous assessments and
evaluations, either directly or through contracted services for the previous HIP demonstration
population. The evaluation will use data from previous HIP evaluations on a variety of metrics including
POWER account, enrollment, and utilization. The historical data will include claims, enrollment, and
other HIP-specific data.
The HIP 2.0 population not only includes the “new adult” population created by the Affordable Care Act
(ACA), but also includes several populations previously covered by the traditional Medicaid program.
These populations include those accessing family planning services, parents and caretakers, and 19 and
20 year olds. As traditional Medicaid has covered these groups for years, there are years of enrollment
and claims data against which the evaluation will compare HIP 2.0 enrollment and claims data.
HIP Benefit Plan Data
HIP Benefit Plan Data refers to data from HIP programs that run concurrent with HIP 2.0, such as Hoosier
Healthwise (HHW). The evaluation will use data from these companion programs to report on a variety
of metrics, in particular, claims and utilization data.
Managed Care Entity (MCE) Health Plan Network and Geo-access Data
HIP health plan network and geo-access data will be used to measure geo-access standards for primary
and specialty care for all HIP 2.0 health plans. The evaluation will use geo-access data to identify and
5 Center for Medicare and Medicaid Services (CMS). Consumer Assessment of Healthcare Providers & Systems (CAHPS). Available at https://www.cms.gov/Research-Statistics-Data-and-Systems/Research/CAHPS/index.html? redirect=/cahps/. Accessed 05/11/15.

Page 11 of 176
measure metrics such as the proximity of primary and specialty care providers to members, the
proximity of dental care providers to members, and related measures.
Member Eligibility, Application, and Enrollment Data
Member application and enrollment data will be used to understand the size and socio-demographic
makeup of HIP 2.0 enrollees. Member data from HIP enrollment figures will be used to identify and
measure key member metrics such as monthly and annual enrollment counts, the length of time
individuals are remaining in the program, the unique number of Indiana residents with household
income under 138% FPL, and related member information.
Employer Eligibility, Application, and Enrollment Data
Employer application and enrollment data will be used starting in Year Two of this evaluation to
understand the characteristics of employers who apply for and are approved to participate in HIP Link.
Employer data from HIP Link enrollment figures will be used to track and assess data metrics such as
employer size, employer industry type, employer-sponsored insurance (ESI)/health plan information,
number of HIP Link employees, and related employer information.
Surveys
Surveys will play a significant role in the evaluation process, as they will capture the perspectives of
current members, nonmembers, and physicians/office administrators regarding HIP. The surveys will
contribute to addressing research questions across the evaluation. In total, Indiana will survey four
distinct population groups. The survey populations and the purpose of each survey are described in the
figure below.
Member
•The member survey will collect data from both HIP Basic and HIP Plus members.
•Questions range in subject from affordability to access to care with the overall goal of understanding member’s experiences with HIP.
•Many of the same questions from the previous HIP demonstration member survey are included in the HIP 2.0 survey for comparison.
Previous Member
•The previous member survey will collect data from individuals who had been fully enrolled in HIP but who left the program for any reason (e.g., moved out of state) in addition to members with income over 100% FPL who left the program for non-payment of their POWER account contribution (PAC).
•The goal of this survey is to understand the reasons individuals left the program.
Never-Member
•The never-member survey will collect data from individuals who had never been enrolled in HIP at the time of the survey. This evaluation will focus on 1) individuals who were determined eligible through Presumptive Eligibility (PE) but did not submit their application to maintain coverage and 2) individuals with household income over 100% FPL who were determined eligible but did not make their first PAC.
•The goal of this survey is to understand the individual's health coverage experiences, specifically access to healthcare services and any grievances with the HIP model.
Provider
•The provider survey will data from providers who accept insurance through HIP.
•Questions will focus on the provider’s perceptions of member’s access to care.

Page 12 of 176
To implement these surveys, the State will ensure respondents are aware of the reason behind the
survey and have the information they need to fully participate. Further, the State will implement
rigorous data capture tools to collect the most meaningful data, including contacting potential survey
participants via mail prior to the survey, using computer-assisted telephone interviewing (CATI) to
promote data consistency and accuracy, offering surveys in both English and Spanish, and monitoring
the survey interview process for quality.4 Additional detail on this approach is included in the Survey
Analysis Plan, Appendix H.
Member Survey Data
Participants for the member survey will be selected at random and the sample size will be statistically
sound for appropriate comparison of study groups. The Member sample was selected to ensure a
predetermined number of responses for each subcategory of HIP health plan participation (Basic and
Plus). In total, the State will complete 550 surveys. This number of surveys will ensure sufficient ratios of
HIP Plus to HIP Basic and Non-Emergency Medical Transportation (NEMT) coverage to individuals who
do not have this benefit coverage (non-NEMT). The State expects these 550 surveys to be distributed
such that about 385 are HIP Plus members (165 HIP Basic members) and that about 260 have a Medicaid
benefit for NEMT (while 290 do not have this NEMT benefit). Where comparisons to other
subpopulations are warranted in the hypotheses, this yields an allocation ratio of 4.4 to 1. Should a
more conservative scenario arise where the null proportion is 0.5 with an allocation ratio of 4 to 1, it will
still be possible to detect a difference of 11.6 percentage points as being statistically significant. More
detail on the sampling approach is included in the Survey Analysis Plan, Appendix H.
The HIP Basic and Plus member surveys address items such as:
Satisfaction with HIP
Use of Fast Track payments
Transportation
Missed appointments, and whether transportation is indicated as the primary reason
POWER accounts
Use of preventive services
Cost sharing, payment of copays and perceptions on affordability
Access to care
Knowledge of HIP
The previous HIP demonstration evaluation employed a survey addressing most of these topics and the
HIP 2.0 evaluation uses many of the same questions to ensure survey continuity and allow for more
accurate comparisons between the previous HIP demonstration and HIP 2.0. The new survey
instruments, however, include new sections to address several of the policies new to HIP 2.0, including
the HIP Basic and HIP Plus cost sharing models, payment of Emergency Department (ED) copays, and
other copayments, as well as the new HIP Link option.
4 See Appendices J and K for letters sent to members and providers, respectively.

Page 13 of 176
Non-Member Survey Data
Several hypotheses require the comparison of perceptions of current HIP members to non-HIP
members. To provide a comparison population for current HIP member surveys, the State will conduct
surveys of two populations that are not current HIP members: previous members (leavers) and never-
members. These two subpopulations are described in greater detail below. Because of the small
sample sizes for both previous members and never-members, the State will pool responses from these
two groups for the purposes of analysis, as appropriate.
Previous Member (Leaver) Survey Data
Previous members (Leavers) refer to individuals who left the program for any reason, including
individuals with household income over 100% FPL who made at least one initial POWER account
contribution and were locked out of the program after failing to make their required PAC. This group is
different from the never-member group, described in the following section, because individuals who left
the program have completed applications and were fully enrolled in the HIP program; whereas
individuals in the never-member group did not take the necessary steps, including completing an
application or making their first PAC, to fully enroll.
The previous member survey addresses items such as:
Reasons for leaving HIP
Affordability of HIP
Current source of health coverage
Affordability of employer coverage (if applicable)
Access to care
Knowledge of HIP
The sample size for each of the survey groups was determined to ensure statistically valid samples for
each of the populations. The State will complete at least 125 surveys for each subpopulation out of the
total sample size of individuals selected, illustrated in the following table.
Survey Detail
Total
Number of
Members
Members
Selected
into Sample
Target
Completed
Responses
Leaver
Includes all persons who exited HIP, by
eligibility group (e.g., Basic vs. Plus) 8,754 2,500 125
Persons >100% FPL who went into lockout 899 899 125
TOTAL 9,653 3,399 250
The contents of the survey will focus on why the individual left HIP, probing specifically around
affordability. In addition, the survey seeks to understand whether individuals who left HIP currently have
insurance coverage, and if so, how they feel about their access to care. Access to care questions are
modeled after the CAHPS survey questions and will be included across all survey groups for comparison.
More detail on the sampling approach is included in the Survey Analysis Plan, Appendix H.

Page 14 of 176
Never-Member Survey Data
Never-member surveys will target two different subpopulations, including individuals who (i) have a
household income over 100% FPL and were conditionally approved, but did not make the necessary PAC
in the first month or (ii) were assessed presumptively eligible for HIP, but did not submit the full
application.
The never-member survey addresses items such as:
Reasons for non-payment of PAC or not completing the full Indiana Application for Health
Coverage
Affordability of HIP
Plans to apply for HIP coverage in the future
Access to care
Similar to the previous member sampling methodology, the State will attempt to complete 125 surveys.
This sample was not stratified; however, the data designates the category of never-member – either
persons conditionally approved who did not make their first PAC or individuals determined eligible
through a Presumptive Eligibility (PE) application that did not complete an application for full coverage –
and analysis will take these two categories into consideration. More detail is included in the Survey
Analysis Plan, Appendix H.
Provider Survey Data
While HIP 2.0 members will make up the majority of survey participants, the evaluation will also include
provider surveys as a means to address several metrics concerning healthcare quality and member
access. For example, Medicaid has traditionally used presumptive eligibility assessments and
applications to expedite enrollment for limited populations. With the expansion of HIP 2.0, the program
is also expanding presumptive eligibility assessments and enrollments to new providers and new
populations. The evaluation will survey healthcare providers and/or appropriate office staff to gain a
better understanding of provider perceptions of presumptive eligibility, copay protocols, non-
emergency transportation and uncompensated care.
The provider survey addresses the following topics:
Practice setting
Perceptions on reimbursement rates
Collection of copayments from HIP members
Perceptions on reasons for missed appointments
Perceptions on impact of missed appointments
Perceptions on presumptive eligibility process
HIP’s overall effect on revenue
Knowledge of HIP
Transition of patients from Hoosier HealthWise to HIP

Page 15 of 176
Uncompensated care
The provider sample, which is currently underway, contains 1,750 unique providers, and the State aims
to complete interviews with 225 providers. The sample selection criteria are restricted to providers
whose addresses are in Indiana or surrounding states (i.e. Michigan, Ohio, Kentucky, Illinois). The State
will exclude the following provider types and related specialties: mental health, schools, pharmacy,
DME/medical supply, transportation provider, dental, laboratory, and First Steps program. The State
plans to target more providers in certain key groups, such as: the 42 FQHCs, and three specific hospitals
(Indiana University Hospital, Community Health Care Center, St. Vincent Hospital). The remaining
providers were selected via simple random sample from the remaining pool of providers. More detail
on the Provider Survey approach is included in the Survey Analysis Plan, Appendix H. Particular provider
groups of interest:
Presumptive eligibility application entities: Traditionally, Indiana Medicaid offered limited
presumptive eligibility application through registered hospitals. With the expansion of HIP, the
State will also expand the criteria for organizations to be eligible to assess individuals as
presumptively eligible for HIP 2.0. As a part of this effort, Indiana will be tracking the count and
types of entities eligible to perform this eligibility assessment and compare that data with the
count and types of entities approved and enrolled to serve this function. The State has
completed a separate review of presumptive eligibility, and will continue monitoring efforts
over time.
Provider Enrollment Data
The State will review the number of new providers in the Medicaid program and the HIP health plans. In
particular, the number of HIP providers will be monitored to ensure provider availability for HIP
participants is comparable to the availability for Hoosier HealthWise (HHW) participants. Given that HIP
providers are reimbursed at a higher rate than HHW providers, the STCs require the State to provide
CMS annual Provider Payment Reports that detail provider enrollment. A direct relationship between
changes in payment rates and provider availability will be difficult to discern, however reporting the
number of providers will provide a useful review of program participation. Additionally, perceptions on
provider availability will be measured through access to care questions included in annual member
surveys, as previously discussed.
Claims Data
The claims records that the health plans submit to the State will be a critical source of information about
the healthcare utilization patterns of all HIP enrollees and will help test several of the demonstration
hypotheses. The State will also utilize historical claims data for populations that were moved into HIP
2.0, as well as the previous HIP population, for comparison purposes on a number of metrics.
Information about how HIP enrollees and comparable Medicaid beneficiaries use care, the type of care
they receive, and their diagnoses5 will be used to assess several HIP goals. In addition, information from
5 The diagnosis codes on these records will be used to identify people with chronic conditions.

Page 16 of 176
these records will be used to identify eligible HIP providers for telephone surveys in order to better
understand the provider effects of the programs.
The evaluation strategy also combines claims data with member eligibility and POWER account data to
look for healthcare utilization patterns associated with particular socio-demographic groups.
In addition, the evaluation will assess claims and utilization data by specific category. Some of the more
salient claims and utilization categories include ED utilization (both emergency use and non-emergency
use), primary care, specialty care, and chronic disease management. The information generated from
these category-specific claims and utilization assessments will be used to provide a more complete and
comprehensive analysis of the effects of policies such as graduated ED copayments and programs such
as HIP Link.
Administrative Data
Administrative data refers to the internal participant-level data generated from member activity. Data
such as POWER account contributions, out-of-pocket payments, and third-party contributions (e.g., not
for profit organization contributions to member POWER account payments) are all forms of
administrative data, which will be used in the evaluation.
POWER Account Data
The HIP 2.0 MCEs maintain participant-level records on monthly POWER account contributions, usage of
POWER account funds, and annually calculate and record whether enrollees qualified for rollover of
their POWER accounts. This data will link with other data—for example, application, enrollment, and
claims data files. Combining POWER account information with other data sources will allow more in-
depth analysis of whether the POWER account can be linked to healthcare utilization, to evaluate if HIP
enrollees engage in value-based purchasing and increased use of preventive services and/or other cost-
effective utilization patterns compared to other Medicaid populations. The evaluation will also use the
POWER account data to compare utilization across current members based on their benefit plan (Basic
or Plus) and to compare utilization differences between the previous HIP demonstration members and
HIP 2.0 members.
The State will examine the link between the different types of rollover incentives and preventive service
utilization, as well as the link between rollover and changes in benefit plan enrollment from HIP Basic to
HIP Plus.
In addition, HIP 2.0 allows employers and not-for-profit organizations to make contributions on behalf of
HIP 2.0 members. The evaluation will also review these payments and use the information to gauge the
impact of third party contributions on access to health coverage.
To complete planned analyses, the evaluation requires several types of secondary data, much of which
will come from the participating health plans and several State offices, including health plan procedural
data and plan monitoring reports to assess plans’ operational performance.

Page 17 of 176
Internal Financial Data
Internal financial data refers to data collected by the State that describe revenues and expenditures
related to HIP programs. The internal financial data that will be used within this evaluation include (but
are not limited to):
Expenditure information for HIP programs (e.g., previous HIP demonstration & HIP 2.0, Hoosier
Healthwise, HIP Link, etc.);
The approved budget neutrality agreement with CMS, and any future changes to that
agreement;
Financial assessment data provided by Milliman (the State’s actuarial consultant, contracted to
assess and track waiver budget neutrality);
Revenue data, including cigarette tax and dedicated funds that support HIP; and related
financial data.
These (and related) financial data will be used to assess costs related to the demonstration, by sub-
populations, including Section 1931, the new adult population, and HIP Link participants.
The State will submit quarterly reports on expenditures, utilizing Form CMS-64, CMS-64.9 Waiver, CMS-
64.9P Waiver, and/or CMS-37, as applicable. These reports will track a number of financial data
elements, as required by Section XI, Paragraph 2 of the STCs.
Analyzing Data
The evaluation will use a series of univariate, bivariate, and multivariate analyses to test the hypotheses
associated with the goals of the HIP program and the related research questions therein.
Univariate analyses will be used to compute measures such as central tendency (i.e., mean,
median and mode), dispersion (i.e., range, variance, max, min, quartiles and standard deviation)
and frequency distributions.6
Bivariate analyses will be used to describe the relationship between two variables (i.e., the
effect that a change in variable X has on variable Y).7
Multivariate analyses will be used to describe the relationship between two variables, while
accounting for the effects of other (confounding) variables on the responses of interest.8
Multiple logistic regressions will be used to assess a dichotomous outcome variable across more
than one independent variable. In this model, the log odds of the outcome is modeled as a
linear combination of the predictor variables. This approach is analogous to multiple linear
regression, which is used for continuous dependent outcomes.
The evaluation summary table (Appendix A) indicates how univariate, bivariate, and multivariate
analyses will be used within the evaluation. The Survey Analysis Plan, Appendix H, includes more
information on how survey results will be analyzed.
6 Babbie E. The Practice of Social Research (2009; 12th edition). Wadsworth Publishing. ISBN 0-495-59841-0.

Page 18 of 176
Mechanisms to Ensure Quality Data and Reporting
Adjusting for Confounders
The STCs require that the evaluation design control for various confounding factors in the
demonstration. Adjusting the data for confounders will increase the internal validity of the evaluation,
which will help ensure the accuracy of the findings. Examples of the types of confounding factors for
which the HIP 2.0 evaluation will control include, but are not limited to:
Health status (determined by a documented and verified Medically Frail Indicator);
Socio-demographic factors (e.g., poverty level, geographic region, age, sex, ethnicity, education, etc. – as derived from administrative data);
Risk (risk scores will be calculated using Symmetry® EBM Connect®8 ERGs and will classify members into healthy, low, medium, high, and very high acuity groups); and
HIP benefit status (Plus, Basic or State Plan).
Controlling for Bias
Recognizing the potential for selection bias in comparing members and non-members, for example, with
regard to access to care, the evaluation will use a series of descriptive analyses and logistic regression
models to analyze survey data and describe differences. This combination provides easy to understand
tables and more robust estimates that simultaneously account and control for differences in available
covariates. The evaluation will show cross-tabulations of survey questions by covariate. Additionally,
the State will evaluate for other sources of bias, e.g., non-response bias, by assessing whether non-
response is differential across comparison groups. If non-response bias is detected, data and
observations used within the evaluation may be weighted to adjust for the probability of selection bias.
Ensuring Appropriate Comparison between Study Groups – Power and Sample Size
The desired comparisons between study groups described further in this Evaluation Plan are based on
random samples large enough to detect statistically significant differences of 7 to 11.6 percentage
points, depending on the observed proportions (0.1 to 0.5) and assuming an allocation ratio of 4:1, Type
I Error of 0.05, and Type II Error of 0.2. These differences meet the threshold for identifying
discrepancies that are appropriate to note from a policy perspective.
Excluded Populations
American Indian/Alaska Native members and pregnant members will be excluded from most samples, as
neither group is subject to the cost sharing requirements. Women who are selected and become
pregnant will be removed from the sample, as they will have no copayments applied for the remainder
of their pregnancy.
8 Symmetry® EBM Connect® is an Optum decision support software that compares medical and pharmacy claim, lab result and enrollment data with evidence-based best practices for clinical conditions and preventive measures. EBM Connect drives the identification of data used to improve provider and patient compliance with proven evidence-based treatment standards.

Page 19 of 176
Availability of Claims Data
Claims data MCEs are submitting to the State will underpin many of the planned analyses within the
evaluation, particularly those that assess HIP’s effects on personal responsibility, preventive care, and
prevention of disease progression. Currently, healthcare providers have up to a year to submit claims for
reimbursement. Delays in submission of claim information produce data deficiencies that can impact
reporting, particularly for rapid assessments such as the monthly monitoring calls as well as monthly and
quarterly reports due to CMS.
Generalizability of Results In accordance with Section XIII, Paragraph 1 of the STCs, the evaluation will consider the potential for
generalizing the results of the HIP 2.0 demonstration. With a series of policy firsts for the Medicaid
population, the HIP 2.0 demonstration will indicate how successfully certain consumer-driven healthcare
principles can be applied across a broader population. Evaluations of the previous HIP demonstration
indicated success in applying commercial healthcare concepts to a limited group of enrollees. HIP 2.0
will expand the application of those principles, as well as new policies, throughout Indiana, which may
demonstrate that the outcomes and experiences associated with HIP members are generalizable to
populations across the State.

Page 20 of 176
Evaluation Deliverables While the general reporting time frame is known and indicated in the following section, the evaluation
will utilize and adhere to all dates/deadlines as indicated within the STCs, including revisions to these
timelines as applied by CMS. These deadlines will be centered on quarterly and annual reports, as well
as an interim and a final report. In addition, the State expects to hold regular monthly calls with CMS,
during which time it will discuss, among other possible topics, data metrics that will be produced as a
part of the State’s compliance with rapid cycle assessment requirements.
Quarterly Reports – Overview and Timelines All quarterly reports will be required to include a discussion of events occurring during that quarter and
events anticipated to occur in the near future that will impact healthcare delivery, enrollment, quality of
care, access, health plan financial performance relevant to the demonstration, benefit package, and
other operational issues. These reports will also discuss any challenges faced in the quarter in addition
to a discussion of the underlying causes of the challenges, how the challenges are being addressed, key
achievements, and to what conditions and efforts those successes can be attributed. Further, quarterly
reports will discuss the HIP Link program operations, challenges, and grievances and will investigate MCE
collection activities, assessing the number of individuals subject to collection, the number of individuals
with POWER account debt, the amounts due, and the amounts paid. Finally, quarterly reports will
address POWER account Contributions and Payment monitoring, with several specific data elements
listed in Appendix A. The Quarterly Report for the Second Quarter of 2015 is included in Appendix I.
In addition to enrollment information, quarterly reports must also include expenditure information for
the quarter, utilizing Form CMS-64, CMS-64.9 Waiver, CMS-64.9P Waiver, and/or CMS-37, as applicable.
These reports will also track a number of financial data elements, as required by Section XI, Paragraph 2
of the STCs.
Quarterly Reporting to CMS
Demonstration Year 2015
2/1/2015 – 1/31/2016 Demonstration Year 2016
2/1/2016 – 1/31/2017 Demonstration Year 2017
2/1/2017 – 1/31/2018
Quarter Data
Reporting Period
Report Due Date
Data Reporting
Period
Report Due Date
Data Reporting
Period
Report Due Date
Q1 2/1/15 – 4/30/15
6/30/15 2/1/16 – 4/30/16
6/30/16 2/1/17 – 4/30/17
6/30/17
Q2 5/1/15 – 7/31/15
9/30/15 5/1/16 – 7/31/16
9/30/16 5/1/17 – 7/31/17
9/30/17
Q3 8/1/15 – 10/31/15
12/31/15 8/1/16 – 10/31/16
12/31/16 8/1/17 – 10/31/17
12/31/17
Q4 11/1/15 – 1/31/16
3/31/16 11/1/16 – 1/31/17
3/31/17 11/1/17 – 1/31/18
3/31/18

Page 21 of 176
Quarterly Financial Reports Due to CMS
Demonstration Year 2015 2/1/2015 – 12/31/2016
Demonstration Year 2016 2/1/2016 – 1/31/2017
Demonstration Year 2017 2/1/2017 – 1/31/2018
Quarter Data
Reporting Period
Report Due Date
Data Reporting
Period
Report Due Date
Data Reporting
Period
Report Due Date
Q1 2/1/15 – 4/30/15
5/30/15 2/1/16 – 4/30/16
5/30/16 2/1/17 – 4/30/17
5/30/17
Q2 5/1/15 – 7/31/15
8/31/15 5/1/16 – 7/31/16
8/31/16 5/1/17 – 7/31/17
8/31/17
Q3 8/1/15 – 10/31/15
12/31/15 8/1/16 – 10/31/16
11/30/16 8/1/17 – 10/31/17
11/30/17
Q4 11/1/15 – 12/31/15
1/31/16 11/1/16 – 1/31/17
2/28/17 11/1/17 – 1/31/18
2/28/18
Annual Reports – Overview and Timelines Annual reports, detailed in Section X, Paragraph 6 of the STCs, are intended to summarize the data
collected in the quarterly reports. To fulfill this requirement, the State will review the four quarterly
reports for the demonstration year, consolidating the information to facilitate a longer-range view of
the data and assessing the data for possible trends. The annual report will also include a summary of
the operations and activities performed in the demonstration year, as well as the data elements in the
following table.
In addition to the general summary of performance metrics, the State will also include a specific
assessment of its expanded presumptive eligibility program annually and an assessment of its waiver of
retroactive coverage as a part of its first annual report.
Annual reports due to CMS
Demonstration Year Report Due Date
2015 4/30/16
2016 4/30/17
2017 4/30/18
Interim and Final Reports – Overview and Timelines CMS requires an interim and final report, which will serve as comprehensive presentations of all of the
key components of the demonstration addressed in quarterly and annual reports. These reports will
include data collected since the beginning of the demonstration, incorporating feedback from CMS as
required in Section X, Paragraph 7 of the STCs.
The State will submit both an interim and a final report, which will serve as comprehensive
presentations of the key components of the demonstration. The interim report will be included either
as a part of a waiver renewal request or as a midpoint evaluation if the State opts not to extend the
demonstration. The final report will summarize data from the demonstration from beginning to end,

Page 22 of 176
consolidating information from all of the quarterly and annual reports submitted throughout the
demonstration.
Interim and Final Reports Due to CMS
Report Report Due Date
Interim Report June 30, 2016
Final Report March 27, 2018
Policy-specific Reports – Overview and Timelines The State will also produce additional reports that are only required once in the STCs. In addition to the
content described below, the reports below explain how policies are expected to impact program
outcomes.
Retroactive coverage data: The State will file two separate reports related to this policy within
the first year of the demonstration. The first report, which the State has already submitted,
examines the automatic renewal process and the population’s responsiveness when their
eligibility was terminated for failure to respond to their renewal and contains data on
uncompensated care related to the lack of retroactive coverage. The second report will analyze
data on the prior claims payment for a subsection of the Section 1931 group.
Presumptive Eligibility (PE) Data: The State will submit monthly and two separate reports
related to this policy, in accordance with STCs Section IV, Paragraphs 6a and 6d. Monthly
reports will cover basic application and eligibility statistics around PE applications. Another
report will address the number of entities potentially eligible to assess for PE, ensuring that
interested entities are able to assess for PE. The second report compares HIP eligibility for PE
enrollees with HIP eligibility across the entire applicant population.
Non-Emergency Medical Transportation (NEMT): The State will assess the impact of its waiver
of non-emergency medical transportation for members, scheduled for the end of February
2016.
Non-Emergency use of the Emergency Department (ED): The State will assess the impact of its
policy to increase the required copayment for individuals utilizing the ED without an emergency
condition more than once.
Provider Payment Rates: The State will file three reports over the course of the
demonstration—one per year—to assess whether enhanced pay for HIP 2.0 healthcare
providers results in different levels of access across Medicaid categories. If the study indicates
this is the case, the State will need to provide corrective actions to ensure equal access and
quality of care for all Medicaid enrollees.
HIP Plus POWER account Contribution (PAC): The State will submit a report addressing the
perceived affordability of the PAC and will examine the impact of the lockout policy on HIP Plus
members who are disenrolled for failure to make the contribution.

Page 23 of 176
Summary of Policy-Specific Reports and Their Timelines
Topic Description Due Date
Retroactive Coverage Data, per Section IV, Paragraph 4 of the STCs
Indiana will conduct an independent evaluation of the retroactive coverage waiver to allow for evaluation of whether there are gaps in coverage that would be remediated by the provision of retroactive coverage. As part of the evaluation:
a. The state will submit a description of its renewal process; b. The state will provide data on its new passive verification
renewal process, conducted in accordance with 42 CFR §435.916, by September 1, 2015.
c. The state will provide data on uncompensated care reported by providers as it relates to the lack of retroactive coverage.
d. The State will implement a transition program for the Section 1931 group that will reimburse providers for costs for services provided prior to their effective date of coverage.
September 1, 2015
The State will provide data regarding the 1931 group, including: a. The number of individuals with costs paid under the program; b. The total amount of costs paid; c. The average cost per person; d. The number and type of providers paid; e. The type of costs incurred, including the specific conditions with
which they are associated; and f. Survey data from beneficiaries and providers about
unreimbursed costs for this population, including amounts not reimbursed under this program.
November 1, 2015
Presumptive Eligibility (PE) Data, per Section IV, Paragraph 6 of the STCs
Monthly reports will be abbreviated reports with the information targeted to meet specific STC requirements. One such report relates to presumptive eligibility (PE). Monthly PE reports will include the following information, as required in Section IV, Paragraph 6 of the STCs:
The percentage of all applications that came through presumptive eligibility; and
The percentage of eligibility determinations following a presumptive period as a share of determinations made on all types of applications.
Monthly
The State will provide a report of the percentage of potentially qualifying entities trained and participating in the HIP 2.0 PE assessment, noting that entities that have refused or not responded to opportunities to participate will not be included in the assessment.
September 1, 2015
The State will assess the percentage of eligibility determinations following a PE period as a share of eligibility determinations made on all types of applications and uses the information to propose a minimum standard effective in calendar year 2016.
December 1, 2015
Non-Emergency Medical Transportation (NEMT), per Section V,
Within the first demonstration year, the State will conduct an assessment of the NEMT waiver, evaluating the impact on access to care. The evaluation must include hypotheses, and address at a minimum the following questions:
February 29, 2016

Page 24 of 176
Topic Description Due Date
Paragraph 1 of the STCs
a. What is the effect of no access to NEMT on missed appointments by income level?
b. Are there parts of the state that are more affected by no access to NEMT?
c. How does not having access to NEMT affect preventive care and overall health outcomes?
d. What is the impact of no access to NEMT as viewed by the providers and beneficiaries?
Non-Emergency use of the Emergency Department, per Section VIII, Paragraphs 2-5 of the STCs
As a condition of the waiver, the State has created a graduated copayment structure for non-emergency use of the emergency department (ED). To test the effectiveness of this policy, the State will need to assess whether the graduated payment successfully deterred unnecessary use of the ED without causing harm to HIP members. To conduct this assessment, the State will comply with the Emergency Room Copay Protocol.
December 1, 2016
Provider Payment Rates, per Section IX, Paragraph 8 of the STCs
The State will submit three reports regarding managed care entity (MCE) provider payment rates, with each including:
a. An evaluation of whether the differential in MCE provider payment rates between the HIP 2.0 program and the Hoosier Healthwise (HHW) program has resulted in unequal access to healthcare services, either in the number of providers available to beneficiaries, the number of providers accepting new beneficiaries, or in the time required to access care;
b. A description of corrective actions implemented if evaluation shows access between programs is not equal;
c. A description of any incremental changes to the provider payment rates in either the HHW and/or HIP 2.0 programs the state will be making for the upcoming rating period; and
d. Changes reported in the annual actuarial rate certification for the rating period.
December 30, 2015;
September 30, 2016;
September 30, 2017
HIP Plus POWER Account Contribution, per Section XIII, Paragraph 5 of the STCs
The State will evaluate the impact of the HIP Plus POWER account contribution on members, including topics such as:
a. How many individuals were disenrolled by income level? b. What are the reasons beneficiaries did not make contributions? c. What healthcare needs did individuals have while they were in
the lockout period and how did they address those needs?
March 31, 2016
Evaluation Structure Within the regular reports to CMS, the State will analyze the hypotheses presented in the HIP 2.0 waiver
and domains of focus listed in the STCs, separated into the five HIP 2.0 goals. Each goal and subgoal is
described in narrative form and listed in a table that outlines the core components: (i) research
questions, (ii) metrics, (iii) data sources, and (iv) an analytic approach that includes potential
comparisons. The first column of the table lists the hypothesis or hypotheses for the goal or subgoal.
The second column lists the research questions that serve as a starting point for the evaluation. The
third column lists the metrics and data elements that will be used for the analysis. The fourth column

Page 25 of 176
lists the data sources from which the required data elements will likely be obtained. The fifth column
describes the analytical approach that will be used to answer the research questions.
Goal 1: Reduce the Number of Uninsured Low Income Indiana Residents and
Increase Access to Healthcare Services HIP 2.0 expands coverage options for hundreds of thousands of currently uninsured Indiana residents.
With additional coverage options available, the rate of uninsured individuals in Indiana should decrease
over the course of the demonstration. Within the first goal, the State, with the assistance of the
evaluation contractor, will analyze five separate hypotheses:
HIP will reduce the number of uninsured Indiana residents with income under 138% FPL over
the course of the demonstration (HIP 2.0 Waiver, Section 5 and STCs, Section XIII, Paragraph 3i).
HIP will increase access to healthcare services among the target population (HIP 2.0 Waiver,
Section 5 and STCs, Section XIII, Paragraph 3ii).
POWER account contributions for individuals in the HIP Plus plan are affordable and do not
create a barrier to healthcare access (STCs, Section XIII, Paragraph 3v).
o Few individuals will experience the lockout period because the policy will deter
nonpayment of POWER account contributions policy for HIP Plus beneficiaries (STCs,
Section XIII, Paragraph 3vi).
Presumptive eligibility (PE) and fast track prepayments will provide the necessary coverage so as
not to have gaps in healthcare coverage (STCs, Section XIII, Paragraph 3vii).
Waiver of non-emergency transportation to the non-pregnant and non-medically frail
population does not pose a barrier to accessing care (STCs, Section XIII, Paragraph 3ix).
1.1. HIP Will Reduce the Number of Uninsured Indiana Residents with Income Under 138%
FPL Over the Course of the Demonstration
Reduction in uninsurance rates has long been a goal for the HIP program. HIP 2.0 will continue to work
to reduce current uninsurance rates in the state; to identify the demonstration’s success in meeting this
goal, the State will evaluate the following research questions:
How many Indiana residents with income under 138% FPL have insurance relative to the total
Indiana resident population and how many have Medicaid/HIP coverage in this population
group?
Are there socio-demographic differences in the health insurance coverage/HIP coverage among
Indiana residents with income under 138% (e.g., differences by age, income)?
What proportion of Indiana residents with income under 138% FPL have had HIP 2.0 coverage at
some point over the course of the year?
Why do members leave HIP and how are they accessing care after leaving HIP?
To address these questions, the evaluation will perform several different analyses. First, the evaluation
will track and describe insurance rates among different populations, based on income and county
and/or region. Using data from the American Community Survey (ACS) or the Current Population Survey

Page 26 of 176
(CPS), the State will analyze health insurance coverage rates by age, county, and income level both
before and after the inception of HIP 2.0. In addition, the State will use enrollment data to evaluate the
number of unique residents enrolled in Medicaid/HIP using both “ever-enrolled” and point in time
definitions. To conduct the analysis, the State will use an Interrupted Time Series (ITS) analysis of trends
in health insurance coverage rates for subpopulations stratified by income level.
The evaluation will consider the socio-demographic differences in health insurance coverage/HIP
coverage among Indiana residents with income under 138% FPL. The State will conduct descriptive
analysis and cross tabulations of socio-demographic characteristics of different populations (enrolled in
HIP Basic, enrolled in HIP Plus, uninsured). The State will also conduct tests for significant differences in
means (t-tests) or distribution (chi-square tests). Further, the State will track the percent of enrollees
with no prior insurance over time.
In addition to tracking uninsurance rates in the state, Indiana will perform an analysis of individuals who
leave HIP to understand their reasons for leaving the program. Departure from the program may be due
to no longer needing public assistance or an eligibility change, in which case the eligibility system may be
sufficient to capture all of the information needed. However, reasons for leaving may be more complex,
and the evaluation will conduct a survey to assess why the individuals left HIP and how they accessed
care after leaving. Understanding where individuals are accessing care will provide insight into the
success of other HIP policies (e.g., individuals leaving after getting a job with insurance through the
Department of Workforce Development [DWD] referral process) and will indicate where and how unmet
healthcare needs are being met, providing an opportunity for State outreach. The State will analyze
previous member (leaver) survey data to create a series of descriptive analyses and logistic regressions
to better understand how individuals access coverage after leaving HIP. At a minimum, covariates in the
logistic regression model will include age group, employment status, and income level. This is further
described in the Survey Analysis Plan in Appendix H.
1.2. HIP will Increase Access to Healthcare Services Among the Target Population
Healthcare access is crucial to improving health outcomes. To identify the program’s success in this aim,
the State will research the following questions:
How do member perceptions of access to healthcare change before and after fully enrolling in
HIP?
How does perceived access to care differ between HIP members and individuals who are eligible
but have not applied and/or enrolled in HIP?
How does access to care differ between HIP 2.0 and HHW members?
Are there geographic areas in Indiana where HIP members lack access to primary or specialty
care?
To understand the differences in member versus previous and non-member perceptions of access to
care, the evaluation will use a series of descriptive analyses and logistic regressions to analyze the
survey data and examine differences in perceptions of access to care, by characteristics such as income
level and employment status. The State may also compare perceptions of access to care among the

Page 27 of 176
following populations: 1) Individuals with current HIP coverage; 2) Individuals with other coverage; and
3) Individuals with no coverage. For more detail on the statistical approach, see the Survey Analysis Plan
in Appendix H. In year two, the evaluation anticipates tracking member feedback for perceived access to
different types of healthcare services before and after enrollment in the HIP program.
In addition to analysis of survey data, the State will use a combination of historical and claims data to
evaluate differences in access to care between HIP 2.0 members and Hoosier HealthWise (HHW)
members. Specifically, the State will compare the change in the number of providers available to HIP 2.0
members to the change in the number of providers available to HHW members, and the change in the
number of providers accepting new members for HIP 2.0 vs. HHW.
As part of this hypothesis, the State will also consider geographic access to care; and will examine HIP
members’ proximity to primary care providers and specialists, across counties. The State will examine
access to primary care providers and specialists relative to access standards established by the Medicaid
program. The state will also consider recognized standards, such as federal definitions of Medically
Underserved Areas and Health Professional Shortage Areas.9
1.3. POWER Account Contributions (PACs) for Individuals in the HIP Plus Plan are Affordable
and Do Not Create a Barrier to Healthcare Access
The evaluation of the previous HIP demonstration showed that an overwhelming number of surveyed
HIP members expressed preference for a set monthly contribution amount over the unpredictable
copayment costs. With the monthly contribution, individuals could include the contribution amount in
their budget calculations and better predict their out-of-pocket healthcare costs. HIP 2.0 has
subsequently applied this cost sharing policy to its HIP Plus benefit plan, requiring HIP Plus members to
contribute approximately two percent10 of their household income to a health savings-like POWER
account in order to stay in the benefit plan. If individuals with household income under 100% FPL fail to
make the contribution, they will be moved to HIP Basic, where they will pay a copayment for each
healthcare service they use. Individuals with household income over 100% FPL who fail to make the
POWER account contribution (PAC) will be subject to a lockout period. Prior to lockout, members will
receive a grace period and reminder notices to ensure they are informed of the policy before it is
implemented.
To address issues of affordability and program lockout, the evaluation will address several research
questions, including:
How many members will be impacted by employers and not-for-profit organizations paying all
or part of their PAC?
How do HIP 2.0 enrollees perceive the affordability of the PAC and non-payment penalties?
How many individuals were never fully enrolled in HIP due to non-payment of the PAC?
How many individuals lost HIP Plus coverage due to non-payment of the PAC?
9 Medically Underserved Areas/Populations (MUA/P) and Health Professional Shortage Areas (HPSA). HHS Health Resources and Services Administration (HRSA). 10 All HIP Plus members are required to contribute at least $1 per month to the POWER account.

Page 28 of 176
How many individuals requested a waiver from the six-month lockout?
How are individuals accessing healthcare if they are locked out due to non-payment of the PAC?
Was the lockout period a deterrent for individuals over 100% FPL to miss a PAC?
Do POWER account contributions present a barrier to initial enrollment in the HIP program?
The evaluation will address these research questions by tracking a series of data points around member
POWER account contributions over the course of the demonstration, including PAC timeliness, the entity
making the PAC, and the number of individuals failing to make the PAC, examining all data elements by
member household income level. The State will use multivariate analysis to describe and compare
members who experience a lock out period for failure to make POWER account contributions,
controlling for confounding factors.
The evaluation will also explore take-up rates for recipients with incomes just under the 100% FPL
threshold – who can obtain some coverage without making contributions – as compared to those with
incomes just above the 100% FPL threshold – who must make a contribution to initiate coverage.
Logistic regression analysis will be conducted on take-up of coverage, controlling for sociodemographic
characteristics.
The State has also developed a series of survey questions that will evaluate member perceptions of the
POWER account contribution requirement, including affordability and the six-month lockout. The survey
will provide information about whether individuals over 100% FPL (identified in Medicaid administrative
data) felt the lockout policy was a deterrent for non-payment, and how individuals who were locked out
of the program for non-payment accessed healthcare during their lockout period. The State will present
cross-tabulations of survey questions that ask respondents about perceived affordability of POWER
accounts, perception of the lockout policy as a deterrent and access to care during lockout, by age,
employment status, and income. These analyses will indicate common perception trends among
members and previous members. The responses, in addition to POWER account data, will also allow for
comparisons of perceptions of PAC among different subpopulations.
HIP also allows employers and not-for-profit agencies to contribute to POWER accounts on behalf of
members. The evaluation will review data sources such as POWER account payment data and member
surveys to identify these third party contributions. The evaluation will conduct descriptive analyses of
the proportion of individuals receiving PAC from employers vs. not-for-profit entities, by entity type, as
well as the average amount paid by contributors, by member income level. The number of POWER
accounts that receive third-party contributions will be compared to the total number of POWER
accounts. POWER account data will be validated prior to use in analysis.
1.4. Presumptive Eligibility (PE) and Fast track Prepayments Will Provide the Necessary
Coverage so as Not to have Gaps in Healthcare Coverage
Presumptive eligibility, while available to several traditional Medicaid populations in the past, has been
expanded to potential HIP enrollees through participating providers. This policy will allow individuals
assessed potentially eligible for HIP to access care before their full HIP application is filed and POWER

Page 29 of 176
account contribution (as applicable) is made to expedite coverage. The policy to accept prepayments is
intended to help potentially eligible individuals reduce their gap in coverage. To assess the impact of
these two policies, the evaluation will address the following research questions:
How does the waiver of retroactive coverage impact uncompensated care costs?
What is the number of PE applications vs. traditional applications?
How many PE members go to HIP Basic vs. HIP Plus?
What proportion of members elected to make fast track prepayments to expedite enrollment in
HIP?
How does utilization of services (time until first use, and use within first several months of
enrollment) differ between those who utilize the fast track payment option and those who do
not?
What are provider perceptions of PE effectiveness? How many members are taking advantage
of other policies that help prevent gaps in coverage, e.g. ex-parte determinations and
prepopulated renewal forms?
The evaluation will first consider whether HIP enrollees used the fast track prepayment option and/or PE
applications and whether or not those policies effectively reduced gaps in coverage. To determine this,
the State will examine metrics such as the percentage of all applications coming through PE, the number
of entities participating in PE, and the number of individuals making fast track payments. These and
other metrics provide a comprehensive snapshot of the uptake of the PE and fast track prepayment
policies. The State will also assess PE and fast track prepayment data longitudinally over the course of
the demonstration to understand changes over time. Additionally, the State will compare the coverage
dates for people that completed PE with fast track; those that completed a standard application and
used fast track; and those that submitted applications without fast track. The State will review how
these different application methods impacted coverage start dates.
Surveys will be used to collect additional information from members and providers, including PE entities.
Provider surveys will provide information about how uncompensated care costs have changed as a
result of HIP 2.0 implementation and providers’ perceptions of the effectiveness of the PE process.
The State will compare utilization between those who make fast track prepayments versus those who
do not to provide insight around coverage start dates to evaluate expanded fast track prepayment
policy. In the analysis the State will attempt to control for potential selection bias between the two
groups (the expedited group may have sought coverage using an expedited method to meet a specific,
immediate medical need whereas the non-expedited group may have had fewer immediate medical
needs, resulting in lower utilization in the first several months of enrollment). Regression techniques
may be employed to control for demographics and other factors.
1.5. Waiver of NEMT to the Non-pregnant and Non-medically Frail Population Does Not Pose
a Barrier to Accessing Care
With a few exceptions (for example, pregnant and medically frail individuals), most HIP 2.0 members will
not be NEMT. The previous HIP demonstration did not provide this benefit and surveys indicated that

Page 30 of 176
this was not a concern to the previous HIP demonstration population. The evaluation will address the
following research questions to verify that the waiver of transportation coverage does not create a
barrier to accessing care. These research questions are listed in the STCs (Section XIII, Paragraph 4):
What is the effect of the NEMT waiver of coverage on missed appointments by income level for
individuals who are neither pregnant nor medically frail?
Are there parts of the state that are more affected by no access to NEMT?
How does not having access to NEMT affect preventive care and overall health outcomes?
What is the impact of no access to NEMT as viewed by the providers and beneficiaries?
To address these questions, the evaluation will rely primarily on survey data from members and
providers. The State will use a series of descriptive analyses and logistic regressions to analyze the
survey data and examine differences in members reporting challenges keeping appointments by
characteristics such as region and income level. Additional data for comparison purposes will be
gathered from HHS Area Health Resources Files (ARHF).11
The State will not use HIP members who receive NEMT as a comparison group for this analysis because
of the differences between members eligible for NEMT and members who are not eligible for NEMT. HIP
members who receive NEMT include: low-income caregivers, Transitional Medical Assistance (TMA)
individuals, low income 19 and 20 year olds, pregnant women, and the medically frail, all of whom
historically have more complex health needs than the general HIP 2.0 population. A meaningful
comparison between these two populations (eligible for NEMT vs. not eligible for NEMT) would require
controlling for multiple characteristics, for example health status, income, and geography. An initial
analysis would also have to yield “cells” that are sufficiently large to permit sound comparisons. The
State will also need to consider other sources of bias, such as whether MCE participation is evenly
distributed geographically, which would make it difficult to control for geography when comparing the
two populations. The state will also review the data by health plan as some plans may offer NEMT as a
benefit.
The following table includes the hypothesis(es), research questions, metrics, data sources, and analytic
approaches that will be used to assess Goal 1. Hypotheses, research questions, and metrics are aligned
in the table to depict how they will inform the hypotheses and goals. The items in blue font represent
the “key” hypotheses, research questions, and metrics needed to assess whether a goal has been
achieved. Cells written in italics and shaded orange are requirements from the STCs and/or HIP 2.0
waiver. Metrics were identified as either Outcome [O] or Process [P] measures.
11 Area Health Resources Files (ARHF). HHS Health Resources and Services Administration (HRSA).

Page 31 of 176
Goal 1 Summary Evaluation Table
# Hypothesis Research Questions Metric Data Source Analytic Approach
Goal 1: Reduce the number of uninsured low income Indiana residents and increase access to healthcare services.
1.1 HIP will reduce the number of uninsured Indiana residents with income under 138% FPL over the course of the demonstration (HIP 2.0 Waiver, Section 5 and STCs, Section XIII, Paragraph 3i).
1. How many Indiana residents with income under 138% FPL have insurance relative to the total Indiana resident population and how many have Medicaid/HIP coverage in this population group?
HIP Take up Rate: Total # enrolled in HIP divided by the estimated # eligible for HIP. Where cell size permits, show by county. [O]
Enrollment Data and American Community Survey/Current Population Survey
Health insurance coverage rates by age, by county, and by income level pre and post HIP 2.0 [O]
American Community Survey/Current Population Survey
Interrupted Time Series (ITS) Analysis of trends in health insurance coverage rates for subpopulations stratified by income level. o Under 138% FPL; o 100-138% FPL; and o Under 100% FPL. - ITS on Medicaid/HIP enrollment counts for different subpopulations - Track HIP take up rates over time
Total health insurance coverage estimates (all ages, counties, and income levels) pre and post HIP 2.0 [O]
American Community Survey/Current Population Survey
# of Indiana residents enrolled in Medicaid/HIP using both "ever-enrolled” and point in time definitions divided by the number of eligibles [O]
Enrollment Data
2. Are there socio-demographic differences in the health insurance coverage/HIP coverage among Indiana residents with income under 138% (e.g., differences by age, education, income, etc.)?
Total # enrolled by income level and HIP Plus and HIP Basic plan [O]
Enrollment Data Descriptive analysis on socio-demographic characteristics of different populations (enrolled in HIP, enrolled in HIP-plus, uninsured). Tests for significant differences in means (t-tests) or distribution (chi-square tests)
Total # of enrollments for the demonstration year
Total # enrolled by income level and HIP Plus and HIP Basic plan [O]
Total # enrolled by race and HIP Plus and HIP Basic plan [O]

Page 32 of 176
# Hypothesis Research Questions Metric Data Source Analytic Approach
Goal 1: Reduce the number of uninsured low income Indiana residents and increase access to healthcare services.
Total # enrolled, by sex/gender and HIP Plus and HIP Basic plan [O]
Total # enrolled, by age and HIP Plus and HIP Basic plan [O]
Total # enrolled per month, by county and HIP Plus and HIP Basic plan [O]
Total # residents with income below 138% FPL, by race and source of coverage [P]
American Community Survey/Current Population Survey
Cross-tabulation, tests on difference in means.
Total # residents with income below 138% FPL, by sex/gender source of coverage [P]
Total # residents with income below 138% FPL, by age and source of coverage [P]
Total # residents with income below 138% FPL, by county and source of coverage [P]
3. What proportion of Indiana residents with income under 138% FPL have had HIP 2.0 coverage at some point over the course of the year?
Total # and % of Indiana residents with household income below 138% FPL enrolled in HIP 2.0 at any point in the past year [O]
Enrollment Data
Total # Indiana residents with household income below 138% FPL [P]
American Community Survey/Current Population Survey
4. Why do members leave HIP and how are they accessing care after leaving HIP?
Length of time individuals enrolled in HIP 2.0 [O]
Enrollment Data Survival analysis on time enrolled in the program; covariates may include age, gender, race and other socio-demographic characteristics
Reason for leaving HIP 2.0 [P] Previous Member Survey Data Cross-tabulations of survey questions that ask respondents about insurance reasons for leaving HIP, by age, employment status, and income.

Page 33 of 176
# Hypothesis Research Questions Metric Data Source Analytic Approach
Goal 1: Reduce the number of uninsured low income Indiana residents and increase access to healthcare services.
How individuals access coverage after leaving HIP [P]
Member and Previous Member Survey Data
Cross-tabulations of survey questions that ask respondents about insurance coverage after HIP, by age, employment status, and income.
1.2 HIP will increase access to healthcare services among the target population (HIP 2.0 Waiver, Section 5 and STCs, Section XIII, Paragraph 3ii).
1. How do member perceptions of access to healthcare change before and after fully enrolling in HIP?
% of members who report having a usual source of care [O]
Members and non-member survey data
Measure member health plan satisfaction indicators: Use a series of descriptive analyses and logistic regressions to analyze the survey data and examine differences in member and non-member perceptions of access to care by characteristics such as income level and employment status. In year two, the evaluation anticipates tracking member feedback for perceived access to different types of healthcare services before and after enrollment in the HIP program. Comparison Groups: Previous members: Former HIP members Non-members: Individuals who were determined presumptively eligible but never completed a full application and those never made their first PAC. The State may also compare the perceptions of access to care among: 1. Individuals with current HIP coverage
Measure of ability to obtain primary care visit [O]
Members and non-member survey data
Measure of ability to obtain specialty care visit [O]
Members and non-member survey data
Measure of ability to obtain a prescription [O]
Members and non-member survey data
Rating of plan overall [P] CAHPS survey

Page 34 of 176
# Hypothesis Research Questions Metric Data Source Analytic Approach
Goal 1: Reduce the number of uninsured low income Indiana residents and increase access to healthcare services.
Ability to get needed care quickly [O]
CAHPS survey 2. Individuals with other coverage 3. Individuals with no coverage
Provider communication [P] CAHPS survey
Coordination of care [P] CAHPS survey
Other relevant CAHPS indicators [P] CAHPS survey
% of members who report having a usual source of care [O]
Members and non-member survey data
2. How does perceived access to care differ between HIP members and individuals who are eligible but have not applied and/or enrolled in HIP?
Measure of ability to obtain primary care visit [O]
Members and non-member survey data
Measure of ability to obtain specialty care visit [O]
Members and non-member survey data
Measure of ability to obtain a prescription [O]
Members and non-member survey data
3. How does access to care differ between HIP 2.0 and HHW members?
Change in # of providers available to HIP 2.0 members vs. Hoosier HealthWise (HHW) members [P]
Historical data and current claims data (for PCP, OB/GYN, most commonly used adult specialty providers)
Descriptive analysis of access to providers for HIP 2.0 members vs. HHW members. Comparison of network adequacy measures across counties.
Change in # of providers accepting new HIP 2.0 members vs. HHW [O]
Administrative data, including network and geo-access data. Historical data and current claims data (for PCP, OB/GYN, most commonly used adult specialty providers)
Change in time to access care for HIP 2.0 members vs. HHW [O]
Historical data and current claims data (for PCP, OB/GYN, most commonly used adult specialty providers)
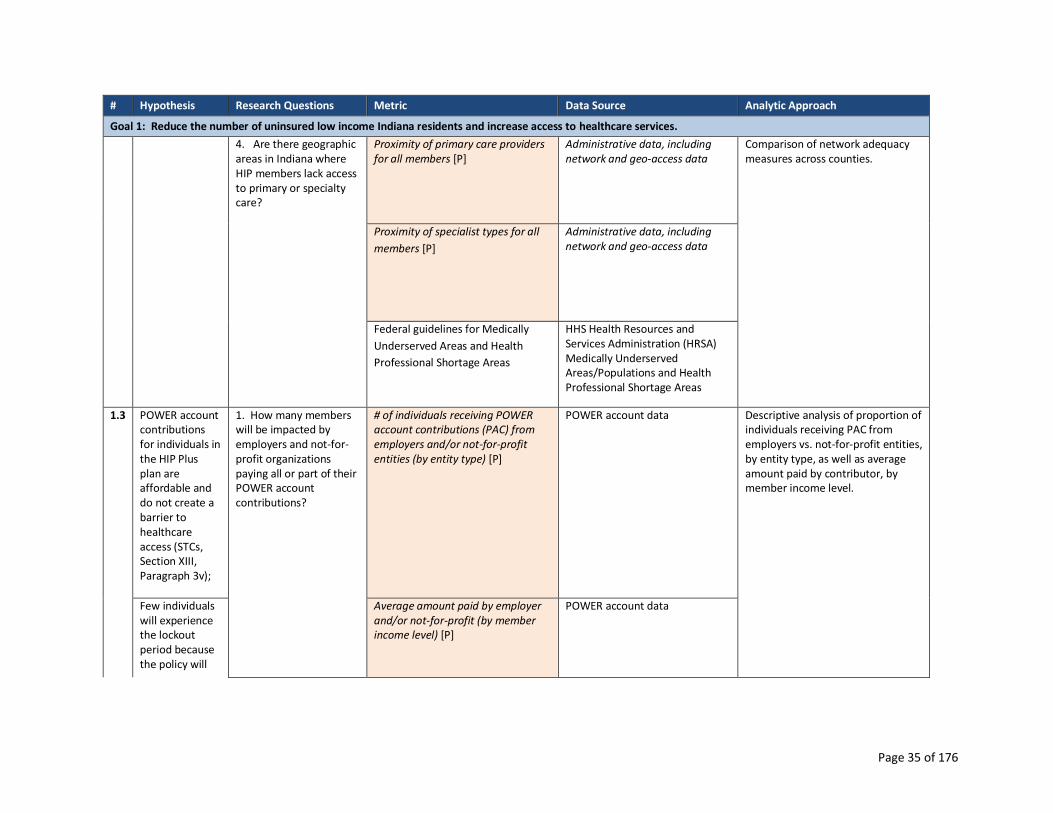
Page 35 of 176
# Hypothesis Research Questions Metric Data Source Analytic Approach
Goal 1: Reduce the number of uninsured low income Indiana residents and increase access to healthcare services.
4. Are there geographic areas in Indiana where HIP members lack access to primary or specialty care?
Proximity of primary care providers for all members [P]
Administrative data, including network and geo-access data
Comparison of network adequacy measures across counties.
Proximity of specialist types for all
members [P]
Administrative data, including network and geo-access data
Federal guidelines for Medically
Underserved Areas and Health
Professional Shortage Areas
HHS Health Resources and Services Administration (HRSA) Medically Underserved Areas/Populations and Health Professional Shortage Areas
1.3 POWER account contributions for individuals in the HIP Plus plan are affordable and do not create a barrier to healthcare access (STCs, Section XIII, Paragraph 3v);
1. How many members will be impacted by employers and not-for-profit organizations paying all or part of their POWER account contributions?
# of individuals receiving POWER account contributions (PAC) from employers and/or not-for-profit entities (by entity type) [P]
POWER account data Descriptive analysis of proportion of individuals receiving PAC from employers vs. not-for-profit entities, by entity type, as well as average amount paid by contributor, by member income level.
Few individuals will experience the lockout period because the policy will
Average amount paid by employer and/or not-for-profit (by member income level) [P]
POWER account data

Page 36 of 176
# Hypothesis Research Questions Metric Data Source Analytic Approach
Goal 1: Reduce the number of uninsured low income Indiana residents and increase access to healthcare services.
deter nonpayment of POWER account contributions policy for HIP Plus beneficiaries (STCs, Section XIII, Paragraph 3vi).
2. How do HIP 2.0 enrollees perceive the affordability of the PAC and non-payment penalties?
Perception of ability to make POWER account contribution [P]
Member and non-member survey data
Cross-tabulations of survey questions that ask respondents about perceived affordability of POWER accounts, by age, employment status, geography, health status, income and HIP status (Basic, Plus, previous member).
Perceived affordability of the PAC, by income level [P]
Member and non-member survey data
3. How many individuals were never fully enrolled in HIP due to non-payment of the PAC?
# individuals approved for HIP and over 100% FPL who do not pay first PAC [P]
POWER account data Track rates and counts over time. Track waiver requests and percentage granted. Use multivariate analysis to describe and compare members who experience a lockout period for failure to make POWER account contributions, controlling for confounding factors.
Rate of non-payment of PAC, by FPL [O]
POWER account data
4. How many individuals lost HIP Plus coverage due to non-payment of the PAC?
# individuals subjected to 6 mo. lockout, by FPL [O]
Member eligibility data
Rate of disenrollment for failure to pay PAC [O]
Member eligibility data
Total # individuals disenrolled (for any reason) by income level [O]
Member enrollment data
Reasons for non-payment of PAC [P] Member and non-member survey
data
Timing of eligibility change due to non-payment (transition to Basic or lockout), by # of months paid and by month in the year [P]
POWER account data
# of months PAC paid, average per member [P]
POWER account data
# individuals with overdue PAC [P] POWER account data
# individuals requesting waiver of lockout [P]
Administrative data

Page 37 of 176
# Hypothesis Research Questions Metric Data Source Analytic Approach
Goal 1: Reduce the number of uninsured low income Indiana residents and increase access to healthcare services.
5. How many individuals requested a waiver from the six month lockout?
# individuals meeting qualifying event criteria and granted waiver of lockout [P]
Member eligibility data
6. How are individuals accessing healthcare if they are locked out due to non-payment of the PAC?
Individual healthcare needs during lockout period, by income level [P]
Member and non-member survey data
Cross-tabulations of survey questions that ask respondents about access to care during the lockout period by age, employment status, and income.
How healthcare needs addressed during lockout period, by income level [P]
Member and non-member survey data
7. Was the lockout period a deterrent for individuals over 100% FPL to miss a PAC?
Member aware of non-payment penalties? (Y/N) [P]
Member and non-member survey data
8. Do POWER account contributions present a barrier to initial enrollment in the HIP program?
# individuals subject to PAC (by income level) [P]
POWER account data Logistic regression on take-up of coverage, controlling for socio-demographic characteristics. Comparison group: Eligible individuals with income just above 100% FPL
# individuals exempted from PAC (Pregnant Women, American Indians) [P]
Member eligibility data
Survey responses to questions about affordability of HIP
Member survey, Previous Member survey, Never Member survey
Coverage take-up rate for residents who can obtain some coverage without making contributions (individuals under 100%FPL enrolled
Member Enrollment data, by income level

Page 38 of 176
# Hypothesis Research Questions Metric Data Source Analytic Approach
Goal 1: Reduce the number of uninsured low income Indiana residents and increase access to healthcare services.
in HIP Basic), as compared to those who must make a contribution to initiate coverage (individuals over 100%FP enrolled in HIP Plus). [P]
1.4 Presumptive eligibility (PE) and fast track prepayments will provide the necessary coverage so as not to have gaps in healthcare coverage (STCs, Section XIII, Paragraph 3vii).
1. How does the waiver of retroactive coverage impact uncompensated care costs?
Unreimbursed retroactive service costs for Section 1931 group transitioning to HIP [P]
Member and provider survey data on retroactive coverage for Section 1931 group transitioning to HIP
Track presumptive eligibility and fast track prepayments over the course of the demonstration. Use univariate and bivariate analysis to describe avoidance of coverage gaps through PE and fast track prepayments. Compare utilization between those who make fast track prepayments versus those who do not, controlling for demographics and other factors. Use a series of descriptive analyses of provider surveys to show the differences in provider perceptions of the effectiveness of the presumptive eligibility process.
Provider perceptions concerning cost of uncompensated care
Survey data - Providers
Level of uncompensated care [O] Survey data - Providers
2. What is the number of PE applications vs. traditional applications?
% of all applications coming through PE [O]
Member eligibility data
% of eligibility determinations following PE period vs. determinations on all applications[P]
Member eligibility data
# entities participating in PE (by type, # of PE applications filed, # full apps filed, # determined eligible, by entity) [P]
Enrollment data
% of potentially qualifying entities trained and participating in HIP 2.0 PE assessment (not counting entities that have refused or not responded to opportunities to participate) [P]
Enrollment data

Page 39 of 176
# Hypothesis Research Questions Metric Data Source Analytic Approach
Goal 1: Reduce the number of uninsured low income Indiana residents and increase access to healthcare services.
3. How many PE members go to HIP Basic vs. HIP Plus?
# of PE-eligible individuals enrolling in HIP Plus vs. HIP Basic, by income [O]
Enrollment data
4. What proportion of members elected to make fast track prepayments to expedite enrollment in HIP?
# of PE individuals making fast track payments [P]
Administrative data
Average # of days between submission of app and eligibility determination [P]
Member eligibility data
Average # of days between eligibility determination and HIP 2.0 plan enrollment, by payment of PAC or 60-day default into HIP Basic for members under 100% FPL [P]
Member eligibility data
# of individuals making fast track payments, by FPL [P]
Member Enrollment data, by income level
Timing of fast track payment submission [P]
Member Enrollment data, by income level
5. How does utilization of services (time until first use, and use within first several months of enrollment) differ between those who utilize the fast track payment option and those who do not?
Service utilization (primary care vs. specialty care vs. emergency care), by fast track utilization (yes/no), by income [0]
Claims/Enrollment data
6. What are provider perceptions of PE effectiveness?
Perceptions of the effectiveness of the PE process [P]
Survey data - PE providers
Length of PE period before making PAC, by FPL [P]
Enrollment data
7. How many members are taking advantage of other policies that prevent gaps in coverage, e.g. ex-parte determinations and
# of individuals determined eligible using ex parte [P]
Member eligibility data
# of individuals receiving prepopulated renewal form [P]
Member eligibility data
# of individuals responding to prepopulated renewal form [P]
Member eligibility data

Page 40 of 176
# Hypothesis Research Questions Metric Data Source Analytic Approach
Goal 1: Reduce the number of uninsured low income Indiana residents and increase access to healthcare services.
prepopulated renewal forms?
# of responders determined eligible [P]
Member eligibility data
# of individuals who reapply within (a) 90 days or less, (b) 6 months, (c) 1 year, following a termination for failure to respond [P]
Member eligibility data
1.5 Waiver of non-emergency transportation to the non-pregnant and non-medically frail population does not pose a barrier to accessing care (STCs, Section XIII, Paragraph 3ix).
1a. What is the effect of the NEMT waiver of coverage on missed appointments by income level for individuals who are neither pregnant nor medically frail? 1b. Are there parts of the state that are more affected by no access to NEMT?
% of respondents reporting challenges in keeping appointments due to lack of transportation, by income level and by county [O]
Member survey data The evaluation will include a series of descriptive analyses and logistic regressions to analyze the survey data and examine differences in members reporting challenges keeping appointments by characteristics such as region and income level.
Specifically, the State will create cross-tabulations of survey questions that ask respondents if they have missed any appointments and reasons why appointments were missed by age, gender, region, income level, availability of public transportation and number of physicians per 1000 population.
Demographic information from eligibility data (member age, gender, income, location) [Covariate]
Eligibility data
Number of physicians per 1,000 population for member’s region of residence [Covariate]
HHS Area Health Resources Files
Data on public transportation services for member’s region of residence [Covariate]
Public data on availability of public transport
2. How does not having access to NEMT affect preventive care and overall health outcomes?
Perceptions about impact of access to NEMT [O]
Provider and Member survey data, using questions from the previous HIP demonstration survey
3. What is the impact of no access to NEMT as viewed by the providers and beneficiaries?
% of respondents reporting challenges in keeping appointments due to lack of transportation, by income level and by county [O]
Member survey data
Perceptions about impact of access to NEMT [O]
Provider and Member survey data, using questions from the previous HIP demonstration survey

Page 41 of 176
Goal 2: Promote Value-based Decision Making and Personal Health
Responsibility One of HIP’s principle aims is to foster members’ sense of personal responsibility by encouraging
positive health behaviors and financial responsibility.
1. HIP policies will 1) encourage member compliance with required contributions and 2) provide
incentives to actively manage POWER account funds (HIP 2.0 Waiver, Section 5).
HIP policies surrounding rollover and preventive care will encourage beneficiaries’
compliance with required contributions and provide incentives to actively manage
POWER account funds (STCs, Section XIII, Paragraph 3viii).
2. HIP Plus members will exhibit more cost-conscious healthcare consumption behavior than: a)
HIP Basic members; and b) traditional Hoosier Healthwise members in the areas of primary,
specialty, and pharmacy service utilization without harming beneficiary health (HIP 2.0 Waiver,
Section 5 and STCs, Section XIII, Paragraph 3iv).
3. HIP’s (i) graduated copayments required for non-emergency use of the emergency department
(ED), (ii) ED prior authorization process, and (iii) efforts to expand access to other urgent care
settings will together effectively deter inappropriate ED utilization without harming beneficiary
health (HIP 2.0 Waiver, Section 5).
The graduated copayment structure for non-emergency use of the emergency
department will decrease inappropriate ED utilization without harming beneficiary
health (STCs, Section XIII, Paragraph 3x).
The prior authorization process for hospital emergency department use and efforts to
expand access to other urgent care settings will decrease inappropriate ED utilization
without harming beneficiary health (STCs, Section XIII, Paragraph 3xi).
2.1. HIP Policies will Encourage Member Compliance with Required Contributions and
Provide Incentives to Actively Manage POWER Account Funds
HIP Plus members have several incentives to continue making their required POWER account
contributions and manage their POWER account funds well, including access to an enhanced benefits
package that includes vision and dental coverage, the ability to roll over remaining POWER account
contributions to reduce future contributions and to increase that rollover by accessing preventive care.12
To assess the impact of HIP Plus incentives and the disincentives, the evaluation will analyze:
What proportion of members make POWER account payments on time? What proportion of
members move from HIP Plus to HIP Basic due to non-payment?
How many members are subject to collection due to non-payment of PAC?
Are providers complying with HIP policies (e.g. charging copayments to HIP Basic members)?
12 Members may reduce future HIP Plus POWER account contributions by rolling over funds from their PAC from the previous year. If Plus members complete required preventive services, they can double the amount of their rollover, up to 100% of the contribution amount. Basic members are only eligible to reduce their required annual contributions if they receive preventive care and they can only reduce their required contribution by half.

Page 42 of 176
Are members actively managing their POWER accounts (to be measured after year 1)?
What are the differences in utilization behaviors for individuals who are receiving rollover vs.
those who do not? How are these variables impacted by member income level? Are there
differences in utilization and POWER account management among members related to health
status, (e.g., diabetes, other chronic diseases)?
Are there differences in utilization and POWER account management between individuals
paying a PAC and those who do not?
The evaluation will build on the data collected around compliance with PAC payment rates in Goal 1.
The State will also consider data on any incentives for healthy behaviors MCEs provide to HIP members.
A combination of descriptive analyses and multivariate logistic regressions will be used to address
whether HIP policies will encourage member compliance with required contributions and provide
incentives to actively manage POWER account funds. The State will conduct a descriptive analysis of
rates of transition from Plus to Basic due to non-payment of POWER account contributions (PAC), rates
of provider copayment collection, by provider type, and percentage of members regularly checking their
POWER account balance, by Basic vs. Plus plan enrollment. Logistic regression will be used to estimate
the probability of utilizing care (any/none or high/low), while controlling for confounding demographic
factors and health status (as determined by a Medically Frail Indicator that is documented and verified
in the administrative data or a risk score derived from claims data). Logistic regression will also be used
to estimate the probability of making a PAC payment, while controlling for confounding demographic
factors and health status.
The evaluation will track the timeliness of POWER account contributions over the course of the
demonstration for the total HIP Plus member group, those with income over 100% FPL, and those with
income under 100% FPL. To address this, the State will create a binary indicator of timeliness of POWER
account contributions and conduct logistic regression analysis assessing timeliness by income level for
individuals with a household income over 100% FPL, and for those with income under 100% FPL.
The evaluation will also compare HIP POWER account balances across different member groups,
including 1) HIP Plus members, 2) HIP Basic members, 3) HIP members transitioning from traditional
Medicaid to HIP (e.g. Section 1931 low-income parents and caretakers), and 4) Medically Frail. In
addition, the evaluation will also consider HIP Basic members transitioning to HIP Plus, focusing on the
average amount by which required contributions are discounted for the transition to HIP Plus at
redetermination.
Among HIP Plus members, the evaluation will also use POWER account administrative data to review
POWER account rollover rates and the distribution by which contributions are reduced in the next
benefit period for base rollovers (100% of member pro-rata share of balance) and preventive care
rollovers (200% of member pro-rata share of balance).13 This will be reported after at least one year of
13 HIP Plus members who consistently contribute to their POWER account during the plan year are eligible to roll-over the member’s unused share of the POWER account balance. The member’s unused share of the POWER account is calculated by multiplying the amount of the member’s required annual contribution plus amounts rolled over from previous coverage terms

Page 43 of 176
program operations to allow time for rollovers to occur. One year of program operations will also need
to occur before the State can report the number of POWER accounts with a balance at the end of a
benefit period.
2.2. HIP Plus Members will Exhibit More Cost-conscious Healthcare Consumption Behavior
than: a) HIP Basic Members; and b) Traditional Hoosier Healthwise Members in the Areas of
Primary, Specialty, and Pharmacy Service Utilization Without Harming Beneficiary Health
At the core of effective POWER account management lies cost-conscious healthcare consumption
behaviors. Given the additional incentives for HIP Plus members to practice these behaviors, the
evaluation will compare the healthcare utilization of HIP Plus members to other populations by
analyzing the following questions:
Are HIP Plus members more likely to exhibit cost-conscious consumption behavior, e.g.
prescription drug adherence, primary care vs. specialty care use, chronic disease management,
appropriate use of the ED, generic vs. brand name medication use? In what area(s)?
Are HIP Plus members less likely to reach the 5 percent of household income limit (threshold) on
out-of-pocket costs?
Do HIP Plus members ask about the cost of care before receiving the care? (Data obtained
through surveys)
Do HIP Plus members ever resist getting needed care because of the cost of that care? (Data
obtained through surveys)
To address these research questions, the evaluation will measure utilization and variances in a variety of
service types and settings, including care delivered as primary care, specialty care, emergency
department, and urgent care, which are the areas of care where recipients will have the most
influence/choice. Generic prescription fill rates will also be evaluated, but generic versus brand is
usually a decision of the prescribing physician more than the recipient.
To further refine the study of utilization trends within the HIP 2.0 member population, the evaluation
will compare utilization patterns with other populations that do not share the same incentive policies
offered by HIP 2.0. Example comparison groups may include previous HIP demonstration members and
traditional Medicaid members transitioning to HIP 2.0.
Finally, to measure potential harm from obtaining too few primary care services, the State will assess
the incidence of ambulatory care sensitive (ACS) admissions and non-emergent emergency department
visits as key outcome measures. The evaluation will also assess 30-day readmission rates and follow-up
within 7 days after hospital discharge for a mental health condition.
2.3. HIP’s (i) Graduated Copayments Required for Non-emergency Use of the Emergency
Department (ED), (ii) ED Prior Authorization Process, and (iii) Efforts to Expand Access to
divided by $2,500 by the remaining balance in the POWER account. If a HIP Plus member receives all recommended preventive care services during the plan year, the member will be eligible to have their unused share doubled.

Page 44 of 176
Other Urgent Care Settings will Together Effectively Deter Inappropriate ED Utilization
Without Harming Beneficiary Health
To discourage non-emergency use of the emergency department (ED), the State is implementing a
graduated copayment, costing $8 for the first non-emergency visit and $25 for subsequent non-
emergency visits. To triage potential urgent care needs, HIP 2.0 is utilizing a Nurse Hotline to serve as a
prior authorization process and is working to expand access to alternative urgent care settings as an
alternative to the ED. To assess the effectiveness of this policy and ensure that beneficiary health is not
compromised, the State will create a control group, as specified by the STCs, which will only have the $8
copay obligation, regardless of the number of non-emergency ED visits. The State will compare ED,
primary care, and urgent care utilization across members, tracking based on participation in the control
group or graduated copay group. In addition, the evaluation will consider the following research
questions:
What is the rate of non-emergency use of the ED among individuals in the control group vs. the
graduated copay group?
What portion of individuals calling the Nurse Hotline are recommended to go to the ED and
what portion of individuals use the ED in spite of the Nurse Hotline advising a different course of
action?
What portion of individuals are accessing urgent care settings outside of the ED?
Are providers complying with HIP policies, e.g. charging copayments to HIP Basic members?
To assess how the graduated copayment policy impacts health behaviors, the evaluation will compare
annual rates of non-emergency ED utilization between HIP 2.0 members in the graduated copay group
and the control group. Claims data will also be used to compare annual rates of alternative urgent care
setting utilization (e.g. retail clinics) before and after the graduated copayment policy effective date; and
administrative data will provide information about the individuals seeking prior authorization via the
Nurse Hotline, including the number of individuals calling the hotline, the number of individuals
approved for ED care, and the number denied. Administrative data will be combined with claims data to
assess how many individuals calling the Nurse Hotline went to the ED—with or without prior
authorization.
In addition to claims data, member surveys will gather data on whether the copayment for non-
emergency use of the ED caused members to seek services with their primary care physician or in an
alternative urgent care setting. Provider surveys will offer information on ED copayment collection rates
and policies. Further, the evaluation will address the graduated copayment policies and associated
impact on member behaviors following the start of the program.
The following table includes the hypothesis(es), research questions, metrics, data sources, and analytic
approaches the State will use to assess Goal 2. Hypotheses, research questions, and metrics are aligned
in the table to depict how they will inform the hypotheses and goals. The items in blue font represent
the “key” hypotheses, research questions, and metrics needed to assess whether a goal has been

Page 45 of 176
achieved. Cells written in italics and shaded orange are requirements from the STCs and/or HIP 2.0
waiver. Metrics were identified as either Outcome [O] or Process [P] measures.

Page 46 of 176
Goal 2 Evaluation Approach Summary
# Hypothesis Research Questions Metric Data Source Analytic Approach
Goal 2: Promote value-based decision making and personal health responsibility.
2.1 HIP policies will encourage member compliance with required contributions (HIP 2.0 waiver, Section 5).
1. What proportion of members make POWER account payments on time? What proportion of members move from HIP Plus to HIP Basic due to non-payment?
# and % transitioned from HIP Plus to HIP Basic due to non-contribution [O]
Enrollment data Descriptive analysis of rates of transition from Plus to Basic due to non-payment of POWER account contributions (PAC). Create a binary indicator of timeliness of POWER account contributions and conduct logistic regression assessing timeliness by income, for individuals over 100 percent FPL, and those with income under 100 percent FPL.
# and % of members making initial POWER account contribution, total and within allowed time [O]
Administrative data
Total enrollment by HIP Plus vs. HIP Basic plan [P]
Enrollment data
# enrolled in HIP Basic who enroll in HIP Plus later [P]
Enrollment data
Total enrollment in HIP Plus, by income (above and below 100% FPL) [P]
Enrollment data
# and % locked out due to non-contribution of PAC [O]
Administrative data
2. How many members are subject to collection due to non-payment of PAC?
MCO collection activities: # individuals subject to collection, amounts due, amounts paid (STCs Sec. VIII, Paragraph 5f)
MCE Data Descriptive analysis of rates of provider copayment collection rates, by provider type.
3. Are providers complying with HIP policies, e.g. charging copayments to HIP Basic members?
% of HIP patients for which providers report regularly collecting copayments [P]
Provider survey data Descriptive statistics on percentage of members who report regularly checking their POWER Account balance, by Basic vs Plus. Describe HIP POWER account balances across different member groups, including 1) HIP Plus members, 2) HIP Basic members, 3) HIP members transitioning from traditional Medicaid to HIP (e.g. Section 1931 low-income parents and caretakers), and 4) Medically Frail. Sub analyses will assess outcomes across additional subpopulations (demographic groups).
Copayment collection rates [P] Provider survey data
Copayment collection policies [P] Provider survey data

Page 47 of 176
# Hypothesis Research Questions Metric Data Source Analytic Approach
Goal 2: Promote value-based decision making and personal health responsibility.
Among HIP Basic members transitioning to HIP Plus, track the average amount by which required contributions are discounted for the transition to HIP Plus at redetermination. Among HIP Plus members, review POWER account rollover rates and the distribution by which contributions are reduced in the next benefit period for base rollovers and preventive care rollovers.
HIP policies will provide incentives to actively manage POWER account funds (HIP 2.0 waiver, Section 5).
4. Are members actively managing their POWER accounts?
Percentage of members who regularly check their POWER Account balance
Member survey data Logistic regression will be used to estimate the probability of utilizing care (any/none or high/low), while controlling for confounding demographic factors and health status (as determined by a Medically Frail Indicator that is documented and verified in the administrative data or a risk score derived from claims data).
% of POWER accounts that have a balance at the end of a benefit period [O]
Administrative data
Average POWER account balance amount at the end of the benefit period [O]
Administrative data
Percentage of HIP Plus members that have a POWER account balance at the end of the benefit period [O]
Administrative data
Total # enrolled by income level, race, gender/sex, and age [O]
Enrollment Data
POWER Account debts (STCs, Section VIII, Paragraph 5g)
MCE data
5. Are there differences in utilization and POWER
Medically Frail Status [P] or risk score derived from procedure
Enrollment data or claims data

Page 48 of 176
# Hypothesis Research Questions Metric Data Source Analytic Approach
Goal 2: Promote value-based decision making and personal health responsibility.
account management among members related to health status, (e.g., diabetes, or other chronic diseases)?
codes, revenue codes and diagnosis codes [O]
% and amount of individuals receiving incentives for healthy behaviors, by MCE and by income and by HIP Plus vs. HIP Basic plan [O]
MCE incentive data
% of POWER accounts that have a balance at the end of a benefit period [O]
Administrative data
Average POWER account balance amount at the end of the benefit period [O]
Administrative data
Percentage of HIP Plus members that have a POWER account balance at the end of the benefit period [O]
Administrative data
Rate of primary care use, by income and by HIP Plus vs. HIP Basic plan [O]
Claims data
Prior authorization requests to provide context on any differences in utilization [P]
Claims data
Rate of specialty care use, by income and by HIP Plus vs. HIP Basic plan [O]
Claims data
Rate of generic medicine use vs. brand name, by income and by HIP Plus vs. HIP Basic plan [O]
Claims data
Rate of ED use, by income and by HIP Plus vs. HIP Basic plan and by number of visits [O]
Claims data
HIP policies surrounding rollover and preventive care will encourage beneficiaries’ compliance with required
6. Are there differences in utilization and POWER account management between individuals paying a PAC and those who do not? How are these variables
% and amount of individuals receiving incentives for healthy behaviors, by MCE and by income and by HIP Plus vs. HIP Basic plan [O]
MCE incentive data Logistic regression will be used to estimate the probability of making a PAC payment, while controlling for confounding demographic factors and health status.
% of POWER accounts that have a balance at the end of a benefit period [O]
Administrative data

Page 49 of 176
# Hypothesis Research Questions Metric Data Source Analytic Approach
Goal 2: Promote value-based decision making and personal health responsibility.
contributions and provide incentives to actively manage POWER account funds (STCs, Section XIII, Paragraph 3viii).
impacted by member income level?
Average POWER account balance amount at the end of the benefit period [O]
Administrative data
Percentage of HIP Plus members that have a POWER account balance at the end of the benefit period [O]
Administrative data
Rate of primary care use, by income and by HIP Plus vs. HIP Basic plan [O]
Claims data
Prior authorization requests [P] Claims data
Rate of specialty care use, by income and by HIP Plus vs. HIP Basic plan [O]
Claims data
Rate of generic medicine use vs. brand name, by income and by HIP Plus vs. HIP Basic plan [O]
Claims data
Rate of ED use, by income and by HIP Plus vs. HIP Basic plan and by number of visits [O]
Claims data
Risk score derived from procedure codes, revenue codes and diagnosis codes
Claims data
2.2 HIP Plus members will exhibit more cost-conscious healthcare consumption behavior than: a) HIP Basic members; and b) traditional Hoosier HealthWise members in the areas of primary,
1. Are HIP Plus members more likely to exhibit cost-conscious consumption behavior, e.g. prescription drug adherence, primary care vs specialty care use, chronic disease management, appropriate use of the ED, and generic vs. brand name medication use? In what area(s)?
# and % of individuals using the ED for non-emergency services, by HIP Plus vs. HIP Basic plan vs. HHW [O]
Claims data Track health service utilization rates for following groups, controlling for health status, age, and other relevant variables: • HIP Plus members; • HIP Basic members; • Section 1931 Group; • Medically Frail Track service utilization by income and benefit plan (HIP Plus vs. HIP Basic) for generic vs. brand name medications, primary care vs. specialty care utilization
Primary care encounters vs. specialty care [O]
Claims data
Preventive service codes [P] Claims data
Pharmacy (overall costs, brand vs. generic dispensing rate) [O]
Claims data
% of individuals using specialty care for chronic disease care, by HIP Plus vs. HIP Basic plan vs. medically frail
Claims data
% of individuals accessing chronic disease management services (if chronic disease present), by HIP Plus vs. HIP Basic plan [O]
Claims data

Page 50 of 176
# Hypothesis Research Questions Metric Data Source Analytic Approach
Goal 2: Promote value-based decision making and personal health responsibility.
specialty, and pharmacy service utilization without harming beneficiary health.
# of unique individuals accessing preventive services, by income [O]
Claims data Use multivariate analysis (linear or logistic, depending on the nature of the outcome, e.g. odds of unnecessary ED visits=logistic vs. # of unnecessary ED visits = linear) to describe and compare the utilization patterns of HIP Plus members versus HIP Basic and traditional Hoosier HealthWise members. Multivariate regression will allow us to control for confounders. Use difference in difference analysis to compare populations transitioning from traditional Medicaid to HIP, e.g. Section 1931 members, looking at costs before and after transition, for HIP Basic vs HIP Plus members. Comparison Groups: HIP Basic members and HHW members Traditional Medicaid members who transitioned to HIP
# of preventive care visits, total and average per person, by income [O]
Claims data
# of specialty care visits, total and average per person, by income [O]
Claims data
# of unique individuals accessing specialty care [O]
Claims data
% of individuals taking brand name medications when generic medication is available, by HIP Plus vs. HIP Basic plan vs. medically frail [O]
Claims data
Rate of copays paid by paid by members transitioning from Medicaid to HIP for ED visits. [P]
Claims data
# of visits to urgent care center, by income [O]
Claims data
Medication adherence/persistence for certain drug classes
Claims data
2. Are HIP Plus members less likely to reach the 5 percent of household income limit (threshold) on out-of-pocket costs?
# and % of individuals reaching the 5% threshold on a monthly or quarterly basis, by income and by HIP Plus vs. HIP Basic plan [P]
Member out-of-pocket tracking data
Use univariate and bivariate analysis to compare the number of HIP Plus members who reach the 5% income threshold versus HIP Basic and traditional Hoosier HealthWise members.
3. Do HIP Plus members ask about the cost of care before receiving the care?
# of members who report asking about the cost of treatment
Member survey data N/a

Page 51 of 176
# Hypothesis Research Questions Metric Data Source Analytic Approach
Goal 2: Promote value-based decision making and personal health responsibility.
4. Do HIP Plus members ever resist getting needed care because of the cost of that care?
# of members who report cost as a cause of missed appointments
Member survey data N/a
2.3 HIP’s (i) graduated copayments required for non-emergency use of the emergency department (ED), (ii) ED prior authorization process, and (iii) efforts to expand access to other urgent care settings will together effectively deter inappropriate ED utilization without harming beneficiary health (HIP 2.0 Waiver, Section 5). • The graduated copayment structure for non-emergency use of the emergency department will decrease
1. What is the rate of non-emergency use of the ED among individuals in the control group vs. the graduated copay group?
Annual non-emergency ED utilization rates (percent of members and visits/100,000 members) [O]
Claims data Track annual rates of members, including low-income caretakers, seeking prior authorization through the nurses’ hotline prior to seeking ED services. Track annual rates of members paying increased copayments based on repeated inappropriate ED utilization. Descriptive analysis of rate of non-emergency use of the ED for members in the control vs the graduated copay group. Tests for significant differences in means (t-tests) or distribution (chi-square tests) Use bivariate analysis to describe and compare inappropriate ED utilization among members with graduated ED. If appropriate, use multivariate regression to control for health status using either the medically frail indicator or a risk score derived from claims data.
Annual overall ED utilization rates (percent of members and visits/100,000 members) [O]
Claims data
Number of members that utilized inappropriate ED services: · Only once · Two times · Three times · More than three times [O]
Administrative data
# visits classified as emergency, by income level and HIP Plus vs. HIP Basic plan
Claims data
# individuals in differing copay structures for non-emergency use of ED [P]
Claims data
Rate of individuals accessing the ED for non-emergency services, by benefit plan [O]
Historical data
Number of members that utilized ED services [O]
Administrative data
# individuals charged the $8 non-emergency use of ED copay [O]
Member out-of-pocket tracking data
# individuals charged the $25 non-emergency use of ED copay [O]
Member out-of-pocket tracking data
Annual overall ED utilization rates (percent of members and visits/100,000 members) [O]
Claims data

Page 52 of 176
# Hypothesis Research Questions Metric Data Source Analytic Approach
Goal 2: Promote value-based decision making and personal health responsibility.
inappropriate ED utilization without harming beneficiary health (STCs, Section XIII, Paragraph 3x). • The prior authorization process for hospital emergency department use and efforts to expand access to other urgent care settings will decrease inappropriate ED without harming beneficiary health
# visits classified as non-emergency, by income level and HIP Plus vs. HIP Basic plan [O]
Claims/ data
2. What portion of individuals calling the Nurse Hotline are recommended to go to the ED and what portion of individuals use the ED in spite of the Nurse Hotline advising a different course of action?
# and % of individuals using the ED, by income level and copayment level [P]
Claims data Use bivariate analysis to describe and compare inappropriate ED utilization among those who called the Nurse Hotline; cross-tabulating by those who were advised to go to the ED and those who were advised not to go to the ED
# individuals calling nurse hotline and subsequently visiting ED [O]
Claims data
Number of members utilizing nurse’s hotline for ED prior authorization [O]
Administrative data
Number of members receiving affirmative prior authorization for ED services [O]
Administrative data
3. What portion of individuals are accessing urgent care settings outside of the ED?
Alternative urgent care locations utilized [O]
Claims data Survey HIP members on whether the copayment for non-emergency use of the ED caused them to seek services with their primary care physician or in an alternative urgent care setting. Descriptive analysis of portion of individuals accessing urgent care settings outside of the ED for members in the control vs the graduated copay group, before and after the graduated copayment policy effective date. Tests for significant differences in means (t-tests) or distribution (chi-square tests). Use bivariate analysis to describe and compare rates of urgent care utilization among members with graduated ED. If appropriate, use multivariate regression to control for health status using either the
% of members who report the required copayment for non-emergency use of the ED caused them to seek services with their primary care physician or in an alternative urgent care setting in lieu of the ED [O]
Survey data – Member
Annual rates of alternative urgent care setting utilization (percent of members and visits/100,000 members). [O]
Claims data

Page 53 of 176
# Hypothesis Research Questions Metric Data Source Analytic Approach
Goal 2: Promote value-based decision making and personal health responsibility.
medically frail indicator or a risk score derived from encounter data.
4. Are providers complying with HIP policies, e.g. charging copayments to HIP Basic members?
% of HIP patients for which providers report regularly collecting copayments [P]
Provider survey data Provider survey data will be used to enhance descriptive analyses of utilization patterns, including copayment collection rates by providers.
Copayment collection rates [P] Provider survey data
Copayment collection policies [P] Provider survey data
Page 54 of 176
Goal 3: Promote Disease Prevention and Health Promotion to Achieve Better
Health Outcomes Disease prevention and health promotion is central to the CMS Three-Part Aim of better care, better
health, and reduced costs. To identify the program’s success in achieving this aim, the State will track
and compare heath service utilization rates among HIP members. Specific metrics the State will monitor
include POWER account rollover and contribution discounts, preventive care utilization, and
participation with chronic disease management programs offered by the health plans. 14
The State will be guided by the following research questions in evaluating its achievement of this goal:
How does primary care, chronic disease management, and preventive care utilization vary
among HIP members?
How does primary care and chronic disease management vary by population age, gender,
benefit plan, FPL, etc.?
In comparing preventive care utilization and chronic disease management between HIP members, the
evaluation will track and compare health service utilization rates between HIP Plus and HIP Basic
members. Preventive care measures will be calculated using Symmetry® EBM Connect® using national
standards. Measures may include:
Patient(s) 20 years of age and older that had a preventive or ambulatory care visit during the
report period.
Patient(s) that had an annual mammogram.
Patient(s) 16 - 24 years of age that had a chlamydia screening test in last 12 reported months.
Chronic disease management measures will also be calculated using Symmetry® EBM Connect® and
considering national standards. Measures may include:
Patient(s) with diabetes diagnosis 18 - 75 years of age that had a HbA1c test in last 12 reported
months.
Patient(s) with asthma that had an office visit for asthma care in last 6 reported months.
Patient(s) with a myocardial infarction in the past who are currently taking a beta-blocker.
The evaluation will also track and compare POWER account rollover and contribution discount rates for
HIP Plus members, and for HIP Basic members who enroll in HIP Plus at the end of the benefit period.
In assessing the impact of disease prevention and health promotion within HIP, the State will track
preventive care utilization rates and trends among different age and gender groups, in addition to
tracking member participation in the health plans’ chronic disease management programs.
14 Members may reduce future HIP Plus POWER account contributions by rolling over funds from their PAC from the previous year. If Plus members complete required preventive services, they can double the amount of their rollover, up to 100% of the contribution amount. Basic members are only eligible to reduce their required annual contributions if they receive preventive care and they can only reduce their required contribution by half.

Page 55 of 176
The following table includes the hypothesis(es), research questions, metrics, data sources, and analytic
approaches the State will use to assess Goal 3. Hypotheses, research questions, and metrics are aligned
in the table to depict how they will inform the hypotheses and goals. The items in blue font represent
the “key” hypotheses, research questions, and metrics needed to assess whether a goal has been
achieved. Cells written in italics and shaded orange are requirements from the STCs and/or HIP 2.0
waiver. Metrics were identified as either Outcome [O] or Process [P] measures.

Page 56 of 176
Goal 3 Summary Evaluation Table
# Hypothesis Research Questions Metric Data Source Analytic Approach
Goal 3: Promote disease prevention and health promotion to achieve better health outcomes.
3.1
HIP will effectively promote member use of preventive, primary, and chronic disease management care to achieve improved health outcomes (HIP 2.0 Waiver, Section 5 and STCs, Section XIII, Paragraph 3iii).
1. How does primary care, chronic disease management, and preventive care utilization vary among HIP members?
Chronic disease management program participation numbers and rates [O]
Administrative data
Track and compare heath service utilization rates among HIP members. Examine specific disease categories and assess whether management was better by HIP Plus or Basic status. Track medically frail status, and assess its impact upon utilization. Identify key metrics for specific disease groups and examine utilization across the different comparison groups. Track preventive care utilization by all, and across the different comparison groups. Track and compare POWER account rollover and contribution discount rates for: • HIP Plus members • HIP Basic members who enroll in HIP Plus at the end of the benefit period Track preventive care utilization rates and trends among different age and gender groups. Track participation in health plans’ chronic disease management programs.
Selected chronic disease management aggregate program outcomes [P]
Administrative data
# individuals with PAC requirement reductions/rollover due to preventive care [O]
Administrative data
POWER account preventive care rollover rates (200% of member pro-rata contribution amount) for HIP Plus members [O]
Administrative data
Average discount in required contributions for HIP Basic members who enroll in HIP Plus at the end of the benefit period [P]
Administrative data
Primary and preventive care utilization by specific disease category [O]
Claims data
Primary and preventive care utilization ambulatory care sensitive conditions [O]
Claims data
HEDIS measures by specific disease category [O]
Claims data
HEDIS measures by ambulatory care sensitive conditions. [O]
Claims data
Primary care encounters [P] Claims data

Page 57 of 176
# Hypothesis Research Questions Metric Data Source Analytic Approach
Goal 3: Promote disease prevention and health promotion to achieve better health outcomes.
Specialty encounters [P] Claims data Use univariate and bivariate analysis to describe and compare primary care and chronic disease management utilization among HIP members. Use descriptive analysis to examine HIP utilization of primary care, chronic disease. Use multivariate analysis to describe how primary care and chronic disease management vary by population age, gender, benefit plan, FPL, and other measures, controlling for confounding factors.
Preventive care codes [P] Claims data
Chronic disease management codes [P]
Claims data
Number, type, and frequency of preventive care services used [O]
Claims data
Gender- and age-specific rates of pre-determined preventive service utilization [O]
Claims data
Medically Frail Status [P] or risk score derived from procedure codes, revenue codes and diagnosis codes [O}
Enrollment data or claims data
HIP will effectively promote member use of preventive, primary, and chronic disease management care to achieve improved health outcomes (HIP 2.0 Waiver, Section 5 and STCs, Section XIII, Paragraph 3iii).
2. How does primary care, chronic disease management, and preventive care utilization vary by population age, gender, benefit plan, FPL, etc.?
Chronic disease management program participation numbers and rates [O]
Administrative data
Selected chronic disease management aggregate program outcomes [P]
Administrative data
# individuals with PAC requirement reductions/rollover due to preventive care [O]
Administrative data
POWER account preventive care rollover rates (200% of member pro-rata contribution amount) for HIP Plus members [O]
Administrative data
Average discount in required contributions for HIP Basic members who enroll in HIP Plus at the end of the benefit period [P]
Administrative data
Primary and preventive care utilization by specific disease category [O]
Claims data

Page 58 of 176
# Hypothesis Research Questions Metric Data Source Analytic Approach
Goal 3: Promote disease prevention and health promotion to achieve better health outcomes.
Primary and preventive care utilization ambulatory care sensitive conditions [O]
Claims data
HEDIS measures by specific disease category [O]
Claims data
HEDIS measures by ambulatory care sensitive conditions. [O]
Claims data
Primary care encounters [P] Claims data
Specialty encounters [P] Claims data
Preventive care codes [P] Claims data
Chronic disease management codes [P]
Claims data
Number, type, and frequency of preventive care services used [O]
Claims data
Gender- and age-specific rates of pre-determined preventive service utilization [O]
Claims data

Page 59 of 176
Goal 4: Promote Private Market Coverage and Family Coverage Options to
Reduce Network and Provider Fragmentation within Families. Leveraging the existing private market as a means of reducing network and provider fragmentation
within families is an important goal of HIP 2.0. The State seeks to accomplish this goal through the HIP
Employer Benefit Link (HIP Link) program.
HIP Link is an optional defined contribution insurance program for all HIP eligible individuals age 21 or
older who have access to HIP Link qualifying employer-sponsored insurance (ESI). HIP Link provides
enrolled individuals with a HIP Link POWER account valued at $4,000. This Health Savings-like account
holds the state’s defined contribution for ESI coverage of $4,000 and will cover the premiums and out of
pocket costs associated with enrollment in ESI. In addition, the account serves as supplemental
coverage for medical expenses incurred during the employer’s annual coverage period. Like HIP Plus,
individuals enrolled in HIP Link will be required to contribute 2 percent of their income towards the cost
of their employer-sponsored insurance. Premiums will be deducted from the employee’s paycheck as
usual, and the state will send the employee reimbursement for the difference between the premium
amount and their 2 percent POWER account contribution on a monthly basis.
The individual who elects to enroll into HIP Link will receive the benefits offered by the HIP Link qualified
employer health insurance instead of the HIP Plus, HIP Basic, or HIP State Plan benefits as applicable.
HIP Link beneficiaries will access benefits provided through their employer-sponsored insurance.
The State will evaluate the following hypothesis:
HIP’s defined contribution premium assistance program (HIP Link) will increase the proportion
of adult Indiana residents with incomes under 138% FPL who are enrolled in ESI since the
previous demonstration period (HIP 2.0 Waiver, Section 5 and STCs, Section XIII, Paragraph 3xii)
4.1. HIP’s defined contribution premium assistance program (HIP Link) will increase the
proportion of adults with incomes under 138% FPL who are enrolled in ESI since the
previous demonstration period
In determining the effect that HIP Link has on increasing the proportion of low-income Indiana residents
covered by ESI, the State will consider the following research question:
How many Indiana residents under 138% FPL are covered by employer-sponsored insurance?
To understand the effects of HIP Link on employers and employees, the State will also consider a
number of additional research questions, including:
How many members who have access to HIP Link enroll in HIP Link instead of HIP Plus or HIP Basic?
How many members move from HIP Link to HIP Plus or HIP Basic?
What are uptake and utilization patterns among members and their dependents in HIP Link?
How many employers are enrolled in HIP Link?
How many employees with an approved HIP Link employer are enrolled in HIP Plus or Basic versus
their employers’ sponsored insurance/HIP Link?

Page 60 of 176
Answers to these (and related) research questions will be generated through the evaluation of a series
of data metrics furnished by the HIP Link program. Specifically, the State will track and compare the
number of members who a) apply for HIP Link and b) qualify for HIP Link.
Of the members who do not qualify for HIP Link, the State will assess the reason (e.g., member not
employed, member employed, but employer does not offer qualifying health plan).
Of the members who do qualify for HIP Link, the State will track a series of data, including (but not
limited to):
The proportion of adults with incomes under 138% FPL enrolled under ESI in HIP 2.0, compared to
proportion of Indiana residents under 138% FPL enrolled in ESI prior to HIP Link implementation
Average number of months enrolled under ESI in HIP 2.0;
The average premium contribution reimbursed to HIP Link members;
The average expenditures (copayments, deductibles, POWER account payments) associated with
participating in HIP Link;
Utilization rates of among HIP Link members (e.g., preventive and specialty), and how they
compare to other HIP members (e.g., HIP Plus and HIP Basic members);
The number of members who leave the HIP Link program and return to HIP; and other related data
How many members move from the HIP Link program to HIP Plus or HIP Basic.
The State will also track and compare the number of employers who a) apply for HIP Link and b) qualify
for HIP Link.
Of the employers who do not qualify for HIP Link, the State will assess the reason (e.g., employer health
plan does not qualify with Essential Health Benefit requirements, employer health plan determined to
be unaffordable for the majority of members, etc.).
Of the employers who do qualify for HIP Link, the State will track a series of data, including (but not
limited to):
Employer industry type;
Employer size;
Number of employees on HIP Link;
The number of employers who leave HIP Link; and other related data
In addition, the State will use surveys to assess both member and employer experiences within the
program; however given the timing of HIP-Link implementation, these questions will not be asked in the
first year, rather they will be included in the year 2 and 3 member survey. Survey questions will aim to
assess the following:
Member and employer reasons for choosing to participate in HIP Link;
Member and employer perceptions on how HIP Link can be improved;
Member and employer reasons for leaving HIP Link (if applicable).

Page 61 of 176
The following table includes the hypothesis(es), research questions, metrics, data sources, and
analytic approaches the State will use to assess Goal 4. Hypotheses, research questions, and metrics
are aligned in the table to depict how they will inform the hypotheses and goals. The items in blue
font represent the “key” hypotheses, research questions, and metrics needed to assess whether a
goal has been achieved. Cells written in italics and shaded orange are requirements from the STCs
and/or HIP 2.0 waiver. Metrics were identified as either Outcome [O] or Process [P] measures.

Page 62 of 176
Goal 4 Summary Evaluation Table
# Hypothesis Research Questions Metric Data Sources Analytic Approach
Goal 4: Promote private market coverage and family coverage options to reduce network and provider fragmentation within families.
4.1 HIP’s defined contribution premium assistance program (HIP Link) will increase the proportion of adult Indiana residents with incomes under 138% FPL who are enrolled in ESI since the previous demonstration period (HIP 2.0 Waiver, Section 5 and STCs, Section XIII, Paragraph 3xii)
1. How many Indiana residents with a household income under 138% FPL are covered by employer-sponsored insurance?
ESI coverage rate estimates, all ages.
Current Population Survey & American Community Survey
Track Indiana residents with income under 138% FPL covered by ESI over the demonstration; use a paired T-test to compare ESI coverage rates pre and post HIP Link implementation
2. How many members who have access to HIP Link enroll in HIP Link instead of HIP Plus or HIP Basic?
Total # qualifying for/enrolling in HIP Link
Enrollment data Track Indiana residents with income under 138% FPL receiving defined contribution premium assistance to purchase ESI each year of the demonstration Use univariate and bivariate analysis to describe and compare a) the number of members who have access to HIP Link who enroll in HIP Link instead of HIP and b) the number of members who move from HIP Link to HIP. Use multivariate analysis to describe how many members participate in HIP Link, controlling for confounding factors.
# of individuals who do not qualify, and reason they do not qualify
Enrollment data
3. How many members move from HIP Link to HIP Plus or HIP Basic?
# moving from HIP Link to HIP Plus, HIP Basic
Enrollment data
# of members who leave HIP Link and move to HIP due to reaching 5% income limit. · # of months member stayed on HIP Link.
Enrollment data
4. What are uptake and utilization patterns among members and their dependents in HIP Link?
# of members who apply for HIP Link.
Enrollment data
# of members who were on HIP before the roll-out of HIP Link.
Enrollment data
# of members who were uninsured before qualifying for/enrolling in HIP Link.
Enrollment data
Average premium contribution reimbursed to HIP Link members
Enrollment data

Page 63 of 176
# Hypothesis Research Questions Metric Data Sources Analytic Approach
Goal 4: Promote private market coverage and family coverage options to reduce network and provider fragmentation within families.
# and % of HIP enrollees who receive premium assistance to purchase ESI—monthly and annually
Enrollment data
# of members who were uninsured before applying for HIP Link.
Enrollment data
Employer contribution (with change from beginning to end of quarter)
POWER account data
Total # qualifying for/enrolling in HIP Link
Enrollment data
# of members who call enrollment broker: · Number who enroll in HIP Link. · Number who enroll in HIP.
Enrollment data
# of members who were in a non-qualifying health plan previously (i.e., number of members who change plans within the 60 day enrollment period created by HIP Link)
Enrollment data
# of members who qualify for rollover (due to completion of preventive services)
Enrollment data
# of members who leave HIP Link due to pregnancy. · # of months member stayed on HIP Link.
Enrollment data
# of members who leave HIP Link due to increased salary/income. · # of months member stayed on HIP Link.
Enrollment data
# of members who leave HIP Link due to leaving their job. · # of months member stayed on HIP Link.
Enrollment data
# of members who leave HIP Link due to their employer leaving HIP Link.
Enrollment data

Page 64 of 176
# Hypothesis Research Questions Metric Data Sources Analytic Approach
Goal 4: Promote private market coverage and family coverage options to reduce network and provider fragmentation within families.
Utilization and amounts paid by HIP Link: · By provider type · By service type
Claims data
Member satisfaction with HIP Link: · Why staying in HIP Link? · Why leaving HIP Link?
Member Survey (Year 2)
POWER account balance for HIP Link members
POWER account data
POWER account expenditures: · HIP Link members · HIP Plus members
POWER account data
Premium amounts paid to members.
POWER account data
Copayment amounts paid to providers: · By provider type · By service type
POWER account data
Deductible amounts paid to providers: · By provider type · By service type
POWER account data
Wrap-around service payments: · By provider type · By service type
POWER account data
4. How many employers are enrolled in HIP Link?
# of employers who apply for HIP Link.
Enrollment data
# of employers who qualify for/enroll in HIP Link.
Enrollment data
# of employers who do not qualify, and reason they do not qualify
Enrollment data
# of employer health plans submitted for HIP Link approval.
Enrollment data
# of employer health plans which qualify for HIP Link.
Enrollment data

Page 65 of 176
# Hypothesis Research Questions Metric Data Sources Analytic Approach
Goal 4: Promote private market coverage and family coverage options to reduce network and provider fragmentation within families.
Number of employers who leave HIP Link. · # of months employer stayed on HIP Link.
Enrollment data
Employer characteristics: · Industry · Size
Enrollment data
# of employees: · Total # of employees · # of employees enrolled in HIP Link
Enrollment data
# of large employers and small employers registered with HIP Link
Enrollment data
Employer satisfaction with HIP Link: · Why stay in HIP Link? · Why leave HIP Link?
Employer Survey
Employer contribution (with change from beginning to end of quarter)
POWER account data
5. How many employees with an approved HIP Link employer are enrolled in HIP Plus or Basic versus their employers’ sponsored insurance/HIP Link?
Employer characteristics: · Industry · Size
Enrollment data
# of employees: · Total # of employees · # of employees enrolled in HIP Link
Enrollment data
# of members who were on their employer's ESI before applying for HIP Link.
Enrollment data
# of members who were on their employer's ESI before qualifying/ enrolling in HIP Link.
Enrollment data

Page 66 of 176
Goal 5: Provide HIP Members with Opportunities to Seek Job Training and
Stable Employment to Reduce Dependence on Public Assistance Research has demonstrated that employed individuals are both physically and mentally healthier, as
well as more financially stable.15,16 To this end, the State will introduce the new Gateway to Work
program to promote employment by integrating the State’s various work training and job search
programs with HIP. Through this employment initiative, all eligible HIP members will be provided with
general information on the State’s job search and training programs. HIP participants who are
unemployed or working less than 20 hours a week will be referred to available employment, work
search and job training programs that will assist them in securing gainful employment.
All non-disabled adults on the program who are unemployed or working less than 20 hours a week will
be referred, as a condition of HIP 2.0 eligibility, to the State’s existing workforce training programs and
work search resources. Full-time students will be exempted from the referral for each year they are
enrolled in a postsecondary education institution or technical school. The HIP application will screen for
education and employment status and contain an acknowledgement of the referral.
All identified eligible individuals will receive information on available employment resources, including
IndianaCareerConnect.com available through the Indiana Department Workforce Development (DWD).
IndianaCareerConnect.com is the most comprehensive source of Indiana job openings in the state. It
provides individuals access to current job openings, the ability to create and upload a resume, explore a
career, and research the job market.
As research indicates that employed persons have better health outcomes as unemployed persons,17
HIP 2.0 seeks to leverage available State resources by referring eligible Indiana residents for workforce
development.
To identify the program’s success in achieving this aim, the State will track and compare the number of
HIP applicants referred for job search and job training assistance. In particular, the State will track the
number of HIP members who accept/participate in work search/job training programs, and compare
rates of full and part-time employment among the enrolled population at application at specific intervals
(e.g., after six months, one year, and two years into the program). The State will also track the number
of HIP individuals who transition off of HIP due to increased income.
The State will be guided the following research questions in evaluating its achievement of this goal:
15 F. M. McKee-Ryan, Z. Song., C. R. Wanberg, and A. J. Kinicki. (2005). Psychological and physical well-being during unemployment: a meta-analytic study. Journal of Applied Psychology, 90 (1), 53-76. 16 K. I. Paul, E. Geithner, and K. Moser. (2009). Latent deprivation among people who are employed, unemployed, or out of the labor force. Journal of Psychology, 143 (5), 477-491. 17 Robert Wood Johnson Foundation. How Does Employment, or Unemployment, Affect Health? Available at http://www.rwjf.org/en/library/research/2012/12/how-does-employment--or-unemployment--affect-health-.html. Accessed 05/25/15.

Page 67 of 176
1. What percent of members referred to DWD become employed (part time vs. full time)?
2. How will referrals to the DWD impact member income and eligibility for HIP?
a. How many stay in HIP and how many referred individuals leave HIP?
3. How will referrals to the DWD impact the number of Indiana residents enrolled in HIP Link?
In assessing the impact of providing HIP members with opportunities to seek job training with DWD, the
State will compare HIP eligibility and enrollment data (e.g. income level and employment status
changes) to eligibility and enrollment data from previous the demonstration period (HIP 1.0), as well as
other traditional Medicaid populations.
The State will evaluate this goal independently, as it is not included in the CMS requirements.
The following table includes a series of research questions, analytic approaches with comparison groups
to assess, data sources, and metrics the evaluation will use to assess Goal 5.

Page 68 of 176
Goal 5 Summary Evaluation Table
# Hypothesis Research Questions Metric Data Sources Analytic Approach
Goal 5: Provide HIP members with opportunities to seek job training and stable employment to reduce dependence on public assistance.
5.1 Referrals to Department of Workforce Development (DWD) employment resources at the time of application will increase member employment rates over the course of the demonstration (HIP 2.0 Waiver, Section 5).
1. What percent of members referred to DWD become employed (part time vs. full time)?
2. How will referrals to the DWD impact member income and eligibility for HIP? How many stay in HIP and how many referred individuals leave HIP?
3. How will referrals to the DWD impact the number of Indiana residents enrolled in HIP Link?
# of HIP applicants annually and monthly
Enrollment data
Track the number of HIP applicants referred for work search and job training assistance. Track the number of HIP members who accept/participate in work search/job training programs. Track the number of HIP individuals transitioning off the program due to increased income. Use univariate and bivariate analysis to describe and compare a) the number of members referred to DWD, b) the number of members who are referred to DWD who earn employment, and c) the number of members referred to DWD who enroll in HIP Link. Use multivariate analysis to describe the number of members who are referred to DWD who earn employment, controlling for confounding factors. Comparison Group: Enrollment data from previous demonstration period (HIP 1.0). Compare rates of full- and part-time employment among the entire HIP-enrolled population and across the HIP-enrolled population referred to DWD at application and after six months, one year, and two years into the program.
# of members who lose HIP eligibility due to income increase—monthly and annual. % of members who report engagement in work search/job training activities after the time of HIP application—one month, six months, and one year
Member survey data
% of enrollees with full or part-time employment at program entry, six months, one year, and two years into the program

Page 69 of 176
Goal 6: Assure State Fiscal Responsibility and Efficient Management of the
Program Ensuring budget neutrality for both the State and the Federal government is a top priority of the HIP
program. In order to evaluate the fiscal responsibility and efficient management of HIP 2.0, the State
will conduct a comprehensive budget neutrality analysis based on HIP financial data.
Examples of the metrics the State will use in its analysis include (but are not limited to):
All expenditures related to the demonstration, including services rendered or capitation
payments made;
Expenditures for specific waiver populations, including (1) 1931 parents and low income 19-20
year old dependent expenditures, (2) New adult group, and (3) HIP Link;
Administrative costs;
Pharmacy rebates assigned to the demonstration, ensuring these rebates are not applicable to
the HIP Link program;
Estimate of matchable demonstration expenditures, separating expenditures (by quarter) for
Medical Assistance Payments (MAP) and State and Local Administration Costs (ADM);
Total annual expenditures for the demonstration population throughout the demonstration year
Calculation of the waiver margin (annual and cumulative);
Documentation of all state and federal costs; etc.
The State will use the following research question as a guide in its evaluation of the achievement of this
goal: Does HIP meet budget neutrality requirements?
The following table includes the hypothesis(es), research questions, metrics, data sources, and analytic
approaches the State will use to assess Goal 5. Hypotheses, research questions, and metrics are aligned
in the table to depict how they will inform the hypotheses and goals. The items in blue font as identified
as “key” hypotheses, research questions, and metrics. Cells written in italics and shaded orange are
requirements from the STCs and/or HIP 2.0 waiver. Metrics were identified as either Outcome [O] or
Process [P] measures.

Goal 6 Summary Evaluation Table
# Hypothesis Research Questions Metric Data Source Analytic Approach
Goal 6: Assure State fiscal responsibility and efficient management of the program.
6.1 HIP will remain budget-neutral for both the federal and state governments (HIP 2.0 Waiver, Section 5 and STCs, Section XII).
1. Does HIP meet budget neutrality requirements?
Expenditures by waiver populations, including (1) 1931 parents and low income 19-20 year old dependent expenditures, (2) New adult group, (3) HIP Link, (STCs, Section XI, Paragraph 2d) and (4) pregnant women
Internal financial data
Conduct a budget neutrality analysis and document adherence to waiver margin, adjusting for the higher provider rates compared to Hoosier HealthWise/Medicaid. Analysis will also need to account for a recent rate increase for Medicaid beneficiaries, as this can be a confounding factor.
Administrative costs (STCs, Section X, Paragraph 5b)
Pharmacy rebates assigned to the demonstration, ensuring these rebates are not applicable to the HIP Link program (STCs, Section XI, Paragraph 2e) Estimate of matchable demonstration expenditures, separating expenditures (by quarter) for Medical Assistance Payments (MAP) and State and Local Administration Costs (ADM) (STCs, Section XI, Paragraph 3)
Cost settlements (STCs, Section XI, Paragraph 2c)
Fiscal data from previous demonstration period (HIP 1.0), and traditional Medicaid population transitioning to HIP 2.0 (e.g. Section 1931 group).
Total annual expenditures for the demonstration population throughout the demonstration year (STCs, Section X, Paragraph 5b)
Calculation of the waiver margin (annual and cumulative) (HIP 2.0 Waiver, Section 5) Budget neutrality estimates and
reports Documentation of all state and federal costs(HIP 2.0 Waiver, Section 5)

Page 71 of 176
# Hypothesis Research Questions Metric Data Source Analytic Approach
Goal 6: Assure State fiscal responsibility and efficient management of the program.
Demonstration of budget neutrality (HIP 2.0 Waiver, Section 5 and STCs, Section XI, Paragraph 2g and Section XII)
Cost effectiveness between HIP Plus, HIP Basic, and HIP Link members.
# individuals with costs paid under the retroactive coverage for Section 1931 group transition to HIP 2.0 (STCs Section IV, Paragraph 4e)
Internal financial data (for Retroactive coverage for Section 1931 group transition to HIP 2.0)
Total costs paid (STCs Section IV, Paragraph 4e)
Average cost per person (STCs Section IV, Paragraph 4e)
# and type of providers paid (STCs Section IV, Paragraph 4e)
Amounts not reimbursed under retroactive coverage for Sec. 1931 group transition to HIP 2.0 (STCs Section IV, Paragraph 4e )
Type of costs incurred, including specific conditions with which they are associated (STCs Section IV, Paragraph 4e)
Claims data (for Retroactive coverage for Section 1931 group transition to HIP2.0)
MCE contributions (STCs, Section XI, Paragraph 2b)
POWER account data
State contributions to participant POWER accounts (STCs, Section XI, Paragraph 2b)
Recouped State contributions to participant POWER accounts (STCs, Section XI, Paragraph 2b)

The following table includes a comprehensive view of demonstration goals, hypotheses, research
questions, analytic approaches, comparison groups, data sources, and metrics the evaluation will use
to assess the hypotheses therein. Cells written in italics and highlighted orange are requirements from
the STCs and/or HIP 2.0 waiver. Text highlighted in blue indicate “key” research questions, metrics,
and data sources. Metrics were identified as either Outcome [O] or Process [P] measures.

Page 73 of 176
Appendix A – Summary Table of Research Questions, Metrics, and Analytic Methods18
# Hypothesis Research Questions
Metric Data Source Analytic Approach
Quarterly
Report
Annual
Report
Interim &
Final
Report
Policy-
Specific
Report
1.1
HIP will reduce the number of uninsured Indiana residents with income under 138% FPL over the course of the demonstration (HIP 2.0 Waiver, Section 5 and STCs, Section XIII, Paragraph 3i).
1. How many Indiana residents with income under 138% FPL have insurance relative to the total Indiana resident population and how many have Medicaid/HIP coverage in this population group?
HIP Take up Rate: Total # enrolled in HIP divided by the estimated # eligible for HIP. Where cell size permits, show by county. [O]
Enrollment Data and American Community Survey/Current Population Survey
Health insurance coverage rates by age, by county, and by income level pre and post HIP 2.0 [O]
American Community Survey/Current Population Survey
Interrupted Time Series (ITS) Analysis of trends in health insurance coverage rates for subpopulations stratified by income level. o Under 138% FPL; o 100-138% FPL; and o Under 100% FPL. - ITS on Medicaid/HIP enrollment counts for different subpopulations - Track HIP take up rates over time
Total health insurance coverage estimates (all ages, counties, and income levels) pre and post HIP 2.0 [O]
American Community Survey/Current Population Survey
X X X
# of Indiana residents enrolled in Medicaid/HIP using both "ever-enrolled” and point in time definitions divided by
Enrollment data
X X X X
18 Notes about each metric are included in the tables listed for each individual goal.

Page 74 of 176
# Hypothesis Research Questions
Metric Data Source Analytic Approach
Quarterly
Report
Annual
Report
Interim &
Final
Report
Policy-
Specific
Report
the number of eligible [O]
2. Are there socio-demographic differences in the health insurance coverage/HIP coverage among Indiana residents with income under 138% (e.g., differences by age, education, income, etc.)?
Total # enrolled by income level and HIP Plus and HIP Basic plan [O]
Enrollment Data Descriptive analysis on socio-demographic characteristics of different populations (enrolled in HIP, enrolled in HIP-plus, uninsured). Tests for significant differences in means (t-tests) or distribution (chi-square tests)
X X X
Total # of enrollments for the demonstration year
X X
Total # enrolled by income level and HIP Plus and HIP Basic plan [O]
Total # enrolled by race and HIP Plus and HIP Basic plan [O]
Total # enrolled, by sex/gender and HIP Plus and HIP Basic plan [O]
Total # enrolled, by age and HIP Plus and HIP Basic plan [O]
Total # enrolled per month, by county and HIP Plus and HIP Basic plan [O]
Total # residents with income below 138% FPL, by race and source of coverage [P]
American Community Survey/Current Population Survey
Cross-tabulation, tests on difference in means.

Page 75 of 176
# Hypothesis Research Questions
Metric Data Source Analytic Approach
Quarterly
Report
Annual
Report
Interim &
Final
Report
Policy-
Specific
Report
Total # residents with income below 138% FPL, by sex/gender source of coverage [P]
Total # residents with income below 138% FPL, by age and source of coverage [P]
Total # residents with income below 138% FPL, by county and source of coverage [P]
3. What proportion of Indiana residents with income under 138% FPL have had HIP 2.0 coverage at some point over the course of the year?
Total # and % of Indiana residents with household income below 138% FPL enrolled in HIP 2.0 at any point in the past year [O]
Enrollment Data
X X X
Total # Indiana residents with household income below 138% FPL [P]
American Community Survey/Current Population Survey
X X X
4. Why do members leave HIP and how are they accessing care after leaving HIP?
Length of time individuals enrolled in HIP 2.0 [O]
Enrollment Data Survival analysis on time enrolled in the program; covariates may include age, gender, race and other socio-demographic characteristics
X X X
Reason for leaving HIP 2.0 [P]
Previous Member Survey Data
Cross-tabulations of survey questions that ask respondents about insurance reasons for leaving HIP, by age, employment status, and income.
X X X

Page 76 of 176
# Hypothesis Research Questions
Metric Data Source Analytic Approach
Quarterly
Report
Annual
Report
Interim &
Final
Report
Policy-
Specific
Report
How individuals access coverage after leaving HIP [P]
Member and Previous Member Survey Data
Cross-tabulations of survey questions that ask respondents about insurance coverage after HIP, by age, employment status, and income.
X X X
1.2
HIP will increase access to healthcare services among the target population (HIP 2.0 Waiver, Section 5 and STCs, Section XIII, Paragraph 3ii).
1. How do member perceptions of access to healthcare change before and after fully enrolling in HIP?
% of members who report having a usual source of care [O]
Members and non-member survey data
Measure member health plan satisfaction indicators: Use a series of descriptive analyses and logistic regressions to analyze the survey data and examine differences in member and previous member (leaver) and non-member (never member) perceptions of access to care by characteristics such as income level and employment status. Comparison Groups: Previous members: Former HIP members who were locked out due to failure to make contributions or left for other reasons (e.g. gaining Medicare coverage) Non-members: Individuals who were determined presumptively eligible but never completed a full application and those never made their first PAC. The State may also compare the perceptions of access to care among: 1. Individuals with current HIP coverage 2. Individuals with other coverage
X X
Measure of ability to obtain primary care visit [O]
Members and non-member survey data
X X
Measure of ability to obtain specialty care visit [O]
Members and non-member survey data
X X
Measure of ability to obtain a prescription [O]
Members and non-member survey data
X X
Rating of plan overall [P]
CAHPS survey X X
Ability to get needed care quickly [O]
CAHPS survey X X
Provider communication [P]
CAHPS survey X X
Coordination of care [P]
CAHPS survey X X
Other relevant CAHPS indicators [P]
CAHPS survey X X
% of members who report having a usual source of care [O]
Members and non-member survey data
X X
2. How does perceived access to care differ between HIP members and
Measure of ability to obtain primary care visit [O]
Members and non-member survey data X X

Page 77 of 176
# Hypothesis Research Questions
Metric Data Source Analytic Approach
Quarterly
Report
Annual
Report
Interim &
Final
Report
Policy-
Specific
Report
individuals who are eligible but have not applied and/or enrolled in HIP?
3. Individuals with no coverage
Measure of ability to obtain specialty care visit [O]
Members and non-member survey data
X X
Measure of ability to obtain a prescription [O]
Members and non-member survey data
X X
3. How does access to care differ between HIP 2.0 and HHW members?
Change in # of providers available to HIP 2.0 members vs. Hoosier HealthWise (HHW) members [P]
Historical data and current claims data (for PCP, OB/GYN, most commonly used adult specialty providers)
Descriptive analysis of access to providers for HIP 2.0 members vs. HHW members.
X
Change in # of providers accepting new HIP 2.0 members vs. HHW [O]
Administrative data, including network and geo-access data. Historical data and current claims data (for PCP, OB/GYN, most commonly used adult specialty providers)
X
Change in time to access care for HIP 2.0 members vs. HHW [O]
Historical data and current claims data (for PCP, OB/GYN, most commonly used adult specialty providers)
X

Page 78 of 176
# Hypothesis Research Questions
Metric Data Source Analytic Approach
Quarterly
Report
Annual
Report
Interim &
Final
Report
Policy-
Specific
Report
4. Are there geographic areas in Indiana where HIP members lack access to primary or specialty care?
Proximity of primary care providers for all members [P]
Administrative data, including network and geo-access data
Comparison of network adequacy measures across counties.
X X
Proximity of specialist types for all members [P]
Administrative data, including network and geo-access data
X X
Federal guidelines for Medically Underserved Areas and Health Professional Shortage Areas
HHS Health Resources and Services Administration (HRSA) Medically Underserved Areas/Populations and Health Professional Shortage Areas
1.3
POWER account contributions for individuals in the HIP Plus plan are affordable and do not create a barrier to healthcare access (STCs, Section XIII, Paragraph 3v); Few individuals will experience the lockout period because the policy will deter nonpayment of POWER account contributions policy for HIP Plus beneficiaries (STCs, Section XIII, Paragraph 3vi).
1. How many members will be impacted by employers and not-for-profit organizations paying all or part of their POWER account contributions?
# of individuals receiving POWER account contributions (PAC) from employers and/or not-for-profit entities (by entity type) [P]
POWER account data
Descriptive analysis of proportion of individuals receiving PAC from employers vs. not-for-profit entities, by entity type, as well as average amount paid by contributor, by member income level.
X X X
Average amount paid by employer and/or not-for-profit (by member income level) [P]
POWER account data
X X X
2. How do HIP 2.0 enrollees perceive the affordability of the PAC and non-payment penalties?
Perception of ability to make POWER account contribution [P]
Member and non-member survey data
Cross-tabulations of survey questions that ask respondents about perceived affordability of POWER accounts, by age, employment status, geography, health status, income and HIP
X X X
Perceived affordability of the PAC, by income level [P]
Member and non-member survey data
X X X

Page 79 of 176
# Hypothesis Research Questions
Metric Data Source Analytic Approach
Quarterly
Report
Annual
Report
Interim &
Final
Report
Policy-
Specific
Report
status (Basic, Plus, previous member).
3. How many individuals were never fully enrolled in HIP due to non-payment of the PAC?
# individuals approved for HIP and over 100% FPL who do not pay first PAC [P]
POWER account data
Track rates and counts over time. Track waiver requests and percentage granted. Use multivariate analysis to describe and compare members who experience a lockout period for failure to make POWER account contributions, controlling for confounding factors.
Rate of non-payment of PAC, by FPL [O]
POWER account data
X X X
4. How many individuals lost HIP Plus coverage due to non-payment of the PAC?
# individuals subjected to 6 mo. lockout, by FPL [O]
Member eligibility data
X X X X
Rate of disenrollment for failure to pay PAC [O]
Member eligibility data
X X X
Total # individuals disenrolled (for any reason) by income level [O]
Member enrollment data
X
Reasons for non-payment of PAC [P]
Member and non-member survey data
X X X
Timing of eligibility change due to non-payment (transition to Basic or lockout), by # of months paid and by month in the year [P]
POWER account data
X X X
# of months PAC paid, average per member [P]
POWER account data X X X
# individuals with overdue PAC [P]
POWER account data
X X X
5. How many individuals requested a
# individuals requesting waiver of lockout [P]
Administrative data
X X X

Page 80 of 176
# Hypothesis Research Questions
Metric Data Source Analytic Approach
Quarterly
Report
Annual
Report
Interim &
Final
Report
Policy-
Specific
Report
waiver from the six month lockout?
# individuals meeting qualifying event criteria and granted waiver of lockout [P]
Member eligibility data X X X
6. How are individuals accessing healthcare if they are locked out due to non-payment of the PAC?
Individual healthcare needs during lockout period, by income level [P]
Member and non-member survey data
Cross-tabulations of survey questions that ask respondents about access to care during the lockout period by age, employment status, and income.
X
How healthcare needs addressed during lockout period, by income level [P]
Member and non-member survey data X
7. Was the lockout period a deterrent for individuals over 100% FPL to miss a PAC?
Member aware of non-payment penalties? (Y/N) [P]
Member and non-member survey data X X X
8. Do POWER account contributions present a barrier to initial enrollment in the HIP program?
# individuals subject to PAC (by income level) [P]
POWER account data
Logistic regression on take-up of coverage, controlling for socio-demographic characteristics. Comparison group: Eligible individuals with income just above 100% FPL
X X X
# individuals exempted from PAC (Pregnant Women, American Indians) [P]
Member eligibility data X X X
Survey responses to questions about affordability of HIP
Member survey, Previous Member survey, Never Member survey
Coverage take-up rate for residents who can obtain some coverage without making contributions (individuals under 100%FPL), as
Member Enrollment data, by income level

Page 81 of 176
# Hypothesis Research Questions
Metric Data Source Analytic Approach
Quarterly
Report
Annual
Report
Interim &
Final
Report
Policy-
Specific
Report
compared to those who must make a contribution to initiate coverage (individuals over 100%FPL). [P]
1.4
Presumptive eligibility (PE) and fast track prepayments will provide the necessary coverage so as not to have gaps in healthcare coverage (STCs, Section XIII, Paragraph 3vii).
1. How does the waiver of retroactive coverage impact uncompensated care costs?
Unreimbursed retroactive service costs for Section 1931 group transitioning to HIP [P]
Member and provider survey data on retroactive coverage for Section 1931 group transitioning to HIP
Track presumptive eligibility and fast track prepayments over the course of the demonstration. Use univariate and bivariate analysis to describe avoidance of coverage gaps through PE and fast track prepayments. Use a series of descriptive analyses to show the differences in provider perceptions of the effectiveness of the presumptive eligibility process.
X
Provider perceptions concerning cost of uncompensated care
Survey data - Providers X X
Level of uncompensated care [O]
Survey data - Providers X X
2. What is the number of PE applications vs. traditional applications?
% of all applications coming through PE [O]
Member eligibility data X
% of eligibility determinations following PE period vs. determinations on all applications[P]
Member eligibility data
X
# entities participating in PE (by type, # of PE applications filed, # full apps filed, # determined eligible, by entity) [P]
Enrollment data
X X X
% of potentially qualifying entities trained and participating in HIP
Enrollment data
X

Page 82 of 176
# Hypothesis Research Questions
Metric Data Source Analytic Approach
Quarterly
Report
Annual
Report
Interim &
Final
Report
Policy-
Specific
Report
2.0 PE assessment (not counting entities that have refused or not responded to opportunities to participate) [P]
3. How many PE members go to HIP Basic vs. HIP Plus?
# of PE-eligible individuals enrolling in HIP Plus vs. HIP Basic, by income [O]
Enrollment data
X X
4. What proportion of members elected to make fast track prepayments to expedite enrollment in HIP?
# of PE individuals making fast track payments [P]
Administrative data X X
Average # of days between submission of app and eligibility determination [P]
Member eligibility data
X X X
Average # of days between eligibility determination and HIP 2.0 plan enrollment, by payment of PAC or 60-day default into HIP Basic for members under 100% FPL [P]
Member eligibility data, POWER Account Data?
X X X
# of individuals making fast track payments, by FPL [P]
Member Enrollment data, by income level
X X X
Timing of fast track payment submission [P]
Member Enrollment data, by income level
X X X
5. How does utilization of services (time until first use, and use within first several months of
Service utilization (primary care vs. specialty care vs. emergency care), by fast track utilization
Claims/Enrollment data
X X

Page 83 of 176
# Hypothesis Research Questions
Metric Data Source Analytic Approach
Quarterly
Report
Annual
Report
Interim &
Final
Report
Policy-
Specific
Report
enrollment) differ between those who utilize the fast track payment option and those who do not?
(yes/no), by income [0]
6. What are provider perceptions of PE effectiveness?
Perceptions of the effectiveness of the PE process [P]
Survey data - PE providers X X
Length of PE period before making PAC, by FPL [P]
Enrollment data
X X
7. How many members are taking advantage of other policies that prevent gaps in coverage, e.g. ex-parte determinations and prepopulated renewal forms?
# of individuals determined eligible using ex parte [P]
Member eligibility data X
# of individuals receiving prepopulated renewal form [P]
Member eligibility data
X
# of individuals responding to prepopulated renewal form [P]
Member eligibility data
X
# of responders determined eligible [P]
Member eligibility data
X
# of individuals who reapply within (a) 90 days or less, (b) 6 months, (c) 1 year, following a termination for failure to respond [P]
Member eligibility data
X
1.5
Waiver of non-emergency transportation to the non-pregnant and non-medically frail population does not pose a barrier to accessing
1a. What is the effect of the NEMT waiver of coverage on missed appointments by
% of respondents reporting challenges in keeping appointments due to lack of transportation,
Member survey data
The evaluation will include a series of descriptive analyses and logistic regressions to analyze the survey data and examine differences in members
X X

Page 84 of 176
# Hypothesis Research Questions
Metric Data Source Analytic Approach
Quarterly
Report
Annual
Report
Interim &
Final
Report
Policy-
Specific
Report
care (STCs, Section XIII, Paragraph 3ix).
income level for individuals who are neither pregnant nor medically frail? 1b. Are there parts of the state that are more affected by no access to NEMT?
by income level and by county [O]
reporting challenges keeping appointments by characteristics such as region and income level.
Specifically, the State will create cross-tabulations of survey questions that ask respondents if they have missed any appointments and reasons why appointments were missed by age, gender, region, income level, availability of public transportation and number of physicians per 1000 population.
Demographic information from eligibility data (member age, gender, income, location) [Covariate]
Eligibility data
Number of physicians per 1,000 population for member’s region of residence [Covariate]
HHS Area Health Resources Files
Data on public transportation services for member’s region of residence [Covariate]
Public data on availability of public transport
2. How does not having access to NEMT affect preventive care and overall health outcomes?
Perceptions about impact of access to NEMT [O]
Provider and Member survey data, using questions from the previous HIP demonstration survey
X X
3. What is the impact of no access to NEMT as viewed by the providers and beneficiaries?
% of respondents reporting challenges in keeping appointments due to lack of transportation, by income level and by county [O]
Member survey data
X X

Page 85 of 176
# Hypothesis Research Questions
Metric Data Source Analytic Approach
Quarterly
Report
Annual
Report
Interim &
Final
Report
Policy-
Specific
Report
Perceptions about impact of access to NEMT [O]
Provider and Member survey data, using questions from the previous HIP demonstration survey
X X
2.1
HIP policies will encourage member compliance with required contributions (HIP 2.0 waiver, Section 5).
1. What proportion of members make POWER account payments on time? What proportion of members move from HIP Plus to HIP Basic due to non-payment?
# and % transitioned from HIP Plus to HIP Basic due to non-contribution [O]
Enrollment data Descriptive analysis of rates of transition from Plus to Basic due to non-payment of POWER account contributions (PAC). Create a binary indicator of timeliness of POWER account contributions and conduct logistic regression assessing timeliness by income, for individuals over 100 percent FPL, and those with income under 100 percent FPL.
X X
# and % of members making initial POWER account contribution, total and within allowed time [O]
Administrative data
X X
Total enrollment by HIP Plus vs. HIP Basic plan [P]
Enrollment data X X
# enrolled in HIP Basic who enroll in HIP Plus later [P]
Enrollment data X X
Total enrollment in HIP Plus, by income (above and below 100% FPL) [P]
Enrollment data
X X
# and % locked out due to non-contribution of PAC [O]
Administrative data
X X
2. How many members are subject to collection due to non-payment of PAC?
MCO collection activities: # individuals subject to collection, amounts due, amounts paid (STCs Sec. VIII, Paragraph 5f)
MCE Data Descriptive analysis of rates of provider copayment collection rates, by provider type.

Page 86 of 176
# Hypothesis Research Questions
Metric Data Source Analytic Approach
Quarterly
Report
Annual
Report
Interim &
Final
Report
Policy-
Specific
Report
3. Are providers complying with HIP policies, e.g. charging copayments to HIP Basic members?
% of HIP patients for which providers report regularly collecting copayments [P]
Provider survey data
Descriptive statistics on percentage of members regularly checking their POWER Account balance, by Basic vs Plus. Describe HIP POWER account balances across different member groups, including 1) HIP Plus members, 2) HIP Basic members, 3) HIP members transitioning from traditional Medicaid to HIP (e.g. Section 1931 low-income parents and caretakers), and 4) Medically Frail. Among HIP Basic members transitioning to HIP Plus, track the average amount by which required contributions are discounted for the transition to HIP Plus at redetermination. Among HIP Plus members, review the pro-rata share of balance POWER account rollover rates and the distribution by which contributions are reduced in the next benefit period for base rollovers and preventive care rollovers.
X X
Copayment collection rates [P]
Provider survey data
X X
Copayment collection policies [P]
Provider survey data
X X
HIP policies will provide incentives to actively manage POWER account funds (HIP 2.0 waiver, Section 5).
4. Are members actively managing their POWER accounts?
Percentage of members who regularly check their POWER Account balance
Member survey data
Logistic regression will be used to estimate the probability of utilizing care (any/none or high/low), while controlling for confounding demographic

Page 87 of 176
# Hypothesis Research Questions
Metric Data Source Analytic Approach
Quarterly
Report
Annual
Report
Interim &
Final
Report
Policy-
Specific
Report
% of POWER accounts that have a balance at the end of a benefit period [O]
Administrative data
factors and health status (as determined by a Medically Frail Indicator that is documented and verified in the administrative data or a risk score derived from claims data).
X X
Average POWER account balance amount at the end of the benefit period [O]
Administrative data
X X
Percentage of HIP Plus members that have a POWER account balance at the end of the benefit period [O]
Administrative data
X X
Total # enrolled by income level, race, gender/sex, and age [O]
Enrollment Data
POWER Account debts (STCs, Section VIII, Paragraph 5g)
MCE data
5. Are there differences in utilization and POWER account management among members related to health status, (e.g., diabetes, or other chronic diseases)?
Medically Frail Status [P] or risk score derived from procedure codes, revenue codes and diagnosis codes [O}
Enrollment data or claims data
X X
% and amount of individuals receiving incentives for healthy behaviors, by MCE and by income and by HIP Plus vs. HIP Basic plan [O]
MCE incentive data
X X
% of POWER accounts that have a balance at
Administrative data X X

Page 88 of 176
# Hypothesis Research Questions
Metric Data Source Analytic Approach
Quarterly
Report
Annual
Report
Interim &
Final
Report
Policy-
Specific
Report
the end of a benefit period [O]
Average POWER account balance amount at the end of the benefit period [O]
Administrative data
X X
Percentage of HIP Plus members that have a POWER account balance at the end of the benefit period [O]
Administrative data
X X
Rate of primary care use, by income and by HIP Plus vs. HIP Basic plan [O]
Claims data
X X
Prior authorization requests to provide context on any differences in utilization [P]
Claims data X X
Rate of specialty care use, by income and by HIP Plus vs. HIP Basic plan [O]
Claims data
X X
Rate of generic medicine use vs. brand name, by income and by HIP Plus vs. HIP Basic plan [O]
Claims data
X X
Rate of ED use, by income and by HIP Plus vs. HIP Basic plan and by number of visits [O]
Claims data
X X
HIP policies surrounding rollover and preventive care
6. Are there differences in
% and amount of individuals receiving
MCE incentive data
Logistic regression will be used to estimate the probability of
X X

Page 89 of 176
# Hypothesis Research Questions
Metric Data Source Analytic Approach
Quarterly
Report
Annual
Report
Interim &
Final
Report
Policy-
Specific
Report
will encourage beneficiaries’ compliance with required contributions and provide incentives to actively manage POWER account funds (STCs, Section XIII, Paragraph 3viii).
utilization and POWER account management between individuals paying a PAC and those who do not? How are these variables impacted by member income level?
incentives for healthy behaviors, by MCE and by income and by HIP Plus vs. HIP Basic plan [O]
making a PAC payment, while controlling for confounding demographic factors and health status.
% of POWER accounts that have a balance at the end of a benefit period [O]
Administrative data
X X
Average POWER account balance amount at the end of the benefit period [O]
Administrative data
X X
Percentage of HIP Plus members that have a POWER account balance at the end of the benefit period [O]
Administrative data
X X
Rate of primary care use, by income and by HIP Plus vs. HIP Basic plan [O]
Claims data
X X
Prior authorization requests [P]
Claims data
X X
Rate of specialty care use, by income and by HIP Plus vs. HIP Basic plan [O]
Claims data
X X
Rate of generic medicine use vs. brand name, by income and by HIP Plus vs. HIP Basic plan [O]
Claims data
X X
Rate of ED use, by income and by HIP Plus vs. HIP Basic plan
Claims data
X X

Page 90 of 176
# Hypothesis Research Questions
Metric Data Source Analytic Approach
Quarterly
Report
Annual
Report
Interim &
Final
Report
Policy-
Specific
Report
and by number of visits [O]
Risk score derived from procedure codes, revenue codes and diagnosis codes
Claims data
2.2
HIP Plus members will exhibit more cost-conscious healthcare consumption behavior than: a) HIP Basic members; and b) traditional Hoosier HealthWise members in the areas of primary, specialty, and pharmacy service utilization without harming beneficiary health (STCs, Section XIII, Paragraph 3iv)
1. Are HIP Plus members more likely to exhibit cost-conscious consumption behavior, e.g. prescription drug adherence, primary care vs specialty care use, chronic disease management, appropriate use of the ED, and generic vs. brand name medication use? In what area(s)?
# and % of individuals using the ED for non-emergency services, by HIP Plus vs. HIP Basic plan vs. HHW [O]
Claims data Track health service utilization rates for following groups, controlling for health status, age, and other relevant variables: • HIP Plus members; • HIP Basic members; • Section 1931 Group; • Medically Frail Track service utilization by income and benefit plan (HIP Plus vs. HIP Basic) for generic vs. brand name medications, primary care vs. specialty care utilization Use multivariate analysis (linear or logistic, depending on the nature of the outcome, e.g. odds of unnecessary ED visits=logistic vs. # of unnecessary ED visits = linear) to describe and compare the utilization patterns of HIP Plus members versus HIP Basic and traditional Hoosier HealthWise members. Multivariate regression will allow us to control for confounders. Use difference in difference analysis to compare populations
X X
Primary care encounters vs. specialty care [O]
Claims data
X X
Preventive service codes [P]
Claims data
X X
Pharmacy (overall costs, brand vs. generic dispensing rate) [O]
Claims data
X X
% of individuals using specialty care for chronic disease care, by HIP Plus vs. HIP Basic plan vs. medically frail
Claims data
X X
% of individuals accessing chronic disease management services (if chronic disease present), by HIP Plus vs. HIP Basic plan [O]
Claims data
X X
# of unique individuals accessing preventive services, by income [O]
Claims data
X X

Page 91 of 176
# Hypothesis Research Questions
Metric Data Source Analytic Approach
Quarterly
Report
Annual
Report
Interim &
Final
Report
Policy-
Specific
Report
# of preventive care visits, total and average per person, by income [O]
Claims data transitioning from traditional Medicaid to HIP, e.g. Section 1931 members, looking at costs before and after transition, for HIP Basic vs HIP Plus members. Comparison Groups: HIP Basic members and HHW members Traditional Medicaid members who transitioned to HIP
X X
# of specialty care visits, total and average per person, by income [O]
Claims data
X X
# of unique individuals accessing specialty care [O]
Claims data
% of individuals taking brand name medications when generic medication is available, by HIP Plus vs. HIP Basic plan vs. medically frail [O]
Claims data
X X
Rate of copays paid by paid by members transitioning from Medicaid to HIP for ED visits. [P]
Claims data
# of visits to urgent care center, by income [O]
Claims data
X X
Medication adherence/persistence for certain drug classes
Claims data

Page 92 of 176
# Hypothesis Research Questions
Metric Data Source Analytic Approach
Quarterly
Report
Annual
Report
Interim &
Final
Report
Policy-
Specific
Report
2. Are HIP Plus members less likely to reach the 5 percent of household income limit (threshold) on out-of-pocket costs?
# and % of individuals reaching the 5% threshold on a monthly or quarterly basis, by income and by HIP Plus vs. HIP Basic plan [P]
Member out-of-pocket tracking data
Use univariate and bivariate analysis to compare the number of HIP Plus members who reach the 5% income threshold versus HIP Basic and traditional Hoosier HealthWise members.
X X X
3. Do HIP Plus members ask about the cost of care before receiving the care?
# of members who report asking about the cost of treatment
Member survey data
N/a
4. Do HIP Plus members ever resist getting needed care because of the cost of that care?
# of members who report cost as a cause of missed appointments
Member survey data
N/a
2.3
HIP’s (i) graduated copayments required for non-emergency use of the emergency department (ED), (ii) ED prior authorization process, and (iii) efforts to expand access to other urgent care settings will together effectively deter inappropriate ED utilization without harming beneficiary health (HIP 2.0 Waiver, Section 5). • The graduated copayment structure for non-emergency use of the emergency department will decrease inappropriate ED utilization
1. What is the rate of non-emergency use of the ED among individuals in the control group vs. the graduated copay group?
Annual non-emergency ED utilization rates (percent of members and visits/100,000 members) [O]
Claims data Track annual rates of members seeking prior authorization through the nurses’ hotline prior to seeking ED services. Track annual rates of members paying increased copayments based on repeated inappropriate ED utilization. Descriptive analysis of rate of non-emergency use of the ED for members in the control vs the graduated copay group. Tests for significant differences in means (t-tests) or distribution (chi-square tests) Use bivariate analysis to describe and compare inappropriate ED
X X
Annual overall ED utilization rates (percent of members and visits/100,000 members) [O]
Claims data
X X
Number of members that utilized inappropriate ED services: · Only once · Two times · Three times
Administrative data
X X

Page 93 of 176
# Hypothesis Research Questions
Metric Data Source Analytic Approach
Quarterly
Report
Annual
Report
Interim &
Final
Report
Policy-
Specific
Report
without harming beneficiary health (STCs, Section XIII, Paragraph 3x). • The prior authorization process for hospital emergency department use and efforts to expand access to other urgent care settings will decrease inappropriate ED without harming beneficiary health
· More than three times [O]
utilization among members with graduated ED. If appropriate, use multivariate regression to control for health status using either the medically frail indicator or a risk score derived from claims data.
# visits classified as emergency, by income level and HIP Plus vs. HIP Basic plan
Claims data
X X X
# individuals in differing copay structures for non-emergency use of ED [P]
Claims data
X X X
Rate of individuals accessing the ED for non-emergency services, by benefit plan [O]
Historical data
X X
Number of members that utilized ED services [O]
Administrative data X X
# individuals charged the $8 non-emergency use of ED copay [O]
Member out-of-pocket tracking data
X X X
# individuals charged the $25 non-emergency use of ED copay [O]
Member out-of-pocket tracking data
X X X
Annual overall ED utilization rates (percent of members and visits/100,000 members) [O]
Claims data
X X
# visits classified as non-emergency, by
Claims data X X X

Page 94 of 176
# Hypothesis Research Questions
Metric Data Source Analytic Approach
Quarterly
Report
Annual
Report
Interim &
Final
Report
Policy-
Specific
Report
income level and HIP Plus vs. HIP Basic plan [O]
2. What portion of individuals calling the Nurse Hotline are recommended to go to the ED and what portion of individuals use the ED in spite of the Nurse Hotline advising a different course of action?
# and % of individuals using the ED, by income level and copayment level [P]
Claims data Use bivariate analysis to describe and compare inappropriate ED utilization among those who called the Nurse Hotline; cross-tabulating by those who were advised to go to the ED and those who were advised not to go to the ED
X X X
# individuals calling nurse hotline and subsequently visiting ED [O]
Claims data
X X X
Number of members utilizing nurse’s hotline for ED prior authorization [O]
Administrative data
X X X
Number of members receiving affirmative prior authorization for ED services [O]
Administrative data
X X
3. What portion of individuals are accessing urgent care settings outside of the ED?
Alternative urgent care locations utilized [O]
Claims data Survey HIP members on whether the copayment for non-emergency use of the ED caused them to seek services with their primary care physician or in an alternative urgent care setting. Descriptive analysis of portion of individuals accessing urgent care settings outside of the ED for members in the control vs the graduated copay group, before and after the graduated copayment policy effective date. Tests for significant differences in means (t-tests) or distribution (chi-square tests).
X X
% of members who report the required copayment for non-emergency use of the ED caused them to seek services with their primary care physician or in an alternative urgent care setting in lieu of the ED [O]
Survey data – Member
X X
Annual rates of alternative urgent
Claims data X X
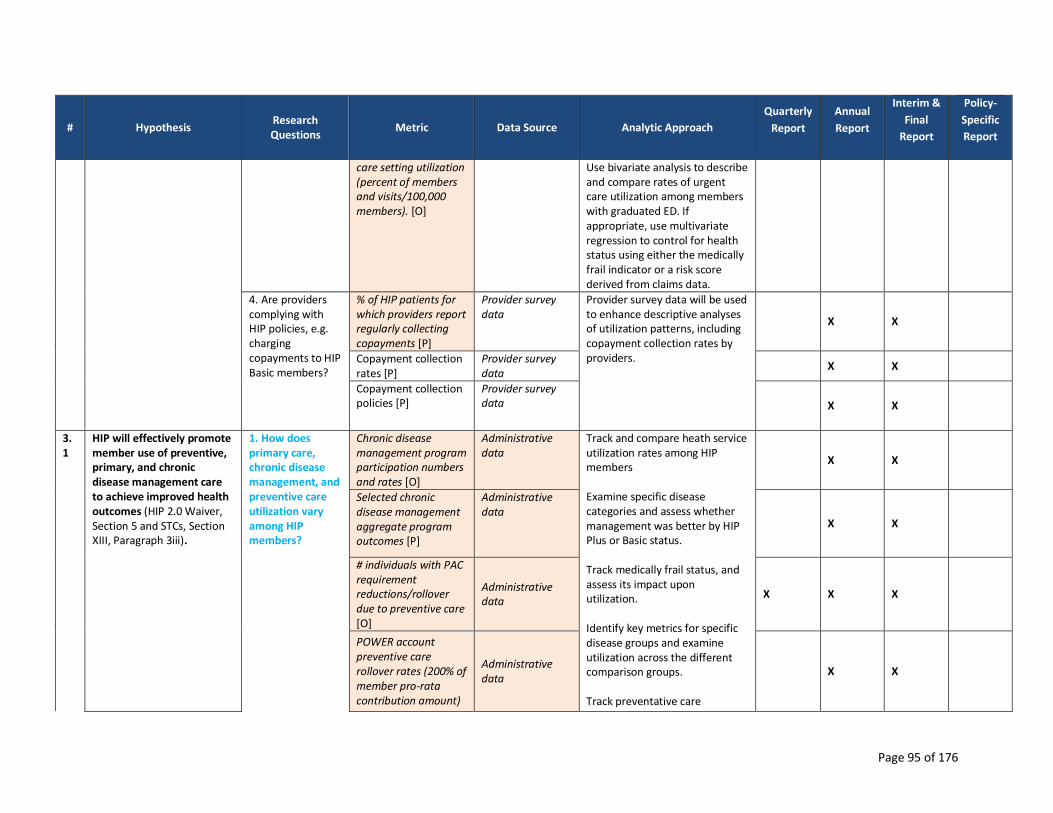
Page 95 of 176
# Hypothesis Research Questions
Metric Data Source Analytic Approach
Quarterly
Report
Annual
Report
Interim &
Final
Report
Policy-
Specific
Report
care setting utilization (percent of members and visits/100,000 members). [O]
Use bivariate analysis to describe and compare rates of urgent care utilization among members with graduated ED. If appropriate, use multivariate regression to control for health status using either the medically frail indicator or a risk score derived from claims data.
4. Are providers complying with HIP policies, e.g. charging copayments to HIP Basic members?
% of HIP patients for which providers report regularly collecting copayments [P]
Provider survey data
Provider survey data will be used to enhance descriptive analyses of utilization patterns, including copayment collection rates by providers.
X X
Copayment collection rates [P]
Provider survey data
X X
Copayment collection policies [P]
Provider survey data X X
3.1
HIP will effectively promote member use of preventive, primary, and chronic disease management care to achieve improved health outcomes (HIP 2.0 Waiver, Section 5 and STCs, Section XIII, Paragraph 3iii).
1. How does primary care, chronic disease management, and preventive care utilization vary among HIP members?
Chronic disease management program participation numbers and rates [O]
Administrative data
Track and compare heath service utilization rates among HIP members Examine specific disease categories and assess whether management was better by HIP Plus or Basic status. Track medically frail status, and assess its impact upon utilization. Identify key metrics for specific disease groups and examine utilization across the different comparison groups. Track preventative care
X X
Selected chronic disease management aggregate program outcomes [P]
Administrative data
X X
# individuals with PAC requirement reductions/rollover due to preventive care [O]
Administrative data
X X X
POWER account preventive care rollover rates (200% of member pro-rata contribution amount)
Administrative data
X X

Page 96 of 176
# Hypothesis Research Questions
Metric Data Source Analytic Approach
Quarterly
Report
Annual
Report
Interim &
Final
Report
Policy-
Specific
Report
for HIP Plus members [O]
utilization by all, and across the different comparison groups. Track and compare POWER account rollover and contribution discount rates for: • HIP Plus members • HIP Basic members who enroll in HIP Plus at the end of the benefit period Track preventive care utilization rates and trends among different age and gender groups. Track participation in health plans’ chronic disease management programs. Use univariate and bivariate analysis to describe and compare primary care and chronic disease management utilization among HIP members versus other Medicaid populations. Use descriptive analysis to examine HIP utilization of primary care, chronic disease Use multivariate analysis to describe how primary care and chronic disease management vary by population age, gender, benefit plan, FPL, and other measures, controlling for confounding factors.
Average discount in required contributions for HIP Basic members who enroll in HIP Plus at the end of the benefit period [P]
Administrative data
X X
Primary and preventive care utilization by specific disease category [O]
Claims data X X
Primary and preventive care utilization ambulatory care sensitive conditions [O]
Claims data
X X
HEDIS measures by specific disease category [O]
Claims data X X
HEDIS measures by ambulatory care sensitive conditions. [O]
Claims data
X X
Primary care encounters [P]
Claims data X X
Specialty encounters [P]
Claims data
X X

Page 97 of 176
# Hypothesis Research Questions
Metric Data Source Analytic Approach
Quarterly
Report
Annual
Report
Interim &
Final
Report
Policy-
Specific
Report
Preventive care codes [P]
Claims data
X X
Chronic disease management codes [P]
Claims data X X
Number, type, and frequency of preventive care services used [O]
Claims data
X X
Gender- and age-specific rates of pre-determined preventive service utilization [O]
Claims data
X X
Medically Frail Status [P] or risk score derived from procedure codes, revenue codes and diagnosis codes [O}
Enrollment data or claims data
X X
HIP will effectively promote member use of preventive, primary, and chronic disease management care to achieve improved health outcomes (HIP 2.0 Waiver, Section 5 and STCs, Section XIII, Paragraph 3iii).
2. How does primary care, chronic disease management, and preventive care utilization vary by population age, gender, benefit plan, FPL, etc.?
Chronic disease management program participation numbers and rates [O]
Administrative data
X X
Selected chronic disease management aggregate program outcomes [P]
Administrative data
X X
# individuals with PAC requirement reductions/rollover due to preventive care [O]
Administrative data
X X X
POWER account preventive care rollover rates (200% of member pro-rata contribution amount)
Administrative data
X X

Page 98 of 176
# Hypothesis Research Questions
Metric Data Source Analytic Approach
Quarterly
Report
Annual
Report
Interim &
Final
Report
Policy-
Specific
Report
for HIP Plus members [O]
Average discount in required contributions for HIP Basic members who enroll in HIP Plus at the end of the benefit period [P]
Administrative data
X X
Primary and preventive care utilization by specific disease category [O]
Claims data
X X
Primary and preventive care utilization ambulatory care sensitive conditions [O]
Claims data
X X
HEDIS measures by specific disease category [O]
Claims data X X
HEDIS measures by ambulatory care sensitive conditions. [O]
Claims data
X X
Primary care encounters [P]
Claims data X X
Specialty encounters [P]
Claims data X X
Preventive care codes [P]
Claims data X X
Chronic disease management codes [P]
Claims data X X
Number, type, and frequency of
Claims data X X

Page 99 of 176
# Hypothesis Research Questions
Metric Data Source Analytic Approach
Quarterly
Report
Annual
Report
Interim &
Final
Report
Policy-
Specific
Report
preventive care services used [O]
Gender- and age-specific rates of pre-determined preventive service utilization [O]
Claims data
X X
4.1
HIP’s defined contribution premium assistance program (HIP Link) will increase the proportion of adult Indiana Residents with incomes under 138% FPL who are enrolled in ESI since the previous demonstration period (HIP 2.0 Waiver, Section 5 and STCs, Section XIII, Paragraph 3xii)
1. How many Indiana residents with household income under 138% FPL are covered by employer-sponsored insurance?
ESI coverage rate estimates, all ages.
Current Population Survey & American Community Survey
Track Indiana residents with income under 138% FPL covered by ESI over the demonstration; use a paired T-test to compare ESI coverage rates pre and post HIP Link implementation
2. How many members who have access to HIP Link enroll in HIP Link instead of HIP Plus or HIP Basic?
Total # qualifying for/enrolling in HIP Link
Enrollment data Track Indiana residents with income under 138% FPL receiving defined contribution premium assistance to purchase ESI each year of the demonstration Use univariate and bivariate analysis to describe and compare a) the number of members who have access to HIP Link who enroll in HIP Link instead of HIP and b) the number of members who move from HIP Link to HIP. Use multivariate analysis to describe how many members
X X X
# of individuals who do not qualify, and reason they do not qualify
Enrollment data
3. How many members move from HIP Link to HIP Plus or HIP Basic?
# moving from HIP Link to HIP Plus, HIP Basic
Enrollment data
X X X
# of members who leave HIP Link and move to HIP due to reaching 5% income limit. · # of months
Enrollment data
X X

Page 100 of 176
# Hypothesis Research Questions
Metric Data Source Analytic Approach
Quarterly
Report
Annual
Report
Interim &
Final
Report
Policy-
Specific
Report
member stayed on HIP Link.
participate in HIP Link, controlling for confounding factors.
4. What are uptake and utilization patterns among members and their dependents in HIP Link?
# of members who apply for HIP Link.
Enrollment data
X X X
# of members who were on HIP before the roll-out of HIP Link.
Enrollment data
X X
# of members who were uninsured before qualifying for/enrolling in HIP Link.
Enrollment data
X X
Average premium contribution reimbursed to HIP Link members
Enrollment data
# and % of HIP enrollees who receive premium assistance to purchase ESI—monthly and annually
Enrollment data
X X
# of members who were uninsured before applying for HIP Link.
Enrollment data
X X
Employer contribution (with change from beginning to end of quarter)
POWER account data
X X X
Total # qualifying for/enrolling in HIP Link
Enrollment data X X X

Page 101 of 176
# Hypothesis Research Questions
Metric Data Source Analytic Approach
Quarterly
Report
Annual
Report
Interim &
Final
Report
Policy-
Specific
Report
# of members who call enrollment broker: · Number who enroll in HIP Link. · Number who enroll in HIP.
Enrollment data
X X
# of members who were in a non-qualifying health plan previously (i.e., number of members who change plans within the 60 day enrollment period created by HIP Link)
Enrollment data
X X
# of members who qualify for rollover (due to completion of preventive services)
Enrollment data
X X
# of members who leave HIP Link due to pregnancy. · # of months member stayed on HIP Link.
Enrollment data
X X
# of members who leave HIP Link due to increased salary/income. · # of months member stayed on HIP Link.
Enrollment data
X X
# of members who leave HIP Link due to leaving their job. · # of months
Enrollment data
X X X

Page 102 of 176
# Hypothesis Research Questions
Metric Data Source Analytic Approach
Quarterly
Report
Annual
Report
Interim &
Final
Report
Policy-
Specific
Report
member stayed on HIP Link.
# of members who leave HIP Link due to their employer leaving HIP Link.
Enrollment data
X X
Utilization and amounts paid by HIP Link: · By provider type · By service type
Claims data
X X
Member satisfaction with HIP Link: · Why staying in HIP Link? · Why leaving HIP Link?
Member Survey (Year 2)
X X
POWER account balance for HIP Link members
POWER account data X X X
POWER account expenditures: · HIP Link members · HIP Plus members
POWER account data
X X
Premium amounts paid to members.
POWER account data
X X
Copayment amounts paid to providers: · By provider type · By service type
POWER account data
X X
Deductible amounts paid to providers: · By provider type · By service type
POWER account data
X X

Page 103 of 176
# Hypothesis Research Questions
Metric Data Source Analytic Approach
Quarterly
Report
Annual
Report
Interim &
Final
Report
Policy-
Specific
Report
Wrap-around service payments: · By provider type · By service type
POWER account data
X X
4. How many employers are enrolled in HIP Link?
# of employers who apply for HIP Link.
Enrollment data X X
# of employers who qualify for/enroll in HIP Link.
Enrollment data X X
# of employers who do not qualify, and reason they do not qualify
Enrollment data
# of employer health plans submitted for HIP Link approval
Enrollment data X X
# of employer health plans which qualify for HIP Link
Enrollment data X X
Number of employers who leave HIP Link. -- # of months employer stayed on HIP Link.
Enrollment data
X X X
Employer characteristics: · Industry · Size
Enrollment data
X X
# of employees: · Total # of employees · # of employees enrolled in HIP Link
Enrollment data
X X
# of large employers and small employers registered with HIP Link
Enrollment data
X X X

Page 104 of 176
# Hypothesis Research Questions
Metric Data Source Analytic Approach
Quarterly
Report
Annual
Report
Interim &
Final
Report
Policy-
Specific
Report
Employer satisfaction with HIP Link: · Why staying in HIP Link? · Why leaving HIP Link?
Employer Survey
X X
Employer contribution (with change from beginning to end of quarter)
POWER account data
X X X
5. How many employees with an approved HIP Link employer are enrolled in HIP Plus or Basic versus their employers’ sponsored insurance/HIP Link?
Employer characteristics: · Industry · Size
Enrollment data
X X
# of employees: · Total # of employees · # of employees enrolled in HIP Link
Enrollment data
X X
# of members who were on their employer's ESI before applying for HIP Link.
Enrollment data
X X
# of members who were on their employer's ESI before qualifying/ enrolling in HIP Link.
Enrollment data
X X
5.1
Referrals to Department of Workforce Development (DWD) employment resources at the time of application will increase
1. What percent of members referred to DWD become employed (part time vs. full time)?
# of HIP applicants annually and monthly
Enrollment data
Track the number of HIP applicants referred for work search and job training assistance.
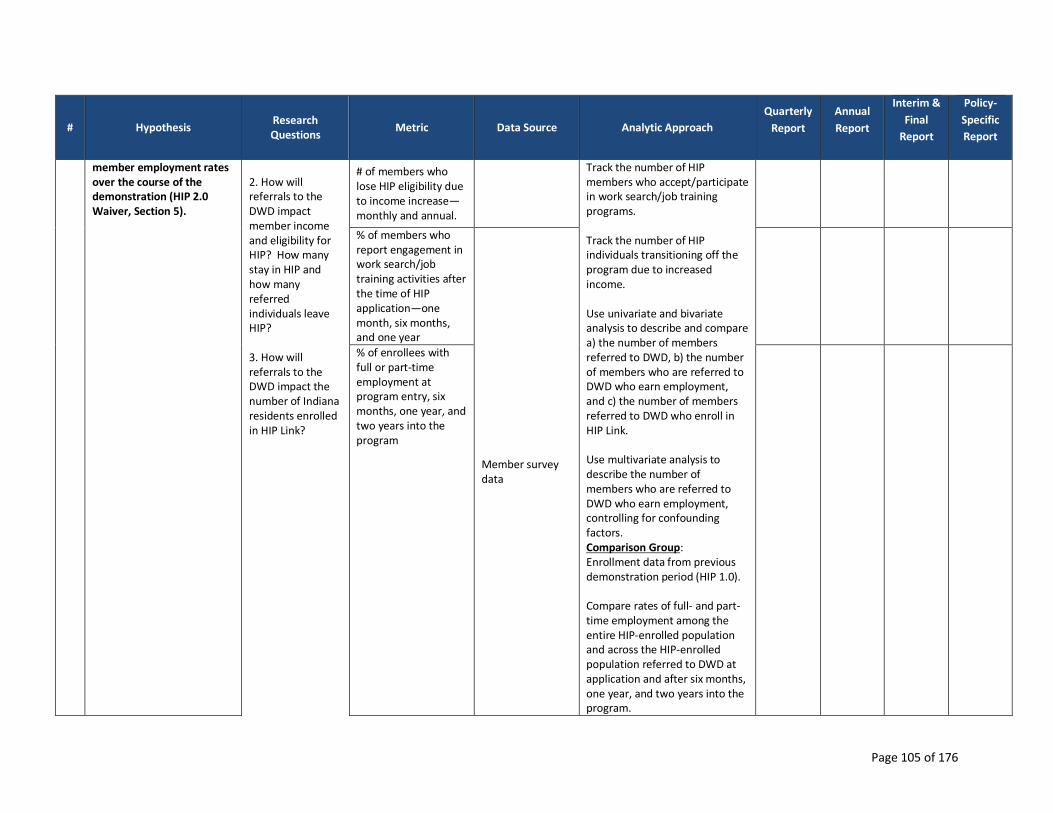
Page 105 of 176
# Hypothesis Research Questions
Metric Data Source Analytic Approach
Quarterly
Report
Annual
Report
Interim &
Final
Report
Policy-
Specific
Report
member employment rates over the course of the demonstration (HIP 2.0 Waiver, Section 5).
2. How will referrals to the DWD impact member income and eligibility for HIP? How many stay in HIP and how many referred individuals leave HIP? 3. How will referrals to the DWD impact the number of Indiana residents enrolled in HIP Link?
# of members who lose HIP eligibility due to income increase—monthly and annual.
Track the number of HIP members who accept/participate in work search/job training programs. Track the number of HIP individuals transitioning off the program due to increased income. Use univariate and bivariate analysis to describe and compare a) the number of members referred to DWD, b) the number of members who are referred to DWD who earn employment, and c) the number of members referred to DWD who enroll in HIP Link. Use multivariate analysis to describe the number of members who are referred to DWD who earn employment, controlling for confounding factors. Comparison Group: Enrollment data from previous demonstration period (HIP 1.0). Compare rates of full- and part-time employment among the entire HIP-enrolled population and across the HIP-enrolled population referred to DWD at application and after six months, one year, and two years into the program.
% of members who report engagement in work search/job training activities after the time of HIP application—one month, six months, and one year
Member survey data
% of enrollees with full or part-time employment at program entry, six months, one year, and two years into the program

Page 106 of 176
# Hypothesis Research Questions
Metric Data Source Analytic Approach
Quarterly
Report
Annual
Report
Interim &
Final
Report
Policy-
Specific
Report
6.1
HIP will remain budget-neutral for both the federal and state governments (HIP 2.0 Waiver, Section 5 and STCs, Section XII).
1. Does HIP meet budget neutrality requirements?
Expenditures by waiver populations, including (1) 1931 parents and low income 19-20 year old dependent expenditures, (2) New adult group, (3) HIP Link, (STCs, Section XI, Paragraph 2d) and (4) pregnant women
Internal financial data
Conduct a budget neutrality analysis and document adherence to waiver margin, adjusting for the higher provider rates compared to Hoosier Healthwise/Medicaid. Analysis will also need to account for a recent rate increase for Medicaid beneficiaries, as this can be a confounding factor.
X X X
Administrative costs (STCs, Section X, Paragraph 5b)
X X
Pharmacy rebates assigned to the demonstration, ensuring these rebates are not applicable to the HIP Link program (STCs, Section XI, Paragraph 2e)
Internal financial data
X X X
Estimate of matchable demonstration expenditures, separating expenditures (by quarter) for Medical Assistance Payments (MAP) and State and Local Administration Costs (ADM) (STCs, Section XI, Paragraph 3)
Fiscal data from the previous demonstration period (HIP 1.0), and traditional Medicaid population transitioning to HIP 2.0 (e.g. Section 1931 group).
X X X

Page 107 of 176
# Hypothesis Research Questions
Metric Data Source Analytic Approach
Quarterly
Report
Annual
Report
Interim &
Final
Report
Policy-
Specific
Report
Cost settlements (STCs, Section XI, Paragraph 2c)
X X X
Total annual expenditures for the demonstration population throughout the demonstration year (STCs, Section X, Paragraph 5b)
Cost effectiveness between HIP Plus, HIP Basic, and HIP Link members.
X
Calculation of the waiver margin (annual and cumulative) (HIP 2.0 Waiver, Section 5)
Budget neutrality estimates and reports
X X
Documentation of all state and federal costs(HIP 2.0 Waiver, Section 5)
X
Demonstration of budget neutrality (HIP 2.0 Waiver, Section 5 and STCs, Section XI, Paragraph 2g and Section XII)
X
# individuals with costs paid under the retroactive coverage for Section 1931 group transition to HIP 2.0 (STCs Section IV, Paragraph 4e)
Internal financial data (for Retroactive coverage for Section 1931 group transition to HIP 2.0)
X
Total costs paid (STCs Section IV, Paragraph 4e)
X
Average cost per person (STCs Section IV, Paragraph 4e)
X

Page 108 of 176
# Hypothesis Research Questions
Metric Data Source Analytic Approach
Quarterly
Report
Annual
Report
Interim &
Final
Report
Policy-
Specific
Report
# and type of providers paid (STCs Section IV, Paragraph 4e)
X
Amounts not reimbursed under retroactive coverage for Sec. 1931 group transition to HIP 2.0 (STCs Section IV, Paragraph 4e )
X
Type of costs incurred, including specific conditions with which they are associated (STCs Section IV, Paragraph 4e)
Claims data (for Retroactive coverage for Section 1931 group transition to HIP 2.0)
X
MCE contributions (STCs, Section XI, Paragraph 2b)
POWER account data
X X X
State contributions to participant POWER accounts (STCs, Section XI, Paragraph 2b)
X X X
Recouped State contributions to participant POWER accounts (STCs, Section XI, Paragraph 2b)
X X X

Page 109 of 176
Appendix B – HIP Members Survey (Basic)
Survey of Current Healthy Indiana Plan (HIP) Members –
BASIC
DESCRIPTION: This survey applies to individuals currently enrolled in HIP Basic. This includes
individuals who started in HIP Plus and moved to HIP Basic for non-payment of POWER account
contribution.
CONFIRM AWARENESS OF ENROLLMENT IN HIP BASIC
Q1. The State of Indiana runs an insurance program called the Healthy Indiana Plan (or HIP) for Hoosiers age 19 to 64. Are you enrolled in the “Healthy Indiana Plan” or “HIP” at this time?
YES
NO
DON’T KNOW CLOSE
REFUSED CLOSE
Q1a. Are you in HIP Basic or HIP Plus?
BASIC GO TO Q2
PLUS GO TO Q2
REFUSED CLOSE
DON’T KNOW CLOSE
Q1b. Based on the information HIP provided it looks like you are in HIP Basic and pay copayments for services. Is this correct?
YES
NO CLOSE
DON’T KNOW CLOSE
REFUSED CLOSE
SATISFACTION WITH HIP
Q2. Thinking about your overall experience with the Healthy Indiana Plan in the past
six months, would you say you are:
VERY SATISFIED,
SOMEWHAT SATISFIED,
NEITHER SATISFIED NOR DISSATISFIED,
SOMEWHAT DISSATISFIED, OR
VERY DISSATISFIED? DON’T KNOW GO TO Q3

Page 110 of 176
REFUSED GO TO Q3
Q2a. Why are you (FILL IN WITH PREVIOUS RESPONSE)? (OPEN-END; RECORD RESPONSES; USE LIST FOR CODING)
OPEN-ENDED RESPONSE:
SPECIFY:
DO NOT READ LIST BELOW; USE FOR CODING PURPOSES
CAN’T SEE MY DOCTOR WITH HIP
DISSATISFACTION WITH CHOICE OF DOCTORS IN HIP
HIP DOES NOT COVER DENTAL
HIP DOES NOT COVER VISION/OPTICAL
HIP DOES NOT COVER PROCEDURE/ MEDICATION
MANY DOCTORS DO NOT ACCEPT HIP
DISSATISFIED WITH ADMINISTRATIVE ISSUE(S) OR PROCESS
DISSATISFACTION WITH A PAYMENT RELATED ISSUE
CAN’T AFFORD CO-PAY/ TOO HIGH
CO-PAYMENT / MONTHLY/ ANNUAL PAYMENT TOO HIGH
LIKE HAVING COVERAGE/ INSURANCE
LIKE DOCTORS/ HOSPITALS / HEALTHCARE PROVIDERS
LIKE PAYMENTS / PRICE
LIKE THE PLAN/ PROVIDER
LIKE SOME THINGS/ DISLIKE OTHER THINGS
SOME THINGS NOT COVERED
DON’T KNOW
REFUSED
OTHER REASON NOT LISTED ABOVE (SPECIFY):
Q3. If you ever left HIP, would you try to re-enroll if you became eligible for the program again?
YES
NO
DON’T KNOW
REFUSED
FAST TRACK PAYMENTS
Q4. When you applied for HIP, did you make a fast track payment?
(IF NEEDED: A fast track payment is made when you complete your application.
(IF NEEDED: Fast track payments allow you to get HIP coverage more quickly because you
pre-pay your first payment.)
(IF NEEDED: By making the fast track payment when you apply, it may take less time for your
coverage to begin.)
YES NO GO TO Q4b
DON’T KNOW GO TO Q5
REFUSED

Page 111 of 176
Q4a. Why did you decide to sign-up for the fast track payment option? (OPEN-END; RECORD RESPONSES; USE LIST FOR CODING)
I WANTED MY COVERAGE AND/OR ELIGIBILITY TO BEGIN SOONER
I THOUGHT IT WAS A REQUIRED PART OF HIP
I THOUGHT IT WOULD BE EASIER TO PAY THEN (I.E., WOULDN’T HAVE TO MAIL/GO IN-PERSON, ETC.)
I HAD THE FUNDS AT THE TIME I APPLIED
OTHER REASON NOT LISTED ABOVE (SPECIFY): ____________________________________________
DON’T KNOW
REFUSED
Q4b. Why did you decide NOT to sign-up for the fast track payment option? (OPEN-END; RECORD RESPONSES; USE LIST FOR CODING)
I COULDN’T AFFORD TO MAKE THE PAYMENT
I WASN’T SURE IF I WOULD BE ELIGIBLE
I DIDN’T UNDERSTAND THE DIFFERENCE BETWEEN FAST TRACK AND THE REGULAR PAYMENT OPTION
I DIDN’T NEED COVERAGE TO START SOONER
I WASN’T AWARE OF THE OPTION TO SIGN-UP FOR FAST TRACK AT THE TIME I APPLIED
OTHER REASON NOT LISTED ABOVE (SPECIFY): ____________________________________________
DON’T KNOW
REFUSED
Q5. In the last 6 months, did you make any appointments for a check-up or routine care at a doctor’s office or clinic?
YES
NO GO TO Q6
Q5a. In the last 6 months, how often did you get an appointment for a check-up or routine care at a doctor’s office or clinic as soon as you needed?
NEVER
SOMETIMES
USUALLY
ALWAYS
Q6. Specialists are doctors like surgeons, heart doctors, allergy doctors, skin doctors, and other doctors who specialize in one area of healthcare. In the last 6 months, did you make any appointments to see a specialist?
YES
NO GO TO Q7
Q6a. In the last 6 months, how often did you get an appointment to see a specialist as
soon as you needed?
NEVER
ACCESS

Page 112 of 176
SOMETIMES
USUALLY
ALWAYS
Q7. In the last 6 months, did you get any new prescription medicines or refill a prescription?
YES
NO GO TO Q8
Q7a. In the last 6 months, how often was it easy to get your prescription medicine from
your health plan?
NEVER
SOMETIMES
USUALLY
ALWAYS
Q8. In the past six months, have you missed any healthcare appointments, such as doctor’s appointments?
YES GO TO 8a
NO GO TO Q9
DON’T KNOW GO TO Q9
REFUSED GO TO Q9
Q8a. What are the reasons you missed an appointment? (READ OPTIONS;
ALLOW MULTIPLE RESPONSE OPTIONS)
COST TOO MUCH
COULDN’T GET CHILDCARE
COULDN’T GET TIME OFF FROM WORK
COULDN’T GET THROUGH ON THE PHONE
COULDN’T SCHEDULE APPOINTMENT SOON ENOUGH
DIDN’T GET APPROVAL FROM PLAN
DIDN’T HAVE TIME
DIDN’T WANT TO GO
HOURS OF OPERATION WERE NOT CONVENIENT FOR ME
NO INSURANCE
PLACE DID NOT ACCEPT THE INSURANCE COVERAGE
TAKES TOO LONG TO GET THERE
TRANSPORTATION PROBLEM
TOO SICK TO GO
OTHER REASON, NOT LISTED ABOVE (SPECIFY): ____________________________________________
DON’T KNOW
REFUSED
Q8b. What is the most common reason you missed an appointment? (IF RESPONDENT CHOOSES MORE THAN ONE OPTION FOR Q8A ABOVE.)
SPECIFY:

Page 113 of 176
Q9. In the past six months, was there any time when you contacted a doctor’s office or clinic, but couldn’t get an appointment soon enough so you went to the emergency room instead?
YES
NO
DON’T KNOW
REFUSED
Q10. When you need to get healthcare, which of the following statements best describes the type of transportation you use most often? (READ LIST)
I DRIVE MYSELF, USING MY OWN VEHICLE
SOMEONE ELSE DRIVES ME, USING MY OWN VEHICLE (IF NEEDED: (SUCH AS A FRIEND, NEIGHBOR, OR FAMILY))
SOMEONE ELSE DRIVES ME, USING THEIR VEHICLE (IF NEEDED: (SUCH AS A FRIEND, NEIGHBOR, OR FAMILY))
I TAKE A TAXI CAB/OR UBER
I TAKE THE BUS
SOME OTHER WAY (SPECIFY): ______________________
DON’T KNOW
REFUSED
Q11. Have you heard of the Healthy Indiana Plan POWER account, which stands for Personal Wellness and Responsibility Account?
YES NO GO TO Q13
DON’T KNOW GO TO Q13
REFUSED GO TO Q13
Q11a. How did you hear or learn about the POWER account? (OPEN-END; RECORD RESPONSES; USE LIST FOR CODING)
(MARK ALL THAT APPLY) MEMBER HANDBOOK
SOMEONE FROM THE PLAN CALLED AND EXPLAINED IT
HIP WEBSITE
HEALTH PLAN
DOCTOR OR HEALTHCARE PROFESSIONAL FAMILY/FRIENDS
OTHER (SPECIFY)
DON’T KNOW
REFUSED
Q12. Do you have a POWER account as part of your HIP Basic insurance?
YES
NO
DON’T KNOW GO TO Q13
REFUSED GO TO Q13
Q12a. How often do you check the balance in your POWER account? Would you say …
AWARENESS

Page 114 of 176
WEEKLY
A FEW TIMES A MONTH
MONTHLY
A FEW TIMES A YEAR BUT NOT EVERY MONTH
ONCE A YEAR
NEVER
DON’T KNOW
REFUSED
Q13. If you were to get preventive services, such as a cancer screening, do you think the cost would be deducted from your POWER account, if you have enough money available in the account?
YES
NO
DON’T KNOW
REFUSED
Q14. Has your health plan given you a HIP POWER Account debit card? (IF NEEDED:
This is a card that can be used to spend the money in your POWER account.)
YES NO GO TO Q15
DON’T KNOW GO TO Q15
REFUSED GO TO Q15
Q14a. How often do you present the card to a healthcare provider? Is it…
EVERY TIME YOU GET CARE SOME OF THE TIME
ONLY FOR SPECIFIC SERVICES
NEVER
DON’T KNOW
REFUSED
Q15. I’m going to read a couple of policies, please indicate whether you think the policy is true or false.
The first policy states: “If you get preventive services suggested by your plan every year and have money left in your POWER account, part of that money will be rolled over to your account for next year.” TRUE
FALSE
DON’T KNOW
REFUSED
Q16. The second policy states: “If you do not get the preventive care that your health
plan recommends during the year and you have money left over in your POWER account, you will not be able to reduce your monthly contributions if you move to HIP Plus.”
TRUE
FALSE
DON’T KNOW

Page 115 of 176
REFUSED
Indiana offers two HIP programs – HIP Plus and HIP Basic. Based on the information HIP provided, you are currently on HIP Basic.
Q17. HIP Plus covers services that HIP Basic does not cover, such as dental and vision. It also covers surgery for obesity and treatment of jaw disorders. Did you know that HIP Plus covers these additional services?
YES, KNEW
NO, DIDN’T KNOW
DON’T KNOW
REFUSED
Q18. How important would this additional coverage be to you?
VERY IMPORTANT
SOMEWHAT IMPORTANT
NOT IMPORTANT
DON’T KNOW
REFUSED
HIP Basic charges copayments or copays at the time you get most services. (IF NEEDED:
Copayments are payments you make at the time you visit your doctor's office, go to the
hospital or get prescription drugs.)
Q19. When you need treatment from a doctor or other health professional, do you ask how much the treatment will cost?
YES
NO
DON’T KNOW
REFUSED
Q20. In the past six months, when you needed treatment from doctors or other
healthcare professionals, did they ask you to make a co-pay?
ALWAYS
SOMETIMES NEVER GO TO Q23
HAVEN’T NEEDED TREATMENT/BEEN TO A HEALTHCARE PROFESSIONAL GO TO Q23
DON’T KNOW GO TO Q23
REFUSED GO TO Q23
Q21. Did you make the co-pay at the time of service (READ LIST)
ALWAYS
SOMETIMES
NEVER GO TO Q23
COVERAGE
COPAYMENTS

Page 116 of 176
DON’T KNOW GO TO Q23
REFUSED GO TO Q23
Q22. Were the co-pays affordable? Yes or no?
YES
NO
DON’T KNOW
REFUSED
Q23. In the past 6 months, how often were you worried about having enough money to pay your copay? (READ LIST)
ALWAYS
SOMETIMES
RARELY
NEVER
DON’T KNOW
REFUSED
Q24. Did you know that HIP Plus does NOT require you to pay co-pays, but does require you to pay in advance for coverage through a monthly or annual payment?
YES, KNEW
NO, DIDN’T KNOW
DON’T KNOW
REFUSED
Q25. Do you prefer to pay copayments at the time of service, rather than paying in advance for your coverage through a monthly or annual payment to your POWER account?
(IF NEEDED: POWER account stands for Personal Wellness and Responsibility Account)
YES / PREFER CO-PAYMENTS NO / PAY IN ADVANCE GO TO Q27
DON’T KNOW GO TO Q27
REFUSED GO TO Q27
Q26. Why? (OPEN-END; RECORD RESPONSES; USE LIST FOR CODING)
SPECIFY:________________________________________________
DO NOT READ LIST BELOW; USE FOR CODING PURPOSES COPAYMENTS ARE CHEAPER
I DON’T USE A LOT OF SERVICES, SO I DON’T WANT TO PAY IF I DON’T NEED THE SERVICES
I DON’T HAVE THE MONEY EVERY MONTH
OTHER: (SPECIFY) ______________________________________________________________________
DON’T KNOW
REFUSED
HIP 2.0 POLICIES

Page 117 of 176
Q27. Did you know that, if you are in HIP Plus, you can use funds in your POWER account to pay for the first $2,500 of covered services?
YES / KNEW
NO / DIDN’T KNOW
DON’T KNOW
REFUSED
Q28. Did you know that, if some of the funds in a POWER account are rolled over to the next year, the monthly POWER account contribution will be reduced in the next year?
YES / KNEW
NO / DIDN’T KNOW
DON’T KNOW
REFUSED
Q29. Did you know that, if you do not make your monthly or annual POWER account contribution, you will be moved from HIP Plus to HIP Basic?
YES / KNEW
NO / DIDN’T KNOW
DON’T KNOW
REFUSED
Q30. Information from HIP shows that you used to be on HIP Plus but moved to HIP Basic because you never made your first monthly or annual POWER account contributions, or because you stopped making monthly or annual POWER account contributions. Can you explain why you never made or stopped making contributions for HIP Plus?
(OPEN-END; RECORD RESPONSES; USE LIST FOR CODING)
(ALLOW MULTIPLE RESPONSES)
CAN’T AFFORD/FEES TOO HIGH
DON’T NEED ADDITIONAL SERVICES
DON’T KNOW HOW TO START PAYING ON A MONTHLY BASIS
PREFER TO PAY COPAYMENTS FOR EACH SERVICE I USE
DO NOT WANT HIP PLUS OR ADDED BENEFITS
DON’T PLAN TO BE IN THE PROGRAM VERY LONG
I ALREADY GOT MY VISION/DENTAL SERVICES, AND DON’T NEED HIP PLUS ANYMORE
NOT OFFERED THE OPTION TO PAY ON A MONTHLY BASIS
DON’T UNDERSTAND THE PROGRAM/DIFFERENCES
NOT REQUIRED TO PAY THE CONTRIBUTION
FORGOT
OTHER REASON NOT LISTED ABOVE (SPECIFY):
DON’T KNOW GO TO Q31
REFUSED GO TO Q31
Q30a. Which of these reasons is the most important?
AFFORDABILITY

Page 118 of 176
Q31. The state checks your eligibility for HIP once a year. The next time the state checks your eligibility, you can move from HIP Basic to HIP Plus if you make your monthly/annual contributions to your POWER account. Did you know this?
YES / KNEW
NO / DIDN’T KNOW
DON’T KNOW
REFUSE
Q32. Would you rather remain in HIP Basic or move to HIP Plus, knowing that they are different?
REMAIN IN HIP BASIC
MOVE TO HIP PLUS
DON’T KNOW GO TO Q31
REFUSED
Q32a. Why? (OPEN-END; RECORD RESPONSES)
SPECIFY:
Q33. If HIP required you to pay $5 each month, would you continue to stay enrolled?
YES NO GO TO Q35
DON’T KNOW GO TO Q35
REFUSED GO TO Q35
Q34. What about $10? Would you continue to stay enrolled if HIP required you to pay $10 each month?
YES
NO
DON’T KNOW
REFUSED
We’re at the final questions. These will help ensure that we are getting opinions from a
wide range of HIP members.
Q35. What is the highest grade or year of school you have completed? (READ LIST)
GRADES 1 TO 8 (IF NEEDED: ELEMENTARY SCHOOL)
GRADES 9 TO 11 (IF NEEDED: SOME HIGH SCHOOL)
GRADE 12 OR GED (IF NEEDED: HIGH SCHOOL GRADUATE)
COLLEGE / TECHNICAL SCHOOL 1 TO 3 YEARS (IF NEEDED: SOME COLLEGE OR
ADDITIONAL TRAINING)
COLLEGE 4 YEARS OR MORE (IF NEEDED: COLLEGE GRADUATE)
(NO FORMAL EDUCATION)—DO NOT READ
DON’T KNOW
REFUSED
DEMOGRAPHICS

Page 119 of 176
Q36. As of this week, which of the following best describes your employment status?
(READ ALL OPTIONS, ALLOW MULTIPLE RESPONSES)
EMPLOYED FOR LESS THAN 20 HOURS A WEEK
EMPLOYED FOR 20 OR MORE HOURS A WEEK
SELF-EMPLOYED
UNEMPLOYED AND LOOKING FOR WORK
OUT OF WORK MORE THAN 1 YEAR
OUT OF WORK LESS THAN 1 YEAR
A HOMEMAKER
TAKING CARE OF AN ELDERLY PARENT OR A FAMILY MEMBER WITH A DISABILITY
A STUDENT
RETIRED
UNABLE TO WORK BECAUSE OF A PHYSICAL OR MENTAL HEALTH CONDITION
SOMETHING ELSE: (SPECIFY)
_____________________________________________________________
DON’T KNOW
REFUSED
CLOSE: On behalf of the Healthy Indiana Plan we thank you for participating in this survey. Your answers will help improve the program.

Page 120 of 176
Appendix C – HIP Member Survey (Plus)
Survey of Current Enrollees in the Healthy Indiana Plan (HIP)
PLUS
DESCRIPTION: This survey applies to individuals currently enrolled in in HIP PLUS, identified
with eligibility data.
CONFIRM ENROLLMENT IN HIP PLUS
Q1. The State of Indiana runs an insurance program called the Healthy Indiana Plan (or HIP) for Hoosiers age 19 to 64. Are you enrolled in the “Healthy Indiana Plan” or “HIP” at this time?
YES
NO CLOSE
DON’T KNOW CLOSE
REFUSED CLOSE
Q1a. Are you in HIP Basic or HIP Plus?
BASIC GO TO Q2
PLUS GO TO Q2
DON’T KNOW GO TO Q1b
REFUSED GO TO Q1b
Q1b. Based on information HIP provided it looks like you are in HIP Plus and make a monthly or annual payment to maintain your coverage. Is this correct?
YES
NO CLOSE
DON’T KNOW CLOSE
REFUSED CLOSE
Q2. Thinking about your overall experience with the Healthy Indiana Plan in the past six months, would you say you are:
VERY SATISFIED
SOMEWHAT SATISFIED
NEITHER SATISFIED NOR DISSATISFIED
SOMEWHAT DISSATISFIED
VERY DISSATISFIED
DON’T KNOW GO TO Q3
REFUSED GO TO Q3
Q2a. Why are you (FILL IN WITH PREVIOUS RESPONSE)? (OPEN-END; RECORD RESPONSES; USE LIST FOR CODING)
OPEN-ENDED RESPONSE
SPECIFY: ___________________________
SATISFACTION WITH HIP

Page 121 of 176
DO NOT READ LIST BELOW; USE FOR CODING PURPOSES.
CAN’T SEE MY DOCTOR WITH HIP
DISSATISFACTION WITH CHOICE OF DOCTOR’S IN HIP
HIP DOES NOT COVER DENTAL
HIP DOES NOT COVER VISION/OPTICAL
HIP DOES NOT COVER PROCEDURE/ MEDICATION
MANY DOCTORS DO NOT ACCEPT HIP
DISSATISFIED WITH ADMINISTRATIVE ISSUE(S) OR PROCESS
DISSATISFACTION WITH A PAYMENT RELATED ISSUE
CAN’T AFFORD CO-PAY/ TOO HIGH
CO-PAYMENT / MONTHLY/ ANNUAL PAYMENT TOO HIGH
LIKE HAVING COVERAGE/ INSURANCE
LIKE DOCTORS/ HOSPITALS / HEALTHCARE PROVIDERS
LIKE PAYMENTS / PRICE
LIKE THE PLAN/ PROVIDER
LIKE SOME THINGS/ DISLIKE OTHER THINGS
SOME THINGS NOT COVERED
DON’T KNOW
REFUSED
OTHER REASON NOT LISTED ABOVE: (SPECIFY) _________________________
Q3. If you ever left HIP, would you try to re-enroll if you became eligible for the program again?
YES
NO
DON’T KNOW
REFUSED
Q4. When you applied for HIP, did you make a fast track payment?
(IF NEEDED: A fast track payment is made when you complete your application. (IF NEEDED: Fast track payments allow you to get HIP coverage more quickly because
you pre-pay your first payment.) (IF NEEDED: By making the fast track payment when you apply, it may take less time
for your coverage to begin.)
YES
NO GO TO Q4b
DON’T KNOW GO TO Q5
REFUSED GO TO Q5
Q4a. Why did you decide to sign-up for the fast track payment option?
(OPEN-END; RECORD RESPONSES; USE LIST FOR CODING)
I WANTED MY COVERAGE AND/OR ELIGIBILITY TO BEGIN SOONER
I THOUGHT IT WAS A REQUIRED PART OF HIP
I THOUGHT IT WOULD BE EASIER TO PAY THEN (I.E., WOULDN’T HAVE TO MAIL/GO IN-PERSON, ETC.)
I HAD THE FUNDS AT THE TIME I APPLIED
OTHER REASON NOT LISTED ABOVE: (Specify) ______________________________
DON’T KNOW
REFUSED

Page 122 of 176
Q4b. Why did you decide NOT to sign-up for the fast track payment option?
(OPEN-END; RECORD RESPONSES; USE LIST FOR CODING)
I COULDN’T AFFORD TO MAKE THE PAYMENT
I WASN’T SURE IF I WOULD BE ELIGIBLE
I DIDN’T UNDERSTAND THE DIFFERENCE BETWEEN FAST TRACK AND THE REGULAR PAYMENT OPTION
I DIDN’T NEED COVERAGE TO START SOONER
I WASN’T AWARE OF THE OPTION TO SIGN-UP FOR FAST TRACK AT THE TIME I APPLIED
OTHER REASON NOT LISTED ABOVE: (Specify) ______________________________
DON’T KNOW
REFUSED
Q5. When you need treatment from a doctor or other health professional, do you ask how much the treatment will cost?
YES
NO
DON’T KNOW
REFUSED
Q6. Do you make a monthly or annual payment to be in HIP? (IF NEEDED: Do you pay something each month or once a year to be in HIP? Some call
this a monthly or annual contribution and others call it a monthly bill.) (IF NEEDED: annually is once a year for the entire year.)
MONTHLY ANNUAL
(DO NOT READ) NO I HAVE NOT MADE A MONTHLY/ANNUAL PAYMENT FOR HIP GO TO Q14
DON’T KNOW GO TO Q14
REFUSED GO TO Q14
Q7a. How much money do you pay each month? _______________________ (ASK ONLY IF Q6 = MONTHLY) (IF NEEDED: YOUR BEST ESTIMATE IS OK) (IF THEY GIVE A RANGE, RECORD THE HIGHEST ANSWER.)
DON’T KNOW
REFUSED
Q7b. How much money do you pay each year? _______________________ (ASK ONLY IF Q6 = ANNUAL) (IF NEEDED: YOUR BEST ESTIMATE IS OK) (IF THEY GIVE A RANGE, RECORD THE HIGHEST ANSWER.)
DON’T KNOW
REFUSED
AFFORDABILITY

Page 123 of 176
8. If HIP required you to pay $5 more each month, would you continue to stay enrolled? (IF NEEDED: more than your current payment amount.)
YES GO TO Q9 NO GO TO Q10 DON’T KNOW REFUSED
Q9. What about $10 more? Would you continue to stay enrolled if HIP required you to pay $10 more each month? ? (IF NEEDED: more than your current payment amount.)
YES NO DON’T KNOW REFUSED
Q10. In the past 6 months, how often were you worried about having enough money to pay your monthly contribution?
ALWAYS
USUSALLY
SOMETIMES
RARELY
NEVER
DON’T KNOW
REFUSED
Q11. When you received your bill for your monthly or annual HIP payment, did you get
any help with the cost from someone else such as a family member, friend,
employer, healthcare provider or charity?
YES NO GO TO Q13
DON’T KNOW GO TO Q13
REFUSED GO TO Q13
Q12. Please tell me yes or no if you received help in making the payments from each of these sources:
FAMILY MEMBER
FRIEND
CHARITY OR RELIGIOUS ORGANIZATION
A HEALTHCARE PROVIDER SUCH AS A DOCTOR’S OFFICE OR HOSPITAL EMPLOYER
SOME OTHER SOURCE (SPECIFY): ______________________________
Q13. Please tell me if you have used each of the following methods to make your payment:
CASH
CHECK
CREDIT CARD
DEBIT CARD
SOME OTHER METHOD (SPECIFY): ______________________________
DON’T KNOW

Page 124 of 176
REFUSED
Q14. In the last 6 months, did you make any appointments for a check-up or routine care at a doctor’s office or clinic?
YES
NO GO TO Q15
Q14a. In the last 6 months, how often did you get an appointment for a check-up or routine care at a doctor’s office or clinic as soon as you needed?
NEVER
SOMETIMES
USUALLY
ALWAYS
Q15. Specialists are doctors like surgeons, heart doctors, allergy doctors, skin doctors,
and other doctors who specialize in one area of healthcare. In the last 6 months, did you make any appointments to see a specialist?
YES
NO GO TO Q16
Q15a. In the last 6 months, how often did you get an appointment to see a specialist as
soon as you needed? NEVER
SOMETIMES
USUALLY
ALWAYS
Q16. In the last 6 months, did you get any new prescription medicines or refill a prescription? YES
NO GO TO Q17
Q16a. In the last 6 months, how often was it easy to get your prescription medicine from your health plan?
NEVER
SOMETIMES
USUALLY
ALWAYS
Q17. In the past six months, have you missed any healthcare appointments, such as doctor’s appointments? YES NO GO TO Q18
DON’T KNOW GO TO Q18
REFUSED GO TO Q18
Q17a. What are the reasons you missed an appointment? (READ FULL LIST; IF
MULTIPLE OPTIONS SELECTED, GO TO Q17B)
ACCESS

Page 125 of 176
COST TOO MUCH
COULDN’T GET CHILDCARE
COULDN’T GET TIME OFF FROM WORK
COULDN’T GET THROUGH ON THE PHONE
COULDN’T SCHEDULE APPOINTMENT SOON ENOUGH
DIDN’T GET APPROVAL FROM PLAN
DIDN’T HAVE TIME
DIDN’T WANT TO GO
HOURS OF OPERATION WERE NOT CONVENIENT FOR ME
NO INSURANCE
PLACE DID NOT ACCEPT THE INSURANCE COVERAGE
TAKES TOO LONG TO GET THERE
TRANSPORTATION PROBLEM
TOO SICK TO GO
OTHER (SPECIFY): _____________________________
Q17b. What is the most common reason you missed an appointment?
(IF RESPONDENT CHOOSES MORE THAN ONE OPTION FOR Q8A ABOVE.)
SPECIFY:
Q18. In the past six months, was there any time when you contacted a doctor’s office or clinic, but couldn’t get an appointment soon enough so you went to the emergency room instead?
YES
NO
DON’T KNOW
REFUSED
Q19. When you need to get healthcare, which of the following statements best
describes the type of transportation you use most often? (READ LIST)
I DRIVE MYSELF, USING MY OWN VEHICLE
SOMEONE ELSE DRIVES ME, USING MY OWN VEHICLE (IF NEEDED: (SUCH AS A FRIEND, NEIGHBOR, OR FAMILY))
SOMEONE ELSE DRIVES ME, USING THEIR VEHICLE (IF NEEDED: (SUCH AS A FRIEND, NEIGHBOR, OR FAMILY))
I TAKE A TAXI CAB/OR UBER
I TAKE THE BUS
SOME OTHER WAY (SPECIFY): ______________________
DON’T KNOW
REFUSED
Q20. Have you heard of the Healthy Indiana Plan POWER account, which stands for Personal Wellness and Responsibility Account?
YES
NO GO TO Q22
AWARENESS

Page 126 of 176
DON’T KNOW GO TO Q22
REFUSED GO TO Q22
Q20a. How did you hear or learn about the POWER account? (OPEN-END; RECORD RESPONSES; USE LIST FOR CODING)
MEMBER HANDBOOK
SOMEONE FROM THE PLAN CALLED AND EXPLAINED IT
HIP WEBSITE
HEALTH PLAN
DOCTOR OR HEALTHCARE PROFESSIONAL FAMILY/FRIENDS
OTHER (SPECIFY): _____________________________________
DON’T KNOW
REFUSED
Q21. Do you have a POWER account as part of your HIP insurance?
YES
NO GO TO Q22
DON’T KNOW GO TO Q22
REFUSED GO TO Q22
Q21a. How often do you check the balance in your POWER account? Would you say …
WEEKLY
A FEW TIMES A MONTH
MONTHLY
A FEW TIMES A YEAR BUT NOT EVERY MONTH
ONCE A YEAR
NEVER
DON’T KNOW
REFUSED
Q22. If you were to get preventive services, such as a cancer screening, do you think the cost would be deducted from your POWER account, if you have enough money available in the account?
YES
NO
DON’T KNOW
REFUSED
Q23. Has your health plan given you a HIP POWER Account debit card? (IF NEEDED: This is a card that can be used to access the funds in your POWER
account.)
YES
NO GO TO Q24
DON’T KNOW GO TO Q24
REFUSED GO TO Q24
Q23a. How often do you present the card to a healthcare provider? Is it… (READ LIST)
EVERY TIME YOU GET CARE

Page 127 of 176
SOME OF THE TIME
ONLY FOR SPECIFIC SERVICES
NEVER
DON’T KNOW
REFUSED
Q24. I’m going to read a couple of policies, please indicate whether you think the policy
is true or false.
The first policy states: “If you get preventive services suggested by your plan every year and have money left in your POWER account, part of that money will be rolled over to your account for next year.”
TRUE
FALSE
DON’T KNOW
REFUSED
Q25. The second policy states: “The second policy states: “If you do not get the preventive care that your health plan recommends during the year and you have money left over in my POWER account, the amount that is rolled over will not be doubled.”.”
TRUE
FALSE
DON’T KNOW
REFUSED
Q26. (BELOW 100% FPL) Are you aware that if you do not make payments, you lose some benefits and have to make co-payments for all services?
(IF NEEDED: A co-pay is a fee you would make to a doctor or provider at the time of
service. It is different from the monthly or annual payment.)
YES / AWARE
NO / NOT AWARE
DON’T KNOW
REFUSED
Q27. (ABOVE 100% FPL) Are you aware that if you do not make payments you can be terminated from HIP and not allowed to return for six months?
YES / AWARE
NO /NOT AWARE
DON’T KNOW
REFUSED
We’re at the final questions. These will help ensure that we are getting opinions from a
wide range of HIP members.
DEMOGRAPHICS

Page 128 of 176
Q28. What is the highest grade or year of school you have completed? (READ ALL OPTIONS) GRADES 1 TO 8 (IF NEEDED: ELEMENTARY SCHOOL)
GRADES 9 TO 11 (IF NEEDED: SOME HIGH SCHOOL)
GRADE 12 OR GED (IF NEEDED: HIGH SCHOOL GRADUATE)
COLLEGE / TECHNICAL SCHOOL 1 TO 3 YEARS (IF NEEDED: SOME COLLEGE OR
ADDITIONAL TRAINING)
COLLEGE 4 YEARS OR MORE (IF NEEDED: COLLEGE GRADUATE)
(NO FORMAL EDUCATION)—DO NOT READ
DON’T KNOW
REFUSED
Q29. As of this week which of the following best describes your employment status?
(READ ALL OPTIONS, ALLOW MULTIPLE RESPONSES)
EMPLOYED FOR LESS THAN 20 HOURS A WEEK
EMPLOYED FOR 20 OR MORE HOURS A WEEK
SELF-EMPLOYED
UNEMPLOYED AND LOOKING FOR WORK
OUT OF WORK MORE THAN 1 YEAR
OUT OF WORK LESS THAN 1 YEAR
A HOMEMAKER
TAKING CARE OF AN ELDERLY PARENT OR A FAMILY MEMBER WITH A DISABILITY
A STUDENT
RETIRED
UNABLE TO WORK BECAUSE OF A PHYSICAL OR MENTAL HEALTH CONDITION
SOMETHING ELSE (SPECIFY) _________________________
DON’T KNOW
REFUSED
CLOSE: On behalf of the Healthy Indiana Plan we thank you for participating in this survey. Your answers will help improve the program.

Page 129 of 176
Appendix D – Previous HIP Member Survey
Survey of Healthy Indiana Plan (HIP) Leavers or
Previous Members
DESCRIPTION: This survey applies to individuals who:
1. Were members but left the program for any reason (e.g., moved out of state, received coverage through Medicare)
2. Were members with income over 100% FPL who left the program for non-payment of the POWER account contribution
INTRODUCTION: Hello, this is (name) calling from the Farnsworth Group on behalf of the new
Healthy Indiana Plan—also known as HIP . May I please speak to (insert name)?
(Reintroduce, if necessary) Today we’re talking with Hoosiers who previously had HIP
insurance but no longer have it. The HIP coverage we are talking about today does not
include temporary Medicaid coverage or presumptive eligibility. We’re interested in your
opinions about the plan.
(IF NEEDED: By sharing your opinions you can help HIP improve services for everyone.)
Q1. Think about the new HIP insurance program that started in February 2015. Were
you enrolled in HIP insurance earlier this year, in 2015? (NOTE: CLARIFY ONLY
2015)
YES
NO GO TO CLOSE
DON’T KNOW GO TO CLOSE
REFUSED GO TO CLOSE
Q2. Just to confirm . . . you are not currently enrolled in HIP at this time. Is that correct? YES
NO GO TO CLOSE
DON’T KNOW GO TO CLOSE
REFUSED GO TO CLOSE
WHY ENROLLMENT ENDED
Q3. What are all the reasons you are no longer enrolled with HIP? (OPEN-END; RECORD RESPONSES; USE LIST FOR CODING) (ACCEPT MULTIPLE RESPONSE)
I EARNED TOO MUCH/INCREASE IN MY INCOME
I DIDN’T FINISH MY PAPERWORK IN TIME
DIDN’T KNOW HOW TO MAKE A MONTHLY PAYMENT
I COULDN’T PAY MY MONTHLY CONTRIBUTION
I HAD OTHER INSURANCE AVAILABLE TO ME
I BECAME PREGNANT WHILE ON HIP

Page 130 of 176
THEY CHANGED ME TO REGULAR MEDICAID
I DON’T KNOW WHY THEY TERMINATED MY COVERAGE
PAYMENT ERROR/MISUNDERSTANDING/CHECKING ACCOUNT PROBLEM/
LOST PAYMENT
LATE OR FORGOTTEN MONTHLY PAYMENT
EMPLOYER ERROR RELATED TO PAPERWORK
GOT MEDICARE
TRIED TO RE-ENROLL BUT STAFF COULDN’T HELP ME/SYSTEM FAILED/ IT DIDN’T WORK OUT
TRIED TO RE-ENROLL BUT THEY DIDN’T GET MY PAPERWORK DONE IN TIME
MOVED / NO LONGER LIVING IN INDIANA
INCARCERATED
PROBLEMS WITH APPEALS PROCESS
HIP PAPERWORK ERROR/MEMBER NEVER RECEIVED PAPERWORK/MEMBER SENT/PAPERWORK BUT HIP NEVER RECEIVED
CHANGED MY MIND / DON’T WANT COVERAGE
OTHER (SPECIFY): ________________________________
DON’T KNOW
REFUSED
Q4. Which reason for leaving HIP was the most important? ________________
(ASK ONLY IF RESPONDENT PROVIDED MULTIPLE REASONS FOR LEAVING HIP;
IF NEEDED RE-READ RESPONDENT’S SELECTIONS FROM ABOVE)
Q5. Did you make a monthly or annual payment when you were in HIP?
(ASK ONLY IF FILE SHOWS RESPONDENT USED TO BE IN HIP PLUS)
DID NOT MAKE A MONTHLY OR ANNUAL PAYMENT GO TO Q8
MONTHLY GO TO Q6
ANNUAL GO TO Q6
REFUSED GO TO Q8
DON’T KNOW GO TO Q8
Q6. Would you say the amount you contributed each month or year was:
(ASK ONLY OF RESPONDENTS WITH DATA FILE ENTRY FOR HIP PLUS)
WAY TOO MUCH
A LITTLE TOO MUCH
THE RIGHT AMOUNT
BELOW THE RIGHT AMOUNT
WAY BELOW THE RIGHT AMOUNT
(DO NOT READ) NEVER MADE A PAYMENT
DON’T KNOW
REFUSED
Q7. When you were enrolled in HIP, how often were you worried about having enough
money to pay your monthly contribution?
(ASK ONLY OF RESPONDENTS WITH DATA FILE ENTRY FOR HIP PLUS)
ALWAYS
USUALLY
SOMETIMES
RARELY

Page 131 of 176
NEVER
(DO NOT READ) NEVER MADE A PAYMENT
DON’T KNOW
REFUSED
Q8. Did you make co-payments when you were in HIP?
(ASK ONLY IF FILE SHOWS RESPONDENT USED TO BE IN HIP BASIC)
(IF NEEDED: COPAYMENTS ARE PAYMENTS YOU MAKE AT THE TIME YOU VISIT
YOUR DOCTOR'S OFFICE, GO TO THE HOSPITAL OR GET PRESCRIPTION
DRUGS.)
YES
NO GO TO Q10
DON’T KNOW GO TO Q10
REFUSED GO TO Q10
Q9. Would you say your co-payments were:
(ASK ONLY IF FILE SHOWS RESPONDENT USED TO BE IN HIP BASIC)
WAY TOO MUCH
A LITTLE TOO MUCH
THE RIGHT AMOUNT
BELOW THE RIGHT AMOUNT
WAY BELOW THE RIGHT AMOUNT
NEVER MADE A PAYMENT
DON’T KNOW
REFUSED
Q10. Are you aware that, in HIP, if you do not make monthly or annual payments you can
be terminated from the program and not allowed to return for six months?
(ASK ONLY OF RESPONDENTS WITH DATA FILE ENTRY FOR FPL ABOVE 100%)
YES / AWARE
NO / NOT AWARE
DON’T KNOW
REFUSED
Q11. Do you have any health insurance coverage right now?
YES GO TO Q13
NO
DON’T KNOW
REFUSED
Q12. So you are not insured right now, is that correct?
YES / NOT INSURED GO TO Q18
NO /HAVE COVERAGE CHANGE RESPONSE TO Q11, GO TO Q13
DON’T KNOW GO TO Q18

Page 132 of 176
REFUSED GO TO Q18
INDIVIDUALS WITH OTHER COVERAGE
Q13. What is your source of insurance coverage?
(ASK ONLY IF YES TO QUESTION 11 ABOUT CURRENTLY HAVING INSURANCE COVERAGE. ACCEPT MULTIPLE RESPONSES)
(OPEN-END; USE PRE-CODED LIST AND OTHER SPECIFY) (NOTE TO INTERVIEWERS: YOU MUST INDICATE WHETHER EMPLOYER
INSURANCE IS THROUGH SPOUSE OR INDIVIDUAL.)
THROUGH YOUR OWN EMPLOYER
THROUGH YOUR SPOUSE’S / PARTNER’S EMPLOYER
MEDICARE
MEDICAID OR HOOSIER HEALTHWISE, OR HOOSIER CARE CONNECT
TRICARE
VETERAN’S ADMINISTRATION
AN INDIVIDUAL POLICY
MARKETPLACE OR TAX CREDIT
SOME OTHER SOURCE (SPECIFY) __________________
DON’T KNOW
REFUSED
INDIVIDUALS WITH EMPLOYER COVERAGE
Q14. Do you or your spouse/partner have to pay a portion of the insurance that you get
from your employer?
(ASK ONLY IF ANSWER TO QUESTION 13 IS “THROUGH YOUR OWN EMPLOYER
OR THROUGH YOUR SPOUSE’S EMPLOYER”)
YES
NO
DON’T KNOW
REFUSED
Q15. In comparison to your previous HIP payments, would you say the amount you
contribute to your employer-sponsored coverage each month is…
(ASK ONLY IF ANSWER TO QUESTION 13 IS “THROUGH YOUR OWN EMPLOYER
OR THROUGH YOUR SPOUSE’S EMPLOYER”)
WAY TOO MUCH
A LITTLE TOO MUCH
THE RIGHT AMOUNT
BELOW THE RIGHT AMOUNT
WAY BELOW THE RIGHT AMOUNT
DON’T KNOW
REFUSED

Page 133 of 176
Q16. When you make your monthly or annual payment to your employer this year, will
you get any help with the cost from someone else such as a family member,
friend, healthcare provider or charity?
(ASK ONLY IF ANSWER TO QUESTION 13 IS “THROUGH YOUR OWN EMPLOYER
OR THROUGH YOUR SPOUSE’S EMPLOYER”)
YES
NO
DON’T KNOW
REFUSED
Q17. If HIP could help you pay for your employer-sponsored insurance, would you sign
up for that type of help?
(ASK ONLY IF ANSWER TO QUESTION 13 IS “THROUGH YOUR OWN EMPLOYER
OR THROUGH YOUR SPOUSE’S EMPLOYER”)
YES
NO
DON’T KNOW
REFUSED
ACCESS TO CARE
Q18. Since you left HIP, did you make any appointments for a check-up or routine care
at a doctor’s office or clinic?
YES
NO GO TO Q20
Q19. Since you left HIP, how often did you get an appointment for a check-up or
routine care at a doctor’s office or clinic as soon as you needed?
NEVER
SOMETIMES
USUALLY
ALWAYS
Q20. Specialists are doctors like surgeons, heart doctors, allergy doctors, skin
doctors, and other doctors who specialize in one area of healthcare. Since you
left HIP, did you make any appointments to see a specialist?
YES NO GO TO Q22
Q21. Since you left HIP, how often did you get an appointment to see a specialist as
soon as you needed?
NEVER
SOMETIMES
USUALLY
ALWAYS
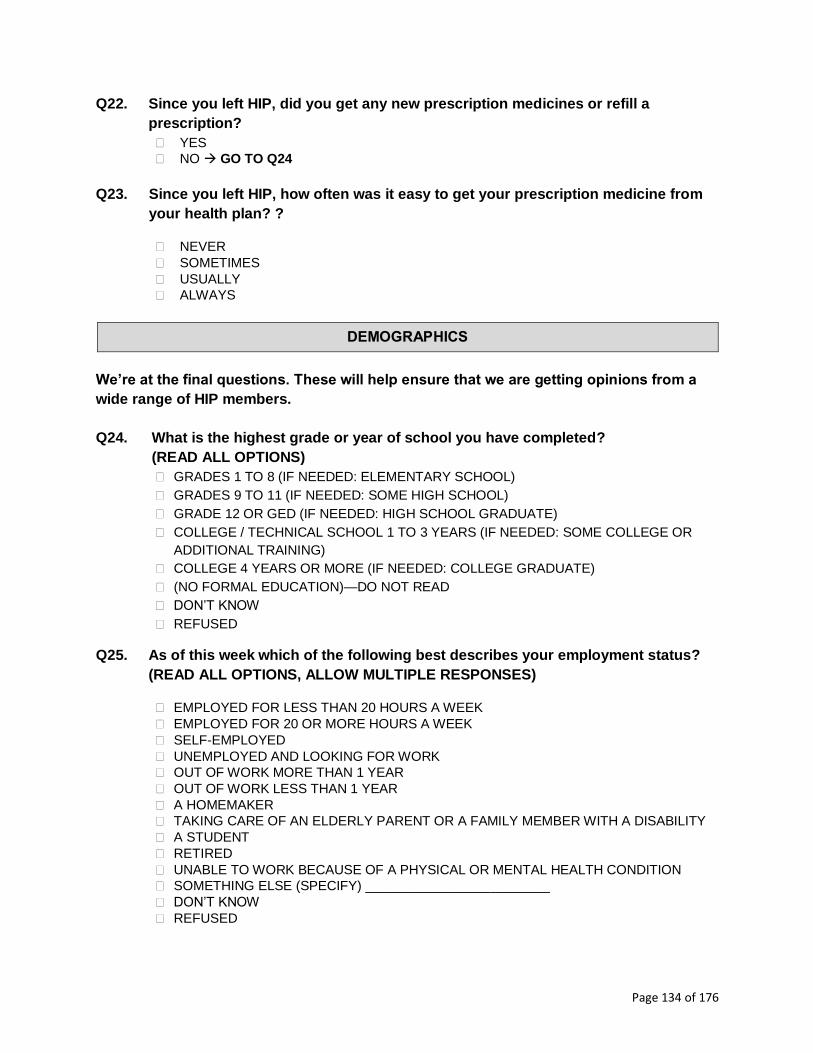
Page 134 of 176
Q22. Since you left HIP, did you get any new prescription medicines or refill a
prescription?
YES
NO GO TO Q24
Q23. Since you left HIP, how often was it easy to get your prescription medicine from
your health plan? ?
NEVER
SOMETIMES
USUALLY
ALWAYS
DEMOGRAPHICS
We’re at the final questions. These will help ensure that we are getting opinions from a
wide range of HIP members.
Q24. What is the highest grade or year of school you have completed?
(READ ALL OPTIONS)
GRADES 1 TO 8 (IF NEEDED: ELEMENTARY SCHOOL)
GRADES 9 TO 11 (IF NEEDED: SOME HIGH SCHOOL)
GRADE 12 OR GED (IF NEEDED: HIGH SCHOOL GRADUATE)
COLLEGE / TECHNICAL SCHOOL 1 TO 3 YEARS (IF NEEDED: SOME COLLEGE OR
ADDITIONAL TRAINING)
COLLEGE 4 YEARS OR MORE (IF NEEDED: COLLEGE GRADUATE)
(NO FORMAL EDUCATION)—DO NOT READ
DON’T KNOW
REFUSED
Q25. As of this week which of the following best describes your employment status?
(READ ALL OPTIONS, ALLOW MULTIPLE RESPONSES)
EMPLOYED FOR LESS THAN 20 HOURS A WEEK
EMPLOYED FOR 20 OR MORE HOURS A WEEK
SELF-EMPLOYED
UNEMPLOYED AND LOOKING FOR WORK
OUT OF WORK MORE THAN 1 YEAR
OUT OF WORK LESS THAN 1 YEAR
A HOMEMAKER
TAKING CARE OF AN ELDERLY PARENT OR A FAMILY MEMBER WITH A DISABILITY
A STUDENT
RETIRED
UNABLE TO WORK BECAUSE OF A PHYSICAL OR MENTAL HEALTH CONDITION
SOMETHING ELSE (SPECIFY) _________________________
DON’T KNOW
REFUSED

Page 135 of 176
CLOSE: On behalf of the Healthy Indiana Plan we thank you for participating in this
survey. Your answers will help improve the program.

Page 136 of 176
Appendix E – Never HIP Member Survey (No PAC)
Survey of Individuals Never Enrolled in the Healthy Indiana
Plan (HIP) – Did Not Make PAC
DESCRIPTION: This survey applies to individuals NOT currently enrolled in in HIP who were
determined eligible but did make their first POWER account contribution (PAC).
CONFIRM NEVER MEMBER STATUS
INTRODUCTION: “Hello, this is (name) calling from the Farnsworth Group on behalf of the Indiana Family and Social Services administration—sometimes called FSSA. We’re conducting a survey about how Hoosiers get their medical care. May I please speak to an adult head of household? (Reintroduce, if necessary) Today we’re conducting a survey for FSSA about how Hoosiers get their medical care. We want to talk to Hoosiers who have medical insurance coverage as well as those who do not.”
Q1. In February 2015 the state introduced an updated version of a Medicaid insurance program called HIP sometimes called the “Healthy Indiana Plan.” Prior to this phone call today, had you ever heard about this program before?
YES
NO GO TO Q3
DON’T KNOW GO TO Q3
REFUSED GO TO Q3
Q1a. Where did you hear or learn about HIP? (OPEN-END; RECORD RESPONSES; USE LIST FOR CODING) (RECORD MULTIPLE RESPONSES)
WEBSITE
FRIEND OR FAMILY
HEALTHCARE PROFESSIONAL / DOCTOR’S OFFICE / HOSPITAL, ETC.
TV
NEWSPAPER
RADIO
BILLBOARDS OR SIGNS
SIGNS ON BUSES
HAVE IT AS MY INSURANCE
SOME OTHER PLACE (SPECIFY)
DON’T KNOW
REFUSED
Q2. Do you have any HIP coverage right now?

Page 137 of 176
YES CLOSE
NO DON’T KNOW CLOSE
REFUSED CLOSE
Q3. Do you have any health insurance coverage right now?
YES
NO GO TO Q 4
DON’T KNOW GO TO Q4
REFUSED GO TO Q4
Q3a. What type of coverage do you have now? (SELECT ALL THAT APPLY)
HIP GO TO CLOSE
THROUGH YOUR OWN EMPLOYER
THROUGH YOUR SPOUSE’S EMPLOYER
MEDICARE
MEDICAID OR HOOSIER HEALTHWISE, OR HOOSIER CARE CONNECT
TRICARE
VETERAN’S ADMINISTRATION (VA)
AN INDIVIDUAL POLICY
MARKETPLACE OR TAX CREDIT
SOME OTHER SOURCE (SPECIFY) __________________
DON’T KNOW
REFUSED
NON-PAYMENT OF PAC
Q4. Did you complete an application for HIP in 2015?
YES
NO SKIP TO Q7
DON’T KNOW SKIP TO Q7
REFUSED SKIP TO Q7
Q5. Once you complete an application for HIP, you are required to make a payment
before your coverage starts. Were you aware of this prior to this call? YES
NO
DON’T KNOW
REFUSED
Q6. Did you make your first HIP payment in 2015?
YES GO TO CLOSE
NO GO TO Q7
DON’T KNOW GO TO Q7
REFUSED GO TO Q7
Q6a. What is the main reason you did not make your first payment?
(OPEN-END; RECORD RESPONSES; USE LIST FOR CODING)
CAN’T AFFORD/FEES TOO HIGH

Page 138 of 176
CHANGED MY MIND ABOUT WANTING HIP COVERAGE
GOT OTHER INSURANCE
DON’T NEED ADDITIONAL SERVICES
DON’T KNOW HOW TO START PAYING ON A MONTHLY BASIS
DO NOT WANT HIP PLUS OR ADDED BENEFITS
DON’T PLAN TO BE IN THE PROGRAM VERY LONG
NOT OFFERED THE OPTION TO PAY ON A MONTHLY BASIS
DON’T UNDERSTAND THE PROGRAM/DIFFERENCES
NOT REQUIRED TO PAY THE CONTRIBUTION
FORGOT
OTHER REASON NOT LISTED ABOVE: (SPECIFY) ______________________________
DON’T KNOW
REFUSED
FUTURE HIP COVERAGE
Q7. Do you plan to apply for health coverage assistance through Medicaid or HIP in the
future? (IF NEEDED: “ HIP is Healthy Indiana Plan” -- a health insurance program
for uninsured Hoosiers that provides coverage for Hoosiers ages 19 to 64.)
YES GO TO Q9
NO
DON’T KNOW GO TO Q9
REFUSED GO TO Q9
Q8. Why do you NOT plan to apply for Medicaid or HIP in the future? (OPEN-END; RECORD RESPONSES; USE LIST FOR CODING)
DON’T KNOW WHERE TO GET APPLICATION
DON’T KNOW WHERE TO SUBMIT AN APPLICATION: DON’T KNOW WHAT OFFICE TO GO TO DON’T HAVE INTERNET ACCESS DON’T KNOW I CAN APPLY BY PHONE
DON'T NEED IT, HEALTHY
DON'T WANT PUBLIC ASSISTANCE
DIDN’T KNOW ABOUT IT
DON’T UNDERSTAND IT
NOT SURE ABOUT ELIGIBILITY / NOT ELIGIBLE
CAN’T AFFORD PAYMENTS
HAVE ACCESS TO OTHER INSURANCE
ALREADY INSURED
PAY FOR MEDICAL COVERAGE WITHOUT INSURANCE
JUST GO TO THE EMERGENCY ROOM
JUST MOVED HERE
GOING TO MOVE AWAY
OTHER (SPECIFY)
DON’T KNOW
REFUSED

Page 139 of 176
Q9. Some people make a monthly contribution to be in HIP. If HIP required you to pay $5 each month to be enrolled, would you enroll? YES
NO
DON’T KNOW GO TO Q11
REFUSED GO TO Q11
Q10. What about $10? Would you enroll if HIP required you to pay $10 each month? YES
NO
DON’T KNOW
REFUSED
ACCESS
Q11. In the last 6 months, did you make any appointments for a check-up or routine
care at a doctor’s office or clinic?
YES
NO GO TO Q13
DON’T KNOW GO TO Q13
REFUSED GO TO Q13
Q12. In the last 6 months, how often did you get an appointment for a check-up or routine care at a doctor’s office or clinic as soon as you needed?
NEVER
SOMETIMES
USUALLY
ALWAYS
Q13. Specialists are doctors like surgeons, heart doctors, allergy doctors, skin doctors,
and other doctors who specialize in one area of healthcare. In the last 6 months, did you make any appointments to see a specialist?
YES
NO GO TO Q15
Q14. In the last 6 months, how often did you get an appointment to see a specialist as
soon as you needed?
NEVER
SOMETIMES
USUALLY
ALWAYS
Q15. In the last 6 months, did you get any new prescription medicines or refill a
prescription? YES NO GO TO Q17

Page 140 of 176
Q16. In the last 6 months, how often was it easy to get your prescription medicine from your health plan? NEVER
SOMETIMES
USUALLY
ALWAYS
We’re at the final questions. These will help ensure that we are getting opinions from a
wide range of HIP members.
Q17. Including yourself, how many total people (adults and children) are in your
household?
1
2
3
4
5
6
7
8
MORE THAN 8
DON’T KNOW
REFUSED
Q18. Please stop me when I read the amount that best describes your family’s monthly
household income. Would that be . . . .
LESS THAN $1,000
MORE THAN $1,000 UP TO $1,400
BETWEEN $1,400 AND $1,700,
BETWEEN $1,700 AND $2,000
BETWEEN $2,000 AND $2,300
BETWEEN $2,300 AND $2,700
BETWEEN $2,700 AND $3,000
BETWEEN $3,000 AND $3,400
MORE THAN $3,400 PER MONTH
DON’T KNOW
REFUSED
Q18. What is the highest grade or year of school you have completed?
(READ ALL OPTIONS)
GRADES 1 TO 8 (IF NEEDED: ELEMENTARY SCHOOL)
GRADES 9 TO 11 (IF NEEDED: SOME HIGH SCHOOL)
GRADE 12 OR GED (IF NEEDED: HIGH SCHOOL GRADUATE)
COLLEGE / TECHNICAL SCHOOL 1 TO 3 YEARS (IF NEEDED: SOME COLLEGE OR ADDITIONAL TRAINING)
COLLEGE 4 YEARS OR MORE (IF NEEDED: COLLEGE GRADUATE)
(NO FORMAL EDUCATION)—DO NOT READ
DON’T KNOW
DEMOGRAPHICS

Page 141 of 176
REFUSED
Q19. As of this week, which of the following best describes your employment status?
(READ ALL OPTIONS, ALLOW MULTIPLE RESPONSES)
EMPLOYED FOR LESS THAN 20 HOURS A WEEK
EMPLOYED FOR 20 OR MORE HOURS A WEEK
SELF-EMPLOYED
UNEMPLOYED AND LOOKING FOR WORK
OUT OF WORK MORE THAN 1 YEAR
OUT OF WORK LESS THAN 1 YEAR
A HOMEMAKER
TAKING CARE OF AN ELDERLY PARENT OR A FAMILY MEMBER WITH A DISABILITY
A STUDENT
RETIRED
UNABLE TO WORK BECAUSE OF A PHYSICAL OR MENTAL HEALTH CONDITION
SOMETHING ELSE (SPECIFY) _________________________
DON’T KNOW
REFUSED
CLOSE: On behalf of the Healthy Indiana Plan we thank you for participating in this survey. Your answers will help improve the program.

Page 142 of 176
Appendix F – Never HIP Member (Presumptive Eligibility)
Survey of Individuals Never Enrolled in the Healthy Indiana
Plan (HIP) – Presumptive Eligibility (PE)
DESCRIPTION: This survey applies to individuals NOT currently enrolled in in HIP who were
determined eligible for Presumptive Eligibility (PE) but did not complete an application to
obtain full coverage. Individuals in this population were identified using eligibility data.
CONFIRM NEVER MEMBER STATUS
Q1. In February 2015 the state introduced an updated version of a Medicaid insurance program called HIP 2.0, sometimes called the “Healthy Indiana Plan.” Prior to this phone call today, had you ever heard about this program before?
YES
NO GO TO Q3
DON’T KNOW GO TO Q3
Q1a. Where did you hear or learn about HIP? (OPEN-END; RECORD RESPONSES; USE LIST FOR CODING)
WEBSITE
FRIEND OR FAMILY
HEALTHCARE PROFESSIONAL / DOCTOR’S OFFICE / HOSPITAL, ETC.
TV
NEWSPAPER
RADIO
BILLBOARDS OR SIGNS
SIGNS ON BUSES
HAVE IT AS MY INSURANCE
SOME OTHER PLACE (SPECIFY)
DON’T KNOW
REFUSED
Q2. Do you have any HIP coverage right now?
(IF NEEDED: Are you insured under the HIP plan now? )
YES CLOSE
NO
DON’T KNOW CLOSE
REFUSED CLOSE
Q3. Do you have any health insurance coverage right now?
YES
NO GO TO Q4
DON’T KNOW GO TO Q4

Page 143 of 176
REFUSED GO TO Q4
Q3a. What type of coverage do you have now? (SELECT ALL THAT APPLY)
HIP GO TO CLOSE
THROUGH YOUR OWN EMPLOYER
THROUGH YOUR SPOUSE’S EMPLOYER
MEDICARE
MEDICAID OR HOOSIER HEALTHWISE, OR HOOSIER CARE CONNECT
TRICARE
VETERAN’S ADMINISTRATION (VA)
AN INDIVIDUAL POLICY
MARKETPLACE OR TAX CREDIT
SOME OTHER SOURCE (SPECIFY) __________________
DON’T KNOW
REFUSED
Q4. At any point in this year did you have temporary Medicaid coverage through presumptive eligibility? (IF NEEDED: To receive this type of coverage, someone at a healthcare providers’ office or hospital would have helped you apply for temporary coverage)
YES
NO GO TO Q10
DON’T KNOW GO TO Q10
REFUSED GO TO Q10
Q5. Next, I’m going to read a list of places where someone could have helped you apply for temporary Medicaid coverage. Please tell me which one of these was the location where someone helped you apply for temporary Medicaid coverage.
A HOSPITAL
PSYCHIATRIC HOSPITAL
COMMUNITY MENTAL HEALTH CENTER
LOCAL HEALTH DEPARTMENT
A PROVIDER TREATING YOU BECAUSE YOU WERE PREGNANT
SOME OTHER PLACE (SPECIFY)
DON’T KNOW
REFUSED
Q6. That coverage was temporary. To keep it, you had to fill out a longer application by phone, online or in-person. Did you complete an application and obtain full Medicaid coverage after receiving temporary coverage? YES GO TO Q8
NO
DON’T KNOW GO TO Q8
REFUSED GO TO Q8
PRESUMPTIVE ELIGIBLITY

Page 144 of 176
Q7. What are the reasons you didn’t complete the full application or obtain full coverage?
(OPEN-END; RECORD RESPONSES; USE LIST FOR CODING)
SENT APPLICATION BUT WAS TOLD THAT IT WAS INCOMPLETE
DIDN’T KNOW OR FORGOT THAT I NEEDED TO COMPLETE AN APPLICATION
DIDN’T KNOW HOW TO APPLY OR SUBMIT AN APPLICATION
CHANGED MY MIND ABOUT WANTING HIP COVERAGE
GOT OTHER INSURANCE
DIDN’T WANT COVERAGE
PREFER TO PAY FOR MEDICAL COVERAGE WITHOUT INSURANCE
DID SUBMIT APPLICATION, BUT FOUND INELIGIBLE
OTHER (SPECIFY)
DON’T KNOW
REFUSED
Q8. Did the hospital, health center, doctor or health department that helped you sign up for temporary coverage follow up to remind you to submit a full application?
YES
NO
DON’T KNOW
REFUSED
Q9. When Temporary Medicaid was set for you, you were enrolled in a health plan to manage your benefits. Did the health plan that you were assigned to for temporary coverage follow up to remind you to submit a full application? (IF NEEDED: By health plan, I mean the company such as Anthem, MDwise, or MHS.)
YES
NO
DON’T KNOW
REFUSED
Q10. Do you plan to apply for health coverage assistance through Medicaid or HIP in the future? (IF NEEDED: “HIP is Healthy Indiana Plan” – a health insurance program for uninsured Hoosiers that provides coverage for Hoosiers ages 19 to 64.)
YES GO TO Q12
NO
DON’T KNOW GO TO Q12
REFUSED GO TO Q12
Q11. Why do you not plan to apply for Medicaid or HIP in the future?
(OPEN-END; RECORD RESPONSES; USE LIST FOR CODING)
DON’T KNOW WHERE TO GET APPLICATION
DON’T KNOW WHERE TO SUBMIT AN APPLICATION: DON’T KNOW WHAT OFFICE TO GO TO
FUTURE HIP COVERAGE

Page 145 of 176
DON’T HAVE INTERNET ACCESS DON’T KNOW I CAN APPLY BY PHONE
DON'T NEED IT, HEALTHY
DON'T WANT PUBLIC ASSISTANCE
DIDN’T KNOW ABOUT IT
DON’T UNDERSTAND IT
NOT SURE ABOUT ELIGIBILITY / NOT ELIGIBLE
CAN’T AFFORD PAYMENTS
HAVE ACCESS TO OTHER INSURANCE
ALREADY INSURED
PAY FOR MEDICAL COVERAGE WITHOUT INSURANCE
JUST GO TO THE EMERGENCY ROOM
JUST MOVED HERE
GOING TO MOVE AWAY
OTHER (SPECIFY)
DON’T KNOW
REFUSED
Q12. Some people make a monthly contribution to be in HIP. If HIP required you to pay $5 each month to be enrolled, would you enroll?
YES
NO GO TO Q14
DON’T KNOW GO TO Q14
REFUSED GO TO Q14
Q13. What about $10? Would you enroll if HIP required you to pay $10 each month?
YES
NO
DON’T KNOW
REFUSED
Q14. In the last 6 months, did you make any appointments for a check-up or routine care at a doctor’s office or clinic?
YES
NO GO TO Q16
DON’T KNOW GO TO Q16
REFUSED GO TO Q16
Q15. In the last 6 months, how often did you get an appointment for a check-up or routine care at a doctor’s office or clinic as soon as you needed?
NEVER
SOMETIMES
USUALLY
ALWAYS
ACCESS (CAHPS QUESTIONS)

Page 146 of 176
Q16. Specialists are doctors like surgeons, heart doctors, allergy doctors, skin doctors, and other doctors who specialize in one area of healthcare. In the last 6 months, did you make any appointments to see a specialist?
YES
NO GO TO Q18
DON’T KNOW GO TO Q18
REFUSED GO TO Q18
Q17. In the last 6 months, how often did you get an appointment to see a specialist as
soon as you needed?
NEVER
SOMETIMES
USUALLY
ALWAYS
Q18. In the last 6 months, did you get any new prescription medicines or refill a
prescription?
YES NO GO TO Q20
Q19. In the last 6 months, how often was it easy to get your prescription medicine from
your health plan? NEVER
SOMETIMES
USUALLY
ALWAYS
We’re at the final questions. These will help ensure that we are getting opinions from a
wide range of HIP members.
Q20. Including yourself, how many total people (adults and children) are in your
household?
1
2
3
4
5
6
7
8
MORE THAN 8
DON’T KNOW
REFUSED
Q21. Please stop me when I read the amount that best describes your family’s monthly
household income. Would that be . . . .
DEMOGRAPHICS

Page 147 of 176
LESS THAN $1,000
MORE THAN $1,000 UP TO $1,400
BETWEEN $1,400 AND $1,700,
BETWEEN $1,700 AND $2,000
BETWEEN $2,000 AND $2,300
BETWEEN $2,300 AND $2,700
BETWEEN $2,700 AND $3,000
BETWEEN $3,000 AND $3,400
MORE THAN $3,400 PER MONTH
DON’T KNOW
REFUSED
Q21. What is the highest grade or year of school you have completed?
(READ ALL OPTIONS)
GRADES 1 TO 8 (IF NEEDED: ELEMENTARY SCHOOL)
GRADES 9 TO 11 (IF NEEDED: SOME HIGH SCHOOL)
GRADE 12 OR GED (IF NEEDED: HIGH SCHOOL GRADUATE)
COLLEGE / TECHNICAL SCHOOL 1 TO 3 YEARS (IF NEEDED: SOME COLLEGE OR ADDITIONAL TRAINING)
COLLEGE 4 YEARS OR MORE (IF NEEDED: COLLEGE GRADUATE)
(NO FORMAL EDUCATION)—DO NOT READ
DON’T KNOW
REFUSED
Q22. As of this week, which of the following best describes your employment status
(READ ALL OPTIONS, ALLOW MULTIPLE RESPONSES)?
EMPLOYED FOR LESS THAN 20 HOURS A WEEK
EMPLOYED FOR 20 OR MORE HOURS A WEEK
SELF-EMPLOYED
UNEMPLOYED AND LOOKING FOR WORK
OUT OF WORK MORE THAN 1 YEAR
OUT OF WORK LESS THAN 1 YEAR
A HOMEMAKER
TAKING CARE OF AN ELDERLY PARENT OR A FAMILY MEMBER WITH A DISABILITY
A STUDENT
RETIRED
UNABLE TO WORK BECAUSE OF A PHYSICAL OR MENTAL HEALTH CONDITION
SOMETHING ELSE (SPECIFY) _________________________
DON’T KNOW
REFUSED
CLOSE: On behalf of the Healthy Indiana Plan we thank you for participating in this survey. Your answers will help improve the program.

Page 148 of 176
Appendix G – HIP Providers Survey
Survey of Healthy Indiana Plan (HIP) Providers
DESCRIPTION: This survey applies to clinicians, practice managers, or others responding on
behalf of healthcare providers that serve HIP members.
OPENING QUESTIONS
Q1. What is your role in the practice?
OFFICE MANAGER/PRACTICE ADMINISTRATOR
CLINICIAN
OTHER (SPECIFY) _________________
Q2. As a provider, which of the following Indiana programs do you participate in?
READ LIST. (SELECT ALL THAT APPLY)
HOOSIER HEALTHWISE (HHW)
HIP
HOOSIER CARE CONNECT (HCC)
FEE-FOR-SERVICE (TRADITIONAL MEDICAID)
Q3. What is your practice setting?
(READ LIST. ALLOW MULTIPLE ANSWER CHOICES)
SOLO/INDIVIDUAL PRACTICE
SINGLE-SPECIALTY GROUP (THIS CAN BE EITHER PRIMARY CARE OR SPECIALISTS)
MULTI-SPECIALTY GROUP (THIS CAN INCLUDE BOTH PRIMARY CARE AND SPECIALISTS)
ACUTE CARE HOSPITAL OR PHYSICIAN HOSPITAL ORGANIZATION (PHO)
FEDERALLY QUALIFIED HEALTH CENTER (FQHC)
RURAL HEALTH CENTER (RHC)
OTHER (PLEASE SPECIFY) _______________
Q4. Are your providers…? READ LIST
A PCP (PRIMARY CARE PROVIDER – THAT IS, INTERNAL MEDICINE, FAMILY PRACTICE)
AN OB/GYN
OTHER SPECIALIST (SPECIFY :_________________)
NONE OF THE ABOVE
Q5. Did you, as a provider, participate in the original HIP program?
YES
NO
DON’T KNOW
REFUSED
IF NOT SELECTED, GO TO CLOSE1

Page 149 of 176
PAYMENT QUESTIONS
Q6a. How does the reimbursement for this program compare to the Medicare program?
Would you say it …? READ LIST
(NOTE: Currently HIP Reimburses at Medicare rates or 130% of the Medicaid rate if
a Medicare rate does not exist.)
REIMBURSES AT THE SAME RATE
REIMBURSES AT A HIGHER RATE
REIMBURSES AT A LOWER RATE
DON’T KNOW
REFUSED
Q6b. Does the reimbursement rate influence your decision to participate in the program? YES
NO
DON’T KNOW
REFUSED
Q7. Were you aware that the State has increased Fee-For-Service
reimbursement for all Medicaid programs, including non-HIP programs such as
Hoosier Healthwise?
YES
NO
DON’T KNOW
REFUSED
Q8. ASK Q. 8 IF ONLY HIP IS CHECKED IN Q. 2. OTHERWISE, SKIP TO Q, 9a
(ASK ONLY IF RESPONDENT INDICATED THAT PRACTICE ACCEPTS HIP BUT
NOT ANY OF THE OTHER MEDICAID PROGRAMS IN Q. 2)
You mentioned that you accept HIP, but not other Medicaid programs. What are
your reasons for only accepting HIP?
THE OTHER PROGRAMS HAVE A LOWER REIMBURSEMENT RATE
I WAS NOT AWARE OF THE OPTION TO COVER OTHER PROGRAMS
ADMINISTRATIVE BURDEN
I USED TO COVER THE OTHER PROGRAMS BUT DON’T ANYMORE
OTHER (PLEASE SPECIFY):_____________________
Q9a. With HIP 2.0, some members are responsible for copayments. Do you know how
to find out if the patient is required to pay copayments?
YES
NO
DON’T KNOW
REFUSED
Q9b. How do you find out if the patient is required to pay a copayment?
GO TO Q7
GO TO Q9b
GO TO Q9c
GO TO Q6b
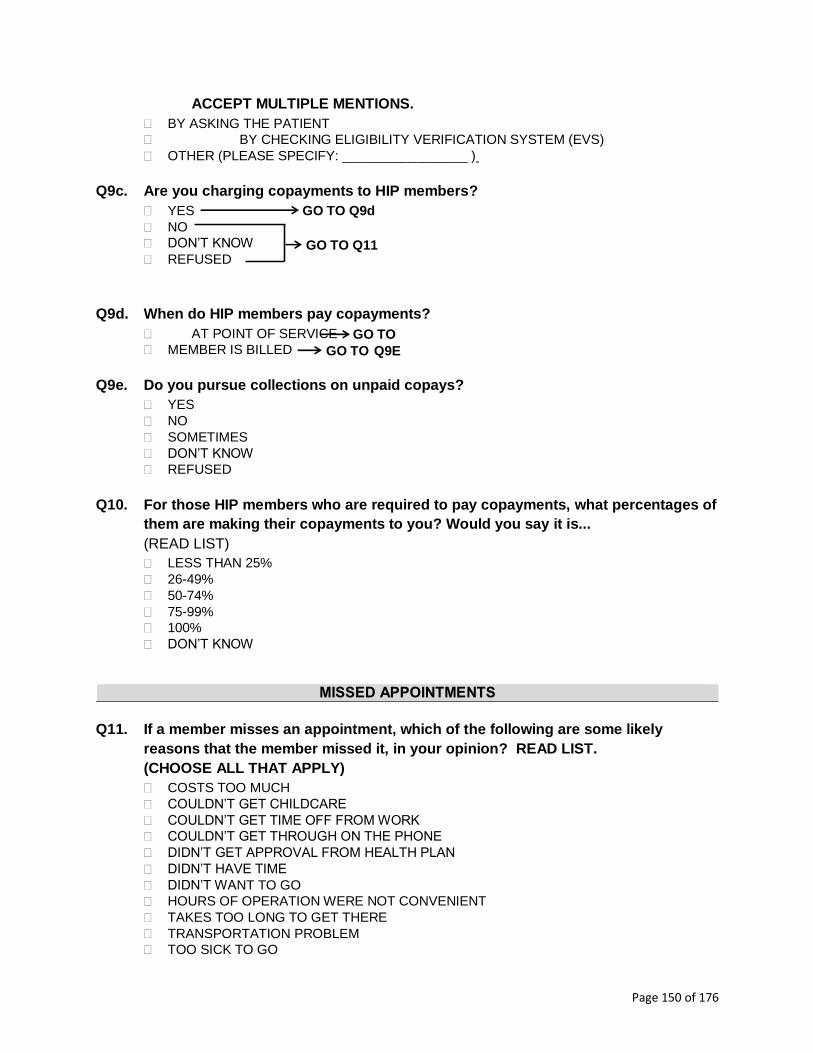
Page 150 of 176
ACCEPT MULTIPLE MENTIONS.
BY ASKING THE PATIENT
BY CHECKING ELIGIBILITY VERIFICATION SYSTEM (EVS)
OTHER (PLEASE SPECIFY: _________________ )
Q9c. Are you charging copayments to HIP members?
YES
NO
DON’T KNOW
REFUSED
Q9d. When do HIP members pay copayments?
AT POINT OF SERVICE
MEMBER IS BILLED
Q9e. Do you pursue collections on unpaid copays?
YES
NO
SOMETIMES
DON’T KNOW
REFUSED
Q10. For those HIP members who are required to pay copayments, what percentages of
them are making their copayments to you? Would you say it is...
(READ LIST)
LESS THAN 25%
26-49%
50-74%
75-99%
100%
DON’T KNOW
MISSED APPOINTMENTS
Q11. If a member misses an appointment, which of the following are some likely
reasons that the member missed it, in your opinion? READ LIST.
(CHOOSE ALL THAT APPLY)
COSTS TOO MUCH
COULDN’T GET CHILDCARE
COULDN’T GET TIME OFF FROM WORK
COULDN’T GET THROUGH ON THE PHONE
DIDN’T GET APPROVAL FROM HEALTH PLAN
DIDN’T HAVE TIME
DIDN’T WANT TO GO
HOURS OF OPERATION WERE NOT CONVENIENT
TAKES TOO LONG TO GET THERE
TRANSPORTATION PROBLEM
TOO SICK TO GO
GO TO Q9d
GO TO Q11
GO TO
Q1
0
GO TO Q9E

Page 151 of 176
OTHER (PLEASE SPECIFY)
I DON’T KNOW
Q11a. Which of the reasons that you just mentioned, do you feel is the most common
reason for a member to miss an appointment?
COSTS TOO MUCH
COULDN’T GET CHILDCARE
COULDN’T GET TIME OFF FROM WORK
COULDN’T GET THROUGH ON THE PHONE
DIDN’T GET APPROVAL FROM HEALTH PLAN
DIDN’T HAVE TIME
DIDN’T WANT TO GO
HOURS OF OPERATION WERE NOT CONVENIENT
TAKES TOO LONG TO GET THERE
TRANSPORTATION PROBLEM
TOO SICK TO GO
OTHER (PLEASE SPECIFY)
I DON’T KNOW
Q12. When members missed appointments, do you feel that it had an impact on
members receiving preventive care?
YES
NO
SOMETIMES
DON’T KNOW
REFUSED
Q13. When members missed appointments, do you feel that it had an impact on
members’ overall quality of care?
YES GO TO Q14
NO GO TO Q15
SOMETIMES GO TO Q14
DON’T KNOW
REFUSED
Q14. How has it impacted members’ quality of care? [Free response]
PRESUMPTIVE ELIGIBILITY
Q15. Are you a qualified Presumptive Eligibility provider?
YES
NO
DON’T KNOW
REFUSED
Q16. Which of the following types of Presumptive Eligibility processes do you
conduct?
GO TO Q20
GO TO Q16
GO TO Q15

Page 152 of 176
(READ LIST, SELECT ALL THAT APPLY)
PE FOR PREGNANT WOMEN (PEPW) ONLY
HOSPITAL PE (HPE)
REGULAR PE (PE)
DON’T KNOW
REFUSED
Q17. Thinking about the Presumptive Eligibility (PE) process, how would you rate the
overall effectiveness of the PE process at eliminating gaps in healthcare
coverage?
Would you say you rate it …? (READ LIST)
VERY EFFECTIVE
SOMEWHAT EFFECTIVE
NOT THAT EFFECTIVE
NOT EFFECTIVE AT ALL
DON’T KNOW
REFUSED
Q18. Do you track how many people who signed up for Presumptive Eligibility
coverage went on to complete an application?
YES
NO
DON’T KNOW
REFUSED
Q19. What would you say is the success rate of your PE members getting full HIP
coverage? Would you say it is … (READ LIST)
LESS THAN 25%
25-49%
50-74%
75-99%
100%
DON’T KNOW
OVERALL THOUGHTS ON HIP
Q20. How do you feel HIP will impact your overall revenues? Do you feel it will…
(READ LIST)
INCREASE OVERALL REVENUES
DECREASE OVERALL REVENUES
KEEP THEM THE SAME, HAVE NO EFFECT ON OVERALL REVENUES
DON’T KNOW
REFUSED
Q21. How do you feel HIP will affect health or healthcare overall in Indiana? Do you feel
it will…
(READ LIST)

Page 153 of 176
MAKE IT BETTER
MAKE NO DIFFERENCE
MAKE IT WORSE
DON’T KNOW
REFUSED
Q22. Some Hoosier Healthwise adults moved into HIP. Have these changes had any
impact on your organization’s uncompensated care, charity care or bad debt?
YES - GO TO Q.22a
NO – STAYED THE SAME – GO TO Q.23
DON’T KNOW – GO TO Q. 23
REFUSED – GO TO Q.23
IF YES IN Q. 22, ASK Q.22a.
Q22a. How have these changes impacted your uncompensated care, charity care or bad
debt?
(Free response)
Q23. Since HIP started in February 2015, have you seen a decline in…
a. The number of patients without insurance YES – NUMBER OF PATIENTS WITHOUT INSURANCE DECLINED
NO – NUMBER OF PATIENTS WITHOUT INSURANCE INCREASED
NO – NUMBER OF PATIENTS WITHOUT INSURANCE STAYED THE SAME
DON’T KNOW
b. The number of requests for charity care cases that the practice receives
YES – IT DECREASED
NO – IT INCREASED
NO – IT STAYED THE SAME
DON’T KNOW
c. The instances of Bad Debt
YES – IT DECREASED
NO – IT INCREASED
NO – IT STAYED THE SAME
DON’T KNOW
> CLOSE1< Thank you for answering these questions. May I please confirm the following
information? This survey is meant to be completed by clinicians or practice managers who provide services to HIP members. If you have any questions about HIP please call 1-877-438-4479. Thank you and have a good (day/night).
INTERVIEWER: HANG UP. CODE CASE AS INELIGIBLE—DOES NOT MEET SURVEY CRITERIA
CLOSE: That concludes our survey questions. May I please confirm the following information?
NAME ________________________________

Page 154 of 176
PROVIDER SITE ___________________________________
ADDRESS _________________________________________
CITY ______________________________ STATE _________________
ZIP CODE ____________ COUNTY _________________
TELEPHONE NUMBER ____________
CLOSE: Thank you for answering these questions. On behalf of the Healthy Indiana Plan we
thank you for participating in this survey. Your answers will help improve the
program.

Page 155 of 176
Appendix H – Survey Analysis Plan
I. Introduction
Indiana will use provider and member surveys - including current members and non-members - to help
evaluate the Healthy Indiana Plan 2.0 (HIP 2.0) program. Indiana plans to administer at least two rounds
of the surveys, one in fall/winter 2015, and another later in the demonstration. The surveys cover a
range of topics that address aspects such as access to care, affordability, member and provider
satisfaction, and member and provider understanding of the program.
This document explains how Indiana will analyze the 2015 survey data to help evaluate these aspects of
the program. First, we summarize the survey methodology including surveyed populations, sample sizes,
and survey administration. Then, we outline the hypotheses we plan to use survey data to help address.
Last, we describe how we will analyze the survey data, often in conjunction with other data sources, to
evaluate each hypothesis. Where appropriate, we include a description of the statistical analysis.
In addition to the survey questions included in the analysis plan below, each survey includes a small
number of questions to help guide the survey administration or provide context for the survey recipient.
These questions are not designed for analysis; but the responses will be used to validate response
consistency across questions. Finally, each survey includes basic demographic questions. The results of
these questions will be reported in the annual report using descriptive statistics.
As detailed in the HIP 2.0 Draft Evaluation Plan, Indiana will also use a number of other data sources to
address these and other aspects of the program. This document pertains only to hypotheses that entail
use of survey data.
II. Survey Methodology
In this section, we outline Indiana’s survey methodology for the member and provider surveys, including
surveyed populations, sample sizes, and survey administration.
A. Populations
i. Members: Individuals enrolled in HIP Basic or HIP Plus at the time the survey is conducted.
ii. Leavers (also called Previous Members): Individuals who were fully enrolled in HIP 2.0
previously, but are not enrolled at the time of the survey. This population includes former
members with income above 100% FPL who were locked out after not making a POWER
account contribution or former members who left for any other reason.
iii. Never Member: Individuals who have not enrolled in HIP at the time of survey. These are
specifically (a) individuals with household income over 100% FPL who went through the
application process and were approved for HIP Plus but failed to make the initial POWER

Page 156 of 176
account contribution, and (b) individuals who were assessed presumptively eligible for HIP
but did not complete the HIP application process.
iv. Providers: Healthcare provider or provider-related entities that accept and treat HIP
members.
B. Sample Size
i. Member, Leaver and Never Member Surveys
The sample size was determined for each survey group to assure a statistically-
representative sample for each subpopulation, given typical survey response rates for
Medicaid recipients. To assure a sufficient number of interviews, we sampled 20 times the
number of targeted completed responses. A 20:1 ratio for completed surveys is a
conservative estimate and will still provide a sufficient sample. Some subpopulations are too
small to permit a 20:1 ratio; in those cases the plan is to survey as many clients as possible –
in some cases we will reach out to the entire subpopulation.
In general, at least 125 completed surveys for each of the Leaver and Never Member
cohorts out of the total sample size of individuals will be called. Based on the hypotheses
and assuming an observed proportion of 0.1 with 95% confidence and power of 0.8, this will
enable the detection of a 7.5 percentage point difference as statistically significant, which
we believe is reasonable from a policy perspective.
For the Member survey, we are aiming for 550 completed surveys. 550 surveys are expected
to be distributed such that about 385 are HIP Plus (with 165 being HIP Basic) and that about
260 have a Medicaid benefit for non-emergency medical transportation (while 290 do not
have this NEMT benefit). The sample will only be stratified in the sense that study enters
the sampling phase with a predetermined number of responses for each HIP and NEMT
class. Where comparisons to other subpopulations are warranted in the hypotheses, this
yields an allocation ratio of 4.4 to 1. Should a more conservative scenario arise where the
null proportion is 0.5 with an allocation ratio of 4 to 1, this will still enable the detection of a
difference of 11.6 percentage points as statistically significant.
Exhibit 1, below, describes the three different member surveys, the total number of
members in each group, the number of members selected into each sample from that
group, and the target number of completed responses. The “Detail” column in the table
describes instances where a random sample from the respective group of members will
yield sufficiently large subpopulations that are relevant to the STCs. For example, the STCs
require an evaluation of missed appointments for those without NEMT coverage. In HIP
Basic and HIP Plus, 145,000 members do not have NEMT coverage; so, a random sample of
these members will yield enough responses to draw statistically sound conclusions. The
evaluation is also over-sampling to ensure a sufficient number of completed surveys. The
survey subcontractor will stop once the target number of completed responses is met. In

Page 157 of 176
some smaller subpopulations, such as persons who were locked out of HIP Plus, we will
attempt to contact all persons.
Exhibit 1. HIP 2.0 Member Survey Sampling
Survey Detail
Total
Number of
Members
Members
Selected into
Sample
Target
Completed
Responses
Member
Includes all HIP Basic and HIP Plus enrollees.
Also encompasses two large subpopulations:
i) ~145,000 persons who do not have
NEMT coverage
ii) ~8,000 persons below 100% FPL who moved to HIP Basic
266,435 11,000 550
Never
Includes persons who were: 1) conditionally
approved, but did not make PAC in the first
month, or 2) presumptively eligible, but did not
submit the full application
5,311 2,500 125
Leaver
Includes all persons who exited HIP, by eligibility
group (e.g., Basic vs. Plus) 8,754 2,500 125
Persons >100% FPL who went into lockout 899 899 125
ii. Provider Survey
The provider sample contains 1,750 unique providers. The sample selection criteria were
restricted to providers whose addresses are in Indiana or surrounding states (i.e. Michigan,
Ohio, Kentucky, and Illinois). The following provider types and related specialties were
excluded: pediatrics, mental health, school corporation, pharmacy, DME/medical supply,
transportation provider, dentist, laboratory, targeted case management, waiver case
management, waiver provider, and First Step program. The evaluation will target more
providers in certain key groups, such as the 42 federally qualified health centers (FQHCs),
and three specific hospitals (Indiana University Hospital, Community Health Care Center,
and St. Vincent Hospital). These three hospitals were selected because they are the prime
locations of the three largest health systems in Indiana. The other 1,705 records were
selected via simple random sample from the remaining pool of providers and are stratified
between primary care providers (PCP) and specialists (defined as non-PCP). While we
expect a high response rate, we are targeting 225 completed survey responses. With a 2 to
1 allocation ratio of PCPs to specialists and a null proportion of 0.1, comparisons between
PCPs and specialists will detect statistically significant differences greater than 13.7
percentage points with 95% confidence and 80% power, which we believe is sufficient for
measuring differences in provider opinions.
Exhibit 2. HIP 2.0 Provider Survey Sampling
Survey Detail Universe
Size
Sample
Size
Target Completed
Responses
Provider FQHCs 42 42 42
Hospitals requested to be sampled 3 3 3

Page 158 of 176
Survey Detail Universe
Size
Sample
Size
Target Completed
Responses
Random Sample 48,361 1,705 225
iii. Survey Administration
To achieve efficiencies and reduce errors in survey completion, we will administer surveys
using computer-assisted telephone interviewing (CATI), in compliance with legal and ethical
guidelines and the Marketing Research Association’s Code of Marketing Research Standards
and Bylaws.
III. Analysis
Interviewers will record and code survey responses electronically. After data collection is complete, we
will quality-check the data and combine it with data from other sources, including member eligibility
data, utilization data and data describing community characteristics. The evaluation will then employ a
series of descriptive analyses and regressions to analyze the survey data. The specific approach to
analyzing survey data varies depending on the hypothesis to be addressed with that survey data. Below,
the approach for each hypothesis is described in detail.19
A. Hypothesis 1.1: HIP will reduce the number of uninsured Indiana residents with income under
138% FPL over the course of the demonstration
i. Methodology
Previous member (leaver) survey data will be used to create a series of descriptive analyses
and logistic regressions to better understand how individuals access coverage after leaving
HIP. This analysis will supplement other analyses that address the hypothesis directly; for
example, we will use data from the American Community Survey to measure differences in
health insurance coverage rates before and after HIP 2.0. This analysis does not require
drilling down on the reasons individuals enter the leaver group, but focuses instead on
coverage status.
ii. Statistical Analysis
The coverage rates from the American Community Survey will make it possible to measure
whether or not the number of uninsured Indiana residents increased or decreased over
time. To further understand whether or not the HIP program impacts that change, we
propose using enrollment data and survey data and describe differences in the extent to
which previous members have access to coverage after leaving HIP. The following primarily
describes the approach to analyze member and non-member data. Covariates include:
Age Group;
Employment status; and
19 Hypotheses correspond to the hypotheses listed in Indiana’s Draft Evaluation Design. Hypotheses 1-5 above correspond to Hypotheses 1-5 for Goal 1 in the evaluation design. Hypotheses 6 and 7 correspond to Goal 2, Hypothesis 1 and Goal 2, Hypothesis 3, respectively in the evaluation design.

Page 159 of 176
Income level.
The evaluation will include cross-tabulations of survey questions that ask respondents about
insurance coverage after HIP, by age, employment status, and income.
Unlike univariate or bivariate descriptive analyses, regression methods allow the evaluation
to simultaneously adjust for a number of potential differences in member characteristics.
The evaluation will use a logit specification to establish the empirical relationship between
categorical outcomes (i.e. a 1/0 value indicating whether the individual obtaining insurance
coverage after leaving HIP) and covariates for member characteristics.
To illustrate the approach, define Yi as the outcome for the ith individual.
𝑃(𝑌𝑖 = 1) =exp(𝛽0 +𝛽𝑥𝑋𝑖)
1 + exp(𝛽0 +𝛽𝑥𝑋𝑖)
Where Xi represents the set of characteristics. Coefficients βx measure the differential
effects of individual characteristics (X) on outcome Y.
To evaluate the probability that a member will obtain other coverage after leaving HIP,
while accounting for all other covariates, we will use estimates from the multivariate
regression analysis to construct several counterfactual scenarios. To illustrate this approach
using employment status, income level and age group, limit observations to a particular
income level and compute the average probability of obtaining other coverage after HIP.
�̅�(𝑌|𝐼𝑛𝑐𝑜𝑚𝑒 => 100%𝐹𝑃𝐿) =∑ 𝑃(𝑌𝑖)𝑛𝑖
𝑛
=exp(𝛽0 +𝛽𝑥[𝐸𝑚𝑝𝑙𝑜𝑦𝑒𝑑]𝑖 +𝛽𝑥[𝐴𝑔𝑒]𝑖 +𝛽𝑥[𝐼𝑛𝑐𝑜𝑚𝑒𝐿𝑒𝑣𝑒𝑙 ≥ 100%𝐹𝑃𝐿]𝑖)
1 + exp(𝛽0 +𝛽𝑥[𝐸𝑚𝑝𝑙𝑜𝑦𝑒𝑑]𝑖 +𝛽𝑥[𝐴𝑔𝑒]𝑖 +𝛽𝑥[𝐼𝑛𝑐𝑜𝑚𝑒𝐿𝑒𝑣𝑒𝑙 ≥ 100%𝐹𝑃𝐿]𝑖)
B. Hypothesis 1.2: HIP will increase access to healthcare services among the target population
i. Methodology
The evaluation will employ a series of descriptive analyses and logistic regressions to analyze
the survey data and examine differences in member and previous member (leaver) and
never-member perceptions of access to care by characteristics such as income level and
employment status.
ii. Statistical Analysis
There is a the potential for selection bias in comparing members and previous
members/never-members to test the hypothesis that the HIP program increases access to
care as perceived by the consumer. Our sample is stratified as the study enters the sampling
phase with a predetermined distribution of HIP Plus and HIP Basic participation that mimics
the underlying population. Additionally, we propose using a series of descriptive analyses
and logistic regressions to analyze survey data and describe differences in members
reporting challenges in accessing care. This combination allows the evaluation to provide

Page 160 of 176
easy to understand tables and more robust estimates that simultaneously account for
differences in available covariates. The following primarily describes the approach to
analyze member and previous member/never-member data. Covariates include:
Family size;
Employment status;
Geography (e.g., area codes);
Health status (e.g. Medically Frail Indicator)
Income level; and
HIP status (Basic, Plus, non-member).
The evaluation will employ cross-tabulations of survey questions that ask respondents about
the ease of accessing care (based on primary care, specialist, and prescription drugs) by
family size, HIP status, employment status, area code, and income. Examining these tables
will allow CMS to understand how HIP enrollment is related to access to care in Indiana.
Unlike univariate or bivariate descriptive analyses, regression methods enable the
evaluation to simultaneously adjust for a number of potential differences in member and
community characteristics. A logit specification will be used to establish the empirical
relationship between categorical outcomes (i.e. a 1/0 value indicating whether the
beneficiary had missed an appointment) and covariates for member and community
characteristics.
To illustrate the approach, define Yi as the outcome for the ith individual.
𝑃(𝑌𝑖 = 1) =exp(𝛽0 +𝛽𝑥𝑋𝑖)
1 + exp(𝛽0 +𝛽𝑥𝑋𝑖)
Where Xi represents the set of characteristics. Coefficients βx measure the differential
effects of individual characteristics (X) on outcome Y.
To evaluate the probability that a member will report issues in accessing care, while
accounting for all other covariates we will use estimates from the multivariate regression
analysis to construct several counterfactual scenarios. To illustrate this approach using
employment status and income level and family size, limit observations to 2-person
households and compute the average probability of a reported access to care issue.
�̅�(𝑌|𝐹𝑎𝑚 = 2) = ∑ 𝑃(𝑌𝑖)𝑛𝑖
𝑛
=exp(𝛽0 +𝛽𝑥[𝐸𝑚𝑝𝑙𝑜𝑦𝑒𝑑]𝑖 +𝛽𝑥[𝐹𝑎𝑚 = 2]𝑖 + …+ 𝛽𝑥[𝐼𝑛𝑐𝑜𝑚𝑒𝐿𝑒𝑣𝑒𝑙]𝑖)
1 + exp(𝛽0 +𝛽𝑥[𝐸𝑚𝑝𝑙𝑜𝑦𝑒𝑑]𝑖 +𝛽𝑥[𝐹𝑎𝑚 = 2]𝑖 + ⋯+𝛽𝑥[𝐼𝑛𝑐𝑜𝑚𝑒𝐿𝑒𝑣𝑒𝑙]𝑖)
The evaluation will use this approach to include all covariates that control for confounders
and improve the performance of the model in explaining access to care (goodness of fit and
model significance).

Page 161 of 176
C. Hypothesis 1.3: POWER account contributions (PAC) for individuals in the HIP Plus plan are
affordable and do not create a barrier to healthcare access; few individuals will experience the
lockout period because the policy will deter nonpayment of POWER account contributions policy
for HIP Plus beneficiaries
i. Methodology
The evaluation will use a series of descriptive analyses and logistic regressions to analyze the
survey data and examine differences in member and previous member (leaver) perceptions
of PAC affordability by characteristics such as income level and HIP enrollment status.
ii. Statistical Analysis
The evaluation will use a series of descriptive analyses and logistic regressions to analyze
survey data and describe differences in the affordability of the HIP program based on
perceptions of the affordability of the POWER account contributions. With limited data
about previous members, this combination still allows the evaluation to provide easy to
understand tables and more robust estimates that simultaneously account for differences in
available covariates. The following primarily describes the approach to analyze member
and non-member data. Covariates include:
Family size;
Employment status;
Geography (e.g., area codes);
Health status (e.g. Medically Frail Indicator)
Income level; and
HIP status (Basic, Plus, previous member).
The evaluation will employ cross-tabulations of survey questions that ask respondents about
the affordability of POWER account contributions and access to care after lockout from HIP.
Examining these tables will help the state and CMS to understand the affordability of HIP
and the effect of HIP lockout policies.
Unlike univariate or bivariate descriptive analyses, regression methods enable the
evaluation to simultaneously adjust for a number of potential differences in member and
community characteristics. A logit specification will be used to establish the empirical
relationship between categorical outcomes (i.e. a 1/0 value indicating whether the
beneficiary had missed an appointment) and covariates for member and community
characteristics.
To illustrate the approach, define Yi as the outcome for the ith individual.
𝑃(𝑌𝑖 = 1) =exp(𝛽0 +𝛽𝑥𝑋𝑖)
1 + exp(𝛽0 +𝛽𝑥𝑋𝑖)
Where Xi represents the set of characteristics. Coefficients βx measure the differential
effects of individual characteristics (X) on outcome Y.

Page 162 of 176
To evaluate the probability that a member will report affordability issues, while accounting
for all other covariates, we will use estimates from the multivariate regression analysis to
construct several counterfactual scenarios. To illustrate this approach using employment
status and income level and family size, limit observations to 2-person households and
compute the average probability of a reported access to care issue.
�̅�(𝑌|𝐹𝑎𝑚 = 2) = ∑ 𝑃(𝑌𝑖)𝑛𝑖
𝑛
=exp(𝛽0 +𝛽𝑥[𝐸𝑚𝑝𝑙𝑜𝑦𝑒𝑑]𝑖 +𝛽𝑥[𝐹𝑎𝑚 = 2]𝑖 + ⋯+ 𝛽𝑥[𝐼𝑛𝑐𝑜𝑚𝑒𝐿𝑒𝑣𝑒𝑙]𝑖)
1 + exp(𝛽0 +𝛽𝑥[𝐸𝑚𝑝𝑙𝑜𝑦𝑒𝑑]𝑖 +𝛽𝑥[𝐹𝑎𝑚 = 2]𝑖 + ⋯+ 𝛽𝑥[𝐼𝑛𝑐𝑜𝑚𝑒𝐿𝑒𝑣𝑒𝑙]𝑖)
The evaluation will use this approach to include all covariates that control for confounders
and improve the performance of the model in explaining access to care (goodness of fit and
model significance). This approach has been used successfully in other evaluations.
D. Hypothesis 1.4: Presumptive eligibility (PE) and fast track prepayments will provide the necessary
coverage so as not to have gaps in healthcare coverage
i. Methodology
The evaluation will employ a series of descriptive analyses to show the differences in
provider perceptions of the effectiveness of the presumptive eligibility process. Additional
statistical analysis will not be necessary to address this hypothesis.
E. Hypothesis 1.5: Waiver of non-emergency transportation to the non-pregnant and non-medically
frail population does not pose a barrier to accessing care
i. Methodology
The purpose of the evaluation is to measure the impact of the non-emergency medical
transportation (NEMT) waiver on existing HIP members and whether the waiver impacts the
number of missed medical appointments. The evaluation will employ a series of descriptive
analyses and logistic regressions to analyze the survey data and examine differences in
members reporting challenges keeping appointments by characteristics such as region and
income level.
ii. Statistical Analysis
As described previously in a memo to CMS dated October 6, 2015, there are significant
differences between the populations excluded from the waiver (i.e. receive NEMT) and
those that are not excluded from the waiver (i.e. do not receive NEMT). It is unlikely that
even the most robust risk adjustment or other statistical techniques could fully account for
these differences. Additionally, a comparison between NEMT and non-NEMT groups fails to
directly address the issue stated by the hypothesis, such a comparison is not part of this
analysis plan. Consequently, we propose using a series of descriptive analyses and logistic
regressions to analyze survey data and describe differences in members reporting
challenges in keeping appointments, specifically focusing on whether or not individuals
report transportation and/or cost issues in survey responses as reasons for missing

Page 163 of 176
appointments. This combination makes it possible to provide easy to understand tables and
more robust estimates that simultaneously account for differences in member covariates
like age, gender, income, and other community characteristics. The following primarily
describes the approach to analyze member data. Provider data can be analyzed in a similar
manner but will use only the community characteristics listed below plus specialty class.
Member covariates include:
Age;
Gender;
Reported transportation issues;
Reported cost issues;
Region; and
Income level.
Community characteristics:
Availability, cost, and type (e.g. fixed route vs. demand-response) of public
transportation; and
Number of physicians per 1,000 population.
The evaluation will employ cross-tabulations of survey questions that ask respondents if
they have missed any appointments and reasons why appointments were missed by age,
gender, region, income level, availability of public transportation and number of physicians
per 1,000 population. Examining these tables will allow CMS to understand how not having
access to NEMT varies by both member and community characteristics.
Unlike univariate or bivariate descriptive analyses, regression methods make it possible to
simultaneously adjust for a number of potential differences in member and community
characteristics. A logit specification will be used to establish the empirical relationship
between categorical outcomes (i.e. a 1/0 value indicating whether the beneficiary had
missed an appointment) and covariates for member and community characteristics.
To illustrate the approach, define Yi as the outcome for the ith individual.
𝑃(𝑌𝑖 = 1) =exp(𝛽0 +𝛽𝑥𝑋𝑖)
1 + exp(𝛽0 +𝛽𝑥𝑋𝑖)
Where Xi represents the set of member and community characteristics. Coefficients βx
measure the differential effects of individual characteristics (X) on outcome Y.
To evaluate the probability that a member will report challenges in keeping appointments,
while accounting for all other covariates we will use estimates from the multivariate
regression analysis to construct several counterfactual scenarios. To illustrate this approach
using only age, sex, and income level, limit observations to males only and compute the
average probability of a missed appointment as described below.

Page 164 of 176
�̅�(𝑌|𝐺𝑒𝑛𝑑𝑒𝑟 = 𝑀) = ∑ 𝑃(𝑌𝑖)𝑛𝑖
𝑛
=exp(𝛽0 +𝛽𝑥[𝐴𝑔𝑒]𝑖 +𝛽𝑥[𝐺𝑒𝑛𝑑𝑒𝑟 = 𝑀]𝑖 + ⋯+𝛽𝑥[𝐼𝑛𝑐𝑜𝑚𝑒𝐿𝑒𝑣𝑒𝑙]𝑖)
1 + exp(𝛽0 +𝛽𝑥[𝐴𝑔𝑒]𝑖 +𝛽𝑥[𝐺𝑒𝑛𝑑𝑒𝑟 = 𝑀]𝑖 + ⋯+𝛽𝑥[𝐼𝑛𝑐𝑜𝑚𝑒𝐿𝑒𝑣𝑒𝑙]𝑖)
The evaluation will use this approach for as many member (age, gender, region, income
level) and community characteristics (availability of public transportation and number of
physicians per 1000 population) covariates as possible. This approach has been used in
other evaluations.
F. Hypothesis 2.1: HIP policies will encourage member compliance with required contributions and
provide incentives to actively manage POWER account funds; HIP policies surrounding rollover
and preventive care will encourage beneficiaries’ compliance with required contributions and
provide incentives to actively manage POWER account funds
i. Methodology
Member survey data will be used in descriptive analyses of member attitudes towards
POWER accounts. Additional statistical analysis will not be necessary to address this
hypothesis.
G. Hypothesis 2.3: HIP’s (i) graduated copayments required for non-emergency use of the emergency
department (ED), (ii) ED prior authorization process, and (iii) efforts to expand access to other
urgent care settings will together effectively deter inappropriate ED utilization without harming
beneficiary health
i. Methodology
Member and provider survey data will be used to enhance the descriptive analyses of
utilization patterns, including copayment collection rates by providers. There is no
statistical inference for studying utilization differences related to value-based decision
making and personal health responsibility that involves stratifying or controlling for survey-
derived data.
IV. Discussion
Survey data will be reported in both policy specific reports, specifically the February 2016 NEMT
evaluation, and in the annual report, scheduled for submission to CMS in April 2016. In each of these
reports, we will highlight key findings of the analysis. The evaluation will also discuss some of the
limitations and caveats of the analysis and suggest some future areas of investigation and potential
improvements for future surveys.

Page 165 of 176
Appendix I – Quarterly Report for Demonstration Year I, Quarter 2
HEALTHY INDIANA PLAN DEMONSTRATION
PROJECT NUMBER: 11-W-00296/5
SECTION 1115 QUARTERLY REPORT
State of Indiana
REPORTING PERIOD:
Demonstration Year: 1 (02/01/15 – 1/31/16)
Demonstration Quarter: 2/2015 (5/15-7/15)
Date submitted to CMS: 10/8/15
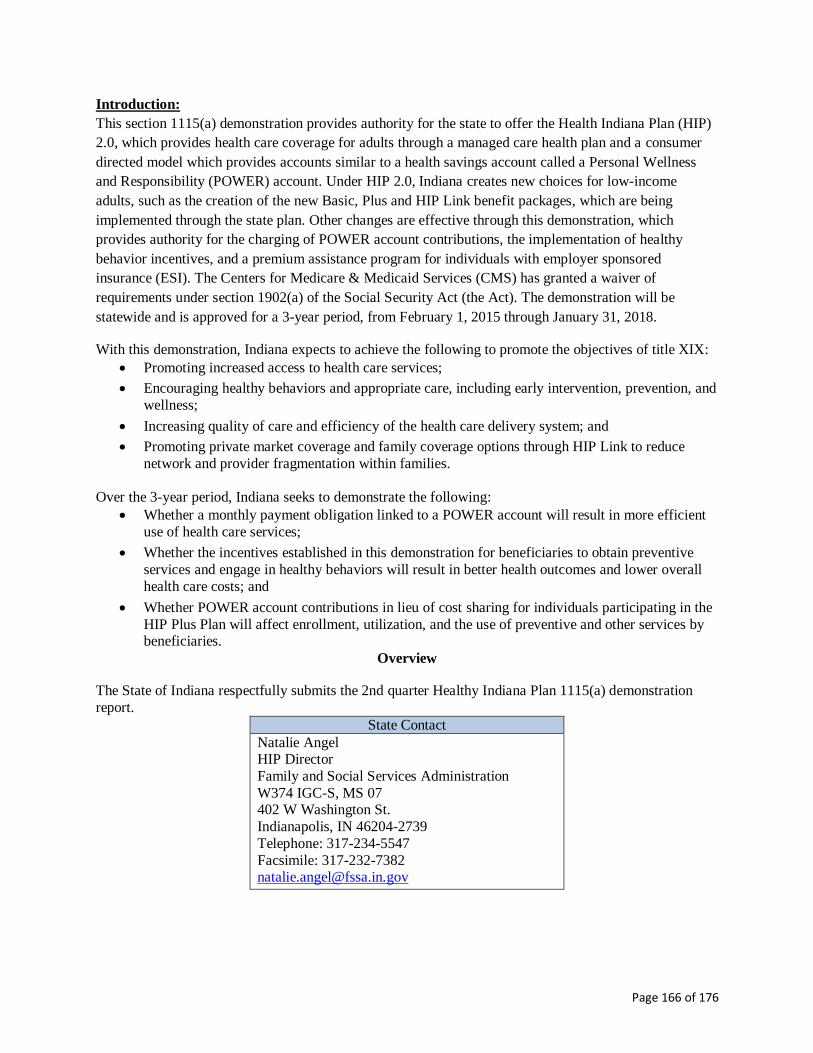
Page 166 of 176
Introduction:
This section 1115(a) demonstration provides authority for the state to offer the Health Indiana Plan (HIP)
2.0, which provides health care coverage for adults through a managed care health plan and a consumer
directed model which provides accounts similar to a health savings account called a Personal Wellness
and Responsibility (POWER) account. Under HIP 2.0, Indiana creates new choices for low-income
adults, such as the creation of the new Basic, Plus and HIP Link benefit packages, which are being
implemented through the state plan. Other changes are effective through this demonstration, which
provides authority for the charging of POWER account contributions, the implementation of healthy
behavior incentives, and a premium assistance program for individuals with employer sponsored
insurance (ESI). The Centers for Medicare & Medicaid Services (CMS) has granted a waiver of
requirements under section 1902(a) of the Social Security Act (the Act). The demonstration will be
statewide and is approved for a 3-year period, from February 1, 2015 through January 31, 2018.
With this demonstration, Indiana expects to achieve the following to promote the objectives of title XIX:
Promoting increased access to health care services;
Encouraging healthy behaviors and appropriate care, including early intervention, prevention, and
wellness;
Increasing quality of care and efficiency of the health care delivery system; and
Promoting private market coverage and family coverage options through HIP Link to reduce
network and provider fragmentation within families.
Over the 3-year period, Indiana seeks to demonstrate the following:
Whether a monthly payment obligation linked to a POWER account will result in more efficient
use of health care services;
Whether the incentives established in this demonstration for beneficiaries to obtain preventive
services and engage in healthy behaviors will result in better health outcomes and lower overall
health care costs; and
Whether POWER account contributions in lieu of cost sharing for individuals participating in the
HIP Plus Plan will affect enrollment, utilization, and the use of preventive and other services by beneficiaries.
Overview
The State of Indiana respectfully submits the 2nd quarter Healthy Indiana Plan 1115(a) demonstration
report.
State Contact
Natalie Angel HIP Director
Family and Social Services Administration
W374 IGC-S, MS 07 402 W Washington St.
Indianapolis, IN 46204-2739
Telephone: 317-234-5547
Facsimile: 317-232-7382 [email protected]

Page 167 of 176
1. A discussion of events occurring during the quarter or anticipated to occur in the
near future that affect health care delivery, enrollment, quality of care, access, health
plan financial performance that is relevant to the demonstration, the benefit package,
and other operational issues.
The second quarter of performance for HIP 2.0 continued to show the high level of preparation and
coordination that allowed the state to implement this innovative program with success. Total enrollment at the end of quarter two stands at 264,004 fully eligible and enrolled individuals, with an
average of 70% actively making contributions to their health savings like account, the POWER
Account. Further breakdown of this eligibility by plan and federal poverty levels is provided below.
Accomplishments during the quarter include receipt of final approval on the HIP Basic and HIP Plus
Alternative Benefit Plan State Plan Amendments and submission of three required 1115 Protocols
including the ER Copay Protocol, the HIP Link Protocol, and the Draft Evaluation Design, and completion and receipt of much positive feedback at the HIP post-award forum on July 9th. The State
also launched new components of the HIP 2.0 program including the Fast Track via credit card,
Gateway to Work, and HIP Link employer application functionality.
Two of the key components of HIP 2.0 launched during this period are designed to support HIP
participants to find and maintain employment. First, the Gateway to Work call center opened May 4th. Gateway to Work assists HIP members with job training and job search activities. HIP members
that work less than 20 hours a week, are not full-time students, and have not already been referred to
work training through SNAP will be referred to Gateway to Work. The Gateway to Work program is
a no-cost voluntary program that offers HIP members a variety of services including an initial assessment of their skills and abilities to identify personal actions to achieve their employment goals.
Non-participation in Gateway to Work does not impact HIP eligibility. The program assists HIP
members with completing job applications, creating resumes, improving job interview skills and job search assistance. Gateway to Work features tools to match participants experience and skills with
employers who have job openings. Since the program start date there have been over 3,000 calls to
the Gateway to Work call center and 479 job orientations have been attended by HIP members. Second, in June, the HIP Link program implemented the employer portal and began to take employer
applications. HIP Link allows HIP eligible members, their spouses, and HIP eligible dependents, to
enroll in their employer’s health plan and receive a HIP Link POWER Account valued at $4,000 per
person to help cover the costs of commercial insurance. The launch of the employer portal allowed the state to start the process of approving employers and employer health plans to offer HIP Link to
their employees.
The state also made enhancements to the Fast Track process. Fast Track allows an individual to make
a $10 payment prior to being found eligible, which allows members to gain coverage more quickly.
If a member opts to make this payment and is found eligible, the effective date of coverage for them
will be the 1st day of the month in which the application was submitted. If the individual is not found eligible, they will have the payment refunded. The ability to make a Fast Track payment via a paper
invoice voucher began in March and health plans invoiced individuals that were potentially eligible
days after they applied for HIP. In June of 2015, the State added a credit card payment option to the Fast Track process. An individual is given the opportunity to make their Fast Track payment on-line
via credit card at the point of filling out their on-line application. Those individuals that do not make
the credit card payment are invoiced by their chosen health plan following the paper voucher process.

Page 168 of 176
2. A discussion of key operational and other challenges, underlying causes of challenges,
how challenges are being addressed, as well as key achievements and to what
conditions and efforts successes can be attributed.
The State continues to hold regular meetings with all involved stakeholders including the managed care
entities, fiscal agent, systems and eligibility teams to monitor operational status and identify and
implement solutions to operational challenges as they arise. These meetings include a daily meeting on all HIP operations and calls specifically focused on addressing individual client issues.
Generally, HIP’s smooth transition continued. The State continued to see robust use of the Hospital
Presumptive Eligibility (HPE) and Presumptive Eligibility (PE) programs. In calendar year 2014 just over 8,000 HPE determinations were made however this has increased to 10,000 per month with the
addition of the adult group, as the number of providers conducting PE increased.
With this volume of newly covered HPE/PE members, and HPE/PE members residing in managed care,
the State has increased provider and member education around how to access and use the HPE/PE
benefits and the requirements to transition from HPE/PE full HIP coverage. Education efforts focus around ensuring members understand how to change their health plan during the HPE/PE period and to
make payment have increased. Processes are being examined to ensure members have sufficient time to
pay and fully understand their plan change options.
Some providers and members have reported confusion about how the HPE/PE program works due to the
real-time nature of the coverage and existing systems limitations. While the system is able to generate
proof of immediate HPE/PE coverage, the system cannot transfer this information to update the clients’ chosen MCE immediately and the file transfer can take up to 24 hours. This is challenging if providers are
seeking prior authorizations or members are seeking pharmacy benefits. Manual workarounds are in
place to allow MCEs to confirm eligibility with pharmacies, and education has been targeted to providers
about the lag in electronic confirmation of benefits. This operational issue arises from systems limitations and will continue to be monitored and development of new processes will be explored to resolve and
ensure members immediate access to all HIP Basic benefits. The state continues to educate members
about how the change their plan during their HPE/PE period.
3. Enrollment figures for the quarter including enrollment figures for individuals by
income level and benefit plan.
Table 1 below shows HIP 2.0 enrollment as of the end of July. The table shows that only 27,828
individuals or approximately 10.5% of enrollees had income over 100% FPL, this lower than anticipated enrollment for this FPL level and is likely due to the fact that individuals who may be interested in
receiving coverage and have income over 100% FPL may be enrolled in marketplace coverage. There
were 64,216 individuals with income between 100% and 150% FPL who selected a plan on the federal
marketplace. These individuals have not transitioned to HIP coverage as expected as federal policies continue to provide tax credits to individuals that are also eligible for Medicaid.
For individuals that enrolled in HIP, approximately 70% are making their POWER Account contributions and receiving HIP Plus benefits. For individuals below 100% FPL the likelihood of making a POWER
Account contribution increases as individual income increases from 62% of individuals under 23% of the
federal poverty level to 79% of individuals between 76% and 100% of the federal poverty level, even
though the amount of the POWER Account contribution has a corresponding increase with increased income. Employers, non-profits, and other third parties are not making a substantial number of individual
contributions as detailed below in #4.

Page 169 of 176
*Source: EDW
4. Data related to POWER account including the number and average amount of
contributions to POWER accounts from third parties, by type of entity, and by
beneficiary income level, the HIP Plus and HIP Basic rollover numbers and amounts,
and the rate of disenrollment for failure to pay POWER Account contributions.
Tables 2 and 3 below outline POWER Account contributions that were made by either an employer or a
non-profit organization. There are not a substantial number of employers or non-profits contributing to
POWER Accounts. Through June 2015, 101 employers and 40 non-profit organizations made contributions on behalf of a HIP Member. In total, 196 HIP Plus members had a POWER Account
contribution made on their behalf.
*Source: OMPP Quality and Reporting
Table 1
HIP 2.0 Enrollment
7/31/2015
% FPL Basic Plus
Total State Regular Total Percentage State Regular Total Percentage
<23% 43,609 14,535 58,144 37.99% 52,367 42,543 94,910 62.01% 153,054
23%-50%
2,090 3,428 5,518 24.1% 3,217 14,133 17,350 75.9% 22,868
51%-
75% 1,849 5,050 6,899 22.9% 3,334 19,860 23,194 77.1% 30,093
76%-100%
1,469 4,894 6,363 21.1% 2,944 20,854 23,798 78.9% 30,161
Total <101%
49,017 27,907 76,924 32.57% 61,862 97,390 159,252 67.43% 236,176
101%-
138% 1,080 478 1,558 6.0% 3,228 21,261 24,489 94.0% 26,047
>138% 762 5 767 43.1% 861 153 1,014 56.9% 1,781
Grand Total
50,859 28,390 79,249 30.02% 65,951 118,804 184,755 69.98% 264,004
Table 2
Employer Power Account Contributions
February 1, 2015-June 30, 2015
YTD Total
Number of Employers Participating 101
Number of Members on Whose Behalf an Employer Makes a
Contribution 99
Total Amount of Employer Contributions $4,044.07
Average Amount of Employer Contributions $40.85
Table 3
Non-Profit Organization Contributions
February 1, 2015-June 30, 2015
YTD Total
Number of Non-Profit Organizations Participating 40
Number of Members on Whose Behalf a Non-Profit Makes a Contribution
97

Page 170 of 176
*Source: OMPP Quality and Reporting
Through six months of HIP 2.0 program performance, only 848 individuals were closed for failure to pay
their POWER Account contribution. That is less than .005% of individuals in the HIP Plus program.
Table 4
HIP 2.0 Closure for Failure to Pay POWER Account
February 1, 2015-July 31, 2015
FPL Count
100% FPL or less 0
100% FPL or more 848
*Source: EDW
There were a total of 32,247 individuals who left the HIP program for reasons other than non-payment.
More than 2,393 of these closures represent a change in Medicaid aid category, meaning they are being
served in another Medicaid program.
*Source: EDW
The most frequent closure reasons for all HIP (above and below 100% FPL) are below. This table
lists the Top 5 most cited reasons for a closure. There are many other closures for a variety of
reasons and the below counts do not include all closures. The most common reason an individual is
closed is the failure to provide information.
Table 6
All HIP Closures – Top 5 Reasons
February 1, 2015-July 31, 2015
Number of Closures
Reason for Closure
10,003 Failure to provide all required information
4,737 Receipt of or increase in earned or self-employment income
3,649 Income exceeds program eligibility standards
2,393 Moved to another Medicaid category
2,177 Not an Indiana resident
22,959 Top 5 Total
Total Amount of Non-Profit Contributions $2,620.05
Average Amount of Non-Profit Contributions $26.00
Table 5
HIP Closures February 1, 2015 – July 31, 2015
HIP Category Closures By Category
Regular Plus 11,651
Regular Basic 5,870
State Basic 10,012
State Plus 4,714
TOTAL Closures 32,247

Page 171 of 176
*Source: EDW
When the closure reasons are broken out for those above and below 100% FPL there are some
differences. The vast majority of members under 100% who are closed are closed for failing to
provide information. For those over 100% FPL a majority are due to the member’s income
exceeding program eligibility standards.
Table 7
HIP Closures 100% FPL and Under – Top 5 Reasons
February 1, 2015-July 31, 2015
Number of Closures Reason for Closure
9,054 Failure to provide all required information
2,936 Receipt of or increase in earned or self-employment income
2,171 Moved to another Medicaid category
2,096 Not an Indiana resident
1,332 Income exceeds program eligibility standards
*Source: EDW
Table 8
HIP Closures over 100% FPL – Top 5 Reasons
February 1, 2015-July 31, 2015
Number of Closures Reason for Closure
2,317 Income exceeds program eligibility standards
1,801 Receipt of or increase in earned or self-employed income
949 Failure to provide all required information
848 Failure to make payment to POWER Account
231 Receipt of or increase in unearned income
*Source: EDW
5. Data related to emergency department use including the number of individuals by
income level and a breakdown of the number of visits classified as an emergency vs.
non-emergency by income level and benefit plan; the number of people who incurred
the $8 and $25 copayments.
Table 9 below documents the number of emergency room visits by HIP 2.0 members in the first
quarter of 2015. Reporting on ER utilization comes from actual claims experience, so data may vary
over time as claims are submitted and adjudicated before reporting. Initial program data indicate
that HIP Plus members are significantly less likely to utilize the emergency room for non-emergent
services. Future reports will break out ER use by income level. The state is waiting for approval of
the ER Co-payment protocol before we begin reporting on co-payment experience.
Table 9
Emergency Room Utilization
January 2015-March 2015 (first calendar quarter)
Category Number
of ER
Number of
ER visits
Number of
visits
deemed
Number of
Adjudicated
ER claims
Percent of
claims
Percent of
claims
deemed

Page 172 of 176
visits in
the period
deemed
emergent
non-
emergent
per 1,000
members
deemed
emergent
non-
emergent
Plus 9722 8364 1358 115 86% 14%
Basic 2041 1439 602 93 70% 30%
State Plan 15179 11383 3796 114 75% 25%
*Source: OMPP Quality and Reporting
6. Reports on speed of eligibility determinations for HIP 2.0 eligible individuals,
including the average number of days between the submission of an application and
an eligibility determination, and the average number of days between an eligibility
determination and HIP 2.0 plan enrollment.
The State continues to report excellent application processing times. With most individual
applications approved in less than 20 days. Individuals who make a POWER Account contribution
can gain full coverage just days after their application is authorized, and eligibility begins the first
day of the month in which payment is made
Table 10
Eligibility Processing
May 1, 2105-July 31, 2015
Number of Days from application to authorization
Number of days from HIP Authorization for full eligibility
Case Type Average Days Average Days
Regular Plus 15.79 6.3
State Plan Basic 8.02 54
State Plan Plus 15.95 6.9
Native American HIP Plus NA NA
Regular Basic 18.32 17.3
*Source: ICES
7. A discussion of the HIP Link program, including but not limited to enrollment, HIP
Account balance amounts, grievances, changes in employer contribution levels,
participants moving from ESI coverage to HIP Plus or HIP Basic, other operational
issues; and evaluation activities.
The HIP Link operational protocol was submitted to CMS on May 26, 2015 and has been updated
per CMS questions. The HIP Link program is a key initiative of Governor Mike Pence and he has
met with business leaders throughout the state to champion the program. Dedicated HIP Link staff
joined the Medicaid office in July and have been working to outreach to a variety of groups in the
business community and began reviewing and approving employers eligible for the program. The
office has met with the Indiana Restaurant and Lodging Association, Indiana Retail Council, Indiana
Chamber of Commerce, local city/county Chamber of Commerce, and with individual businesses in
the retail, education, restaurant, and health care industries. Other outreach initiatives have included
program education to the health insurance agent, broker, and navigator community. HIP Link will
continue to grow and be featured in future reports.
8. The Status of the NEMT Evaluation and POWER Account Contributions and
Copayments Monitoring.

Page 173 of 176
The POWER Account Contributions and Copayments Monitoring Protocol was submitted July 30,
2015. Greater detail on both activities will be reported in future reports.
9. Reports on data required as part of the Health Incentives Protocol described in
Section VIII and POWER Account Contributions and Copayments Monitoring
Protocols.
During the quarter, protocol documents for special monitoring requirements have been submitted to
CMS and the state is awaiting final approval before this data can reported.
10. The number of hospitals and other entities participating in Presumptive Eligibility, by
type and the number of applications filed by each entity. The number of full
applications filed and the number determined eligible, by entity.
With the expansion of presumptive eligibility to Community Mental Health Centers, Federally
Qualified Health Centers, Rural Health Clinics, and County Health Departments; we established
a series of webinars to train providers and direct them in how to obtain the necessary qualified
provider status. As mentioned above, this program has grown considerably with the introduction
of the new adult group and new provider types. More applications are processed each month in
the HPE/PE program than were done in the entire first year of Hospital Presumptive Eligibility in
2014. The State will continue to provide education, guidance, and training opportunities for
active qualified providers and to providers who are interested in joining the program.
Table 11
Presumptive Eligibility Applications and Performance
May 1, 2015-July 30, 2015
Provider Type
PE
Applications
Submitted
PE
Applications
Approved
Percent
PE
Applications
Approved
IHCP
Applications
Submitted
IHCP
Applications
Approved*
Percent
IHCP
Applications
Approved*
Acute Care Hospital
33,467 26,523 79% 16,343 4,431 27%
Community
Mental Health
Center
1,768 1,425 81% 886 240 27%
Federally
Qualified
Health Center
3,232 2,765 86% 2,165 821 38%
Psychiatric Hospital
596 452 76% 263 67 25%
Rural Health Clinic
31 27 87% 18 4 22%
County Health
Department
0 0 0 0 0 0
Grand Total 39,094 31,192 80% 19,675 5,563 28%
*Source: Indiana AIM *Applications submitted in the performance quarter may have still been pending when data was run. This number
only reflects those that have had a determination made at that time. This data will be updated next quarter and may
be adjusted.

Page 174 of 176
Table 12 below provides information on the number of qualified providers that are completing HPE/PE
applications for individuals. There are 174 qualified providers that are operating in 247 different
locations. This provides individuals with many options in gaining presumptive eligibility coverage. The
3rd column outlines the total number of providers enrolled, by type, in the Indiana Health Coverage
Programs. This reveals how many providers of any type are not participating as a qualified provider. In
the Acute Care Hospital category, there are 168 hospitals enrolled with Indiana Medicaid. Of these 168
hospitals, 114 are participating in the HPE program. While we have access to HPE/PE statewide, we
have not gotten Local County Health Departments or Rural Health Clinics interested in the program.
Prior to the expansion of PE to these new provider types, a letter was mailed to each entity in the state.
This included those not already enrolled with Indiana Medicaid. All providers were given information
about the program and directions on how to participate. All of the providers who expressed an interested
in participating have been enrolled. The State will continue outreach efforts to grow providers in the
program.
Table 12
Presumptive Eligibility Qualified Providers
July 2015
Provider Type
Number of
Qualified
Providers
Number of
Qualified Provider
Locations
Total Potential
Provider by
Type*
Acute Care Hospital 114 114 168
Community Mental Health Center 20 49 25
Federally Qualified Health Center 21 65 68
Psychiatric Hospital 15 15 32
Rural Health Clinic 4 4 66
County Health Department 0 0 57
Total 174 247 416
*Source: Indiana AIM
*This Column reflects the total number of providers of that type enrolled in the IHCP.

Page 175 of 176
Appendix J – Survey Notification Letter Sent to HIP Members
[Case ID]
[casename]
[Address Line 1]
[Address Line 2]
Dear [casename],
We are writing to ask for your help with a survey about your experience with the new Healthy
Indiana Plan or “HIP 2.0.” Your answers will help us improve the program.
Your point of view is important to us. In the next few weeks you may get a phone call from
someone asking about your health care. Our phone call should take less than fifteen minutes.
Your name was picked randomly from a list of all people who receive health care through HIP
2.0. You can choose to answer the questions or not. If you decide not to answer questions, it
will NOT affect any HIP 2.0 benefits you receive.
Your answers to the survey will be kept private, and will be used only to help understand
experiences with HIP 2.0.
Your opinion matters to us. We hope that you will talk with us. We want to learn more about
what you think of your health care in Indiana. If you have any questions regarding the content or
purpose of the survey, please contact Shannon Curtis Kellogg at 317-872-0784. If you have
questions about HIP 2.0, please call 1-877-GET-HIP-9.
Thank you for your time.
Sincerely,
[Signature Block]
Joseph Moser
Medicaid Director

Page 176 of 176
Appendix K – Survey Notification Letter Sent to HIP Providers
[Date]
[Provider Name and Address]
Dear [Provider Name],
We are writing to encourage you to participate in an important telephone survey for the state of
Indiana. As you may know, Indiana has implemented the new Healthy Indiana Plan (or “HIP
2.0”). The state is working with The Lewin Group and Bingle Research to conduct phone
interviews with providers across the state in order to understand your experience with HIP 2.0.
Your participation in this interview process is a critical component of Indiana’s evaluation of the
HIP 2.0 Initiative. Indiana will use the data collected from these surveys to help understand the
impact of the HIP 2.0 program.
In the next few weeks, someone from The Lewin Group or Bingle Research may contact you to
conduct the interview or to set up an interview time most convenient for your schedule.
Interviews will be conducted over the phone and may be with the practice administrator or office
manager. Our phone call should take about ten minutes. Results will be reported in a non
identifiable, aggregated form that will ensure your full confidentiality. Data on your individual
practice will not be shared with anyone besides the evaluation team, and will not be used for any
purposes other than the evaluation of this initiative.
If you have any questions regarding the content or purpose of the survey, please contact us at
317-927-7004. If you have questions about HIP 2.0, please call 1-877-GET-HIP-9.
Thank you in advance for your participation in this important process.
Sincerely,
[Signature Block]
Joseph Moser
Medicaid Director