healthcare utilization and cost of the smi population in ... · depression 0.53, major depression...
TRANSCRIPT
1
Healthcare Utilization and Cost
of the SMI Population in Texas Medicaid:
Year 3 Final Report of the UTSPH Medicaid SMI Study
March 2017
Prepared for:
The Meadows Mental Health Policy Institute
by:
UT School of Public Health Faculty:
Paul J. Rowan, Charles Begley, Robert Morgan
UT School of Public Health Doctoral Students:
Shuangshuang Fu, Bakbergen Turibekov

2
Healthcare Utilization and Cost
of the SMI Population in Texas Medicaid:
Year 3 Final Report of the UTSPH Medicaid SMI Study
March 2017
Table of Contents
Executive Summary ………………………………………………………………. 03
I. Introduction ……………………………………………………………………….. 06
II. Data Acquisition and Linkage …………………………………………………….. 08
III. Utilization Analyses ………………………………………………...……………... 09
IV. Conclusion and Discussion ……………………………………………………….. 26
Contact:
Paul J. Rowan, Ph.D., M.P.H.
Associate Professor, The University of Texas-Houston School of Public Health
Division of Management, Policy, and Community Health
Reuel A. Stallones Building, Room E303
1200 Herman Pressler
Houston, TX 77030
(713) 500-9183 phone
(713) 500-9171 fax

3
Healthcare Utilization and Cost
of the SMI Population in Texas Medicaid:
Year 3 Interim Report of the UTSPH Medicaid SMI Study
Executive Summary
In 2014, the UTSPH SMI Study team began obtaining and linking several administrative
databases from Texas state healthcare agencies in order to document the use and cost of
healthcare for adults with severe mental illness (SMI) across public programs. Our main focus is
on determining the average use and cost of services of the Medicaid enrolled adult population
with SMI, how they compare to Medicaid adults without SMI, and how they vary by diagnostic
(schizophrenia, bipolar, depression), medical comorbidity (with/without), and Medicaid
eligibility (SSI/non-SSI, Medicaid/Medicare dual eligibles, etc.) subgroup. We have also
conducted interviews with healthcare providers and managed care plan representatives regarding
issues in payment models and service delivery for this population.
Two previous reports completed in 2015 and 2016, available from the authors or from the
website of the UTSPH Center for Health Services Research, provide more details on the
objectives of the study, the databases obtained and linked, the methods used to identify cases,
services, and costs, findings on the characteristics of the Medicaid SMI population, their
enrollment patterns, their total and per capita healthcare costs, and preliminary results from the
healthcare provider interviews.
In this report, we present findings on utilization and cost patterns of Medicaid-enrolled
adults with SMI in 2012, the latest year for which we have data, including: variation in
hospitalizations and emergency room (ER) visits as compared to adults without SMI and
differences within diagnostic, comorbidity, and eligibility subgroups. We also identify the

4
characteristics of adults with SMI with the highest costs and their relative proportion of total
Medicaid service use and costs.
Major Findings
Compared to Medicaid adults without SMI, those with SMI had a significantly higher
likelihood of being hospitalized during the year (OR 2.3; 95% CI 2.2-2.3) and having one or
more ER visits (OR 3.1; 95% CI 3.1-3.1). Further, Medicaid adults with SMI had significantly
higher annual hospital and ER rates than non-SMI adults (hospitalizations: 0.54 versus 0.38 per
12 months for SMI and non-SMI, respectively; ER visits: 2.38 versus 0.87 per 12 months,
respectively). The primary reason for the visits were more often medical than psychiatric
(hospitalizations: primary medical diagnosis 70%, primary psychiatric diagnosis 29%; ER visits:
primary medical diagnosis 88%, primary psychiatric diagnosis 11%). Medicaid adults with more
than one SMI diagnosis (combinations of bipolar, depression and schizophrenia) have
significantly higher rates of inpatient and ER utilization relative to those with only one SMI
diagnosis (i.e. hospitalizations: major depression 0.25 per 12 months, major depression plus
bipolar disorder 0.30, major depression plus schizophrenia 0.29, all three 0.47; ER visits: major
depression 0.53, major depression plus bipolar disorder 0.65, major depression plus
schizophrenia 0.54, all three 0.70).
Although the magnitude of differences varied, the excess utilization of the SMI
population compared to non-SMI applied across sub-groups with different numbers of medical
comorbidities and eligibility status. Likelihood ratios comparing SMI/non-SMI varied from 1.3
to 3.0 for hospitalizations and from 1.5 to 4.0 for ER visits across subgroups with 0 to 6+
comorbidities. Similarly, the likelihood ratios comparing SMI/non-SMI varied from 1.9 to 2.6
5
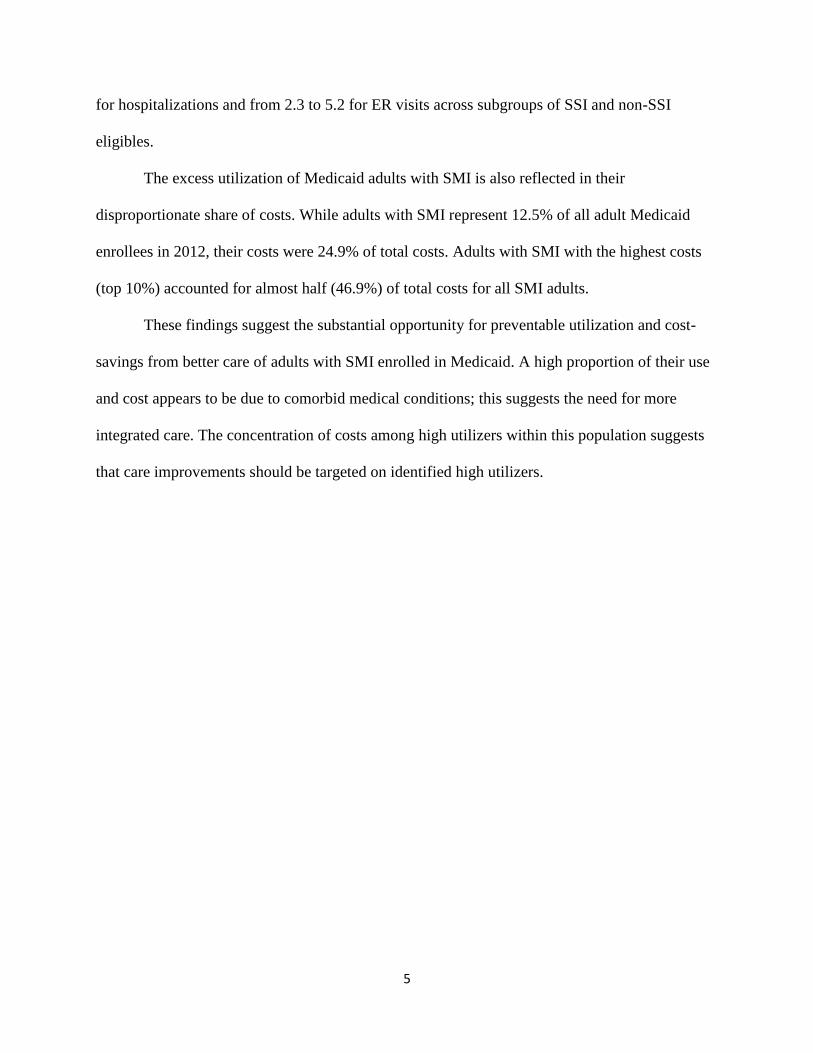
for hospitalizations and from 2.3 to 5.2 for ER visits across subgroups of SSI and non-SSI
eligibles.
The excess utilization of Medicaid adults with SMI is also reflected in their
disproportionate share of costs. While adults with SMI represent 12.5% of all adult Medicaid
enrollees in 2012, their costs were 24.9% of total costs. Adults with SMI with the highest costs
(top 10%) accounted for almost half (46.9%) of total costs for all SMI adults.
These findings suggest the substantial opportunity for preventable utilization and cost-
savings from better care of adults with SMI enrolled in Medicaid. A high proportion of their use
and cost appears to be due to comorbid medical conditions; this suggests the need for more
integrated care. The concentration of costs among high utilizers within this population suggests
that care improvements should be targeted on identified high utilizers.

6
Healthcare Utilization and Cost
of the SMI Population in Texas Medicaid:
Year 3 Final Report of the UTSPH Medicaid SMI Study
Introduction
Serious Mental Illness (SMI) affects cognition and emotions, and impacts interpersonal
relationships, productivity, and the ability to work and be self-sufficient. Because of this impact,
a high portion of this population relies on publically subsidized programs, such as Medicaid, to
access needed healthcare. To better understand the characteristics of the SMI population enrolled
in Medicaid and their utilization and cost patterns, the Texas Institute for Health Care Quality
and Efficiency, the Texas Department of Health and Human Services, and the Meadows Mental
Health Policy Institute, have funded our UTSPH research team to obtain and link several
administrative databases and conduct analyses of utilization and cost patterns of the SMI adult
population with Medicaid coverage. The analyses are designed to produce useful information for
policymakers, advocates, and healthcare providers concerned with identifying strategies for
increasing effectiveness, efficiency, and equity of care for this population. Our previous reports
are available from the authors or from the website of the UTSPH Center for Health Services
Research.
In this report, we have focused on describing the proportion of Medicaid SMI adults with one
or more hospital and/or emergency room visit in 2012, describing the variation within SMI
subgroups and between SMI and non-SMI adults, and on describing the characteristics and
utilization patterns of high utilizers. Hospital visits and ER visits are significant because of their

7
preventability and high cost, and it is significant to examine those with high utilization in order
to consider the proportion of care that may be devoted to this population, and the degree that
savings could be achieved by more optimally managing this care.

8
I. Data Acquisition and Linkage
The data acquisition objectives for this part of the project were to obtain the following
updates from the Texas Health and Human Services Commission (HHSC):
Medicaid acute care and pharmacy claims and encounters for 2013-2014,
Medicaid acute care and pharmacy claims and encounters refresh for 2008-2012, and
Medicare acute care and pharmacy claims for 2013-2014;
from the Department of Aging and Disability Services (DADS):
LTSS encounters and payments for Medicaid adults with SMI; and
from the Department of State Health Services:
Local Mental Health Authority and State Hospital (LMHA/SH) encounters and
payments, and
statewide hospital discharges (THCIC) of Medicaid adults with SMI.
Data requests to HHSC were submitted in mid-2015 and are awaiting final approval of a
Memorandum of Understanding (MOU) so the Medicaid and Medicare updates can be
transferred. HHSC staff obtained a signed Data Use Agreement with the University of Texas to
allow the data transfer once the MOU between HHSC and UTSPH is approved. The MOU has
been delayed as it is being further developed by HHSC staff as part of an agency-wide data
sharing plan. Once we receive the updated Medicaid and Medicare files, we can identify those
with an SMI diagnosis, and prepare the data update requests, for these Medicaid adults, to DADS
and the DSHS.

9
II. Utilization Analyses
Overview
We identified 232,348 adult Medicaid enrollees with a SMI diagnosis in 2012. This
population accounted for 12.5% of all 1,863,880 adult Medicaid adults. We examined utilization
and costs of services of adults with and without SMI in four dimensions.
First, we calculated the counts and the percentage of Medicaid enrolled adults who had
one or more hospitalization or ER visit. This addresses overall use of hospital and ER services
among Medicaid adults with and without an SMI diagnosis. To control for differences in
continuity of enrollment among Medicaid adults, which would affect the opportunity for
accessing hospital or ER services, we limited the utilization analyses to those with continuous
enrollment throughout the year. The continuously enrolled SMI adult population of 152,872
represented 66% of the total SMI adult population. The utilization of this population was
compared to the 679,686 non-SMI Medicaid adults with continuous enrollment, representing
42% of all adult non-SMI adults. These counts are compared between those with and without an
SMI diagnosis for the following characteristics: number of medical comorbidities; SSI status;
and specific Medicaid program. To explore the degree that utilization by Medicaid adults with
SMI is related to the mental illness or other conditions, we examined the primary diagnosis for
the hospitalization or ER event by the primary diagnosis for these events, and by diagnosis of the
enrollee. We also examined the number and percent of hospitalizations and ER visits for
Medicaid adults with SMI by dual-enrollment status with Medicare, and by the intersections of
diagnostic group, dual-enrollment, and SSI status.
Second, we calculated the rate of hospitalizations and ER visits per enrollment month to
address the question of intensity of use of these services among Medicaid adults with and

10
without an SMI diagnosis. Calculating the number of events per enrollee per month allows the
inclusion of Medicaid adults enrolled for less than the entire year, consequently we used our
entire cohort of Medicaid adults with (N = 232,348) and without (N = 1,863,880) an SMI
diagnosis. We standardized the monthly rate to a rate of events per 12 months of enrollment for
ease of comparison and interpretation. These rates of events were examined by: SMI status; dual-
enrollee status; dual-enrollment status; by SMI diagnostic group, and by level of medical
comorbidities (less than 3, three or more; medical comorbidities included: diabetes mellitus,
diseases of the heart, chronic lower respiratory disease, disorders of lipid metabolism, arthritis,
cerebrevascular diseases, nephritis/nephrotic syndromes/nephrosis, influenza and pneumonia,
malignant neoplasms, septicemia, Alzheimer's Disease, osteoporosis, hepatitis C, and
unintentional injuries).
Third, we conducted a comparison of the portion of Medicaid adults with SMI with their
portion of 2012 Medicaid and Medicare costs. We also compared these combined costs for a
subset of the most costly Medicaid adults. We examined the dollars of utilization, and
percentage, for the top 01%, 05%, 10%, and 25% most costly Medicaid adults, and noted the
portion that had an SMI diagnosis. We also calculated further data for the 10% most costly
patients relative to the remaining 90%. Costs were total Medicaid and Medicare acute care
expenditures during 2012. We examined high utilizers among subgroups based on a combination
of number of medical comorbidities (< 3 versus 3 or more) and SSI eligibility status (SSI versus
non-SSI).
Finally, we examined differences in utilization and costs for Medicaid adults with and
without a SMI across subgroups based on number of comorbidities, and eligibility status.

11
Use of Hospital and ER Services among Medicaid Adults with and without SMI
We analyzed hospitalization and ER utilization differences between Medicaid adults with
and without SMI, and the extent of the differences among SMI adults by SSI status and by
specific Medicaid program. Analyses were limited to Medicaid adults with continuous
enrollment during FY 2012. Table 1 shows the number and percent of Medicaid adults with and
without SMI who had one or more hospitalization and/or ER visit in 2012, and odds ratios
comparing the two populations. As indicated in the table, the likelihood of an adult with SMI
having one of these events was 2.3 times that of adults without SMI for hospitalizations and 3.1
times that of the adults without SMI for ER visits.
Table 1. Number and percent of Medicaid adults with hospitalizations and/or ER visits:
SMI versus Non-SMI.
Adults with SMI Adults without SMI Odds Ratio (95% CI)
Hospitalizations 39,262 (25.7%) 90,441 (13.3%) 2.3 (2.2 to 2.3)
ER Visits 84,339 (55.2%) 193,117 (28.4%) 3.1 (3.1 to 3.1)
Total Adults 152,872 (100.0%) 679,686 (100.0%)
The percentage of individuals with hospital admissions and/or ER visits rises with the
number of comorbidities for adults both with and without SMI, although, compared to the non-
SMI population the odds were consistently higher for SMI adults across increasing numbers of
comorbidities (Table 2).

12
Table 2. Number and percentage of Medicaid adults with hospitalizations or ER visits:
SMI versus non-SMI by medical comorbidity count.
Hospitalizations
SMI Adults Non-SMI Adults
Number of
Comorbidities N
N (%) with
Hospitalizations N
N (%) With
Hospitalizations Odds Ratio (95% CI)
0 67,601 10,917 (16.1%) 401,117 24,325 (6.1%) 3.0 (2.9, 3.1)
1 37,244 8,043 (21.6%) 115,318 13,337 (11.6%) 2.1 (2.0, 2.2)
2 22,697 6,960 (30.7%) 77,601 15,945 (20.5%) 1.7 (1.7, 1.8)
3 13,223 5,692 (43.0%) 46,513 15,342 (33.0%) 1.5 (1.5, 1.6)
4 7,060 3,930 (55.7%) 23,845 11,204 (47.0%) 1.4 (1.3, 1.5)
5 3,201 2,200 (68.7%) 10,156 6,306 (62.1%) 1.3 (1.2, 1.5)
6+ 1,846 1,520 (82.3%) 5,136 3,982 (77.5%) 1.4 (1.2, 1.5)
Total 152,872 39,262 (25.7%) 679,686 90,441 (13.3%) 2.3 (2.2, 2.3)
ER Visits
SMI Adults Non-SMI Adults
Number of
Comorbidities N
N (%) With ER
Visits N
N (%) With ER
Visits Odds Ratio (95% CI)
0 67,601 33,254 (49.2%) 401,117 72,361 (18.0%) 4.4 (4.3, 4.5)
1 37,244 20,006 (53.7%) 115,318 39,309 (34.1%) 2.2 (2.2, 2.3)
2 22,697 13,198 (58.1%) 77,601 31,795 (41.0%) 2.0 (1.9, 2.1)
3 13,223 8,653 (65.4%) 46,513 23,618 (50.8%) 1.8 (1.8, 1.9)
4 7,060 5,061 (71.7%) 23,845 14,553 (61.0%) 1.6 (1.5, 1.7)
5 3,201 2,532 (79.1%) 10,156 7,295 (71.8%) 1.5 (1.3, 1.6)
6+ 1,846 1,635 (88.6%) 5,136 4,186 (81.5%) 1.8 (1.5, 2.1)
Total 152,872 84,339 (55.2%) 679,686 193,117 (28.4%) 3.1 (3.1, 3.1)

13
Table 3 shows the proportions of SMI and non-SMI Medicaid adults with hospitalizations
or ER visits by SSI eligibility status. Regardless of SSI eligibility status, Medicaid adults with
SMI were more likely to use hospital or ER services. However, the odds ratios were consistently
higher for the non-SSI adults than for those with SSI eligibility.
Table 3. Number and percentage of Medicaid SMI versus non-SMI adults with
hospitalizations and ER visits: SSI versus non-SSI.
Non-SSI
SMI Adults
Total N = 22,038
Non-SMI Adults
Total N = 271,455
Odds Ratio
(95% CI)
Hospitalizations 4,807 (21.8%) 26,090 (9.6%) 2.6 (2.5 to 2.7)
ER Visits 12,260 (55.6%) 52,498 (19.3%) 5.2 (5.1 to 5.4)
SSI
SMI
Number (percent);
Total N = 130,834
Non-SMI
Number (percent);
Total N = 408,231
Odds Ratio
(95% CI),
SMI vs. Non-SMI
Hospitalizations 34,455 (26.3%) 64,351 (15.8%) 1.9 (1.9 to 1.9)
ER Visits 72,079 (55.1%) 140,619 (34.5%) 2.3 (2.3 to 2.4)
Table 4 compares hospitalizations and ER visits for Medicaid adults with and without
SMI by Medicaid program. Generally, hospitalizations are twice as common in adults with SMI
versus without, and ER visits are two to three times as common in adults with SMI.

14
Table 4. Number and percentage of Medicaid adults with hospitalizations and ER visits:
SMI versus non-SMI by Medicaid program.
Hospitalizations
SMI Adults Non-SMI Adults OR (95% CI)
Medicaid Program Total Hospitalizations Total Hospitalizations
SSI 106,977 26,675 (24.9%) 352,519 53,357 (15.1%) 1.9 (1.8, 1.9)
SSI-Related MAO 20,901 6,910 (33.1%) 46,391 9,425 (20.3%) 1.9 (1.9, 2.0)
Catastrophic
Healthcare:
Qualified Medicare
Beneficiary
10,345 2,316 (22.4%) 76,157 8,547 (11.2%) 2.3 (2.2, 2.4)
TANF and Medicaid 5,227 1,154 (21.9%) 26,769 4,321 (16.1%) 1.5 (1.4, 1.6)
“Federally
Mandated
Children” 18 +
2,108 382 (18.1%) 7,267 822 (11.3%) 1.7 (1.5, 2.0)
TANF-UP and
Medicaid 754 165 (21.9%) 7,467 858 (11.5%) 2.2 (1.8, 2.6)
Other 6,510 1,660 (25.5%) 163,116 13,111 (8.0%) 3.9 (3.7, 4.2)
Total 152,872 39,262 (26.7%) 679,686 90,441 (13.3%) 2.3 (2.2, 2.3)
ER Visits
SSI 106,977 60,530 (56.6%) 352,519 123,568 (35.1%) 2.4 (2.4, 2.4)
SSI-Related MAO 20,901 9,847 (47.1%) 46,391 14,194 (30.6%) 2.0 (2.0, 2.1)
Catastrophic
Healthcare:
Qualified Medicare
Beneficiary
10,345 5,220 (50.5%) 76,157 17,983 (23.6%) 3.3 (3.2, 3.4)
TANF and Medicaid 5,227 3,603 (68.9%) 26,769 14,321 (53.5%) 1.9 (1.8, 2.0)
Federally
Mandated Children 2,108 1,104 (52.4%) 7,267 2,519 (34.7%) 2.1 (1.9, 2.3)
TANF-UP+ Medicaid 754 501 (66.4%) 7,467 3,254 (43.6%) 2.6 (2.2, 3.0)
Other 6,510 3,534 (54.3%) 163,116 17,278 (10.6%) 10.0 (9.5, 10.6)
Total 152,872 84,339 (55.2%) 679,686 193,117 (28.4%) 3.1 (3.1, 3.1)

15
Variation in Utilization by Diagnosis
Approximately 30% of hospitalizations of SMI adults were primarily for psychiatric
conditions (depression, bipolar disorder, and schizophrenia), approximately 1% were primarily
related to substance use, and the majority, 69.8%, were primarily for a medical or other reason
(all remaining codes). The comparable percentages for ER visits are 10%, 2%, and 88%,
respectively (Table 5).
Table 5. Number and percentage of Medicaid SMI adults with hospitalizations and ER
visits by primary diagnosis of event.a
SMI Adults (N = 152,872)
Hospitalizations Primary Diagnosis 39,262 (25.7%)b
SMI 11,546 (29.4%)c
Substance-Related 518 (1.3%)c
Neither SMI nor Substance-Related 27,422 (69.8%)c
ER Visits 84,339 (55.2%)b
SMI 8,824 (10.5%)d
Substance-Related 2,066 (2.5%)d
Neither SMI nor Substance-Related 74,072 (87.8%)d
a Individuals could have had more than one category of hospitalization. b Percent of all SMI adults. c Percent of hospitalizations. d Percent of ER visits.
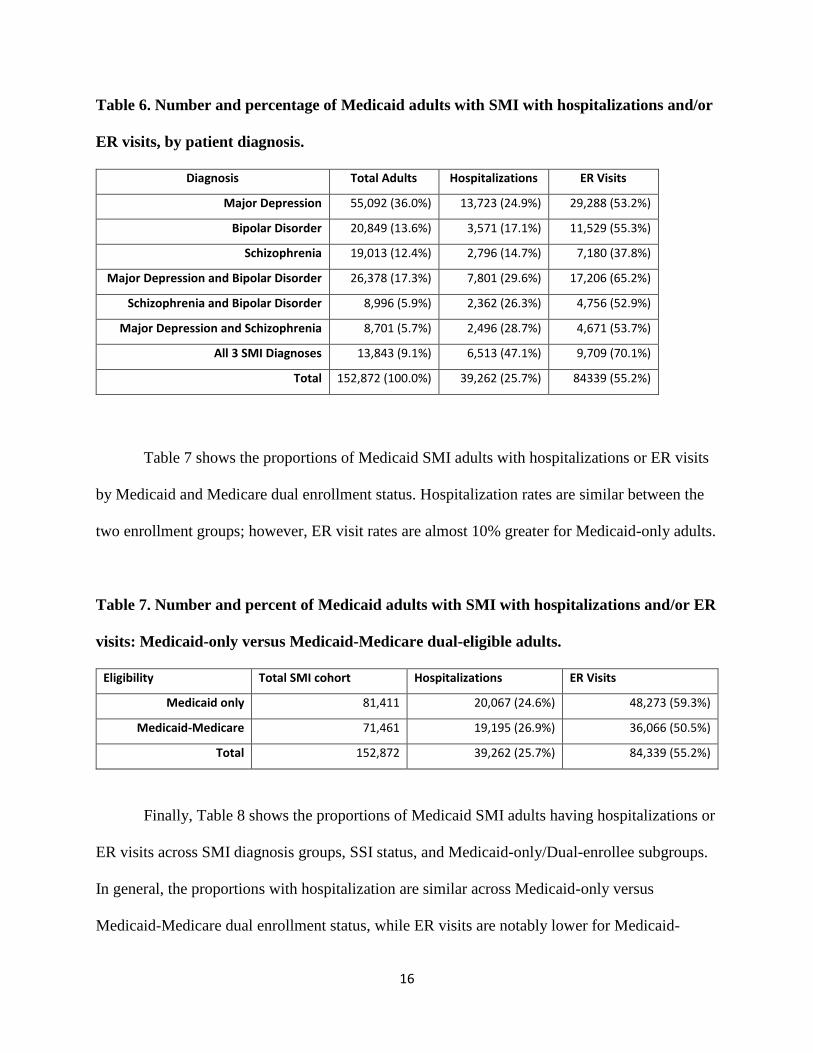
Table 6 shows the proportions of Medicaid adults with SMI, by SMI diagnosis, who had
hospitalizations or ER visits. The proportion with hospitalizations or ER visits were lowest
among Medicaid adults with a diagnosis of schizophrenia (without comorbid depression or
bipolar disorder), and highest among those with all three SMI diagnoses.
16
Table 6. Number and percentage of Medicaid adults with SMI with hospitalizations and/or
ER visits, by patient diagnosis.
Diagnosis Total Adults Hospitalizations ER Visits
Major Depression 55,092 (36.0%) 13,723 (24.9%) 29,288 (53.2%)
Bipolar Disorder 20,849 (13.6%) 3,571 (17.1%) 11,529 (55.3%)
Schizophrenia 19,013 (12.4%) 2,796 (14.7%) 7,180 (37.8%)
Major Depression and Bipolar Disorder 26,378 (17.3%) 7,801 (29.6%) 17,206 (65.2%)
Schizophrenia and Bipolar Disorder 8,996 (5.9%) 2,362 (26.3%) 4,756 (52.9%)
Major Depression and Schizophrenia 8,701 (5.7%) 2,496 (28.7%) 4,671 (53.7%)
All 3 SMI Diagnoses 13,843 (9.1%) 6,513 (47.1%) 9,709 (70.1%)
Total 152,872 (100.0%) 39,262 (25.7%) 84339 (55.2%)
Table 7 shows the proportions of Medicaid SMI adults with hospitalizations or ER visits
by Medicaid and Medicare dual enrollment status. Hospitalization rates are similar between the
two enrollment groups; however, ER visit rates are almost 10% greater for Medicaid-only adults.
Table 7. Number and percent of Medicaid adults with SMI with hospitalizations and/or ER
visits: Medicaid-only versus Medicaid-Medicare dual-eligible adults.
Eligibility Total SMI cohort Hospitalizations ER Visits
Medicaid only 81,411 20,067 (24.6%) 48,273 (59.3%)
Medicaid-Medicare 71,461 19,195 (26.9%) 36,066 (50.5%)
Total 152,872 39,262 (25.7%) 84,339 (55.2%)
Finally, Table 8 shows the proportions of Medicaid SMI adults having hospitalizations or
ER visits across SMI diagnosis groups, SSI status, and Medicaid-only/Dual-enrollee subgroups.
In general, the proportions with hospitalization are similar across Medicaid-only versus
Medicaid-Medicare dual enrollment status, while ER visits are notably lower for Medicaid-
17
Medicare dual enrollee adults, regardless of SSI status or diagnostic group. Also, the portion
with hospitalizations, and with ER visits, was greater for those with two or all three SMI
diagnoses than for those with one.

18
Table 8. Number and percentage of Medicaid adults with SMI with hospitalizations and
ER visits: Patient diagnosis by SSI and Medicaid-only/Dual status.
Medicaid-Only
Diagnostic Group
SSI Status
Number
Hospitalizations
ER Visits
Major Depression Non-SSI 5,009 974 (19.4%) 2,896 (57.8%)
SSI 18,662 4,090 (21.9%) 10,920 (58.5%)
Bipolar Disorder Non-SSI 1,791 359 (20.0%) 1,129 (63.0%)
SSI 11,392 1,843 (16.2%) 6,552 (57.5%)
Schizophrenia Non-SSI 65 15 (23.1%) 37 (56.9%)
SSI 10,541 1,526 (14.5%) 4,272 (40.5%)
Major Depression and Bipolar Disorder Non-SSI 3,296 807 (24.5%) 2,156 (65.4%)
SSI 12,994 3,776 (29.1%) 8,897 (68.5%)
Schizophrenia and Bipolar Disorder Non-SSI 100 26 (26.0%) 67 (67.0%)
SSI 5,165 1,427 (27.6%) 2,910 (56.3%)
Major Depression and Schizophrenia Non-SSI 88 25 (28.4%) 58 (65.9%)
SSI 4,314 1,260 (29.2%) 2,509 (58.2%)
All 3 SMI Diagnoses Non-SSI 254 105 (41.3%) 179 (70.5%)
SSI 7,740 3,834 (49.5%) 5,691 (73.5%)
Total Non-SSI 10,603 2,311 (21.8) 6,522 (61.5)
SSI 70,808 17,756 (25.1) 41,751 (59.0)
Medicaid-Medicare
Diagnostic Group
SSI Status
Number
Hospitalizations
Emergency Visits
Major Depression Non-SSI 4,163 868 (20.9%) 2,049 (49.2%)
SSI 27,258 7,791 (28.6%) 13,423 (49.2%)
Bipolar Disorder Non-SSI 1,908 315 (16.5%) 954 (50.0%)
SSI 5,758 1,054 (18.3%) 2,894 (50.3%)
Schizophrenia Non-SSI 1,634 189 (11.6%) 539 (33.0%)
SSI 6,773 1,066 (15.7%) 2,332 (34.4%)
Major Depression and Bipolar Disorder Non-SSI 1,740 500 (28.7%) 1,089 (62.6%)
SSI 8,348 2,718 (32.6%) 5,064 (60.7%)
Schizophrenia and Bipolar Disorder Non-SSI 691 179 (25.9%) 335 (48.5%)
SSI 3,040 730 (24.0%) 1,444 (47.5%)
Major Depression and Schizophrenia Non-SSI 514 113 (22.0%) 253 (49.2%)
SSI 3,785 1,098 (29.0%) 1,851 (48.9%)
All 3 SMI Diagnoses Non-SSI 785 332 (42.3%) 519 (66.1%)
SSI 5,064 2,242 (44.3%) 3,320 (65.6%)
Total Non-SSI 11,435 2,496 (21.8) 5,738 (50.2)
SSI 60,026 16,699 (27.8) 30,328 (50.5)

19
Rate of Hospitalizations and ER Visits per 12 months of Enrollment
Table 9 presents ER visit rates and hospitalization rates per 12 months of enrollment for
Medicaid adults with and without SMI, and presents these data by Medicaid/Medicare dual-
enrollment and SSI status. Table 10 presents ER visit rates and hospitalization rates per 12
months of enrollment for Medicaid adults with and without SMI, by clinical characteristics
including: level of medical comorbidity (less than 3, three or more), and SMI diagnosis groups.
Table 9. Twelve-Month Emergency Room Visit Rates and Hospitalization Rates, Medicaid
adults with and Without SMI, by Enrollment Characteristics: Medicaid/Medicare dual
enrollment, SSI benefit status.
# ER Visits Per
12 Mo Enrollment
# Hospitalizations Per
12 Mo Enrollment
SMI Status
SMI 2.38 0.54
Non-SMI 0.87 0.38
Dual Enrollee Status
SMI Medicaid-Only 2.91 0.51
Medicaid-Medicare 1.72 0.59
Non-SMI Medicaid-Only 0.93 0.41
Medicaid-Medicare 0.75 0.33
SSI Status:
SMI Non-SSI 2.49 0.46
SSI 2.36 0.56
Non-SMI Non-SSI 0.81 0.42
SSI 0.95 0.34

20
Table 10. Twelve-Month Emergency Room Visit Rates and Hospitalization Rates, Medicaid
adults with and Without SMI, by Clinical Characteristics: Comorbidity Level, Specific
SMI Diagnostic Group.
# ER Visits Per
12 Mo Enrollment
# Hospitalizations Per
12 Mo Enrollment
Medical Comorbidity Level
SMI Less Than 3 2.19 0.39
3 or More 3.45 1.37
Non-SMI Less Than 3 0.77 0.32
3 or More 1.94 1.06
Diagnostic Group
Schizophrenia 1.24 0.27
Major Depression 2.04 0.53
Bipolar Disorder 2.25 0.33
Schizophrenia and Dep 2.19 0.58
Schizophrenia and Bipolar 2.19 0.52
Major Depr and Bipolar 3.22 0.61
All 3 4.51 1.23
21
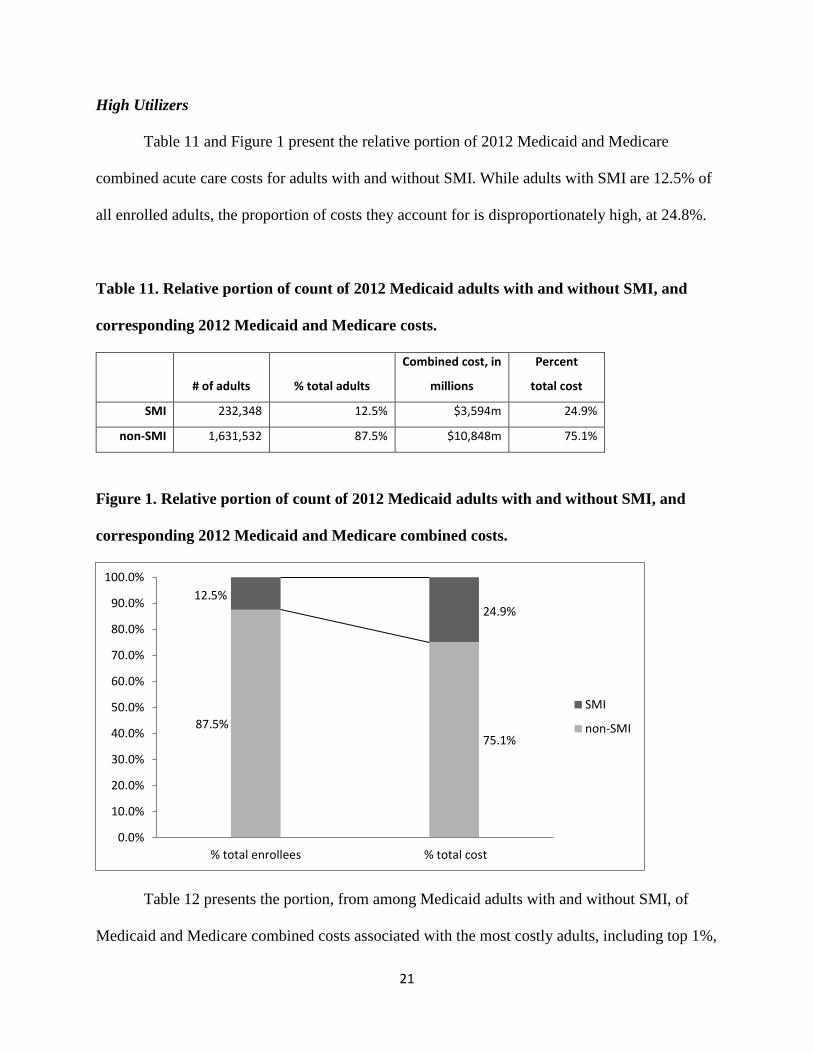
High Utilizers
Table 11 and Figure 1 present the relative portion of 2012 Medicaid and Medicare
combined acute care costs for adults with and without SMI. While adults with SMI are 12.5% of
all enrolled adults, the proportion of costs they account for is disproportionately high, at 24.8%.
Table 11. Relative portion of count of 2012 Medicaid adults with and without SMI, and
corresponding 2012 Medicaid and Medicare costs.
# of adults % total adults
Combined cost, in
millions
Percent
total cost
SMI 232,348 12.5% $3,594m 24.9%
non-SMI 1,631,532 87.5% $10,848m 75.1%
Figure 1. Relative portion of count of 2012 Medicaid adults with and without SMI, and
corresponding 2012 Medicaid and Medicare combined costs.
Table 12 presents the portion, from among Medicaid adults with and without SMI, of
Medicaid and Medicare combined costs associated with the most costly adults, including top 1%,
87.5%75.1%
12.5%24.9%
0.0%
10.0%
20.0%
30.0%
40.0%
50.0%
60.0%
70.0%
80.0%
90.0%
100.0%
% total enrollees % total cost
SMI
non-SMI

22
5%, 10%, and 25%. The top 10% most expensive Medicaid adults with SMI accounted for
46.9% of 2012 combined Medicaid-Medicare expenses (Figure 2), while the top 10% most
expensive Medicaid adults without SMI accounted for 66.9% of 2012 Medicaid-Medicare
expenses (Figure 3; Figure 4).
Table 12. Medicaid and Medicare 2012 Combined Costs and Percentages Associated with
Top Portions of Medicaid Utilizers.
SMI Non-SMI
2012 Expense 2012 Medicaid Costs
(in thousands)
Percent of total
2012 Medicaid
Costs
2012 Medicaid Costs
(in thousands)
Percent of total
2012 Medicaid
Costs
Top 01% $221,600, 13.4% $1,053,800, 22.0%
Top 05% $553,530, 35.1% $2,323,300, 48.6%
Top 10% $802,760, 51.0% $3,121,000, 65.3%
Top 25% $1,217,900, 77.3% 4,260,400, 89.1%
Total $1,575,233, 100.0% 4,781,677, 100.0%
Figure 2. Medicaid and Medicare 2012 Combined Costs and Percentages Associated with
Top Portions of Medicaid Utilizers, Medicaid Adults with SMI.
90.0%
53.1%
10.0%
46.9%
0.0%
10.0%
20.0%
30.0%
40.0%
50.0%
60.0%
70.0%
80.0%
90.0%
100.0%
Total enrollees Total combined cost
Top 10 percent most costlyenrollees
Other 90 percent enrollees

23
Figure 3. Medicaid and Medicare 2012 Combined Costs and Percentages Associated with
Top Portions of Medicaid Utilizers, Medicaid Adults with SMI.
Figure 4. Texas Medicaid and Medicare 2012 combined costs, by top ten percent most
costly Medicaid adults.
90.0%
33.1%
10.0%
66.9%
0.0%
10.0%
20.0%
30.0%
40.0%
50.0%
60.0%
70.0%
80.0%
90.0%
100.0%
Total enrollees Total combined cost
Top 10 percent most costlyenrollees
Other 90 percent enrollees
$1,684,100,000 $1,909,505,695
$7,260,200,000
$3,588,166,259
Top 10 percent most costly enrollees Other 90 percent enrollees
SMI non-SMI

24
SMI/non-SMI Differences by Number of Comorbidities and SSI Status
Higher utilization should be expected in those with more medical comorbidities, and in
those with, versus without, SSI. Table 13 presents mean Medicaid and Medicare costs combined,
for Medicaid adults with and without SMI, at differing levels of medical comorbidities: those
with fewer than 3 medical comorbidities, and those with 3 or more medical comorbidities. These
data are illustrated in Figure 4, as well.
For this population, adults with SMI had significantly greater 2012 costs relative to those
without SMI, but the magnitude of difference was not as great for those with three or more
medical comorbidities, and was not as great for those with SSI. For Medicaid adults with fewer
than three medical comorbidities, mean 2012 cost per non-SSI adult with SMI was $5,968, while
mean 2012 cost was $2,825 for those without SMI. For Medicaid adults with three or more
medical comorbidities, mean 2012 cost per non-SSI adult with SMI was $30,683, while mean
2012 cost was $$26,452 for those without SMI. For SSI-enrolled Medicaid adults with SMI,
mean 2012 costs for those with fewer than three medical comorbidities was $12,685, while mean
2012 costs for SSI-enrolled Medicaid adults without SMI was $9,130. For SSI-enrolled Medicaid
adults with SMI, mean 2012 costs for those with three or more medical comorbidities was
$44,784, while mean 2012 costs for SSI-enrolled Medicaid adults without SMI was $36,814.

25
Table 13. Combined 2012 Medicaid and Medicare combined costs by level of medical
comorbidity and by SSI status, Medicaid adults with and without SMI.
SMI Non-SMI
Comorbidity Level Number Mean Cost Per
Enrollee
Number Mean Cost Per
Enrollee
Less than three Non-SSI 55,553 $5,968 1,073,915 $2,825
SSI 143,564 $12,685 451,941 $9,130
Three or more Non-SSI 3,347 $30,683 19,538 $26,452
SSI 29,884 $44,784 86,138 $36,814
Figure 4. Mean combined cost for 2012 Medicaid adult enrollees, by indicators of level of
medical need: SSI status and number of medical comorbidities.
$5,968
$12,685
$30,683
$44,784
$2,825
$9,130
$26,452
$36,814
non-SSI SSI non-SSI SSI
< 3 comorbidities ≥ 3 comorbidities
SMI non-SMI

26
IV. Conclusion and Discussion
Compared to Medicaid adults without SMI, those with SMI had a significantly higher
likelihood of being hospitalized during the year, and having one or more ER visits. This relative
difference was observed across a variety of differentiations, including across number of medical
comorbidities, SSI status, and Medicaid-Medicare dual enrollment. Generally, ER visits were
greater in number, and were proportionately greater than hospitalizations, likely because health
care providers and systems have more control over hospital admission than ER admission.
Among Medicaid SMI adults, those with more than one SMI diagnosis had higher rates
of inpatient and ER utilization, relative to those with only one diagnosis. This may be due to
greater clinical complexity. It may also be that some individuals present greater diagnostic
uncertainty, resulting in more difficult to manage care. Stronger emphasis on continuity of care
may be needed when adults with SMI access care in short-term care settings, such as the ER.
Hospitalizations and ER visits for Medicaid adults with SMI are more often for medical
rather than psychiatric reasons. This finding supports the need to extend and improve the
availability of integrated care services and sites for this population.
When examining utilization of Medicaid adults with SMI, the proportion with
hospitalizations are similar between Medicaid-Medicare dually enrolled adults and Medicaid-
only adults, while the proportion with ER visits is almost 20% greater for Medicaid-only adults.
The percentage of Medicaid SMI adults with hospitalizations are generally similar across
diagnostic, SSI status, and Medicaid-only/Dual-enrollee subgroups, while ER visits are notably
lower for Medicaid-Medicare dually enrolled adults, regardless of SSI status or diagnostic group.
We calculated rates of hospitalizations and ER visits per 12-months of enrollment. This
analysis showed that Medicaid adults with SMI had a greater rates, at 2.38 ER visits and 0.54

27
hospitalizations per 12 months of enrollment, compared to 0.87 ER visits and 0.38
hospitalizations per 12 months of enrollment for adults without SMI.
We examined the portion of overall Medicaid costs attributable to Medicaid adults with
SMI. While adults with SMI were 12.5% of all Medicaid enrollees, they accounted for 24.9% of
all 2012 Medicaid and Medicare combined costs. Among adults with SMI, the top ten percent
most expensive accounted for 46.9% of all costs. We also calculated costs attributable to the top
1%, 5%, and 25%. This analysis showed that a relatively small portion of Medicaid adults
accounted for a great portion of costs, and this was more extreme at more extreme definitions of
high utilizer.
Finally, we examined combined Medicaid-Medicare costs for Medicaid adults with and
without SMI, according to level of anticipated medical need. This was defined by number of
comorbidities (less than 3 versus 3 or more), and by SSI eligibility status. Again, adults with
SMI had greater 2012 costs relative to those without SMI, but the magnitude of difference was
not as great for those with three or more medical comorbidities, and was not as great for those
with SSI.
These findings suggest that Medicaid payers and providers should devote attention to
adults with SMI, since this is a cohort with higher likelihood of expensive utilization, much of
which may be preventable. A significant portion of costs seems to be associated with medical
care for these adults with SMI, so interventions such as integrated care may be warranted.
Also, examination of high utilizers suggests strategies for improving quality and lowering
costs, such as wider application of care management strategies for identified high utilizers. Our
further analyses will try to identify more specific indicators and causes of high utilization, as
well as with evaluating strategies for managing this utilization, for example integrated care.
28
Our data suggest that, among adults with Medicaid only or among those with dual
Medicaid-Medicare enrollment, rates of inpatient and ER utilization are roughly comparable
between those with or without SSI eligibility. Finally, ER visits are somewhat less common for
those dually-enrolled in both Medicaid and Medicare than for those solely in Medicaid. This
difference could be due to a greater portion of older adults accessing Medicare due to age
eligibility as opposed to disability eligibility; clinical management may be more predictable in
that population.
We plan to conduct further analyses that will include examination of the costs of care for
SMI versus non-SMI Medicaid adults and differences in utilization among managed care
organization (MCO) and non-MCO adults. Further analyses will also examine the utilization of
Medicaid adults in other programs of care, including DADS, state hospitals, and the state’s set of
Community Centers providing care for individuals with SMI. We intend to build on the set of
analyses reported here and in our earlier reports by examining utilization across these additional
data sets, including an examination of the impact of disenrollment from Medicaid on utilization
in other programs of care.
We hope these analyses are valuable for stakeholders concerned with improving the
quality and efficiency of care for Medicaid adults with SMI. We believe that analysts outside of
state healthcare administration, under proper conditions (proper data access and use agreements,
proper management of confidentiality of information, proper IRB approval), and with the
collaboration of state staff, can greatly expand the fruitful analysis of state healthcare utilization
data. These analyses are necessary for evaluation of, and improvement of, state supported
healthcare programs and policies.