healthcare reform in china: consequences and policy - duo
TRANSCRIPT
Healthcare Reform in China: Consequences and Policy
Implications
Meng Tan
Master thesis for the Master of Philosophy in Environmental and
Development Economics
University of Oslo April 2010

ii
iii
Preface
First, I would like to express my deepest gratitude to my supervisor Tapas Kundu for his
patient guidance and insightful comments. I can never complete this thesis without his help
and support.
I also would like to thank all lecturers and other personnel in the Department of Economics
for teaching me and helping me. I want to thank all my friends here in Oslo who help me
have an enjoyable and memorable life in Norway.
Last but not least, I want to thank my parents, my brother, my sister-in-law and my niece for
their unconditional love.
All remaining mistakes are mine.
Meng Tan
April 30, 2010

iv
Abstract
China has continuous reforms in health sector since its economic reform in 1978. The
purpose of this thesis is to examine the health sector in China and provide policy
recommendations for healthcare reforms. A historical review on the reform process provided
implications of challenging problems in China’s health sector. Hospitals are classified into
three grades and prices for healthcare services are regulated. It is believed that efficiency
could be improved by applying more appropriate pricing scheme. A quality competitive
model of hospitals under regulated price was developed in this thesis. The author analyzed
the effect of expanding price difference among hospitals within the model. The results of the
model demonstrated that hospitals have higher incentive to improve healthcare quality after
increasing regulated price. However, the impact of expanding price difference depends on
other socioeconomic conditions. Hence policymakers need to pay careful attention to various
aspects of the health sector when applying this strategy.
Key words: healthcare reform, hospital competition, price regulation, healthcare quality

v
CONTENTS
1 INTRODUCTION.................................................................................................................................... 1
2 LITERATURE REVIEW........................................................................................................................ 3
2.1 HISTORICAL REVIEW OF THE HEALTH SECTOR IN CHINA......................................................................... 3
2.1.1 Period I (1978-1985) .................................................................................................................. 3
2.1.2 Period II (1985-1992)................................................................................................................. 4
2.1.3 Period III (1992-2000)................................................................................................................ 6
2.1.4 Period IV (2000-2005)................................................................................................................ 7
2.1.5 Period V (after 2005) .................................................................................................................. 8
2.2 IMPLICATIONS OF REFORM IN THE HEALTH SECTOR ................................................................................ 9
2.2.1 Increase insurance coverage ...................................................................................................... 9
2.2.2 Strengthen government role in healthcare supply .................................................................... 11
2.2.3 Improve efficiency in healthcare utilization.............................................................................. 13
3 AN ANALYTICAL STUDY.................................................................................................................. 15
3.1 THE BASIC MODEL................................................................................................................................ 15
3.1.1 Framwork.................................................................................................................................. 15
3.1.2 Interpretations of parameters ................................................................................................... 16
3.1.3 Hospitals’ strategic choices ...................................................................................................... 17
3.2 THE MODEL UNDER DIFFERENT REGULATED PRICES ............................................................................. 18
3.3 EFFECT OF EXPANDING PRICE DIFFERENCE........................................................................................... 20
4 CONCLUSION....................................................................................................................................... 23
REFERENCE.................................................................................................................................................... 24
APPENDIX........................................................................................................................................................ 27

1 Introduction
China launched a new plan of healthcare reform in 2009 aiming at solving the “kan bing nan,
kan bing gui” problem (decreasing access to healthcare and increasing expenditure on
healthcare) in the health sector. The phenomenon that high-grade hospitals are overcrowded
while low-grade hospitals are underutilized is one of the most debated topics in healthcare
reform. In China, public hospitals are classified into three grades according to health
resources and functions. Generally, high-grade hospitals are able to provide higher quality
healthcare services and treat more complicated diseases. Prices for healthcare services are
regulated. Historically, there is little price difference for the same treatment provided by
different hospitals. Some believe that expanding price difference among hospitals can
mitigate demand pressure on high-grade hospitals and improve the utilization rate of low-
grade hospitals; and suggest that pricing leverage should be used to coordinate demand and
supply of healthcare (Hu, 2006; Yin, 2009). This suggestion has been accepted by some
provinces (e.g., Jiangsu Province and Anhui Province) and a trial project has been launched.
Hence it is very important to understand the effects of changes in regulated prices on the
supply of and demand for healthcare services.
The purpose of this thesis is to provide a theoretical model of the strategies of high-grade
hospitals and low-grade hospitals facing regulated prices, analyze the effect of expanding
price difference and find some implications for the health sector reform in China.
Existing models of hospital behaviours or physicians’ behaviours under regulated prices
mainly focus on the pricing structure. Eggleston and Yip (2004) have developed a model of
public-private hospital competition under regulated prices. They note that prices of basic
services are regulated at a low level to assure access for basic healthcare in China while
prices for other services are set high to allow hospitals to recover revenue. Their results
show that the distorted price structure leads to over/under use of services by profitability,
which in turn fuels cost escalation and reduces access for those who cannot afford to self-
pay for care. Chen, Liu and Wang (2008) have developed a vocational choice model of
doctors under regulated price. People’s willingness to enter the healthcare market and hence
the supply of healthcare are closely associated with the regulated prices for healthcare. When
prices could not reflect physicians’ ability, people with high ability choose not to enter the
2
market. The supply of high quality level of healthcare services could then not meet people’s
demand and hence access to high quality healthcare services is limited. Physicians who are
already in the healthcare market would induce patients to use more pharmaceuticals to
compensate their income which in turn leads to increasing expenditure on healthcare. They
conclude that regulated price is the root cause of problems confronting the health sector in
China and recommend softening price regulation to solve these problems.
The existing literature does not capture the characteristics of hospital classification and
demand-supply situation of different grade hospitals in China. In this thesis, we develop an
asymmetric duopoly model to capture competition between different grade hospitals. In our
model, we assume hospitals choose quality levels of healthcare services to maximize their
profits under regulated prices. Patients decide which hospital to choose by comparing
qualities and prices of healthcare services provided by different hospitals.
We find that a hospital has higher incentive to improve healthcare quality after increasing its
price. Then competition between hospitals urges other hospitals to improve quality also. But
the equilibrium demand for a hospital’s health service increases depends on not only its
quality but also its price. The effect of expanding price difference on demand for healthcare
services depends on the price elasticity of demand for healthcare services, hospitals’ cost
functions and the relative price change of different hospitals. Hence policymakers need to
pay careful attention to various aspects of the health sector when applying this strategy.
The rest of the thesis is organized as follows. The next chapter provides a historical review
of the health sector reform in China and summarizes implications of the reform. The
historical review introduces the evolution of the health sector in China after economic
reform in 1978. I describe the main challenging implications of the reform process and
proceed to discuss the last one in detail. The third chapter develops the quality competitive
model of hospitals and displays the analytic results. The last chapter contains the
conclusions of results and policy recommendations.
3
2 Literature review
2.1 Historical review of the health sector in China
China had an almost thirty-year period of planned economy after its foundation in 1949 and
started its economic reform from a planned economy to a market economy in 1978
(commonly called as “reform and opening-up” in China). Along with the development of
economic reform in various areas, the health sector was inevitably affected. Old systems
were collapsed or outdated under the new socioeconomic environment. Following this, a
series of reforms toward marketization and modernization in the health sector have been
piloted and carried out. The question whether the health sector should be market-led or
government-led has sparked heated debates and never ceased since the early 1990s. Wang
(2008) made a review on reforms in the health sector, and divided the process after 1978 into
five periods. In this section, I will follow Wang’s division and introduce a review on
evolution and reform in China’s health sector.
2.1.1 Period I (1978-1985)
This was a transitional period of reconstruction and reform in the health sector. Before 1980,
the aim of the health sector administration was restoration and reconstruction of the
healthcare system which was heavily destroyed during the Cultural Revolution (1966-1976).
After 1980, emphasis of healthcare was gradually transferred to reform in the health sector
(Wang, 2008).
Policy: In 1979, the former Minister of Health Qian Xinzhong, proposed to “use economic
means to administer the health sector” in an interview. And at the national conference of
health bureau directors, it was claimed that “the (current) emphasis of the health sector
administration should be the modernisation of the health sector”. That same year, the
Ministry of Health applied “fixed subsidies, economic measurement as well as punishment
and reward according to results”.

4
In August 1980, the State Council approved and transmitted the “consulting report on
allowing private healthcare practice” submitted by the Ministry of Health, which marked the
start to break the situation of all public-owned hospitals.1
Evolution: In rural areas, over 90% of the population was covered by the Cooperative
Medical Scheme (CMS) before 1978. In urban areas, “the Government Insurance Scheme
and Labour Insurance Scheme provided almost free healthcare to the employees of the
government agencies and public institutions”. However, the CMS gradually collapsed
following the collapse of collective production. After that for a long time, most of the rural
population had no health insurance coverage but paid for services out-of-pocket (Tang et al.,
2008).
2.1.2 Period II (1985-1992)
1985 was the first year that the healthcare reform was officially launched in China. The core
ideas of the reform at that time were decentralization of power, allowing hospitals to retain
larger share of profits, and expansion of hospital autonomy.
Policy: In April 1985, the State Council approved and transmitted a document submitted by
the Ministry of Health.2 The document proposed to “reform, relax policies, streamline
administration and decentralize, and raise funds from multi-channels”, which unveiled a
prelude to the transformation of healthcare institutions.
In 1989 the State Council approved and transmitted the document “suggestions on expansion
of medical and healthcare services”.3 The document proposed five measures: (1) actively
promote various forms of contract and responsibility system; 4 (2) encourage health
1 Ministry of Health, (1980): Guanyu Yunxu Geti Yisheng Kaiye Xingyi Wenti de Qingshi Baogao (consulting report on allowing private healthcare practice), policy document.
2 Ministry of Health, (1985): Guanyu Weisheng Gongzuo Gaige Ruogan Zhengce Wenti de Baogao (Report on Several Policies concerning Healthcare Reform), (Guo Fa [1985] No. 62), policy document.
3 Ministry of Health, Ministry of Finance, Ministry of Personnel, the State Price Bureau and the State Administration of Taxation(1989): “suggestions on expansion of medical and healthcare services”, (Guo Fa [1989] No. 10), policy document.
4 The contract and responsibility system “was a practice in China starting from 1981. The major change from the past egalitarian distribution method was that individual companies and managers were now responsible for their own losses and
5
institutions to provide paid supplementary service; (3) further adjust fees for healthcare
services;(4) health preventive and protective institutions would provide paid services;(5)
suggest public hospitals “yi fu bu zhu, yi gong zhu yi” (a policy requiring public healthcare
institutions to carry out profitable production of side-products to recover revenue).5 Health
institutions were exempted from tax for three years to carry out other businesses.
In November 1989, the Ministry of Health enacted the rule “Regulations for Hospital
Classification”. 6 Hospitals became classified into three grades according to hospital
functions, hospital resources, medical facilities as well as physician expertise. The first grade
hospitals are basic hospitals and community hospitals directly providing preventive
medicine, diagnosis services, treatment services and convalesce services to its community.
The second grade hospitals are district hospitals providing comprehensive healthcare
services to more than one community and conducting certain level of teaching and
researching tasks. The third grade hospitals are hospitals providing high-level and
specialized healthcare services to more than one district and conducting higher education
and researching tasks. Every three years, there is a hospital evaluation by the government.
Hospitals participating in the evaluation get a score according to their comprehensive
performance during the past three years. Within each grade, hospitals are further divided into
three levels according to their evaluation score. For example, a third grade hospital is labeled
as level A when it receives a score no less than 900 which represents outstanding
performance in hospital management, technology, service quality and other aspects. A third
grade level B hospital has a score between 750 and 899. When its evaluation score is lower
than 750, a third grade hospital is labeled as level C and required to take concrete measures
to improve its performance.
The reform during this period focused on management and operation mechanism. The
government did not provide funding when implementing these healthcare reforms. Direct
gains by contract with the government. it was first adopted in agriculture and later extended to other sectors of the economy ”(Juan Du, 2009).
5 For example, hospitals can set up pharmaceutical retaining stores and other related production to seek profit. In August 1988 Jintan Chinese Medicine Hospital set up a medical plastic material plant to implement the policy spirit.
6 See Appendix C for description in detail.

6
investment by the government in the health sector gradually reduced and hospitals were
encouraged to embrace market mechanism for development.
2.1.3 Period III (1992-2000)
Policy: In September 1992, the State Council issued the document “Opinions on deepening
healthcare reform”.7 By implementing the document spirit the Ministry of Health required
hospitals to make new achievements on “yi fu bu zhu, yi gong zhu yi”. The government gave
fixed subsidies to hospitals. Hospitals were required to increase revenue by economic
means.This health policy stimulated hospitals’ profit-driven behaviours, and also affected
hospitals’ role as public welfare institutions, which became the root cause of problems in the
health sector - decreasing access to and increasing expenditure on healthcare service (“kan
bing nan, kan bing gui”).
Evolution: “Although the majority of Chinese health facilities are publicly owned, they rely
heavily on revenue-generating activities for financial survival. Consequently, while most
health facilities are “public” in terms of ownership, they are really “private, for-profit” in
terms of behavior. As of the early 1990s, government subsidies for public health facilities
have represented a mere 10% of the facilities’ total revenues. To keep healthcare affordable,
the government sets prices for basic healthcare below cost. At the same time, the
government wants facilities to survive financially, so it sets prices for new and high-tech
diagnostic services above cost and allow a 15% profit margin on drugs” (Yip & Hsiao,
2009).
In May 1993, regarding hospitals’ profit-driven tendency, a series of debates was launched
in the Ministry of Health. At the national working conference on the health sector issues, the
deputy Minister of Health Yin Dakui openly opposed to marketization in the health sector
and called for public-welfare property of healthcare services and basic social healthcare
equality. Since then, debates on whether healthcare should be government-led or market-led
have never ceased.
7 The State Council (1992): Guanyu Shenhua Weisheng Yiliao Tizhi Gaige de Jidian Yijian (Opinions on deepening healthcare reform), policy document.
7
2.1.4 Period IV (2000-2005)
During this period, different reform directions took place. Market-orientation has played a
significant role but has also gradually exposed its drawbacks, especially after the outbreak of
SARS. Market-led or government-led debates deepened and laid a foundation for next
period’s reform.
Policy: In February 2000, the State Council issued a policy document “Guidance Proposals
on Institutional Reform in Urban Medicine and Pharmaceuticals System”.8 Since then,
hospitals are classified as for-profit and not-for-profit and administered accordingly. Not-
for-profit public hospitals receive subsidies from the local government. For example, the
municipal governments provide subsidies to municipal hospitals. County level hospitals
were subsidized by their county government. For-profit hospitals have no subsidies from the
government. Prices for health services of not-for-profit are set according to cost which
deduced fiscal subsidies and spread income from pharmaceuticals. For-profit hospitals
should implement the guidance price set by the government.
In January 2003, the State Council approved and transmitted “Proposals on Establishment of
New Cooperative Medical Scheme”.9 It proposes to launch a pilot project of the New
Cooperative Medical Scheme (NCME) in small areas first and then gradually roll out
nationwide. The aim of NCMS is to achieve universal coverage of basic social medical
insurance for rural residents by 2010.
Evolution: In 2000, the first public hospital was privatized by auction in Suqian, Jiangsu
Province. Suqian was the poorest city of Jiangsu province and the municipal government
faced a debt burden at that time. Hospitals there had insufficient funding and sometimes the
wages of workers in health institutions could not be paid on time. The then mayor intended
to attract non-government capital by privatization of healthcare (Chow, 2006).
8 The Institutional Reform Office of the State Council, et al (2000): Guanyu Chengzhen Yiyao Weisheng Tizhi Gaige de Zhidao Yijian (Guidance Proposals on Institutional Reform in Urban Medicine and Pharmaceuticals System), (Guo Fa [2000] No.16), policy document.
9 The Ministry of Health, the Ministry of Finance and the Ministry of Agriculture (2003): Guanyu Jianli Xinxing Nongcun Hezuo Yiliao Zhidu de Yijian (Proposals on Establishment of New Cooperative Medical Scheme), (Guo Fa [2003], No.3), policy document.

8
The financial burden of healthcare on rural and urban households increased. According to
statistical data, aggregate healthcare expenditures in China increased from 11.02 billion
RMB in 1978 to 50.25 billion RMB in 2001.10 Individual out-of-pocket payments as a share
of total health expenditure grew from 20% to 60% between 1978 and 2001.11 People paid a
significant fraction of their income on health expenditure. Yip and Hsiao (2009) state that
“between 1993 and 2003, health expenditure as a share of household income increased, on
average, from 8.2% to 10.7% in rural areas and from 6.0% to 7.2% in urban areas.”
2.1.5 Period V (after 2005)
On July 28 2005, “China Youth Daily” published a report made by the Development and
Research Center of the State Council. By providing a review and reflection on healthcare
reform over the years, the report concluded that China's health system reform was basically
unsuccessful. This conclusion was mainly built on a market-led and government-led debate.
Because of this report, 2005 became the starting point of a new round of healthcare reform.
Policy: At the beginning of 2006, the State Council issued the “Guidance on Development of
Urban Community Healthcare Service” which announced to maintain the public-welfare
nature of the healthcare service, emphasis on equity, efficiency and access of healthcare,
keep government-led and encourage social involvement.12 After that, extensive debates and
conferences were launched regarding the direction of reform in the health sector.
In October 2006, the Sixth Plenary Session of the 16th Central Committee of the Chinese
Communist Party adopted the “resolutions of the CPC Central Committee on major issues
regarding the building of a harmonious socialist society.” It specifically identified healthcare
reform as a national priority and the government has committed to strengthen government
responsibility.
10 China Healthcare Statistical Yearbook 2009
11 See Appendix B for data in detail.
12 The State Council (2006): Guanyu Fazhan Chengshi Shequ Weisheng Fuwu de Zhidao Yijian(Guidance on Development of Urban Community Healthcare Service), (Guo Fa [2006] No.10), policy document.
9
In April 2009, China finally launched a new healthcare reform plan in which the Chinese
government pledged a stronger role for government in ensuring equity in healthcare services.
“The government announced that it will spend an additional 850 billion yuan over the next
three years to invest in five specific areas: (1)expand insurance coverage with a target of
achieving universal coverage by 2011, with significant demand subsidies for the rural
population to enroll in the New Cooperative Medical Scheme (NCMS) and for the urban
uninsured to enroll in the Urban Resident Basic Medical Insurance Scheme (URBMI); (2)
increase government spending on public health services especially in lower- income regions
with the goal of equalizing public health spending across regions; (3) establish primary-care
facilities – community health centers in urban areas an township health centers in rural areas
– which will serve as gate-keepers in the long run; (4) reform the pharmaceutical market;
and (5) pilot test public hospital reforms” (Yip & Hsiao, 2009).
2.2 Implications of reform in the health sector
2.2.1 Increase insurance coverage
The establishment of the New Cooperative Medical Scheme (NCMS) for rural residents and
Basic Medical Insurance for Urban Residents (BMISUR) were responses to accumulating
evidence that limited health insurance has been one of the fundamental causes of
unaffordable healthcare, and increasing public criticism on the government's negligence over
the people's health insurance (Wagstaff et al., 2009). A significant proportion of the
population had no health insurance of any form until the early 2000s.
The financial burden of healthcare on rural and urban households has increased significantly
since 1978. Individual’s out-of-pocket payments as a share of total health expenditure grew
from 20% to 60% between 1978 and 2001.13 Increasing expenditure causes additional
financial burden to poor households. “According to National Health Surveys, between 1998
and 2003, the proportion of people ill in the last two weeks who did not see care for financial
reasons increased in both urban and rural areas” (Ministry of Health, 2004; Eggleston et al.,
2008).
10
In 2003, China launched the NCMS program for rural residents. The objective is to establish
universal coverage of basic health insurance for rural residents. The NCMS is financed by
contributions from the central government, local governments, and individuals. When the
program started in 2003, both the central and the local government subsidized 10 Yuan per
capita each year in the poorer central and western regions, with individuals paying an
additional 10 Yuan in annual premiums to enroll in the NCMS.14 In 2006, the minimum
requirement for central and local government subsidy both increased to 20 Yuan per
capita.15 In 2008, the central and local government further increased subsidy to 40 Yuan per
capita, and individuals were required to pay 20 Yuan.16 Since 2010, the annual subsidies
both from central government and local government have increased to 60 Yuan per capita
with individual contribution increased to 30 Yuan.17
The Basic Medical Insurance Scheme for Urban Residents (BMISUR), covering children,
the elderly, the disabled, and other non-working urban residents, started from 2007. The
objective is to provide basic health insurance to the urban uninsured population. People
covered by the BMISUR receive subsidies provided by governments ranging from 40 Yuan
to 80 Yuan per capita, depending on the region's economic status and the social vulnerability
of population groups.18 The BMISUR is a complementary scheme to the Basic Medical
Insurance Scheme for Urban Employees (BMISUE). The BMISUE provides health
insurance to urban employees. It evolves from the Government Insurance Scheme (GIS) and
Labor Insurance Scheme (LIS), which dated back to the planned economy era and provided
13 See Appendix B for data in detail.
14 The Ministry of Health, the Ministry of Finance and the Ministry of Agriculture (2003): Guanyu Jianli Xinxing Nongcun Hezuo Yiliao Zhidu de Yijian (Proposals on Establishment of New Cooperative Medical Scheme), (Guo Fa [2003] No.3), Beijing, policy document.
15 The Ministry of Health et al. (2006): Guanyu Jiakuai Tuijin Xinxing Nongcun Hezuo Yiliao Shidian Gongzuo de Tongzhi (Notification of accelerating the pilot progress of New Cooperative Medical Scheme), Beijing, policy document. http://www.moh.gov.cn/publicfiles/business/htmlfiles/mohncwsgls/s3581/200804/31106.htm
16 The Ministry of Health and the Ministry of Finance (2008): Guanyu Zuohao 2008 nian Xinxing Nongcun Hezuo Yiliao Gongzuo de Tongzhi (Notification of the construction of rural New Cooperative Medical Scheme in 2008), Beijing, policy document. http://www.moh.gov.cn/publicfiles/business/htmlfiles/mohncwsgls/s3581/200804/31097.htm
17 The State Council (2009): Guanyu Shenhua Yiyao Weisheng Tizhi Gaige de Yijian (Guidance on Deepening Health and Medical Institutional Reform), Beijing, policy document. http://www.moh.gov.cn/publicfiles/business/htmlfiles/mohzcfgs/s7846/200904/39847.htm
18 The State Council (2007): Guanyu Kaizhan Chengzhen Jumin Jiben Yiliao Baoxian Shidian de Zhidao Yijian (Guidance on Pilot Experienment of Basic Meical Insurance for Urban Residents), (Guo Fa [2007] No.20), Beijing, policy document.
11
healthcare to the employees of the government agencies and public institutions. The
BMISUE is financed with a payroll tax, nominally divided between employer and employee
(Eggleston & Yip, 2004; Tang et al., 2008; Dong, 2009).
2.2.2 Strengthen government role in healthcare supply
The Chinese government took full responsibility in healthcare supply before economic
reform in 1978. All hospitals were state-owned and all health workers were paid by the
government. Following the economic reform, the government has tried to retreat from
supplying healthcare and has introduced market mechanisms in the health sector. From the
early 2000s, however, the government committed to increase spending and strengthen its
role in healthcare supply. This implicates a returning back to a government-led health sector.
Statistically, aggregate healthcare expenditures in China increased from 11.02 billion Yuan
in 1978 to 112.89 billion Yuan in 2007.19 Supply in healthcare didn’t increase accordingly
with the rapid increase in demand. From 1978 to 2007, the number of health workers, the
number of hospital beds and the number of health institution only increased from 3.11
billion to 5.91 billion, from 2.04 billion to 3.70 billion, and from 169.73 thousand to 298.41
thousand respectively.20
Since the first reform in 1985, the government has reduced spending in healthcare and
requires hospitals to sustain financially themselves. Government spending as a share of total
health expenditure decreased from 32.2% to 15.7% between 1978 and 2002.21 Without
universal health insurance coverage, prices for basic healthcare were set below cost by the
government to assure access to healthcare. To allow hospitals to recover revenue, the
government sets prices for new and high-tech diagnostic services above cost and allows a
15% profit margin on drugs (Yip & Hsiao, 2009). Eggleston and Yip (2004) noted that the
average percentage of Chinese public hospital income from governments shrank from 17%
in 1985 to 7% in 1999. Over the same period an increasing percentage of public hospital
income came from user fees (26 to 37%) and drug sales (39% to 50%). The decrease in
19 See “China Healthcare Statistical Yearbook 2009” 20 See Appendix A for data in detail. 21 See Appendix B for data in detail.
12
government subsidies has caused a significant reliance of public hospitals on non-state
revenues, primarily in the form of user fees and drug sales. And the pricing scheme for
healthcare and drugs has caused distorted incentives for hospitals which over-prescribe
drugs and high-tech procedures. This is a root cause of reduced access to and rapidly
increasing expenditure on healthcare.
Actually the Chinese government has recognized the distorted incentive of the pricing
scheme and has intended to reduce the distortion since the early 2000s. In October 2001, the
Ministry of Finance, the Ministry of Health and other related bureaus issued “Guidance on
improving compensation institution and implement compensation policy of urban healthcare
facilities”. The document announced to gradually increase prices of professional services,
reduce prices of large-scale health equipment test, encourage local government to increase
investment into healthcare and implement financial subsidy policy to public non-profit
hospitals.
In 2007, the minister of Health Chen Zhu said in an interview that the core idea of public
hospital reform was to reform the compensation institution. Currently, there are three
compensation streams for public hospitals - government subsidies, user charges and revenue
from drug sales. Since government spending in healthcare has been in serious shortage for a
long time and government subsidies as a share in health expenditure is only 17%, health
institutions primarily rely on user charges and drug sales to sustain financially. The reform
intends to gradually reduce hospitals’ profit-seeking behavior from drug sales. And to
maintain public hospital operation, either government subsidies or user charges should be
increased to replace hospital revenue from selling drugs.
In April 2009, a new healthcare reform plan was launched in China. In the plan, the
government announced that it will spend an additional 850 billion Yuan over the next three
years in healthcare. Two of the five specific areas that the plan intends to invest are
increasing government spending on public health services and reforming the pharmaceutical
market.

13
2.2.3 Improve efficiency in healthcare utilization
Another implication of reforms in the health sector is the inefficiency in healthcare
utilization. Some studies have documented inefficiencies in healthcare utilization in China.
The high grade hospitals in urban areas are often overcrowded with patients. Long queues
wait in doctors’ waiting rooms and rampant scalpers resell medical appointments at
extortionately high prices; patients pay under-the-table payment to doctors with the intention
to receive privileged treatment (Eggleston, et al., 2008; Kou & Shi, 2009). At the same time,
the low grade hospitals and clinics are underutilized and patronized by few patients. This
leads to an imbalance between demand for and supply of healthcare resources.
Zhou (2008) asserts that the price regulation in the health sector is one plausible reason.
Wherever there is a need to queue up, the price is undervalued. The existence of scalpers
reselling appointment numbers in leading hospitals indicates severe under-pricing. Zhou
regards under-the-table payment is a natural reflection of the distorted price in the health
sector. People are willing to pay more for health service but the price is regulated. Some
other scholars assert there is distrust in lower grade hospitals. People are worried that they
could not get good treatment in community hospitals which are among low-grade hospitals.
Even if it takes long time to get treated in higher grade hospitals, they still choose leading
hospitals. Scholars therefore suggest that more subsidies should provide to improve health
services in community hospitals (Yang & Liu, 2008).
Pilot projects have been implemented at a sub national level to disperse patients from high
grade hospitals to low grade hospitals. For example, in Shanghai, the Basic Medical
Insurance Scheme reimburses a higher share of health expenditure for people visiting
community hospitals compared to higher grade hospitals for certain diseases. In Beijing,
People’s Hospital of Beijing University – a third grade hospital – established a “healthcare
community” with two community healthcare centers and 16 community healthcare clinics in
September 2007. Within the community, healthcare institutions share information and
resources and implement mutual transferals. The community aims at guiding people to
“community hospitals with simple ailments and large hospitals with serious diseases”

14
(commonly phased “xiaobing zai shequ, dabing jin yiyuan” in Chinese) (Bai, 2001; Bai,
2008).
However, there is no nationwide program targeting the problem yet. As Yip & Hsiao (2009)
stated, the new reform announcement in April 2009 “is less specific on how to improve
efficiency and quality within the health system. The announcement's call for a “pilot” of
public hospital reform is akin to an admission that more research must be done before more
specific policy guidelines can be drawn up in this area.”

3 An Analytical Study
In this chapter, I develop a quality competition model of hospitals under regulated prices.
The purpose of this model is to show the effect of different price regulation on hospitals’
behaviors and demand for healthcare services. I use different cost coefficients to capture the
difference between high-grade hospitals and low-grade hospitals. When price difference is
very small, expanding it appropriately could give high-grade hospitals more incentive to
improve quality of healthcare services and competition could urge low-grade hospitals to
keep certain level of healthcare quality. Since people attach great value to health and pay
great attention to qualities of healthcare services, high quality would lead to high demand for
healthcare services and also high utility level of patients. Expanding the price difference
between hospitals appropriately when existing price difference is small could bring about
positive effects from the aspects of healthcare quality and patients’ utilities.
3.1 The basic model
3.1.1 Framwork
We consider a price-regulated healthcare market with two hospitals, labeled as H and L. H
denotes high-grade and L low-grade. Their prices are exogenously fixed at . p
15
q p u u
Patients’ healthcare demand to hospital not only depends on the quality of service
provided by hospital but also the quality of service provided by its competitor. Since
people have to pay healthcare service out-of-pocket or at least pay part of the total
expenditure, demand for healthcare also depends on price. Let and be the number
of patients wanting treatment at hospital H and L respectively. Let and be the
quality of services provided by hospital H and L respectively. A demand function for H and
L is assumed to be
i
i
hq lq
hu lu
h h lα β γ= − + − l hu u and q p l=α β γ− + − respectively, where
α is a constant term, β is a very small positive number and (0,1)γ ∈ . I will discuss these
coefficients in more detail below.
16
h
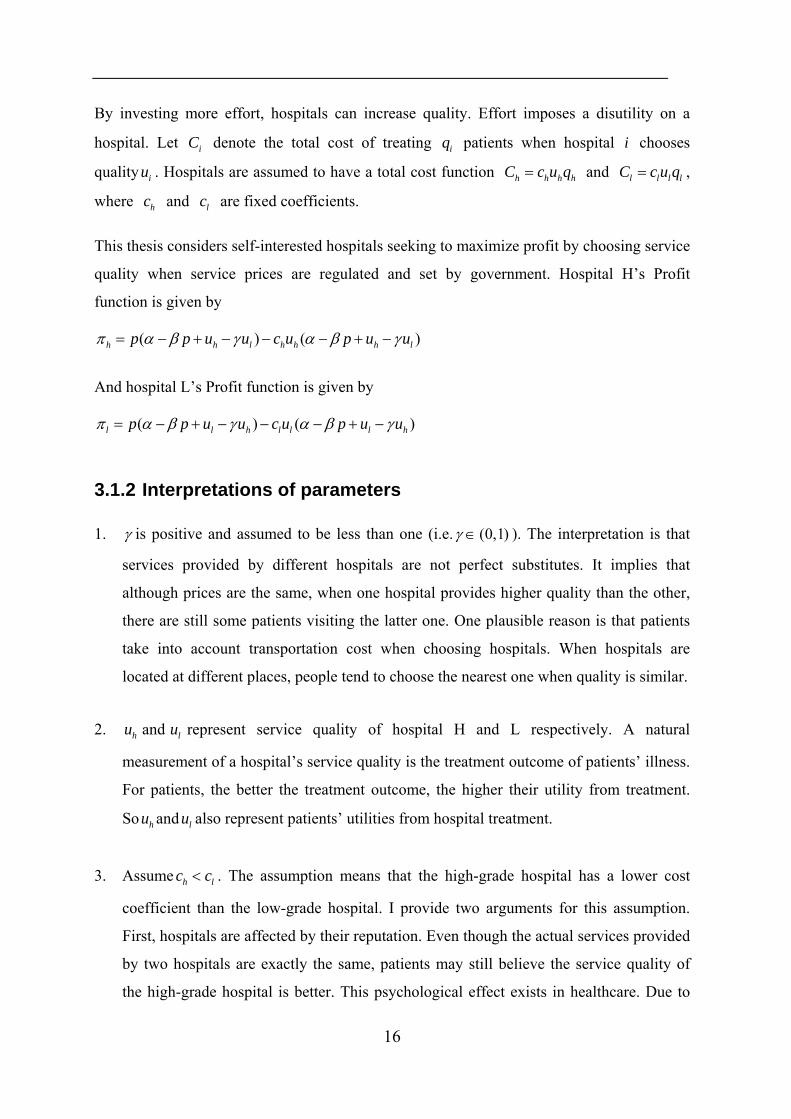
By investing more effort, hospitals can increase quality. Effort imposes a disutility on a
hospital. Let denote the total cost of treating patients when hospital i chooses
quality . Hospitals are assumed to have a total cost function iC iq
iu h h hC c u q= and ,
where and are fixed coefficients. l l lC c u q= l
h l
hc lc
This thesis considers self-interested hospitals seeking to maximize profit by choosing service
quality when service prices are regulated and set by government. Hospital H’s Profit
function is given by
( ) ( )h h l h hp p u u c u p u uπ α β γ α β γ= − + − − − + −
And hospital L’s Profit function is given by
( ) ( )l l h l l l hp p u u c u p u uπ α β γ α β γ= − + − − − + −
3.1.2 Interpretations of parameters
1. γ is positive and assumed to be less than one (i.e. (0,1)γ ∈ ). The interpretation is that
services provided by different hospitals are not perfect substitutes. It implies that
although prices are the same, when one hospital provides higher quality than the other,
there are still some patients visiting the latter one. One plausible reason is that patients
take into account transportation cost when choosing hospitals. When hospitals are
located at different places, people tend to choose the nearest one when quality is similar.
2. and represent service quality of hospital H and L respectively. A natural
measurement of a hospital’s service quality is the treatment outcome of patients’ illness.
For patients, the better the treatment outcome, the higher their utility from treatment.
So and also represent patients’ utilities from hospital treatment.
hu lu
hu lu
3. Assume . The assumption means that the high-grade hospital has a lower cost
coefficient than the low-grade hospital. I provide two arguments for this assumption.
First, hospitals are affected by their reputation. Even though the actual services provided
by two hospitals are exactly the same, patients may still believe the service quality of
the high-grade hospital is better. This psychological effect exists in healthcare. Due to
hc c< l
this effect, high-grade hospitals need less effort to produce the same level of utility for
patients. Another argument is that a high-grade hospital has more health resources and
provides a large scope for healthcare services, which generates economics of scale and
economics of scope. Hence it is reasonable to assume h lc c< .
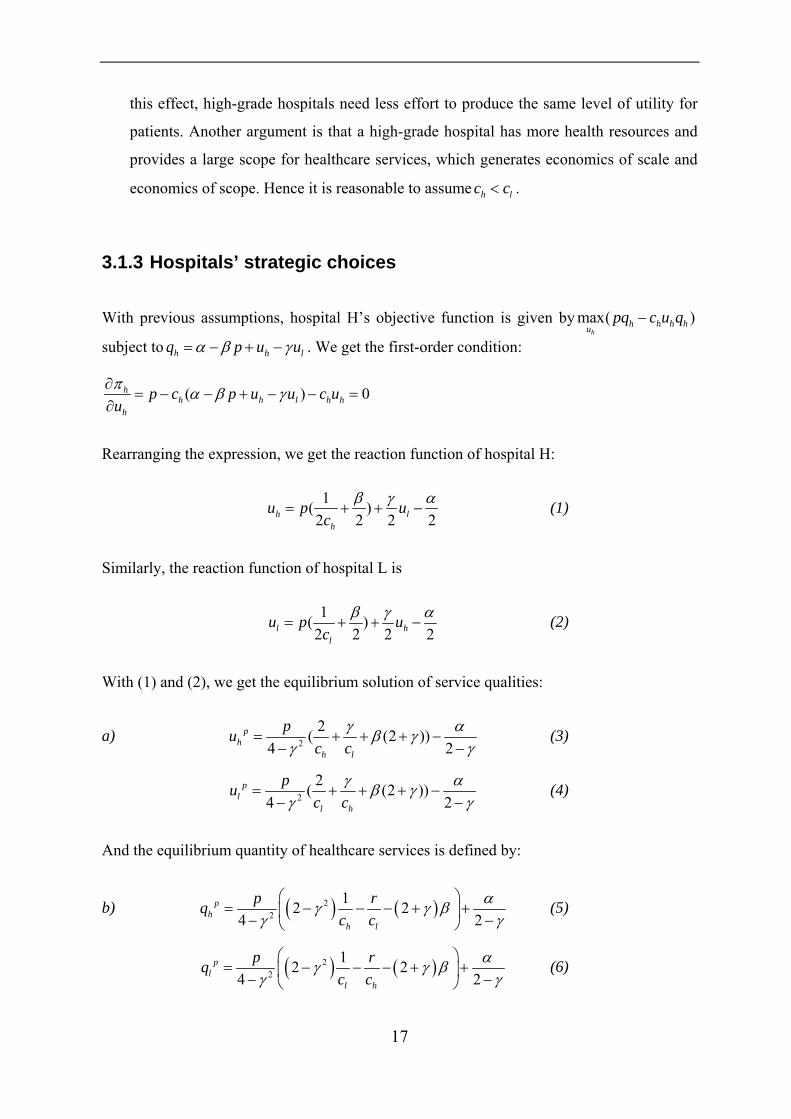
3.1.3 Hospitals’ strategic choices
With previous assumptions, hospital H’s objective function is given by max( )h
h h h hupq c u q−
subject to h hq p u luα β= − + −γ . We get the first-order condition:
( )hh h l h
h
p c p u u c uu
0hπ α β γ∂
= − − + − − =∂
Rearranging the expression, we get the reaction function of hospital H:
1( )2 2 2h
h
u p uc 2l
β γ= + + −
α (1)
Similarly, the reaction function of hospital L is
1( )2 2 2l h
l
u p uc 2
β γ α= + + − (2)
With (1) and (2), we get the equilibrium solution of service qualities:
a) 2
2( (2 ))4 2
ph
h l
puc c
γ αβ γγ γ
= + + + −− −
(3)
2
2( (2 ))4 2
pl
l h
puc c
γ αβ γγ γ
= + + + −− −
(4)
And the equilibrium quantity of healthcare services is defined by:
b) ( ) ( )22
12 24 2
ph
h l
p rqc c
αγ γ βγ γ
⎛ ⎞= − − − + +⎜ ⎟− −⎝ ⎠
(5)
( ) ( )22
12 24 2
pl
l h
p rqc c
αγ γ βγ γ
⎛ ⎞= − − − + +⎜ ⎟− −⎝ ⎠
(6)
17

We obtain the quality difference 02
p p p l hh l
h l
c cpu u uc cγ−
Δ = − = ⋅ >+
. Under the same regulated
price, the high-grade hospital provides a higher service quality.
3.2 The model under different regulated prices
Consider the case of different regulated prices for services of hospital H and L, denoted
hp and lp respectively. It is rational to assume h lp p> . In this case, hospital H’s profit
function becomes ( ) ( )h h h h l h h h h lp p u u c u p u uπ α β γ α β γ= − + − − − + − . And its objective
function becomes max( )h
h h h h hup q c u q− , subject to h h hq p u luα β γ= − + − .
The first order condition of hospital H is
( )hh h h h l h h
h
p c p u u c uu
0π α β γ∂= − − + − − =
∂
Again we obtain the reaction function of hospital H and hospital L:
1( )2 2 2h h l
h
u p uc 2
β γ= + + −
α (7)
1( )2 2 2l l h
l
u p uc 2
β γ α= + + − (8)
The solution of hospitals’ problem is given by:
c) *2
1 1 1(2 ( ) ( ))4 2h h l
h l
u p pc c
αβ γ βγ γ
= + + + −− −
(9)
*2
1 1 1(2 ( ) ( ))4 2l l h
l h
u p pc c
αβ γ βγ γ
= + + + −− −
(10)
d) ( )* 22 2
1 12 24 4
h lh
h l
p pqc c
γ2αγ β β
γ γ γ⎛ ⎞ ⎛ ⎞
= − − − + +⎜ ⎟ ⎜ ⎟− −⎝ ⎠ ⎝ ⎠ − (11)
( )* 22 2
1 12 24 4
l hl
l h
p pqc c
γ2αγ β β
γ γ γ⎛ ⎞ ⎛ ⎞
= − − − + +⎜ ⎟ ⎜ ⎟− −⎝ ⎠ ⎝ ⎠ − (12)
18

The quality difference is * * * 1 1 1[ ( ) ( )2h l h l
h l
u u u p pc c
]β βγ
Δ = − = + − ++
.
Since h lp p≥ and , we have which means high-grade would provide higher
level of service quality.
hc c< l* 0uΔ >
The derivatives of the equilibrium qualities with respect to prices are presented blow:
*
2
2 1( ) 0>
19
4h
h h
up c
βγ
∂= +
∂ −,
*
2
1( )4
l
h h
up c
γ βγ
∂ 0= + >∂ −
,* *2h l
h h
u u∂p pγ
∂= ;
∂ ∂
*
2
2 1( ) 0>4
l
l l
up c
βγ
∂= +
∂ −,
*
2
1( )4
h
l l
up c
γ βγ
∂ 0= + >∂ −
,* *2l h
l l
u u∂p pγ
∂= .
∂ ∂
i i
i
Proposition 1: The equilibrium quality of healthcare service provided by
hospital increases when hospital ’s regulated price increases; the equilibrium quality
of healthcare service provided by hospital increases when its competitor’s regulated
price increase. ( { },i H L∈ )
The economic interpretation of proposition 1 is that hospitals have high incentives to attract
demand under a high regulated price by improving quality level of healthcare services so as
to maximize profits. When a hospital has increased quality, the other hospital would increase
quality also to compete for patients. This is why a hospital’s equilibrium quality also
increases when its competitor’s regulated price increases.
Also, we can get the derivatives of the equilibrium demand with respect to prices:
( )*
22
1 12 24
h
h h
qp c
γ βγ
⎛ ⎞∂= − −⎜ ⎟∂ − ⎝ ⎠
, *
2
1 04
h
l l
qp c
γ βγ
⎛ ⎞∂= − +⎜ ⎟∂ − ⎝ ⎠
<
( )*
22
1 12 24
l
l l
qp c
γ βγ
⎛ ⎞∂= − −⎜ ⎟∂ − ⎝ ⎠
, *
2
1 04
l
h h
qp c
γ βγ
⎛ ⎞∂= − +⎜ ⎟∂ − ⎝ ⎠
<
Proposition 2: When its regulated price increases, change in demand for healthcare
services provided by hospital (i { },i H L∈ ) depends on the relative magnitude of the

cost coefficient andβ ; its equilibrium demand decreases when competitor’s regulated
price increases.
The economic interpretation of proposition 2 is that although a hospital improves its
healthcare quality when its competitor’s regulated price increases, it has a lower
improvement than its competitor and hence the demand for its healthcare services still
decreases. The uncertainty of effect on demand of own price change is because patients
consider both price and quality when choosing a hospital. When the improvement in quality
is not large enough to compensate the increase in price, people would turn to the other
hospital.
3.3 Effect of expanding price difference
In this section I analyze what would happen if increase hp to and decrease'hp lp to '
lp while
keeping constant. More specifically, we want to see the effect on healthcare quality,
demand for healthcare and patients’ total utility after expanding the price difference and
keeping constant.
*lu
*lu
Define and . Define' 0l <llp p pΔ = − ' 0h h hp p pΔ = − > *' *h h hu u uΔ = − and . We
rewrite the reaction function of hospital H and L after expanding price difference:
*' *l l lu u uΔ = −
*' ' '2
1 1 124 2h h l
h l
u p pc c
αβ γ βγ γ
⎛ ⎞⎛ ⎞ ⎛ ⎞= + + +⎜ ⎟⎜ ⎟ ⎜ ⎟⎜ ⎟− −⎝ ⎠ ⎝ ⎠⎝ ⎠
−
*' ' '2
1 1 124 2l l h
l h
u p pc c
αβ γ βγ γ
⎛ ⎞⎛ ⎞ ⎛ ⎞= + + +⎜ ⎟⎜ ⎟ ⎜ ⎟⎜ ⎟− −⎝ ⎠ ⎝ ⎠⎝ ⎠
− .
1) When keeping the service quality of hospital L constant (i.e. 0luΔ = ), we find that
220huΔ > (13)
22 See Appendix D for proof
20
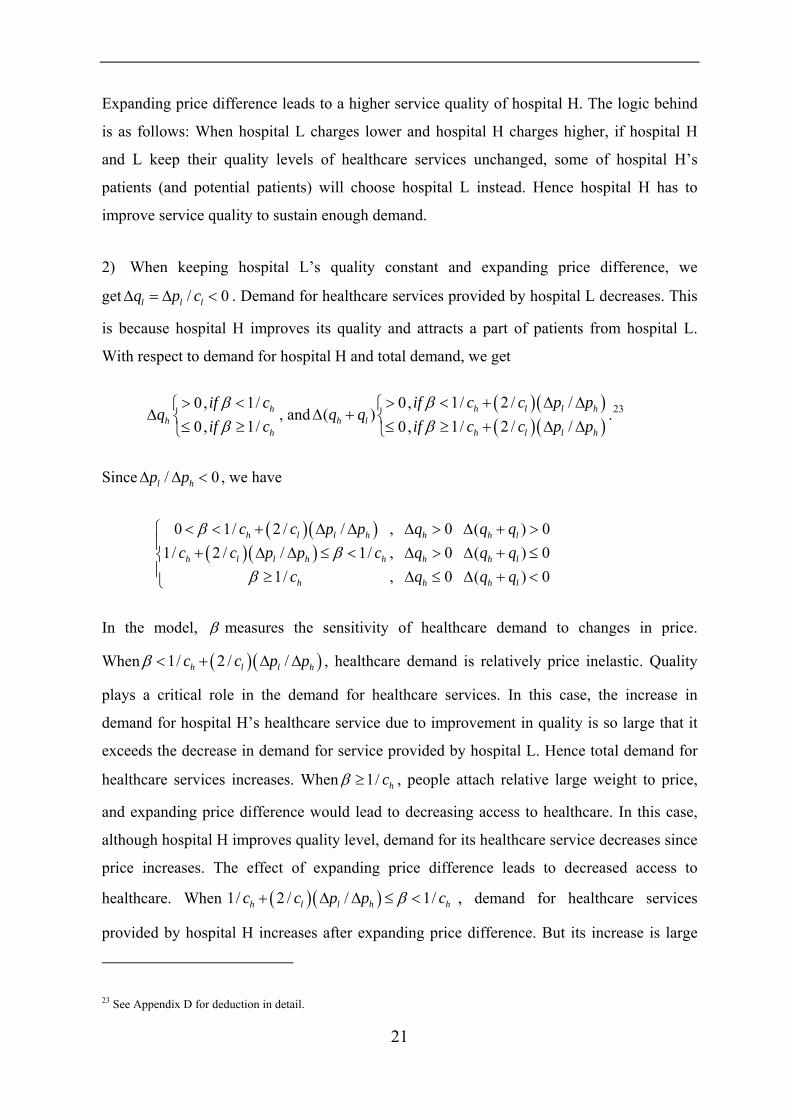
Expanding price difference leads to a higher service quality of hospital H. The logic behind
is as follows: When hospital L charges lower and hospital H charges higher, if hospital H
and L keep their quality levels of healthcare services unchanged, some of hospital H’s
patients (and potential patients) will choose hospital L instead. Hence hospital H has to
improve service quality to sustain enough demand.
2) When keeping hospital L’s quality constant and expanding price difference, we
get . Demand for healthcare services provided by hospital L decreases. This
is because hospital H improves its quality and attracts a part of patients from hospital L.
With respect to demand for hospital H and total demand, we get
/ 0l l lq p cΔ = Δ <
1/0,1/0,
hh
h
if cq
if cββ<>⎧
Δ ⎨ ≥≤⎩, and
( )( )( )(
1/ 2 / /0,( )
1/ 2 / /0,h l l
h lh l l
if c c p pq q
if c c p pββ< + Δ Δ>⎧
Δ + ⎨ ≥ + Δ Δ≤⎩ )h
h
0
lq≤
+ <
.23
Since , we have / 0l hp pΔ Δ <
( )( )
( )( )0 1/ 2 / / , 0 ( )
1/ 2 / / 1/ , 0 ( ) 01/ , 0 ( ) 0
h l l h h h l
h l l h h h h l
h h h
c c p p q q qc c p p c q q q
c q q
ββ
β
< < + Δ Δ Δ > Δ + >⎧⎪ + Δ Δ ≤ < Δ > Δ +⎨⎪ ≥ Δ ≤ Δ⎩
In the model, β measures the sensitivity of healthcare demand to changes in price.
When , healthcare demand is relatively price inelastic. Quality
plays a critical role in the demand for healthcare services. In this case, the increase in
demand for hospital H’s healthcare service due to improvement in quality is so large that it
exceeds the decrease in demand for service provided by hospital L. Hence total demand for
healthcare services increases. When
( )(1/ 2 / /h l lc c p pβ < + Δ Δ )h
1/ hcβ ≥ , people attach relative large weight to price,
and expanding price difference would lead to decreasing access to healthcare. In this case,
although hospital H improves quality level, demand for its healthcare service decreases since
price increases. The effect of expanding price difference leads to decreased access to
healthcare. When , demand for healthcare services
provided by hospital H increases after expanding price difference. But its increase is large
( )( )1/ 2 / / 1/h l l hc c p p β+ Δ Δ ≤ < hc
23 See Appendix D for deduction in detail.
21

enough to offset decrease in demand for healthcare services provided by hospital L. Hence
total demand for healthcare services decreases.
Discussions above imply that the effects of expanding price difference depend on the price
elasticity of demand for healthcare services. Ringel et al. (2002) make a literature review on
healthcare demand elasticity and find that price elasticity of demand for healthcare tends to
center on -0.17. This is plausible. When people get sick, they will not be very price sensitive.
Hence the case that ( )( )1/ 2 / /h l lc c p pβ < + Δ Δ h
0
stands a good chance. And it is worth while
to further discuss the change in patients’ utility in this case.
3) If , we find that( )h lq qΔ + > ( ) 0h h l lq u q uΔ + > .24 When ,
expanding price difference leads to increase in total demand for healthcare services. Hospital
H would improve its quality level and treat more patients. Hospital L keeps its quality level
constant. This implies that more patients are treated and more patients are serviced by better
healthcare services. The compounding effects of increase in quality and quantity of
healthcare services lead to a great improvement of patients’ utility. Hence when expanding
price difference leads to increasing demand for healthcare services, the total utility of
patients also increases.
( )(1/ 2 / /h l lc c p pβ < + Δ Δ )h
The discussions above are summarized in proposition 3.
Proposition 3: When increase hp and decrease lp simultaneously while
keeping constant, we get following results: *
0
lq≤
+ <
0
lu
i. ; 0huΔ >
ii. ; ( )( )
( )( )0 1/ 2 / / , 0 ( )
1/ 2 / / 1/ , 0 ( ) 01/ , 0 ( ) 0
h l l h h h l
h l l h h h h l
h h h
c c p p q q qc c p p c q q q
c q q
ββ
β
< < + Δ Δ Δ > Δ + >⎧⎪ + Δ Δ ≤ < Δ > Δ +⎨⎪ ≥ Δ ≤ Δ⎩
iii. if . ( ) 0h h l lq u q uΔ + > ( )h lq qΔ + >
24 See Appendix D for proof.
22

23
4 Conclusion
In this article, I present a quality competitive model of hospitals under regulated price and
analyze the effects of regulated prices on hospital behaviours and patients’ utilities. Prices
for healthcare services are regulated in China. Hospitals are classified into three grades. In
my model, I capture the difference between high-grade hospitals and low grade hospitals
with different cost coefficients. Expanding price difference among hospitals to coordinate
demand and supply of different grade hospitals has been used by provincial governments in
China. The purpose of this thesis is to provide a theoretical analysis of this policy.
The present analysis shows that expanding price difference has potential to promote high-
grade hospitals to improve healthcare quality. This is a positive effect. However, the total
utility of patients not only depends on healthcare quality but also accessibility to healthcare.
When people’s demand for healthcare is price inelastic or people attach a relatively small
weight to price compared with quality, total demand for healthcare services would increase
after expanding price difference and total utility level of patients would increase as well. But
when people attach great value on price compared with quality, then total demand for
healthcare services would decrease instead. The results of the model imply that the effect of
expanding price difference is closely associated with the price elasticity of demand for
healthcare.
The price elasticity of demand is affected by various factors, like income and health
insurance coverage. Covered by health insurance, patients would be less sensitive to price
and demand becomes less elastic. Arrow (1963) discussed the potential effect of health
insurance on demand for healthcare. People with high income could afford more on
healthcare and might be less price elastic. Hence the impact of expanding price difference
depends on other socioeconomic conditions. In wealthy provinces where most residents are
covered by various health insurance programs, expanding price difference is much likely to
produce social welfare. However, in poor provinces with few populations covered by health
insurance, the policy might not generate many positive effects and may even bring negative
effects. Therefore policymakers need to pay attention to the comprehensive condition of the
health sector when apply the strategy to hospitals.
24
Reference
Arrow, Kenneth J. (1963): “Uncertainty and the Welfare Economics of Medical Care”, The
American Economic Review, No.5, 941-973.
Bai, Jianfeng (2001): “What is the cause of “kan bing nan” (too difficult to see a doctor)” (in
Chinese), People Daily, March 27, 2001, No.10.
Bai, Jianfeng (2008): “Building new healthcare chain – pilot project of healthcare
community by People’s Hospital of Beijing University”, People Daily, October 19, 2008,
No.1.
Chen, Z., Liu, X., and H., Wang (2008): “Service price marketization: the unfinished road of
healthcare system reform in China” (in Chinese), Management World, No. 8, 52-58.
Chow, Gregory C. (2009): “An Economic Analysis of Healthcare in China,” in Gordon G.
Liu, Shufang Zhang and Zongyi Zhang, ed., Investing in Human Capital for Economic
Development in China. Singapore: World Scientific, 2009.
Development Research Center of State Council (2005): “An evaluation and
recommendations on the reforms of the health system in China”. China Development
Review (Supplement), Beijing.
Dong, Keyong (2009): “Medical insurance system evolution in China”, China Economic
Review, No. 20, 591-597.
Du, Juan (2009): “Economic reforms and health insurance in China”, Social Science &
Medicine, No. 69, 387-395.
Eggleston, K., Li, L., Meng, Q., Lindelow, M., and A., Wagstaff (2008): “Health Service
Delivery in China: A Literature Review”, Health Economics, No.17, 149-165.
Eggleston, K. and W., Yip (2004): “Hospital Competition under Regulated Prices:
Application to Urban Health Sector Reforms in China”, International Journal of Health Care
Finance and Economics, No.4, 343-368.

25
Hu, Shanlian (2006): Study on Causes and Solution of “kan bing nan, kan bing gui” Problem
in Shanghai, Health Economics Study, No.2, 21-23.
Kou, Z. and L., Shi (2009): “the Reason and Solution of “too expensive to see a doctor, too
difficult to see a doctor” problem”, working paper, Fudan University.
Ringel, Jeanne S., Hosek, Susan D., Vollaard, Ben A. and Sergej Mahnovski (2002): “The
Elasticity of Demand for Health Care: A Review of the Literature and Its Application to the
Military Health System” (Kindle Edition), RAND Corporation (February 25, 2002).
Tang, S., Meng, Q., Chen, L., Bekedam, H., Evans, T., and M., Whitehead (2008): “Tackling
the challenges to health equity in China”, Lancet, No.372, 1493−1501.
The Ministry of Health (1989): “Regulation for Hospital Classification” (in Chinese),
Ministry of Health, Beijing, China.
The Ministry of Health (1990): “General Hospital Classification Management Standard (trial
draft)” (in Chinese), Ministry of Health, Beijing, China.
The Ministry of Health (2004): “Study on National Health Services in 2003” (in Chinese),
Ministry of Health, Beijing, China.
Wagstaff, A., Lindelow, M., Gao, J., Xu, L., and J., Qian (2009): “Extending health
insurance to the rural population: An impact evaluation of China’s new cooperative medical
scheme”, Journal of Health Economics, No.28, 1-19.
Wang, Hufeng (2008): “30 years reform of China’s healthcare system” , in: Zhou Dongtao
eds., Development and Reform Blue Book – China’s 30 years reform and opening-up
(1978~2008) (Social Science Literature Press), Chapter 23.
Wang, Hufeng (2009): “A dilemma of Chinese healthcare reform: How to re-define
government roles?”, China Economic Review, No.20, 598-604.
Yang, G. and Y., Liu (2008): “Economic analysis of new healthcare institutional reform” (in
Chinese), Economic Theory and Management, No.3, 26-29.

26
Yin, Jia (2009): “Increase physicians’ compensation to improve investment efficiency –
recommendations for healthcare reform by a physician from Xiehe hospital”, Sohu Health
Web, http://health.sohu.com/20090206/n262092017.shtml
Yip, W. and W., Hsiao (2009): “China’s health care reform: A tentative assessment”, China
Economic Review, No.20, 613-619.
Zhou, Qiren (2008): “Essays of medical care reforms in China”, Beijing University Press.
2008.

27
Appendix
Appendix A: Resources and Total Expenditure in the Health Sector
Year Number of
Health Worker
Number of Hospital
Beds
Number of Health
InstitutionsYear
Number of Health Worker
Number of Hospital
Beds
Number of Health
Institutions
1978 3105572 204.17 169732 1994 5307009 313.40 191742
1980 3534707 218.44 180553 1995 5373378 314.06 190057 1981 3796121 223.38 190126 1996 5419002 309.96 322566
1982 3957804 228.03 193438 1997 5516176 313.45 315033
1983 4090030 234.16 196017 1998 5535682 314.30 314097 1984 4213646 241.24 198256 1999 5570048 315.90 300996
1985 4313011 248.71 200866 2000 5591026 317.70 324771
1986 4445919 256.25 203139 2001 5583932 320.12 330348 1987 4564122 268.50 204960 2002 5238079 313.61 306038
1988 4677512 279.49 205988 2003 5274786 316.40 291323 1989 4786959 286.70 206724 2004 5356589 326.84 297540
1990 4906201 292.54 208734 2005 5426851 336.75 298997
1991 5025134 299.19 209036 2006 5619515 351.18 308969 1992 5140246 304.94 204787 2007 5907052 370.11 298408
1993 5215416 309.90 193586 2008 6169050 403.87 278337
Source: China health Statistical Yearbook 2009, China Statistical Yearbook 2008, China Statistical
Yearbook 1999
From 1978 to 2007, the number of health workers, hospital beds and health institutions has
increased less than 1 time. But the total health expenditure has increased dramatically.
Appendix B: Total Health Expenditure Components
Total Health Expenditure (100 million) Total Health Expenditure Components (%)
Year
Total expenditure
Government Expenditure
Social Expenditure
Individual Expenditure
Government Share
Social Share
Individual Share
1978 110.21 35.44 52.25 22.52 32.2 47.4 20.4
1979 126.19 40.64 59.88 25.67 32.2 47.5 20.3 1980 143.23 51.91 60.97 30.35 36.2 42.6 21.2
1981 160.12 59.67 62.43 38.02 37.3 39.0 23.7
1982 177.53 68.99 70.11 38.43 38.9 39.5 21.6 1983 207.42 77.63 64.55 65.24 37.4 31.1 31.5
1984 242.07 89.46 73.61 79.00 37.0 30.4 32.6
28
1985 279.00 107.65 91.96 79.39 38.6 33.0 28.5
1986 315.90 122.23 110.35 83.32 38.7 34.9 26.4
1987 379.58 127.28 137.25 115.05 33.5 36.2 30.3
1988 488.04 145.39 189.99 152.66 29.8 38.9 31.3
1989 615.50 167.83 237.84 209.83 27.3 38.6 34.1 1990 747.39 187.28 293.10 267.01 25.1 39.2 35.7
1991 893.49 204.05 354.41 335.03 22.8 39.7 37.5
1992 1096.86 228.61 431.55 436.70 20.8 39.3 39.8
1993 1377.78 272.06 524.75 580.97 19.7 38.1 42.2
1994 1761.24 342.28 644.91 774.05 19.4 36.6 43.9
1995 2155.13 387.34 767.81 999.98 18.0 35.6 46.4 1996 2709.42 461.61 875.66 1372.15 17.0 32.3 50.6
1997 3196.71 523.56 984.06 1689.09 16.4 30.8 52.8
1998 3678.72 590.06 1071.03 2017.63 16.0 29.1 54.8
1999 4047.50 640.96 1145.99 2260.55 15.8 28.3 55.9
2000 4586.63 709.52 1171.94 2705.17 15.5 25.6 59.0
2001 5025.93 800.61 1211.43 3013.89 15.9 24.1 60.0 2002 5790.03 908.51 1539.38 3342.14 15.7 26.6 57.7
2003 6584.10 1116.94 1788.50 3678.66 17.0 27.2 55.9 2004 7590.29 1293.58 2225.35 4071.35 17.0 29.3 53.6
2005 8659.91 1552.53 2586.41 4520.98 17.9 29.9 52.2
2006 9843.34 1778.86 3210.92 4853.56 18.1 32.6 49.3 2007 11289.50 2297.10 3893.72 5098.66 20.4 34.5 45.2
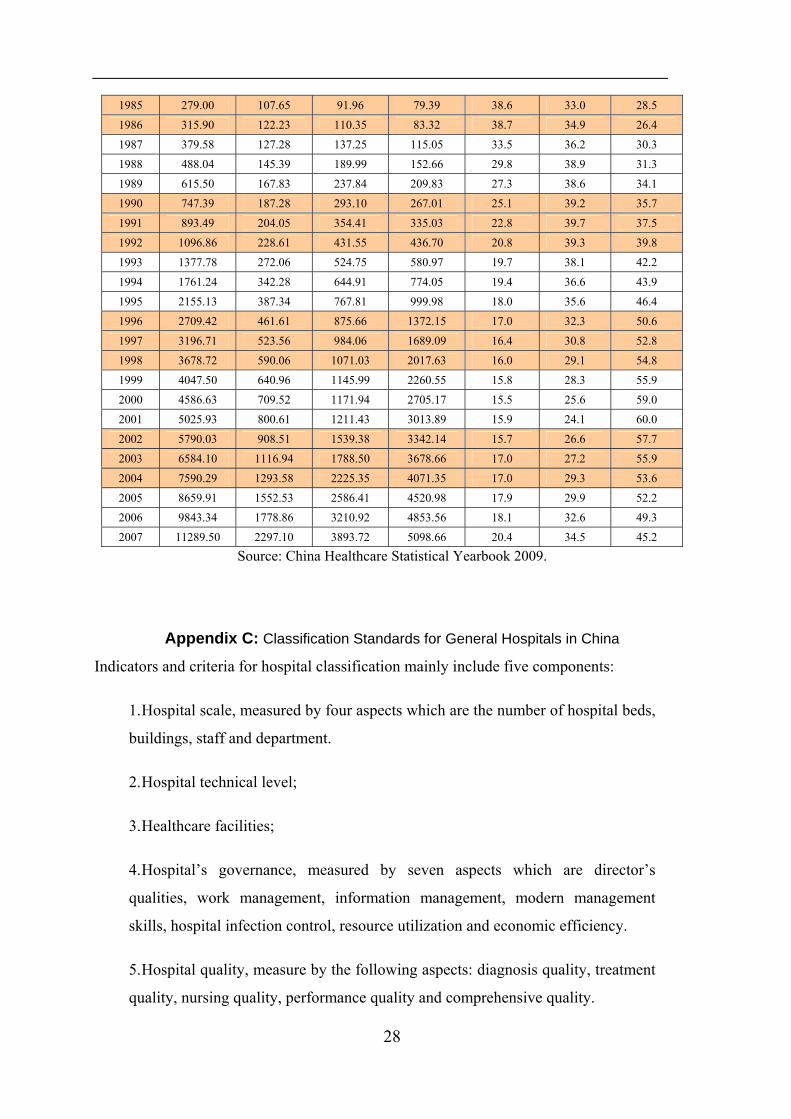
Source: China Healthcare Statistical Yearbook 2009.
Appendix C: Classification Standards for General Hospitals in China
Indicators and criteria for hospital classification mainly include five components:
1. Hospital scale, measured by four aspects which are the number of hospital beds,
buildings, staff and department.
2. Hospital technical level;
3. Healthcare facilities;
4. Hospital’s governance, measured by seven aspects which are director’s
qualities, work management, information management, modern management
skills, hospital infection control, resource utilization and economic efficiency.
5. Hospital quality, measure by the following aspects: diagnosis quality, treatment
quality, nursing quality, performance quality and comprehensive quality.
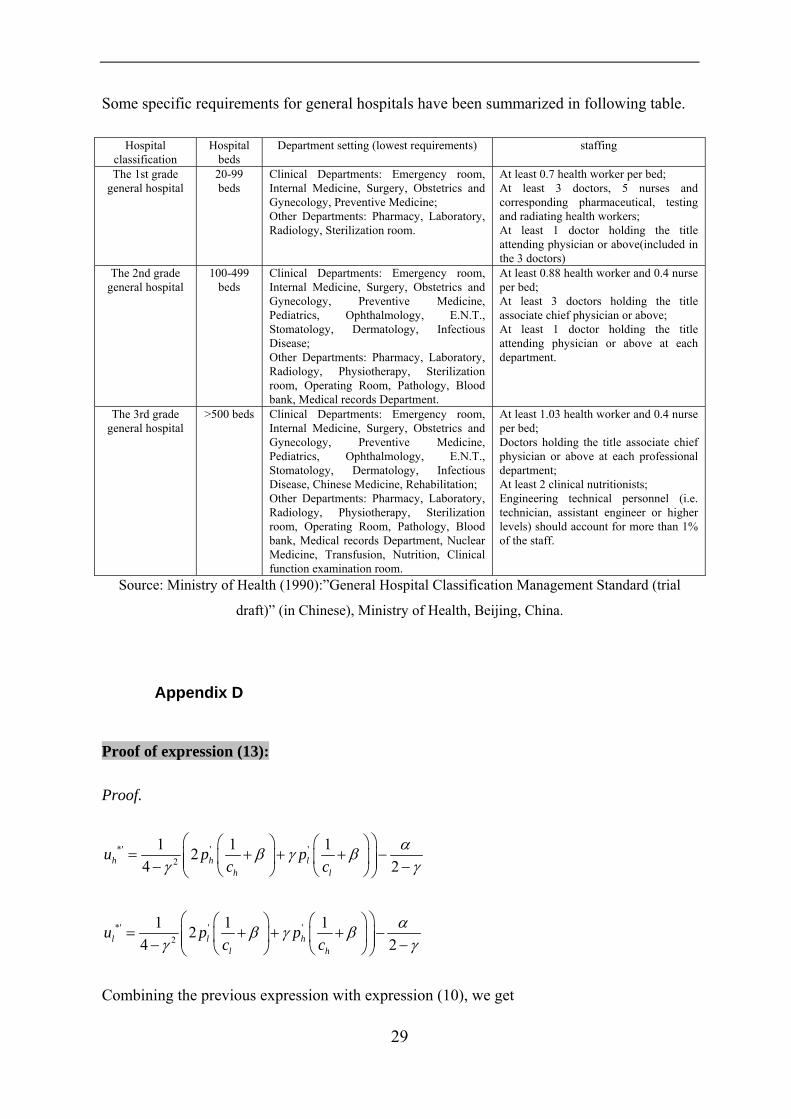
Some specific requirements for general hospitals have been summarized in following table.
Hospital classification
Hospital beds
Department setting (lowest requirements) staffing
The 1st grade general hospital
20-99 beds
Clinical Departments: Emergency room, Internal Medicine, Surgery, Obstetrics and Gynecology, Preventive Medicine; Other Departments: Pharmacy, Laboratory, Radiology, Sterilization room.
At least 0.7 health worker per bed; At least 3 doctors, 5 nurses and corresponding pharmaceutical, testing and radiating health workers; At least 1 doctor holding the title attending physician or above(included in the 3 doctors)
The 2nd grade general hospital
100-499 beds
Clinical Departments: Emergency room, Internal Medicine, Surgery, Obstetrics and Gynecology, Preventive Medicine, Pediatrics, Ophthalmology, E.N.T., Stomatology, Dermatology, Infectious Disease; Other Departments: Pharmacy, Laboratory, Radiology, Physiotherapy, Sterilization room, Operating Room, Pathology, Blood bank, Medical records Department.
At least 0.88 health worker and 0.4 nurse per bed; At least 3 doctors holding the title associate chief physician or above; At least 1 doctor holding the title attending physician or above at each department.
The 3rd grade general hospital
>500 beds Clinical Departments: Emergency room, Internal Medicine, Surgery, Obstetrics and Gynecology, Preventive Medicine, Pediatrics, Ophthalmology, E.N.T., Stomatology, Dermatology, Infectious Disease, Chinese Medicine, Rehabilitation; Other Departments: Pharmacy, Laboratory, Radiology, Physiotherapy, Sterilization room, Operating Room, Pathology, Blood bank, Medical records Department, Nuclear Medicine, Transfusion, Nutrition, Clinical function examination room.
At least 1.03 health worker and 0.4 nurse per bed; Doctors holding the title associate chief physician or above at each professional department; At least 2 clinical nutritionists; Engineering technical personnel (i.e. technician, assistant engineer or higher levels) should account for more than 1% of the staff.
Source: Ministry of Health (1990):”General Hospital Classification Management Standard (trial
draft)” (in Chinese), Ministry of Health, Beijing, China.
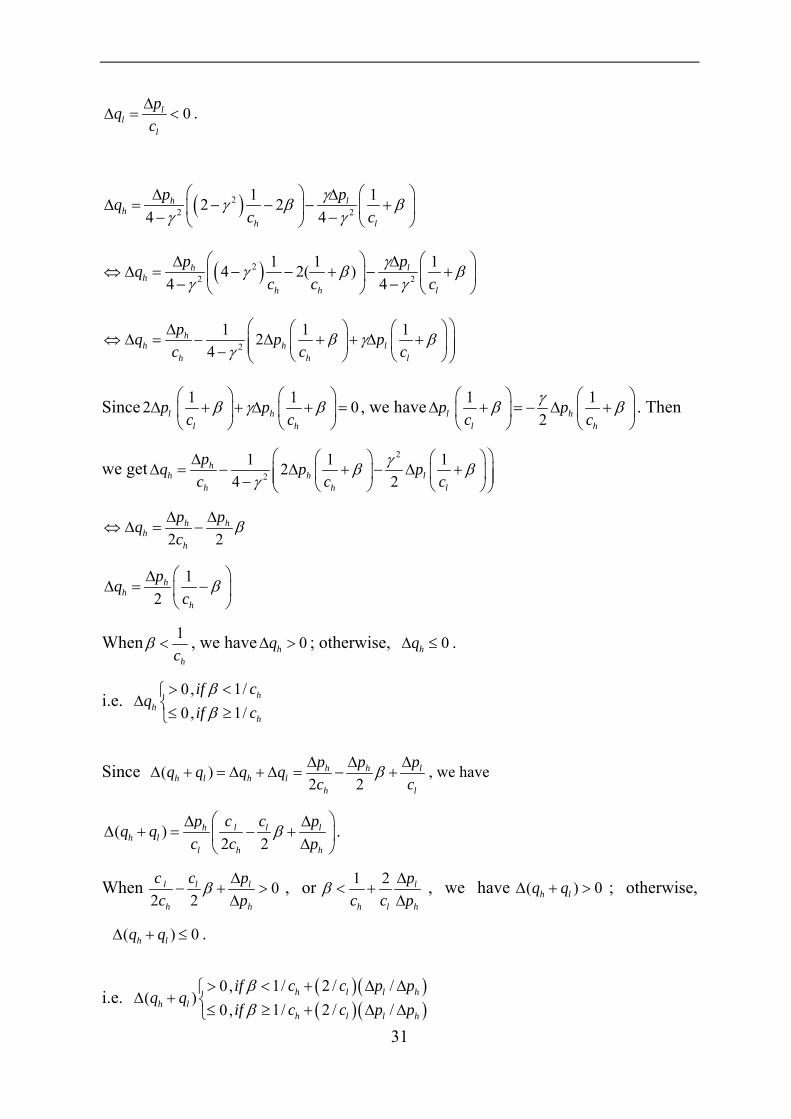
Appendix D
Proof of expression (13):
Proof.
*' ' '2
1 1 124 2h h l
h l
u p pc c
αβ γ βγ γ
⎛ ⎞⎛ ⎞ ⎛ ⎞= + + +⎜ ⎟⎜ ⎟ ⎜ ⎟⎜ ⎟− −⎝ ⎠ ⎝ ⎠⎝ ⎠
−
*' ' '2
1 1 124 2l l h
l h
u p pc c
αβ γ βγ γ
⎛ ⎞⎛ ⎞ ⎛ ⎞= + + +⎜ ⎟⎜ ⎟ ⎜ ⎟⎜ ⎟− −⎝ ⎠ ⎝ ⎠⎝ ⎠
−
Combining the previous expression with expression (10), we get
29

' '2 2
1 1 1 1 1 12 24 2 4 2l h l h
l h l h
p p p pc c c c
α αβ γ β β γ βγ γ γ
⎛ ⎞ ⎛ ⎞⎛ ⎞ ⎛ ⎞ ⎛ ⎞ ⎛ ⎞+ + + − = + + + −⎜ ⎟ ⎜ ⎟⎜ ⎟ ⎜ ⎟ ⎜ ⎟ ⎜ ⎟⎜ ⎟ ⎜ ⎟− − − −⎝ ⎠ ⎝ ⎠ ⎝ ⎠ ⎝ ⎠⎝ ⎠ ⎝ ⎠ γ
2
1 1 12 04 l h
l h
p pc c
β γ βγ
⎛ ⎞⎛ ⎞ ⎛ ⎞⇔ Δ + + Δ +⎜ ⎟⎜ ⎟ ⎜ ⎟⎜ ⎟− ⎝ ⎠ ⎝ ⎠⎝ ⎠
=
1 12 0l hl h
p pc c
β γ β⎛ ⎞ ⎛ ⎞
⇔ Δ + + Δ + =⎜ ⎟ ⎜ ⎟⎝ ⎠ ⎝ ⎠
By defining 1
h
Ac
β= + and 1
l
Bc
β= + , we can rewrite the previous equation
as 2 0h lp A p BγΔ + Δ = . Since hc cl< , we have . Since , we
have
0A B> > 0hpΔ >
2 0lh
p Bp AγΔ
Δ = − > .
*' *2 2
2 ( )2 2 04 4
hh
h l hh h h
p Ap Ap A p B p Au u u2
γγγγ γ
− ΔΔ +Δ + Δ Δ
Δ = − = = = >− −
Since , is positive ( ). 0hp AΔ > huΔ 0huΔ >
Deduction of , and : lqΔ hqΔ ( )h lq qΔ +
( )22 2
1 12 24 4
l hl
l h
p pqc c
γγ β βγ γ
⎛ ⎞ ⎛Δ ΔΔ = − − − +⎜ ⎟ ⎜− −⎝ ⎠ ⎝
⎞⎟⎠
( )22 2
1 1 14 2( )4 4
l hl
l l h
p pqc c c
γγ β βγ γ
⎛ ⎞Δ Δ⇔ Δ = − − + − +⎜ ⎟− −⎝ ⎠
⎛ ⎞⎜ ⎟⎝ ⎠
2 2
2 1 14 4
l l hl
l l h
p p pqc c c
γβ βγ γ
⎛ ⎞ ⎛Δ Δ Δ⇔ Δ = − + − +⎜ ⎟ ⎜− −⎝ ⎠ ⎝
⎞⎟⎠
2
1 1 124
ll l h
l l
pq p pc c ch
β γ βγ
⎛ ⎞⎛ ⎞ ⎛Δ⇔ Δ = − Δ + + Δ +⎜ ⎟⎜ ⎟ ⎜⎜ ⎟− ⎝ ⎠ ⎝⎝ ⎠
⎞⎟⎠
Since 1 12 0l hl h
p pc c
β γ β⎛ ⎞ ⎛ ⎞
Δ + + Δ + =⎜ ⎟ ⎜ ⎟⎝ ⎠ ⎝ ⎠
, we have
30
0ll
l
pqcΔ
Δ = < .
( )22 2
1 12 24 4
h lh
h l
p pqc c
γγ β βγ γ
⎛ ⎞ ⎛Δ ΔΔ = − − − +⎜ ⎟ ⎜− −⎝ ⎠ ⎝
⎞⎟⎠
( )22 2
1 1 14 2( )4 4
h lh
h h l
p pqc c c
γγ β βγ γ
⎛ ⎞Δ Δ⇔ Δ = − − + − +⎜ ⎟− −⎝ ⎠
⎛ ⎞⎜ ⎟⎝ ⎠
2
1 1 124
hh h l
h h
pq p pc c lc
β γ βγ
⎛ ⎞⎛ ⎞ ⎛Δ⇔ Δ = − Δ + + Δ +⎜ ⎟⎜ ⎟ ⎜⎜ ⎟− ⎝ ⎠ ⎝⎝ ⎠
⎞⎟⎠
Since 1 12 0l hl h
p pc c
β γ β⎛ ⎞ ⎛ ⎞
Δ + + Δ + =⎜ ⎟ ⎜ ⎟⎝ ⎠ ⎝ ⎠
, we have 1 12l h
l h
p pc c
γβ β⎛ ⎞ ⎛
Δ + = − Δ +⎜ ⎟ ⎜⎝ ⎠ ⎝
⎞⎟⎠
. Then
we get2
2
1 1 124 2
hh h l
h h
pq p pc c
γ
lcβ β
γ⎛ ⎞⎛ ⎞ ⎛Δ
Δ = − Δ + − Δ +⎜ ⎟⎜ ⎟ ⎜⎜ ⎟− ⎝ ⎠ ⎝⎝ ⎠
⎞⎟⎠
2 2h h
hh
p pqc
βΔ Δ⇔ Δ = −
12
hh
h
pqc
β⎛ ⎞Δ
Δ = −⎜ ⎟⎝ ⎠
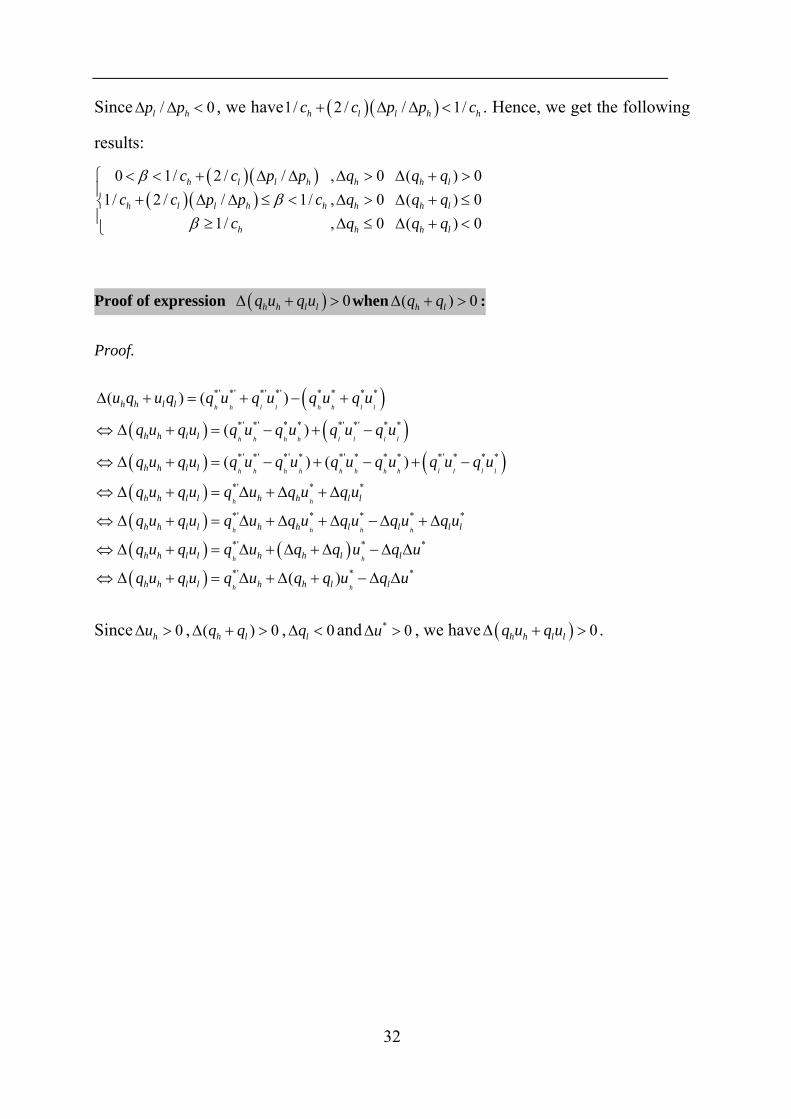
When 1
hcβ < , we have ; otherwise, 0hqΔ > 0hqΔ ≤ .
i.e. 1/0,1/0,
hh
h
if cq
if cββ<>⎧
Δ ⎨ ≥≤⎩
Since ( )2 2
h hh l h l
h l
p p pq q q qc c
βΔ Δ ΔΔ + = Δ + Δ = − + l , we have
( )2 2
h l l lh l
l h h
p c c pq qc c p
β⎛ ⎞Δ Δ
Δ + = − +⎜ ⎟Δ⎝ ⎠.
When 02 2
l l l
h h
c c pc p
β Δ− + >
Δ, or 1 2 l
h l
pc c p
βh
Δ< +
Δ, we have ( )h lq q 0Δ + > ; otherwise,
. ( )h lq qΔ + ≤ 0
i.e. ( )( )( )(
1/ 2 / /0,( )
1/ 2 / /0,h l l
h lh l l
if c c p pq q
if c c p pββ< + Δ Δ>⎧
Δ + ⎨ ≥ + Δ Δ≤⎩ )h
h
31
32
0Since , we have/l hp pΔ Δ < ( )( )1/ 2 / / 1/h l l hc c p p+ Δ Δ < hc
0
lq≤
+ <
. Hence, we get the following
results:
( )( )( )( )
0 1/ 2 / / , 0 ( )1/ 2 / / 1/ , 0 ( ) 0
1/ , 0 ( ) 0
h l l h h h l
h l l h h h h l
h h h
c c p p q q qc c p p c q q q
c q q
ββ
β
< < + Δ Δ Δ > Δ + >⎧⎪ + Δ Δ ≤ < Δ > Δ +⎨⎪ ≥ Δ ≤ Δ⎩
Proof of expression ( ) 0h h l lq u q uΔ + > when ( )h lq q 0Δ + > :
Proof.
( )( ) ( )( ) ( )( )( )
*' *' *' *' * * * *
*' *' * * *' *' * *
*' *' *' * *' * * * *' * * *
*' * *
( ) ( )
( )
( ) ( )
h h l l h h l l
h h h h l l l l
h h h h h h h h l l l l
h h
h
h h l l
h h l l
h h l l
h h l l h h l l
h h l l
u q u q q u q u q u q u
q u q u q u q u q u q u
q u q u q u q u q u q u q u q u
q u q u q u q u q u
q u q u q
Δ + = + − +
⇔ Δ + = − + −
⇔ Δ + = − + − + −
⇔ Δ + = Δ + Δ + Δ
⇔ Δ + =
( ) ( )( )
*' * * * *
*' * *
*' * *( )
h h h
h h
h h
h h l l l l
h h l l h h l l
h h l l h h l l
u q u q u q u q u
q u q u q u q q u q u
q u q u q u q q u q u
Δ + Δ + Δ −Δ + Δ
⇔ Δ + = Δ + Δ + Δ −Δ Δ
⇔ Δ + = Δ + Δ + −Δ Δ
Since , ,Δ < and0huΔ > ( ) 0h lq qΔ + > 0lq * 0uΔ > , we have ( ) 0h h l lq u q uΔ + > .