healthcare commission national audit of violence 2006-7
TRANSCRIPT

The Healthcare Commission National Audit of Violence 2006-7 Final Report – Working Age Adult Services
1
Charity reg. No. 228636
Healthcare Commission National Audit of Violence 2006-7 Final Report - Working age adult services The Audit Team Royal College of Psychiatrists’ Centre for Quality Improvement 4th Floor, Standon House 21 Mansell Street London, E1 8AA

The Healthcare Commission National Audit of Violence 2006-7 Final Report – Working Age Adult Services
2

The Healthcare Commission National Audit of Violence 2006-7 Final Report – Working Age Adult Services
3
Executive summary This report describes the findings from the 2006/7 phase of the National Audit of Violence which was funded by the Healthcare Commission and managed by the Royal College of Psychiatrists’ Centre for Quality Improvement. A total of 69 NHS trusts and independent sector organisations took part in the programme, representing 78% of all eligible participants in England and Wales. Work focused on two specialities – older people’s services and acute services. Data was collected between October 2006 and March 2007. This report presents the findings from services for adults of working age. When the audit was last carried out in 2003/5, the findings from the 120 participating acute wards were particularly concerning. Indeed, by way of demonstrating its commitment to support implementation of the audit findings, the Healthcare Commission part-funded the development of an accreditation service for acute wards (AIMS, further details can be found at: www.rcpsych.ac.uk/AIMS). For the 2006/7 phase of the audit, the strategy team at the Healthcare Commission asked the team at the Royal College of Psychiatrists’ Centre for Quality Improvement to maintain a focus on acute wards, but to extend it to include older people’s services. Accordingly, the invitation to join the programme that went out to all eligible trusts in England and Wales invited them to put forward three wards - one acute ward, one older person’s wards, and one other adult mental health ward. When considered in terms of both the stand-alone data, and in comparison with older people’s services, services for working age adults have much to be proud of. The results suggest that although the nature, level and severity of violence on wards have increased, the effectiveness with which staff teams prevent and manage incidents has also increased. Throughout the programme – in the content of discussions at workshops and in the extensive comments contained in the data – it has been clear that the sophistication with which the subject is being understood and the problems addressed is often exemplary. There is clear evidence that the majority of services are now adopting proactive and preventative strategies to tackling violence in inpatient services. The effort and commitment that this represents is enormous and must be applauded. The audit highlighted a few areas where wards should consider reviewing their practice, as further work may be required. • Life on the ward: administration of medication; involving patients in decisions;
activities and therapies; provision of information; • Ward staffing: staff ratio and skill mix; flexible staffing in relation to resident
population; • Training and support for staff: in particular, undertaking searches; recording
incidents; observation and rapid tranquillisation; • Environmental safety: basic safety features i.e. de-escalation area/effective alarm
system; ensuring privacy and dignity; lack of space and overcrowding; • Being supported in relation to actual incidents: proactive measures; post incident
supports; reporting of less severe incidents; improving awareness of supports available from the Local Security Management Specialist.
Local and national reports have been sent out to all participating wards and regional action planning workshops were held to support local teams to take forward service improvements. A series of ‘change management’ workshops are also being held to train staff to lead change within their services.

The Healthcare Commission National Audit of Violence 2006-7 Final Report – Working Age Adult Services
4

The Healthcare Commission National Audit of Violence 2006-7 Final Report – Working Age Adult Services
5
Foreword Why are acute psychiatric inpatient units so important? Should they not be of less relevance in a system that has moved on to community-based means of delivering mental health services? After all, they should be made obsolete by the efficient introduction of Crisis Resolution and Home Treatment Teams. But this is, of course, unrealistic fantasy, as they remain an important reality for a small, but significant, proportion of service users because they provide a source of care to people who are often at their most unwell and vulnerable, and give a means of dealing with problems that services in the community have been unable to resolve. In many cases they are doing so without the service user’s voluntary consent, thus placing a particular obligation on the staff. The phrase ‘crisis in acute inpatient care’ has been around for many years and there does not yet seem to be any justification for abandoning this term. It is certain that acute psychiatric inpatient units have been more challenging places to work, and the rates of violent behaviour reported here testify to this. The world surrounding the units has also changed, particularly with the increase in substance misuse and the changing attitudes to authority. Staff and service users seem to speak with one voice when they agree with the inadequacy of acute inpatient wards to provide the therapeutic environments and conditions for sanctuary necessary for the delivery of good quality mental health care. Few would disagree that it is time for change, but that change may be difficult to make, particularly in a world dominated by risk aversion. Nevertheless, the National Audit of Violence seems to be indicating some possibility of change, as one thing that does seem clear in this report is the number of able staff working on the wards who have made changes to their practice and are instilled with some sense of pride, despite their taxing environments. The audit also reveals some areas of clear intransigence to change, in particular the poor physical environments, inadequate training and difficulty in providing therapeutic and other activities. These are not matters that can be allowed to rest. The National Audit of Violence has the capacity to monitor change over time and to cast a critical eye on a situation that cannot be allowed to remain the same if the quality of care for service users and the quality of working environments for staff is to be improved. Such monitoring relies on the hard work of many people, including those ward staff who provide the data returns and the CCQI staff who must organise and analyse the data and provide the reports. This is a credit to the thoughtful and compassionate workers who are sufficiently inquisitive to examine the nature of their working environments which will require dramatic transformation to be fit for the twenty-first century. Dr Jed Boardman, Chair of the General and Community Faculty of the Royal College of Psychiatrists 2002-2007

The Healthcare Commission National Audit of Violence 2006-7 Final Report – Working Age Adult Services
6

The Healthcare Commission National Audit of Violence 2006-7 Final Report – Working Age Adult Services
7
Contents Acknowledgements 9 Participating Trusts/organisations 10 Non-participating Trusts/organisations 11 Key messages 13 Introduction and methods 16 National findings 22 Findings from modules 1 and 2 24 Setting the scene: Experiences of severely challenging/violent behaviour in wards and its management 25 An overview of current practice Being treated with respect and dignity, and given privacy and choice 36 Being offered meaningful occupation 39 Being listened to and given adequate information 41 Strong communication systems and positive ward culture 43 Appropriate training for staff 48 Adequate staff supervision 55 Supports from other colleagues on the war d 58 A safe physical environment 61 Being supported in relation to actual incidents 72 Additional comments 75 Module 3a: review of violent incidents 77 Module 3b: case note/drug chart audit on the use of rapid tranquillisation 81 Discussion 83 Key areas for attention 85 Glossary 87
Appendix 1- Case Studies 90 Appendix 2- National Audit of Violence 2003/5- Contribution of the findings to the development of national policy, guidance and initiatives 92 Appendix 3- National Audit of Violence 2006/07- Declaration of Understanding 93 Appendix 4- Contextual Data summary 95 Appendix 5- Ward survey results by service ‘type’ 97 Appendix 6- Environmental Audit Overall National Findings 131 Appendix 7- Case note/drug chart audit on the use of rapid tranquillisation 133 Appendix 8- Comparative report: key findings from older people’s services, relative to services for adults of working age 151

The Healthcare Commission National Audit of Violence 2006-7 Final Report – Working Age Adult Services
8

The Healthcare Commission National Audit of Violence 2006-7 Final Report – Working Age Adult Services
9
Acknowledgements The Audit Team would like to thank the following for helping to make the audit programme such a success. Firstly, the Healthcare Commission for funding the work and for supporting us by attending both Introductory and Feedback Events. Our thanks go to a number of people: our expert Steering Group – Helen Bennett, Rachel Christian-Edwards, Marion Janner, Sarah King, Paul Lelliott, Colin Dale, Rick Tucker, Simon O’Donovan and Alan Swann. Special thanks go to Simon O’Donovan and Alan Swann, who worked so hard with us to modify the standards and methods to make them appropriate for services for older people. Thanks to Rob Chaplin for providing invaluable support with the revision of the audit tools and helping us run the Introductory and Feedback Events. Additional thanks to Sarah King for helping run the Introductory and Feedback Events and to Ignatius Loubser, Specialist Registrar and Gary Blackhurst, Counter Fraud and Security Management Service for helping at the Feedback Events. Thanks to Jed Boardman for agreeing to write the Foreword to this report. The Audit Team Maureen McGeorge, Programme Manager Leanne Shinkwin, Project Administrator Graham Hinchcliffe, Project Administrator

The Healthcare Commission National Audit of Violence 2006-7 Final Report – Working Age Adult Services
10
Participating Trusts/organisations We would also like to thank all the local project leads and the people who took the time to complete a questionnaire, without whom this piece of work could not have been done. 5 Boroughs Partnership NHS Trust (John Evans), Avon & Wiltshire Mental Health Partnership NHS Trust (Jayne Hayes), Barnet, Enfield and Haringey Mental Health NHS Trust (Clara Wessinger), Bedfordshire and Luton Community Trust (Maggie Nicholls), Birmingham & Solihull Mental Health NHS Trust (Paul Warwick and Angharad Newbold), Bolton, Salford and Trafford NHS Trust (Pam Neilan), Bro Morgannwg NHS Trust (Paul Sussex), Cambridgeshire & Peterborough Mental Health Partnership NHS Trust (Sue Smith and Sue Champion), Camden & Islington Mental Health & Social Care Trust (Emma Rooks), Cardiff and Vale NHS Trust (Simon O’Donovan), Central and North West London NHS Foundation Trust (Rachel Huck), Cheshire and Wirral Partnership NHS Trust (Joanna Rogerson), Conwy and Denbighshire NHS Trust (Stuart Mival), Cornwall Partnership NHS Trust (Paul Richards), Coventry Teaching PCT (Terry Twomey), Derbyshire Mental Health Services NHS Trust (Wendy Henson and Russell Mason), Devon Partnership NHS Trust (Linda Moore), Doncaster & South Humber Healthcare NHS Trust (Wendy Joseph), Dudley PCT (James Cole), East London & The City Mental Health NHS Trust (Eirlys Evans), Gwent Healthcare NHS Trust (Kelly Jones), Hampshire Partnership NHS Trust (Jane Elderfield), Hertfordshire Partnership NHS Trust (Andrew Cashmore), Humber Mental Health Teaching NHS Trust (Jan Marshall), Kent & Medway NHS and Social Care Partnership Trust (Kevin Halpin), Lancashire Care NHS Trust (Pam Tester), Leeds Partnerships NHS Foundation Trust (Carrie Rae), Leicestershire Partnership NHS Trust (Steve Walls), Lincolnshire Partnership NHS Trust (Anita Lewin), Manchester Mental Health & Social Care NHS Trust (Bernadette Bailey), Milton Keynes PCT (Tina Parish), North Cumbria Mental Health & Learning Disabilities NHS Trust (Jonathan Coomber), North East London Mental Health NHS Trust (Debbie Taylor), North East Wales NHS Trust (Simon Pyke), North Essex Mental Health Partnership NHS Trust (Susan Barry), North Glamorgan NHS Trust (Meryl Griffin), North Staffordshire Combined Healthcare NHS Trust (Rob Grant), North West Wales NHS Trust (David Reader), North Yorkshire & York PCT (Jeff Whiley and Kevin Pratt), Northamptonshire Healthcare NHS Trust (Vic Barrington-Wise), Northumberland, Tyne & Wear NHS Trust (Robin Green), Nottinghamshire Healthcare NHS Trust (Pauline Adams1), Oxfordshire & Buckinghamshire Partnership NHS Trust (Bhavna Pascal), Oxleas Foundation NHS Trust (Phil Garnham), Pembrokeshire and Derwen NHS Trust (Stephen Nessmann), Pennine Care NHS Trust (Samantha Williamson), Plymouth Teaching PCT (Sarah Mitchell and David McAuley), Priory Healthcare Limited (Carole Cairns), Sandwell Mental Health NHS and Social Care Trust (Lesley Richards), Somerset Partnership NHS & Social Care Trust (Andy Harewood), South Essex Partnership NHS Foundation Trust (Jane Cheeseman), South London and Maudsley NHS Trust (Natalie Hammond), South Staffordshire Healthcare NHS Trust (Gary Firkins), South West London and St George's Mental Health NHS Trust (Bartholomew Tenerowicz), South West Yorkshire Mental Health NHS Trust (Susan Alibone), St Andrews Healthcare (Lorraine Walker), Suffolk Mental Health Partnership NHS Trust (Janet Roper), Surrey & Borders Partnership NHS Trust (Martin Clark2), Sussex Partnership NHS Trust (Claudine Chaloner), Swansea NHS Trust (Alison Guyatt), Tees, Esk & Wear Valleys (John Stamp, Christine Parry and Simon Lancashire) , The Retreat (Chris Dawson), Walsall Teaching PCT (Liz Lockett), West London Mental Health NHS Trust (Sarina Martin), Wolverhampton City PCT (Angela Hossack and Dan Fisher), Worcestershire Mental Health Partnership NHS Trust (Robert Hipwell).
1 Plus local team members Mick O’Driscoll and Annie Clarke 2 Plus local team members Noreen Jeffery, Sharmila Ramchurn, Alan Saunders and Sivas Sivassubramaniam

The Healthcare Commission National Audit of Violence 2006-7 Final Report – Working Age Adult Services
11
Non-participating Trusts/organisations Barnsley PCT, Berkshire Healthcare NHS Trust, Bradford District Care Trust, Cygnet Health Care Limited, Dorset Healthcare NHS Trust, Gloucestershire Partnership NHS Trust, Hambleton & Richmondshire PCT, Herefordshire PCT, Hillingdon PCT, Isle of Wight Healthcare NHS Trust, Mersey Care NHS Trust, Morecambe Bay PCT, Norfolk and Waveney Mental Health NHS Trust, North Dorset PCT, Pontypridd & Rhondda NHS Trust, Portsmouth City Teaching PCT, Sheffield Care Trust, Shropshire County PCT, Warwickshire PCT, Swindon PCT.

The Healthcare Commission National Audit of Violence 2006-7 Final Report – Working Age Adult Services
12

The Healthcare Commission National Audit of Violence 2006-7 Final Report – Working Age Adult Services
13
Key Messages
Findings from the audit showed that across England and Wales, in mental health services for adults of working age, levels of experienced violence were high. Many respondents reported not only a heightened frequency of incidents, but also an increased severity - in extreme cases involving weapons. People who had been exposed to violence described its impact, often in graphic terms. It was clear, however, that recent national policy and practice drivers that have emphasised the use of prevention and de-escalation, rather than physical interventions, were firmly embedded in ward-based practices in many services. Staff, patients and visitors were clearly aware of this changing culture, and were responding positively to it. The prevention and effective management of violence is, however, a broad and complex subject. The 1998 and 2005 Guidelines3 offer substantive advice about how safety can be maximised. The audit measured compliance with this good practice. The key messages are summarised below. Being treated with respect and dignity, and given privacy and choice A large portion of questions in this section were answered positively by the majority of patients, making a very clear and optimistic statement about the general treatment of patients on our wards. In general, the comments box was used to raise specific concerns. A number of problem areas were highlighted: • Local practices relating to the administration of medication; • The involvement of patients in decision-making about their own care, particularly in
relation to choice of medication and their preferred way of being managed in the event of their becoming violent;
• The involvement of patients in decision-making about aspects of how the ward is run, e.g. mealtimes, choice of menu, availability of refreshments outside of mealtimes, waking times.
Being offered meaningful occupation Boredom was still a problem on many wards. Large numbers of patients complained about the lack of daily exercise and the general absence of things to do, particularly in the evenings and at weekends. Encouragingly, just as many people offered constructive suggestions and ideas about how to alleviate boredom; most of these ideas would be inexpensive and relatively easy to implement. It is vital that wards address this area as a matter of priority; measures should also be put in place to ensure that activities and therapies are reviewed regularly so that the provision is appropriate to the current patient and staff mix. Being given adequate information It is clear from the responses from patients that in the large majority of wards, staff are communicating effectively with them, even during stressful times - such as an admission. If not currently available, wards should consider providing written information, in a leaflet or on a notice board, to reduce any potential confusion.
3 Wing, J.K., Marriott, S., Palmer, C. and Thomas, V. (1998) The Management of Imminent Violence: Clinical Practice Guidelines to Support Mental Health Services. Occasional Paper OP41. London: Royal College of Psychiatrists.
3 National Institute for Clinical Excellence (2005) Violence: The short-term management of disturbed/violent behaviour in psychiatric in-patient settings and emergency departments. Clinical Guideline 25, NICE.

The Healthcare Commission National Audit of Violence 2006-7 Final Report – Working Age Adult Services
14
Ward communication systems and culture The overall picture nationally was of cohesive, supportive staff teams, with well-structured communication systems and strong multi-disciplinary working. For many wards, there was a sense of pride in what was being achieved and some even referred to their improvements as ‘a work in progress’ – keen to emphasise that more lay ahead. There were some obvious exceptions – wards where the dynamics within the nursing team, or between the nursing staff and their clinical colleagues, were damaged and/or where morale was particularly low. The most common source of problems was staffing on the ward. While some wards clearly had well-established teams and flexible systems that allowed them to manage their staffing resource to match the needs of the ward, others were less fortunate. A number were experiencing problems recruiting staff; others faced financial constraints that meant that their staffing levels and/or access to bank/agency staff or overtime had been reduced. The issue of poor skills mix on wards was raised many times, with a range of underlying factors: problems retaining experienced staff; financially-driven reductions to the numbers of qualified to unqualified staff; high reliance on bank/agency staff. Concerns about the gender of ethnic mix of the staff team were generally linked to local recruitment problems. Staff training Access to training relating to the prevention and management of violence was variable, both between services, and between different respondent groups. Some particular areas stood out for comment: • Training for nursing staff in undertaking searches; • Training for all staff in recording incidents; • On-going competency training in observation for nurses; • Access for nurses to all recommended training related to the use of rapid tranquillisation. Additional appeals were expressed for more regular, more in-depth, and more accessible training. In some services, even when training courses were available, staff shortages and difficulties funding backfill often prevented staff from attending. Consequently, some staff were missing out on training that they needed to allow them to effectively and safely carry out their jobs, leaving them ill-equipped and ‘at risk’ in volatile environments. Staff supervision While the large majority of nursing and other clinical staff were receiving one-to-one clinical supervision, large numbers were not. Those that were receiving supervision reported high levels of satisfaction with its quality, though nursing staff were less happy with its frequency. As many of these staff were being required to work in increasingly challenging environments, perhaps not surprisingly, particular value was placed on supervision as a forum for dealing with the aftermath of violent and aggressive incidents, as was the need for flexible access to advice and supports from senior colleagues. Supports from other colleagues The majority of staff reported that they were satisfied with the supports they received from their team on the ward, though less so with supports from more senior managers. Many ward staff had become highly reliant on each other, especially in the context of managing actual incidents. On wards where the staff team was unstable and/or there was a high reliance on bank and agency staff (who might not have been trained and/or able to offer the required support), individual team members were often left feeling vulnerable, unsupported, and unappreciated, as this quote from a member of the clinical staff team explained:

The Healthcare Commission National Audit of Violence 2006-7 Final Report – Working Age Adult Services
15
“The trust needs to look at the support it gives to the nurses they have working for them on the wards. Some of these wards are not a pleasant environment the staff are coming to with regards to violent/aggressive/abusive patients - who are obviously unwell. So they should at least make staff feel more appreciated for the efforts they do.” Environmental safety The picture nationally was very mixed. There were undoubtedly wards that were well-designed and able to provide a safe environment in which to care for people. However, there were also many wards where the physical environment exposed staff, patients and visitors to unnecessary levels of risk. A sizeable number of wards still lacked basic safety features – such as a de-escalation area or an effective alarm system. Where these types of short-falls exist, they must be addressed as a matter of urgency. The design of some wards was inappropriate for purpose – e.g. long corridors, blind spots - and it was clear people were being exposed to additional associated risks. In some cases, services were accommodated in buildings that were not built for their current purpose; in others, the buildings were old and offered limited scope for improvement. Perhaps most worryingly, the audit revealed that new wards were still being built that failed to take into account available intelligence about safe design. In some wards, the privacy, dignity and choice given to patients was being compromised by poor and/or inadequate design – such as limited access to outside areas, the absence of a separate area to receive people with a police escort, or doors that could not be locked. In some cases, these problems could and should be remedied with relatively inexpensive solutions. For many wards, specific short-falls in environmental features were heightening the risk of violence: lack of space and over-crowding; excessive noise levels; over-heating. In extreme cases, wards were described as “gloomy”, “dirty” or “dehumanising”. Wherever possible, these should be addressed as a matter of urgency. Being supported in relation to actual incidents In general, the range of supports that were being offered to patients and visitors in relation to actual incidents were poor. More proactive measures need to be taken to ensure that those at risk have access to advice about what to do in the event of a violent incident. Additionally, systems need to be tightened up to ensure that patients and visitors who are involved in incidents are offered appropriate post-incident supports. Although the data on reporting incidents suggested that the majority of serious incidents were being recorded, the comments indicated that less severe incidents, including threatening behaviour, may not be. Services need to examine and address any potential barriers to reporting – whether associated with the inefficiencies of local reporting systems, the inadequacy of post-incident follow-up/supports, or the dominant culture on the ward. The introduction of Local Security Management Specialists into mental health services was designed to make staff feel safer: more must be done to make staff aware that this service is available for them and how it can be accessed and used.

The Healthcare Commission National Audit of Violence 2006-7 Final Report – Working Age Adult Services
16
Introduction General background This is the second time that the Healthcare Commission has funded a full-scale national audit of violence in mental health services. In the 2003/5 phase of work, the focus for the audit was mental health and learning disabilities in-patient wards in England and Wales. Sixty provider organisations, representing over 260 individual wards and units, took part. The effectiveness of the audit as a driver for improvement was clearly evident at both local and national levels. Local-level impact Following on from the audit, the Healthcare Commission undertook an independent evaluation to establish whether the audit had been effective in driving forward service improvements. Between September and December 2005, action plans and progress reports were collected from the Trusts that had taken part in the audit. A sample of Trusts were then visited or spoken to about the improvements that they had been able to bring about, following on from the audit and its findings. The study indicated that the audit was perceived to be a success by staff working on the participating wards, in clinical leadership roles, and in clinical governance departments. For some, their successes were relatively simple – for example, moving public telephones to more private areas, the introduction of routine incident de-briefing, and increasing patient involvement in ward decision-making. Others had engaged in complex, time-consuming and sometimes costly ventures – for example, relocating smoking facilities, installing electronically-controlled blinds to assist temperature control, working with local police to minimise substance misuse, or purchasing new alarm systems. The follow-up survey concluded that many trusts had used the findings from the audit to drive improvements. “In all situations where the therapeutic environment was improved, levels of aggression were diminished. Staff reported that they felt greater job satisfaction and retention of staff was easier. Junior staff particularly felt that senior management and the boards were willing to listen and had not necessarily experienced this previously. They put this down to the fact that the audit was very ‘hands on’ for ward staff and, in this, they were the ‘experts’ …. Patients felt that their opinions counted especially when their views were used in planning activities and in debriefing sessions. Some felt that staff dealt with issues in a more caring, confident and containing manner.”
Healthcare Commission, 2006.
Appendix 1 contains case study examples from three of the participating Trusts. National-level impact At a national level, the findings provided significant input to a wide range of policy, guidance, and initiatives (Appendix 2).

The Healthcare Commission National Audit of Violence 2006-7 Final Report – Working Age Adult Services
17
The 2006/7 audit The 2006/7 phase of the has audit focused on two specialities – older people’s services and acute services. This report presents the findings from the latter. It is hoped that the launch of this report will ignite a new wave of measures, locally and nationally, that will support the improvements.
Overall participants in the National Audit of Violence 2006/7 The Healthcare Commission directed the selection of participants for the audit programme. A letter was sent, jointly signed by the Director of the Royal College of Psychiatrists’ Research and Training Unit, and the Chief Executive of the Healthcare Commission, to all eligible providers of mental health services in the NHS and independent sectors in England and Wales. The letter expressly asked them to include the following mental health wards: • one acute psychiatric ward; • one older people’s ward; • one ‘other' adult mental health ward. A total of 69 Trusts/organisations registered to take part in the audit programme, representing 78% of all eligible participants. The table below gives a breakdown of participants by ward ‘type’. During the life of the project, these figures fluctuated slightly due to reconfigurations of Trusts and ward closures. Ward ‘type’ No. units England Wales Acute 76 13 Psychiatric Intensive Care Unit (PICU) 25 2 Forensic 14 3 Rehabilitation 5 1 Older People – functional 16 3 Older People – organic 24 5 Older People – mixed4 26 2
TOTAL 186 29 At time of registration onto the programme, participants were asked to complete a Declaration of Understanding (see Appendix 3), detailing the mutual expectations between themselves and the audit team at the Royal College of Psychiatrists’ Centre for Quality Improvement. Sixty-nine signed documents were returned.
4 The category ‘Older people – mixed’ was not an original category on the Contextual Information Checklist, however, many wards selected both ‘Older people – organic’ and ‘Older people – functional’ when describing their service.

The Healthcare Commission National Audit of Violence 2006-7 Final Report – Working Age Adult Services
18
Definition of terms Each ward was categorised into one of 7 service ‘types’. This was done to allow the findings to be grouped so that participating wards could benchmark their results against other similar-type wards. The categories were defined as follows: • Acute: any mental health acute in-patient service • PICU: any psychiatric intensive care unit for people with a primary diagnosis of mental
heath problems • Forensic: any forensic service for people with a primary diagnosis of mental health
problems • Rehabilitation: any long-stay in-patient mental health service not covered by the above
e.g. continuing care, rehabilitation wards • Older people - functional: any mental health service specifically for the care for older
people (generally over 65 years) with functional mental illness • Older people - organic: any mental health service specifically for the care for older
people (generally over 65 years) with organic mental illness • Older people – mixed: any mental health service specifically for the care for older people
(generally over 65 years) with either functional or organic mental illness
Methods: working age adults The audit standards The standards were drawn largely from two sources: • The Royal College of Psychiatrists’ Guideline ‘The Management of Imminent Violence’
(1998)3. • The NICE Guideline ‘The short-term management of disturbed/violent behaviour in
psychiatric in-patient settings and emergency departments’ (2005)3. The audit tools A range of approaches were used to gather feedback from all groups of people who were likely to be affected by violence or the threat of violence, either through residing in, working in, or spending significant amounts of time in the participating wards. The ‘unit of analysis’ throughout the programme was the individual ward. • Contextual data: a proforma was used to gather systematic information about the
participating wards to support bench-marking and networking. • Module 1: an anonymised questionnaire survey for staff, patients and visitors to the
wards. The questionnaires examined the supports that each group received to maximise safety, and minimise risk that a violent incident would occur. Each questionnaire contained a mixture of closed ‘yes/no’ questions, and free text boxes for comments. Local project teams were guided to aim for a response rate of at least 50% from staff, and 20 questionnaire returns from patients5.
• Module 2: an environmental audit where staff and non-staff teams rated the environment
against a set of evidence-based standards and agreed ideas for improvement.
5 If the ward was very small and/or had a long-length of stay, individual advice was given about adjusting this target.

The Healthcare Commission National Audit of Violence 2006-7 Final Report – Working Age Adult Services
19
• Module 3a: the structured review of a series of up to three violent incidents, where staff groups worked through a ‘good practice’ framework, and agreed an action plan for improving the management of future incidents.
• Module 3b: an audit of case notes/drug charts relating to the use of rapid tranquillisation. The audit programme Once Trusts and organisations signed up to the audit programme, they were sent a ‘Project Management Pack’ which detailed the main elements and materials for the programme, including guidance on how to set up the project locally. As part of this, they were encouraged to establish a local project team who would oversee the programme of work. It was advised that this team had strong leadership and direct links to its trust board, or equivalent, to ensure that the process of and outcomes from the audit would be supported. The programme began with a series of regional events where these local teams were brought together to learn about the programme and begin planning how they would manage and support it in their own organisations. The data collection period differed for each module of the programme. The contextual data were gathered at the beginning of the programme, collated according to service ‘type’, and circulated to participants to support them to identify possible benchmarking partners. The collection of Module 1 data ran from October 2006 to the end of January 20076. Data collection for Module 3a ran throughout, beginning in October 2006 and ending at the end of February 2007. Data for Modules 2 and 3b were collected between the beginning of January and the middle of March 20077. The audit reports Reports were sent out at the end of each phase of data collection: • Contextual data: each participating trust/organisation was sent a breakdown of the
national summary tables (Appendix 4). • Module 1: participating wards that completed data collection during the originally
specified deadline, i.e. before the end December 2006, were sent a report containing their quantitative and qualitative local findings. Wards that completed data collection at the end of the period were sent one report containing both their local and the national findings.
• Module 2: each trust/organisation was sent a table detailing their compliance with each
standard by each participating unit. In addition, they received a copy of the overall national findings. Participants also received an analysis of the overall qualitative data, detailing the types of problems people were experiencing, relative to each standard, ideas for improvement, and ‘good practice’. Reports of the national quantitative data, broken down according to service ‘type’, were available on request (Appendix 6).
• Module 3a: the background information about each incident, i.e. gender, age, ethnicity of
patient, what forms of violence were involved e.g. pushing, hitting, was collated and presented according to service ‘type’. Participants also received an analysis of the overall qualitative data, detailing the various interventions that had been identified to address short-falls in practice.
6 The original deadline of the end of December 2006 was extended at the request of the majority of participants. 7 The original deadline of the end of February 2007 was extended at the request of the majority of participants.

The Healthcare Commission National Audit of Violence 2006-7 Final Report – Working Age Adult Services
20
• Module 3b: only wards that collected data on 5 patients received a local report which compared their percentage compliance with each standard, relative to the national figure (Appendix 7).
The audit data Module 1 survey Of the original 145 wards who committed to participate in the audit, 137 completed Module 18. Nationally, the survey generated a sizeable response. Respondent Group National Acute PICU Forensic Rehab Nursing staff i.e. qualified/unqualified/student nurses
1809 1097 275 318 82
Clinical staff e.g. psychiatrists, occupational therapists, psychologists, pharmacists, managers, social workers, clinical audit staff
358 226 57 57 12
Non-clinical staff e.g. administrators, domestic, catering, portering, maintenance staff
229 159 20 38 9
Patients 1025 751 106 124 44 Visitors e.g. family members, benefits officers, religious leaders
424 285 64 58 17
TOTAL 38459 2518 522 595 164 In addition to the quantitative data, the comments from the questionnaires generated 8164 individual comments from participants. These varied in length from one line to half a page. Module 2 audit of the environment The local and national results were sent out in May 2007 based upon data received from 177 wards (working age adults and older people’s services). There were 117 cases from working age adult services, as detailed below:
National Services for Working Age Adults = 117
Acute 76 PICU 21 Forensic 15 Rehab 5
Module 3a Eighty-eight wards entered data for module 3a, 59 submitted the recommended 3 cases.
National Services for Working Age Adults = 88
Acute 55 PICU 17 Forensic 14 Rehab 2
8 Of these 137, 127 submitted enough data to receive a local report. One ward submitted data after the national deadline. 9 The overall total number of returns presented by ‘ward type’ does not add up to the overall national figures for working age adult services. This is because the analysis by ‘ward type’ was carried out as a secondary analysis and at that time, it became apparent that some wards for older people had, in error, completed the questionnaire for working age adults, and vice versa. This data was subsequently removed and accounts for the difference of 46 across all respondent groups. However, with such a large total number of respondents, the removal of these cases would have little effect on the overall national results.

The Healthcare Commission National Audit of Violence 2006-7 Final Report – Working Age Adult Services
21
Module 3b The local and national results were sent out in June 2007, based upon data received from 95 individual wards, 65 submitted the minimum 5 cases required to receive a local report.
National Services for Working Age Adults = 95
Acute 60 PICU 20 Forensic 14 Rehab 1
Copies of the various reports and a database of local action plans can be found on the programme’s web pages: www.rcpsych.ac.uk/nav. Any other queries should be addressed to the project team at: [email protected].

The Healthcare Commission National Audit of Violence 2006-7 Final Report – Working Age Adult Services
22
National Findings Contextual information The results are available in full, for England (n=116 wards) and Wales (n=15 wards) on the National Audit of Violence website www.rcpsych.ac.uk/nav-reports. Note: due to the small number of Welsh wards, extreme caution should be exercised in interpreting the comparative data. Location: the majority of wards in both England and Wales were located in a mixed urban/rural location (England=66%, Wales=73%). Bed state: the numbers of beds per ward ranged from 5-32 in England, and 4-38 in Wales. In England the majority were operating with a bed occupancy of less than 100% (mean=93%); this figure was similar in Wales at 92%. Numbers of patients detained under the Mental Health Act: although numbers ranged considerably in both countries, (England=0-25, Wales=0-16), the mean number of detained patients was similar (mean England=10, Wales=7). Numbers of consultants with allocated beds: with a similar mean of 4 in England and 3 in Wales, the greatest difference was evident in terms of relative range (England=0-22, Wales=0-10). Recruitment and retention of nursing staff: the mean number of funded qualified posts was the same in both countries (15), the range was also close (England=4-37, Wales=7-32). The same gap was apparent in relation to the mean number of filled qualified posts, (England=13, Wales=14). In relation to funded unqualified posts, although the mean figure was lower in England than Wales (11, relative to 13 per ward), their ranges were similarly broad (3-34, England, compared with 6-28, Wales). In both countries, the mean number of unfilled posts after both 3 and 6 months was low (England=1, Wales=0). Administrative support: while the same percentage of wards could expect to receive over 30 hours of admin support (47%), Welsh wards were more likely to have no admin support at all, compared with their English counterparts (10% in England, 27% in Wales). Policies and procedures: wards were asked about whether they had in place various policies and procedures relating to the prevention and effective management of violence. • Risk assessment and management: in both countries, levels of compliance with these
standards were reassuringly high (assessment: England=90%, Wales=100%, management: England=97%, Wales=100%).
• Alarm systems well-maintained: compliance rates were better in England than Wales (England=97% and Wales=80%).
• Accessibility of doctor to attend alarms: for this standard, rates were similarly poor at 71% for England, and 80% for Wales.
• Systems for post-incident support review: again, the figures were lower in England (86%) compared with Wales (93%). Wards were also asked whether staff, patients who were involved, carers/family, other patients, and visitor witnesses were able to access these supports. With the exception of staff involvement, where the figures were similar (England=88% and Wales=87%), results were consistently lower in England, compared with Wales: patients who were involved: England=67%, Wales=87%; carers/family:

The Healthcare Commission National Audit of Violence 2006-7 Final Report – Working Age Adult Services
23
England=55%, Wales=60%; other patients: England=47%, Wales=60%, and; visitor witnesses: England=42%, Wales=43%.
• Searches of patients: the results were similar in England (97%), compared with Wales (93%).
• Children visitors: the margin of difference was greater for this standard, with compliance rates of 95% and 87% (England and Wales, respectively).
• Observing high-risk patients: the results were, again, similar (England 98%, compared with Wales, 93%).
• Safety of women: both countries rated disappointingly low, though more so England, with compliance rates of 48% compared with Wales (60%), although it should be noted that in England, 14% of the wards were male-only.
• Using/recording restraint: compliance rates were higher in England compared with Wales (99% and 87%, respectively).
• Using/recording rapid tranquillisation: the gap narrowed in relation to rapid tranquillisation, with 83% of English wards and 80% of Welsh wards rating this standard as ‘met’.
• Using/recording seclusion: in England, 96% of wards were able to rate this standard as either ‘met’ or ‘not applicable’. In Wales, however, 13% of wards rated the standard as ‘unmet’.
• Locking the ward: in England, 95% of wards either met this standard or rated it ‘not applicable’, compared with 80% of Welsh wards.
• Preventing and dealing with harassment and abuse: compliance rates were similar in England (91%) and Wales (87%).
• Supporting patients with disabilities: the margin of difference between the two countries widened with Wales rating this standard as 80% ‘met’, compared with only 57% of English wards.
• The provision of staff training relating to the short-term management of disturbed/violent behaviour: compliance rates were high at 99% for England and 100% for Wales, however, the level of detail contained in the policy varied, specifically: in England, 91% of policies specified the level of training (based on risk assessment), a similar figure to Wales (87%). In England, 93% of policies specified how often staff should receive training (compared with 87% in Wales). In England, 92% of policies described the techniques that would be taught (compared with 100% in Wales), and in England, 91% of policies specified the need for annual refresher training, compared with 93% of Welsh policies.
• Protocol to ensure police and staff are aware of the procedures and roles in emergency situations: only 65% of English wards met this standard, compared with 75% of Welsh wards, though some English wards clearly did not have reason to work with the police and rated this standard as ‘not applicable’ (3%).

The Healthcare Commission National Audit of Violence 2006-7 Final Report – Working Age Adult Services
24
Findings from Modules 1 and 2 Presentation of findings • The table at the beginning of each section relates to the Module 1 national survey data for
services for adults of working age. Each number indicates the percentage of the total number of respondents from each respondent group, i.e. nursing staff, patients who answered ‘yes’ or ‘no’ to each question.
• The text beneath each table offers a summary description of the overall trends across the different respondent groups, and between the different service ‘types’, i.e. acute wards, forensic wards etc. Please note: caution should be exercised in weighting the responses from smaller service type and/or respondent groups (please refer to the table on page 20, for further details). Particular trends that have emerged from the data will be raised in the Discussion section.
• Where appropriate, anonymised quotes from Module 1 have been used to illustrate the themes that came out of the qualitative data.
• Additional data has been drawn from the Module 2 Environmental Audit.
Notes about the report • Percentages are presented without decimal points (e.g. 56%, rather than 56.4%),
meaning that some totals will be 99% or 101%. • Quotes have undergone a standard spelling and grammar check but otherwise remain
unchanged. Any comment that may have identified an individual or ward has been modified to protect anonymity; this is indicated by [].
• One of the key aims of the audit is to support services to make improvements by comparing their local findings with the national figures, and developing action plans that will help them to deliver positive changes. The audit data was collected between October 2006 and February 2007. It is hoped that the some of the problems identified through the audit will already be the subject of local improvement programmes.

The Healthcare Commission National Audit of Violence 2006-7 Final Report – Working Age Adult Services
25
Setting the scene Experiences of severely challenging/violent behaviour in wards and its management All respondent groups were asked about their experiences of severely challenging/violent behaviour on the ward, and their perceptions of how these incidents were managed. Firstly, three graded questions were asked to establish the severity of incidents. • Have you personally been made to feel upset/distressed by a patient’s severely
challenging/violent behaviour? • Have you personally been threatened or made to feel unsafe? • Have you personally been physically assaulted?
Upset/distressed Threatened/made to feel unsafe
Physically assaulted
Yes No Yes No Yes No Nursing staff 58 42 72 28 46 54 Clinical staff 37 63 44 56 13 87
Non-clinical staff 27 73 33 67 8 92 Patients 45 55 34 66 18 82 Visitors 17 83 14 86 3 97
Amongst nursing staff, nearly one-half said that they had been physically assaulted, and almost three-quarters said that they had been threatened or made to feel unsafe. The pattern that the ‘threat of violence’ was more common than ‘actual assault’ was evident across all respondent groups. For patients, almost one-half had experienced violence that had upset or distressed them, and one-third had felt threatened or unsafe, but only 18% had been physically assaulted – a high percentage, but substantially lower than for staff. The likelihood of visitors being exposed to violence of any type was lower still, relative to the other groups. Not surprisingly, over 750 people commented on this subject. Findings by ward type In acute wards, relative to all ward types, nurses and visitors in acute wards were most likely to have felt upset/distressed (nurses: yes=61%; visitors: yes=20%), and visitors were most likely to have been threatened or made to feel unsafe (18%). Patients, however, were least likely to have been physically assaulted (15%). In forensic wards, patients were most likely to have felt upset/distressed (58%). While non-clinical team members were least likely to have been threatened or made to feel unsafe (11%), patients were most likely of all ward types (49%). In relation to physical assault, all three staff groups were least likely to have experienced this form of violence (nurses: yes=33%; clinical staff=7%; non-clinical staff=0%), yet the patient rating was close to highest at 25%). In PICUs clinical staff were most likely to have felt upset/distressed (yes=41%), whilst their non-clinical colleagues rated themselves as least likely (yes=21%). Nursing staff and members of the clinical team were most likely to have been threatened or made to feel unsafe (78% and 57%, respectively). The risk of physical assault for nurses, clinicians and

The Healthcare Commission National Audit of Violence 2006-7 Final Report – Working Age Adult Services
26
patients was greatest in PICUs (yes=61%, 22%, 26% [joint with rehabilitation wards], respectively). In rehabilitation wards, clinical staff and patients were least likely to have felt upset/distressed (17% and 39%, respectively), though their non-clinical colleagues were most likely to have answered ‘yes’ (67%)10. Nurses, clinical staff, patients and visitors were least likely to have been threatened or made to feel unsafe (62%, 25%, 24%, and 0%, respectively). Contrastingly, non-clinical staff were most likely to have answered ‘yes’ (44%). Non-clinical staff and patients were most likely to have been personally assaulted (11% and 26% [joint with PICUs], respectively), compared to visitors who were least likely to have answered ‘yes’ (0%). The frequency of incidents Although the data showed that the level of violence on psychiatric wards was generally high, this was clearly not the experience of every ward that took part in the audit. Both the quantitative and the qualitative data indicated that the occurrence of violence was rare on some wards and, when it did happen, staff worked well together to manage the incident, as these quotes describe: “The ward has been peaceful.” (a patient) “Incidents are fortunately rare.” (a member of the clinical team) “The incidents that I have been personally involved in that required C&R have been well controlled and have ended up with no injury to anyone. Perhaps 3 times in a year.” (a nurse) “I have not witnessed any violent behaviour but the staff appear confident and calm when dealing with distressed patients.” (a visitor) “There have been occasions where I have felt threatened; the support of the team has been excellent always.” (a member of the clinical team) Unfortunately, the majority of comments referred to (increasingly) high levels and/or severity of violence on wards, as these quotes from nurses illustrate: “The times when you are waiting for something to happen are getting closer together which does add pressure to the work environment.” “These have increased both in ferocity and severity. Staff have been injured on [Ward A] (serious), on [Ward B] (serious) on [Ward C] (serious). It appears nothing has been done to save or improve the situation. These wards are a disaster waiting to happen - no question about it.” “Patients kicking doors, shouting at staff, swearing and name calling are very common on my ward.” “Staff are forced to take abuse from patients physical and verbal. Lately more staff have been injured in just one year than in three previous years combined!!”
10 Caution should be exercised in interpreting this result as the overall sample size was 9 people

The Healthcare Commission National Audit of Violence 2006-7 Final Report – Working Age Adult Services
27
A number of respondents described factors that they felt contributed to these increases. These will all be discussed more fully in later sections of this report. “Challenging and violent behaviour is a regular occurrence on this ward. It is usually dealt with effectively by staff, however when the skill mix is poor and lots of agency staff are used who are not C&R trained, situations often become increasingly dangerous. Consequences of this are not always recognised fully enough by senior management.” (a nurse) “Challenging behaviour appears to be more frequent in past year. This may be due to the more acute patients admitted to the ward as less ill patients are dealt with by crisis intervention team. It also appears that there is a lack of availability of ICU beds which necessitates patients being cared for inappropriately on an open ward for longer periods of time than they should be.” (a visitor) “The frequency appears to be increasing, as of the last 5-10 years, and it appears to be more related to the incidence of substance use. Patients are often younger and first presentation and do not have age-appropriate activities. There is often a lack of opportunity to take patients off the ward to have a walk or be involved in physical activity.” (a nurse) Personal experiences of severely challenging/violent incidents Large numbers of respondents described their own experiences of violence on the ward. Physical assault: more than 70 people from across all groups described having been assaulted. Their experiences ranged widely in terms of the severity, frequency and outcome of the incidents, as these quotes illustrate: “I have had several episodes of patients trying to attack me but other staff successfully intervening, for example, during seclusion reviews.” (a member of the clinical team) “At times during the last 18 months I have been involved in many violent incidents, during these incidents I have been spat at, punched to the body area, and bit on the shoulder which drew blood.” (a nurse) “A guy I was sitting with and had not spoken to before was under a delusion I was calling him a thief, he followed my trail from outside to the staff desk and tried to attack me. I put him to the ground and held him and called for the staff.” (a patient) “I have been attacked twice in the past year, once in the clinic room where a patient attempted to break my neck.” (a nurse) “I was punched in the head. The other staff on duty that night were also attacked and sustained injuries including a broken nose and severe bruising. All the members of staff involved were off sick for between 1 week and 3 months. I believe the staff involved acted with considerable bravery in managing to prevent further injuries to themselves, and also succeeded in preventing any other patients from being involved in the incident.” (a nurse) Being threatened or made to feel unsafe: large numbers of respondents described times when they had felt threatened or unsafe. These quotes describe some common experiences: “At times I have been frightened and scared for my safety on the ward and threats made to me about what some patients may do to me or my family off the ward.” (a nurse) “I have been threatened with serious violence on three occasions in the last year, but never assaulted.” (a member of the clinical team) “I have been verbally abused on the ward by male patients but due to my training in de-escalation skills I have managed the situation.”

The Healthcare Commission National Audit of Violence 2006-7 Final Report – Working Age Adult Services
28
A number of respondents expressed concerns about the dismissive way that non-physical violence was being dealt with on some wards: “Sometimes I feel that verbal abuse is not taken seriously enough, sometimes I feel that we are expected to take verbal abuse as just ‘part of the job’.” (a nurse) The impact of violence on individuals Spending long periods of time in an environment where there is a risk of violence would be challenging for most people. However, if a person has already been the victim of an aggressive or violent incident, the associated stress is likely to be amplified. Descriptions of how people responded to and coped with the threat of violence could be categorised under these broad headings: Avoid the source of threat “There have been some potentially serious incidents on the unit. This has made me feel very stressed and has made me question my nursing career.” (a nurse) “A female patient assaulted me by punching my shoulder about 3 weeks ago. I was given the opportunity to talk about this and was supported by my colleagues. It has changed the way I feel about this patient though.” (a nurse) Attempt to manage your personal anxiety “As someone who has been severely assaulted (not in hospital) I became extremely anxious if violent behaviour takes place close to me.” (a patient) “Everyday life is daunting and psychologically traumatising.” (a nurse) “[I] find the physical and verbal aggression difficult to cope with. Can be upsetting at times, feel out of my depth, unsafe, and it definitely acts as a barrier to the therapeutic process.” (a member of the clinical team) Mask your true feelings “There can often be a 'macho' reaction towards violent and challenging behaviour and its effect on staff. Staff are often wary of expressing how they feel.” (a nurse) “Being on the ward when an incident occurs is upsetting, especially if someone was (badly) hurt. I think that gets forgotten as we ‘normalise’ it a lot. This is especially true for patients who often don't have others to confide in.” (a member of the clinical team) “The impact upon the patients is often forgotten. Staff become rapidly used to dealing with violence and often forget the impact it has on others who are encountering this for the first time.” (a member of the non-clinical team) The impact of violence on the team The consequences of day-on-day violence – whether verbal or physical – cannot be over-stated. As well as the personal costs for those involved, whether physical or emotional, there are consequences for those who witness these incidents, as one nurse explained: “This unit has a good team but we are burning out.” Some quotes from staff communicated a sense of hopelessness, with individuals – like this nurse – seemingly accepting their experiences as inevitable:

The Healthcare Commission National Audit of Violence 2006-7 Final Report – Working Age Adult Services
29
“I have been verbally abused on many occasions in fact I tend to feel like its part of the job now, which is a real shame because no one should have to be made to feel like that.” In contrast, other people strongly challenged this tendency to accept violence on wards as ‘unavoidable’: “It is upsetting when you have been hit and challenged many times. The managers say that the client is mentally ill and we should accept this, I do not believe that this is acceptable in any shape or form.” (a nurse). “I believe that staff should have a better approach towards patients who are violent. Instead of using the excuse that the patient is ill because violence should not be condoned at all.” (a patient) “Staff and other professionals rarely press charges when becoming victims of aggression. [It] appears that if you have any mental health problems this gives people the right to abuse staff. We are also members of the public who provide a difficult service and I feel let down by the NHS because it does not take violence against psychiatric nurses seriously.” (a nurse) Triggers for violence Non-staff groups (patients and visitors) were asked what they felt ‘triggered’ violence on the ward. Almost 500 people chose to comment. There were several common emerging themes. Firstly, people spoke about confinement - lack of space on the ward and limited access to outside areas and escorted leave as these respondents explained: “Unavailability of staff to take you out on escort so you are cooped up in a noisy, hot, unpleasant environment.” (a patient) “Cabin fever. Not enough staff to take patients off ward and outside!!” (a visitor) “Frustration of people living in a confined space, sharing rooms, lack of liberty.” (a visitor) Secondly, people felt illegal drugs and alcohol played a part in violent and aggressive behaviour on the ward: “I have suffered physical injury during an assault by a patient. I felt angry about this as although the patient was unwell he was like this because of his use of illicit drugs. This was not the first time he had assaulted people.” (a nurse) “If patients are fearful or terrified they may kick-off. If they are having a reaction to illicit drugs they may become violent.” (a visitor) Access to cigarettes and not being able to smoke on the ward was also a factor, as these people described: “No cigarettes - patients constantly asking each other for them.” (a visitor) “Not being able to go out for cigarettes when they [want] or short of it.” (a patient) Thirdly, patients described feeling like they were not being listened to by staff, and visitors explained that staff shortages meant that some patients were not having their needs met:

The Healthcare Commission National Audit of Violence 2006-7 Final Report – Working Age Adult Services
30
“There are not enough staff on the ward, in other wards too many patients and not enough staff. This makes it impossible for staff to satisfy all patients' needs and they become aggressive.” (a visitor) Fourthly, respondents described problems associated with boredom and the lack of activities, as one visitor explained: “Boredom...excessively long times doing nothing, but thinking.” Finally, people felt mental illness itself could be a trigger for violence and in particular a mix of patients on the ward with different illnesses and at varying stages of illness, as this patient described: “Very ill patients and recovering patients on same ward, too many areas where very ill and recovering patients interact without supervision.” Other less commonly occurring themes were: excessive noise, e.g. loud music, shouting, screaming; staff attitudes and behaviour; patient conflict; rules and restrictions; gender and age mix; problems around prescribed medication; lack of access to information and poor ward environment. The management of violent incidents Respondents were asked about their perceptions about the management of incidents, firstly between patients and then, towards staff from patients.
Between patients
Towards staff from patients
Yes No Yes No Nursing staff 94 6 87 13 Clinical staff 94 6 91 9
Non-clinical staff 97 3 94 6 Patients 80 20 84 16 Visitors 90 10 92 8
Encouragingly, a considerable number of people (approx 60) make the point that they had not experienced violence and therefore could not comment on its management. “I have not seen any violence on the ward since my admission in May 2006 and feel that the ward is a safe and comfortable environment.” (a patient) “I have been knowledgeable about violent behaviour in past but in the last 2 weeks of being here, I haven't experienced any upsetting behaviour.” (a patient) The large majority of all staff felt that violence between patients was being managed effectively, however, a relatively high 20% of patients disagreed. The findings ranged across service types from a maximum of 24% in forensic wards, to a minimum of 7% in rehabilitation wards. In relation to the management of violence towards staff, there was little variation in the ratings from nurses and clinicians (maximum=90% and 96%, respectively in PICUs; minimum=85% and 89%, respectively in acute wards). However, patients in forensic wards and PICUs were considerably less likely than patients from acute or rehabilitation wards to rate the management of violence towards staff as inadequate (forensic=28%; PICUs=21%; acute=14%; rehabilitation=5%).

The Healthcare Commission National Audit of Violence 2006-7 Final Report – Working Age Adult Services
31
Interestingly, compared with the violence between patients, staff were less likely to agree that the violence towards staff was being dealt with effectively, whereas patients were more likely to feel these type of incidents were being managed effectively. Over 850 respondents commented. Violence between patients: a small number of people, predominantly patients, expressed concerns about the way staff managed violence between patients, namely: failure by staff to intervene at an early stage (sometimes because of staff shortages); staff refusing to deal with their concerns at all, and; staff behaving in ways that contributed to the escalation of violence. Violence towards staff: again, few people commented specifically about the mismanagement of violence towards staff. Where they did, it was generally ward staff complaining that they had felt let down by one of three potential support systems: their senior managers; their consultant colleagues; the police. Some typical quotes from nursing staff: “I believe that staff on the ward deal effectively with severely challenging/violent behaviour, but are let down by senior management, who for example, will often not authorise extra staff to be drafted in following the admission of a patient with potentially challenging/violent behaviour.” “Frustrating for staff as most assaults on staff get swept under the carpet as patients have ‘immunity’ or diminished responsibility.” “As a team I think we deal with challenging and violent behaviour very well, however we have a no tolerance policy which is often not backed by the doctors and the police never take any action despite reports. We have even activated a 999 call and the police have not responded.” The use of physical interventions too quickly All groups were asked whether they felt that any of a range of physical interventions were being used “too quickly” to manage severely challenging/violent incidents.
Using medication Using hands-on restraint
Using seclusion
Yes No Yes No Yes No Nursing staff 13 87 8 92 6 94 Clinical staff 24 76 11 89 5 95
Non-clinical staff 8 92 5 95 4 96 Patients 38 62 30 70 25 75 Visitors 21 79 15 85 12 88
Interestingly, two of the three groups who were most likely to be exposed to violence on the ward because of the amount of time that most spend there (nursing staff and non-clinical staff) were least likely to agree that either medication or restraint was being used too quickly. However, the third group with greatest exposure to violence (patients) - were most likely to agree. In relation to the use of seclusion, there was far greater consensus between the staff groups in their ratings. Across the ward types, patients in PICUs were most likely to feel that all three interventions were being used too quickly (medication: yes=47%; hands-on restraint: yes=35%; seclusion: yes=32%). Over 420 people made comments that related to these questions, the majority of which described the reasons why they believed interventions were being used too quickly.

The Healthcare Commission National Audit of Violence 2006-7 Final Report – Working Age Adult Services
32
Most frequently mentioned was the impact of low staffing levels on the ward, meaning that staff did not have time to de-escalate situations and resorted instead to using quicker methods, as these staff explained: “Lack of time and staff to pursue other interventions (I know this is terrible!).” (a nurse) “Low staffing levels have eroded staff confidence. They have little faith that they will be able to deal with difficult situations.” (a member of the non-clinical team) “Because staff are not able/or do not spend enough time taking the opportunity to build a relationship with their patients.” (a member of the clinical team) A second commonly cited reason for using physical interventions too quickly was that staff lacked skills in using non-physical methods. This was linked to a range of factors: lack of experience; poor confidence, and; the absence of training in non-physical interventions. A third reason was the desire to make the situation safe, as this nurse explained: “Most of the time, the patients are severely distressed and quite threatening and medication or hands-on restraint is used to safely manage the patients and to maintain a safe environment for the patient and others.” A fourth and worrying reason that was offered by several respondents, was that physical interventions were ‘easy’, or ‘a quick fix’. These comments were generally linked to inadequate staffing levels and/or skills mix - but not always. Some respondents were clearly describing a ward culture where overly aversive approaches to managing violence were still happening, as these quotes described: “Medication is a quick fix and sometimes the patients demand PRN even when they do not really need it. Some staff have the attitude ‘it’s prescribed so I might as well give it’.” (a nurse) “Cannot be bothered to take time to use de-escalation techniques. For a quiet shift.” (a nurse) “I feel it is used too often and for too long as it is easy option for ‘keeping the peace’." (a visitor) A range of other less commonly cited reasons were given for physical interventions being used too quickly: to ‘calm’ or ‘bring control’ to the situation; because the environment could not support less aversive approaches, e.g. the lack of de-escalation facilities; because the staff enjoyed the sense of ‘power’ that using physical interventions brought. On a more positive note, rather than criticising the over-use of physical interventions, a number of respondents opted to comment on the positive benefits of using non-physical approaches, like this visitor: “My son can usually be talked out of being violent, most of my family can do this and we have not received any training. At sixteen, my son is very frightened, often he needs reassurance not restraint.” General observations relating to the management of violence The large majority of comments (approx 250) spoke positively about the way that staff managed incidents on the ward. Some staff described their management strategies, many making it clear that they were acutely aware of local policies and procedures: “Staff use physical restraint as the very last resort, many opportunities such as one-to-one time and time-out are offered to patients beforehand (obviously depending on the nature of

The Healthcare Commission National Audit of Violence 2006-7 Final Report – Working Age Adult Services
33
an incident). Nursing staff also take time to discuss things through with the patients if PRN medication is required, it is not just given, it is only administered when there is a genuine need to do so.” (a nurse) “Very well-managed in a professional manner following NICE 2005 guidelines and Trust policy.” (a nurse) “I see the nursing staff on my wards talking and controlling patients calmly when they are angry/challenging and abusive towards them. They are very patient and very good!” (a member of the clinical team) Good practice was widely commented upon by all non-staff groups – visitors to the ward, patients, and even patients who had been at the ‘receiving end’ of nursing interventions! “[The ward] uses de-escalation techniques before resorting to restraint or seclusion. If the latter are necessary it is only for the briefest period required to calm the situation down. Patients are encouraged to ask for PRN if feeling distressed or agitated, they are encouraged to take control and manage their distress in a way that is acceptable to them. Staff administer medication only if other methods have failed.” (a visitor) “Severely challenging/violent behaviour has been observed whilst I have visited. At all times the staff have tried to calm the patient - by quiet persuasion. I have not witnessed a 'quick' action.” (a visitor) “Staff handle situations pretty well actually. I haven't felt scared on the ward this time.” (a patient) “Staff seem to suss out trouble before it starts.” (a patient) “I was very abusive. Foul language, filthy talk, etc, violent when I was first admitted to the ward. I have calmed down a lot and hope I have improved. But in spite of my behaviour I was treated well.” (a patient) The data gave a strong sense that practice in relation to the prevention and management has not only improved, but that this was widely recognised and highly valued. Many of the comments reflected professional pride, and personal appreciation: “Staff [are] becoming more skilled in being pro-active and managing incidents before they occur and use as required medication appropriately. Low stimulus environments are used. There is no robust/secure room and no seclusion has been used for about 10 years.” (a nurse) “Staff here have great skill in dealing with situations. This seems to be something that has developed partly through training but from role modelling by senior staff and also I feel due to the personalities and caring of team members.” (a nurse) “Staff are kinder and more helpful than before. Don’t wind us up so much, and not so much in your face, take more time to listen and understand now - not just give meds like before.” (a patient) “From what I have seen, staff did what was required to the best of their ability and in the best interests of the patient.” (a patient) “Staff manage behaviour very well, under the pressure staff work under, right down to domestics, staff get verbally abused 24/7, I take my hat off to all staff working in this environment.” (a visitor) “They have always dealt with incidents of that nature with great respect and professionalism towards the service user. They are very collaborative and it shows that they know exactly

The Healthcare Commission National Audit of Violence 2006-7 Final Report – Working Age Adult Services
34
not only what to do in an emergency but also how to behave in order to limit the impact on visitors and patients.” (a visitor) Where less positive comments were made about the ways that staff managed violent incidents, a range of contributory factors were described: problems associated with the staffing on the ward i.e. the skills mix, staffing levels, gender of ward staff, or impact of reliance on bank/agency staff; staff not having received adequate training; the failure of back-up systems; environments that did not lend themselves to effective de-escalation, and occasionally, comments about staff attitudes or behaviours that might have exacerbated situations (though this was generally associated with lack of skill or training). Some quotes that described a few of these problems: “We cope to the best of our ability considering that we do not have the facilities or staff.” (a nurse) “Sometimes we do not give the patients enough time to explain themselves. Because the ward is busy, we are trying to resolve everything too fast, and sometimes wrong decisions are made.” (a nurse) “Staff are showing signs of burnout. High staff turnover in last year. Unit relies on agency staff to manage challenging/violent behaviour. This leads to problems with differing control and restraint techniques. Frequent use of non regular staff is disruptive.” (a visitor) “Some staff do not notice that raising their voices when negotiating with clients does not de-escalate situations and instead leads to violence.” (a nurse) Overall, the data indicated that considerable progress has been made in this area over the last few years, with ward staff becoming increasingly skilled at preventing and de-escalating potentially volatile situations, but, as this nurse explained, improvement takes time: “[The] culture has changed in past 2 years. Staff more skilled in de-escalation. Less quick to restrain and medicate. Some older staff find this difficult to alter way of thinking and managing things.” Reporting an incident of staff abuse towards a patient All respondent groups were asked whether they would feel comfortable to confidentially report an incident of staff abuse towards a patient. Reassuringly, the large majority of staff and visitors answered ‘yes’. Findings were fairly consistent across ward types. Although 26% of patients answered ‘no’ to this question, very few commented. Where they did, it was usually to suggest that they would report such an event to some staff, but not to others.
Yes No Nursing staff 92 8 Clinical staff 93 7
Non-clinical staff 93 7 Patient 74 26 Visitor 92 8

The Healthcare Commission National Audit of Violence 2006-7 Final Report – Working Age Adult Services
35
Concluding comments on experiences of severely challenging/violent behaviour in wards and its management National levels of experienced violence were high. Many respondents reported not only the heightened frequency of incidents, but also the increased severity - in extreme cases involving weapons. Those who had been exposed to violence spoke graphically about its impact – whether they had experienced physical assault or verbal abuse/threat. It was evident from the data that more needed to be done to minimise the risk of violence through the reduction of environmental stressors and by ensuring that the people residing, working and spending time in wards received appropriate supports. The data also revealed positive results: it was clear that recent national policy and practice drivers that have emphasised the use of prevention and de-escalation, rather than physical interventions, were firmly embedded in ward-based practices in many services. Staff, patients and visitors were aware of this changing culture and were responding positively to it.

The Healthcare Commission National Audit of Violence 2006-7 Final Report – Working Age Adult Services
36
An overview of current practice
How organisations support people in unsafe environments The 1998 and 2005 Guidelines3 identified a range of ways in which staff, patients and visitors can expect to be supported to minimise the risk that they will experience violence on the ward. The audit asked the various respondents groups about the extent to which these supports were available to them. Some standards applied to all respondent groups, others to specific groups.
Being treated with respect and dignity and given privacy and choice (patients) Patients in working age adults’ services were asked a series of questions about their experiences relating to different aspects of respect, privacy, dignity and choice on their ward. As well as answering these questions, 343 people provided additional comments. Medication Firstly, patients were asked about whether they had privacy when they were being given their medication. A disappointing 41% said that they did not. Problems were greatest in PICUs (44%) and least in rehabilitation wards (9%). The main source of complaint was queuing for medication, as these people described: “You have to get up in night clothes and go and queue for night medication.” “Done in front of everyone!” “I personally feel having to queue up to receive medication quite humiliating and depressing.” Patients were then asked whether they had ever asked to have their medication reviewed. One-half of respondents said that they had and an encouraging 72% reported that their request had been met. Of the remaining 28%, only a few commented, mostly to describe how their requests had not being listed to, or had been ignored: “Have never had a choice about my medications and needs.” “When I asked to have my medication reviewed, I was told it would happen the following week but it didn't and my requests were ignored.” Opportunities to go outdoors/leave the ward Patients were asked whether they had opportunities to go outdoors/leave the ward: a concerning 21% said that they did not. PICUs scored most poorly (no=34%) compared with rehabilitation wards (no=0%). The associated comments described the limitations faced by patients, most commonly, staff being too busy, or there not being enough staff to take people out on escorted leave.

The Healthcare Commission National Audit of Violence 2006-7 Final Report – Working Age Adult Services
37
Relationships with staff Patients were asked whether they were able to speak to staff when they needed to, for example if they were concerned or upset, and a reassuring 88% answered ‘yes’. This figure was highest in rehabilitation services (100%). Additionally, over three-quarters of patients agreed that their concerns had been taken seriously and were acted upon (77%). Again, the findings from rehabilitation and PICUs were in stark contrast (rehabilitation=91%; PICUs=67%). Several patients commented positively about their contact with staff, as the following quotes illustrate: “I'm happy with the staff because they all look after you and always ask how you are everyday and say if anything is bothering you don't hesitate to come up and talk to them.” “I felt the staff were always around when you needed to speak to somebody and you were always taken somewhere in private.” Where dissatisfaction was expressed, it generally related to staff being too busy to talk to patients, specifically on a one-to-one basis, and nursing staff spending too much time in the office, as this comment summarises: “The desk staff spend most of the time filling in charts and the nursing staff simply dispense medication and remain in the office. I feel like I am intruding if I knock on the office door. There is very little communication between staff and patients.” Involvement in choices and decisions Patients were asked about whether, when they were admitted to the ward, they were asked about (a) what they would and would not wish to happen if their behaviour became severely challenging/violent, and (b) their trigger factors and early warning signs of severely challenging/violent behaviour and how these should be managed. Only 21% answered ‘yes’ to the first part of the question, and 23% to the second. These findings suggest that many services have not yet begun to work proactively with patients to minimise the risk of violence through, for example, the use of advance statements. The range of responses to both questions was extreme, going from the low of acute wards ([a] 17%, [b] 19%) to the high of rehabilitation services ([a] 60%, [b] 51%). Being treated with dignity Patients were asked whether the ward respected their religious and cultural needs, e.g. religious festivals, diet. Across all ward types, 52% agreed that it had, and 36% rated it as ‘not applicable’. Particular good practice was evident in rehabilitation services, where 80% of patients answered ‘yes’ and 11% answered ‘not applicable’. Patients were then asked whether they had been cared for in a dignified manner and an encouraging 83% answered ‘yes’. A sizeable range in responses was evident across the ward types with only 71% of PICU patients answering ‘yes’, compared with 91% of patients from rehabilitation wards. Finally, they were asked whether their personal preferences, e.g. in relation to food and drink choices, going to bed, clothing etc, were respected. Twenty-one percent answered ‘no’ to this question. Again, rehabilitation services excelled with 100% of patients rating this standard as ‘met’. Although the large majority of patients felt that the standards relating to all three aspects of dignity had been met, they were far more likely to comment on any breach of personal dignity associated with their personal preferences, as these various quotes describe: “Enforcing a regime of when we should go to bed is ridiculous.” “It seems like dietary needs and allergies to food are not being properly catered for.”

The Healthcare Commission National Audit of Violence 2006-7 Final Report – Working Age Adult Services
38
“The menu is extremely limited in choice this is the only institution/organisation that I know of that has a one week repeat menu span which has remained unchanged for three years to my knowledge.” “There is no choice on this ward when to have a hot drink, you are expected to only be thirsty at certain times.” “It is demeaning to have to 'beg' for a cup of tea 6am, 7am or 3.30pm when 'tea times' have been missed by sleeping.” Concluding comments on respect, privacy, dignity and choice A large proportion of questions in this section were answered positively by the majority of patients, making a very clear and optimistic statement about the general treatment of patients on our wards. In general, the comments box was used to raise specific concerns. A number of problem areas were highlighted: • Local practices relating to the administration of medication. • The involvement of patients in decision-making about their own care, particularly in
relation to choice of medication and their preferred way of being managed in the event of their becoming violent.
• The involvement of patients in decision-making about aspects of how the ward is run e.g. mealtimes, choice of menu, availability of refreshments outside of mealtimes, waking times.

The Healthcare Commission National Audit of Violence 2006-7 Final Report – Working Age Adult Services
39
Being offered meaningful occupation (patients) The links between boredom levels and severely challenging/violent behaviour are well- recognised and documented. The audit asked patients a series of questions about the extent to which they were being given access to a range of activities. Over 350 people chose to comment on this section. Interaction, recreation and exercise Firstly, they were asked whether they had daily opportunities to take part in group interaction and/or recreation. Three quarters of patients agreed there were daily opportunities for group interaction and/or recreation, although many people commented on the need for greater frequency or choice in these group activities. This figure was lowest in acute wards (73%) and highest in rehabilitation wards (86%). Next, they were asked whether they had daily opportunities for physical activity/exercise. Only 54% of patients said that they had opportunities to take daily exercise. Findings were similarly poor in acute wards and PICUs (49% and 53%, respectively), but were better in forensic and rehabilitation wards (75% and 89%, respectively). This high level of dissatisfaction was reflected in the overwhelming number of requests for access to a gym, organised exercise and walks. Patients often linked these requests to the need to find ways to alleviate stress and improve mental well-being, as these comments demonstrate: “Would be nice to have a gym or some sort of physical exercise to get rid of pent up feelings.” “A gymnasium would be a real asset (treadmills etc) as I believe physical exercise is a real depression-buster.” Of those who did have access to a gym, there were often barriers preventing this from happening, as this patient commented: “Staff should be able to take patients to the gym. Not enough staff available to do this, need more staff.” Therapies and activities The Environmental Audit found that 26% of wards did not have an activity room on the ward. The survey asked patients whether they thought the choice of therapies and the choice of activities available during the day were adequate. 53% of patients thought that there were not enough therapies, and 48% that there were not enough activities during the day. For both questions, the highest scoring ward type was rehabilitation services (therapies: yes=81%; activities: yes=86%), and the poorest scoring was acute wards (therapies: yes=44%; activities: yes=48%). Many patients commented on having little or nothing to do, being bored, and not having enough information about what was going on, as these quotes illustrate: “[The ward] does need more and different types of activities so there would be something to probably interest different people to keep them occupied and stop the boredom and would keep wards more calm.” “More information should be available on therapies, e.g. timetables on the wall.” “There are things but there are not many times each one occurs.”

The Healthcare Commission National Audit of Violence 2006-7 Final Report – Working Age Adult Services
40
Patients made a number of suggestions for activities to keep them entertained, e.g. singing and dancing, day trips and access to computers. These were often put forward as an alternative to the monotonous activities about which people mostly complained, namely, watching TV, listening to music and reading. Finally, respondents were asked whether they thought that there was an adequate choice of activities available in the evenings and at weekends. The large majority - two-thirds of patients - did not think there were enough activities available in the evenings and at weekends. Again, the highest scoring area was rehabilitation wards (yes=59%) and the lowest was acute wards (yes=29%). A large proportion of the comments related to this question. Common themes from the qualitative data included: a lack of ward staff to provide activities at the weekend; the ward being too quiet because patients were on leave from the ward; the lack of occupational therapy support at weekends. Some typical quotes: “Definitely very little to do at weekends and evenings.” “Very little to do at the weekends. There are less staff on shift at the weekend and they are usually [more] concerned with doing paperwork than facilitating fresh air and exercise for patients.” “Especially at weekends, some people go home but those left on the ward are just left to their own devices. There's only the television to watch.” “Weekends are extremely boring due to lack of activities. If we (the patients) are occupied, the less time there is to 'ponder' and become bored.” Concluding comments on being offered meaningful occupation Boredom was still a problem on many wards. Large numbers of patients complained about the lack of daily exercise and the general absence of things to do, particularly in the evenings and at weekends. Encouragingly, just as many people offered constructive suggestions and ideas about how to alleviate boredom; most of these ideas would be inexpensive and relatively easy to implement. It is vital that wards address this area as a matter of priority; measures should also be put in place to ensure that activities and therapies are reviewed regularly so that the provision is appropriate to the current patient and staff mix.

The Healthcare Commission National Audit of Violence 2006-7 Final Report – Working Age Adult Services
41
Being given adequate information (patients) Patients were asked questions about their experiences in relation to a series of situations. Comments were received from 235 individuals.
Yes No Have you been given enough information about why you have been admitted to the ward?
72 28
Have you been given enough information about how the ward is run, for example visiting times, complaints procedure, ward rounds?
71 29
Are you satisfied with your involvement in decisions about your care (e.g. treatment and medication)?
67 33
Have you been given enough information about how to get advice or help from someone who does not work here, for example, an advocate?
60 40
Have you been put under close observation during your admission to this ward?
52 48
If you have been put under close observation during your admission to the ward:
Was the reason you were put under observation explained to you? 69 31 Were you told how long observation was likely to be maintained? 38 62
Admission Almost three-quarters of patients felt they had been given adequate information about the reason they were admitted. Responses varied between different wards types, from a maximum of 77% (rehabilitation wards), to a minimum of 60% (PICUs). A small number of comments from the remaining quarter of patients related to confusion about why they had been admitted. A greater concern was that a number of patients felt they had been inadequately informed about the operation of the admission procedure itself. These comments from two patients describe this experience: “Been given very little information on admission - toilets? teatime? meds? care plan? locker? I was shown to my bed and that was the best info I was given. Very unorganised.” “I felt I should been shown around the ward to know where the toilets/bathroom etc.” Ward information Seventy-one percent of patients felt that they had been given information about how the ward runs in general, which was commented upon very positively by most patients. The highest scoring ward type was rehabilitation (86%) and the lowest scoring was PICUs (66%). It was evident that in most cases, information was being communicated from staff to patients clearly and competently. These comments from patients demonstrate their satisfaction: “Any information given has always been very clear and if you do not understand they are willing to go over it again without getting frustrated until you understand it.” “I had lots of information given to me in help of my stay at the hospital. The staff are brilliant and really helpful.” “Comprehensive information. What I didn't know has been found out for me.” Another emergent theme was the request for this information to be displayed on a notice board or in a leaflet, as this patient explained:

The Healthcare Commission National Audit of Violence 2006-7 Final Report – Working Age Adult Services
42
“It would be nice to have printed information - visiting times etc. They have stopped putting up the menus on the wall”. The exception to this good practice in the provision of information was the finding that 40% of patients felt they had not been given any information about how to contact an advocate. Here, figures were poorest in acute services, where 43% of people said this had not been met, and best in forensic wards where only 21% answered ‘no’. However, almost all the comments suggested that the advocates introduced themselves independently. This could imply ‘good practice’, i.e. that the presence of advocates was highly visible on many wards and there was therefore no need for staff to distribute information. Alternatively, it could reflect the fact that staff were failing in their responsibility to make available information about the advocacy service. Involvement in care Seventy-six percent of patients were satisfied with their involvement in decisions about their care, with a range of comments given about their level of involvement - from having no involvement in treatment and medication whatsoever, to having been fully informed and updated about care planning. Again, the highest scores were from rehabilitation wards (84%) and the lowest PICUs (61%). Just over half of patients had been put under close observation during their admission to their ward: while a relatively high proportion of these (69%) said the reason why they were put under observation had been explained to them, a disappointing 62% had not been told how long this would be maintained. Concluding comments on being given adequate information It is clear from the responses from patients that in the large majority of wards, staff are communicating effectively with them, even during stressful times - such as an admission. If not currently available, wards should consider providing written information, in a leaflet or on a notice board, to reduce any potential confusion.

The Healthcare Commission National Audit of Violence 2006-7 Final Report – Working Age Adult Services
43
Strong communication systems and a positive ward culture (all staff groups)
This section related to the experiences of the staff working on the wards and examined aspects of team working, ward communication systems, and ward culture. Over 800 comments were received. Opportunities to raise and discuss issues Firstly, staff were asked whether they felt that they had sufficient opportunities to raise and discuss issues with colleagues on the ward.
Yes No Nursing staff 87 13 Clinical staff 91 9
Non-clinical staff 86 14 Both the quantitative and the qualitative data indicated that ward-based communication systems were generally well-developed and comprehensive, as these quotes described: “MDT review meetings are held weekly to review identified clients, qualified staff support meetings are held every Tuesday lunchtime which gives staff the opportunity to reflect on practice and difficult clients, MDT teaching/training sessions are held on Wednesdays, staff support group takes place on a Thursday” (a nurse) Put more simply: “Communication is brilliant.” (a nurse) The lowest scoring ward type was acute wards, where 84% of nurses and 87% of clinicians answered ‘yes’, compared with the highest scoring ward type – PICUs (‘yes’=95% nurses and 93% clinicians). In a small number of wards, however, communication problems were evident: some staff described how the quality of communication differed between team members; others spoke about there being ‘room for improvement’; several recognised that previously identified problems were in the process of being addressed. A small minority of respondents described very difficult situations on their wards, as these quotes illustrate: “Communication is poor consistently. Ward culture is a fragmented team - who work in isolation of each other.” (a member of the clinical team) “Continues to remain hierarchical with staff willing to speak out, unable to do so due to becoming frustrated with not being listened to or ideas being acted upon.” (a nurse) Concerns taken seriously Respondents were then asked whether they felt that concerns were taken seriously and acted upon. Non-nursing staff were more likely to answer ‘yes’ than their nursing colleagues.
Yes No Nursing staff 74 26 Clinical staff 85 15
Non-clinical staff 90 10

The Healthcare Commission National Audit of Violence 2006-7 Final Report – Working Age Adult Services
44
A relatively small but similar number commented positively, compared to negatively. Again, the lowest scores came from nurses and clinicians in acute services (70% and 83%, respectively), compared with PICU wards (86% and 92%, respectively). Where problems were described, these often referred to variation in the responsiveness of different members of ward-based staff. Some staff criticised their senior management’s lack of attentiveness, as this nurse explained: “Concerns raised by staff are taken seriously at ward level, but the ward appears to be forgotten by 'higher management' and the high risk patients that are dealt with here.” Handover systems The effectiveness of the hand-over systems on the ward was rated similarly high by all groups.
Yes No Nursing staff 88 12 Clinical staff 85 15
Non-clinical staff 85 15 Where wards were experiencing problems with their handovers, this was linked to a range of different factors: the skills and experience of the staff member leading the session; how much time was available; the focus and usefulness of the information that was being shared; which staff were able/available to attend. On some wards, problems were seen to be limited to certain times of the day, such as the handover to/from night staff. Multi-disciplinary consensus on care All staff were asked whether they agreed that there was a multi-disciplinary consensus on the clinical care of patients.
Yes No Nursing staff 87 13 Clinical staff 89 11
Non-clinical staff 89 11 A very high percentage of staff across all groups answered ‘yes’. These positive experiences were reflected in a number of the comments received: “Communication is good. We have multi-disciplinary meetings every morning.” (a member of the clinical team) “The MDTs are a valued forum for discussing management issues with the patients. The consultants are approachable, and issues concerning violence and aggression are discussed and responded to.” (a nurse) Where problems within the multi-disciplinary team were evident, the nature of these problems varied, as these two contrasting quotes illustrate: “Ward is not truly MDT as main focus comes from nursing staff.” (a nurse) “Mostly there is a rough consensus between the multi-disciplinary team in so much that other parties may have chance to input their views, however it is generally felt that the consultant will have the final word in all clinical care issues, whether the multi-disciplinary team agree or not.”

The Healthcare Commission National Audit of Violence 2006-7 Final Report – Working Age Adult Services
45
Control over admissions All staff were asked whether they had ‘a say’ about who was admitted onto the ward. The perspective of nursing staff was very different from that of other members of the clinical team. However, although a high 64% of nursing staff answered ‘no’, surprisingly few people commented on the subject. The data revealed that these problems were greatest in acute wards where only 30% answered ‘yes’, compared with colleagues from the best scoring area, PICUs (55%).
Yes No Nursing staff 36 64 Clinical staff 65 35
Non-clinical staff 41 59 Appropriate staffing on the ward All staff groups were asked a series of questions about whether they felt that the staffing on the ward was appropriate to the resident population. These questions related to (a) the numbers of staff, (b) their skills, experience, and qualifications, (c) the gender mix, and (d) ethnic mix.
Ratios Skill mix Gender Ethnic mix Yes No Yes No Yes No Yes No
Nursing staff 64 36 74 26 67 33 70 30 Clinical staff 68 32 76 24 81 19 77 23
Non-clinical staff 66 34 82 18 80 20 85 15 Staff ratios Around one-third of all respondents did not agree that the ratio of staff on the wards was appropriate to the needs of their patients. The range of scores from nursing staff was concerning, with 83% from PICUs rating ratios as adequate, compared with only 45% of rehabilitation colleagues. A number of different causal factors were cited: high levels of sickness; demands from other wards; problem times of day where ratios were lower (usually associated with either night shifts, or times when the demands on staff time were higher, e.g. during admissions or ward rounds). Some nursing staff described the impact of poor staffing ratios in relation both to ‘risk’, and to the quality of ‘therapeutic engagement time’: “We often have a shortage of staff, night shifts are often dangerous.” “The ward has a good nursing team, but is forced to work on ‘bare bones’ staffing much of the time, which means decisions about leave, therapeutic interventions and group work are primarily dictated by whether staff can be left working with only one colleague rather than clinical need.” Skills mix Again, there was some degree of consensus about the adequacy of the staff skills mix, with around three-quarters of all staff answering ‘yes’. The greatest problems were evident in acute wards where only 70% of nurses felt the mix was appropriate (compared with 85% of nurses from PICUs). Where staff commented, these generally related to one of three issues: the belief that the ratio of qualified to unqualified staff was inappropriate; the high use of bank or agency staff; the relative inexperience of some staff. These quotes describe experiences on some wards: “[A] ratio of one qualified on a shift is not satisfactory. The qualified has to administer medication, see to admission if there is one and speak to relatives. Sometimes there is a ward round to see to. All this and making sure the clients and the team are safe and the ward is running smoothly is very heavy on one qualified.” (a nurse)

The Healthcare Commission National Audit of Violence 2006-7 Final Report – Working Age Adult Services
46
“The use of bank staff depletes the ward of experienced staff, often there not being enough staff who are appropriately trained in Breakaways and C&R, also not having as good de- escalation skills as the regular staff, and more and more bank staff are being utilised all the time.” (a nurse) “There are a large number of inexperienced staff which is not always apparent as at times it can be quiet, however in an emergency it is very apparent.” (a clinician) Gender In relation to gender, nursing staff were considerably less likely than their non-nursing colleagues to feel that the mix was appropriate to the needs of the resident population. Problems were greatest in rehabilitation services and acute wards. Some staff described what seemed like on-going shortages – sometimes of female staff, sometimes male. Others described rare situations where, perhaps because of staff sickness, there had been problems. Ethnicity Again, nursing staff were more likely to feel that the staffing mix was inappropriate, this time in relation to ethnicity. Again, it was acute and rehabilitation wards that nurses felt were experiencing the greatest difficulties. In some cases, these were linked to problems recruiting staff from relevant ethnic backgrounds. A number of staff described the impact of these imbalances on their ward: “Cultural mix needs to be addressed. [I] am the only white male on the ward. I feel that white clientele cannot always relate to a person from a different religious or cultural background.” (a nurse) “The problem lies in language barriers not ethnicity, sometimes patients and staff feel frustrated at staff that can not communicate effectively due to not understanding what has been said!” (a nurse) “For our resident population we need more Afro-Caribbean and Asian staff. Most staff are White British or African. Communication can suffer between staff and also between staff and patients as a result of some staff having English as a second language, naturally causing barriers to effective communication.” (a nurse) Access to additional resources All staff were asked whether they could access additional resources when the ward had a difficult mix of patients. Again, although a relatively high proportion of both nurses and other members of the clinical team answered ‘no’ to this question, few comments were made on the subject. A sizeable range was evident in the positive ratings from nursing and clinical staff in PICUs, compared to rehabilitation wards (PICUs: nurses=73%, clinicians=81%; rehabilitation wards: nurses=39%, clinicians=50%).
Yes No Nursing staff 56 44 Clinical staff 61 39
Non-clinical staff 61 39

The Healthcare Commission National Audit of Violence 2006-7 Final Report – Working Age Adult Services
47
Concluding comments on ward communication systems and culture The overall picture nationally was of cohesive, supportive staff teams, with well-structured communication systems and strong multi-disciplinary working. For many wards, there was a sense of pride in what was being achieved and some even referred to their improvements as ‘a work in progress’ – keen to emphasise that more lay ahead. There were some obvious exceptions – wards where the dynamics within the nursing team, or between the nursing staff and their clinical colleagues, were damaged and/or where morale was particularly low. The most common source of problems was staffing on the ward. While some wards clearly had well-established teams and flexible systems that allowed them to manage their staffing resource to match the needs of the ward, others were less fortunate. A number were experiencing problems recruiting staff; others faced financial constraints that meant that their staffing levels and/or access to bank/agency staff or overtime had been reduced. The issue of poor skills mix on wards was raised many times, with a range of underlying factors: problems retaining experienced staff; financially-driven reductions to the numbers of qualified to unqualified staff; high reliance on bank/agency staff. Concerns about the gender or ethnic mix of the staff team were generally linked to local recruitment problems.

The Healthcare Commission National Audit of Violence 2006-7 Final Report – Working Age Adult Services
48
Appropriate training for staff (all staff groups)
General training Before moving on to look at training that related specifically to the prevention and management of violence, the staff questionnaires asked a series of questions about access to general training.
Yes No Nursing staff 47 53 Clinical staff 52 48
Equal opportunities
Non-clinical staff 38 62 Nursing staff 18 82 Clinical staff 33 67
The ‘Bournewood Ruling’, especially in respect of restriction and deprivation of liberty
Non-clinical staff 10 90 Nursing staff 32 68 Clinical staff 53 47
The Mental Capacity Act, especially in respect of the best interest and least restrictive principles
Non-clinical staff 18 82 Around half of nursing and clinical staff had received training in Equal Opportunities. Clinicians were considerably more likely than their nursing colleagues to have received training around the Bournewood Ruling or the Mental Capacity Act. Training relating to undertaking personal searches All staff groups were asked whether they were involved in undertaking personal searches.
Yes No Nursing staff 61 39 Clinical staff 8 92
Non-clinical staff 2 98 Of those who said that they were, the following percentages had received appropriate instruction in undertaking personal searches, which was repeated and regularly updated. Figures for nurses were highest in forensic wards (60%), but were substantially lower in acute and rehabilitation wards (34% and 36%, respectively).
Yes No Nursing staff 41 59 Clinical staff 59 41
Non-clinical staff 25 75 Training relating to the management of actual incidents Staff were asked whether they were involved in managing severely challenging/violent incidents.
Yes No Nursing staff 86 14 Clinical staff 50 50
Non-clinical staff 7 93

The Healthcare Commission National Audit of Violence 2006-7 Final Report – Working Age Adult Services
49
Those who answered ‘yes’ were then asked a series of questions about the training that they had received. • Have you had access to training that promotes the use of non-physical interventions to
recognise and prevent severely challenging/violent behaviour, e.g. ‘Promoting Safer and Therapeutic Services’ training?
• Has your training been adequate to enable you to minimise the risk of a severely challenging/violent incident occurring?
• Has your training been adequate to enable you to deal with a severely challenging/violent incident when one occurs?
Training received Minimising risk Dealing with incident
Yes No Yes No Yes No Nursing staff 75 25 79 21 83 17 Clinical staff 75 25 83 17 82 18
Non-clinical staff 57 43 64 36 64 36 Three-quarters of nurses and clinical staff reported that they had received training. When asked about whether the training had enabled them to minimise risk, and to deal with incidents, around one-fifth of nurses and clinicians felt that it had not. Interestingly, nurses in forensic wards and PICUs were more likely to report satisfaction with training, compared to nurses in acute and rehabilitation wards. All respondent groups were invited to describe any additional training they would like relating to minimising risk, or dealing with severely challenging/violent incidents. Over 440 comments were made about training to minimise risk, compared with 280 comments about training to deal with incidents. There was considerable duplication between the two sets of comments. One obvious distinction, however, was that in relation to minimising risk, training in non-physical interventions (specifically ‘de-escalation’) was most commonly requested, whereas in relation to dealing with actual violence, C&R was the most requested training. In keeping with the quantitative data, it was clear from both sets of responses that many staff felt satisfied with the training they received around violence and aggression, especially nursing staff. A typical comment from a nurse: “I am happy with the training and experience I have received and gained over the years.” The large majority of comments from nursing staff related to requests for additional, specific training. Most commonly, they asked for training in the use of non-physical interventions and de-escalation, including (in order of frequency): ‘PSTS’; ‘conflict resolution’, and; ‘risk management’. This was followed by requests for training relating to the management of violence and aggression, specifically: C&R; Breakaway, and PMVA. Clinical staff were more likely to request training around communication skills and talking/engagement therapies, perhaps reflecting their very different role in relation to the management of actual incidents. A dominant theme throughout the comments was the need for more regular/ongoing training, including updates and refresher courses, especially around de-escalation and C&R training, as these nurses explained: “More regular updates on training courses, as it’s been a long time and procedures change.” “I would feel a lot more confident on the ward if C&R refresher courses were offered on a more regular basis, i.e. every 2/3 months. A refresher course once a year is not enough to enable people to feel entirely confident whilst managing challenging/violent behaviour on the ward.” “I have had training but have forgotten the ways and methods due to lack of practice.”

The Healthcare Commission National Audit of Violence 2006-7 Final Report – Working Age Adult Services
50
Many staff commented that they would like to receive “any” or “all” training that was available, giving the impression that they felt ill-equipped to deal with violence on the ward. Also, a surprising number of staff stated that they did not know what training was available to them. Recording incidents All staff groups were asked whether they had received training in how to record incidents using the appropriate local templates. Almost one-third of nurses said that they had not.
Yes No Nursing staff 66 34 Clinical staff 52 48
Non-clinical staff 43 57 Training relating to observation skills Definition The primary aim of observation should be to engage positively with the service user. This involves a two-way relationship, established between a service user and a nurse, which is meaningful, grounded in trust, and therapeutic for the service user. (NICE, 2005) All staff were asked whether they were involved in carrying out observations.
Yes No Nursing staff 95 5 Clinical staff 23 77
Non-clinical staff 8 92 Those that answered ‘yes’ were asked whether they had received ongoing competency training in observation. Findings were similar across different ward types.
Yes No Nursing staff 32 68 Clinical staff 41 59
Non-clinical staff 0 100 Although 95% of nurses were required to use this intervention, only one-third said that they had been appropriately trained.

The Healthcare Commission National Audit of Violence 2006-7 Final Report – Working Age Adult Services
51
Training relating to the use of rapid tranquillisation Definition All medication given in the short-term management of disturbed/violent behaviour should be considered as part of rapid tranquillisation (including PRN medication taken from an agreed rapid tranquillisation protocol or as part of an advance directive). (NICE, 2005)
All staff were asked whether they were involved in administering or prescribing rapid tranquillisation, or in monitoring patients to whom parenteral rapid tranquillisation had been administered.
Yes No Nursing staff 66 34 Clinical staff 44 56
Non-clinical staff 1 99 Those that answered ‘yes’ were then asked a series of questions: • Have you received training around the legal framework that authorises the use of rapid
tranquillisation? • Are you trained in the use of pulse oximeters? • Do you receive ongoing competency training to a level of Immediate Life Support (ILS –
Resuscitation Council UK)?
Training around the legal
framework
Trained in the use of pulse oximeters
Ongoing competency training to a level of ILS
Yes No Yes No Yes No Nursing staff 53 47 40 60 69 31 Clinical staff 75 25 58 42 76 24
Non-clinical staff 50 50 50 50 50 50 Of the two-thirds of nursing staff who were involved in rapid tranquillisation, almost one-half had not received training around the legal framework authorising its use, 60% had not been trained in the use of pulse oximeters, and almost one-third did not receive ongoing competency training to a level of Immediate Life Support. The percentage of nurses using this intervention was far lower in rehabilitation services (32%). The pattern of responses to the three follow-on questions was fairly consistent across the remaining three ward types.

The Healthcare Commission National Audit of Violence 2006-7 Final Report – Working Age Adult Services
52
Training relating to the use of hands-on restraint Definition Skilled, hands-on method of physical restraint involving trained designated healthcare professionals to prevent individuals from harming themselves, endangering others or seriously compromising the therapeutic environment. Its purpose is to safely immobilise the individual concerned. (NICE, 2005) NOTE: NICE uses the term 'physical intervention'. All staff groups were asked whether they were involved in using hands-on restraint. Levels of usage of this intervention by nursing staff ranged from 92% (PICUs) to 64% (rehabilitation wards).
Yes No Nursing staff 85 15 Clinical staff 21 79
Non-clinical staff 5 95 Those that answered ‘yes’ were then asked two additional questions: • Have you received training around the legal framework that authorises the use of hands-
on restraint? • Have you been trained in Basic Life Support (BLS – Resuscitation Council UK)?
Training around legal framework
Trained in BLS
Yes No Yes No Nursing staff 88 12 85 15 Clinical staff 91 9 96 4
Non-clinical staff 70 30 80 20 Encouragingly, the large majority of all groups had been trained both in the associated legal issues and in Basic Life Support. This was consistent across all ward types. Training relating to the use of seclusion Definition The supervised confinement of a patient in a room, which may be locked to prevent others from significant harm, its sole aim is to contain severely disturbed behaviour that is likely to cause harm to others. (NICE, 2005) Staff were asked whether they had been directly involved in the care of a secluded patient on their ward during the last year.
Yes No Nursing staff 39 61 Clinical staff 19 81
Non-clinical staff 2 98

The Healthcare Commission National Audit of Violence 2006-7 Final Report – Working Age Adult Services
53
Those that answered ‘yes’ were then asked two additional questions: • Have you received training around the legal framework that authorises the use of
seclusion? • Do you receive ongoing competency training in the use of seclusion?
Training around the legal framework
Ongoing competency training
Yes No Yes No Nursing staff 59 41 43 57 Clinical staff 59 41 39 61
Non-clinical staff 25 75 33 67 The number of staff using seclusion was lower, a reflection of the fact that many wards opt not to use this intervention. Levels of usage were highest in forensic wards and PICUs (53% and 59%, respectively). Of the 39% of nurses and 19% of clinicians who were involved in caring for a person who had been secluded, a large proportion had not received the appropriate training. The percentage of nurses who reported receiving training around the legal framework ranged from 70% in forensic services, to 33% in rehabilitation wards. In relation to on-going competency training in the use of seclusion, nurses in both forensic wards and PICUs had greater access to training (53% and 52%, respectively), compared to acute wards (36%) and rehabilitation wards (19%). General comments about staff training At the end of this section, staff had the opportunity to comment more generally about their experiences of training. There were 440 staff comments: the majority of these came from nursing staff (n=350); clinical staff provided 69 comments; 23 non-clinical staff commented. The most common concern was that staff had limited or no access to the training that they wanted and needed to allow them to carry out their roles effectively. A number of reasons were given: many nursing staff described how staff shortages prevented them from taking time off the ward to attend training, even mandatory training; closely linked to this was the issue that financial constraints meant access to training was reduced. Some typical quotes from nurses: “Due to the lack of staffing and/or funding, even mandatory training sometimes is cancelled or you are unable to attend due to being needed on the ward.” “Training presents issues to the management team and ward staff as staff are off the ward and not available to cover shifts. Other members of the team cover shifts as overtime but this is not always possible and can lead to lower staffing levels, especially if someone calls in sick”. “More training needed, often courses are cancelled due to lack of funding.” Other factors that were attributed to preventing staff from accessing training included: problems getting on courses due to long waiting lists for places; the infrequency of courses; the poor availability of trainers, and; the fact that there were simply no training courses available, especially around ILS/BLS and seclusion (where used). Certain staff groups, especially newly-qualified staff, student nurses, bank staff and non- clinical staff, described additional problems accessing training: “As an admin member of staff I am not trained in a lot of the areas that nursing staff are – however, as I am working on the ward in a potentially dangerous environment, I feel that

The Healthcare Commission National Audit of Violence 2006-7 Final Report – Working Age Adult Services
54
more training around violence and safety should be offered.” (a member of the non-clinical team) “I am a bank nurse, I have worked on the bank for over two years. I work full-time and I feel I should be offered training. Prior to me working for the Trust I had received my training from my last employer, however I still feel that I should be refreshed as do permanent staff on the ward.” (a nurse) “Vacancies have been frozen and gaps filled by bank nursing assistants who do not receive even the most basic training.” (a nurse) “I have been involved in 3:1 care of a patient in the seclusion room, for a prolonged period of time, and have also had to restrain a patient - but have never had C&R training, having been here 11 months.” (a nurse)
Concluding comments on staff training Access to training relating to the prevention and management of violence was variable, both between services and between different respondent groups. Some particular areas stood out for comment: • training for nursing staff in undertaking searches; • training for all staff in recording incidents; • on-going competency training in observation for nurses; • access for nurses to all recommended training related to the use of rapid tranquillisation. Additional appeals were expressed for more regular, more in-depth, and more accessible training. In some services, even when training courses were available, staff shortages and difficulties funding backfill often prevented staff from attending. Consequently, some staff were missing out on training that they needed to allow them to effectively and safely carry out their jobs, leaving them ill-equipped and ‘at risk’ in volatile environments.

The Healthcare Commission National Audit of Violence 2006-7 Final Report – Working Age Adult Services
55
Adequate staff supervision (all staff groups) Staff from all groups were asked a series of questions about their experiences of supervision in general, and specifically related to the prevention and management of violence. Almost 500 people commented. Firstly, they were asked whether they currently received one-to-one clinical supervision.
Yes No Nursing staff 63 37 Clinical staff 74 26
Non-clinical staff 14 86 Over one-third of nursing staff reported that they did not receive one-to-one supervision. These figures were lowest in rehabilitation wards (yes=48%) and highest in PICUs (74%). However, of those that said answered ‘yes’, many commented about different formats for delivering supervision – including group supervision, and peer supervision – which may account for many of those who answered ‘no’ to this question (i.e. they may have been receiving supervision in a format that was not ‘one-to-one’.) Clinical staff tended to comment positively about the supervision that they received. “Regular meetings with my consultant and meetings with the other members of multi-disciplinary teams on a weekly basis.” “We receive both managerial and clinical supervision which allows us to add items to the agenda and discuss all issues which keeps a happy work/life balance.” Although the majority of non-clinical staff said that they were not receiving supervision, their comments revealed that many were getting managerial supervision with either the ward manager or their external line manager, or that they had ad-hoc supervision with other ward staff, and that they felt had no need for more formal one-to-one clinical supervision. Staff were then asked about the frequency of their supervision:
Weekly Fortnightly Monthly > Monthly Nursing staff 5 6 58 32
Clinical 33 15 43 8 Non-clinical 27 12 46 15
Of the staff that did receive clinical supervision, the most common frequency for all groups was monthly. Almost one-third of nursing staff, however, received clinical supervision less often than monthly. All staff were invited to rate their satisfaction with the frequency and quality of their supervision (see tables below). How would you rate your satisfaction with the frequency of supervision that you get?
Totally satisfied
Satisfied Dissatisfied Totally dissatisfied
Nursing staff 28 57 13 2 Clinical staff 41 54 5 0
Non-clinical staff 35 62 4 0

The Healthcare Commission National Audit of Violence 2006-7 Final Report – Working Age Adult Services
56
How would you rate your satisfaction with the quality of supervision that you get?
Totally satisfied
Satisfied Dissatisfied Totally dissatisfied
Nursing staff 33 60 6 1 Clinical staff 40 55 5 0
Non-clinical staff 33 67 0 0 The large majority of staff from all groups rated themselves as ‘satisfied’ or ‘totally satisfied’ with both the frequency and quality of their supervision. Nurses in acute and forensic wards were most likely to rate themselves as less than satisfied with the frequency of their supervision (dissatisfied/totally dissatisfied=18% and 16%, respectively), compared with their colleagues in PICUs and rehabilitation wards (dissatisfied/totally dissatisfied=9% and 3%, respectively). Many people commented on their own positive experiences: “Supervision gives me a good opportunity to discuss any incidents which may have taken place, how they were dealt with and how they could be dealt with differently in the future or avoided. It also gives me the opportunity to learn from my supervisor's past experiences, as well as discussing past experiences with other members of staff, both formally and informally.” (a member of the clinical team) “I find supervision very useful and consider it to be a major part of my support at work.” (a member of the clinical team) “Supervision is an important aspect to help further development.” (a member of the non-clinical team) A common theme related to the frequency of supervision was the importance to staff of having easy and flexible access to supervision, advice and support, as these nurses explained: “Although formal supervision is currently monthly the opportunity to increase this is available should the need arise.” “Anything can be discussed during supervision and it can take place more frequently if requested.” Dissatisfaction with the frequency of supervision was highest amongst the nursing group (15%), as these quotes reflect: “Been qualified for a year and a half, have not had any supervision.” “Clinical supervision is not compulsory in my trust and I have only had it twice in five and a half years.” “I believe I should receive supervision but as yet haven't.” All staff were asked whether supervision included incidents and events relating to the prevention and management of violence.
Yes No Nursing staff 74 26 Clinical staff 64 36
Non-clinical staff 44 56

The Healthcare Commission National Audit of Violence 2006-7 Final Report – Working Age Adult Services
57
Over one-quarter of nursing staff said that it this important element was not always included. The range of responses across the ward type was notable, with 84% of nurses in PICUs answering ‘yes’, compared with only 47% of colleagues from rehabilitation wards. Two comments from nurses: “I undertake regular clinical supervision, though this does not always include incidents of violence.” “I would have liked to have received more supervision on incidents and events relating to the prevention of violence.” A number of additional themes emerged from the comments: staff not having time to attend clinical supervision due to ward commitments; the unavailability of supervisors, and; new and unqualified staff not having the same opportunities to access supervision as qualified staff. A key observation by a number of nurses was that the onus is on the individual nurse to ensure that they have access to supervision.
Concluding comments on staff supervision While the large majority of nursing and other clinical staff were receiving one-to-one clinical supervision, large numbers were not. Those that were receiving supervision reported high levels of satisfaction with its quality, though nursing staff were less happy with its frequency. As many of these staff were being required to work in increasingly challenging environments, perhaps not surprisingly, particular value was placed on supervision as a forum for dealing with the aftermath of violent and aggressive incidents, as was the need for flexible access to advice and supports from senior colleagues.

The Healthcare Commission National Audit of Violence 2006-7 Final Report – Working Age Adult Services
58
Supports from other colleagues on the ward (all staff groups) Staff were asked about the range of supports that they received from other colleagues in relation to managing violence and aggression. Over 450 staff chose to comment. Supports from other staff on the ward Firstly, all staff groups were asked to rate supports that they got from other staff on their ward.
Totally satisfied
Satisfied Dissatisfied Totally dissatisfied
Nursing staff 34 58 7 1 Clinical staff 32 64 4 0
Non-clinical staff 39 53 5 2 Satisfaction levels were high across all respondent groups. Overall, 94% of all staff were either ‘satisfied’ or ‘totally satisfied’ with the supports they got from other staff: in PICUs, an impressive 42% of nurses and 41% of clinicians rated themselves as ‘totally satisfied’; in acute wards, only 25% of clinicians rated themselves as ‘totally satisfied. A large number of positive comments relating to this subject were made, accounting for over one-half of the total comments received: staff of all disciplines expressed appreciation for their colleagues, both on a professional and personal level; camaraderie was clearly high, especially when faced with violent and aggressive incidents. Some typical quotes: “I work with the best support you could wish for in a team, we all work together well, we know where each person is coming from and the management know your limitations as to what they expect from you. You are given full support in both work and personal circumstances.” (a nurse) “I have found that all levels of staff and disciplines work effectively together” (a member of the clinical team) “All staff on the ward qualified/unqualified and non-clinical staff all work together in managing severely challenging/violent behaviour, the whole ward work really well as a team in these circumstances.” (a member of the non-clinical team) “This is an effective team in dealing with difficult situations. We pull together, each team member's safety is paramount, and of course the patient's.” (a nurse) Where dissatisfaction was expressed, this was most frequently linked to problems associated with the mix of skills, gender or level of experience of the staff team. In particular: many spoke about the impact of using high numbers of bank and agency staff, who were generally untrained in managing violent incidents; others explained that some of their colleagues were unconfident when faced with violent and aggressive behaviour, and that this could mean that their own confidence levels would vary according to which staff were on their shift. The following quotes from nurses illustrate the problems: “There are occasions where 'bank' or ‘agency' staff are unable to assist due to lack of training.”

The Healthcare Commission National Audit of Violence 2006-7 Final Report – Working Age Adult Services
59
“ ... can often feel unsafe due to temporary inexperienced staff who are not adequately trained in effective communication skills or equipped with skills in managing potential or actual serious incidents of violence.” “The support that I receive from colleagues always depends on who I am working with. Some people are very supportive and some are just ‘hiding away’ during incidents.” Supports from the senior management team within the directorate All respondent groups were asked about the supports from the senior management team within their directorate.
Totally satisfied
Satisfied Dissatisfied Totally dissatisfied
Nursing staff 16 53 26 5 Clinical staff 20 66 13 1
Non-clinical staff 32 53 12 2 Eighty percent of all staff groups were either ‘satisfied’ or ‘totally satisfied’ with the support they received from their senior management team. Notably, 31% of nursing staff rated themselves as either ‘dissatisfied’ or ‘totally dissatisfied’. Nursing staff in PICUs were most likely to rate themselves as ‘totally satisfied’ (20%), compared with nurses in rehabilitation services, who were least likely to rate themselves as ‘totally satisfied’ (10%). The group of nurses most likely to rate themselves as either ‘dissatisfied’ or ‘totally dissatisfied’, was acute wards (34%). A number of themes stood out from the comments. Firstly, a feeling that managers did not understand the hard work that was put in by staff, and the daily pressures that they faced: “Ward staff work hard. Management do not know what ward life is actually like.” (a member of the clinical team) “It’s difficult for those non ward-based colleagues to know the reality of dealing with violence on the ward. They are supportive but I don't think they have any real understanding of what it feels like and the stress it causes staff.” (a nurse) Secondly, large numbers of staff expressed the belief that senior managers did not spend enough time on the ward, and that they showed a lack of interest in the staff who worked there, as these quotes illustrate: “It is very rare that anybody from senior management attends the ward to offer any direct support. This support would be appreciated, particularly after an incident, even if it was just to say ‘well done’ or ‘how are you’.” (a nurse) “[The] only contact with senior management team is when 'something goes terribly wrong', rather than to find how things are and how they can improved.” (a nurse) “Sometimes feel that the management only appear on the ward to criticise when something has gone wrong.” (a nurse) “Teamwork and support is good. I'm able to discuss issues with staff and feel a sense of support in resolving problems. [I] cannot say the same for senior management.” (a member of the clinical team) “It feels that once you pass Ward Manager level, there is no-one fighting your corner.” (a nurse)

The Healthcare Commission National Audit of Violence 2006-7 Final Report – Working Age Adult Services
60
The quality of leadership on the ward Finally, all groups were asked to rate their satisfaction with the quality of leadership on their ward.
Totally satisfied
Satisfied Dissatisfied Totally dissatisfied
Nursing staff 32 55 11 1 Clinical staff 32 59 8 1
Non-clinical staff 44 50 5 1 Ninety-one percent of all staff rated themselves as either ‘satisfied’ or ‘totally satisfied’. Again, it was nurses and clinicians from PICUs who were most likely to rate themselves as ‘totally satisfied’ (37% and 41%, respectively), compared with only 24% of nurses and 30% of clinicians from forensic wards. At the opposite extreme, nurses from forensic services were also most likely to rate themselves as either ‘dissatisfied’ or ‘totally dissatisfied’ (16%), though they were followed closely by colleagues from acute wards (14%). Most staff tended to comment generally about feeling supported by ‘all staff’ or the ‘staff team’, rather than specifically about ‘leadership’. Of the comments that were made, some were positive, while others criticised the consistency, skills or availability of the management lead on their ward. This range in experiences is illustrated by the following quotes: “[It] is sometimes a very difficult place to work, but it works because of the quality of the team - from consultant psychiatrists to cleaning staff - and the leadership the team receives from senior staff.” (a member of the clinical team) “[The] quality of leadership depends on who is in charge at any given time.” (a nurse) “I feel that the quality of leadership is incredibly poor. They lack consistency and are not very supportive towards individual MDT members, making you feel unsupported and not particularly valued!” (a member of the clinical team) “There appears to be a total lack of leadership currently on the unit, team moral and team spirit are at a low, limited communication and support are offered to all.” (a nurse) “At present the ward is without a Ward Manager and this impacts upon nursing leadership.” (a member of the clinical team) Concluding comments on supports from other colleagues The majority of staff reported that they were satisfied with the supports they received from their team on the ward, though less so with supports from more senior managers. Many ward staff had become highly reliant on each other, especially in the context of managing actual incidents. On wards where the staff team was unstable and/or there was a high reliance on bank and agency staff (who might not have been trained and/or able to offer the required support), individual team members were often left feeling vulnerable, unsupported, and unappreciated, as this quote from a member of the clinical team explained: “The Trust needs to look at the support it gives to the nurses they have working for them on the wards. Some of these wards are not a pleasant environment the staff are coming to with regards to violent/aggressive/abusive patients - who are obviously unwell. So they should at least make staff feel more appreciated for the efforts they do.”

The Healthcare Commission National Audit of Violence 2006-7 Final Report – Working Age Adult Services
61
A safe physical environment (all respondent groups)
The 1998 and 2005 Guidelines3 contain substantive guidance about the ways in which organisations can minimise risk in relation to the physical environment. Many of these relate to the provision of specific safety features; others, to environmental precipitants of violence. Over 1,400 individual comments were received on this subject. Environmental safety The audit asked questions relating to the presence or absence of a range of recommended safety features. A designated area for the purpose of reducing arousal and/or agitation The Environmental Audit asked local teams whether there was designated area or room specifically for the purpose of reducing arousal and/or agitation (in addition to a seclusion room). Only 46% of wards rated this standard as ‘met’. This findings linked with a question in the staff survey which asked: When patients have become distressed or angry, have you generally been able to access a quiet area/separate room on the ward where they can be supported by staff?
Yes No Nursing staff 84 16 Clinical staff 87 13
Non-clinical staff 90 10 The data suggests that many wards were unable to provide a dedicated space. Levels of compliance were lowest in acute wards. These nurses described the problems: “[The] quiet rooms in both male and female corridor have been converted to bedrooms to accommodate increasing admission rates.” “… no facility where staff can take patients who are overtly distressed, aroused etc. in order to de-escalate or administer emergency PRN in a safe surrounding (seclusion room), and subsequently spend some quiet time.” The discrepancy between the findings from the Environmental Audit and the survey is perhaps explained by the fact that ward staff were often being forced to make use of alternative space to de-escalate incidents, as this nurse described: “The unit … does not have adequate rooms to see patients safely and quietly, often having to use their bedrooms.”

The Healthcare Commission National Audit of Violence 2006-7 Final Report – Working Age Adult Services
62
Alarm systems All staff groups were asked a series of questions about the adequacy of alarm systems on the ward.
Is the emergency
alarm system on this ward
effective?
Is a personal safety alarm available for
your use?
Does the ward have a consistent and rehearsed
response to emergency alarm calls (including personal
safety alarm calls)? Yes No Yes No Yes No
Nursing staff 82 18 86 14 83 17 Clinical staff 97 3 83 17 87 13
Non-clinical staff 95 5 88 12 88 12 These findings indicate that of all the staff groups, nurses felt most let down by the alarm system, with almost one-fifth saying their system was not effective. Levels of satisfaction with the alarm systems were highest in PICUs (91% of nursing staff), compared with 67% of rehabilitation colleagues. Large numbers spoke about their experiences of systems that were faulty or ineffective, as these quotes illustrate: “An alarm system was installed over 18 months ago but has never been operational.” (a nurse) “The new system does not pinpoint where the incident is taking place, it just points you to the zone where you need to respond, which is not accurate.” (a nurse) In relation to the provision and operation of personal alarms, there was less variation between the experiences of the different staff groups, with around 14% of staff describing problems. Again, levels of satisfaction were highest in PICU services (96%), compared with only 78% of rehabilitation nurses. The comments revealed that where problems did exist, these most commonly related to either ‘too few alarms’, or difficulties with their maintenance, as these staff explained: “Alarms are available, although when we need to book extra staff, alarms are not available.” “Personal alarms constantly not functioning properly and take a very long time to be fixed/replaced.” When asked about the ward’s response to alarm calls, the response from all staff groups was similarly consistent and disappointing, though few people chose to comment. Once again, problems were reportedly greatest in rehabilitation wards and least in PICU wards. These findings were consistent with those obtained from the Environmental Audit. Met Not
Met Furniture is arranged so that alarms can be reached and doors are not obstructed
88 12
There are accessible alarms in interview rooms, reception areas, and other areas where one patient and one staff member work together
86 14
There is a system that ensures that all alarms (for example panic buttons and personal alarms) are well maintained and checked regularly
87 13

The Healthcare Commission National Audit of Violence 2006-7 Final Report – Working Age Adult Services
63
Additional safety standards The Environmental Audit asked teams to rate compliance with a number of additional safety standards: Met Not
Met PEAT N/A
Sight lines are unimpeded 50 50 There are good routes of entry and exit in the event of an emergency, e.g. fire, disturbed/violent behaviour
77 11 12
A crash bag is available within 3 minutes11 85 13 2 Crash bag equipment is maintained and checked weekly12 84 12 4 There is a designated seclusion room which is ‘fit for purpose’
29 22 50
A copy of the policy for preventing and dealing with all forms of harassment and abuse is displayed prominently
61 39
Several staff described problems associated with poor visibility on their wards: badly shaped corridors with blind spots; wards that were accommodated on more than one floor. One nurse spelled out the possible consequences of poor design: “The ward is very poorly laid out. If an incident happens in one area of the ward, staff may be unaware that it is taking place.” Alcohol and illegal drugs on wards The problems associated with alcohol and illegal drugs in in-patient services are well recognised. All respondent groups were asked whether their ward was affected.
Alcohol Illegal drugs Yes No Yes No
Nursing staff 62 38 73 27 Clinical staff 57 43 69 31
Non-clinical staff 47 53 53 47 Patients 16 84 19 81 Visitors 18 82 24 76
The pattern of impact on staff was consistent across the two substances, with nursing staff reporting the greatest problems, followed by clinicians, and then non-clinical staff. Problems associated with alcohol were by far greatest in acute wards, where 85% of nursing staff felt their ward was affected. At the opposite end of the spectrum, only 15% of nurses from forensic services identified problems with alcohol. In relation to illegal drugs, the picture was more varied across wards of different types: in acute wards and PICUs, where nursing staff were most likely to identify problems (88% acute; 68% PICUs), patients were consistently less likely than visitors to the ward to identify difficulties associated with illegal drugs (acute: patients=20%, visitors=28%; PICUs: patients=16%, visitors=33%). Large numbers of respondents commented on the subject of the problems associated with alcohol and illegal drugs on the ward, firstly, in relation to the link between substance misuse and violence, as this nurse explained: “Problems can arise when service users deal or take drugs on the ward. This leads to increases in violence and aggression towards staff and between service users.”
11 This standard was preceded by the guidance note ‘this would apply in settings where rapid tranquillisation, physical intervention and seclusion might be used’. 12 See footnote 11

The Healthcare Commission National Audit of Violence 2006-7 Final Report – Working Age Adult Services
64
Comments also related to the impact of alcohol and illegal drugs on the mental wellbeing of the patients – here described from the very differing perspectives of one nurse and one patient: “Frequently problems due to drug use, often patients supply drugs to others causing deterioration in mental state and due to increased paranoia more risk of verbal and physical aggression.” (a nurse) “It’s hard when people are on the ward smelling of alcohol when you are trying to recover from alcoholism.” (a patient) Many respondents reflected on local strategies to tackle the issue of substance misuse on wards. Their comments suggest that this problem is being tackled with varying degrees of success across England and Wales. At one extreme, considerable success was evident: “There has been a 90% reduction in drug and alcohol related incidents in the past year following implementation of a new local ward specific policy.” (a nurse) “The ward and police work in conjunction. Patients are searched upon return from unaccompanied leave (not strip search). If drugs are found on a patient it is kept as an exhibit. Leave is also suspended for certain days if patients are in possession of drugs.” (a member of the non-clinical team) “After the detection or suspicion of a patient using drugs, a test is carried out and the result is passed on to the appropriate doctor in charge to take the necessary action, either suspend the patient from leave or cancel leave outright.” (a nurse) At the other end of the spectrum, many wards were clearly still struggling to adopt consistent and thorough strategies to deal with the problem, as these nursing staff described: “It is said that abuse of staff will not be tolerated or drinking alcohol, yet this goes on with no support from, more often, medical staff. Patients are told on admission discharge will occur if alcohol is utilised, yet this does not happen.” “Although contracts are being signed upon admission regarding drug and alcohol intake whilst on the unit, discharge is not necessarily implemented.” “Apparently we have zero tolerance to alcohol and drugs and associated behaviour. However, this is rarely backed up and acted on by doctors and senior management.” Environmental privacy and security Personal privacy A number of questions were asked in the Environmental Audit about personal privacy: Met Not
Met PEAT N/A
There are single sex toilets 92 8 There are single sex washing facilities 93 7 There are single sex day areas 51 34 10 4 There are single sex sleeping accommodation 85 5 10
These findings suggest that many wards had a long way to go before they would be able to offer single sex accommodation, particularly in relation to the provision of day areas. The survey also asked patients whether they had to share space with members of the opposite

The Healthcare Commission National Audit of Violence 2006-7 Final Report – Working Age Adult Services
65
sex when they didn’t want to. Although a seemingly high 18% said that this did happen, very few patients commented on the subject. The greatest problems were evident in PICU wards where a high 24% of patients answered ‘yes’, compared with only 2% of patients from rehabilitation services. The Environmental Audit asked additional questions that related to the provision of specific types of private spaces. Met Not
Met PEAT N/A
Provision is made for children visiting the ward 69 13 12 6 There is a separate area to receive patients with police escorts
62 33 5
Patients have access to an outside area which is adequately fenced to ensure privacy and security
67 33
Patients can lock their bedroom doors (with external staff override)
64 33 3
Patients can lock bathroom doors (with external staff override)
95 4 1
Patients can lock toilet doors (with external staff override)
94 5 1 Three standards stand out for particular comment. Firstly, the provision of a separate area for people with police escorts: one-third of wards failed to meet this standard, raising serious concerns about loss of dignity for many patients during the vulnerable period of their admission to the ward. Secondly, the finding that one-third of wards were unable to offer access to a private and secure outside area. Finally, that one-third of wards did not provide lockable bedrooms. The Environmental Audit asked local teams to rate the standard ‘Personal effects are safe and accessible’. This was rated ‘not met’ by 23% of wards – a finding that was consistent with the survey which asked patients about storage of and access to their belongings.
Storage Access Yes No Yes No
Patients 81 19 81 19 However, although almost one-fifth of patients reported problems either storing or accessing their belongings, very few commented on these problems. A few did, however, describe the problem of theft on wards: “There is persistent theft on the ward. Clients are warned of these problems.” “[I] have to sleep with money in socks as other patients steal it.”

The Healthcare Commission National Audit of Violence 2006-7 Final Report – Working Age Adult Services
66
Environmental comfort The standards in this section of the questionnaires and Environmental Audit explored the extent to wards were able to offer a comfortable environment in which known potential triggers for violence – for example over-crowding, noise, uncomfortable temperatures, etc. – were minimised. Adequate space In the Environmental Audit, 27% of teams rated the standard ‘There are adequate quiet spaces for patients for prayer and quiet reflection’ as ‘not met’. Linked to this, teams were asked to rate whether the ward met the standard ‘There is a perception of space and overcrowding is avoided’. This standard was also rated ‘not met’ by 27% of wards. The survey also asked all respondent groups about whether they felt there was enough space on the ward.
Yes No Nursing staff 58 42 Clinical staff 58 42
Non-clinical staff 67 33 Patients 72 28 Visitors 71 29
The variation in findings between the Environmental Audit and the survey suggests that the problems associated with the lack of space became far more apparent when the person making the rating was being asked to spend significant amounts of time on the ward, rather than visiting for a short period to conduct an Environmental Audit. Of the five respondent groups, nursing and clinical staff were most likely to feel this standard was not being met, and large numbers commented on the subject. These comments most commonly related to one of three problems. Firstly, the lack of space in which to carry out specific tasks – quiet areas, interview rooms, activity areas, office space, storage, etc. Secondly, the sheer level of demand on existing space, as this nurse described: “There are designated rooms for doctors, ward rounds, but if various disciplines and solicitors/outside agencies arrive at the same time it can be difficult to provide rooms for everyone.” Finally, the cramped or, as many described it, “claustrophobic” conditions in some wards. Worryingly, it would seem that the lessons that should have been learned from previous design failures not always have, as this quote from a nurse illustrates: “There is limited space on the unit for both staff and patients despite the unit being built in 1999.” Although patients described similar types of problems, they more often talked about the lack of communal space or quiet areas where they could spend time with their family and friends, as these patients explained: “Be nicer to have more quiet rooms and extra TV rooms as the men tend to take over what's on the TV.” “Due to the layout on the ground floor, if trouble erupts, everybody is affected in some way. A quiet room would be nice if situated on the ground floor.”

The Healthcare Commission National Audit of Violence 2006-7 Final Report – Working Age Adult Services
67
Noise levels The Environmental Audit asked local teams to rate themselves against the standard ‘Noise levels are adjusted to meet the needs of the people living/residing on the ward’. This standard was rated as ‘not met’ by one-fifth of wards. The survey also asked all groups about excessive noise levels during the day and during the night:
During the day During the night
Yes No Yes No Nursing staff 40 60 11 89 Clinical staff 29 71 11 89
Non-clinical staff 30 70 5 95 Patients 35 65 22 78 Visitors 17 83 - -
Of the five respondent groups, nurses and patients were most likely to express dissatisfaction with daytime noise levels. Greater proportions of nursing staff in acute wards rated this as problematic (yes=43%), whereas patients in forensic and PICU wards were more likely to express concerns (yes=41%, both types) – perhaps reflecting the dual impact of noise levels and containment. Large numbers of both groups described their experiences: “The ward environment is not always excessively noisy but due to the nature of the ward, emergency admissions, there can be numbers of patients waiting in corridors for beds along with ambulance crew and this can have a significant effect on noise levels.” (a nurse) “People come and go playing music and television very loud. Between 12 midnight and 8am it's quiet … by 9am the television is blaring.” (a patient) In relation to the impact of noise during the day and night, some patients and visitors explained: “The period of my stay on the ward was extremely noisy during the day. There was not one place where I could experience silence: TVs, radios, playstations, and behaviour, all clammered together.” (a patient) “I just want to go home. I hate being in this hospital where it is too noisy to be able to relax. (a patient) “Impossible to sleep with banging doors.” (a patient) “[The patient] does not like shouting, so when someone is kicking off, he hides in his room and tends not to come out again.” (a visitor)

The Healthcare Commission National Audit of Violence 2006-7 Final Report – Working Age Adult Services
68
Ambient temperatures In the Environmental Audit, teams were asked whether the ward met the standard ‘Ambient temperatures and ventilation are adequately controlled’. This standard was rated ‘not met’ by a high 52% of wards – a finding that was echoed by responses to the survey questions that asked whether the temperature often felt ‘too hot’ or ‘too cold’.
Too hot Too cold
Yes No Yes No Nursing staff 55 45 36 64 Clinical staff 46 54 16 84
Non-clinical staff 62 38 23 77 Patients 33 67 32 68 Visitors 39 61 8 92
All of the staff groups were more likely than either non-staff group to feel that the temperature was ‘too hot’. In acute wards, all levels of dissatisfaction were highest from all respondent groups except non-clinical staff. Many people described ‘unbearable conditions’. There was far greater similarity, however, between nurses and patients in their rating of the environment as ‘too cold’. This is likely to be linked to the fact that these two groups were on the wards during the night, when temperatures were often seen to drop. Large numbers of people commented on the topic of the temperature on the ward: some described ‘hot’ or ‘cold’ spots – such as the staff office or bedrooms; many described the impact of seasonal variation, as this comment from a member of the non-clinical team illustrates: “The unit is either too hot in the summer or too cold in the winter, not a well planned building for either season!”. A number of staff commented on the difficulty of controlling the temperature in different parts of the ward: some described design limitations; others spoke about faulty systems; some explained that the heating/ventilation systems were operated centrally. Some typical quotes that describe the problems that some wards were experiencing: “Temperature control can be very difficult from room to room (e.g. meeting rooms, staff room) as some rooms do not have windows and lack ventilation.” (a nurse) “The heating system is inadequate in that in summer the system blows out hot air making the ward hot and uncomfortable and in the winter the heating system is often switched off at night, therefore it is cold during the night and the morning.”(a nurse) Other aspects of environmental comfort Homely and comfortable All respondents were asked whether the ward was homely and comfortable in respect of lighting and appropriate décor and music.
Yes No Nursing staff 63 37 Clinical staff 64 36
Non-clinical staff 72 28 Patients 70 30 Visitors 72 28

The Healthcare Commission National Audit of Violence 2006-7 Final Report – Working Age Adult Services
69
Levels of satisfaction were highest in rehabilitation wards. While the majority of all groups answered ‘yes’, there were still sizeable numbers of wards where it was not, as these comments testified: “It is a large, open environment, with open views of areas from large office space. Lacks homely features, largely due to safety, and lack of available resources.” (a nurse) “Ward has no comfortable or inviting lounge-type area and would really benefit from this. The patio area where the patients smoke could really use some lighting because it does not feel safe or comfortable at night.” (a nurse) “The unit has the feel of a prison. Concrete with exercise yard!” (a visitor) “The ward appears dirty, the decor is unpleasant and the bedrooms are quite frankly dank and horrible, with plain walls and nothing homely about them.” (a nurse) “The ward environment is gloomy and dirty looking. There are minimal home comforts and [it] is dehumanising.” (a member of the clinical team) The Environmental Audit looked at a range of factors that contribute to the creation of a pleasant and comfortable environment. National compliance with these basic standards was often disappointingly low. Met Not
Met PEAT N/A
All areas look clean 59 14 27 All areas smell clean 66 15 18 All areas look friendly 58 29 13 There is access to natural daylight 71 14 15 There is access to natural fresh air 81 19 Internal smoking areas/rooms have powerful ventilation and are fitted with a smoke-stop door(s)
38 33 8 21
There is a day room with a television 97 3 Cleanliness A number of respondents commented of the cleanliness of the ward. Experiences were highly variable, as these contrasting quotes illustrate: “Beautifully clean and tidy.” (a patient) “Pleasant, clean and comfortable.” (a visitor) Compared with: “ … my room smells of urine and the carpets are filthy.” (a patient) “The ward is not particularly homely, often smells unclean and smoky.” (a member of the clinical team) Linked to this, a few people commented on unpleasant smells on the ward: sometimes these comments were associated with the ward itself, e.g. old carpets, unclean toilets, cigarette smoke; other times, they were linked to the poor personal hygiene of other patients.

The Healthcare Commission National Audit of Violence 2006-7 Final Report – Working Age Adult Services
70
Friendliness Large numbers of respondents spoke about whether they felt the ward was ‘friendly’: the large majority of comments were positive, acknowledging the general ambience that the ward staff had created, as these quotes from patients and visitors demonstrate: “A pleasant and homely environment. Staff and patients friendly and welcoming.” (a visitor) “I find the ward pleasant and, more importantly, the staff are very friendly and informative.” (a patient) “I visit the ward regularly to visit my grandson. There is always a welcoming, pleasant atmosphere, and the staff have my greatest admiration for the way they care for patients.” (a visitor) “The staff and patients are all friendly. There is a good, happy relationship between staff and patients. Everybody tries to cooperate and help if they're able to.” (a patient) “This ward is friendly and kind. Just the way it should be.” (a patient) Access to natural daylight and fresh air In the survey, a number of respondents described the problems on their wards: “Unfortunately sectioned patients with no Section 17 leave have no grounds in which to walk and so are confined to the ward.” (a nurse) “The layout is such that at times you are unaware of what the weather is actually like outside.” (a nurse) “A locked ward, with little natural light and dependent on fluorescent lighting that hurts the eyes. Little ventilation, especially in summer.” (a visitor) “Poorly designed low secure unit, little natural lighting, with a dearth of opportunities for patients to experience fresh air.” (a nurse) Worryingly, it would appear that units are still being built that fail to meet the most basic needs, as this nurse explained: “It is a new purpose-built unit. Not enough provision has been made for quiet areas away from the patient population. It is too warm, the light is 'garish' and not enough natural lighting. It is very busy during daytime and noisy. It is not a therapeutic environment for patients.” Supporting individual needs The Environmental Audit asked about whether the ward provided suitable access and facilities for people who have special needs. This standard was ‘not met’ by 31% of wards. Teams were also asked whether patients were able to access meals and other foods (finger foods) outside of mealtimes: this standard was met by a high 91% of wards.

The Healthcare Commission National Audit of Violence 2006-7 Final Report – Working Age Adult Services
71
Concluding comments on a safe physical environment The picture nationally was very mixed. There were undoubtedly wards that were well-designed and able to provide a safe environment in which to care for people. However, there were also many wards where the physical environment exposed staff, patients and visitors to unnecessary levels of risk. A sizeable number of wards still lacked basic safety features such as a de-escalation area or an effective alarm system. Where these types of shortfalls exist, they must be addressed as a matter of urgency. The design of some wards was inappropriate for purpose – e.g. long corridors, blind spots, and it was clear people were being exposed to additional associated risks. In some cases, services were accommodated in buildings that were not built for their current purpose; in others, the buildings were old and offered limited scope for improvement. Perhaps most worryingly, the audit revealed that new wards were still being built that failed to take into account available intelligence about safe design. In some wards, the privacy, dignity and choice given to patients was being compromised by poor and/or inadequate design, such as limited access to outside areas, the absence of a separate area to receive people with a police escort, or doors that could not be locked. In some cases, these problems could and should be remedied with relatively inexpensive solutions. For many wards, specific shortfalls in environmental features were heightening the risk of violence: lack of space and over-crowding; excessive noise levels; over-heating. In extreme cases, wards were described as “gloomy”, “dirty” or “dehumanising”. Wherever possible, these should be addressed as a matter of urgency.

The Healthcare Commission National Audit of Violence 2006-7 Final Report – Working Age Adult Services
72
Being supported in relation to actual incidents The Module 1 questionnaires asked all respondent groups about how they were supported in relation to (the risk of) actual incidents. These questions were designed to establish the extent to which organisations were putting in place adequate systems and supports to maximise safety and allow any lessons to be learned. Pre-emptive advice on what to do All non-staff groups were asked whether they had been given any advice on what to do in the event of a severely challenging/violent incident.
Yes No Patient 38 62 Visitor 48 52
Disappointingly, fewer than half of either respondent group had been given advice. The findings varied across ward type from highs for both respondent groups in forensic wards (patients: yes=58%; visitors: yes=67%), to a low in acute wards (patients: yes=33%; visitors: yes=39%). A number of people commented that they had used their own initiative. Others were clear that the ward had a responsibility to protect people by offering explicit advice on what to do, as these visitors explained: “I think an 'intro' to the ward would have reduced my anxiety, for instance I was visiting with my baby (4 months old) and an incident boiled over on the ward. It was very frightening to listen to as I was not aware that it was under control.” “No advice about procedure is offered. I am a teacher so I have no problem approaching figures in authority to find out information. There are a lot of people visiting who are not as confident and are shy. They are left feeling confused and wondering whether or not they are doing the right thing.” Other respondents described positive experiences where they had been given clear advice about what to do in the event of a violent incident occurring, as this patient described: “Try to avoid person. In each room check position of alarms. Try not to be alone.” Post-incident supports Patients and visitors that had experienced some degree of distress, threat or actual violence were asked whether staff had given them the opportunity to talk about their experience. The findings indicated that visitors were more likely than patients to be offered this support, though very few respondents commented on their experiences. Good practice was evident in rehabilitation services, relative to the other three ward types, with 82% of patients answering ‘yes’.
Yes No Patient 58 42 Visitor 64 36

The Healthcare Commission National Audit of Violence 2006-7 Final Report – Working Age Adult Services
73
Staff were also asked whether they felt that patients on their ward were routinely given the opportunity to discuss their experiences of being involved in severely challenging/violent incidents (either as perpetrator, victim or witness).
Yes No Nursing staff 75 25 Clinical staff 75 25
Non-clinical staff 87 13 Interestingly, greater numbers of staff than patients or visitors felt that this was happening. The responses ranged across ward types, with only 70% of nurses in acute wards feeling this happened, compared with 87% of colleagues in forensic services. Amongst clinicians, those working in rehabilitation wards were least likely to answer ‘yes’ (67%), compared with 82% of colleagues in PICUs. Reporting incidents Staff were asked whether all incidents of severely challenging/violent behaviour that they had been aware of in the past year been reported/recorded.
Yes No Nursing staff 91 9 Clinical staff 92 8
Non-clinical staff 93 7 Figures from all groups indicated consistently that reporting was improving. Ratings across ward types were similar for nursing staff. Some of the comments, however, indicated that in some wards, only the most severe incidents were being reported, as these nurses described: “Due to the remit of the ward staff regularly face threatening and violent behaviour of a verbal and physical nature. It is easy for staff to become complacent when confronted with it and [we] don’t always record it, especially verbal assault.” “The ward is sometimes lax in reporting minor abuses towards staff such as verbal abuse.” “99% of potential incidents are dealt with successfully using a variety of verbal de-escalation skills that result in these incidents not even being reported or recorded due to resolution.” A nurse commented to describe the impact of non-physical violence, and to emphasise the importance of reporting all incidents: “Verbal abuse can be destructive in its own right … There doesn't seem to be a specific protocol for reporting these threats, they seem to be treated as if they are a consequence of our jobs, but if these threats were made to others, in public, they would be taken seriously and dealt with.” Other staff described ‘barriers’ to reporting, associated with time constraints, or a lack of belief that it would ‘make a difference’, for example, as these quotes explained: “New computerised recording of incidents is very time-consuming and it is not always practical to input information at time of incident.” (a nurse) “I reported an incident when I was threatened and nothing happened to support me.” (a member of the non-clinical team)

The Healthcare Commission National Audit of Violence 2006-7 Final Report – Working Age Adult Services
74
“When I was physically assaulted by a patient, I recorded [the] incident in the incident report book and apart from support from my colleagues I got no other support.” (a nurse) The role of the ‘Local Security Management Specialist’ Since December 2003, all health bodies have been required by the NHS Security Management Service to provide a ‘Local Security Management Specialist’ whose role it is to become “the focal point for the local delivery of professional security management work” (http://www.cfsms.nhs.uk). Staff were asked whether they knew who their Local Security Management Specialist was. Perhaps not surprisingly, nurses were the group most likely to answer ‘yes’, and it was nurses in forensic services who provided the highest rating (54%), compared with their poorly-scoring rehabilitation colleagues (20%).
Yes No Nursing staff 35 65 Clinical staff 30 70
Non-clinical staff 29 71
Concluding comments on being supported in relation to actual incidents In general, the range of supports that were being offered to patients and visitors in relation to actual incidents were poor. More proactive measures need to be taken to ensure that those at risk have access to advice about what to do in the event of a violent incident. Additionally, systems need to be tightened up to ensure that patients and visitors who are involved in incidents are offered appropriate post-incident supports. Although the data on reporting incidents suggested that the majority of serious incidents were being recorded, the comments indicated that less severe incidents, including threatening behaviour, may not be. Services need to examine and address any potential barriers to reporting – whether associated with the inefficiencies of local reporting systems, the inadequacy of post-incident follow-up/supports, or the dominant culture on the ward. The introduction of Local Security Management Specialists into mental health services was designed to make staff feel safer: more must be done to make staff aware that this service is available for them and how it can be accessed and used.

The Healthcare Commission National Audit of Violence 2006-7 Final Report – Working Age Adult Services
75
Additional comments At the end of the Module 1 questionnaire, all respondents were given the opportunity to make additional comments. Over 300 comments were received. The majority of respondents used this as an opportunity to emphasise key messages. Key messages The ward and its staff team The most frequent theme was to comment positively on the ward and its staff team. These were frequently made by team members, but also by patients and visitors. Some typical quotes: “I believe this ward to be a safe, efficient place of work, there is a strong team here and there is no split between the nursing team and support staff, everybody works together, I have thoroughly enjoyed my time here as a student and would love to have full-time employment here when I qualify in 18 months time.” (a nurse) “I feel the need to state I have received exceptional help in terms of my care and future needs. I really can't thank enough my key worker and all the professionals I have met during my stay here - they have been extremely compassionate, understanding and offered all the support and advice I could need to return to living at home again.” (a patient) “The staff on this ward are brilliant, even on my bad days I'm treated with respect. They are friendly and I could talk to any of them for advice even when I'm having a bad day. I'm being watched one-to-one. It can be intimidating at times, but I know it's for my safety. The staff deserve a medal.” (a patient) “Staff are excellent and take time to meet and explain to visitors treatment and progress of relatives.” (a visitor) “I am happy that this ward functions according to policy and procedures of the Trust and that it provides good, warm and safe care for the patients in its care.” (a nurse) “It is a well-run ward. Could be more homely but staff do well with a very difficult and challenging group of clients.” (a visitor) Where negative comments were made about the ward or its staff, these were generally associated with individual events and experiences, or were ‘non-specific’, for example: “Not a good ward.” (a patient) The management of violence Another subject that received more positive than negative feedback was the experience of respondents in relation to the management of actual incidents, as these quotes illustrate: “As a professional visiting the ward, I have always been advised appropriately when dealing with potentially difficult situations. A personal alarm has been supplied if deemed necessary and I have always been advised on summoning. I have never felt at risk on the ward and staff have always made themselves available, for example, to carry out joint assessments.” (a visitor) “I feel safe and confident working on my unit. We have a great team and everyone works well together. We manage violent incidents as well as we can, with minimal disruptions to all involved (clients, family and staff, etc.).” (a nurse)

The Healthcare Commission National Audit of Violence 2006-7 Final Report – Working Age Adult Services
76
“We have made a lot of changes in our practice in the past two years which has had an extremely positive impact on reducing aggression and violence. This has only been achievable because the whole team has been committed to change the cultures normally associated with acutely disturbed service users.” (a member of the clinical team) Ward staffing Comments about staffing ranged from recognition that current levels were inadequate, through to observations about skills mix and its impact on both quality of care and safety, as the following quotes illustrate: “Staffing on ward is often at a low and unsafe level due to financial issues - management often deny requests for extra staff and appear happy to let wards run on low numbers. Response to staff concerns is often slow or non-existent.” (a nurse)
“Staff shortages have a knock on effect of suspending/delaying/cancelling/patient's leave, visits, therapy etc.” (a visitor) “This unit is dangerously understaffed. Limited finances result in an inability to increase staffing levels if there is a high level of disturbed individuals on the ward (i.e. high levels of one to ones, etc.). This has also resulted in high levels of stress for staff which in turn results in high levels of staff sickness.” (a member of the non-clinical team) “I feel very strongly that budget seems to be more important than sufficient staffing, and bank staff are used more because they are paid at a lower banding (hence saving money). I feel that this puts bank staff at risk as some of them have insufficient training and it also puts permanent staff at risk when an incident occurs.” (a nurse) Ward-based activities A number of people took the opportunity to comment on the lack of therapies and activities on the ward, and its impact: “More outdoor activities need to be introduced. Football, running, volleyball, team games etc. Exercise and mental illness!!! If a patient is locked up on the ward, it brings on stress and anguish!! Day-trips.” (a visitor) “I believe if there was a greater emphasis on psychotherapeutic interventions there would be fewer incidents of violence and challenging behaviour.” (a member of the clinical team) Additional themes A range of themes that were covered by the survey questions were raised by small numbers of respondents: the cleanliness (or lack of cleanliness) of wards; problems associated with specific environmental features; issues associated with the impact of illegal drugs and alcohol on wards; poor morale; limited support from senior managers; problems associated with the mix of patients on wards.

The Healthcare Commission National Audit of Violence 2006-7 Final Report – Working Age Adult Services
77
Module 3a: Review of violent incidents Background Module 3a focused on the management of actual violent incidents. Each participating ward was asked to review a series of three violent incidents against a structured ‘good practice’ checklist. The aim of this audit was to encourage staff groups to review their practices and identify the strengths and areas for improvement of the approaches they used to manage each incident. This exercise supported the principles of peer-review and ‘learning from mistakes’ and was designed to illuminate a variety of possible areas for improvement, from ideas for changes to ward routine, to suggestions for updates to existing policy and procedures.
Content of the audit tool The audit tool contained a structured checklist and an action plan. The structured checklist was based upon the NICE 2005 Guideline. The action plan was a simple framework for gathering feedback from participating wards. The complete audit tool can be found in the ‘NAV audit tools and guidance’ section of our website, www.rcpsych.ac.uk/nav.
Methods Selecting three incidents The guidance for the audit explicitly recognised that local definitions of what constituted ‘a severely challenging/violent incident’ would vary considerably between wards and organisations. Teams were therefore encouraged to refer to their own local definitions and to try to identify incidents that fulfilled some of the following criteria: • they took place within the last month (but not so recently that staff felt unduly
traumatised by the experience); • they involved different ‘types’ of incidents e.g. actual bodily harm, damage to
property; • they necessitated the application of different management approaches e.g. de-escalation,
medication, hands-on restraint, seclusion; • they involved different ‘teams’ of staff; • they offered the potential for group learning. Preparing for a review meeting Teams were asked to arrange a convenient time for all of the staff who had been involved in managing the incident to meet together. In advance of the meeting, the person who led the management of the incident was asked to complete the structured checklist as thoroughly and comprehensively as possible, aiming to complete the free-text comments boxes as well as the ‘yes/no’ questions. This was then to be circulated to the rest of the team and used to promote discussion at the actual review meeting.

The Healthcare Commission National Audit of Violence 2006-7 Final Report – Working Age Adult Services
78
The review meeting Team members were encouraged to discuss and agree ‘ground rules’ for the meeting, with a view to ensuring that everyone would feel confident that their contributions to the meeting would be listened to by everyone present, and that the discussions would be constructive and would lead to positive changes. The group then worked together through the completed checklist in the following way:
• The person who led the management of the incident presented a brief description of the incident for discussion by the group.
• The person who led the management of the incident then worked through each of the relevant sections of the checklist in turn, firstly giving a brief overview of their responses and observations, before opening it up to discussion amongst the group.
• The group then completed the relevant sections of the Action Plan.
Data management Data collection The data collection period began in October 2006 and continued until March 200713. Data was collected using a paper-based version of the Action Plan and then submitted via an on-line link on the ‘National Audit of Violence’ web page www.rcpsych.ac.uk/nav-data to the SnapSurveys database software. Data analysis The survey data was extracted from the SnapSurveys database. The quantitative data was then analysed and presented using Microsoft Excel. The qualitative data was exported into Microsoft Word and analysed manually. Data presentation 88 wards submitted at least one action plan, with a total of 240 completed forms. Some wards reported that they were unable to complete this component of the audit because no incidents had occurred during the data collection period. This report is based upon the collated national findings of the action plans, specifically: • Background information: quantitative data about the perpetrator of each incident
under review. Each section heading relates to each question asked in the action plan, broken down by working age adult’s services and older people’s services. Bar charts have also been used to allow a clear comparison of the results. Percentages are presented without decimal points (e.g. 56%, rather than 56.4%), resulting in some ‘rounding up’ of scores, meaning that sometimes total scores will appear to be 99% or 101%.
Note: the selection of incidents was left to the discretion of local teams. The resulting quantitative data is not, therefore, systematic.
13 The initial deadline of the end of February was extended at the request of many participants.

The Healthcare Commission National Audit of Violence 2006-7 Final Report – Working Age Adult Services
79
National Findings: background information (n=88)
Gender n % Male 157 65% Female 82 34% No reply 1 0% Total 240 99%
Age n % 18-24 46 19% 25-34 87 36% 35-44 57 24% 45-54 20 8% 55-64 16 7% 65 and over 11 5% No reply 3 1% Total 240 100%
Ethnicity
n % White British 174 73% Black African 17 7% Any other 17 7% Black Caribbean 13 5% Any other White background 11 5% Mixed White & Black Caribbean 8 3% Total 240 100%
Occurrences during the incident
Number of
occurrences % of total incidents that involved this behaviour
Pushing 37 36 Hitting another person 55 53 Throwing, striking or damaging furnishings/fittings/objects
30 29
Spitting at a person 6 6 Use of a weapon or object to threaten 14 13 Use of a weapon or object to attack a person 13 13 Injury which required treatment 10 10 Resisting restraint or forced treatment 23 22 Other, Please specify 28 27 No reply 2 2

The Healthcare Commission National Audit of Violence 2006-7 Final Report – Working Age Adult Services
80
Other (please specify) • Verbal aggression/abuse (n=37) • Threats (n=31) • Raised voices (n=25) • Self harm/attempted suicide (n=9) • Attempted absconsion (n=8) • Biting (n=5) • Kicking (n=4) • Throwing liquid (hot drinks/urine) (n=4) • Racist abuse (n=3) • Screaming/shouting (n=3) • Smashing windows (n=2) • Refusing medication/care (n=2) • Headbutting (n=2) • Starting fires (n=2) • Removing clothing (n=1)
Key findings The findings from the Module 3a checklist showed an emphasised preventing and pre-emting violent incidents beforehand, as opposed to managing incidents as they happened. The following areas were commented upon most frequently: • Increased patient involvement: assessing risk; discussing triggers; creating advance
statements; • Practice changes: debriefings for staff and patients; minimising use of bank/agency
staff; flagging up good practice at senior managers meetings; increased access to therapies and activities;
• Improved training: reviewing number of staff trained to undertake observation; use incidents as discussion points in training;
• Culture change: giving clear message that ‘violence is not tolerated’; Develop ethos that restraint is a ‘last resort’.

The Healthcare Commission National Audit of Violence 2006-7 Final Report – Working Age Adult Services
81
Module 3b: case note/drug chart audit on the use of rapid tranquillisation
Background The questions within the audit tool were based upon the rapid tranquillisation section of the NICE Guideline: Violence – the short term management of disturbed/violent in in-patient psychiatric settings and emergency departments (2005)3 and its associated algorithm. As the scope for the audit specifically excluded services for people with dementia, the audit tool for ‘older people’s services’ is briefer than the ‘working age adults’ equivalent. The results for ‘older people’s services’ will be reported separately.
Methods
Sampling All wards were encouraged to take part in this part of the audit programme, although it was anticipated many wards would be unable to take part due to lack of cases. In recognition of the fact that the levels of usage of rapid tranquillisation varied considerably between subject wards, the sampling and audit methods were suitably flexible14. A three-stage process was recommended: firstly, a census week was used to identify potential cases that might be audited; secondly, the audit sample was identified; finally, the case notes were audited against the audit checklist. 1. Census week: local project teams were asked to specify one week and, during this
week, the Ward Manager was asked to ensure that a numbered list was compiled of all instances where a patient had received rapid tranquillisation (it was suggested that this task could be delegated to another member of the nursing team or the ward clerk, or could be compiled by the team at each handover).
2. Sampling: at the end of the week, teams were instructed to work through the numbered list and draw a sample from the odd numbers of a minimum of 5 and a maximum of 15 separate instances15.
3. Audit of case notes/drug charts: the following suggestions were made to local teams about who should carry out the actual audit.
• A senior nurse • An SHO or SpR • A pharmacist • A member of the clinical governance/clinical audit team
14 During the Introductory Workshops that preceded the data collection, the Audit Team consulted with local teams to determine an appropriate methodology for this module of the audit. 15 At the end of the census week, wards that had insufficient instances to include in the audit were given two options: continue collecting the list for one (or more) additional weeks or include all instances in the sample.

The Healthcare Commission National Audit of Violence 2006-7 Final Report – Working Age Adult Services
82
Submission of data Local teams collected their data using a simple template. This data was then entered via a web-link. The data collection period began at the beginning of October 2006 and continued until the middle of March 200716. Data presentation Nationally, data was submitted on behalf of the following: • 54 trusts; • 95 wards; • 532 individual incidents.
Key findings from national results The sampling methods for the audit, the relatively small number cases audited, and the often high levels of missing data mean that the national results have to be interpreted with caution. However, the data would seem to indicate the following: • On the whole, the right class of drugs (individual or combinations) are being used for the
right situations (psychosis or non-psychosis), and within safe dosage limits. • Post administration monitoring appears to be inadequate, although the findings could
also reflect the fact that many patients were included who did not have a reduced level of consciousness.
• Lack of monitoring is associated with the absence of an agreed plan to monitor.
16 The original deadline of the end of February 2007 was extended at the request of many of the participating wards.

The Healthcare Commission National Audit of Violence 2006-7 Final Report – Working Age Adult Services
83
Discussion When the audit was last carried out in 2003/5, the findings from the 120 participating acute wards were particularly concerning. Indeed, by way of demonstrating its commitment to support implementation of the audit findings, the Healthcare Commission part-funded the development of an accreditation service for acute wards (Accreditation for Acute Inpatient Mental Health Services (AIMS), further details can be found at: www.rcpsych.ac.uk/AIMS). For the 2006/7 phase of the audit, the strategy team at the Healthcare Commission asked the team at the College Centre for Quality Improvement (CCQI) to maintain a focus on acute wards, but to extend it to include older people’s services. Accordingly, the invitation to join the programme that went out to all eligible Trusts in England and Wales asked them to put forward three wards - one acute ward, one older person’s wards, and one other adult mental health ward. The standards for the audit were drawn from the 1998 and 2005 Guidelines3. As the 2005 guideline expressly excluded services for people with dementia, all of the standards had to be reviewed and revised to take account of the needs of older people with organic disorders. The audit was effectively run as two separate programmes, one for adults of working age, the other for older people’s services. A paper that compares the findings between the two data sets is presented at Appendix 8.
Key comparisons • Experiences of violence: although nursing staff in working age adult services (WAA)
were more likely to feel upset/distressed, or be threatened/made to feel unsafe than their colleagues in older people’s services (OPS), they were less likely to be physically assaulted (46% WAA compared with 64% OPS).
• The use of interventions too quickly: while ratings between staff groups were similar,
patients in WAA were more likely than patients in OPS to report that medication, hands-on restraint and seclusion was used too quickly (medication: yes=38% WAA compared with 21% OPS; hands-on restraint: yes=30% WAA compared with 14% OPS; seclusion: yes=25% WAA compared with 13% OPS).
• Being treated with respect and dignity and given privacy and choice: OPS out-
performed WAA in a number of key questions in this section, i.e. respecting religious/cultural needs and personal preferences, however, patients on WAA wards were more likely to have been asked how they wanted to be treated in the event of their becoming violent (yes=21% WAA compared with 9% OPS), or to be asked about their early warning signs (yes=23% WAA compared with 12% OPS).
• The provision of information: patients on WAA wards were more likely to be given
information about why they had been admitted to the ward (yes=72% WAA compared with 64% OPS), or about how to get help from an advocate (yes=60% WAA compared with 40% OPS), however (and crucially), they were less likely to feel satisfied with their involvement in decisions about their care (yes=67% WAA compared with 79% OPS).
• Having things to do: patients in WAA services were slightly less likely to have daily
opportunities for group interaction/recreation or physical activity/exercise than patients in OPS (interaction/recreation: yes=75% WAA compared with 82% OPS); (activity/exercise: yes=54% WAA compared with 62% OPS). However, both specialties

The Healthcare Commission National Audit of Violence 2006-7 Final Report – Working Age Adult Services
84
were experiencing similarly high problems in relation to the provision of therapies and activities during the day, and in the evening/at weekends.
• Environmental safety: although wards for older people were more likely to be rated as
clean, friendly, and spacious, wards for adults of working age were more likely to provide access to specific safety features - such as single sex accommodation, facilities for children visitors, and a separate area for people with police escorts.
• Alarm systems: in relation to the adequacy of their ward’s systems, the team’s
response to alarms and access to personal alarms, nurses in WAA services expressed sometimes markedly higher levels of satisfaction (alarm systems: yes=82% WAA compared with 75% OPS); (response to alarms: yes=82% WAA compared with 75% OPS); (personal alarms: yes=86% WAA compared with 57% OPS).
• The patient mix: nurses on WAA wards were more likely to feel that they had a say
over admissions to the ward than their colleagues in OPS (yes=36% WAA compared with 24% OPS)
• Staffing: although staff from WAA and OPS reported similar levels of satisfaction with
the ratios and skills mix of their staff teams, nurses on WAA wards were more likely to state that they could access additional resources if they had a particularly difficult mix of patients (yes=56% WAA compared with 46% OPS).
• Staff training in preventing and managing violent incidents: similar numbers of
nurses in OPS and WAA services were being called upon to use the range of interventions associated with preventing and managing violence, however, nurses in WAA services were consistently more likely to have received the necessary training.
• Supervision: nurses in WAA services were more likely to receive one-to-one clinical
supervision (yes=63% WAA compared with 56% OPS) and this was more likely to include incidents and events relating to the prevention and management of violence (yes=74% WAA compared with 66% OPS).
• Post-incident discussions: staff in WAA were more likely to report that patients were
routinely given the opportunity to discuss their experiences of being involved in violent incidents (yes=nurses 75% WAA compared with 65% OPS; clinical staff 75% WAA compared with 56% OPS; non-clinical staff 87% WAA compared with 75% OPS).
In conclusion When considered in terms of both the stand-alone data, and in comparison with older people’s services, services for working age have much to be proud of. The results suggest that although the nature, level and severity of violence on wards has increased, the effectiveness with which staff teams prevent and manage incidents has also increased. Throughout the programme, in the content of discussions at workshops and in the extensive comments contained in the data, it has been clear that the sophistication with which the subject is being understood and the problems addressed is often exemplary. There is clear evidence that the majority of services are now adopting proactive and preventative strategies to tackling violence in inpatient services. The effort and commitment that this represents is enormous and must be applauded.

The Healthcare Commission National Audit of Violence 2006-7 Final Report – Working Age Adult Services
85
The audit highlighted a few areas where wards may consider reviewing their practice and further work may be required.
Key areas for attention Life on the ward • In some wards, practices relating to the administration of medication may need to be
revised to make them more dignified for patients. • Wards should examine the adequacy of the ways they involve patients in decision-
making about their own care, particularly in relation to choice of medication and their preferred way of being managed in the event of their becoming violent.
• Wards should examine the adequacy of the ways they involve patients in decision-making about aspects of how the ward is run, e.g. mealtimes, choice of menu, availability of refreshments outside of mealtimes, waking times etc.
• The link between boredom and the risk of violence is well-recognised. In many wards, the provision of activities and therapies, both during the day and during the evenings/at weekends, was inadequate. This should be addressed as priority.
• If not currently available, wards should consider providing key information in a written format – either in a leaflet or on a notice board.
Ward staffing • On some wards, the staff ratio and skills mix did not match the needs of the resident
population. In some cases, this was linked to a high use of bank/agency staff who might not be familiar with the ward’s practices or the patients, and who might not be trained to deal with violent incidents. Services should work towards staffing strategies that minimise dependence on non-permanent staff.
• The staffing requirement of a ward varies according to the needs of the resident population. Services should ensure that their systems for staffing their wards are sufficiently flexible to allow them to accommodate these changing needs.
Training and support for staff • Wards should review their provision of training relating to the prevention and
management of violence, in particular: - training for nursing staff in undertaking searches; - training for all staff in recording incidents; - on-going competency training in observation for nurses; - access for nurses to all recommended training related to the use of rapid
tranquillisation. Environmental safety • A number of areas were identified as lacking in some wards. Where possible, these
should be addressed as a matter of urgency: - a sizeable number of wards still lacked basic safety features, such as a de-escalation
area or an effective alarm system; - the design of some wards was inappropriate for purpose, e.g. long corridors, blind
spots;

The Healthcare Commission National Audit of Violence 2006-7 Final Report – Working Age Adult Services
86
- in some wards, patient privacy, dignity and choice were being compromised by poor and/or inadequate design, such as limited access to outside areas, the absence of a separate area to receive people with a police escort, or doors that could not be locked;
- for many wards, specific shortfalls in environmental features were heightening the risk of violence: lack of space and over-crowding; excessive noise levels; over-heating. In extreme cases, wards were described as “gloomy”, “dirty” or “dehumanising”.
• Measures must be taken to ensure that the re-development and re-build of all wards takes full account of available intelligence about safe environmental design.
Being supported in relation to actual incidents • In general, the range of supports that were being offered to patients and visitors in
relation to actual incidents were poor: - more proactive measures need to be taken to ensure that those at risk have access
to advice about what to do in the event of a violent incident; - systems need to be tightened up to ensure that patients and visitors who are
involved in incidents are offered appropriate post-incident supports. • Although the data on reporting incidents suggested that the majority of serious incidents
were being recorded, the comments indicated that less severe incidents, including threatening behaviour, may not be. Services need to examine and address any potential barriers to reporting, whether associated with the inefficiencies of local reporting systems, the inadequacy of post-incident follow-up/supports, or the dominant culture on the ward.
• More should be done to make staff aware of the supports that are available through their Local Security Management Specialist.

The Healthcare Commission National Audit of Violence 2006-7 Final Report – Working Age Adult Services
87
Glossary
This glossary was adapted from the NICE Guideline, 2005. Advance directive/statement: a document that contains the instructions of a person with mental health problems setting out their requests in the event of a relapse, an incident of disturbed/violent behaviour etc. It sets out the treatment that they do not want to receive and any treatment preferences that they may have in the event that they become violent. It also contains people who they wish to be contacted and any other personal arrangement that they wish to be made. Aggression: a disposition, a willingness to inflict harm, regardless of whether this is behaviourally or verbally expressed and regardless of whether physical harm is sustained. Antipsychotics: A class of prescription medications used to treat psychotic conditions. Basic Life Support: the maintenance of an airway and the support of breathing and circulation without using equipment other than a simple airway device or protective shield. Benzodiazepines: refers to any of several similar lipophilic amines used as tranquillizers or sedatives or hypnotics or muscle relaxants. Breakaway: A set of physical skills to help separate or breakaway from an aggressor in a safe manner. They do not involve the use of restraint. Calming: the reduction of anxiety. Clinical staff: any non-nursing member of the multi-disciplinary team Crash Bag: the equipment necessary to resuscitate a n individual if they suffer a cardiac arrest. De-escalation: a complex range of skills designed to abort the assault cycle during the escalation phase, and these include both verbal and non-verbal communication skills (CRAG, 1996). De-escalation room/area: this should be a low stimulus room, where a service user can go to calm down. It should not normally be the seclusion room, which is a specific room set aside for the purpose of seclusion, and which must meet specifications that are principled in the Mental Health Act Code of Practice. Seclusion of an informal patient should be taken as an indicator of the need to consider formal detention; this is not the case when a service user is asked to use the de-escalation room. Disturbed behaviour: to be experiencing emotions and exhibiting behaviours that deviate from the accepted norm as a result of mental ill-health. Effectiveness: The extent to which a specific intervention, when used under ordinary circumstances, does what it is intended to do. Clinical trials that assess effectiveness are sometimes called management trials (NICE, 2002). Environment: the physical and therapeutic external conditions or surroundings.

The Healthcare Commission National Audit of Violence 2006-7 Final Report – Working Age Adult Services
88
Forensic Services: Mental health services based on authority derived from judicial actions. Gender: those characteristics of women and men that are socially determined, as opposed to 'sex' which is biologically determined (Mainstreaming Gender and Women's Mental Health Implementation Guide, 2003). Guideline Recommendation: a systematically developed statement that is derived from the best available research evidence, using predetermined and systematic methods to identify and evaluate evidence relating to the specific condition in question. Immediate Life Support: Basic Life Support and safe defibrillation (manual and/or automatic external defibrillator). Key Worker: The healthcare professional who is the first line of contact for a person with mental illness. Low Secure Unit: Low secure units deliver intensive, comprehensive, multidisciplinary treatment and care by qualified staff for patients who demonstrate disturbed/violent behaviour in the context of a serious mental disorder and who require the provision of security (Department of Health, Mental Health Policy Implementation Guide, 2002). Medium Secure Unit: Usually houses service users who are detained under the Mental Health Act, but who do not need to be detained in high security hospitals. NHS Security Management Service (SMS) also known as the Counter Fraud and Security Management Service: is a Special Health Authority which has responsibility for all policy and operational matters relating to the prevention, detection and investigation of fraud and corruption and the management of security in the National Health Service. Non-clinical staff: any other staff member whose role is neither nursing nor clinical, but whose job brings them into regular contact with the ward. Observation: a two-way relationship, established between a service user and a nurse, which is meaningful, grounded in trust, and therapeutic for the service user (UKCC, 2002). Parenteral: method of administering medication or nutrition other than via the digestive tract, such as intravenous, subcutaneous or intra-muscular. Patient: the term ‘patient’ is used, rather than ‘service user’ in this document and associated audit tools and guidance (except when text is quoted directly from the NICE guideline). Physical intervention: a skilled, hands-on method of physical restraint involving trained designated healthcare professionals to prevent individuals from harming themselves, endangering others or seriously compromising the therapeutic environment. Its purpose is to safely immobilise the individual concerned. PICU (Psychiatric Intensive Care Unit): psychiatric intensive care is for patients compulsorily detained, usually in secure conditions, who are in an acutely disturbed/violent phase of a serious mental disorder (Department of Health, Mental Health Policy Implementation Guide, 2002). PRN (pro re nata): medication that may be used as the occasion arises.

The Healthcare Commission National Audit of Violence 2006-7 Final Report – Working Age Adult Services
89
Rapid tranquillisation: the use of medication to calm/lightly sedate the service user, reduce the risk to self and/or others and achieve an optimal reduction in agitation and aggression, thereby allowing a thorough psychiatric evaluation to take place and allowing comprehension and response to spoken messages throughout the intervention. Although not the overt intention, it is recognised that in attempting to calm/lightly sedate the service user, rapid tranquillisation may lead to deep sedation/anaesthesia. Seclusion: the supervised confinement of a patient in a room, which may be locked to protect others from significant harm. Its sole aim is to contain severely disturbed behaviour that is likely to cause harm to others. Seclusion should be used as a last resort, for the shortest possible time. Seclusion should not be used as a punishment or threat; as part of a treatment programme; because of shortage of staff; or where there is any risk of suicide or self-harm. Seclusion of an informal patient should be taken as an indicator of the need to consider formal detention. Seclusion Room: the seclusion room is a room which is fit for purpose as defined by the principles laid out in the Mental Health Act Code of Practice. It should only be used for the purpose of carrying out seclusion. As such, it should be distinguished from a low stimulus room, where a service user can go simply for the purpose of de-escalation. Therapeutic Engagement: may be defined as a skilled nursing intervention that aims to empower the patient to actively participate in their care. Rather than "having things done to them”, i.e. Observations, the patient negotiates the level of engagement that will be most therapeutic. Violence: the use of physical force which is intended to hurt or injure another person (Wright 2002).

The Healthcare Commission National Audit of Violence 2006-7 Final Report – Working Age Adult Services
90
Appendix 1
Case study 1 Provided by Liz Fair, Clinical Effectiveness Manager, Sussex Partnership NHS Trust, on behalf of Rose Ward Action point 1: through the audit of the environment, it was agreed that the ward was overcrowded, that there was insufficient space to see patients individually, and that action should be taken to reduce overcrowding and provide more therapeutic space that emphasised engagement, observation and recreation. A new unit is scheduled to be built and to be ready in 2008, but it was agreed that action was needed in the meantime. A refurbishment programme was started in mid-October 2005 and is now complete: there are now extra interview rooms available, and extra seating (via the reassignment of an old dining room into a lounge/dining room). Action point 2: the audit highlighted concerns around the lack of meaningful activity. A basic grade OT has since been reappointed and continued attempts are being made to engage the nursing team. As of March 2006, all people being newly admitted are being assessed within 72 hours and given a full activity programme.
Case study 2 Provided by Lou Bean, Clinical Audit Manager Mental Health, East Kent NHS and Social Care Partnership Trust, on behalf of Edgehill Ward. Edgehill Ward is a 19-bedded mixed sex acute admission ward, built in approximately 1993 with long narrow corridors, poor observation lines, limited natural daylight and ventilation. Around the same time as the ward was taking part in the audit programme, Edgehill Ward was also selected by the trust to take part in a project run by the Kings Fund - ‘Enhancing the Healing Environment’. Findings from the audit were fed into plans for a series of environmental improvements. The biggest impact was expected to result from changing the use of space by the patients within the ward: the existing dining room was not being used outside of mealtimes and patients were instead congregating in a windowless small lounge; a link was made between the resultant overcrowding and the occurrence of violent incidents – especially during summer months when temperatures rose due to the lack of ventilation. Improvements included: • the use of calming colour schemes; • better access to hot and cold drinks for service users; • improved observation and greater feel of safety; • the creation of new sitting areas; • the introduction of artwork in communal areas.

The Healthcare Commission National Audit of Violence 2006-7 Final Report – Working Age Adult Services
91
Case study 3 Provided by Helen Bennett and Andy Morgan, Cardiff and Vale NHS Trust Cardiff and Vale were able to produce longitudinal data over the period of the audit, relating both to the frequency and the management of challenging behaviour on three of their wards, and to corresponding staff sickness levels. The results were encouraging.
June 04/ May 05
June 05/ May 06
Number of incidents of challenging behaviour 86 41 Number of incidents requiring use of restraint 8 11
Ward A
Staff sickness 4.5% 3% Number of incidents of challenging behaviour 117 91 Number of incidents requiring use of restraint 47 62
Ward B
Staff sickness 6.2% 5.8% Number of incidents of challenging behaviour 61 40 Number of incidents requiring use of restraint 21 19
Ward C
Staff sickness 7.5% 9.2%

The Healthcare Commission National Audit of Violence 2006-7 Final Report – Working Age Adult Services
92
Appendix 2
National Audit of Violence 2003/5 Contribution of the findings to the development of national policy, guidance and initiatives National Patient Safety Agency (NPSA): the topic of ‘violence’ was chosen as its first programme of work in mental health. The National Audit findings was one factor that influenced the decision by the NPSA to set up the “Safer Wards for Acute Psychiatry” (SWAP) initiative. Staff at the CRTU worked to ensure that the two programmes dove-tailed. Counter Fraud and Security Management Services (CFSMS): the audit team contributed to work that the CFSMS took forward to support staff to prevent and manage violence in the workplace. Cross-Government Group ‘Management of Violence’ Group. This group was set up to pull together national policy initiatives relating to the prevention and management of violence across and between public sector services. Findings from the audit were brought to the attention of this group and, in turn, the audit team was enabled to audit member trusts abreast of national policy and practice changes. Cross-Government Group ‘Management of Violence’ Sub-Group: The Accreditation and Regulation of Physical Intervention Trainers and Programmes of Education and Training: the work of this sub-group was directly informed by some of the audit findings. NIMHE’s London Development Centre’s ‘Acute Care Collaborative’ programme: as members of the Steering Group, the audit team was able to contribute both to the development of the standards, and the methods for this work. NICE Guideline: The short-term management of disturbed/violent behaviour in in-patient psychiatric settings and emergency departments: • Reference to audit tools (Appendix D): http://www.nice.org.uk/pdf/cg025niceguideline.pdf • NICE Cost impact report: http://www.nice.org.uk/page.aspx?o=257224 Mental Health Act Commission’s Eleventh Biennial Report: the report frequently cites findings from the audit programme. http://www.mhac.org.uk/Pages/documents/publications/MHAC%2011%20TEXT%20FA.pdf. NIMHE/HC handbook of standards: as part of the follow-up work from the last phase of the audit, the audit team developed an accreditation scheme for acute wards (AIMS – Accreditation for Acute In-patient Mental Health services - http://www.rcpsych.ac.uk/aims). When NIMHE was subsequently asked by the Healthcare Commission to develop a handbook of standards to support the latter’s improvement reviews in acute psychiatric wards, the AIMS Project Team was invited to join the sub-group leading the NIMHE work. The content of the AIMS standards greatly influenced the content and process of the improvement reviews.

The Healthcare Commission National Audit of Violence 2006-7 Final Report – Working Age Adult Services
93
Appendix 3
National Audit of Violence 2006-07 Declaration of Understanding
(Name of Trust/Organisation)………………………………………………………………………… agrees to participate in the fourth wave of the National Audit of Violence. This declaration lists the undertakings of the College Research and Training Unit’s central project team and your trust/organisation to ensure the success of the audit, locally and nationally. The Chief Executive will: • offer high-level, visible support to the participating units; • support a senior individual to work as project lead for the local project team; • ensure that local project team members are allocated time to devote to the audit; • ensure that local project team members have the resources to carry out programme
activities, e.g. admin support, meeting rooms, access to computers and the internet; • support the local team to develop action plans arising from the audit findings; • create a conduit between the local project team and relevant local committees, such as
the trust board (or equivalent), clinical governance committee, practice improvement groups, etc;
• monitor improvement and outcomes resulting from the audit; • fund accommodation and travel costs for project team members to attend one regional
introductory workshop and one feedback workshop. The CRTU central project team will offer an efficient and effective service and will: • run a regional introductory workshop event prior to data collection; • run a regional feedback workshop at the end of the data collection period; • develop data collection instruments, guidance, data analysis and reporting that will
support evaluation against the audit standards; • provide relevant and timely summaries of the audit findings to each participating
organisation; • support participating organisations to compare their findings with others nationally; • encourage action planning and implementation of improvements. Status of data derived from the audit The data gathered during the course of the National Audit of Violence will be held by the Royal College of Psychiatrists’ Research and Training Unit on behalf of the Healthcare Commission. In the normal course of events, the CRTU will provide the Healthcare Commission with a report of the results after the data have been analysed and placed in context. However, all data are subject to the Freedom of Information Act, any requests being channelled through the Healthcare Commission. In the event that a request is received for trust level data, the Healthcare Commission will consult with the trust concerned before reaching any decision on disclosure, although the final decision will remain with the Commission.

The Healthcare Commission National Audit of Violence 2006-7 Final Report – Working Age Adult Services
94
The names of our participating inpatient units are: Acute ward
………………………………………………………………………………………………………………………………………………………
Older Peoples ward
………………………………………………………………………………………………………………………………………………………
Other ward (please specify e.g. PICU, Forensic, Acute)
………………………………………………………………………………………………………………………………………………………
Chief Executive
Signed: ……………………………………………………………………………………………………………………………………….
Date: …………….…………………………………………………………………………………………...……………………………….
Royal College of Psychiatrists’ Research and Training Unit
Signed: …………………………………………………………………………………………………………………………………………
Date: …………………………………………………………………………………………………………………………………………….

The Healthcare Commission National Audit of Violence 2006-7 Final Report – Working Age Adult Services
95
Appendix 4
Contextual Data summary summarised by service type
Location
Bed state Number qualified posts
Mixed Urban Rural Number Number occupied
Occupancy
No. patients under MHA
No. consultants with allocated
beds Funded Filled
All wards – England (n=116) 77 35 4 m=18 m=17 93% m=10 m=4 m=15 m=13
66% 30% 3% 5-32 3-32 39%-128% 0-25 0-22 4-37 4-28 All wards – Wales (n=15)
11 2 2 m=17 m=16 92% m=7 m=3 m=15 m=14 73% 13% 13% 4-38 3-38 73%-100% 0-16 0-10 7-32 7-32
Number unqualified
posts Number unfilled
advertised posts in past
Hours admin support per week
Policies and procedures % ‘yes’
Funded Filled 3 months
6 months
0 1-29 30-40
40+
Ris
k m
anag
emen
t st
rate
gy
Ris
k as
sess
men
t ca
rrie
d o
ut
To incl
ude
alar
ms
Ala
rms
wel
l m
ainta
ined
and
chec
ked
Doct
or
quic
kly
avai
lable
to
atte
nd a
larm
s
Sys
tem
s fo
r post
in
ciden
t su
pport
/rev
iew
All wards – England (n=116) m=11 m=10 m=1 m=1 12 49 48 7 90% 97% 97% 97% 71% 86% 3-34 2-33 0-14 0-14 10% 42% 41% 6%
All wards – Wales (n=15) m=13 m=13 m=0 m=0 4 4 6 1 100% 100% 93% 80% 80% 93% 6-28 6-28 0-1 0-2 27% 27% 40% 7%

The Healthcare Commission National Audit of Violence 2006-7 Final Report – Working Age Adult Services
96
Groups able to access supports % ‘yes’
Policies and procedures % ‘yes’
Sta
ff invo
lved
Pat
ients
invo
lved
Car
ers
and fam
ily
Oth
er p
atie
nts
Vis
itors
who
witnes
sed
Sea
rches
of pat
ients
Child
ren v
isitors
Obse
rvin
g h
igh r
isk
pat
ients
Saf
ety
of w
om
en
Usi
ng/r
ecord
ing
rest
rain
t
Usi
ng/r
ecord
ing r
apid
tr
anqill
isat
ion
Usi
ng/r
ecord
ing
secl
usi
on
Lock
ing t
he
war
d
Pre
venting a
nd
dea
ling w
ith
har
assm
ent
and
abuse
Support
ing p
atie
nts
w
ith d
isab
ilities
Tra
inin
g e
mplo
yees
in
short
-ter
m
man
agem
ent
of
dis
turb
ed/v
iole
nt
beh
avio
ur
All wards – England (n=116)
88% 67% 55% 47% 42% 97% 95% 98% 48% 99% 83% 94% 71% 91% 57% 99%
All wards – Wales (n=15)
87% 87% 60% 60% 43% 93% 87% 93% 60% 87% 80% 27% 47% 87% 80% 100% Does the training specify:
Leve
l of
tra
inin
g
(bas
ed o
n r
isk
asse
ssm
ent )
?
How
oft
en t
hey
will
be
trai
ned
?
(An o
utlin
e of)
te
chniq
ues
in w
hic
h
they
will
be
trai
ned
?
That
tra
inin
g n
eeds
revi
ewed
annual
ly?
Proto
col to
ensu
re
polic
e a
nd s
taff a
re
awar
e of
pro
cedure
s an
d r
ole
s in
em
ergen
cy s
ituat
ions?
All wards – England (n=116)
91% 93% 92% 91% 65%
All wards – Wales (n=15)
87% 87% 100% 93% 75%

The Healthcare Commission National Audit of Violence 2006-7 Final Report – Working Age Adult Services
97
Appendix 5
Ward survey results by service ‘type’
The ward Is there enough space on the ward?
Acute Forensic PICU Rehab Yes % No % n= Yes % No % n= Yes % No % n= Yes % No % n=
Nursing staff 55 45 1083 55 45 273 62 38 315 78 23 80 Clinical staff 57 43 224 53 47 57 57 43 56 100 0 12 Non clinical staff 62 38 144 80 20 20 71 29 38 100 0 9 Patient 74 26 736 66 34 104 59 41 122 93 7 44 Visitor 70 30 270 73 27 63 70 30 56 86 14 14 Is the ward usually excessively noisy during the day?
Acute Forensic PICU Rehab Yes % No % n= Yes % No % n= Yes % No % n= Yes % No % n=
Nursing staff 43 57 1072 29 71 272 42 58 313 36 64 81 Clinical staff 32 68 222 27 73 56 22 78 55 8 92 12 Non clinical staff 35 65 147 10 90 20 32 68 38 22 78 9 Patient 34 66 721 41 59 102 41 59 117 20 80 44 Visitor 20 80 259 11 89 61 16 84 56 8 92 13

The Healthcare Commission National Audit of Violence 2006-7 Final Report – Working Age Adult Services
98
Is the ward usually excessively noisy during the night?
Acute Forensic PICU Rehab Yes % No % n= Yes % No % n= Yes % No % n= Yes % No % n=
Nursing staff 13 87 1036 8 92 269 14 86 300 4 96 78 Clinical staff 13 87 151 5 95 37 7 93 41 0 100 12 Non clinical staff 9 91 85 0 100 13 0 100 29 0 100 8 Patient 21 79 726 29 71 100 24 76 119 20 80 44 Does the temperature often feel too hot?
Acute Forensic PICU Rehab Yes % No % n= Yes % No % n= Yes % No % n= Yes % No % n=
Nursing staff 60 40 1087 44 56 273 48 52 317 53 47 81 Clinical staff 48 52 220 42 58 57 45 55 55 25 75 12 Non clinical staff 65 35 149 55 45 20 54 46 37 67 33 9 Patient 33 67 734 35 65 104 33 67 118 18 82 44 Visitor 45 55 276 35 65 62 23 77 56 13 87 15 Does the temperature often feel too cold?
Acute Forensic PICU Rehab Yes % No % N= Yes % No % n= Yes % No % n= Yes % No % n=
Nursing staff 36 64 1079 42 58 272 37 63 314 22 78 82 Clinical staff 12 88 218 29 71 56 20 80 55 17 83 12 Non clinical staff 27 73 143 16 84 19 19 81 37 11 89 9 Patient 32 68 728 31 69 104 34 66 120 20 80 44 Visitor 8 92 268 11 89 61 5 95 57 7 93 15

The Healthcare Commission National Audit of Violence 2006-7 Final Report – Working Age Adult Services
99
Is the ward homely and comfortable in respect of lighting and appropriate décor and music?
Acute Forensic PICU Rehab Yes % No % n= Yes % No % n= Yes % No % n= Yes % No % n=
Nursing staff 61 39 1090 68 32 272 66 34 313 65 35 82 Clinical staff 57 43 220 75 25 55 71 29 56 92 8 12 Non clinical staff 70 30 142 90 10 20 63 37 38 100 0 9 Patient 70 30 726 71 29 103 63 37 121 88 12 43 Visitor 67 33 259 85 15 60 71 29 52 100 0 15 When patients have become distressed or angry, have you generally been able to access a quiet area/separate room on the ward where they can be supported by staff?
Acute Forensic PICU Rehab Yes % No % n= Yes % No % n= Yes % No % n= Yes % No % n=
Nursing staff 80 20 1086 91 9 274 90 10 312 85 15 82 Clinical staff 83 17 193 96 4 52 91 9 53 100 0 12 Non clinical staff 85 15 121 93 7 15 100 0 53 100 0 9 Is the emergency alarm system on the ward effective?
Acute Forensic PICU Rehab Yes % No % n= Yes % No % n= Yes % No % n= Yes % No % n=
Nursing staff 80 20 1076 84 16 273 91 9 316 76 24 80 Clinical staff 98 2 209 98 2 55 100 0 56 67 33 12 Non clinical staff 97 3 147 94 6 17 100 0 34 89 11 9 Is a personal safety alarm available for your use?
Acute Forensic PICU Rehab Yes % No % n= Yes % No % n= Yes % No % n= Yes % No % n=
Nursing staff 86 14 1086 85 15 273 96 4 314 78 23 80 Clinical staff 80 20 218 91 9 57 93 7 57 55 45 11 Non clinical staff 87 13 151 85 15 20 100 0 37 78 22 9

The Healthcare Commission National Audit of Violence 2006-7 Final Report – Working Age Adult Services
100
Does the ward have a consistent and rehearsed response to emergency alarm calls (including personal safety alarm calls)?
Acute Forensic PICU Rehab Yes % No % n= Yes % No % n= Yes % No % n= Yes % No % n=
Nursing staff 80 20 1077 89 11 273 93 7 315 74 26 81 Clinical staff 87 13 209 94 6 54 87 13 55 58 42 12 Non clinical staff 88 12 138 94 6 17 100 0 36 67 33 9 Do you know who your ‘Local Security Management Specialist’ is?
Acute Forensic PICU Rehab Yes % No % n= Yes % No % n= Yes % No % n= Yes % No % n=
Nursing staff 31 69 1071 54 46 267 38 62 305 20 80 80 Clinical staff 23 77 216 60 40 58 34 66 56 8 92 12 Non clinical staff 25 75 137 42 58 19 42 58 36 33 67 9 Do ward staff have a say about admissions onto the ward?
Acute Forensic PICU Rehab Yes % No % n= Yes % No % n= Yes % No % n= Yes % No % n=
Nursing staff 30 70 1064 38 62 271 55 45 312 41 59 80 Clinical staff 58 42 194 75 25 52 80 20 50 75 25 12 Non clinical staff 40 60 103 54 46 13 52 48 27 25 75 8 When you have a particularly difficult mix of patients, are additional resources made available to the ward?
Acute Forensic PICU Rehab Yes % No % n= Yes % No % n= Yes % No % n= Yes % No % n=
Nursing staff 49 51 1021 66 34 265 73 27 300 39 61 79 Clinical staff 52 48 178 76 24 50 81 19 47 50 50 12 Non clinical staff 49 51 95 92 8 13 88 12 25 38 63 8

The Healthcare Commission National Audit of Violence 2006-7 Final Report – Working Age Adult Services
101
Do you have somewhere secure to store your belongings, for example, money or jewellery?
Acute Forensic PICU Rehab Yes % No % n= Yes % No % n= Yes % No % n= Yes % No % n=
Patient 78 22 727 86 14 105 88 12 119 100 0 44 Can you get your belongings whenever you want?
Acute Forensic PICU Rehab Yes % No % n= Yes % No % n= Yes % No % n= Yes % No % n=
Patient 81 19 725 71 29 105 75 25 122 98 2 44 Do you have to share space with members of the opposite sex when you don't want to?
Acute Forensic PICU Rehab Yes % No % n= Yes % No % n= Yes % No % n= Yes % No % n=
Patient 19 81 727 15 85 103 24 76 123 2 98 44 Is there ever any trouble on the ward because of patients getting drunk?
Acute Forensic PICU Rehab Yes % No % n= Yes % No % n= Yes % No % n= Yes % No % n=
Nursing staff 85 15 1062 15 85 267 35 65 311 40 60 80 Clinical staff 78 22 197 13 87 54 27 73 52 67 33 12 Non clinical staff 67 33 118 6 94 18 13 88 32 33 67 9 Patient 18 82 727 8 92 100 7 93 118 16 84 44 Visitor 25 75 234 2 98 58 13 87 46 0 100 13

The Healthcare Commission National Audit of Violence 2006-7 Final Report – Working Age Adult Services
102
Is there ever any trouble on the ward because of patients taking illegal drugs?
Acute Forensic PICU Rehab Yes % No % n= Yes % No % n= Yes % No % n= Yes % No % n=
Nursing staff 88 12 1063 43 57 267 68 32 305 35 65 78 Clinical staff 84 16 194 35 65 55 59 41 54 67 33 12 Non clinical staff 67 33 106 22 78 18 39 61 28 33 67 9 Patient 20 80 714 14 86 102 16 84 118 11 89 44 Visitor 28 72 225 7 93 57 33 67 46 0 100 13

The Healthcare Commission National Audit of Violence 2006-7 Final Report – Working Age Adult Services
103
Communication systems Are you able to speak to staff when you need to, for example if you are concerned or upset?
Acute Forensic PICU Rehab Yes % No % n= Yes % No % n= Yes % No % n= Yes % No % n=
Visitor 93 7 257 98 2 62 96 4 57 100 0 13 Are your concerns taken seriously and acted upon?
Acute Forensic PICU Rehab Yes % No % n= Yes % No % n= Yes % No % n= Yes % No % n=
Visitor 89 11 231 91 9 58 96 4 50 100 0 13
Communication systems and ward culture Do you have sufficient opportunities to raise and discuss issues and concerns with colleagues on the ward?
Acute Forensic PICU Rehab Yes % No % n= Yes % No % n= Yes % No % n= Yes % No % n=
Nursing staff 84 16 1090 89 11 273 95 5 315 89 11 81 Clinical staff 87 13 219 98 2 57 93 7 54 100 0 12 Non clinical staff 83 17 139 90 10 20 95 5 38 89 11 9 Are your concerns taken seriously and acted upon?
Acute Forensic PICU Rehab Yes % No % n= Yes % No % n= Yes % No % n= Yes % No % n=
Nursing staff 70 30 1061 75 25 268 86 14 309 78 22 79 Clinical staff 83 18 200 87 13 55 92 8 50 92 8 12 Non clinical staff 87 13 128 90 10 20 97 3 36 100 0 9

The Healthcare Commission National Audit of Violence 2006-7 Final Report – Working Age Adult Services
104
Are the handover systems on the ward effective?
Acute Forensic PICU Rehab Yes % No % n= Yes % No % n= Yes % No % n= Yes % No % n=
Nursing staff 89 11 1080 87 13 272 89 11 313 87 13 82 Clinical staff 83 17 190 88 12 52 90 10 50 92 8 12 Non clinical staff 84 16 108 100 0 16 90 10 31 63 38 8 Are the following appropriate to the resident population?
Acute Forensic PICU Rehab Yes %
No % n= Yes %
No % n= Yes %
No % n= Yes % No %
n=
Nursing staff 58 42 1072 70 30 274 83 17 315 45 55 78 Clinical staff 57 43 185 87 13 53 88 12 50 58 42 12
Staff ratios i.e. number of staff on each shift
Non clinical staff
58 42 108 80 20 15 97 3 30 33 67 9
Acute Forensic PICU Rehab
Yes %
No % n= Yes %
No % n= Yes %
No % n= Yes % No %
n=
Nursing staff 70 30 1076 79 21 272 85 15 314 75 25 79 Clinical staff 70 30 188 85 15 52 86 14 51 92 8 12
Staff skill mix i.e. experience and qualifications of staff
Non clinical staff
79 21 107 100 0 14 90 10 30 67 33 9
Acute Forensic PICU Rehab
Yes %
No % n= Yes %
No % n= Yes %
No % n= Yes % No %
n=
Nursing staff 61 39 1078 80 20 270 81 19 313 53 48 80 Clinical staff 77 23 194 92 8 53 84 16 51 67 33 12
Gender mix of staff Non clinical
staff 79 21 108 100 0 15 93 7 30 44 56 9

The Healthcare Commission National Audit of Violence 2006-7 Final Report – Working Age Adult Services
105
Acute Forensic PICU Rehab
Yes %
No % n= Yes %
No % n= Yes %
No % n= Yes % No %
n=
Nursing staff 66 34 1040 75 25 268 77 23 309 65 35 77 Clinical staff 75 25 188 81 19 53 82 18 51 83 17 12
Ethnic mix of staff
Non clinical staff
85 15 103 100 0 15 81 19 27 56 44 9
Is there a multi-disciplinary consensus on the clinical care of patients?
Acute Forensic PICU Rehab Yes % No % n= Yes % No % n= Yes % No % n= Yes % No % n=
Nursing staff 85 15 1016 91 9 269 90 10 301 95 5 74 Clinical staff 85 15 101 96 4 56 90 10 51 100 0 12 Non clinical staff 88 12 82 100 0 15 96 4 23 57 43 7
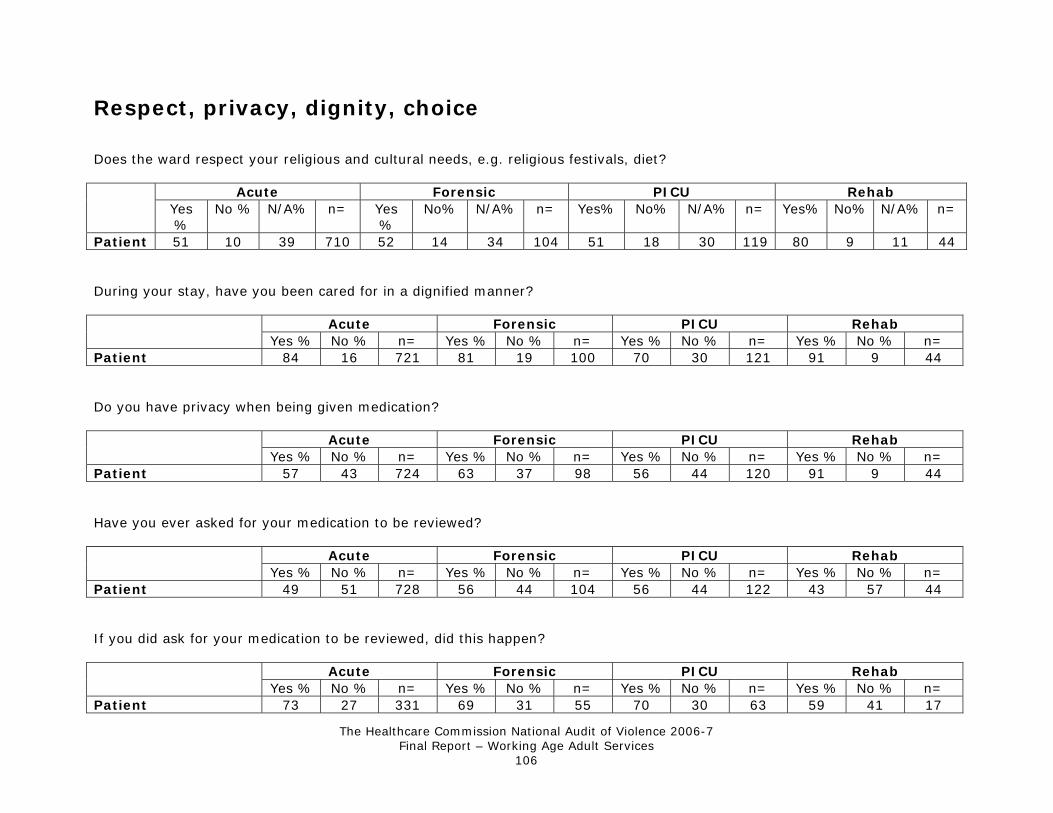
The Healthcare Commission National Audit of Violence 2006-7 Final Report – Working Age Adult Services
106
Respect, privacy, dignity, choice Does the ward respect your religious and cultural needs, e.g. religious festivals, diet?
Acute Forensic PICU Rehab Yes %
No % N/A% n= Yes %
No% N/A% n= Yes% No% N/A% n= Yes% No% N/A% n=
Patient 51 10 39 710 52 14 34 104 51 18 30 119 80 9 11 44 During your stay, have you been cared for in a dignified manner?
Acute Forensic PICU Rehab Yes % No % n= Yes % No % n= Yes % No % n= Yes % No % n=
Patient 84 16 721 81 19 100 70 30 121 91 9 44 Do you have privacy when being given medication?
Acute Forensic PICU Rehab Yes % No % n= Yes % No % n= Yes % No % n= Yes % No % n=
Patient 57 43 724 63 37 98 56 44 120 91 9 44 Have you ever asked for your medication to be reviewed?
Acute Forensic PICU Rehab Yes % No % n= Yes % No % n= Yes % No % n= Yes % No % n=
Patient 49 51 728 56 44 104 56 44 122 43 57 44 If you did ask for your medication to be reviewed, did this happen?
Acute Forensic PICU Rehab Yes % No % n= Yes % No % n= Yes % No % n= Yes % No % n=
Patient 73 27 331 69 31 55 70 30 63 59 41 17

The Healthcare Commission National Audit of Violence 2006-7 Final Report – Working Age Adult Services
107
Are your personal preferences respected, e.g. in relation to food and drink choices, going to bed, clothing?
Acute Forensic PICU Rehab Yes % No % n= Yes % No % n= Yes % No % n= Yes % No % n=
Patient 79 21 702 77 23 102 73 27 117 100 0 39 Do you have opportunities to go outdoors/leave the ward?
Acute Forensic PICU Rehab Yes % No % n= Yes % No % n= Yes % No % n= Yes % No % n=
Patient 78 22 712 89 11 104 66 34 117 100 0 43 Are you able to speak to staff when you need to, for example if you are concerned or upset?
Acute Forensic PICU Rehab Yes % No % n= Yes % No % n= Yes % No % n= Yes % No % n=
Patient 88 12 717 87 13 103 86 14 115 100 0 43 Are your concerns taken seriously and acted upon?
Acute Forensic PICU Rehab Yes % No % n= Yes % No % n= Yes % No % n= Yes % No % n=
Patient 78 22 693 76 24 97 67 33 112 91 9 43 When you were admitted to the ward, were you asked what you would and would not wish to happen if your behaviour became severely challenging/violent?
Acute Forensic PICU Rehab Yes % No % n= Yes % No % n= Yes % No % n= Yes % No % n=
Patient 17 83 670 27 73 96 28 72 105 60 40 40

The Healthcare Commission National Audit of Violence 2006-7 Final Report – Working Age Adult Services
108
When you were admitted to the ward, were you asked your trigger factors and early warning signs of severely challenging/violent behaviour and how these should be managed?
Acute Forensic PICU Rehab Yes % No % n= Yes % No % n= Yes % No % n= Yes % No % n=
Patient 19 81 636 34 66 88 29 71 98 51 49 35

The Healthcare Commission National Audit of Violence 2006-7 Final Report – Working Age Adult Services
109
Training
General Training Have you received any training related to Equal opportunities?
Acute Forensic PICU Rehab Yes % No % n= Yes % No % n= Yes % No % n= Yes % No % n=
Nursing staff 42 58 1066 53 47 272 55 45 314 60 40 81 Clinical staff 50 50 212 68 32 56 44 56 55 58 42 12 Non clinical staff 35 65 129 67 33 18 38 62 34 38 63 8 Have you received any training related to The 'Bournewood Ruling', especially in respect of restriction and deprivation of liberty?
Acute Forensic PICU Rehab Yes % No % n= Yes % No % n= Yes % No % n= Yes % No % n=
Nursing staff 16 84 1056 17 83 267 20 80 309 22 78 79 Clinical staff 32 68 209 33 67 54 31 69 54 50 50 12 Non clinical staff 12 88 120 0 100 18 10 90 29 13 88 8 Have you received any training related to The Mental Capacity Act, especially in respect of the best interests and least restrictive principles?
Acute Forensic PICU Rehab Yes % No % n= Yes % No % n= Yes % No % n= Yes % No % n=
Nursing staff 29 71 1069 37 63 269 34 66 309 44 56 78 Clinical staff 52 48 210 55 45 55 52 48 54 50 50 12 Non clinical staff 16 84 118 11 89 18 20 80 30 38 63 8

The Healthcare Commission National Audit of Violence 2006-7 Final Report – Working Age Adult Services
110
Undertaking personal searches Are you involved in undertaking personal searches?
Acute Forensic PICU Rehab Yes % No % n= Yes % No % n= Yes % No % n= Yes % No % n=
Nursing staff 58 42 1056 72 28 268 66 34 305 50 50 82 Clinical staff 5 95 214 16 84 57 11 89 54 17 83 12 Non clinical staff 1 99 136 0 100 20 3 97 37 11 89 9 Have you received appropriate instruction in undertaking personal searches, which is repeated and regularly updated?
Acute Forensic PICU Rehab Yes % No % n= Yes % No % n= Yes % No % n= Yes % No % n=
Nursing staff 34 66 610 60 40 193 43 58 200 36 64 39 Clinical staff 55 45 11 67 33 9 50 50 6 100 0 2 Non clinical staff 0 100 2 - - - 0 100 1 100 0 1

The Healthcare Commission National Audit of Violence 2006-7 Final Report – Working Age Adult Services
111
The management of actual incidents Are you involved in managing severely challenging/violent incidents?
Acute Forensic PICU Rehab Yes % No % n= Yes % No % n= Yes % No % n= Yes % No % n=
Nursing staff 85 15 1075 88 12 273 94 6 314 74 26 82 Clinical staff 46 54 214 58 42 57 54 46 56 67 36 11 Non clinical staff 7 93 139 5 95 20 6 94 36 11 89 9 Have you had access to training that promotes the use of non-physical interventions to recognise and prevent severely challenging/violent behaviour e.g. 'Promoting Safer and Therapeutic Services' training?
Acute Forensic PICU Rehab Yes % No % n= Yes % No % n= Yes % No % N= Yes % No % n=
Nursing staff 71 29 904 85 15 238 78 22 290 77 23 61 Clinical staff 67 33 95 90 10 30 73 27 30 100 0 7 Non clinical staff 70 30 10 100 0 1 0 100 2 0 100 1 Has your training been adequate to enable you to minimise the risk of a severely challenging/violent incident occurring?
Acute Forensic PICU Rehab Yes % No % n= Yes % No % n= Yes % No % n= Yes % No % n=
Nursing staff 76 24 889 88 12 233 85 15 287 72 28 60 Clinical staff 76 24 94 91 9 32 90 10 30 86 14 7 Non clinical staff 70 30 10 100 0 1 50 50 2 0 100 1 Has your training been adequate to enable you to deal with a severely challenging/violent incident when one occurs?
Acute Forensic PICU Rehab Yes % No % n= Yes % No % n= Yes % No % n= Yes % No % n=
Nursing staff 79 21 875 90 10 233 88 12 285 81 19 57 Clinical staff 77 23 91 97 3 32 86 14 29 57 43 7 Non clinical staff 70 30 10 100 0 1 50 50 2 0 100 1

The Healthcare Commission National Audit of Violence 2006-7 Final Report – Working Age Adult Services
112
Have you received training in how to record any incident using the appropriate local templates?
Acute Forensic PICU Rehab Yes % No % n= Yes % No % n= Yes % No % n= Yes % No % n=
Nursing staff 63 37 866 70 30 234 72 28 283 66 34 56 Clinical staff 47 53 93 65 35 31 57 43 30 67 33 6 Non clinical staff 40 60 10 100 0 1 50 50 2 0 100 1
Observation Are you involved in carrying out observations?
Acute Forensic PICU Rehab Yes % No % n= Yes % No % n= Yes % No % n= Yes % No % n=
Nursing staff 94 6 1085 96 4 270 97 3 310 85 15 80 Clinical staff 23 77 217 23 77 57 27 73 56 33 67 12 Non clinical staff 4 96 143 10 90 20 19 81 36 11 89 9 Do you receive ongoing competency training in observation?
Acute Forensic PICU Rehab Yes % No % n= Yes % No % n= Yes % No % n= Yes % No % n=
Nursing staff 31 69 685 35 65 162 37 63 194 29 71 59 Clinical staff 43 57 30 22 78 9 50 50 14 0 100 3 Non clinical staff 0 100 5 0 100 1 0 100 4 - - 0

The Healthcare Commission National Audit of Violence 2006-7 Final Report – Working Age Adult Services
113
Rapid Tranquillisation Are you involved in administering or prescribing rapid tranquillisation, or in monitoring patients to whom parenteral rapid tranquillisation has been administered?
Acute Forensic PICU Rehab Yes % No % n= Yes % No % n= Yes % No % n= Yes % No % n=
Nursing staff 68 32 1068 64 36 273 75 25 315 32 68 82 Clinical staff 44 56 218 33 67 57 48 52 56 50 50 12 Non clinical staff 1 99 141 0 100 20 0 100 35 0 100 9 Have you received training around the legal framework that authorises the use of rapid tranquillisation?
Acute Forensic PICU Rehab Yes % No % n= Yes % No % n= Yes % No % n= Yes % No % n=
Nursing staff 51 49 715 59 41 169 56 44 236 54 46 24 Clinical staff 74 26 96 79 21 19 74 26 27 67 33 6 Non clinical staff 50 50 2 - - - - - - - - - Are you trained in the use of pulse oximeters?
Acute Forensic PICU Rehab Yes % No % n= Yes % No % n= Yes % No % n= Yes % No % n=
Nursing staff 41 59 714 33 67 168 46 54 233 17 83 23 Clinical staff 61 39 96 47 53 19 56 44 27 50 50 6 Non clinical staff 50 50 2 - - - - - - - - - Do you receive ongoing competency training to a level of Immediate Life Support (ILS - Resuscitation Council UK)?
Acute Forensic PICU Rehab Yes % No % n= Yes % No % n= Yes % No % n= Yes % No % n=
Nursing staff 68 32 700 71 29 167 72 28 228 70 30 20 Clinical staff 71 29 95 100 0 19 67 33 27 100 0 6 Non clinical staff 50 50 2 - - - - - - - - -

The Healthcare Commission National Audit of Violence 2006-7 Final Report – Working Age Adult Services
114
Hands-on restraint Are you involved in using hands-on restraint?
Acute Forensic PICU Rehab Yes % No % n= Yes % No % n= Yes % No % n= Yes % No % n=
Nursing staff 84 16 1079 89 11 272 92 8 312 64 36 81 Clinical staff 16 84 219 33 67 57 23 77 57 33 67 12 Non clinical staff 4 96 146 10 90 20 3 97 36 13 88 8 Have you received training around the legal framework that authorises the use of hands-on restraint?
Acute Forensic PICU Rehab Yes % No % n= Yes % No % n= Yes % No % n= Yes % No % n=
Nursing staff 86 14 874 91 9 239 93 7 281 80 20 50 Clinical staff 87 13 31 89 11 18 100 0 13 100 0 3 Non clinical staff 67 33 6 100 0 2 100 0 1 0 100 1 Have you been trained in Basic Life Support (BLS - Resuscitation Council UK)?
Acute Forensic PICU Rehab Yes % No % n= Yes % No % n= Yes % No % n= Yes % No % n=
Nursing staff 84 16 874 86 14 239 87 13 280 80 20 49 Clinical staff 97 3 32 94 6 18 92 8 13 100 0 3 Non clinical staff 100 0 6 100 0 2 0 100 1 0 100 1

The Healthcare Commission National Audit of Violence 2006-7 Final Report – Working Age Adult Services
115
Seclusion Have you been directly involved in the care of a secluded patient on this ward during the last year?
Acute Forensic PICU Rehab Yes % No % n= Yes % No % n= Yes % No % n= Yes % No % n=
Nursing staff 33 67 1079 53 47 267 59 41 310 26 74 80 Clinical staff 14 86 219 32 68 56 31 69 54 17 83 12 Non clinical staff 2 98 139 0 100 20 3 97 36 0 100 9 Have you received training around the legal framework that authorises the use of seclusion?
Acute Forensic PICU Rehab Yes % No % n= Yes % No % n= Yes % No % n= Yes % No % n=
Nursing staff 52 48 343 70 30 141 65 35 184 33 67 21 Clinical staff 55 45 29 67 33 18 59 41 17 50 50 2 Non clinical staff 0 100 3 - - - 100 0 1 - - 0 Do you receive ongoing competency training in the use of seclusion?
Acute Forensic PICU Rehab Yes % No % n= Yes % No % n= Yes % No % n= Yes % No % n=
Nursing staff 36 64 343 53 47 139 52 48 183 19 81 21 Clinical staff 24 76 29 56 44 18 41 59 17 100 0 2 Non clinical staff 0 100 2 - - - 100 0 1 - - 0

The Healthcare Commission National Audit of Violence 2006-7 Final Report – Working Age Adult Services
116
Being given information Have you been given enough information about why you have been admitted to the ward?
Acute Forensic PICU Rehab Yes % No % n= Yes % No % n= Yes % No % n= Yes % No % n=
Patient 73 27 717 72 28 103 60 40 121 77 23 43 Have you been given enough information about how the ward is run, for example visiting times, complaints procedure, ward rounds?
Acute Forensic PICU Rehab Yes % No % n= Yes % No % n= Yes % No % n= Yes % No % n=
Patient 70 30 722 77 23 102 66 34 120 86 14 44 Are you satisfied with your involvement in decisions about your care (e.g. treatment and medication)?
Acute Forensic PICU Rehab Yes % No % n= Yes % No % n= Yes % No % n= Yes % No % n=
Patient 68 32 714 65 35 103 61 39 117 84 16 43 Have you been given information about how to get advice or help from someone who does not work here, for example an advocate?
Acute Forensic PICU Rehab Yes % No % n= Yes % No % n= Yes % No % n= Yes % No % n=
Patient 57 43 713 79 21 103 63 37 118 72 28 39

The Healthcare Commission National Audit of Violence 2006-7 Final Report – Working Age Adult Services
117
Have you been put under close observation during your admission to this ward?
Acute Forensic PICU Rehab Yes % No % n= Yes % No % n= Yes % No % n= Yes % No % n=
Patient 52 48 707 62 38 101 50 50 119 30 70 44 Was the reason you were put under observation explained to you?
Acute Forensic PICU Rehab Yes % No % n= Yes % No % n= Yes % No % n= Yes % No % n=
Patient 68 32 333 71 29 56 69 31 54 75 25 12 Were you told how long observation was likely to be maintained?
Acute Forensic PICU Rehab Yes % No % n= Yes % No % n= Yes % No % n= Yes % No % n=
Patient 33 67 313 64 36 55 40 60 50 50 50 12

The Healthcare Commission National Audit of Violence 2006-7 Final Report – Working Age Adult Services
118
Things to do Are there daily opportunities for group interaction and/or recreation?
Acute Forensic PICU Rehab Yes % No % n= Yes % No % n= Yes % No % n= Yes % No % n=
Patient 73 27 714 82 18 102 78 22 116 86 14 42 Are there daily opportunities for physical activity/exercise?
Acute Forensic PICU Rehab Yes % No % n= Yes % No % n= Yes % No % n= Yes % No % n=
Patient 49 51 707 75 25 102 53 47 115 89 11 44 Do you think that there is an adequate choice of therapies available during the day?
Acute Forensic PICU Rehab Yes % No % n= Yes % No % n= Yes % No % n= Yes % No % n=
Patient 44 56 693 54 46 100 50 50 111 81 19 43 Do you think that there is an adequate choice of activities available during the day?
Acute Forensic PICU Rehab Yes % No % n= Yes % No % n= Yes % No % n= Yes % No % n=
Patient 48 52 695 62 38 99 54 46 116 86 14 44 Do you think that there is an adequate choice of activities available in the evenings and at weekends?
Acute Forensic PICU Rehab Yes % No % n= Yes % No % n= Yes % No % n= Yes % No % n=
Patient 29 71 693 34 66 100 40 60 116 59 41 44

The Healthcare Commission National Audit of Violence 2006-7 Final Report – Working Age Adult Services
119
Supervision Do you currently receive one-to-one clinical supervision?
Acute Forensic PICU Rehab Yes % No % N= Yes % No % n= Yes % No % n= Yes % No % n=
Nursing staff 60 40 1074 65 35 274 74 26 311 48 52 79 Clinical staff 70 30 216 82 18 57 81 19 54 83 17 12 Non clinical staff 15 85 136 0 100 19 26 74 34 0 100 9 How often does the supervision take place?
Acute Weekly % Fortnightly
% Monthly % Less than monthly
% n=
Nursing staff 5 6 56 33 630 Clinical staff 34 13 42 10 149 Non clinical staff 11 22 56 11 18
Forensic Weekly % Fortnightly
% Monthly % Less than monthly
% n=
Nursing staff 3 6 56 34 172 Clinical staff 26 19 51 4 47 Non clinical staff - - - - -
PICU Weekly % Fortnightly
% Monthly % Less than monthly
% n=
Nursing staff 4 7 62 27 227 Clinical staff 43 16 34 7 44 Non clinical staff 56 0 22 22 9

The Healthcare Commission National Audit of Violence 2006-7 Final Report – Working Age Adult Services
120
Rehab Weekly % Fortnightly
% Monthly % Less than monthly
% N=
Nursing staff 3 0 76 22 37 Clinical staff 20 20 50 10 10 Non clinical staff - - - - - How would you rate your satisfaction with the frequency of supervision that you get?
Acute Totally satisfied
% Satisfied % Dissatisfied
% Totally dissatisfied
% n=
Nursing staff 28 54 15 3 640 Clinical staff 38 55 6 1 149 Non clinical staff 33 67 0 0 18
Forensic Totally satisfied
% Satisfied % Dissatisfied
% Totally dissatisfied
% n=
Nursing staff 25 59 14 2 171 Clinical staff 45 53 2 4 47 Non clinical staff - - - - -
PICU Totally satisfied
% Satisfied % Dissatisfied
% Totally dissatisfied
% n=
Nursing staff 28 62 8 1 229 Clinical staff 43 52 5 0 44 Non clinical staff 33 56 11 22 9
Rehab Totally satisfied
% Satisfied % Dissatisfied
% Totally dissatisfied
% N=
Nursing staff 26 71 3 0 38 Clinical staff 60 40 0 0 10 Non clinical staff - - - - -

The Healthcare Commission National Audit of Violence 2006-7 Final Report – Working Age Adult Services
121
How would you rate your satisfaction with the quality of supervision that you get?
Acute Totally satisfied
% Satisfied % Dissatisfied
% Totally dissatisfied
% N=
Nursing staff 33 59 7 2 638 Clinical staff 38 56 6 0 149 Non clinical staff 35 65 0 0 20
Forensic Totally satisfied
% Satisfied % Dissatisfied
% Totally dissatisfied
% N=
Nursing staff 36 56 8 1 170 Clinical staff 41 52 7 0 46 Non clinical staff - - - - -
PICU Totally satisfied
% Satisfied % Dissatisfied
% Totally dissatisfied
% N=
Nursing staff 33 63 4 1 228 Clinical staff 41 57 2 0 44 Non clinical staff 25 75 0 0 8
Rehab Totally satisfied
% Satisfied % Dissatisfied
% Totally dissatisfied
% N=
Nursing staff 26 71 3 0 38 Clinical staff 60 40 0 0 10 Non clinical staff - - - - -

The Healthcare Commission National Audit of Violence 2006-7 Final Report – Working Age Adult Services
122
Does your supervision include incidents and events relating to the prevention and management of violence?
Acute Forensic PICU Rehab Yes % No % n= Yes % No % n= Yes % No % n= Yes % No % n=
Nursing staff 70 30 625 76 24 171 84 16 224 47 53 46 Clinical staff 63 37 145 65 35 46 66 34 44 70 30 10 Non clinical staff 50 50 18 - - - 33 67 9 - - -

The Healthcare Commission National Audit of Violence 2006-7 Final Report – Working Age Adult Services
123
Supports from other colleagues In relation to managing severely challenging/violent behaviour, how would you rate your satisfaction with the supports that you get from other staff on this ward?
Acute Totally satisfied
% Satisfied % Dissatisfied
% Totally dissatisfied
% n=
Nursing staff 32 60 7 1 1068 Clinical staff 25 70 6 0 200 Non clinical staff 34 57 6 3 114
Forensic Totally satisfied
% Satisfied % Dissatisfied
% Totally dissatisfied
% n=
Nursing staff 30 63 6 1 274 Clinical staff 45 53 2 0 49 Non clinical staff 36 64 0 0 14
PICU Totally satisfied
% Satisfied % Dissatisfied
% Totally dissatisfied
% n=
Nursing staff 42 50 8 0 312 Clinical staff 41 54 6 0 54 Non clinical staff 50 47 3 0 32
Rehab Totally satisfied
% Satisfied % Dissatisfied
% Totally dissatisfied
% n=
Nursing staff 32 63 5 0 79 Clinical staff 58 42 0 0 12 Non clinical staff 71 14 0 14 7

The Healthcare Commission National Audit of Violence 2006-7 Final Report – Working Age Adult Services
124
In relation to managing severely challenging/violent behaviour, how would you rate your satisfaction with the supports that you get from the senior management team within your directorate?
Acute Totally satisfied
% Satisfied % Dissatisfied
% Totally dissatisfied
% n=
Nursing staff 16 50 27 7 1059 Clinical staff 17 66 15 2 190 Non clinical staff 28 58 12 3 109
Forensic Totally satisfied
% Satisfied % Dissatisfied
% Totally dissatisfied
% n=
Nursing staff 12 61 24 3 271 Clinical staff 29 61 8 2 49 Non clinical staff 36 57 7 0 14
PICU Totally satisfied
% Satisfied % Dissatisfied
% Totally dissatisfied
% n=
Nursing staff 20 54 23 4 311 Clinical staff 25 65 10 0 52 Non clinical staff 45 38 17 0 29
Rehab Totally satisfied
% Satisfied % Dissatisfied
% Totally dissatisfied
% n=
Nursing staff 10 58 29 3 77 Clinical staff 17 67 17 0 12 Non clinical staff 57 29 0 14 7

The Healthcare Commission National Audit of Violence 2006-7 Final Report – Working Age Adult Services
125
How would you rate your satisfaction with the quality of leadership on the ward?
Acute Totally satisfied
% Satisfied % Dissatisfied
% Totally dissatisfied
% n=
Nursing staff 33 53 12 2 1056 Clinical staff 28 62 9 0 203 Non clinical staff 41 54 5 0 118
Forensic Totally satisfied
% Satisfied % Dissatisfied
% Totally dissatisfied
% n=
Nursing staff 24 60 14 2 270 Clinical staff 30 60 6 4 53 Non clinical staff 33 60 7 0 15
PICU Totally satisfied
% Satisfied % Dissatisfied
% Totally dissatisfied
% n=
Nursing staff 37 53 9 1 308 Clinical staff 41 52 7 0 54 Non clinical staff 50 44 3 3 34
Rehab Totally satisfied
% Satisfied % Dissatisfied
% Totally dissatisfied
% n=
Nursing staff 31 63 5 1 80 Clinical staff 50 50 0 0 12 Non clinical staff 78 22 0 0 9

The Healthcare Commission National Audit of Violence 2006-7 Final Report – Working Age Adult Services
126
The way that severely challenging/violent behaviour has been dealt with on the ward Do you think that staff deal effectively with severely challenging/violent behaviour:
Acute Forensic PICU Rehab Yes % No % n= Yes % No % n= Yes
% No %
n= Yes % No % n=
Nursing staff 93 7 1060 94 6 272 94 6 314 96 4 79 Clinical staff 92 8 207 94 6 53 98 2 51 100 0 12 Non clinical staff 96 4 121 100 0 15 100 0 34 100 0 8 Patient 81 19 650 76 24 92 77 23 111 93 7 42
Between patients
Visitor 86 14 209 96 4 49 98 2 48 100 0 13
Acute Forensic PICU Rehab Yes % No % N= Yes % No % n= Yes
% No %
n= Yes % No % n=
Nursing staff 85 15 1035 87 13 263 90 10 307 88 12 75 Clinical staff 89 11 198 92 8 52 96 4 50 92 8 12 Non clinical staff 93 8 120 100 0 15 97 3 34 100 0 8 Patient 86 14 588 79 21 85 72 28 95 95 5 38
Towards staff from patients
Visitor 90 10 192 94 6 50 98 2 48 100 0 12 Would you feel comfortable to confidentially report an incident of staff abuse towards a patient?
Acute Forensic PICU Rehab Yes % No % n= Yes % No % n= Yes % No % n= Yes % No % n=
Nursing staff 92 8 1074 90 10 271 94 6 313 90 10 80 Clinical staff 92 8 207 98 2 56 91 9 53 82 18 11 Non clinical staff 91 9 127 100 0 19 97 3 34 100 0 9 Patient 73 27 680 71 29 96 78 22 116 77 23 39 Visitor 92 8 250 95 5 56 91 9 55 100 0 16

The Healthcare Commission National Audit of Violence 2006-7 Final Report – Working Age Adult Services
127
Do you think staff resort too quickly to using medication when managing severely challenging/violent incidents?
Acute Forensic PICU Rehab Yes % No % n= Yes % No % n= Yes % No % n= Yes % No % n=
Nursing staff 13 87 1074 13 87 269 12 88 312 17 83 77 Clinical staff 25 75 197 20 80 50 25 75 51 17 83 12 Non clinical staff 14 86 106 7 93 14 0 100 34 0 100 8 Patient 36 64 619 40 60 89 47 53 110 39 61 41 Visitor 26 74 198 16 84 45 13 87 47 0 100 12 Do you think staff resort too quickly to using hands-on restraint when managing severely challenging/violent incidents?
Acute Forensic PICU Rehab Yes % No % n= Yes % No % n= Yes % No % n= Yes % No % n=
Nursing staff 8 92 1070 9 91 270 7 93 313 9 91 76 Clinical staff 10 90 194 12 88 52 18 82 51 8 92 12 Non clinical staff 8 92 109 0 100 14 0 100 33 0 100 9 Patient 30 70 617 28 72 93 35 65 110 21 79 42 Visitor 16 84 200 11 89 44 15 85 47 0 100 12 Do you think staff resort too quickly to using seclusion when managing severely challenging/violent incidents?
Acute Forensic PICU Rehab Yes % No % n= Yes % No % n= Yes % No % n= Yes % No % n=
Nursing staff 5 95 1009 8 92 261 7 93 293 3 97 74 Clinical staff 2 98 184 12 88 50 10 90 50 9 91 11 Non clinical staff 7 93 102 0 100 13 0 100 32 0 100 9 Patient 24 76 559 29 71 85 32 68 107 24 76 38 Visitor 13 87 189 9 91 44 12 88 43 9 91 11

The Healthcare Commission National Audit of Violence 2006-7 Final Report – Working Age Adult Services
128
Have all incidents of severely challenging/violent behaviour that you have been aware of in the past year been reported/recorded?
Acute Forensic PICU Rehab Yes % No % n= Yes % No % n= Yes % No % n= Yes % No % n=
Nursing staff 90 10 1043 94 6 272 94 6 311 92 8 76 Clinical staff 93 7 175 92 8 51 93 7 46 83 17 12 Non clinical staff 93 7 94 100 0 16 100 0 28 67 33 9 Are patients routinely given the opportunity to discuss their experiences of being involved in severely challenging/violent incidents (either as perpetrator, victim or witness)?
Acute Forensic PICU Rehab Yes % No % n= Yes % No % n= Yes % No % n= Yes % No % n=
Nursing staff 70 30 1037 87 13 269 80 20 308 82 18 76 Clinical staff 71 29 159 80 20 51 82 18 44 67 33 12 Non clinical staff 85 15 81 93 7 15 96 4 26 57 43 7

The Healthcare Commission National Audit of Violence 2006-7 Final Report – Working Age Adult Services
129
Experiences of severely challenging/violent behaviour on the ward Have you personally been made to feel upset/distressed by a patient's severely challenging/violent behaviour?
Acute Forensic PICU Rehab Yes % No % n= Yes % No % n= Yes % No % n= Yes % No % n=
Nursing staff 61 39 1081 54 46 274 58 42 315 49 51 79 Clinical staff 40 60 217 30 70 56 41 59 54 17 83 12 Non clinical staff 28 72 144 22 78 18 21 79 38 67 33 9 Patient 43 57 700 58 42 96 43 57 114 39 61 31 Visitor 20 80 270 13 88 64 11 89 57 8 92 13 Have you personally been threatened or made to feel unsafe?
Acute Forensic PICU Rehab Yes % No % n= Yes % No % n= Yes % No % n= Yes % No % n=
Nursing staff 73 27 1083 66 34 274 78 22 316 62 38 79 Clinical staff 44 56 219 41 59 56 57 43 56 25 75 12 Non clinical staff 34 66 147 11 89 18 39 61 38 44 56 9 Patient 31 69 706 49 51 97 39 61 111 24 76 29 Visitor 18 82 271 8 92 64 7 93 57 0 100 15 Have you personally been physically assaulted?
Acute Forensic PICU Rehab Yes % No % n= Yes % No % n= Yes % No % n= Yes % No % n=
Nursing staff 45 55 1084 33 67 275 61 39 313 36 64 81 Clinical staff 12 88 220 7 93 56 22 78 55 17 83 12 Non clinical staff 9 91 146 0 100 18 8 92 38 11 89 9 Patient 15 85 707 25 75 97 26 74 117 26 74 31 Visitor 3 97 268 3 97 64 5 95 56 0 100 15

The Healthcare Commission National Audit of Violence 2006-7 Final Report – Working Age Adult Services
130
Did staff give the people involved the opportunity to talk about the experience?
Acute Forensic PICU Rehab Yes % No % n= Yes % No % n= Yes % No % n= Yes % No % n=
Patient 55 45 283 67 33 54 57 43 49 82 18 11 Visitor 56 44 61 100 0 7 100 0 7 100 0 1 Has anyone given you advice on what to do if you see or hear about someone behaving in a way that is severely challenging/violent, for example how to summon help?
Acute Forensic PICU Rehab Yes % No % n= Yes % No % n= Yes % No % n= Yes % No % n=
Patient 33 67 572 58 42 76 48 52 89 48 52 27 Visitor 39 61 237 67 33 58 65 35 52 62 38 13

The Healthcare Commission National Audit of Violence 2006-7 Final Report – Working Age Adult Services
131
Appendix 6 Environmental Audit Overall National Findings (n=117)
Standard Met Not
Met N/A PEAT
1 All areas look clean 59 14 27 2 All areas look friendly 58 29 13 3 All areas smell clean 66 15 18 4 There is natural daylight 71 14 15 5 There is natural fresh air 81 19 6 There is a perception of space and overcrowding is avoided 73 27 7 Noise levels are adjusted to meet the needs of the people living/residing on the ward 71 20 8 8 Ambient temperatures and ventilation area adequately controlled 39 52 8 9 Sight-lines are unimpeded 50 50 10 There are good routes of entry and exit in the event of an emergency e.g. fire,
disturbed/violent behaviour 77 11 12
11 A crash bag is available within 3 minutes 85 13 2 12 Crash bag equipment is maintained and checked weekly 84 12 4 13 Provision is made for children visiting the ward 69 13 6 12 14 There are single sex toilets 92 8 15 There are single sex washing areas 93 7 16 There are single sex day areas 51 34 4 10 17 There is single sex sleeping accommodation 85 5 10 18 There is a separate area to receive patients with police escorts 62 33 5 19 There are adequate quiet spaces for patients for prayer and quiet reflection 73 27 20 Long narrow corridors and numerous doors or corridors that lead to locked doors and
dead ends, are avoided 61 27 13
21 Doors are colour-coded to help patients to identify rooms. There are clear and simple signs at a visible height
35 35 29
22 The ward provides suitable access and facilities for people who have special needs 69 31 23 Internal smoking areas/rooms have powerful ventilation and are fitted with a smoke-
stop door(s) 38 33 21 8
24 Patients have access to an outside area which is adequately fenced to ensure privacy and security
67 33
25 There is an activity room on the ward 74 26

The Healthcare Commission National Audit of Violence 2006-7 Final Report – Working Age Adult Services
132
26 The ward environment helps patients become and remain oriented 70 14 16 27 There is a day room with a television 97 3 28 There is a safe designated area or room specifically for the purpose of reducing arousal
and/or agitation. This is in addition to a seclusion room 54 46
29 There is a designated seclusion room which is ‘fit for purpose’ 29 22 50 30 Patients can lock their bedroom doors (with external override) 64 33 3 31 Patients can lock bathroom doors (with external override) 95 4 1 32 Patients can lock toilet doors (with external staff override) 94 5 1 33 Personal effects are safe and accessible 77 23 34 Furniture is arranged so that alarms can be reached and doors are not obstructed 88 12 35 There are accessible alarms in interview rooms, reception areas and other areas where
one patient and one staff member work together 86 14
36 There is a system that ensures that all alarms (for example panic buttons and personal alarms) are well maintained and checked regularly
87 13
37 A copy of the policy for preventing and dealing and dealing with all forms of harassment and abuse is display prominently
61 39
38 Meals or other foods (finger foods) are available outside of mealtimes 91 8 1

The Healthcare Commission National Audit of Violence 2006-7 Final Report – Working Age Adult Services
133
Appendix 7
Case note/drug chart audit on the use of rapid tranquillisation (n=65) Notes • Percentages are presented without decimal points (e.g. 56%, rather than 56.4%), resulting in some ‘rounding up’ of
scores, meaning that sometimes total scores will appear to be 99% or 101%. • Good practice has been highlighted in green on the graphs. Areas of concern have been highlighted in red.
Section 1: Carrying out rapid tranquillisation NOTE This section of the audit was completed by ALL respondents. The total number of cases audited by services for adults of working age nationally was 532 (n=532), however, the total national figures in some tables/charts do not add up to the expected number due to missing data. 1.8.4.7 Guideline recommendation Oral medication should be offered before parenteral medication as far as possible. 1.8.4.14 Guideline recommendation If parenteral treatment proves necessary, the intramuscular route is preferred over intravenous from a safety point of view. Which route of administration was used?
Oral Intramuscular Oral/ Intramuscular
Total n
64% 26% 9% 532

The Healthcare Commission National Audit of Violence 2006-7 Final Report – Working Age Adult Services
134
1.8.4.9 Guideline recommendation Oral and intramuscular medications should be prescribed separately and the abbreviation of o/i/m should not be used.
Are oral and intramuscular medications written up separately on the drug chart?
72%
28%
0%
20%
40%
60%
80%
100%
Total n=515
YesNo

The Healthcare Commission National Audit of Violence 2006-7 Final Report – Working Age Adult Services
135
Prescribing levels
1.8.4.28 Guideline recommendation When using rapid tranquillisation there may be certain circumstances in which the current BNF uses and limits and manufacturer’s SPC may be knowingly exceeded. A risk–benefit analysis should be recorded in the case notes and a rationale should be recorded in the care plan.
Were BNF or SPC doses exceeded?
96%
4%
0%
20%
40%
60%
80%
100%
Total n=520
YesNo

The Healthcare Commission National Audit of Violence 2006-7 Final Report – Working Age Adult Services
136
If BNF doses were exceeded
19%
31%
81%
69%
0%
20%
40%
60%
80%
100%
Total n=16 Total n=16
Was a risk benefit analysis recorded in thenotes?
Was the rationale recorded in the careplan?
YesNo

The Healthcare Commission National Audit of Violence 2006-7 Final Report – Working Age Adult Services
137
Section 2: The use of oral medication NOTE: the respondent group for this section included: • cases where ONLY ORAL RAPID TRANQUILLISATION was administered; • cases where ORAL AND INTRAMUSCULAR RAPID TRANQUILLISATION were administered. The total number of respondents nationally was 392 (n=392), however, the total national figures in some tables/charts do not add up to the expected number due to missing data. 1.8.4.10 Guideline recommendation When the behavioural disturbance occurs in a non-psychotic context it is preferable to initially use oral lorazepam alone or intramuscularly if necessary. Did the behavioural disturbance occur in a non-psychotic context?
Was oral lorazepam used alone initially?
71%
29%
0%
20%
40%
60%
80%
100%
Total n=162
YesNo
Yes No Total n
43% 57% 384

The Healthcare Commission National Audit of Violence 2006-7 Final Report – Working Age Adult Services
138
1.8.4.11 Guideline recommendation When the behavioural disturbance occurs in the context of psychosis, to achieve early onset of calming/sedation, or to achieve a lower dose of antipsychotic, an oral antipsychotic in combination with oral lorazepam, should be considered in the first instance (see chart for rapid tranquillisation). Did the behavioural disturbance occur in the context of psychosis?
Was an oral antipsychotic given in combination with oral lorazepam initially?
69%
31%
0%
20%
40%
60%
80%
100%
Total n=211
YesNo
Yes No Total n
97% 3% 218

The Healthcare Commission National Audit of Violence 2006-7 Final Report – Working Age Adult Services
139
1.8.4.13 Guideline recommendation Sufficient time should be allowed for clinical response between oral doses of medication for rapid tranquillisation (see chart for rapid tranquillisation). Was oral medication for the purpose of tranquillisation given more than once during this period of treatment?
Was sufficient time allowed for clinical response between oral doses of medication?
95%
5%
0%
20%
40%
60%
80%
100%
Total n=108
YesNo
Yes No Total n
28% 72% 383

The Healthcare Commission National Audit of Violence 2006-7 Final Report – Working Age Adult Services
140
Section 3: the use of intramuscular medication NOTE: the respondent group for this section included: • cases where ONLY INTRAMUSCULAR RAPID TRANQUILLISATION was administered; • cases where ORAL AND INTRAMUSCULAR RAPID TRANQUILLISATION were administered. The total number of respondents nationally was 190 (n=190), however, the total figures in some tables/charts do not add up to the expected number due to missing data. 1.8.4.14 Guideline recommendation If parenteral treatment proves necessary, the intramuscular route (i/m) is preferred over intravenous (i/v) from a safety point of view.
Was intramuscular medication offered in preference to intravenous medication?
91%
9%
0%
20%
40%
60%
80%
100%
Total n=183
YesNo
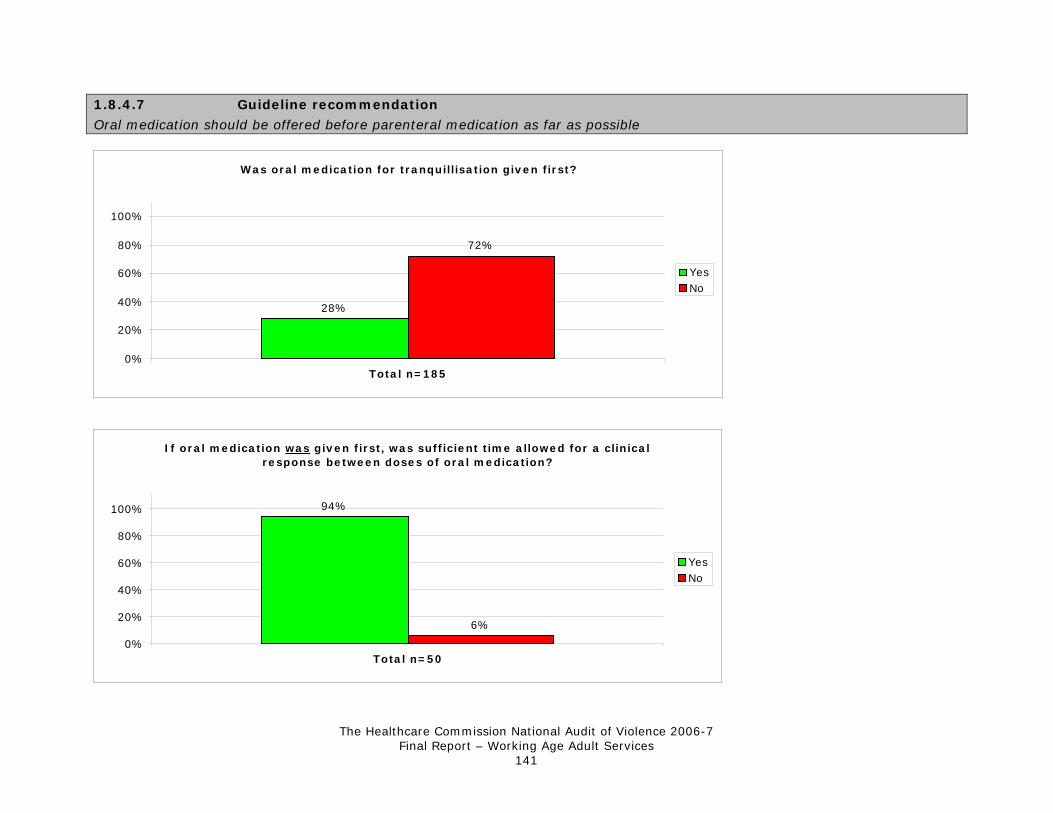
The Healthcare Commission National Audit of Violence 2006-7 Final Report – Working Age Adult Services
141
1.8.4.7 Guideline recommendation
Oral medication should be offered before parenteral medication as far as possible
If oral medication was given first, was sufficient time allowed for a clinical response between doses of oral medication?
94%
6%
0%
20%
40%
60%
80%
100%
Total n=50
YesNo
Was oral medication for tranquillisation given first?
28%
72%
0%
20%
40%
60%
80%
100%
Total n=185
YesNo

The Healthcare Commission National Audit of Violence 2006-7 Final Report – Working Age Adult Services
142
1.8.4.15 Guideline recommendation Where rapid tranquillisation through oral therapy • is refused • is not indicated by previous clinical response • is not a proportionate response • or is ineffective • a combination of an intramuscular anti-psychotic and an intramuscular benzodiazepine is recommended
If oral medication was not given, is there evidence that one of the four descriptions apply to the situation?
1%
99%
0%
20%
40%
60%
80%
100%
Total n=126
YesNo

The Healthcare Commission National Audit of Violence 2006-7 Final Report – Working Age Adult Services
143
1.8.4.10 Guideline recommendation When the behavioural disturbance occurs in a non-psychotic context it is preferable to initially use oral lorazepam alone or intramuscularly if necessary. Did the behavioural disturbance occur in a non-psychotic context?
Was intramuscular lorazepam used alone initially?
49% 51%
0%
20%
40%
60%
80%
100%
Total n=39
YesNo
Yes No Total n
22% 78% 181

The Healthcare Commission National Audit of Violence 2006-7 Final Report – Working Age Adult Services
144
1.8.4.16 Guideline recommendation In the event of moderate disturbance in service users with psychosis, i/m olanzapine may also be considered. Intramuscular lorazepam should not be given within 1 hour of i/m olanzapine.
Was intramuscular olanzapine given?
Was intramuscular lorazepam avoided within one hour?
86%
14%
0%
20%
40%
60%
80%
100%
Total n=21
YesNo
Yes No Total n
12% 88% 180

The Healthcare Commission National Audit of Violence 2006-7 Final Report – Working Age Adult Services
145
1.8.4.18 Guideline recommendation Sufficient time should be allowed for clinical response between intramuscular (i/m) doses of medications for rapid tranquillisation (see chart). Was intramuscular medication given on more than one occasion during this period of treatment?
Was sufficient time allowed for clinical response between intramuscular does of medication?
95%
5%
0%
20%
40%
60%
80%
100%
Total n=40
YesNo
Yes No Total n
23% 77% 176

The Healthcare Commission National Audit of Violence 2006-7 Final Report – Working Age Adult Services
146
1.8.4.19 Guideline recommendation The use of two drugs of the same class for the purpose of rapid tranquillisation should not occur.
Were two drugs of the same class used e.g. 2 antipsychotics?
12%
88%
0%
20%
40%
60%
80%
100%
Total n=175
YesNo

The Healthcare Commission National Audit of Violence 2006-7 Final Report – Working Age Adult Services
147
Use of zuclopentixol acetate (acuphase) 1.8.4.26 Guideline recommendation Zuclopenthixol acetate injection is not recommended for rapid tranquillisation due to long onset and duration of action. However, zuclopenthixol acetate injection may be considered as an option for rapid tranquillisation when: • it is clearly expected that the service user will be disturbed/violent over an extended period of time • a service user has a past history of good and timely response to zuclopenthixol acetate injection • a service user has a past history of repeated parenteral administration • an advance directive has been made indicating that this is a treatment of choice
If zuclopentixol acetate injection was used, is evidence that at least one of the above applied to the situation?
39%
61%
0%
20%
40%
60%
80%
100%
Total n=101
YesNo

The Healthcare Commission National Audit of Violence 2006-7 Final Report – Working Age Adult Services
148
Section 4: Care after rapid tranquillisation if the patient became inactive NOTE This section of the audit was completed by ALL respondents. The total number of respondents nationally was 532 (n= 532), however, the total national figures in some tables/charts do not add up to the expected number due to missing data. 1.8.4.33 Guideline recommendation
After rapid tranquillisation is administered, vital signs should be monitored and pulse oximeters should be available. Blood pressure, pulse, temperature, respiratory rate and hydration should be recorded regularly, at intervals agreed by a multidisciplinary team, until the service user becomes active again.
46% 48%54% 52%
0%
20%
40%
60%
80%
100%
Total n=437 Total n=406
Is there a record of how often it wasagreed that vital signs should be
monitored?
Did monitoring take place at the agreedintervals?
YesNo

The Healthcare Commission National Audit of Violence 2006-7 Final Report – Working Age Adult Services
149
1.8.4.34 Guideline recommendation In the following circumstances, more frequent and intensive monitoring by appropriately trained staff is required and should be recorded in the care plan. Particular attention should be paid to the service user’s respiratory effort, airway, and level of consciousness: • if the service user appears to be or is asleep/sedated • if intravenous administration has taken place • if the BNF limit or SPC is exceeded • in high-risk situations • where the service user has been using illicit substances or alcohol • where the service user has a relevant medical disorder or concurrently prescribed medication
Did any of the above circumstances apply?
Yes No Total n
50% 50% 437
If any of the above circumstances did apply, is there a record the particular attention was paid to:
45%
62%51%55%
38%49%
0%
20%
40%
60%
80%
100%
Total n=211 Total n=212 Total n=210
Airway? Level of consciousness? Respiratory effort?
YesNo

The Healthcare Commission National Audit of Violence 2006-7 Final Report – Working Age Adult Services
150
Section 5: Aftercare and support NOTE This section of the audit was completed by ALL respondents. The total number of sets of notes by audited by services for adults of working age nationally was 532 (n=532), however, the total national figures in some tables/charts do not add up to the expected number due to missing data. 1.8.1.8 Guideline recommendation After the use of rapid tranquillisation, service users should be given the opportunity to document their account of the intervention in their notes.
Was the patient given the opportunity to discuss or write about the incident?
69%
31%
0%
20%
40%
60%
80%
100%
Total n=509
YesNo

The Healthcare Commission National Audit of Violence 2006-7 Final Report – Working Age Adult Services
151
Appendix 8
Comparative report: key findings from older people’s services, relative to services for adults of working age Introduction Between October 2006 to March 2007, 215 wards for adults with mental health problems in England and Wales collected various types of data relating to the prevention and management of violence. Of these, 139 wards provided services for adults of working age; the remaining 76 provided services for older people. Separate reports have been produced that detail the findings from the two service areas. This paper summarises key comparative findings between the two. Experiences of severely challenging behaviour/violence on wards One component of the audit surveyed the experiences of staff, patients, and visitors. Questions were asked about their exposure to different severities of violent behaviour. As the results in the table below show, although nurses working in services for working age adults (WAA) were more likely than colleagues in older people’s services (OPS) to feel upset/distressed or threatened, they were less likely to experience actual physical assault. This increased risk of assault was not apparent for patients in older people’s services.
WAA OPS Nurses Patients Nurses Patients
Made to feel upset/distressed 58% 45% 54% 29% Threatened or made to feel unsafe 72% 34% 66% 14% Physically assaulted 46% 18% 64% 6% Nursing staff were asked about their involvement in the various tasks and activities associated with the prevention and management of violence. Findings showed that while there was a wide disparity in the extent to which staff in OPS versus WAA were being called upon to undertake searches, this gap narrowed in relation both to involvement in seclusion, and the administration/care of someone being given rapid tranquillisation. Even more surprisingly, there was only marginal difference in the extent to which nurses from either group might be involved in undertaking observation, or in administering hands-on restraint. WAA OPS Undertaking searches 61% 23% Seclusion 39% 18% Rapid tranquillisation 66% 48% Management of incidents 86% 79% Observation 95% 94% Hands-on restraint 85% 84%

The Healthcare Commission National Audit of Violence 2006-7 Final Report – Working Age Adult Services
152
The audit then looked at the perceptions of different respondent groups about how these incidents were being managed. The management of severely challenging/violent incidents When asked about whether they felt that staff dealt with violence effectively both between patients, and towards staff from patients, responses from all groups in both service areas were generally high (87% - 98%). The lowest ratings to both questions came from patients in WAA services (80% and 84%, respectively). In relation the management of actual incidents, the questionnaires went on to ask both patients and nurses about the extent to which a range of physical interventions were being used too quickly to deal with (potentially) violent incidents. Findings indicate that this is considerably more of a problem in WAA services, as the figures below illustrate.
WAA OPS Nurses Patients Nurses Patients
Use of medication too quickly 13% 38% 14% 21% Use of hands-on restraint too quickly 8% 30% 9% 14% Use of seclusion too quickly 6% 25% 3% 13%
Next, the audit examined the extent to which a range of evidence-based measures had been put in place to protect the people residing, working and spending substantial periods of time on these wards. How organisations support people in unsafe environments By providing a physical environment that is safe National levels of compliance for a number of very basic safety standards in the environmental audit were alarmingly low, particularly in OPS.
Met WAA OPS
Sight lines are unimpeded 50% 31% A crash bag is available within 3 minutes (where rapid tranquillisation, physical intervention and seclusion might be used)
85% 71%
There is a designated area or room specifically for the purpose of reducing arousal and/or agitation. This is in addition to a seclusion room.
54% 55%
By providing a comfortable environment On all standards relating to the comfort of the ward – the availability of space, temperature and noise levels, homeliness – results were similarly variable between different respondent groups for both WAA and OPS. One area of concern, particularly for wards for older people, was the lack of control over temperature and ventilation, with only 26% of OPS and 39% of WAA services meeting this standard.

The Healthcare Commission National Audit of Violence 2006-7 Final Report – Working Age Adult Services
153
By providing adequate alarm systems A considerable 25% of OPS nursing staff did not feel their alarm system was adequate (18% for WAA); only 61% had a consistent and rehearsed response to emergency alarm calls (83% for WAA); only 57% had access to a personal alarm (86% for WAA). By providing adequate staffing ratios While similar proportions of nursing staff in either service area felt that staff ratios were appropriate to the resident population (61% of OPS and 64% in WAA services), only 46% of OPS nursing staff agreed they could access additional resources if the ward had a difficult mix of patients, compared with 56% in services for WAA, and 76% of nursing staff felt that they did not have a say about admissions onto the ward (compared with 64% in WAA services). By providing adequate staff training Older people’s services: Although 79% of nurses were involved in managing incidents, only 66% of these had received ‘Promoting Safer and Therapeutic Services’ training (or equivalent) (75% for WAA); while 94% were involved in carrying out observations, only 27% of these had received training; 68% were involved in administering covert medication but only 36% of these had received training.
Services for adults of working age: 86% of nurses were involved in managing incidents and of these, 75% had received PSTS training (or equivalent), however: 21% felt it had not enabled them to minimise the risk of an incident (26% in OPS); 17% felt it had not enabled them to deal with an incident (27% in OPS). While 66% of nurses were involved in rapid tranquillisation, only 53% of these had been trained around the legal framework authorising its use, only 40% had been trained in the use of pulse oximeters, and 31% did not receive ongoing ILS training By providing adequate access to therapies and activities Levels of patient satisfaction with therapies and activities were similar across both groups, though access to physical activity/exercise would seem to be a problem in WAA services, and access to any activities during evenings and weekends for both groups.
Yes WAA OPS
Opportunities for group interaction and/or recreation? 75% 82% Daily opportunities for physical activity/exercise? 54% 62% Choice of therapies during the day? 47% 52% Choice of activities during the day? 52% 56% Choice of activities evenings/weekends? 33% 33% Indeed, the environmental audit revealed that 26% of WAA and 29% of OPS did not have an activity room on the ward. By providing opportunities to go outside When surveyed, an alarming 21% (WAA) and 24% (OPS) of patients said they did not have opportunities to go outdoors/leave the ward. These findings were backed up by the audit of the environment when 33% of local teams in services for WAA, and 26% in OPS said that their wards did not meet the standard that patients had access to an outside area which was adequately fenced to ensure privacy and security.

The Healthcare Commission National Audit of Violence 2006-7 Final Report – Working Age Adult Services
154
By ensuring staff are accessible Across all respondent groups, relative to WAA services, staff in OPS felt less satisfied with opportunities to discuss issues and concerns with colleagues. Interestingly, patients in both service areas generally felt that staff were available for them if they were concerned or upset (WAA = 88%, OPS = 91%). By giving people information The adequacy of the provision of information varied between service areas, depending on its type: information about why a person had been admitted was more readily available on WAA wards (WAA = 72%, OPS = 64%); information and involvement in decisions about their care was better rated by patients in OPS (WAA = 67%, OPS = 79%); information about how to access the support of an advocate was more accessible in services for WAA (WAA = 60%, OPS = 40%). By treating people with respect and dignity Patient satisfaction with the way religious and cultural needs were being met was higher in OPS. Similarly, 92% of patients in OPS felt they has been cared for in a dignified manner, compared with 83% in WAA services. In relation to having privacy when being given medication, however, 41% (WAA) and 40% (OPS) felt this standard was not being met.


If you would like to discuss this report or any aspects of the audit, please contact the Audit Team on the details below:
National Audit of Violence Royal College of Psychiatrists’ Centre for Quality Improvement
4th Floor, Standon House 21 Mansell Street
London E1 8AA
Tel: 020 7977 6645/6 Email: [email protected]
Website: www.rcpsych.ac.uk/nav
© 2007 The Royal College of Psychiatrists For further information contact [email protected]