health system reform © allen c. goodman, 2013. goals a health “safety net” for all residents,...
TRANSCRIPT

Health System Reform
© Allen C. Goodman, 2013

Goals
• A health “safety net” for all residents, irrespective of age, health status, or employment status
• Mechanisms that promote cost containment
• Choice for patients and providers
• Ease in administration
Resource Costs
B+ΔH
A
-ΔG
Health Goods
Non-Health Goods
Efficient Care
H0
G0
B
Inefficient Care
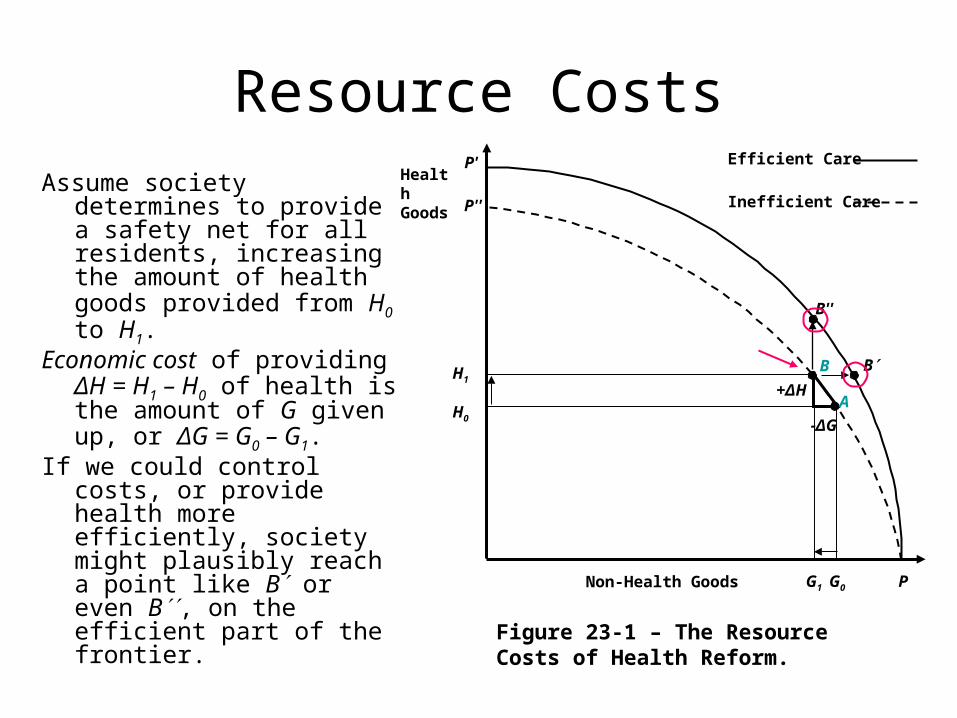
Figure 23-1 – The Resource Costs of Health Reform.
H1
P
B''
P'
P''
G1
Assume society determines to provide a safety net for all residents, increasing the amount of health goods provided from H0 to H1.
Economic cost of providing ΔH = H1 – H0 of health is the amount of G given up, or ΔG = G0 – G1.
If we could control costs, or provide health more efficiently, society might plausibly reach a point like B or even B, on the efficient part of the frontier.

One of the underlying goals of reform would move to more efficient production of health from health care.
A related issue is whether there will be cost-sharing for covered services and
If so, what type of cost-sharing arrangement will occur.
B+ΔH
A
-ΔG
Health Goods
Non-Health Goods
Efficient Care
H0
G0
B
Inefficient Care
Figure 23-1 – The Resource Costs of Health Reform.
H1
P
B''
P'
P''
G1

Costs of Incremental Care
• The truly incremental costs stem from several sources. – First, the major reason for switching to a NHI
plan is to extend coverage to the 50 million uninsured. It should be understood that the uninsured already consume health care.
– Zero insurance does not necessarily mean zero care.

Hadley et al (2008)
• Used data from the 2002–2004 Medical Expenditure Panel Surveys (MEPS), a nationally representative survey of the civilian, noninstitutionalized population.
• Estimated that uninsured Americans consumed $86 billion worth of health care in 2008. This total consisted of $30 billion in out-of-pocket costs and $56 billion in uncompensated care. Governments picked up about $43 billion of the latter.

Hadley – 2
• The authors then projected that the incremental cost of providing full-year coverage for all uninsured would amount to $123 billion, so that total spending of those currently uninsured would rise from $86 to $209 billion.
• This incremental cost represented 5.1% of total health care spending in the United States and slightly less than 1% of its GDP. The authors base their estimates on the utilization patterns of lower-income and lower-middle income individuals.
• More or less generous plans as well as higher or lower payment rates to providers would raise or lower estimated costs accordingly.

Hadley – 3
• Insured population will cost more to the extent that an NHI plan provides greater typical coverage than people already choose to buy or have provided to them by other sources.
• Also, any tax-supported system of financing care potentially entails a deadweight loss to society, as taxpayers respond to the changed incentives. The deadweight losses that accompany tax increases mean that some efficiency loss will result, caused by the disincentives to work and invest.
• This is true even if the program is of the employer-mandated type, because a law forcing employers to incur expense is really a tax.

Now?
• If you push up numbers by about 15% (5% per year), since 2008 you get:– 86 * 1.15 100– 123 * 1.15 142
• Health expenditures are about $2.5 Trillion. • This incremental cost represented 5 – 6% of
total health care spending in the United States and slightly less than 1% of its GDP.

?
Employer Mandate - Who pays?
We have demand …
… and supply.
They lead to a labor market equilibrium.
What happens if we provide $z per hour of insurance, that is worth $z to workers?
Who pays?
What happens if insurance costs rise?
Wage, W
Labor Mkt
DS
W*
L*
D
S
z z

Benefits
Is there no welfare loss?
We have demand …
… and supply.
They lead to a labor market equilibrium.
What happens if we provide $z per hour of insurance, that is worth $0 to workers?
Who pays?
What happens if insurance costs rise?
Wage, W
Labor Mkt
DS
W*
L*
Dz
L**
W**
DW Loss

Competitiveness?
Depends on Elasticity
• In previous diagram, who pays, depends on how elastic the demand is.
• In past, demand for cars, for example, was relatively inelastic.
• As US car-makers got more competition, what happened?

Stop Here
• Go to Levy_ACA_Nov-2013-a.ppt.
PPACA
• The U.S. Congress passed the Patient Protection and Affordable Care Act (PPACA) in March 2010.
• Focuses on two key areas– the problem of affordability in the individual
insurance market due to inadequate incomes or pre-existing conditions and
– the lack of coverage for employees of small businesses.
Features – 1 • Require most U.S. citizens and legal residents to have
health insurance, the individual mandate. Families without coverage will face penalties up to $2,085 per year or 2.5% of household income. Individuals and families with incomes as high as 400% of the federal poverty level (FPL) will be eligible for refundable credits or an expanded Medicaid program.
• Penalize employers with 50 or more full-time employees that do not offer coverage at a fee of $2,000 per full-time employee. Small businesses that provide health insurance for their employees will be eligible for tax credits. (Effective January 1, 2014).
• Expand Medicaid to all non-Medicare eligible individuals under age 65 (children, pregnant women, parents, and adults without dependent children) with incomes up to 133% of the federal poverty level FPL with a benchmark benefit package.
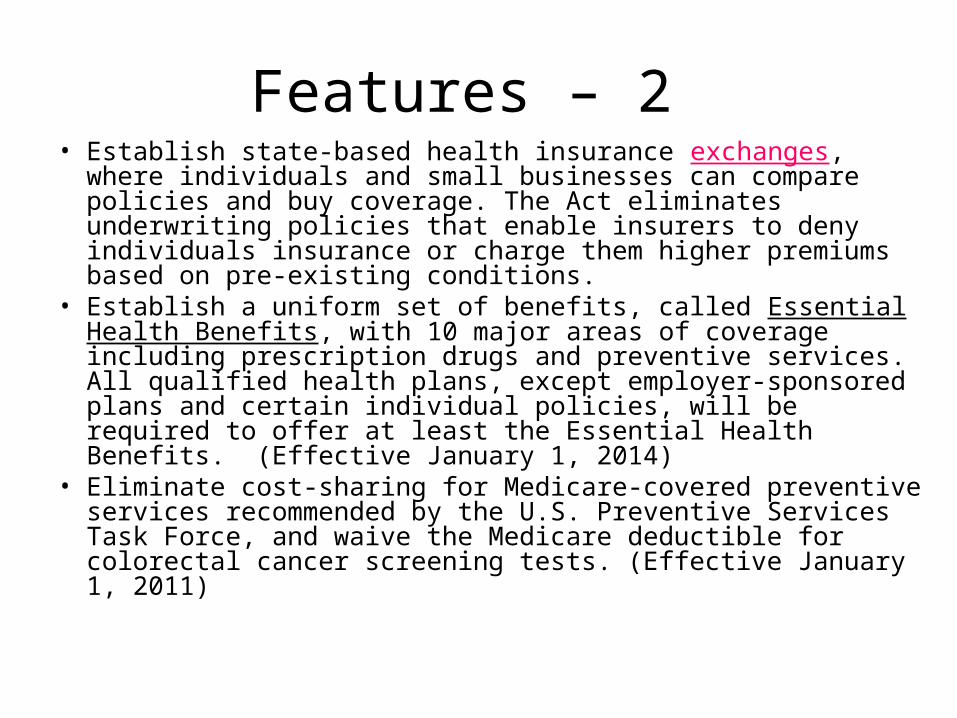
Features – 2 • Establish state-based health insurance exchanges, where
individuals and small businesses can compare policies and buy coverage. The Act eliminates underwriting policies that enable insurers to deny individuals insurance or charge them higher premiums based on pre-existing conditions.
• Establish a uniform set of benefits, called Essential Health Benefits, with 10 major areas of coverage including prescription drugs and preventive services. All qualified health plans, except employer-sponsored plans and certain individual policies, will be required to offer at least the Essential Health Benefits. (Effective January 1, 2014)
• Eliminate cost-sharing for Medicare-covered preventive services recommended by the U.S. Preventive Services Task Force, and waive the Medicare deductible for colorectal cancer screening tests. (Effective January 1, 2011)

Incentives
• “Cadillac” tax on high-cost employer-provided policies.
• In addition to this tax, funding for the program comes mainly from an expanded Medicare tax base that will affect higher income individuals and families, fees on health insurers, and taxes on manufacturers and importers of branded drugs and certain medical devices.
• These new revenue streams will nevertheless fall short of the increased federal obligations under PPACA.

Exchanges
• A key feature in PPACA is the establishment of state-level “exchanges” which one might think of as an Orbitz for health care, in which agents (individuals, but most likely employers) can shop for packages of health insurance.[1] This will start January 1, 2014, with hopes of being financially self-sustaining by January 1, 2015. The exchanges will be based on the Massachusetts Connector mechanism in Massachusetts’s subsidized health insurance program established in 2006
• Those with incomes up to 400% of the U.S. poverty level will see their health insurance subsidized at a decreasing rate using tax credits. This will promote participation by the private insurance industry and consumer choice among plans.
• [1] States that choose not to create their own exchanges can have the federal government come in and establish it for them.
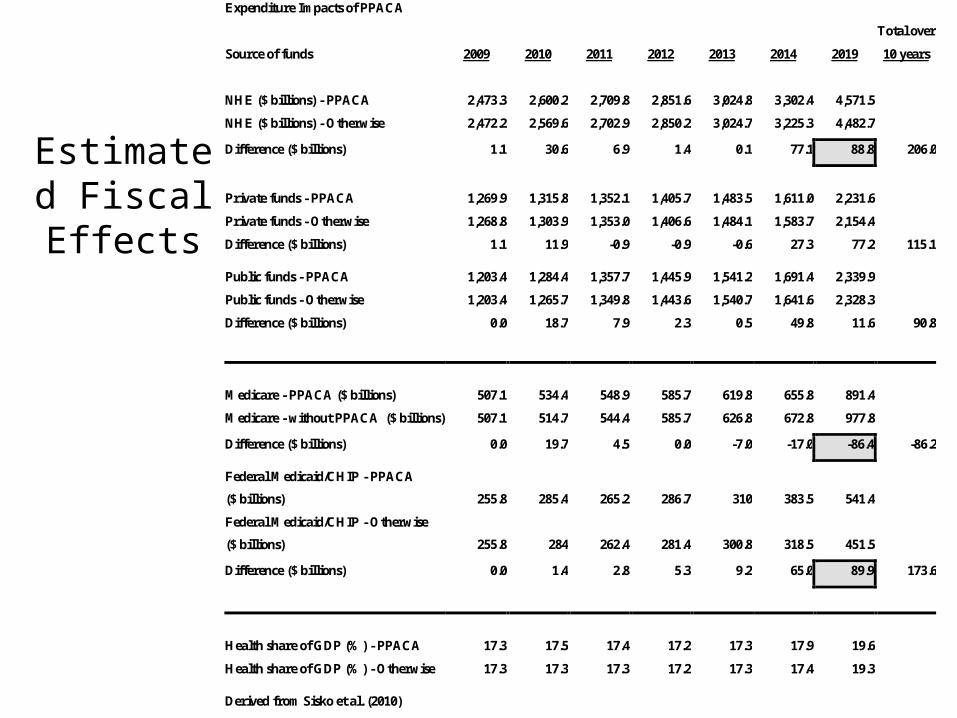
Estimated Fiscal Effects
Expenditure Impacts of PPACA
Total over
Source of funds 2009 2010 2011 2012 2013 2014 2019 10 years
NHE ($ billions) - PPACA 2,473.3 2,600.2 2,709.8 2,851.6 3,024.8 3,302.4 4,571.5
NHE ($ billions) - Otherwise 2,472.2 2,569.6 2,702.9 2,850.2 3,024.7 3,225.3 4,482.7
Difference ($ billions) 1.1 30.6 6.9 1.4 0.1 77.1 88.8 206.0
Private funds - PPACA 1,269.9 1,315.8 1,352.1 1,405.7 1,483.5 1,611.0 2,231.6
Private funds - Otherwise 1,268.8 1,303.9 1,353.0 1,406.6 1,484.1 1,583.7 2,154.4
Difference ($ billions) 1.1 11.9 -0.9 -0.9 -0.6 27.3 77.2 115.1
Public funds - PPACA 1,203.4 1,284.4 1,357.7 1,445.9 1,541.2 1,691.4 2,339.9
Public funds - Otherwise 1,203.4 1,265.7 1,349.8 1,443.6 1,540.7 1,641.6 2,328.3
Difference ($ billions) 0.0 18.7 7.9 2.3 0.5 49.8 11.6 90.8
Medicare - PPACA ($ billions) 507.1 534.4 548.9 585.7 619.8 655.8 891.4
Medicare - without PPACA ($ billions) 507.1 514.7 544.4 585.7 626.8 672.8 977.8
Difference ($ billions) 0.0 19.7 4.5 0.0 -7.0 -17.0 -86.4 -86.2
Federal Medicaid/CHIP - PPACA
($ billions) 255.8 285.4 265.2 286.7 310 383.5 541.4
Federal Medicaid/CHIP - Otherwise
($ billions) 255.8 284 262.4 281.4 300.8 318.5 451.5
Difference ($ billions) 0.0 1.4 2.8 5.3 9.2 65.0 89.9 173.6
Health share of GDP (%) - PPACA 17.3 17.5 17.4 17.2 17.3 17.9 19.6
Health share of GDP (%) - Otherwise 17.3 17.3 17.3 17.2 17.3 17.4 19.3
Derived from Sisko et al. (2010)

Blahous v. Bernstein
http://crfb.org/blogs/lively-debate-affordable-care-act

Evaluation of PPACA – Safety Net
• CBO noted that approximately 32 million people would gain coverage by 2019.
• Predicted increases of 16 million through Medicaid and CHIP, and 24 million through the exchanges, with small decreases of those in employer and nongroup insurance.
• This would leave about 23 million non-elderly residents uninsured (about one-third of whom would be unauthorized immigrants).
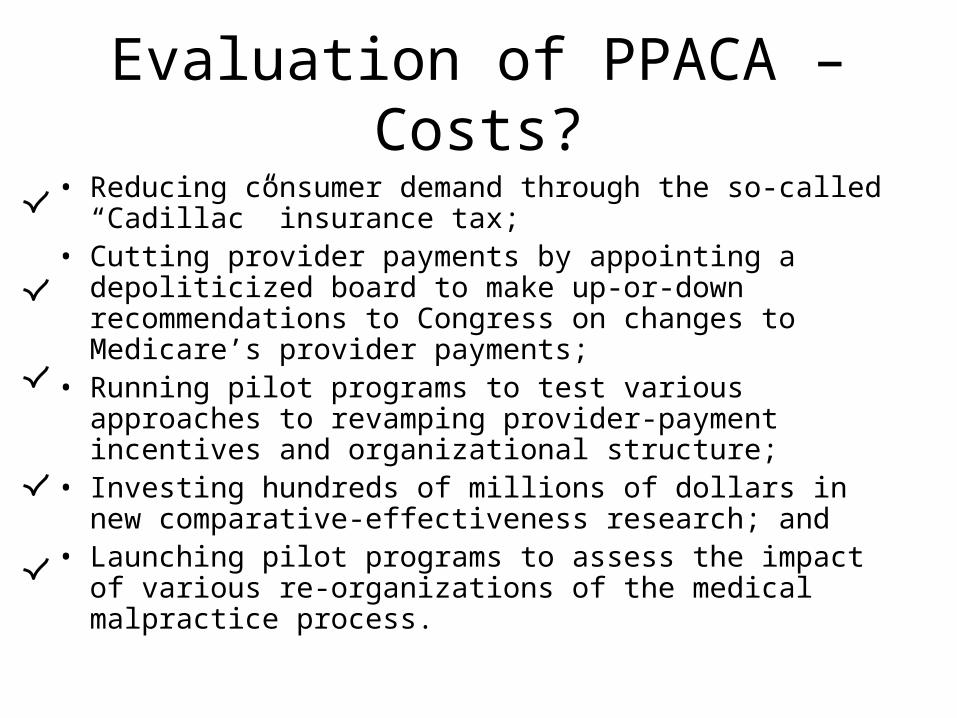
Evaluation of PPACA – Costs?
• Reducing consumer demand through the so-called “Cadillac” insurance tax;
• Cutting provider payments by appointing a depoliticized board to make up-or-down recommendations to Congress on changes to Medicare’s provider payments;
• Running pilot programs to test various approaches to revamping provider-payment incentives and organizational structure;
• Investing hundreds of millions of dollars in new comparative-effectiveness research; and
• Launching pilot programs to assess the impact of various re-organizations of the medical malpractice process.

• In bypassing either single-payer programs or explicit mandated providers, PPACA will preserve both patient and provider choice.
• The insured would appear to have no less choice in insurance coverage, and payment provisions would seem to remain the same as previously.
Evaluation of PPACA – Choice?

• The largest increases in the numbers insured would come through Medicaid/CHIP (an additional 16 million) and the new insurance exchanges (24 million more).
• Medicaid/CHIP is a well-established program, with state-level relationships already in place.
• States have not yet established the exchanges, however, and some considerable administrative costs will most likely accompany their creation and operation
Evaluation of PPACA – Administration?

So?
• PPACA a long-term “fix” in that provisions will step in gradually until 2018.
• It formulates an individual mandate for consumers to purchase health insurance and provides market-pooling mechanisms to make the insurance available to many who were previously not able to get it.
• Its cost-containment and quality assessment mechanisms are less concrete than those that provide the insurance. Analysts and policy-makers will seek to address these mechanisms as PPACA phases in through 2018.