health plan mco contact information performance
TRANSCRIPT
1
MCO Contact Information
1. Principal MCO Contact Person [PERSON RESPONSIBLE FOR COMPLETING THIS REPORT AND WHO CAN BE CONTACTED FOR QUESTIONS]
Tiffany Page, LCSW Behavioral Health Quality Specialist 770-200-6753 [email protected]
2. Additional Contact(s) [PERSON(S) RESPONSIBLE IN THE EVENT THAT THE PRINCIPAL CONTACT PERSON IS UNAVAILABLE]
Hayley Clothier, MPS
Quality Director, Behavioral Health 615-493-9559 [email protected]
Deborah Junot Health Plan Quality Director 504-849-1522 [email protected]
Health Plan Performance Improvement
Project (PIP)
Health Plan: UnitedHealthcare
Improving Rates for (1) Initiation and Engagement of Alcohol and Other Drug Abuse or Dependence Treatment (IET) and (2) Follow-Up After Emergency Department Visit for Alcohol and Other Drug Abuse or Dependence
PIP Implementation Period: January 1, 2020-December 31, 2020
Submission Dates: 12/10/2020

2
3. External Collaborators (if applicable): N/A

3
Attestation
Plan Name: UnitedHealthcare
Title of Project: Improving Rates for Initiation and Engagement of Alcohol and Other Drug Abuse or Dependence Treatment (IET) and for Follow-Up after ED Visit for Alcohol and Other Drug Abuse/Dependence (FUA)
The undersigned approve this PIP and assure involvement in the PIP throughout the course of the project.
Medical Director signature: First and last name: Julie Morial, MD Date: 1/17/2020
CEO signature: First and last name: Karl Lirette Date: 1/22/2020
Quality Director signature: Date: 1/17/2020 IS Director signature (if applicable): N/A First and last name: Date:

4
Updates to the PIP For Interim and Final Reports Only: Report all changes in methodology and/or data collection from initial proposal submission in the table below. [EXAMPLES INCLUDE: ADDED NEW INTERVENTIONS, ADDED A NEW SURVEY, CHANGE IN INDICATOR DEFINITION OR DATA COLLECTION, DEVIATED FROM HEDIS® SPECIFICATIONS, REDUCED SAMPLE SIZE(S)]
Table 1: Updates to PIP
Change Date of change Area of change Brief Description of change
Change 1 4/25/2020 ☐ Project Topic
☐ Methodology
☒ Barrier Analysis /
Intervention
☐ Other
Added barrier/intervention around Vivitrol education and Focused Care Advocacy case management program. Added more detailed information from provider and member feedback.
Change 2 6/25/2020 ☒ Project Topic
☐ Methodology
☐ Barrier Analysis /
Intervention
☒ Other
Updated final HEDIS 2020 rates from audited results (CY 2019). Updated goals and results section to reflect changes in final rates, per above. Added Focused Care Advocacy and member MAT outreach initiative and intervention tracking measure
Change 3 8/24/2020 ☒ Project Topic
☐ Methodology
☐ Barrier Analysis /
Intervention
☐ Other
Indicator #1 target rate increased by 3 percentage points due to meeting the 95th quality compass percentile during Q2.
Change 4 11/16/2020 ☐ Project Topic
☐ Methodology
☐ Barrier Analysis /
Intervention
☒ Other
Added final data results, remaining sections for completion, including appendix.
Healthcare Effectiveness and Information Data Set (HEDIS) is a registered trademark of the National Committee for Quality Assurance (NCQA).
5
Abstract
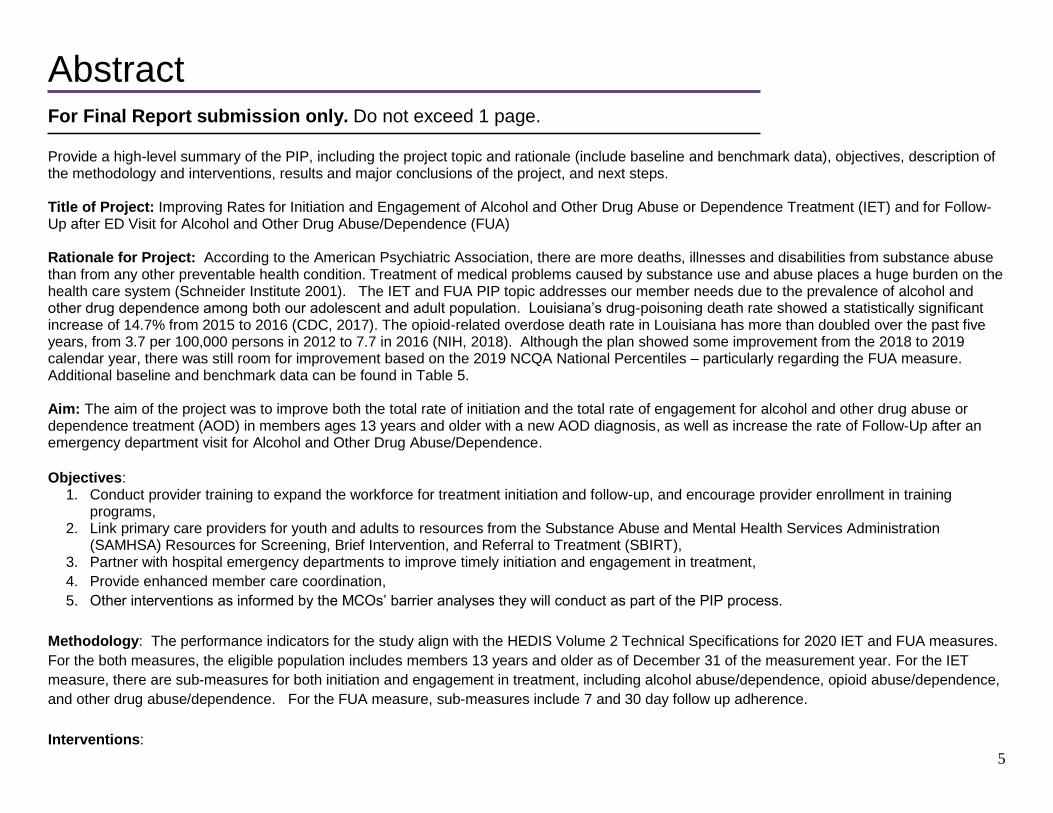
For Final Report submission only. Do not exceed 1 page. Provide a high-level summary of the PIP, including the project topic and rationale (include baseline and benchmark data), objectives, description of the methodology and interventions, results and major conclusions of the project, and next steps. Title of Project: Improving Rates for Initiation and Engagement of Alcohol and Other Drug Abuse or Dependence Treatment (IET) and for Follow-Up after ED Visit for Alcohol and Other Drug Abuse/Dependence (FUA) Rationale for Project: According to the American Psychiatric Association, there are more deaths, illnesses and disabilities from substance abuse than from any other preventable health condition. Treatment of medical problems caused by substance use and abuse places a huge burden on the health care system (Schneider Institute 2001). The IET and FUA PIP topic addresses our member needs due to the prevalence of alcohol and other drug dependence among both our adolescent and adult population. Louisiana’s drug-poisoning death rate showed a statistically significant increase of 14.7% from 2015 to 2016 (CDC, 2017). The opioid-related overdose death rate in Louisiana has more than doubled over the past five years, from 3.7 per 100,000 persons in 2012 to 7.7 in 2016 (NIH, 2018). Although the plan showed some improvement from the 2018 to 2019 calendar year, there was still room for improvement based on the 2019 NCQA National Percentiles – particularly regarding the FUA measure. Additional baseline and benchmark data can be found in Table 5. Aim: The aim of the project was to improve both the total rate of initiation and the total rate of engagement for alcohol and other drug abuse or dependence treatment (AOD) in members ages 13 years and older with a new AOD diagnosis, as well as increase the rate of Follow-Up after an emergency department visit for Alcohol and Other Drug Abuse/Dependence.
Objectives:
1. Conduct provider training to expand the workforce for treatment initiation and follow-up, and encourage provider enrollment in training programs,
2. Link primary care providers for youth and adults to resources from the Substance Abuse and Mental Health Services Administration (SAMHSA) Resources for Screening, Brief Intervention, and Referral to Treatment (SBIRT),
3. Partner with hospital emergency departments to improve timely initiation and engagement in treatment,
4. Provide enhanced member care coordination,
5. Other interventions as informed by the MCOs’ barrier analyses they will conduct as part of the PIP process.
Methodology: The performance indicators for the study align with the HEDIS Volume 2 Technical Specifications for 2020 IET and FUA measures.
For the both measures, the eligible population includes members 13 years and older as of December 31 of the measurement year. For the IET
measure, there are sub-measures for both initiation and engagement in treatment, including alcohol abuse/dependence, opioid abuse/dependence,
and other drug abuse/dependence. For the FUA measure, sub-measures include 7 and 30 day follow up adherence.
Interventions:

6
Enhanced provider education through provider engagement activities, free continuing education credits, and direct doctor-to-doctor outreach
in order to increase knowledge of both first line medical and behavioral health providers around SUD and SAMHSA best practices.
Developed enhanced materials for case management to increase member engagement and knowledge around SUD diagnoses and
treatment.
Increased member outreach and advocacy for members involved in MAT or with a history of non-compliance with care through focused care
advocacy program and pharmacy outreach initiatives to increase member engagement and motivation for treatment.
Provided education to providers, case management, and utilization management to increase knowledge of appropriate Vivitrol administration
and prior authorization in order to decrease member barriers to accessing medications.
Results:
There were no performance indicators that met the target rate for the project, however, all performance indicators reflected an increase in rates. 6
out of 8 performance indicators experienced a statistically significant rate increase from baseline to final measurement period. Sustained
improvement will be further evaluated when the full data is available.
Conclusion:
The overall goal of the project was to improve both member initiation and engagement for substance use disorder treatment, as well as member
follow-up after an emergency department visit for a substance use disorder diagnosis. Despite not meeting rate goals for the study period, the study
did appear to achieve some success through the interventions implemented in the final measurement year.
Although some interventions were delayed due to COVID-19, there were some successes in provider education and engagement. Targeted
education around appropriate screening, resources and referral led to increases in the use of SBIRT with providers. While the DEA-X waivered
prescribers have not increased in the measurement period, they did remain steady through COVID-19 and other natural disasters. Member
adherence to recommended therapy while being prescribed MAT medications has increased slightly during the study period. There was a notable
increased in the number of members who followed up after an ED visit for a SUD diagnosis. The member materials have not been widely used
within the tracking measures but may have had some other positive benefits across the state. Peer support providers and increased case
management services have been added for additional member support and engagement. While some interventions may have made traction, a full
year of data is needed to make definitive conclusions.
Regarding next steps, the plan will continue to expand provider education within the new structure of collaboration with other MCOs, as well as
recruit for additional MAT providers. Targeted provider education will be provided to those prescribers that have a low therapy adherence rate, per
MAT best practices. Quality staff will continue to meet with case management staff to ensure member engagement materials are developed as
needed. The plan is also reviewing medical behavioral integrated programs that can do in person outreach to address various population health
needs and provide treatment in place. The main limitation was surrounding claims lag as it relates to the final performance indicators.

7
Project Topic
To be completed upon Proposal submission. Do not exceed 2 pages. Describe Project Topic and Rationale for Topic Selection
Describe how PIP Topic addresses your member needs and why it is important to your members: Alcohol and other Drug dependence is common across many age groups and is a cause of morbidity, mortality and decreased productivity. There is strong evidence that treatment for AOD dependence can improve health, productivity and social outcomes, and can save millions of dollars on health care and related costs (NCQA, 2018). According to the American Psychiatric Association, there are more deaths, illnesses and disabilities from substance abuse than from any other preventable health condition. Treatment of medical problems caused by substance use and abuse places a huge burden on the health care system (Schneider Institute 2001). The IET and FUA PIP topic addresses our member needs due to the prevalence of alcohol and other drug dependence among both our adolescent and adult population. Louisiana’s drug-poisoning death rate showed a statistically significant increase of 14.7% from 2015 to 2016 (CDC, 2017). Prescription and illicit opioids are the prime drivers of drug overdose deaths in the U.S. (CDC, 2017). The opioid-related overdose death rate in Louisiana has more than doubled over the past five years, from 3.7 per 100,000 persons in 2012 to 7.7 in 2016 (NIH, 2018). Prior to 2012, the primary driver of opioid-related overdose deaths was prescription opioids. Since 2012, the number of heroin-related deaths trended sharply upward to exceed that of prescription opioid-related deaths in 2016 (149 vs. 124, respectively; NIH, 2018). The overdose crisis has been interpreted as “an epidemic of poor access to care” (Wakeman and Barnett, 2018), with close to 80% of Americans with opioid use disorder lacking treatment (Saloner and Karthikeyan, 2015). UnitedHealthcare Community Plan of Louisiana completed several analyses surrounding the members who fall into the Initiation and Engagement of Alcohol and Other Drug Abuse or Dependence Treatment (IET) HEDIS ® measure, as well as Follow-Up After Emergency Department Visit for Alcohol and Other Drug Abuse or Dependence (FUA). The tables referenced below can be found in Appendix F. The following trends were noted from the data:
IET noncompliance rates for members ages 13-17 were slightly higher than those of adult members for initiation (Table 1). The highest rate of non-compliance for both initiation and engagement was ages 13-17 with an alcohol abuse or dependence diagnosis. For adults in the IET measure, the highest rate of noncompliance for initiation and engagement was also alcohol abuse or dependence (Table 1). The denominators for the 13 -17 age group are much lower than those of the adult population. The sub measure with the lowest rate of noncompliance in both initiation and engagement measures was adults with opioid abuse or dependence (Table 1). The region with the highest rate of noncompliance for initiation for adolescents was Northeast Delta HAS, while the region with the highest rate of noncompliance for adults was Northwest Louisiana HSD (Table 2). For engagement, the highest rate of noncompliance for the 13-17 population was South Central Louisiana HAS (Table 3). Northwest Louisiana HSD had the highest rate of noncompliance for adults.

8
The FUA measure has much lower denominators than the IET measure, with very few adolescents falling into the measure (Table 1 and Table 4). Adolescents had a higher noncompliance rate for both the 7 day and 30-day FUA measure (Table 4). For the FUA 7-day measure, the only regions that had any compliant members for ages 13-17 were Metropolitan HSD and Central Louisiana HSD (Table 5). Metropolitan HSD had the highest rate of noncompliance for adults. For the 30-day FUA measure, the only regions that had compliant members for ages 13-17 were Metropolitan HSD, Florida Parishes HSA and Central Louisiana HSD (Table 6). Imperial Calcasieu HAS had the highest rate of noncompliance for adults in the measure. Tables 7-10 focus on the special healthcare needs populations within Louisiana. The top 10 parishes with the highest incidences of pregnancy, comorbid conditions, ER utilization and IP utilization are broken out. The data analysis suggests that there are patterns of membership in certain areas of the state, including East Baton Rouge, Orleans, Jefferson, Caddo, Terrebonne, Saint Tammany, Lafayette, Livingston, Calcasieu, and Ouachita parishes.
Describe high-volume or high-risk conditions addressed:
This PIP will focus on the initiation and engagement of treatment for alcohol, opioids and other substances with both the adolescent (13-17) population and the adult (18+) population, as well as follow up after emergency department visit for alcohol and other drug abuse or dependence. The data summary suggests interventions should be focused on members using opioids and alcohol, as well as the adolescent population.
Describe current research support for topic (e.g., clinical guidelines/standards): Several studies conducted by The National Center for Biotechnology Information (a part of the United States National Library of Medicine, which is a branch of the National Institute of Health) indicate that treatment and engagement are recognized as important benchmarks on the path to recovery from substance use disorders. Early withdrawal from treatment tends to lead to relapse, indicating ongoing engagement in treatment is the most successful indicator of remission. An additional study from the National Institute of Health and the US Department of Veterans Affairs examined the patient-level associations between the Health Plan Employer Data and Information Set (HEDIS) substance use disorder (SUD) treatment engagement quality indicator and improvements in clinical outcomes. Administrative and survey data from 2,789 US Department of Veterans Affairs SUD patients were used to estimate the effects of meeting the HEDIS engagement criterion on improvements in Addiction Severity Index Alcohol, Drug, and Legal composite scores. Patients meeting the engagement indicator improved significantly more in all domains than patients who did not engage, and the relationship was stronger for alcohol and legal outcomes for patients seen in outpatient settings.
Explain why there is opportunity for MCO improvement in this area (must include baseline and if available, statewide average/benchmarks): The following table summarizes the plan performance for the baseline year, in comparison with NCQA Quality Compass benchmarks. Statewide averages were not available for HEDIS ® 2019.

9
Measure
UHCCPLA HEDIS®
2019
Next Quality Compass
HEDIS® 2019 Benchmark Difference
Alcohol abuse/dependence: Initiation of AOD 43.29 45.34 (75th) -2.05
Alcohol abuse/dependence: Engagement of AOD 12.75 13.76 (75th) -1.01
Opioid abuse/dependence: Initiation of AOD 58.23 59.8 (66.67th) -1.57
Opioid abuse/dependence: Engagement of AOD 24.45 26.52 (50th) -2.07
Total: Initiation of AOD 45.67 46.68 (75th) -1.01
Total: Engagement of AOD 15.46 16.93 (66.67th) -1.47
FUA 30-day measure 10.46 13.78 (33.33rd) -3.32
FUA 7-day measure 6.84 9.12 (33.33rd) -2.28
For total initiation, our rate was 45.67, which was slightly above the 2019 NCQA quality compass 66.67th percentile of 45.05.
For total engagement, our rate was 15.46, which was above the 2019 NCQA quality compass 50th percentile of 14.02.
For alcohol initiation, our rate was 43.29, which was slightly below the 2019 NCQA quality compass 66.67th percentile of 43.65.
For alcohol engagement, our rate was 12.75, which was slightly below the 2019 NCQA quality compass 66.67th percentile of 12.88.
For opioid initiation, our rate was 58.23, which was below the 2019 NCQA quality compass 66.67th percentile of 59.8.
For opioid engagement, our rate was 24.45, which was below the 2019 NCQA quality compass 50th percentile of 26.52.
For the FUA 7-day measure, our rate was 6.84, which was slightly above the 2019 NCQA quality compass 25th percentile of 6.58.
For the FUA 30-day measure, our rate was 10.46, which was slightly below the 2019 NCQA quality compass 25th percentile of 10.94.
Aims, Objectives and Goals Healthy Louisiana PIP Aim: The overall aim is to improve the rate of Initiation and Engagement of Alcohol and Other Drug Abuse or Dependence Treatment (IET; HEDIS 2020) and to improve the rates for Follow-Up After Emergency Department Visit for Alcohol and Other Drug Abuse or Dependence (FUA; HEDIS 2020) by implementing enhanced interventions to test the change concepts indicated in the Driver Diagram (Appendix D) to achieve the following objectives:
1. Conduct provider training to expand the workforce for treatment initiation and follow-up, and encourage provider enrollment in the following training programs:

10
o Treatment of Opioid Use Disorder Course (includes training for the waiver to prescribe buprenorphine) - American Society of Addiction Medicine (ASAM); Targeted providers to include PCPs, pediatricians, obstetricians, ER physicians, FQHC and urgent care providers.
o Fundamentals of Addiction Medicine (ASAM); Targeted providers to include psychiatrists, pediatricians, LMHPs, PCPs, obstetricians, ER physicians, FQHC and urgent care providers.
o The ASAM Criteria Course for appropriate levels of care; Targeted providers to include LMHPs, PCPs, pediatricians, obstetricians, ER physicians, FQHC and urgent care providers
o ASAM Motivational Interviewing Workshop; Targeted providers to include LMHPs, PCPs, pediatricians, obstetricians, ER physicians, FQHC and urgent care providers
2. Link primary care providers for youth and adults to resources from the Substance Abuse and Mental Health Services Administration (SAMHSA) Resources for Screening, Brief Intervention, and Referral to Treatment (SBIRT) (https://www.samhsa.gov/sbirt/resources), and encourage primary care conduct of SBIRT for youth and adults; Targeted providers to include pediatricians, LMHPs, PCPs, obstetricians, ER physicians, FQHC and urgent care providers.
3. Partner with hospitals/EDs to improve timely initiation and engagement in treatment (e.g., MCO liaisons, hospital initiatives, ED
protocols); and
4. Provide enhanced member care coordination (e.g., behavioral health integration, case management, improved communication
between MCO UM and CM for earlier notification of hospitalization, improved discharge planning practices and support, such as
recovery coaches).
5. Other interventions as informed by the MCOs’ barrier analyses they will conduct as part of the PIP process.
Table 2: Goals
Indicators
Baseline Rate
Measurement Period: 1/1/18-12/31/18
Interim Rate Measurement Period:
1/1/19-12/31/19 Target Rate2
Rationale for Target Rate3
Indicator #1. Initiation of AOD Treatment: Total age groups, Alcohol abuse or dependence diagnosis cohort
N: 1687 D: 3897 R: 43.29
N: 2024 D: 4127 R: 49.04
R: 56.28 Next quality compass benchmark (95th) was met during 2020 Q2, increased by 3 points
Indicator #2. Initiation of AOD Treatment: Total age groups, Opioid abuse or dependence diagnosis cohort
N: 1405 D: 2413 R: 58.23
N: 1641 D: 2731 R: 60.09
R: 68.42 Next quality compass benchmark (90th)
Indicator #3. Initiation of AOD Treatment: Total age groups, Total diagnosis cohort
N: 5865 D: 12842 R: 45.67
N: 6634 D: 13218 R: 50.19
R: 53.89 Next quality compass benchmark (95th)
Indicator #4. Engagement of AOD Treatment: Total
N: 497 D: 3897
N: 621 D: 4127
R: 18.49 Next quality compass benchmark (95th)

11
Indicators
Baseline Rate
Measurement Period: 1/1/18-12/31/18
Interim Rate Measurement Period:
1/1/19-12/31/19 Target Rate2
Rationale for Target Rate3
age groups, Alcohol abuse or dependence diagnosis cohort
R: 12.75 R: 15.05
Indicator #5. Engagement of AOD Treatment: Total age groups,
Opioid abuse or dependence diagnosis cohort
N: 590 D: 2413 R: 24.45
N: 823 D: 2731 R: 30.14
R: 35.11 Next quality compass benchmark (75th)
Indicator #6. Engagement of AOD Treatment: Total age groups,
Total diagnosis cohort
N: 1986 D: 12842 R: 15.46
N: 2374 D: 13218 R: 17.96
R: 24.72 Next quality compass benchmark (95th)
Indicator #7. The percentage of emergency
department (ED) visits for members 13 years of age
and older with a principal diagnosis of alcohol or other
drug (AOD) abuse or dependence, who had a follow
up visit for AOD within 30 days of the ED visit
N: 231 D: 2208 R: 10.46
N: 252 D: 2152 R: 11.71
R: 17.83 Next quality compass benchmark (50th)
Indicator #8. The percentage of emergency
department (ED) visits for members 13 years of age
and older with a principal diagnosis of alcohol or other
drug (AOD) abuse or dependence, who had a follow
up visit for AOD within 7 days of the ED visit
N: 151 D: 2208 R: 6.84
N: 161 D: 2152 R: 7.48
R: 16.97 NCQA accreditation health plan rating minimum quality compass benchmark (75th)
1 Baseline rate: the MCO-specific rate that reflects the year prior to when PIP interventions are initiated. 2 Upon subsequent evaluation of performance indicator rates, consideration should be given to improving the target rate, if it has been met or exceeded at that time. 3 Indicate the source of the final goal (e.g., NCQA Quality Compass) and/or the method used to establish the target rate (e.g., 95% confidence interval).

12
Methodology
To be completed upon Proposal submission.
Performance Indicators (See HEDIS Volume 2 Technical Specifications for 2020 IET and FUA measures)
Table 3: Performance Indicators1
Indicator Description Data Source Eligible Population Specification
Exclusion Criteria Numerator Specification
Denominator Specification

13
Indicator Description Data Source Eligible Population Specification
Exclusion Criteria Numerator Specification
Denominator Specification
Indicator #1 (HEDIS IET)
Initiation of AOD Treatment: Total age groups, Alcohol abuse or dependence diagnosis cohort
Administrative Claims Data
Members 13 years or older as of December 31 of the measurement year with a new episode of Alcohol abuse or dependence during the intake period. Members must be enrolled for 60 days before the index episode start date through 48 days after the index episode start date, with no gaps in enrollment.
Test for Negative Diagnosis History: Exclude members who had a claim/ encounter with a diagnosis of AOD abuse or dependence (AOD Abuse and Dependence Value Set), AOD medication treatment (AOD Medication Treatment Value Set) or an alcohol or opioid dependency treatment medication dispensing event (Alcohol Use Disorder Treatment Medications List; Opioid Use Disorder Treatment Medications List) during the 60 days (2 months) before the IESD. Members in hospice
The number of members from the eligible population who initiate treatment through an inpatient AOD admission, outpatient visit, intensive outpatient encounter or partial hospitalization, telehealth or medication treatment within 14 days of the diagnosis
The eligible population minus exclusions

14
Indicator Description Data Source Eligible Population Specification
Exclusion Criteria Numerator Specification
Denominator Specification
Indicator #2 (HEDIS IET)
Initiation of AOD Treatment: Total age groups, Opioid abuse or dependence diagnosis cohort
Administrative Claims Data
Members 13 years or older as of December 31 of the measurement year with a new episode of Opioid abuse or dependence during the intake period. Members must be enrolled for 60 days before the index episode start date through 48 days after the index episode start date, with no gaps in enrollment.
Test for Negative Diagnosis History: Exclude members who had a claim/ encounter with a diagnosis of AOD abuse or dependence (AOD Abuse and Dependence Value Set), AOD medication treatment (AOD Medication Treatment Value Set) or an alcohol or opioid dependency treatment medication dispensing event (Alcohol Use Disorder Treatment Medications List; Opioid Use Disorder Treatment Medications List) during the 60 days (2 months) before the IESD. Members in hospice
The number of members from the eligible population who initiate treatment through an inpatient AOD admission, outpatient visit, intensive outpatient encounter or partial hospitalization, telehealth or medication treatment within 14 days of the diagnosis
The eligible population minus exclusions

15
Indicator Description Data Source Eligible Population Specification
Exclusion Criteria Numerator Specification
Denominator Specification
Indicator #3 (HEDIS IET)
Initiation of AOD Treatment: Total age groups, Total diagnosis cohort
Administrative Claims Data
Members 13 years or older as of December 31 of the measurement year with a new episode of AOD abuse or dependence during the intake period. Members must be enrolled for 60 days before the index episode start date through 48 days after the index episode start date, with no gaps in enrollment.
Test for Negative Diagnosis History: Exclude members who had a claim/ encounter with a diagnosis of AOD abuse or dependence (AOD Abuse and Dependence Value Set), AOD medication treatment (AOD Medication Treatment Value Set) or an alcohol or opioid dependency treatment medication dispensing event (Alcohol Use Disorder Treatment Medications List; Opioid Use Disorder Treatment Medications List) during the 60 days (2 months) before the IESD. Members in hospice
The number of members from the eligible population who initiate treatment through an inpatient AOD admission, outpatient visit, intensive outpatient encounter or partial hospitalization, telehealth or medication treatment within 14 days of the diagnosis
The eligible population minus exclusions

16
Indicator Description Data Source Eligible Population Specification
Exclusion Criteria Numerator Specification
Denominator Specification
Indicator #4 (HEDIS IET)
Engagement of AOD Treatment: Total age groups, Alcohol abuse or dependence diagnosis cohort
Administrative Claims Data
Members 13 years or older as of December 31 of the measurement year with a new episode of Alcohol abuse or dependence during the intake period. Members must be enrolled for 60 days before the index episode start date through 48 days after the index episode start date, with no gaps in enrollment.
Test for Negative Diagnosis History: Exclude members who had a claim/ encounter with a diagnosis of AOD abuse or dependence (AOD Abuse and Dependence Value Set), AOD medication treatment (AOD Medication Treatment Value Set) or an alcohol or opioid dependency treatment medication dispensing event (Alcohol Use Disorder Treatment Medications List; Opioid Use Disorder Treatment Medications List) during the 60 days (2 months) before the IESD. Members in hospice
The number of members from the eligible population who initiated treatment and who were engaged in AOD treatment within 34 days of the initiation visit, as evidenced by at least two additional qualified substance use disorder treatment encounters in addition to the qualified initiation encounter.
The eligible population minus exclusions
17
Indicator Description Data Source Eligible Population Specification
Exclusion Criteria Numerator Specification
Denominator Specification
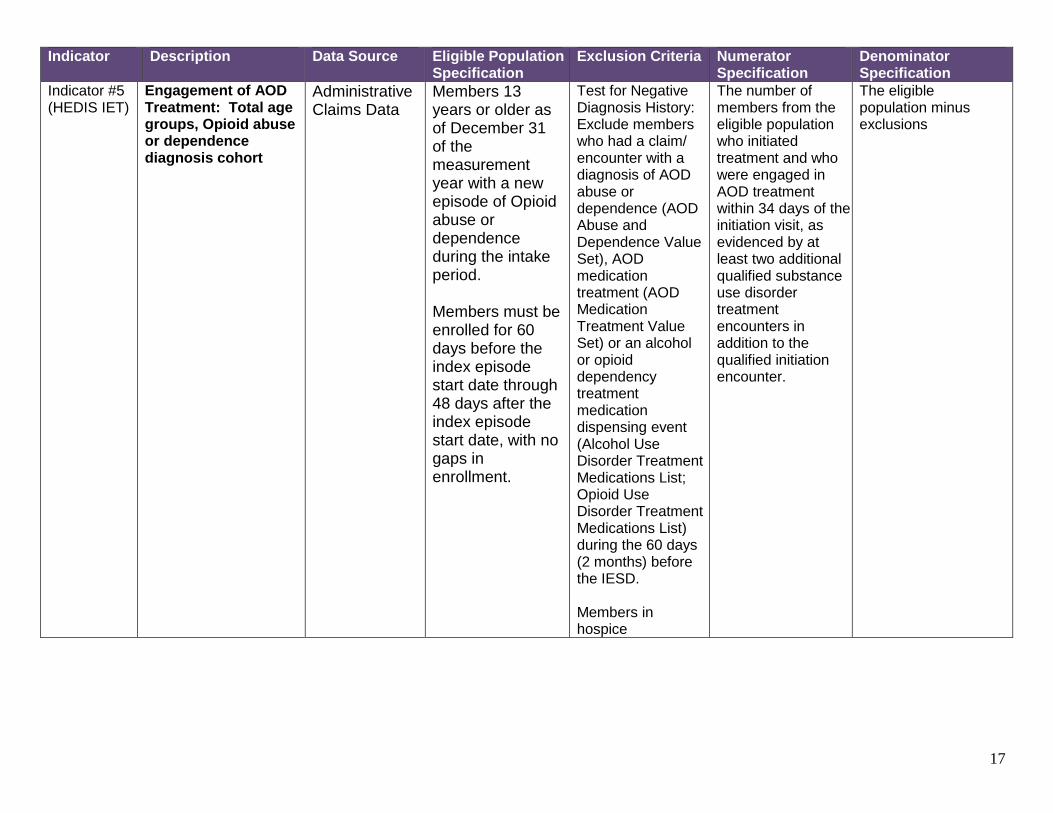
Indicator #5 (HEDIS IET)
Engagement of AOD Treatment: Total age groups, Opioid abuse or dependence diagnosis cohort
Administrative Claims Data
Members 13 years or older as of December 31 of the measurement year with a new episode of Opioid abuse or dependence during the intake period. Members must be enrolled for 60 days before the index episode start date through 48 days after the index episode start date, with no gaps in enrollment.
Test for Negative Diagnosis History: Exclude members who had a claim/ encounter with a diagnosis of AOD abuse or dependence (AOD Abuse and Dependence Value Set), AOD medication treatment (AOD Medication Treatment Value Set) or an alcohol or opioid dependency treatment medication dispensing event (Alcohol Use Disorder Treatment Medications List; Opioid Use Disorder Treatment Medications List) during the 60 days (2 months) before the IESD. Members in hospice
The number of members from the eligible population who initiated treatment and who were engaged in AOD treatment within 34 days of the initiation visit, as evidenced by at least two additional qualified substance use disorder treatment encounters in addition to the qualified initiation encounter.
The eligible population minus exclusions

18
Indicator Description Data Source Eligible Population Specification
Exclusion Criteria Numerator Specification
Denominator Specification
Indicator #6 (HEDIS IET)
Engagement of AOD Treatment: Total age groups, Total diagnosis cohort
Administrative Claims Data
Members 13 years or older as of December 31 of the measurement year with a new episode of AOD abuse or dependence during the intake period. Members must be enrolled for 60 days before the index episode start date through 48 days after the index episode start date, with no gaps in enrollment.
Test for Negative Diagnosis History: Exclude members who had a claim/ encounter with a diagnosis of AOD abuse or dependence (AOD Abuse and Dependence Value Set), AOD medication treatment (AOD Medication Treatment Value Set) or an alcohol or opioid dependency treatment medication dispensing event (Alcohol Use Disorder Treatment Medications List; Opioid Use Disorder Treatment Medications List) during the 60 days (2 months) before the IESD. Members in hospice
The number of members from the eligible population who initiated treatment and who were engaged in AOD treatment within 34 days of the initiation visit, as evidenced by at least two additional qualified substance use disorder treatment encounters in addition to the qualified initiation encounter.
The eligible population minus exclusions

19
Indicator Description Data Source Eligible Population Specification
Exclusion Criteria Numerator Specification
Denominator Specification
Indicator #7 (HEDIS FUA)
The percentage of emergency department (ED) visits for members 13 years of age and older with a principal diagnosis of alcohol or other drug (AOD) abuse or dependence, who had a follow up visit for AOD within 30 days of the ED visit
Administrative Claims Data
Members 13 years or older with an ED visit including a principle diagnosis of AOD abuse of dependence. Members must have continuous enrollment through 30 days after the visit and no gaps in enrollment.
ED visits that result in an inpatient stay or admission to an inpatient care setting. Members in hospice.
The number of members from the eligible population who received follow up within 30 days of the emergency department visit.
The eligible population minus exclusions
Indicator #8 (HEDIS FUA)
The percentage of emergency department (ED) visits for members 13 years of age and older with a principal diagnosis of alcohol or other drug (AOD) abuse or dependence, who had a follow up visit for AOD within 7 days of the ED visit
Administrative Claims Data
Members 13 years or older with an ED visit including a principle diagnosis of AOD abuse of dependence. Members must have continuous enrollment through 30 days after the visit and no gaps in enrollment.
ED visits that result in an inpatient stay or admission to an inpatient care setting. Members in hospice.
The number of members from the eligible population who received follow up within 7 days of the emergency department visit.
The eligible population minus exclusions
HEDIS Indicators: If using a HEDIS measure, specify the HEDIS reporting year used and reference the HEDIS Volume 2 Technical Specifications (e.g., measure name(s)). It is not necessary to provide the entire specification. A summary of the indicator statement, and criteria for the eligible population, denominator, numerator, and any exclusions are sufficient. Describe any modifications being made to
the HEDIS specification, e.g., change in age range. **Interim performance indicators are based on 2020 HEDIS technical specifications, while prospective performance tracking of indicators would be based on 2021 HEDIS technical specifications (not yet available).

20
Data Collection and Analysis Procedures Is the entire eligible population being targeted by PIP interventions? Yes Sampling Procedures If sampling was employed (for targeting interventions, medical record review, or survey distribution, for instance), the sampling methodology should consider the required sample size, specify the true (or estimated) frequency of the event, the confidence level to be used, and the margin of error that will be acceptable.
Describe sampling methodology: No sampling was used for the study. Data Collection Describe who will collect the performance indicator and intervention tracking measure data (using staff titles and qualifications), when they will perform collection, and data collection tools used (abstraction tools, software, surveys, etc.). If a survey is used, indicate survey method (phone, mail, face-to-face), the number of surveys distributed and completed, and the follow-up attempts to increase response rate.
Describe data collection: Data for this study is collected administratively only, electronically, using extraction software. The parameters for extraction come directly from the Healthcare Effectiveness Data and Information Set (HEDIS®) measure for Initiation and Engagement of Alcohol and Other Drug Abuse or Dependence Treatment (IET) and Follow Up After Emergency Department Visit for Alcohol and Other Drug Abuse or Dependence (FUA). These data extracts are already in place in order to track and trend all HEDIS® measures throughout the year.
*See Appendix H: Data Collection algorithm Validity and Reliability Describe efforts used to ensure performance indicator and intervention tracking measure data validity and reliability. For medical record abstraction, describe abstractor training, inter-rater reliability (IRR) testing, quality monitoring, and edits in the data entry tool. For surveys, indicate if the survey instrument has been validated. For administrative data, describe
validation that has occurred, methods to address missing data and audits that have been conducted.
Describe validity and reliability: The data collection process is audited by specific NCQA certified auditors. The auditors perform a review of UHC’s transaction systems and data analysis procedures, examine computer programs to confirm adherence to NCQA specifications, interview key process representatives, examine select transactions including claims, and benchmark the performance rates for each measure against normative data.
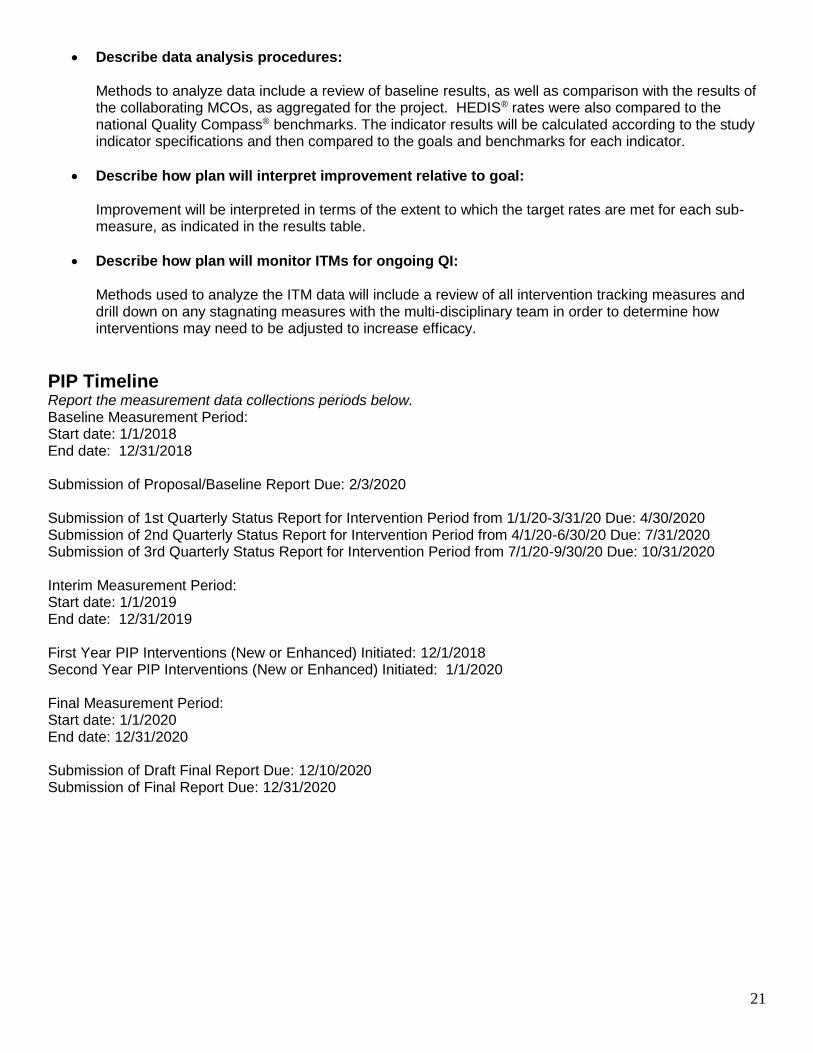
**See Appendix G: HEDIS ® Certification of Med measures Data Analysis Explain the data analysis procedures and, if statistical testing is conducted, specify the procedures used (note that hypothesis testing should only be used to test significant differences between independent samples; for instance, differences between health outcomes among sub-populations within the baseline period is appropriate ).Describe the methods that will be used to analyze data, whether measurements will be compared to prior results or similar studies, and if results will be compared among regions, provider sites, or other subsets or benchmarks. Indicate when data analysis will be performed (monthly, quarterly, etc.). Describe how plan will interpret improvement relative to goal. Describe how the plan will monitor intervention tracking measures (ITMs) for ongoing quality improvement (e.g., stagnating or worsening quarterly ITM trends will trigger barrier/root cause analysis, with findings used to inform modifications to interventions).
21
Describe data analysis procedures: Methods to analyze data include a review of baseline results, as well as comparison with the results of the collaborating MCOs, as aggregated for the project. HEDIS® rates were also compared to the national Quality Compass® benchmarks. The indicator results will be calculated according to the study indicator specifications and then compared to the goals and benchmarks for each indicator.
Describe how plan will interpret improvement relative to goal: Improvement will be interpreted in terms of the extent to which the target rates are met for each sub-measure, as indicated in the results table.
Describe how plan will monitor ITMs for ongoing QI: Methods used to analyze the ITM data will include a review of all intervention tracking measures and drill down on any stagnating measures with the multi-disciplinary team in order to determine how interventions may need to be adjusted to increase efficacy.
PIP Timeline Report the measurement data collections periods below. Baseline Measurement Period: Start date: 1/1/2018 End date: 12/31/2018 Submission of Proposal/Baseline Report Due: 2/3/2020 Submission of 1st Quarterly Status Report for Intervention Period from 1/1/20-3/31/20 Due: 4/30/2020 Submission of 2nd Quarterly Status Report for Intervention Period from 4/1/20-6/30/20 Due: 7/31/2020 Submission of 3rd Quarterly Status Report for Intervention Period from 7/1/20-9/30/20 Due: 10/31/2020 Interim Measurement Period: Start date: 1/1/2019 End date: 12/31/2019 First Year PIP Interventions (New or Enhanced) Initiated: 12/1/2018 Second Year PIP Interventions (New or Enhanced) Initiated: 1/1/2020 Final Measurement Period: Start date: 1/1/2020 End date: 12/31/2020 Submission of Draft Final Report Due: 12/10/2020 Submission of Final Report Due: 12/31/2020

22
Barrier Analysis, Interventions, and Monitoring
Table 4: Alignment of Barriers, Interventions and Tracking Measures Barrier 1: First line medical providers lack of engagement/knowledge/training in engaging SUD patients, screening, triage and referral procedures, and SUD treatment continuum of care.
Method of barrier identification: LDH guidance, direct feedback from providers and multi-disciplinary MCO staff discussion. Provider feedback obtained via discussions with clinical practice consultants. The providers involved in the barrier analysis discussion included several physicians (5 pediatric clinics and 3 adult primary care practices). Physician feedback often included a lack of knowledge on where to refer members, including those that accept Medicaid, are willing to treat children or will address pain management issues. Additional barriers included transportation issues, especially in rural areas where providers might be farther away from members. Providers also reported members are not always ready to admit they have a substance use issue or seek treatment and may be non-compliant with recommendations.
2020
Q1 Q2 Q3 Q4
Intervention #1 to address barrier: Enhanced provider education, including information on MAT, SBIRT, the engagement of members with SUD diagnoses, and appropriate level of care referral. Examples of provider engagement activities to include joint operations committees, activities with the PCP association, provider expos, break-out sessions, webinars, online based courses, ED leadership meetings. Targeted providers to include LMHPs, PCPs, pediatricians, obstetricians, ER physicians, FQHC and urgent care providers.
Intervention #1 tracking measure: ITM 1A: N: The total number of in-network providers educated
D: The total number of providers in-network ITM 1B: N: The number of providers that completed the free motivation interviewing or Care Philosophy training through MCO continuing education portal D: The total number of providers in network ITM 1C: N: The number of providers that billed an SBIRT screening
ITM 1A: N: 0 D: 5941 R: 0
ITM 1B: N: 0 D: 5941 R: 0
ITM 1C: N: 15 D: 5941
ITM 1A: N: 0 D: 5997 R: 0
ITM 1B: N: 0 D: 5997 R: 0
ITM 1C: N: 17 D: 5997
ITM 1A: N: 57 D: 6021 R: 0.94%
ITM 1B: N: 5 D: 6021 R: 0.08%
ITM 1C: N:22 D:6021
ITM 1A: N: 64 D: 6295 R: 1.01%
ITM 1B: N: 2 D: 6295 R: .03%
ITM 1C: N: 16 D: 6295

23
*See provider education deck Planned Start Date: 2/1/2020 Actual Start Date: 9/3/2020
for members 13 years of age and older billed/paid, by provider type D: The number of providers, by provider type
R: 0.25% Provider Use of SBIRT by State Category ED 0/61 (0%) Primary Care 5/750 (0.7%) Urgent Care 0/4 (0%) Pediatricians 2/194 (1%) OB/GYN 4/193 (2.1%) Other 4/5941 (0.08%) There were a total of 350 claims for SBIRT in Q1 2020 by 16 different providers.
R: 0.28% Provider Use of SBIRT by State Category ED 0/57 (0%) Primary Care 5/749 (0.7%) Urgent Care 0/4 (0%) Pediatricians 3/196 (1.5%) OB/GYN 5/197 (2.5%) Other 4/4794 (0.08%) There were a total of 576 claims for SBIRT in Q2 2020 by 17 different providers.
R: 0.37% Provider Use of SBIRT by State Category ED 0/63 (0%) Primary Care 8/756 (1.1%) Urgent Care 0/3 (0%) Pediatricians 2/193 (1%) OB/GYN 4/195 (2.1%) Other 8/4811 (0.2%) There were a total of 1200 claims for SBIRT in Q3 2020 by 22 different providers.
R: 0.25%
Provider Use of SBIRT by State Category ED 0/63 (0%) Primary Care 3/793 (0.38%) Urgent Care 0/5 (0%) Pediatricians 1/206 (0.49%) Obs 3/209 (1.44%) Other 9/5019 (0.18%) There were a total of 510 claims for SBIRT by 16 different providers
Intervention #2 to address barrier: Sponsor DEA X waiver training for providers Planned Start Date: 6/1/2020 Actual Start Date: not implemented
Intervention #2 tracking measure: N: The total number of DEA X waivered prescribers in network D: The total number of prescribers in network
N: 426 D: 11134 R: 3.83%
N: 423 D: 11205 R: 3.77%
N: 419 D: 11506 R: 3.64%
N: 409 D: 11590 R: 3.52%
Barrier 2: Statewide lack of MAT prescribers and limited prescriber knowledge of local psychosocial treatment resources
Method of barrier identification: LDH guidance, direct feedback from providers, and multi-disciplinary MCO staff discussion. Provider feedback obtained via discussions with clinical practice consultants (see above summary).
2020
Q1 Q2 Q3 Q4
Intervention #3 to address barrier: Identify MAT prescribers with lower compliance rates of engaging members in psychosocial treatment
Intervention #3 tracking measure: N: The number of members prescribed buprenorphine that have had a therapy encounter
N: 683 D: 3184
N: 694 D: 3437
N: 834 D: 3709
N: 675 D: 3330

24
and provide targeted education that includes information on MAT best practices, motivational interviewing and additional resources. Planned Start Date: 3/1/2020 Actual Start Date: 8/5/2020
D: The number of members prescribed buprenorphine R: 21.45% R: 20.19%
R: 22.49%
R: 20.27%
Intervention #4 to address barrier: Educate and link area EDs with specialized SUD programming, which provide medication and psychosocial components of care, as well as comprehensive evaluation and referral to appropriate level of care. Planned Start Date: 3/1/2020 Actual Start Date: 9/3/2020
Intervention #4 tracking measure: ITM 4A: N: The total number of members who had a claim that included any SUD diagnosis in positions 1-9 within 30 days of the qualified ED visit D: The total number of members who received an ED visit with a SUD diagnosis ITM 4B: N: The total number of members with co-occurring mental health disorder who had a claim that included any SUD diagnosis in positions 1-9 for any SUD service within 30 days of the qualified ED visit D: The total number of members with co-occurring mental health disorder who received an ED visit with a SUD diagnosis
ITM 4A: N: 301 (23 telehealth – 7.64%) D: 950 R: 31.68%
ITM 4B: N: 281 D: 745 R: 37.71%
ITM 4A: N: 227 (35 telehealth – 15.41%) D: 899 R: 25.25%
ITM 4B: N: 206 D: 670 R: 30.75%
ITM 4A: N: 417 (77 telehealth – 18.47%) D: 1093 R: 38.15%
ITM 4B: N: 380 D: 835 R: 45.50%
ITM 4A: N: 212 (17 telehealth – (8.02%) D: 499 R: 42.48%
ITM 4B: N:194 D:368 R:52.72%
Barrier 3: Special Healthcare Needs (SHCN) eligible subpopulations pose unique communications and motivation challenges to engagement in case management.
Method of barrier identification: LDH guidance, direct feedback from case management interaction with members and multi-disciplinary MCO staff discussion. Member feedback obtained from case management interaction with members who has substance use diagnoses. The quality team completed a drill down on ten members involved in case management to gather common member barriers to successful engagement in substance use disorder treatment. Common barriers mainly included social determinants of health, such as homelessness, financial issues, limited supports, legal issues and vocational challenges. Additional barriers to success included co-occurring conditions, such as mental health and medical
2020
Q1 Q2 Q3 Q4

25
diagnoses.
Intervention #5 to address barrier: Develop member facing materials to increase member engagement with SUD treatment, as well as engagement with case management. Material to include information on SUD helpline and MAT. Planned Start Date: 3/1/2020 Actual Start Date: 4/1/2020
Intervention #5 tracking measure: N: The number of members with a primary SUD diagnosis engaged in UHC case management who received the targeted education D: The number of members with a primary SUD diagnosis engaged in UHC case management
N: 0 D: 314 R: 0
N: 17 D: 300 R: 5.67%
N: 26 D: 470 R: 5.53%
N: 12 D: 392 R: 3.06%
Intervention #6 to address barrier: Increase statewide availability of peer support programs to provide additional treatment and support options to members with SUD diagnoses. Planned Start Date: 4/1/2020 Actual Start Date: 11/1/2020
Intervention #6 tracking measure: N: Number of parishes with peer support availability D: Total number of parishes
N: 1 D: 64 R: 1.56%
N: 1 D: 64 R: 1.56%
N: 1 D: 64 R: 1.56%
N: 26 D: 64 R: 40.62%
Intervention #7 to address barrier: Target members who have been engaged in MAT treatment and are showing as recently non-compliant to ensure they have the appropriate linkage to providers to continue medication (result of COVID-19 crisis). To include the following medications; including Buprenorphine, Acamprosate calcium, Naltrexone HCl, Disulfiram, Naloxone HCl, Naltrexone microspheres, and Buprenorphine HCl/Naloxone HCl. Planned Start Date: 4/28/2020 Actual Start Date: 4/28/2020
Intervention #7 tracking measure: ITM 7A: N: The total number of members successfully outreached D: The total number of members targeted for MAT task force outreach ITM 7B: N: The total number of members that refilled their MAT medication D: The total number of members successfully outreached by the MAT taskforce
N: N/a D: N/a R: N/a
ITM 7A: N: 190 D: 645 R: 29.46%
ITM 7B: N: 175 D: 190 R: 92.1%
N: N/a D: N/a R: N/a
ITM 7A: N: 44 D: 2986 R: 1.47%
ITM 7B: N: 4 D: 44 R: 9.09%
26
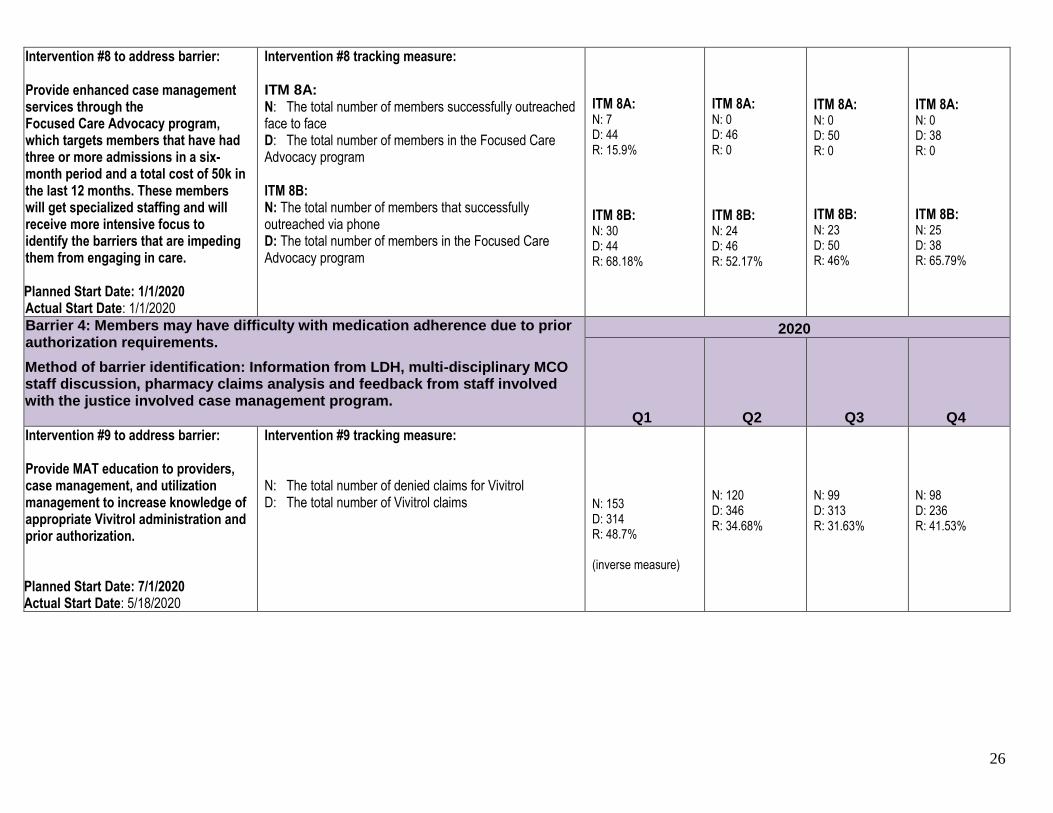
Intervention #8 to address barrier: Provide enhanced case management services through the Focused Care Advocacy program, which targets members that have had three or more admissions in a six-month period and a total cost of 50k in the last 12 months. These members will get specialized staffing and will receive more intensive focus to identify the barriers that are impeding them from engaging in care. Planned Start Date: 1/1/2020 Actual Start Date: 1/1/2020
Intervention #8 tracking measure: ITM 8A: N: The total number of members successfully outreached face to face D: The total number of members in the Focused Care Advocacy program ITM 8B: N: The total number of members that successfully outreached via phone D: The total number of members in the Focused Care Advocacy program
ITM 8A: N: 7 D: 44 R: 15.9%
ITM 8B: N: 30 D: 44 R: 68.18%
ITM 8A: N: 0 D: 46 R: 0
ITM 8B: N: 24 D: 46 R: 52.17%
ITM 8A: N: 0 D: 50 R: 0
ITM 8B: N: 23 D: 50 R: 46%
ITM 8A: N: 0 D: 38 R: 0
ITM 8B: N: 25 D: 38 R: 65.79%
Barrier 4: Members may have difficulty with medication adherence due to prior authorization requirements.
Method of barrier identification: Information from LDH, multi-disciplinary MCO staff discussion, pharmacy claims analysis and feedback from staff involved with the justice involved case management program.
2020
Q1 Q2 Q3 Q4
Intervention #9 to address barrier: Provide MAT education to providers, case management, and utilization management to increase knowledge of appropriate Vivitrol administration and prior authorization. Planned Start Date: 7/1/2020 Actual Start Date: 5/18/2020
Intervention #9 tracking measure: N: The total number of denied claims for Vivitrol D: The total number of Vivitrol claims
N: 153 D: 314 R: 48.7% (inverse measure)
N: 120 D: 346 R: 34.68%
N: 99 D: 313 R: 31.63%
N: 98 D: 236 R: 41.53%

27
Results
To be completed upon Proposal/Baseline and Final Report submissions. The
results section should present project findings related to performance indicators. Do not interpret the results in this section.
Table 5: Results
Indicator
Baseline Measure period: 1/1/18-12/31/18
Interim Measure period: 1/1/19-12/31/19
Final Measure period: 1/1/20-11/2/20
Percentage point
change: Baseline to Final period
*preliminary pending
final HEDIS 2021 rates
Target Rate
Indicator #1. Initiation of AOD Treatment: Total age groups, Alcohol abuse or dependence diagnosis cohort
N: 1687 D: 3897 R: 43.29
N: 2024 D: 4127 R: 49.04
N: 2069 D: 3740 R: 55.32%
+12.03
R: 56.28 Next quality compass benchmark (95th)
Indicator #2. Initiation of AOD Treatment: Total age groups, Opioid abuse or dependence diagnosis cohort
N: 1405 D: 2413 R: 58.23
N: 1641 D: 2731 R: 60.09
N: 1624 D: 2454
R: 66.18%
+7.95
R: 68.42
Next quality compass benchmark (90th)
Indicator #3. Initiation of AOD Treatment: Total age groups, Total diagnosis cohort
N: 5865 D: 12842 R: 45.67
N: 6634 D: 13218 R: 50.19
N: 6699 D: 12518
R: 53.51%
+7.84
R: 53.89
Next quality compass benchmark (95th)
Indicator #4. Engagement of AOD Treatment: Total age groups, Alcohol abuse or dependence diagnosis cohort
N: 497 D: 3897 R: 12.75
N: 621 D: 4127 R: 15.05
N: 610 D: 3740 R: 16.31%
+3.56
R: 18.49
Next quality compass benchmark (95th)
Indicator #5. Engagement of AOD Treatment: Total age groups, Opioid abuse or dependence diagnosis cohort
N: 590 D: 2413 R: 24.45
N: 823 D: 2731 R: 30.14
N: 778 D: 2454
R: 31.70%
+7.25
R: 35.11
Next quality compass benchmark (75th)
28
Indicator
Baseline Measure period: 1/1/18-12/31/18
Interim Measure period: 1/1/19-12/31/19
Final Measure period: 1/1/20-11/2/20
Percentage point
change: Baseline to Final period
*preliminary pending
final HEDIS 2021 rates
Target Rate
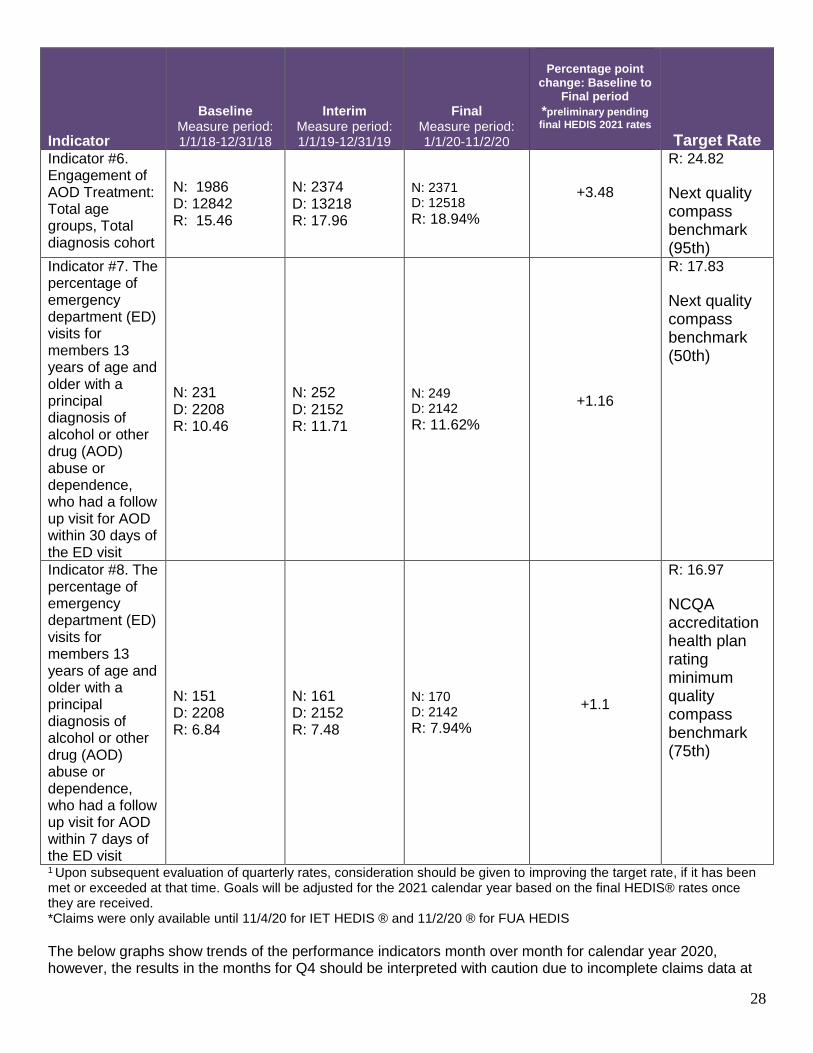
Indicator #6. Engagement of AOD Treatment: Total age groups, Total diagnosis cohort
N: 1986 D: 12842 R: 15.46
N: 2374 D: 13218 R: 17.96
N: 2371 D: 12518
R: 18.94%
+3.48
R: 24.82
Next quality compass benchmark (95th)
Indicator #7. The percentage of emergency department (ED) visits for members 13 years of age and older with a principal diagnosis of alcohol or other drug (AOD) abuse or dependence, who had a follow up visit for AOD within 30 days of the ED visit
N: 231 D: 2208 R: 10.46
N: 252 D: 2152 R: 11.71
N: 249 D: 2142
R: 11.62%
+1.16
R: 17.83
Next quality compass benchmark (50th)
Indicator #8. The percentage of emergency department (ED) visits for members 13 years of age and older with a principal diagnosis of alcohol or other drug (AOD) abuse or dependence, who had a follow up visit for AOD within 7 days of the ED visit
N: 151 D: 2208 R: 6.84
N: 161 D: 2152 R: 7.48
N: 170 D: 2142
R: 7.94%
+1.1
R: 16.97
NCQA accreditation health plan rating minimum quality compass benchmark (75th)
1 Upon subsequent evaluation of quarterly rates, consideration should be given to improving the target rate, if it has been met or exceeded at that time. Goals will be adjusted for the 2021 calendar year based on the final HEDIS® rates once they are received. *Claims were only available until 11/4/20 for IET HEDIS ® and 11/2/20 ® for FUA HEDIS
The below graphs show trends of the performance indicators month over month for calendar year 2020, however, the results in the months for Q4 should be interpreted with caution due to incomplete claims data at

29
this time. Highlights of rate trends are discussed in the following discussion section. These are monthly cumulative rates.
56%48%
58% 55% 58% 56% 54%58% 58% 57%
40%
Jan Feb Mar Apr May Jun Jul Aug Sep Oct Nov
RESULTS FIGURE 1: INITIATION: ALCOHOL
62%58%
66% 70% 71% 74%69% 70% 72%
58%
43%
Jan Feb Mar Apr May Jun Jul Aug Sep Oct Nov
RESULTS FIGURE 2: INITIATION OPIOID
52% 51% 52% 55% 55% 55% 53% 54% 56% 54%
39%
Jan Feb Mar Apr May Jun Jul Aug Sep Oct Nov
RESULTS FIGURE 3: INITIATION TOTAL

30
19%
16% 16%14%
19% 18%16%
14%
18%
10%
0%Jan Feb Mar Apr May Jun Jul Aug Sep Oct Nov
RESULTS FIGURE 4: ENGAGEMENT ALCOHOL
28% 30%36% 37%
30%34%
32%36%
31%
24%
0%Jan Feb Mar Apr May Jun Jul Aug Sep Oct Nov
RESULTS FIGURE 5: ENGAGEMENT OPIOID
19% 20% 20% 22%20% 19% 20%
18% 19%
11%
0%Jan Feb Mar Apr May Jun Jul Aug Sep Oct Nov
RESULTS FIGURE 6: ENGAGEMENT TOTAL

31
11%9%
7%
12%
19%
11%
14% 14%
9% 10%
0%Jan Feb Mar Apr May Jun Jul Aug Sep Oct Nov
RESULTS FIGURE 7: FUA 30 DAY
8%7%
4%
7%
11%
10%9%
10%
6% 7%
0%Jan Feb Mar Apr May Jun Jul Aug Sep Oct Nov
RESULTS FIGURE 8: FUA 7 DAY

32
Discussion
To be completed upon Interim/Final Report submission. The discussion section is for
explanation and interpretation of the results.
Discussion of Results
Interpret the performance indicator rates for each measurement period, i.e., describe whether rates improved or declined between baseline and interim, between interim and final and between baseline and final measurement periods. There were no performance indicators that met the target rate for the project, however, all performance indicators reflected an increase in rates. Sustained improvement will be further evaluated when the full data is available. The total initiation rate varied slightly over the final measurement period, starting 52% and increasing to 56% in Q3 (results, figure 3). The total engagement rate also varied slightly over the final measurement period, however, was the same rate at the end of Q3 as it was in the beginning of Q1 (results, figure 6). The FUA rates showed more variability over the course of the final measurement period, possibly due to the COVID-19 pandemic. FUA 7-day rates began around 8% and decreased to 6% at the end of Q3 (results, figure 8). FUA 30-day rates began at 11% and decreased to 9% at the end of Q3 (results, figure 7). Q4 could not be trended due to incomplete claims data available at the time of this report. The overall goal of the project was to improve both member initiation and engagement for substance use disorder treatment, as well as member follow-up after an emergency department visit for a substance use disorder diagnosis. Key indicators chosen for the study were Initiation and Engagement of Alcohol and Other Drug Abuse or Dependence Treatment (IET) HEDIS rates and Follow-Up after ED Visit for Alcohol and Other Drug Abuse/Dependence (FUA) HEDIS rates. Target rates for these measurements were determined using the 2019 NCQA ® quality compass percentiles, as 2020 percentiles did not become available until October 2020. The baseline rate for total initiation was just above the 2019 NCQA® quality compass 66th percentile, at 45.67%. The goal for this measure was set at the NCQA® quality compass 95th percentile (53.89%). The final rate for total initiation was just below the NCQA® quality compass 95th percentile, at 53.51%. While the NCQA® year is not complete, we appear to be on track to meet the NCQA® quality compass 95th percentile. In comparison, the final rate fell just below the updated 2020 NCQA® quality compass 95th percentile. The baseline rate for total engagement was just above the 2019 NCQA® quality compass 50th percentile, at 15.46%. The goal for this measure was the NCQA® quality compass 95th percentile (24.82%). The final rate for total engagement was just above the NCQA® quality compass 75th percentile, at 18.94%. While the HEDIS year is not complete, we appear to be on track to meet the NCQA® quality compass 75th percentile. In comparison, the final rate fell just above the updated 2020 NCQA® quality compass 75th percentile. For the FUA measures, the baseline rate for 30 day follow up fell just below the 2019 NCQA® quality compass 25th percentile at 10.46%. The goal for this measure was the NCQA® quality compass 50th percentile (17.91%). The final rate for 30-day post emergency room follow up was just above the NCQA® quality compass 25th percentile, at 11.62%. While the HEDIS year is not complete, we appear to be on track to meet the NCQA® quality compass 25th percentile. In comparison, the final rate fell just above the updated 2020 NCQA® quality compass 25th percentile.

33
For the FUA measures, the baseline rate for 7 day follow up fell just above the 2019 NCQA® quality compass 25th percentile at 6.84%. The goal for this measure was the NCQA® quality compass 75th percentile (17.01%). The final rate for 7-day post emergency room follow up was just above the NCQA® quality compass 25th percentile, at 7.94%. While the HEDIS year is not complete, we appear to be on track to meet the NCQA® quality compass 25th percentile. In comparison, the final rate fell just above the updated 2020 NCQA® quality compass 25th percentile.
Explain and interpret the results by reviewing the degree to which objectives and goals were achieved. Use your ITM data to support your interpretations.
Intervention tracking measures were identified that were thought to be feasible ways to target key areas that may improve outcomes with member engagement and follow up with SUD treatment. Although some interventions experienced notable limitations due to COVID-19 and other natural disasters throughout the study period, there were some preliminary improvements in rates (pending Q4 complete data). Barriers were identified through direct feedback from providers and members, as well as from internal staff direct interactions and guidance from The Louisiana Department of Health. One specific area we identified through our barrier analysis was to conduct provider education on the assessment, triage and referral of members with substance use disorders. This education included information on Medication Assisted Treatment and SBIRT, as well as levels of care and regional resources. The intervention included a PowerPoint presentation that was delivered by a licensed clinical social worker from the quality department and behavioral health medical director. This deck was presented in several ways, including via a statewide provider townhall, breakout sessions with several federally qualified health clinics, and through virtual provider expos. Additionally, provider facing flyers were disseminated to encourage participation in additional training via the provider education site, which offers courses that include motivational interviewing and addiction/trauma informed care. In evaluating the ITM data, we noted that few providers chose to utilize the independent virtual learning platforms for courses, while more providers were likely to engage in the in person virtual presentation. Additionally, there was a slight improvement in the number of providers using SBIRT claims quarter over quarter. Although the number of claims was not an official tracking measure, we also saw an increase in claims paid quarter over quarter. While SBIRT is one tool that can be used by providers to identify and refer individuals to SUD treatment, we realize there is work happening by providers to ensure members are appropriately identified and referred, but this may not be reflected in claims. We noted that some providers are screening for SUD but do this under as standard E & M billing code and do not submit a separate SBIRT claim code, therefore, our data may not truly reflect the work happening through our providers specific to SUD screening. We also included an ITM to track the number of DEA X waivered providers statewide. Overall, we showed a slight decrease in the number of waivered prescribers quarter over quarter (decrease of 0.19%). However, the number of waivered prescribers did remain relatively consistent quarter over quarter despite the project being placed on hold for part of the study year, decreasing by only 0.19% from Q1 to Q3. We were unable to offer a DEA X waiver training during the test period due to COVID-19 related delays. The data included in tracking measure is specific to only MAT providers who have a DEA-X waiver to prescribe buprenorphine, so our overall MAT who can prescribe other MAT medications (such as Naltrexone, Acamposate, Disulfiram) is much broader. Based on this assessment, we believe our network of overall MAT prescribers is adequate. However, we continue to evaluate any gaps in member accessibility and will address any regions with limited provider availability for future recruitment. Our third ITM tracked the number of members who were prescribed buprenorphine and receiving psychosocial/therapeutic services. This measure was based on both pharmacy and encounter claims data. We provided targeted education to those prescribers that were the highest volume with the lowest adherence rates, which included physician to physician outreach and educational information on SAMHSA best practice guidelines and other additional trainings available. While there was a slight decrease in overall adherence from Q1 to Q2 of 1.29%, rates rebound in Q3 for an overall increase of 1.04%.

34
We also noted through our barrier analysis that an ITM to focus on education and outreach to emergency rooms may help to promote SBIRT and appropriate SUD screening and referral for our members. We decided to track this using claims-based data on the number of members who had a follow up appointment with any SUD diagnosis on diagnoses 1-9, rather than use the FUA technical specifications that only consider the primary diagnosis. The FUA numerator technical specifications are very concentrated and exact and may not fully represent the scope at which some of the members are getting care, due to the principle diagnosis requirements. This limits the picture of what services members are receiving for SUD related diagnoses since that may not be coded as the primary diagnosis. We were attempting to get a broader idea of what members are getting care, but the primary diagnosis on the claim may not be the SUD diagnosis (could be a MH diagnosis). For example, if a member with dual diagnoses attends a primarily mental health related appointment that also addresses their substance use disorder, this encounter would not count towards the FUA numerator. In this same instance, it would count for our numerator for this ITM if there was a SUD diagnosis listed on the claim, even if it was not primary. We also wanted to analyze if those members with a co-occurring behavioral health diagnosis had better rates of follow up than those with a SUD diagnosis only. Initially, we saw a decrease in both sub-measures from Q1 to Q2; however, both rates increased from Q1 to Q3. ITM 4A increased by 6.47% while ITM 4B increased by 7.79%. We also saw an increase in the rate of use in which members were using telemedicine for visits following an ED visit (10.83%). Although this measure appears like the FUA HEDIS measure, the main difference is that diagnoses must match up exactly on claims for both the ED visit and the follow up visit to be counted in the HEDIS measure. For this intervention tracking measure, we wanted to measure how many members had any SUD service after their ED visit, not necessarily just encounters that mirrored the ED diagnoses. Although we were unable to engage any ED’s individually for our provider education presentation, some providers that attended larger presentations may be involved with emergency care. We were able to identify some target ED’s based on data analysis, but we experienced great difficulty is setting up these meetings with the facilities. However, we continue to work on establishing meetings so that we can conduct this education at a future date and hope to establish some ongoing collaboration on how we can better support them in working with our members. Another area of focus for the study was related to our case management program. We developed an ITM to track the number of members who received specialized educational material from case management. This material included pertinent helpline contacts and information normalizing substance use disorders to decrease the stigma associated with seeking treatment and increase member engagement. Although the volume of members receiving the education was low, this educational material is being used with both provider and member facing staff across the state. Use of the tool did increase from Q1 to Q3 by 5.53%, but this may have not been the most accurate way to determine if new materials were being successfully shared with members. Many of our members are difficult to find as the addresses and phone numbers available are often incorrect, which was further compounded by the events of the study period. Quality staff met with case management staff throughout the study to address barriers to this intervention, as well as explore other needs case management staff may have in order to better engage members. Our second ITM related directly to member engagement and decrease of stigma was to increase the availability of peer support services. Initially, we experienced some stagnancy with our ability to successfully contract with these providers. However, we were able to increase the number of parishes covered by peer support providers from 1 to 26, which is a 39.06% increase. The next ITM focused on supporting members who are engaged in MAT treatment to ensure they had the appropriate support and resources to continue treatment through the COVID-19 crisis. This intervention was only in place for Q2 and therefore cannot be trended; however, outreaches resulted in over 90% of members successfully reached refilling their MAT medications. Although we have preliminary data for Q4, the new program structure did not begin until 11/11/2020. We are awaiting additional ITM data for Q4 for more

35
informed conclusions around the impact of this intervention. There were 2896 members identified for outreach in Q4 and data was only available for the first two weeks of the program at the time of this report. Another area of focus for the study was related to enhancing our case management program. We developed an ITM to track how members were engaged with case management, specifically members who met criteria and are enrolled in our focused care advocacy program. As previously thought, telephonic case management contacts had a higher volume than face to face contacts in all three quarters. Face to face visits were prohibited in Q2 and Q3 due to COVID-19. While this was valuable information, there may be a more useful way to gather data around the focused case advocacy program in the future, such as how this affects their engagement in SUD treatment or effects on total cost of care. The last ITM we tracked was related to the education we provided to providers and staff around MAT medication administration and authorization, with a focus on Vivitrol due to a reported issue around medications being denied through retail pharmacies. This issue was initially identified specifically to those members with justice involvement and transitioning back to the community, however, it was determined that a system wide intervention may also decrease barriers to members. Education was provided in Q2. From Q1 to Q3, denied claims for Vivitrol decreased by 17.07%. We will continue to monitor the percentage of denied claims to determine if additional training sessions are needed. Targeted education around appropriate screening, resources and referral led to minimal increases in the use of SBIRT with providers. While the DEA-X waivered prescribers have not increased in the measurement period, they did remain steady through COVID-19 and other natural disasters. Member adherence to recommended therapy while being prescribed MAT medications has increased slightly during the study period. There was a notable increased in the number of members who followed up after an ED visit for a SUD diagnosis, but additional data is needed to determine if this had a positive effect on the final outcomes of the study. The member materials have not been widely used within the tracking measures but may have had some other positive benefits across the state. Peer support providers and increased case management services have been added for additional member support and engagement. While some interventions may have made traction, several are still in progress and have not had enough time to successfully affect rates.
What factors were associated with success or failure? For example, in response to stagnating or declining ITM rates, describe any findings from the barrier analysis triggered by lack of intervention progress, and how those findings were used to inform modifications to interventions.
Interventions were in place for a limited amount of time, which could have affected their efficacy over the course of the project. Additionally, some interventions could not be fully implemented due to both internal and external delays and are still in process. Results of intervention tracking measures and interventions were reviewed in at least bi-weekly multi-disciplinary work group meetings to address any stagnation or declining rates. Some factors associated with limited success included restrictions around communication and interactions with providers and members, as well as the flood of information that members and providers had to absorb during the pandemic.
Limitations As in any population health study, there are study design limitations for a PIP. Address the limitations of your project design, i.e., challenges identified when conducting the PIP (e.g., accuracy of administrative measures that are specified using diagnosis or procedure codes are limited to the extent that providers and coders enter the correct codes; accuracy of hybrid measures specified using chart review findings are limited to the extent that documentation addresses all services provided).
Were there any factors that may pose a threat to the internal validity the findings? Definition and examples: internal validity means that the data are measuring what they were intended to measure. For instance, if the PIP data source was meant to capture all children 5-11 years of age with an asthma diagnosis, but instead the PIP data source omitted some children due to inaccurate ICD-10 coding, there is an internal validity problem.

36
Initially, factors included typical claims lag that can last up to 90 calendar days and can impact the final HEDIS rates, which were the key indicators for this study. A full evaluation of the impact of interventions could be determined until final HEDIS rates were completed.
Were there any threats to the external validity the findings? Definition and examples: external validity describes the extent that findings can be applied or generalized to the larger/entire member population, e.g., a sample that was not randomly selected from the eligible population or that includes too many/too few members from a certain subpopulation (e.g., under-representation from a certain region).
Lower rates in the final quarterly measurement could be attributed to claims only being available through 11/2/2020. This does not consider claims that may be submitted later or are still processing. Quality Compass rates are based on a full calendar year of data, which is not available at this time.
Describe any data collection challenges. Definition and examples: data collection challenges include low survey response rates, low medical record retrieval rates, difficulty in retrieving claims data, or difficulty tracking case management interventions.
The use of HEDIS rates for indicators prevents an accurate determination on the overall effectiveness of interventions, due to reporting lags in the data and claims lags.
The validation findings generally indicate that the credibility of the PIP results is not at risk. Results must be interpreted with some caution due to several factors including; the short timeframe for the study, the data lags around HEDIS and claims, and the key indicators used to determine efficacy being reliant on an entire year’s worth of data. The ability to draw true conclusions around the data cannot be determined to be final.
Throughout the course of the project, finding updates were shared with internal staff during committee and staff meetings. Multi-disciplinary, integrated meetings were also held throughout the project to share findings, as well as obtain MCO wide feedback. The results will also be shared with this team. The final report is submitted to the Louisiana Department of Health. The final report summary will be reviewed at both Provider Advisory Committee and Member Advisory Committee.
37
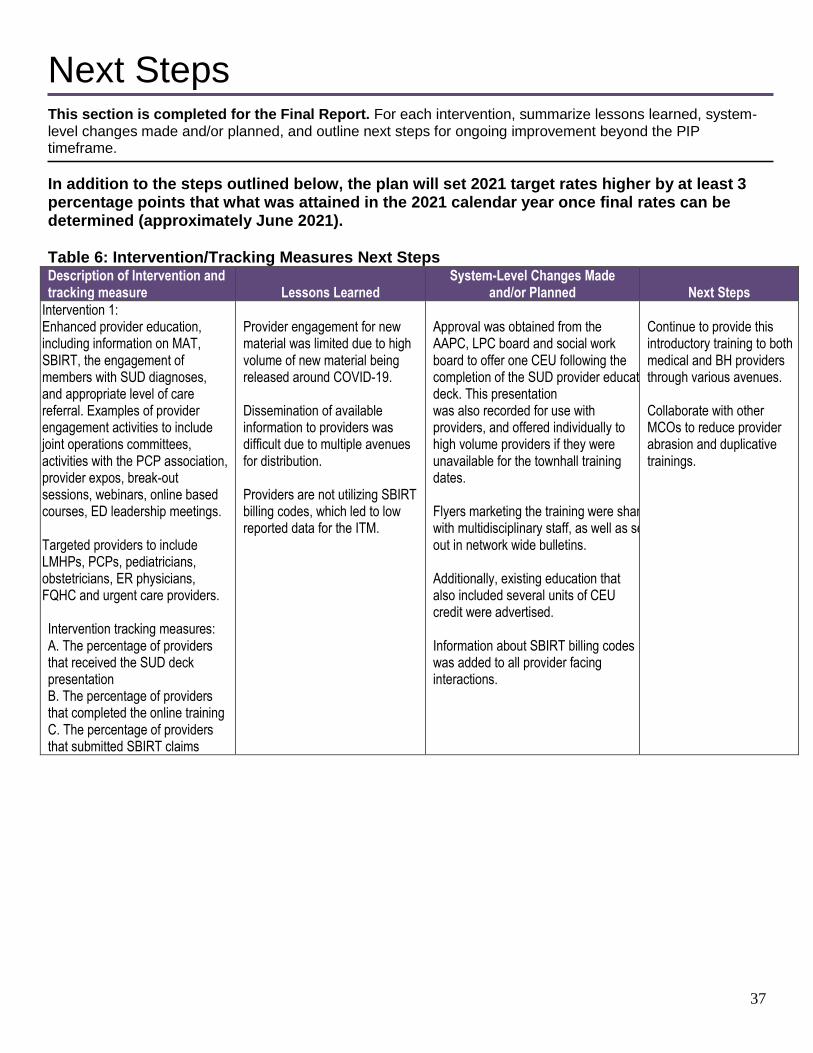
Next Steps
This section is completed for the Final Report. For each intervention, summarize lessons learned, system-level changes made and/or planned, and outline next steps for ongoing improvement beyond the PIP timeframe.
In addition to the steps outlined below, the plan will set 2021 target rates higher by at least 3 percentage points that what was attained in the 2021 calendar year once final rates can be determined (approximately June 2021). Table 6: Intervention/Tracking Measures Next Steps Description of Intervention and tracking measure Lessons Learned
System-Level Changes Made and/or Planned Next Steps
Intervention 1: Enhanced provider education, including information on MAT, SBIRT, the engagement of members with SUD diagnoses, and appropriate level of care referral. Examples of provider engagement activities to include joint operations committees, activities with the PCP association, provider expos, break-out sessions, webinars, online based courses, ED leadership meetings. Targeted providers to include LMHPs, PCPs, pediatricians, obstetricians, ER physicians, FQHC and urgent care providers.
Intervention tracking measures: A. The percentage of providers that received the SUD deck presentation B. The percentage of providers that completed the online training C. The percentage of providers that submitted SBIRT claims
Provider engagement for new material was limited due to high volume of new material being released around COVID-19. Dissemination of available information to providers was difficult due to multiple avenues for distribution. Providers are not utilizing SBIRT billing codes, which led to low reported data for the ITM.
Approval was obtained from the AAPC, LPC board and social work board to offer one CEU following the completion of the SUD provider education deck. This presentation was also recorded for use with providers, and offered individually to high volume providers if they were unavailable for the townhall training dates. Flyers marketing the training were shared with multidisciplinary staff, as well as sent out in network wide bulletins. Additionally, existing education that also included several units of CEU credit were advertised. Information about SBIRT billing codes was added to all provider facing interactions.
Continue to provide this introductory training to both medical and BH providers through various avenues. Collaborate with other MCOs to reduce provider abrasion and duplicative trainings.

38
Intervention 2: Sponsor DEA X waiver training for providers Intervention tracking measure: The percentage of DEA X waivered prescribers in the network
Securing a community partnership for waiver training presented additional challenges due to COVID-19.
The plan determined a virtual training would be the most impactful due to COVID-19 limitations.
Ongoing evaluation of regions/parishes where there may be deficits in MAT/SUD providers, followed by recruitment and/or additional trainings to increase network availability. Additionally, the plan collaborating with the hospital system to reach as many providers as possible in urban areas. The medical director is currently coordinating with external partners to determine how to market a free DEA X waiver program that is available virtually, as well as determining any incentives that could be offered to providers that complete the program.
Intervention 3: Identify MAT prescribers with lower compliance rates of engaging members in psychosocial treatment and provide targeted education that includes information on MAT best practices and additional resources Intervention tracking measure: The percentage of members were prescribed buprenorphine and had a therapy encounter
Although prescribers appeared to be aware of best practices around MAT medications, few prescribers required psychosocial treatment (although most did recommend this component of treatment). There is no process in place to hold either prescribers or members to the psychosocial component of treatment.
The plan disseminated best practice and quick reference guide information, specifically targeting MAT providers to ensure awareness of psychosocial components of care. The BH medical director reached out to several prescribers via phone do discuss potential barriers to member engagement in psychosocial care, as well as stress the importance of adhering to best practices around MAT service delivery.
The plan is currently drafting a form letter for high volume providers, that will be sent out along with the educational materials previously mentioned, including member materials that link patients with resources to schedule therapy services. The medical director will be available for further discussion with these providers if desired. The plan is also reviewing how to incorporate a more robust tracking metric to address this important piece of MAT treatment and increase provider/member accountability.

39
Intervention 4: Educate and link area EDs with specialized SUD programming, which provide medication and psychosocial components of care, as well as comprehensive evaluation and referral to appropriate level of care. Intervention tracking measure: A. The percentage of members that had a claim for any SUD related service in the 30 days following their diagnosis B. The percentage of members with a co-occurring mental health diagnosis that had a claim for any SUD related service in the 30 days following their diagnosis
ED staff have limited bandwidth for training/educational materials.
Collaborate with LDH and other MCOs to assess how system wide changes can be made within the hospital setting
All MCOs have begun attending PIP collaborative meeting to assess how system wide changes can be made within the hospital setting in order to increase the use of ASAM 6-dimensional risk assessments and referrals to appropriate levels of care. The plan continues to coordinate with EDs across the state for future educational offers, following the COVID-19 crisis.
Intervention 5: Develop member facing materials to increase member engagement with SUD treatment, as well as engagement with case management. Material to include information on SUD helpline and MAT. Intervention tracking measure: The percentage of members with a primary SUD diagnosis who received the targeted education and were enrolled in case management.
Due to limitations in face to face contact during the COVID-19 crisis, this information was provided via phone during part of the study and may not have been as effective.
Additional material needs were addressed in weekly multidisciplinary meetings with case management leadership.
Evaluate additional tools/materials that can be used to engage members in SUD treatment through direct CM feedback/input.
Intervention 6: Increase statewide availability of peer support programs to provide additional treatment and support options to members with SUD diagnoses. Intervention tracking measure: The percentage of parishes with current peer support service providers.
Contracting for peer support services was complex due to new fee schedules having to be developed and additional complications related to claims programming. This caused a delay in contracting.
Going forward, onboarding peer support providers will be more efficient due to steps put in place throughout this initial onboarding process.
Add additional peer support services across the state to increase member engagement and resources. The plan is exploring how to appropriately and accurately educate peer support providers on offering telehealth options.

40
Intervention 7: Target members who have been engaged in MAT treatment and are showing as recently non-compliant to ensure they have the appropriate linkage to providers to continue medication (result of COVID-19 crisis). Intervention tracking measure: A: The percentage of members who were successfully outreached regarding adhering to ongoing MAT prescriptions B. The percentage of members who successfully refilled their medications during the outreach period.
This intervention was resource intensive. Members were difficult to reach during natural disasters, such as hurricanes, and had more immediate case management needs (i.e. housing support, financial resources, food) which was addressed first.
National case management leadership has been engaged to determine how this pilot can be continued long term and managed within the workforce.
This intervention will continue with additional support from pharmacy and other national partners.
Intervention 8: Provide enhanced case management services through the Focused Care Advocacy program, which targets members that have had three or more admissions in a six-month period and a total cost of 50k in the last 12 months. These members will get specialized staffing and will receive more intensive focus to identify the barriers that are impeding them from engaging in care. Intervention tracking measure: A. The percentage of members in the program who were successfully contacted face to face. B. The percentage of members in the program who were successfully contacted by phone
The intervention tracking measure used to measure the success of this intervention did not accurately depict the benefits of members being in the program.
Quality and case management staff have been collaborating to determine a more valuable way of tracking the effect of this program on membership, such as ED utilization or total cost of care.
Determine/confirm the best data metric to track regarding this intervention, which will be clearer once a full calendar year of data is available. The plan is reviewing medical behavioral integrated programs that can do in person outreach to address various population health needs and provide treatment in place.

41
Intervention 9: Provide education to providers, case management, and utilization management to increase knowledge of appropriate Vivitrol administration and prior authorization. Intervention tracking measure: The percentage of denied claims for Vivitrol.
Many provider and member facing staff were not aware of the various options for MAT treatment.
This educational series was provided several times to ensure all plan staff were aware of MAT treatment options, as well as the best steps to take to ensure barriers to members are minimized.
Continue to track the number of denials for Vivitrol to determine the need for additional educational sessions and if education needs to be expanded. Drill down on specific denial data to determine if there is any opportunity to target education for member or provider cohorts. Collaborate with provider advocacy to educate providers with high denial rates.

42
References
Initiation and Engagement of Alcohol and Other Drug Abuse or Dependence Treatment. (n.d.). Retrieved October 10, 2018, from https://www.ncqa.org/hedis/measures/initiation-and-engagement-of-alcohol-and-other-drug-abuse-or-dependence-treatment/ Ericson, N. (2001). Substance Abuse: The Nation’s Number One Health Problem. PsycEXTRA Dataset. doi:10.1037/e381342004-001 Increases in Drug and Opioid Overdose Deaths - United States, 2000–2014. (2016, January 01). Retrieved October 10, 2018, from https://www.cdc.gov/mmwr/preview/mmwrhtml/mm6450a3.htm Lee, M. T., Garnick, D. W., O'Brien, P. L., Panas, L., Ritter, G. A., Acevedo, A., . . . Godley, M. D. (2012, June). Adolescent treatment initiation and engagement in an evidence-based practice initiative. Retrieved October 10, 2018, from https://www.ncbi.nlm.nih.gov/pmc/articles/PMC3345887/ The National Survey on Drug Use and Health (NSDUH) is an annual survey sponsored by the Substance Abuse and Mental Health Services Administration (SAMHSA). The survey is the primary source of information on the use of illicit drugs, alcohol, and tobacco in the civilian, noninstitutionalized population of the United States aged 12 years old or older, and also includes mental health issues and mental health service utilization for adolescents aged 12 to 17 and adults aged 18 or older. Conducted by the Federal Government since 1971, the survey collects data by administering questionnaires to a representative sample of the population through face-to-face interviews at their place of residence. The data used in this report are based on information obtained from approximately 67,500 individuals aged 12 or older per year in the United States. Additional information about NSDUH is available at http://www.samhsa.gov/data/population-data-nsduh. Harris, A. H., Humphreys, K., Bowe, T., Tiet, Q., & Finney, J. W. (2008). Does Meeting the HEDIS Substance Abuse Treatment Engagement Criterion Predict Patient Outcomes? The Journal of Behavioral Health Services & Research, 37(1), 25-39. doi:10.1007/s11414-008-9142-2

43

44
Glossary of PIP Terms Table 7: PIP Terms
PIP Term Also Known as… Purpose Definition
Aim Purpose
To state what the MCO is trying to accomplish by implementing their PIP.
An aim clearly articulates the goal or objective of the work being performed for the PIP. It describes the desired outcome. The Aim answers the questions “How much improvement, to what, for whom, and by when?”
Barrier Obstacle
Hurdle
Roadblock
To inform meaningful and specific intervention development addressing members, providers, and MCO staff.
Barriers are obstacles that need to be overcome in order for the MCO to be successful in reaching the PIP Aim or target goals. The root cause (s) of barriers should be identified so that interventions can be developed to overcome these barriers and produce improvement for members/providers/MCOs. A barrier analysis should include analyses of both quantitative (e.g., MCO claims data) and qualitative (such as surveys, access and availability data or focus groups and interviews) data as well as a review of published literature where appropriate to root out the issues preventing implementation of interventions.
Baseline rate Starting point To evaluate the MCO’s performance in the year prior to implementation of the PIP.
The baseline rate refers to the rate of performance of a given indicator in the year prior to PIP implementation. The baseline rate must be measured for the period before PIP interventions begin.
Benchmark rate Standard
Gauge
To establish a comparison standard against which the MCO can evaluate its own performance.
The benchmark rate refers to a standard that the MCO aims to meet or exceed during the PIP period. For example, this rate can be obtained from the statewide average, or Quality Compass.
Goal Target
Aspiration
To establish a desired level of performance.
A goal is a measurable target that is realistic relative to baseline performance, yet ambitious, and that is directly tied to the PIP aim and objectives.
Intervention tracking measure
Process Measure To gauge the effectiveness of interventions (on a quarterly or monthly basis).
Intervention tracking measures are monthly or quarterly measures of the success of, or barriers to, each intervention, and are used to show where changes in PIP interventions might be necessary to improve success rates on an ongoing basis.

45
PIP Term Also Known as… Purpose Definition
Limitation Challenges
Constraints
Problems
To reveal challenges faced by the MCO, and the MCO’s ability to conduct a valid PIP.
Limitations are challenges encountered by the MCO when conducting the PIP that might impact the validity of results. Examples include difficulty collecting/ analyzing data, or lack of resources / insufficient nurses for chart abstraction.
Performance indicator
Indicator
Performance Measure (terminology used in HEDIS)
Outcome measure
To measure or gauge health care performance improvement (on a yearly basis).
Performance indicators evaluate the success of a PIP annually. They are a valid and measurable gauge, for example, of improvement in health care status, delivery processes, or access.
Objective Intention To state how the MCO intends to accomplish their aim.
Objectives describe the intervention approaches the MCO plans to implement in order to reach its goal(s).

46
Appendix A: Fishbone (Cause and Effect) Diagram

48
Appendix B: Priority Matrix
Which of the Root Causes Are . . .
Very Important Less Important
Very Feasible to Address Lack of member knowledge regarding options for SUD treatment Lack of member engagement in CM Lack of provider knowledge and interest on SUD screening, referral process, and SUD treatment options Internal process to identify DEA X waivered MAT providers Targeting geographic areas Member difficulty filling Vivitrol prescriptions Member difficulties related to telehealth
Delays in meeting with facility staff
Less Feasible to Address Social determinants of health Member inaccurate contact info Information sharing around SUD Ensuring MAT prescribers follow best practices Natural disasters and COVID-19 related barriers to care Stigma around SUD treatment for members/providers
Provider incentive for engagement

49
Appendix C: Strengths, Weaknesses, Opportunities, and Threats (SWOT) Diagram
Positives Negatives
INT
ER
NA
L
un
der
yo
ur
co
ntr
ol
build on
STRENGTHS Examples:
Strong program for members involved in the department of corrections
Historical data confirms members who are actively engaged with CM have higher rates of initiation and engagement
Provider educational materials have been effective in raising awareness and knowledge around appropriate assessment, triage and referral of SUD
minimize
WEAKNESSES Examples:
Communication between UM/CM
Data limitations around ADT feeds
EX
TE
RN
AL
no
t u
nd
er
yo
ur
co
ntr
ol, b
ut
can
im
pact
yo
ur
wo
rk
pursue
OPPORTUNITIES
Examples:
Provider engagement with education
Member engagement with case management
Provider engagement with case management
protect from
THREATS
Examples:
Difficulties engaging with ER staff/facilities
ITMs/performance indicators are based on administrative data and will be lagged, making it difficult to reassess the impact of interventions throughout a study with a brief measurement period
COVID-19 related complications, as well as natural disaster effects leading to inability to provide face to face case management and limited provider contact

50
Appendix D: Driver Diagram
Aim Primary Drivers Secondary Drivers Change Concepts MCO-identified Enhanced Interventions to test Change Concepts
1. Improve the rates for Initiation of and Engagement in Alcohol and Other Drug Abuse or Dependence Treatment to the next highest Quality Compass percentile (or by 10 percentage points)
2. Improve the rates for Follow-Up After Emergency Department Visit for Alcohol and Other Drug Abuse or Dependence to the next highest
First-line medical provider knowledge: PCPs: youth, adult, OB/Gyn ED providers
- Understanding Stages of Change and motivational interviewing for SUD -SBIRT training: adult, youth -ASAM criteria for level of care/transitions in care training - MAT waiver-training and local SUD treatment resources - Staff and providers may not be aware of the IET timeline specifications
Implement innovative approaches for training providers in (SBIRT) Adult and Adolescent specific screening, brief intervention, triage and referral to ASAM evaluations in first-line medical settings. - Prompt ASAM level of care evaluations/referral to treatment for those members presenting at the ED/inpatient with SUD overdoses. - First-line medical provider education supporting screening, brief intervention and referral (Stages of Change, motivational interviewing, knowledge of available treatment/services/providers)
Enhanced provider education, including information on MAT, SBIRT, the engagement of members with SUD diagnoses, and appropriate level of care referral. Examples of provider engagement activities to include joint operations committees, activities with the PCP association, provider expos, break-out sessions, webinars, online based courses, ED leadership meetings. Targeted providers to include LMHPs, PCPs, pediatricians, obstetricians, ER physicians, FQHC and urgent care providers.
Waiver training to increase MAT prescribers statewide
Sponsor DEA X waiver training for providers
Implement innovative statewide intervention to increase MAT prescriber knowledge of local evidence-based psychosocial treatment resources and referral procedures to higher levels of care
Identify MAT prescribers with lower compliance rates of engaging members in psychosocial treatment and provide targeted education that includes information on MAT best practices and additional resources
Member Engagement:
-Members in Pre-Contemplation Stage of
SHCN Case Management: Implement innovative approaches to conduct motivational interviewing
Develop member facing materials to increase general member engagement with SUD treatment, as

51
Aim Primary Drivers Secondary Drivers Change Concepts MCO-identified Enhanced Interventions to test Change Concepts
Quality compass percentile (or by 10 percentage points)
Youth, adult, all SUD involved SHCN subpopulations eligible for CM:
Change Vulnerability of SHCN sub-populations -SDOH impeding service delivery
techniques, with increased face-to-face engagement with members (Recovery coaches, Life coaches BH advocates, etc.)
well as engagement with case management. Material to include information on SUD helpline and MAT.
Increase statewide availability of peer support programs to provide additional treatment and support options to members with SUD diagnoses. Target members who have been engaged in MAT treatment and are showing as recently non-compliant to ensure they have the appropriate linkage to providers to continue medication. Provide enhanced case management services through the Focused Care Advocacy program, which targets members that have had three or more admissions in a six-month period and a total cost of 50k in the last 12 months. These members will get specialized staffing and will receive more intensive focus to identify the barriers that are impeding them from engaging in care. Provide education to providers, case management, and utilization management to increase knowledge of appropriate Vivitrol administration and prior authorization.

52
Aim Primary Drivers Secondary Drivers Change Concepts MCO-identified Enhanced Interventions to test Change Concepts

53
Appendix E: Plan-Do-Study-Act Worksheet
Pilot Testing Measurement #1 Measurement #2
Intervention #1: Provide education to providers, case management, and utilization management to increase knowledge of appropriate Vivitrol
administration and prior authorization.
Plan: Document the plan for conducting the intervention.
Who: Education was provided to internal staff members, including both member and provider facing staff. What: The training included common barriers for both providers and members surrounding Medication Assisted Treatment (MAT), as well as indications for the various types of MAT available in the state. There was a focus on Naltrexone due to the barrier that members were having with prior authorizations in retail pharmacies. When: Trainings were offered on three separate occasions to accommodate for staff schedules (May 18, May 20, June 5). Where: Trainings were provided via WebEx with reference materials available following the training. Prediction: Through increasing staff knowledge and awareness of the appropriate indications and administration of MAT medications, member barriers to filling MAT medications will decrease (specifically Naltrexone). Data Collection: Pharmacy staff will track the number of Naltrexone prescriptions that have been denied due to no prior authorization through the pharmacy claims system.
Numerator: The total number of denied claims for Vivitrol due to no prior authorization Denominator: The total number of Vivitrol claims
Month Rejected Total Rate
Jan-20 55 96 57.29%
Feb-20 29 68 42.65%
Mar-20 62 143 43.36%
Apr-20 40 116 34.48%
May-20 36 103 34.95%
Jun-20 44 127 34.65%
Numerator: The total number of denied claims for Vivitrol due to no prior authorization Denominator: The total number of Vivitrol claims
Month Paid Rejected Total Rate
Jul-20 72 35 107 32.71%
Aug-20 72 35 107 32.71%
Sep-20 70 29 99 29.29%

54
Do: Document implementation of the intervention.
Training was offered to staff on three occasions throughout May and June. Over 100 staff members attended the training. Data was collected on the number of naltrexone prescriptions that were denied based on prior authorization issues.
Study: Document what you learned from the study of your work to this point, including impact on secondary drivers.
The education of member and provider facing staff appeared to have a positive effect on the number of denials, as the rate decreased following the intervention implementation. Staff also responded positively to the training. This directly impacted the secondary driver related to barriers for members accessing medication.
Act: Document how you will improve the plan for the subsequent phase of your work based on the study and analysis of the intervention.
Going forward, the denial rate will continue to be monitored to ensure rates do not rebound. Additional trainings will be offered if needed, to account for new staff and any changes in authorization processes. Additional data analysis will be completed if the rate stagnates to determine if any susceptible subpopulations or providers need to be targeted as well.

55
Median = 36.00
25
30
35
40
45
50
55
60
65
Me
asu
rem
en
t
Observation
PDSA Run Chart: Denied Claims (numerator)
Sta
rt o
f in
terv
enti
on

56
Median = 107.00
60
70
80
90
100
110
120
130
140
150
Me
asu
rem
en
t
Observation
PDSA Run Chart: Total Claims (denominator)
Sta
rt o
f in
terv
enti
on

57
Intervention #2: Provide enhanced case management services through Focused Care Advocacy program, which targets members that have a
certain threshold of utilization and care cost. These members receive specialized staffing and more intensive focus on identifying barriers that
impede them from engaging in treatment.
Median = 0.35
25.00%
30.00%
35.00%
40.00%
45.00%
50.00%
55.00%
60.00%
Me
asu
rem
en
t
Observation
PDSA Run Chart: Rate of denial
Sta
rt o
f in
terv
enti
on

58
Plan: Document the plan for conducting the intervention.
Who: Health plan leadership will identify members with complex behavioral health needs in order to engage them in a new case management program regardless of the opt decision of the member. The aim is to engage members through various member and system focused avenues including partnerships with internal and external parties, such as the member, the internal utilization and case management teams, other providers and family members/supports. Members can still be involved in the program if they do not agree to active case management services, however, only the internal portion of the program will be utilized (i.e. increased staffing and team collaboration). What: Members involved in the Focused Care Advocacy program will receive additional staffing and case management outreach to address barriers to engagement in treatment. Additionally, this program focuses on decreasing total cost of care, as well as ER and inpatient utilization. Members in this program are expected to have a higher rate of adherence to treatment, including medication and follow up visits. When: This program ramped up in January 2020. Where: Members across the state will be considered for the Focused Care Advocacy program. Prediction: This enhanced case management program will increase rates of engagement for members (i.e. IET HEDIS ® rates) with complex behavioral health needs, including members with substance use disorder, as well as decrease ER utilization. Decreased utilization of emergency departments may have a positive effect on the Follow Up After Emergency Room Visit for a Substance Use Disorder (FUA) measure.
Measure for test period
General Population
FCA population
IET Initiation 52.45% 70.38%
IET Engagement 18.40% 29.63%
FUA 30 10.19% 20%
FUA 7 7.67% 6.67%

59
Data Collection: Case management will track the number of members involved in the FCA program. Data analysts will gather IET and FUA HEDIS® data. Quality staff will review the HEDIS ® data to determine if members involved in the FCA program have a higher compliance rate regarding the IET and FUA indicators.
Do: Document implementation of the intervention.
There were 90 members involved in the FCA program during the test period, which lasted from January 1, 2020 to June 30, 2020. Of the members in the FCA program, 36 of them fell into the IET or FUA measure.
Study: Document what you learned from the study of your work to this point, including impact on secondary drivers.
There were very few members in the FCA program that fell into the IET or FUA measures. Since this program has a focus on decreasing ED utilization, that may have had an impact on the number of members in the FUA measure. Although this program may have had a positive impact on overall rates, it is unlikely due to the low number of members that were included in either measure. The members involved in FCA showed a higher rate of compliance for the three of four performance indicators being tracked for this test (IET initiation, IET engagement, FUA 30-day measure). This may indicate that if these services are expanded, it could have a positive impact on those measures overall.
Act: Document how you will improve the plan for the subsequent phase of your work based on the study and analysis of the intervention.
The FCA program is currently being evaluated to include members that may not meet the previously determined utilization/cost of care thresholds. Expansion of this program could have a positive impact on future IET and FUA rates.

60

61
Appendix F: Rationale data
Table 1: IET - Age Group Breakout by Sub measure
Age Group
13 - 17 18+
Total mbrs
Non-compliant
#
Noncompliant %
Total mbrs
Non-compliant
#
Noncompliant %
Initiation of AOD Treatment total (unique)
450 252 56% 11,713 6,112 52%
Initiation of AOD treatment: Other
414 224 54% 7,752 4,036 52%
Initiation of AOD treatment: Opioid
9 5 56% 2,374 908 38%
Initiation of AOD treatment: Alcohol
46 29 63% 3,598 1,851 51%
Engagement of AOD Treatment total (unique)
450 375 83% 11,713 9,826 84%
Engagement of AOD treatment: Other
414 339 82% 7,752 6,549 84%
Engagement of AOD treatment: Opioid
9 7 78% 2,374 1,710 72%
Engagement of AOD treatment: Alcohol
46 42 91% 3,598 3,097 86%
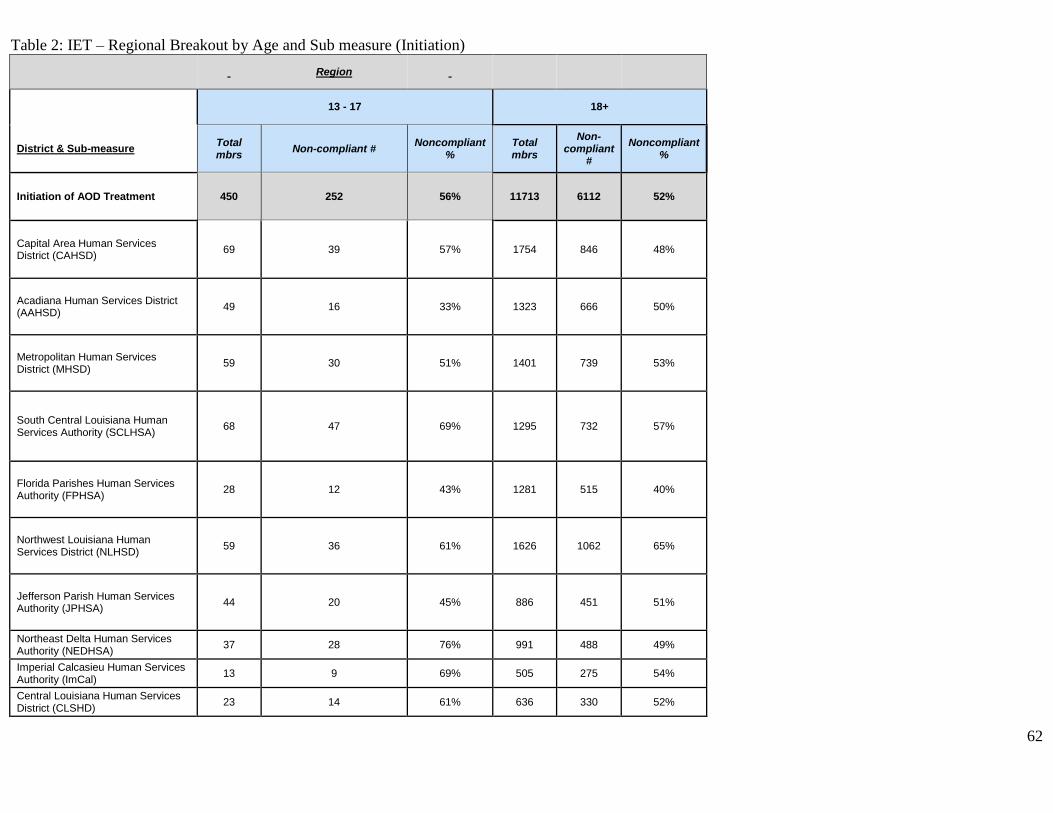
62
Table 2: IET – Regional Breakout by Age and Sub measure (Initiation)
Region
13 - 17 18+
District & Sub-measure Total mbrs
Non-compliant # Noncompliant
% Total mbrs
Non-compliant
#
Noncompliant %
Initiation of AOD Treatment 450 252 56% 11713 6112 52%
Capital Area Human Services District (CAHSD)
69 39 57% 1754 846 48%
Acadiana Human Services District (AAHSD)
49 16 33% 1323 666 50%
Metropolitan Human Services District (MHSD)
59 30 51% 1401 739 53%
South Central Louisiana Human Services Authority (SCLHSA)
68 47 69% 1295 732 57%
Florida Parishes Human Services Authority (FPHSA)
28 12 43% 1281 515 40%
Northwest Louisiana Human Services District (NLHSD)
59 36 61% 1626 1062 65%
Jefferson Parish Human Services Authority (JPHSA)
44 20 45% 886 451 51%
Northeast Delta Human Services Authority (NEDHSA)
37 28 76% 991 488 49%
Imperial Calcasieu Human Services Authority (ImCal)
13 9 69% 505 275 54%
Central Louisiana Human Services District (CLSHD)
23 14 61% 636 330 52%

63
out of state address 1 1 100% 15 8 53%
Table 3: IET – Regional Breakout by Age and Sub measure (Engagement)
Region
13 - 17 18+
District & Sub-measure Total mbrs
Non-compliant # Noncompliant
% Total mbrs
Non-compliant
#
Noncompliant %
Engagement of AOD Treatment 450 375 83% 11713 9826 84%
Capital Area Human Services District (CAHSD)
69 56 81% 1754 1450 83%
Acadiana Human Services District (AAHSD)
49 38 78% 1323 1116 84%
Metropolitan Human Services District (MHSD)
59 52 88% 1401 1187 85%
South Central Louisiana Human Services Authority (SCLHSA)
68 61 90% 1295 1098 85%
Florida Parishes Human Services Authority (FPHSA)
28 25 89% 1281 1010 79%
Northwest Louisiana Human Services District (NLHSD)
59 45 76% 1626 1440 89%
Jefferson Parish Human Services Authority (JPHSA)
44 37 84% 886 766 86%
Northeast Delta Human Services Authority (NEDHSA)
37 32 86% 991 781 79%

64
Imperial Calcasieu Human Services Authority (ImCal)
13 10 77% 505 433 86%
Central Louisiana Human Services District (CLSHD)
23 18 78% 636 530 83%
out of state address 1 1 100% 15 15 100%
Table 4: FUA breakdown by Age
Age Group
13 - 17 18+
Total mbrs
Non-compliant
#
Noncompliant %
Total mbrs
Non-compliant
#
Noncompliant %
7 day follow up
76 74 97% 1,816 1,671 92%
30 day follow up
76 73 96% 1,816 1,595 88%

65
Table 5: FUA breakdown by Age and Region (7-day measure)
13 - 17 18+
District & Sub-measure
Total mbrs
Non-compliant
#
Noncompliant %
Total mbrs
Non-compliant
#
Noncompliant %
7 day follow up 76 74 97% 1816 1671 92%
Capital Area Human Services District (CAHSD)
12 12 100% 227 211 93%
Acadiana Human Services District (AAHSD)
8 8 100% 213 199 93%
Metropolitan Human Services District (MHSD)
9 8 89% 315 302 96%
South Central Louisiana Human Services Authority (SCLHSA)
12 12 100% 219 199 91%
Florida Parishes Human Services Authority (FPHSA)
7 7 100% 200 180 90%
Northwest Louisiana Human Services District (NLHSD)
6 6 100% 147 132 90%
Jefferson Parish Human Services Authority (JPHSA)
7 7 100% 137 125 91%
Northeast Delta Human Services Authority (NEDHSA)
3 3 100% 126 110 87%
Imperial Calcasieu Human Services Authority (ImCal)
3 3 100% 105 100 95%
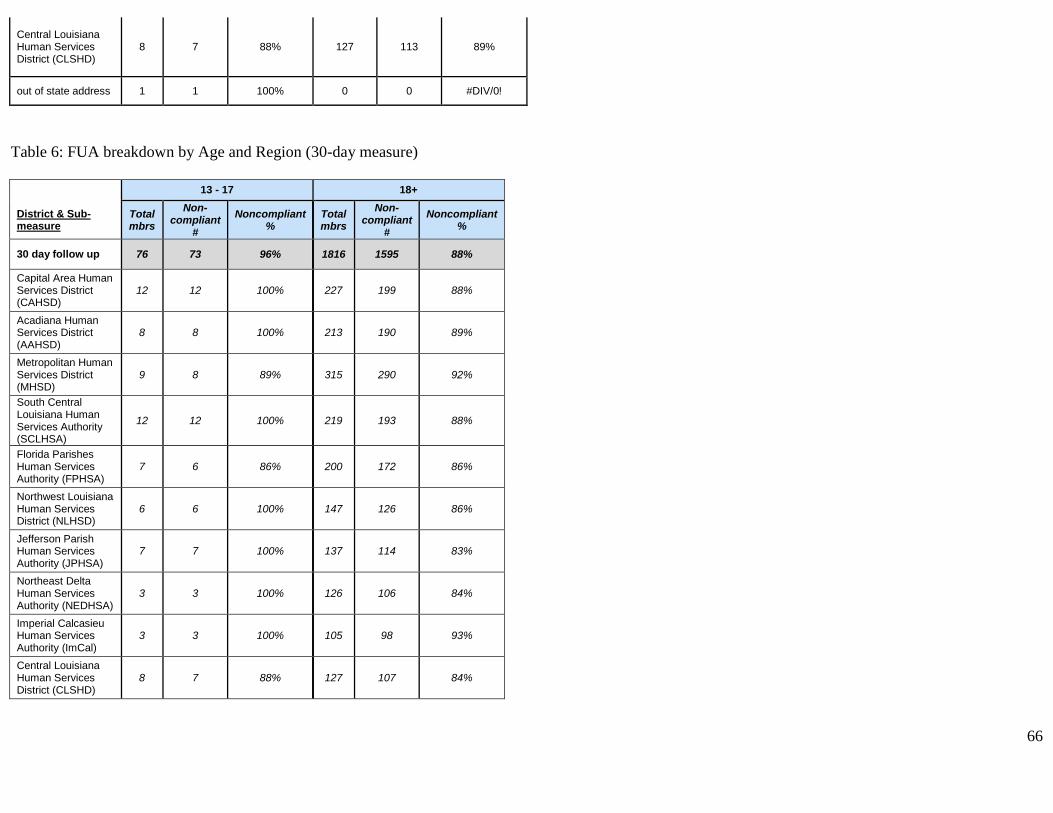
66
Central Louisiana Human Services District (CLSHD)
8 7 88% 127 113 89%
out of state address 1 1 100% 0 0 #DIV/0!
Table 6: FUA breakdown by Age and Region (30-day measure)
13 - 17 18+
District & Sub-measure
Total mbrs
Non-compliant
#
Noncompliant %
Total mbrs
Non-compliant
#
Noncompliant %
30 day follow up 76 73 96% 1816 1595 88%
Capital Area Human Services District (CAHSD)
12 12 100% 227 199 88%
Acadiana Human Services District (AAHSD)
8 8 100% 213 190 89%
Metropolitan Human Services District (MHSD)
9 8 89% 315 290 92%
South Central Louisiana Human Services Authority (SCLHSA)
12 12 100% 219 193 88%
Florida Parishes Human Services Authority (FPHSA)
7 6 86% 200 172 86%
Northwest Louisiana Human Services District (NLHSD)
6 6 100% 147 126 86%
Jefferson Parish Human Services Authority (JPHSA)
7 7 100% 137 114 83%
Northeast Delta Human Services Authority (NEDHSA)
3 3 100% 126 106 84%
Imperial Calcasieu Human Services Authority (ImCal)
3 3 100% 105 98 93%
Central Louisiana Human Services District (CLSHD)
8 7 88% 127 107 84%

67
out of state address 1 1 100% 0 0 #DIV/0!
Table 7: Parishes with the highest number of ED visits (subset, members with a primary SUD diagnosis; January 1, 2019 - December 31, 2019)
**Tables 7-10
Parish
*# of ER visits (5,979 unique mbrs had at least 1 ER visit in
2019)
ORLEANS (1,039) 7317
EAST BATON ROUGE (1,021) 5338
JEFFERSON (839) 4171
CADDO (584) 3038
TERREBONNE (469) 2688
LAFAYETTE (385) 2411
LIVINGSTON (465) 2254
SAINT TAMMANY (494) 2094
CALCASIEU (313) 1914
OUACHITA (370) 1911
Grand Total 33136
Table 8: Parishes with the highest number of IP visits (subset, members with a primary SUD diagnosis; January 1, 2019 - December 31, 2019)
District & County
*Total # of IP admits (3,082
unique mbrs had at least 1 IP MH stay
in 2019)
EAST BATON ROUGE (604) 1648
ORLEANS (505) 1562
JEFFERSON (440) 1158
LAFAYETTE (214) 703
LIVINGSTON (256) 685
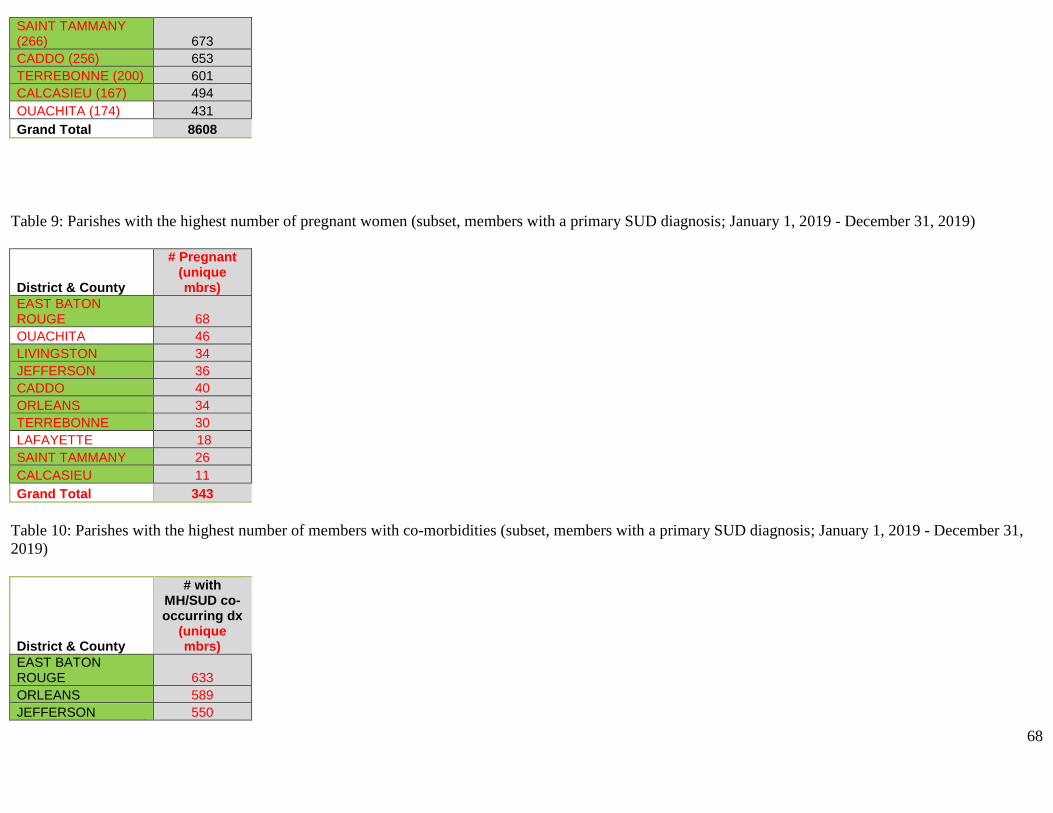
68
SAINT TAMMANY (266) 673
CADDO (256) 653
TERREBONNE (200) 601
CALCASIEU (167) 494
OUACHITA (174) 431
Grand Total 8608
Table 9: Parishes with the highest number of pregnant women (subset, members with a primary SUD diagnosis; January 1, 2019 - December 31, 2019)
District & County
# Pregnant (unique mbrs)
EAST BATON ROUGE 68
OUACHITA 46
LIVINGSTON 34
JEFFERSON 36
CADDO 40
ORLEANS 34
TERREBONNE 30
LAFAYETTE 18
SAINT TAMMANY 26
CALCASIEU 11
Grand Total 343
Table 10: Parishes with the highest number of members with co-morbidities (subset, members with a primary SUD diagnosis; January 1, 2019 - December 31,
2019)
District & County
# with MH/SUD co-occurring dx
(unique mbrs)
EAST BATON ROUGE 633
ORLEANS 589
JEFFERSON 550

69
CADDO 376
TERREBONNE 352
SAINT TAMMANY 321
LAFAYETTE 278
LIVINGSTON 266
CALCASIEU 207
OUACHITA 208
Grand Total 3780
Table 11: Summary of susceptible subpopulations in state requested target areas (subset, members with a primary SUD diagnosis; January 1, 2019 - December
31, 2019)
District & County *# of ER
visits
*Total # of IP admits (based
off prim dx)
# with comorbid prim dx
# Pregnant
# with HIV DX
# with DD prim
Capital Area Human Services District (CAHSD) 6636 2034 1061 102 63 0
ASCENSION 1298 386 217 27 2 0
EAST BATON ROUGE 5338 1648 844 75 61 0
Florida Parishes Human Services Authority (FPHSA) 5641 1684 960 83 12 2
LIVINGSTON 2254 685 351 45 3 2
SAINT TAMMANY 2094 673 419 31 6 0
TANGIPAHOA 1293 326 190 7 3 0
Metropolitan Human Services District (MHSD) 8128 1819 910 53 59 3
ORLEANS 7317 1562 761 39 57 3
SAINT BERNARD 811 257 149 14 2 0
Jefferson Parish Human Services Authority (JPHSA) 4166 1156 711 43 19 0
JEFFERSON 4166 1156 711 43 19 0
Northwest Louisiana Human Services District (NLHSD) 3038 653 449 42 17 1
CADDO 3038 653 449 42 17 1
South Central Louisiana Human Services Authority (SCLHSA) 2688 601 446 37 4 0
TERREBONNE 2688 601 446 37 4 0
Imperial Calcasieu Human Services Authority (ImCal) 1914 494 266 13 4 1
CALCASIEU 1914 494 266 13 4 1
Central Louisiana Human Services District (CLSHD) 1581 387 230 14 3 1
RAPIDES 1581 387 230 14 3 1
Grand Total 33792 8828 5033 387 181 8

70
Attachment G: HEDIS® Certification of Med Measures
NCQA Measure CertificationSM
Certification Report for Cognizant Technology Solutions U.S. Corporation
CERTIFICATION OUTCOME Date of Certification Report April 6, 2018
Name of Product Containing Certified Measures ClaimSphere™ QaaS
Version of HEDIS Technical Specifications HEDIS 2018
Vendor ID (for IDSS XML) 14087
MEASURE DETAIL
MEASURE STATUS DATE UNIQUE IDENTIFIER
ABA Adult BMI Assessment PASS 11/20/2017 8117ae4e-39b9-1eac-77e6-34ece0a7353d
WCC Weight Assessment and Counseling for Nutrition and Physical Activity for Children/Adolescents PASS 11/20/2017 badfdfc8-eb93-fdb9-56e7-b7f69037a445
CIS Childhood Immunization Status PASS 12/05/2017 1409f3ac-64e7-e835-be1c-cf869ce1f7cc
IMA Immunizations for Adolescents PASS 11/22/2017 6933d1df-dd38-ba91-f17d-2e3ea94f3b5e
LSC Lead Screening in Children PASS 12/05/2017 933d0a14-f9e6-3eaf-8386-55dfd397cb82
BCS Breast Cancer Screening PASS 12/15/2017 42053ff2-b3dd-dcb5-1624-feb9c02f0839
CCS Cervical Cancer Screening PASS 11/20/2017 bdd290c1-bdcd-62a7-726c-a12d887aaf97
COL Colorectal Cancer Screening PASS 11/22/2017 76184208-d2d4-95c5-7427-f40d85379534
CHL Chlamydia Screening in Women PASS 12/26/2017 6ca1b11f-6c18-ae3d-afa6-a4828c089c37
COA Care for Older Adults PASS 12/06/2017 3067eed8-1a67-630a-6040-57420984c1a5
CWP Appropriate Testing for Children with Pharyngitis PASS 12/18/2017 14b22a08-5b5b-f79a-47bf-b8cae580bba0
SPR Use of Spirometry Testing in the Assessment and Diagnosis of COPD PASS 01/10/2018 4ee11abc-7ded-b7b3-9ca9-7548ee73da14
PCE Pharmacotherapy Management of COPD Exacerbation PASS 12/18/2017 2ba4f38f-dc0c-d16d-ec36-a92810d83212

71
MEASURE STATUS DATE UNIQUE IDENTIFIER
MMA Medication Management for People with Asthma PASS 12/22/2017 09566534-70cc-3e63-e9ae-76c6c4ee496d
AMR Asthma Medication Ratio PASS 12/22/2017 596df43f-bda8-6f53-21db-13b23745c131
CBP Controlling High Blood Pressure PASS 11/21/2017 e5bdf69f-7cb6-a30b-c8ac-3b3dc63c55c5
PBH Persistence of Beta-Blocker Treatment After a Heart Attack PASS 01/04/2018 c33683a0-2ac1-b83f-bc9b-aabe693b7c8d
SPC Statin Therapy for Patients with Cardiovascular Disease PASS 01/22/2018 20883146-b0a0-c10a-1f53-6098dd8f2eeb
CDC Comprehensive Diabetes Care PASS 11/24/2017 e15fc8ba-d211-591a-d3f9-00596c02d304
SPD Statin Therapy for Patients with Diabetes PASS 01/22/2018 d467d4bd-83af-8039-003b-60b3b6eb1504
ART Disease-Modifying Anti-Rheumatic Drug Therapy in Rheumatoid Arthritis PASS 12/12/2017 02c89cf1-6518-bce6-bc71-fd52f91e6cef
OMW Osteoporosis Management in Women Who Had a Fracture PASS 12/18/2017 ae045dcf-459a-ba37-86e5-105101de042a
AMM Antidepressant Medication Management PASS 12/17/2017 a1a6807d-8234-fbf2-e1b5-ddba3fe1d33a
ADD Follow-Up Care for Children Prescribed ADHD Medication PASS 01/24/2018 1f30646e-2791-f1b2-20c4-646c4afe7b33
FUH Follow-Up After Hospitalization for Mental Illness PASS 02/08/2018 80d6b8e4-3422-fe22-25e1-dde2218b159b
FUM Follow-Up After Emergency Department Visit for Mental Illness PASS 02/07/2018 3821e709-47b7-8796-cf24-e2c4cc12be19
FUA Follow-Up After Emergency Department Visit for Alcohol and Other Drug Abuse or Dependence PASS 02/07/2018 9bacef5b-6b7c-a2ff-ff5a-40ac64e34df2
SSD Diabetes Screening for People with Schizophrenia or Bipolar Disorder Who Are Using Antipsychotic Medications PASS 01/24/2018 7724ff7c-ac68-d5e7-fb23-2697684f3397
SMD Diabetes Monitoring for People with Diabetes and Schizophrenia PASS 02/01/2018 e3a848bc-c428-a0cd-ee0b-1ebf68dbb0e7
SMC Cardiovascular Monitoring for People with Cardiovascular Diseases and Schizophrenia PASS 01/25/2018 060b83ae-bda9-4ac7-042a-a23baba5050a
SAA Adherence to Antipsychotic Medications for Individuals with Schizophrenia PASS 02/03/2018 ee835bc4-5758-eace-ef93-11195db82e60
APM Metabolic Monitoring for Children and Adolescents on Antipsychotics PASS 01/20/2018 5c744af1-6cde-34d3-1c07-b8e8f98542a5
MPM Annual Monitoring for Patients on Persistent Medications PASS 12/17/2017 2f2662a0-f91f-7032-faf6-8929a06645de
MRP Medication Reconciliation Post-Discharge PASS 12/05/2017 2a155cc5-f144-70e0-4c46-a686c2e7731f
TRC Transitions of Care PASS 11/22/2017 d7d8a849-b21c-f61a-7a91-8e323bfb98aa
FMC Follow-Up After Emergency Department Visit for People with High-Risk Multiple Chronic Conditions PASS 02/08/2018 a443f5f9-49da-81cc-c1fc-3627735cba88
NCS Non-Recommended Cervical Cancer Screening in Adolescent Females PASS 12/12/2017 af1484b9-ad58-8e74-8a5f-394e01c59813
PSA Non-Recommended PSA-Based Screening in Older Men PASS 01/23/2018 2df2c13b-6b0e-41fd-53ee-c81906fa1140
URI Appropriate Treatment for Children with Upper Respiratory Infection PASS 12/18/2017 987cb0a3-24d3-73a5-36d4-6b5afab214eb
AAB Avoidance of Antibiotic Treatment in Adults with Acute Bronchitis PASS 12/14/2017 76f34598-cf3e-f389-7642-2bb9a6cfa00e
LBP Use of Imaging Studies for Low Back Pain PASS 01/17/2018 d4d2d7f0-ed8a-17bf-f9bb-ba559b939d5e
APC Use of Multiple Concurrent Antipsychotics in Children and Adolescents PASS 02/03/2018 69c4eec8-df6d-ed75-164e-ee6747aa9ce3
DDE Potentially Harmful Drug-Disease Interactions in the Elderly PASS 01/17/2018 13c01962-b222-e4d3-25fc-3ee6098abc8c
DAE Use of High-Risk Medications in the Elderly PASS 01/04/2018 d9d825f1-59a2-8103-c8aa-8c5ec884bbf6
UOD Use of Opioids at High Dosage PASS 02/06/2018 20b24bb1-e72a-a42a-76a1-a69fb61f5e94
UOP Use of Opioids from Multiple Providers PASS 02/07/2018 95cfdf77-06e9-c286-74bd-a4608662ea68
AAP Adults’ Access to Preventive/Ambulatory Health Services PASS 12/14/2017 9acdda1a-6e9f-c445-ec36-78f2a1bf8e22
CAP Children and Adolescents’ Access to Primary Care Practitioners PASS 12/12/2017 0f4b0d6d-87cd-9123-acae-83f0c08a0aaa
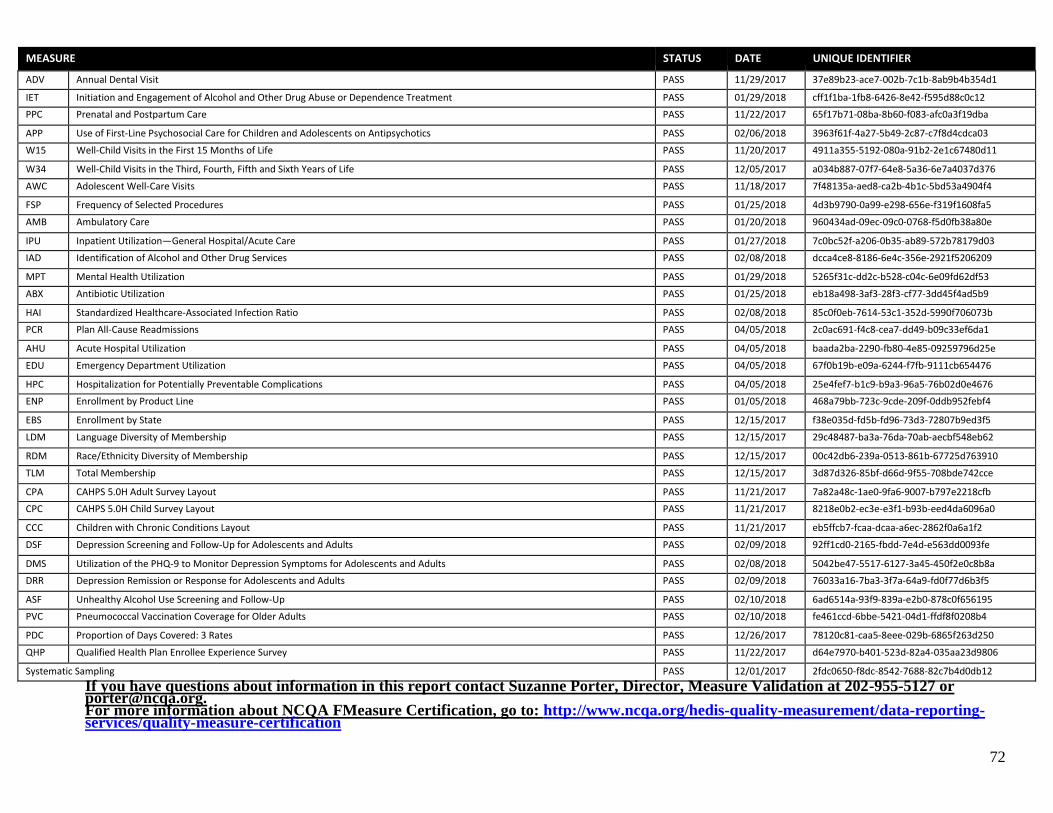
72
MEASURE STATUS DATE UNIQUE IDENTIFIER
ADV Annual Dental Visit PASS 11/29/2017 37e89b23-ace7-002b-7c1b-8ab9b4b354d1
IET Initiation and Engagement of Alcohol and Other Drug Abuse or Dependence Treatment PASS 01/29/2018 cff1f1ba-1fb8-6426-8e42-f595d88c0c12
PPC Prenatal and Postpartum Care PASS 11/22/2017 65f17b71-08ba-8b60-f083-afc0a3f19dba
APP Use of First-Line Psychosocial Care for Children and Adolescents on Antipsychotics PASS 02/06/2018 3963f61f-4a27-5b49-2c87-c7f8d4cdca03
W15 Well-Child Visits in the First 15 Months of Life PASS 11/20/2017 4911a355-5192-080a-91b2-2e1c67480d11
W34 Well-Child Visits in the Third, Fourth, Fifth and Sixth Years of Life PASS 12/05/2017 a034b887-07f7-64e8-5a36-6e7a4037d376
AWC Adolescent Well-Care Visits PASS 11/18/2017 7f48135a-aed8-ca2b-4b1c-5bd53a4904f4
FSP Frequency of Selected Procedures PASS 01/25/2018 4d3b9790-0a99-e298-656e-f319f1608fa5
AMB Ambulatory Care PASS 01/20/2018 960434ad-09ec-09c0-0768-f5d0fb38a80e
IPU Inpatient Utilization—General Hospital/Acute Care PASS 01/27/2018 7c0bc52f-a206-0b35-ab89-572b78179d03
IAD Identification of Alcohol and Other Drug Services PASS 02/08/2018 dcca4ce8-8186-6e4c-356e-2921f5206209
MPT Mental Health Utilization PASS 01/29/2018 5265f31c-dd2c-b528-c04c-6e09fd62df53
ABX Antibiotic Utilization PASS 01/25/2018 eb18a498-3af3-28f3-cf77-3dd45f4ad5b9
HAI Standardized Healthcare-Associated Infection Ratio PASS 02/08/2018 85c0f0eb-7614-53c1-352d-5990f706073b
PCR Plan All-Cause Readmissions PASS 04/05/2018 2c0ac691-f4c8-cea7-dd49-b09c33ef6da1
AHU Acute Hospital Utilization PASS 04/05/2018 baada2ba-2290-fb80-4e85-09259796d25e
EDU Emergency Department Utilization PASS 04/05/2018 67f0b19b-e09a-6244-f7fb-9111cb654476
HPC Hospitalization for Potentially Preventable Complications PASS 04/05/2018 25e4fef7-b1c9-b9a3-96a5-76b02d0e4676
ENP Enrollment by Product Line PASS 01/05/2018 468a79bb-723c-9cde-209f-0ddb952febf4
EBS Enrollment by State PASS 12/15/2017 f38e035d-fd5b-fd96-73d3-72807b9ed3f5
LDM Language Diversity of Membership PASS 12/15/2017 29c48487-ba3a-76da-70ab-aecbf548eb62
RDM Race/Ethnicity Diversity of Membership PASS 12/15/2017 00c42db6-239a-0513-861b-67725d763910
TLM Total Membership PASS 12/15/2017 3d87d326-85bf-d66d-9f55-708bde742cce
CPA CAHPS 5.0H Adult Survey Layout PASS 11/21/2017 7a82a48c-1ae0-9fa6-9007-b797e2218cfb
CPC CAHPS 5.0H Child Survey Layout PASS 11/21/2017 8218e0b2-ec3e-e3f1-b93b-eed4da6096a0
CCC Children with Chronic Conditions Layout PASS 11/21/2017 eb5ffcb7-fcaa-dcaa-a6ec-2862f0a6a1f2
DSF Depression Screening and Follow-Up for Adolescents and Adults PASS 02/09/2018 92ff1cd0-2165-fbdd-7e4d-e563dd0093fe
DMS Utilization of the PHQ-9 to Monitor Depression Symptoms for Adolescents and Adults PASS 02/08/2018 5042be47-5517-6127-3a45-450f2e0c8b8a
DRR Depression Remission or Response for Adolescents and Adults PASS 02/09/2018 76033a16-7ba3-3f7a-64a9-fd0f77d6b3f5
ASF Unhealthy Alcohol Use Screening and Follow-Up PASS 02/10/2018 6ad6514a-93f9-839a-e2b0-878c0f656195
PVC Pneumococcal Vaccination Coverage for Older Adults PASS 02/10/2018 fe461ccd-6bbe-5421-04d1-ffdf8f0208b4
PDC Proportion of Days Covered: 3 Rates PASS 12/26/2017 78120c81-caa5-8eee-029b-6865f263d250
QHP Qualified Health Plan Enrollee Experience Survey PASS 11/22/2017 d64e7970-b401-523d-82a4-035aa23d9806
Systematic Sampling PASS 12/01/2017 2fdc0650-f8dc-8542-7688-82c7b4d0db12
If you have questions about information in this report contact Suzanne Porter, Director, Measure Validation at 202-955-5127 or [email protected]. For more information about NCQA FMeasure Certification, go to: http://www.ncqa.org/hedis-quality-measurement/data-reporting-services/quality-measure-certification

73