health dialogue - cabri-sbo. · pdf filecabri health dialogue ... and points towards the...
TRANSCRIPT
HealtH DialogueKeynote Report 1

CABRI Health Dialogue
Value for Money in the Health Sector: Policy and Budget Planning
Keynote Report 1
The Health Challenge in Africa and its Institutional Context
ContentsList of tables 1
List of figures 2
Acronyms and abbreviations 3
1. Objective and overview 4
2. Approaches to describing the health challenge in Africa 4
2.1 Overview 4
2.2 Ghana 2001 4
2.3 Unpacking supply-side issues 6
2.4 Drivers of the demand for health care 7
2.5 An overview of outcomes, outputs and inputs 7
3. Health status and disease burden (health outcomes) 8
3.1 Life expectancy 8
3.2 Adult mortality 10
3.3 Child mortality 11
3.4 Maternal mortality 13
3.5 Burden of disease 13
4 Health service delivery (outputs) 16
5 Health funding and inputs 19
5.1 Overall health spending 19
5.2 Human resources 22
6 Interrelationships between inputs, outputs and outcomes 24
7 Health system context 25
7.1 Functions of a health system 26
7.2 Generalisations about health system types 28
7.3 Sources of health spending in Africa 31
7.4 Policy and reform issues in Africa 34
7.5 Public financial management reform 38
8. Conclusion 39
References/Bibliography 41
List of tablesTable 3.1 Life expectancy, 1990–2008, selected African countries (lowest and
highest) and international country groupings 9
Table 3.2 Adult mortality, 1990–2008, selected African countries (lowest and
highest) and international country groupings 11
Table 3.3 Infant and child mortality, 1990–2008, selected African countries
(lowest and highest) and international country groupings 12
Table 3.4 Burden of disease, DALYs, WHO African region 15
Table 4.1 Selected indicators of health service delivery (children), selected
African countries (lowest and highest) and international WHO regions 17
Table 4.2 Inequality in measles immunisation coverage – selected African
countries (ranked from highest urban-rural ratio to lowest) 18
Table 4.3 Selected indicators of health service delivery (maternal/reproductive
health) – selected African countries (lowest and highest) and
international WHO regions 19
Table 5.1 Expenditure on health as a proportion of GDP and government health
expenditure as a proportion of total government expenditure –
selected African countries (lowest and highest) and international
WHO regions 21
Table 5.2 Indicators of health workforce and hospital bed availability 23
Table 6.1 Indicators of health outcomes, service delivery and inputs:
sub-Saharan countries and other country groupings 25
Table 7.1 Government and private health expenditure as a proportion of
health spending – selected African countries (ranked from highest
proportion of government expenditure to lowest) and international
WHO regions 32
2Value For Money in the Health Sector: Policy and Budget Planning
List of figuresFigure 2.1: The results chain 8
Figure 3.1: Components and determinants of health status (causal chain of
events for health outcomes – broad schema) 14
Figure 3.2: Burden of disease by broad cause group and region, 2004 15
Figure 5.1: Africa’s health challenge: disease, inputs and resources compared 20
Figure 5.2: Health workforce driving forces and challenges 22
Figure 5.3: Number of physicians per 10 000 population in Africa countries 23
Figure 5.4: Number of nurses and midwives per 10 000 population in Africa
countries 24
Figure 7.1: Health system functions and objectives 27
Figure 7.2: Broad types of health systems 29
Figure 7.3: Characteristics of selected country health systems focusing on
financing (revenue collection, pooling, purchasing) and service
provision 30
Figure 7.4: Financing and provision of health care in Argentina 31
Figure 7.5: Stylised schema of a historic centralised health system 37
Figure 7.6: PFM role-players and process components 38
3Keynote Report 1 The Health Challenge in Africa and its Institutional Context
Acronyms and abbreviationsCABRI Collaborative Africa Budget Reform Initiative
DAH development aid for health
DALY disability-adjusted life-year
GBD Global Burden of Disease (framework)
GFATM Global Fund to fight AIDS, Tuberculosis and Malaria
HALE Healthy life expectancy
HIV/AIDS Human Immunodeficiency Virus / Acquired Immunodeficiency Syndrome
IFC International Finance Corporation
IMF International Monetary Fund
IHME Institute for Health Metrics and Evaluation
IRIN integrated regional information networks
ORT oral rehydration therapy
PFM public financial management
QALYs quality-adjusted life years
SWAp sector-wide approach
TB tuberculosis
WHO World Health Organisation
YLL years of life lost to premature mortality
YLD years of healthy life lost as a result of disability
4Value For Money in the Health Sector: Policy and Budget Planning
1. Objective and overview
The aim of this paper1 is to provide an overview of the health challenge in Africa and to review policy or reform options in order to address value for money in health in Africa.
Section 2 of this paper provides various perspectives on the health challenge in Africa, starting with a specific case in Ghana and, thereafter, summarising some recent reviews. It introduces the notion of the results chain, linking inputs, outputs and outcomes. Value for money is about maximising impact with limited resources, and is determined by the relationship between inputs, outputs and outcomes.
Sections 3 to 5 document health challenges in Africa more systematically through an analysis of available data, which compare key health outcomes, outputs and inputs in Africa to those of other regions and also point to the significant differences between African countries in terms of health indicators.
Section 6 summarises and draws together the analysis in the foregoing sections, underlining the large and changing disease burden in Africa. While weak health outcomes in Africa can be related to relatively low levels of inputs and financing, it is also clear that, as in the health sector in other regions, there is significant room for focusing on efficiencies and improving value for money. Given the state of health in Africa, this focus is critical.
Section 7 reviews a range of recent work on value for money in health and on health system reform to provide frameworks of policy options or levers for addressing efficiency in the health sector. This discussion builds necessarily on an understanding of the core functions of a health system, and components of the health financing function are reviewed and aspects of the African reality described.
The conclusion highlights key areas, and points towards the themes for future dialogues.
2. Approaches to describing the health challenge in Africa
2.1 Overview
There are many possible entry points to the discussion of Africa’s health challenges. The health community has been making consistent progress in providing systematic information about the health situation and health systems of different countries and in setting up comparative databases.
We begin by looking at a specific case in Ghana. Thereafter, we focus on two recent assessments, one by the World Health Organisation (WHO) and another by two leading researchers, offering slightly different entry points. The section then provides an introduction to key indicators of health outcomes, service delivery and financing/inputs, and reviews the most recent evidence for Africa.
2.2 Ghana 2001
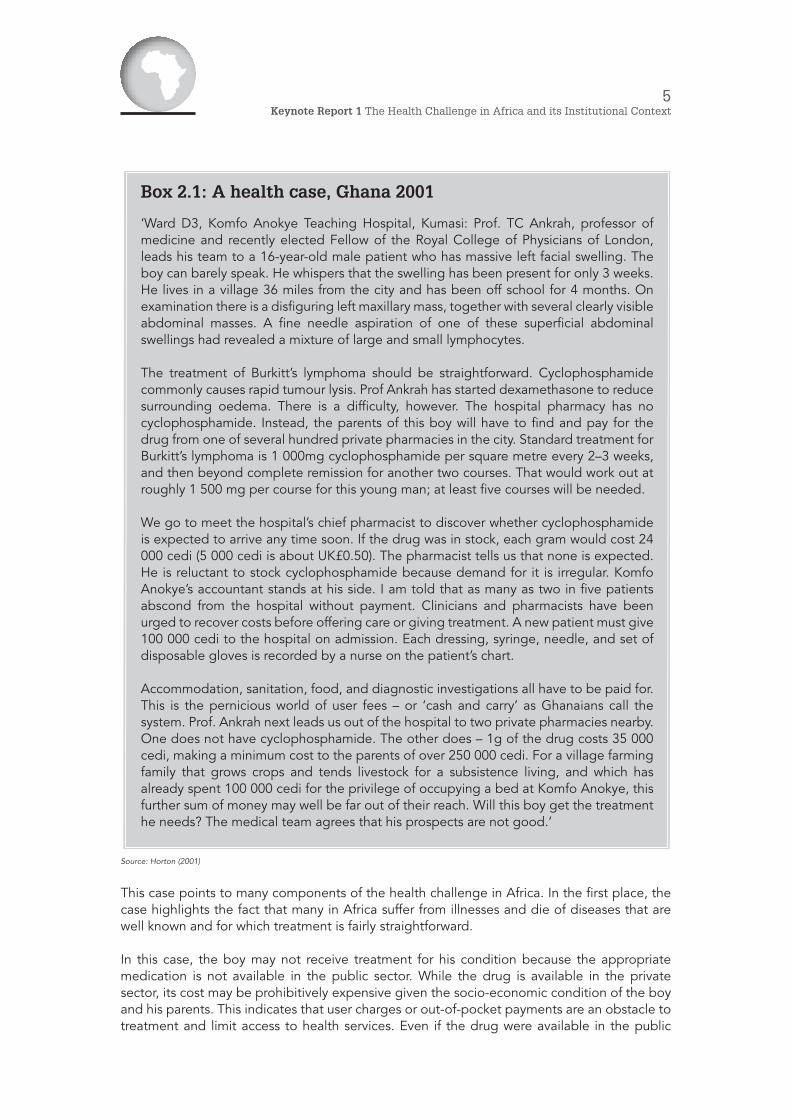
In a 2001 article in The Lancet, the editor Richard Horton investigates aspects of the health system and changes therein in Ghana, suggesting in the article’s title that conditions there ‘define the African challenge’. His introductory ‘case’ is reproduced in Box 2.1.
1 This paper was prepared by John Kruger for CABRI health dialogue on policy and planning in the health sector. The dialogue was held in Nairobi on 4–5 April 2011.
5Keynote Report 1 The Health Challenge in Africa and its Institutional Context
Source: Horton (2001)
This case points to many components of the health challenge in Africa. In the first place, the case highlights the fact that many in Africa suffer from illnesses and die of diseases that are well known and for which treatment is fairly straightforward.
In this case, the boy may not receive treatment for his condition because the appropriate medication is not available in the public sector. While the drug is available in the private sector, its cost may be prohibitively expensive given the socio-economic condition of the boy and his parents. This indicates that user charges or out-of-pocket payments are an obstacle to treatment and limit access to health services. Even if the drug were available in the public
Box 2.1: A health case, Ghana 2001
‘Ward D3, Komfo Anokye Teaching Hospital, Kumasi: Prof. TC Ankrah, professor of medicine and recently elected Fellow of the Royal College of Physicians of London, leads his team to a 16-year-old male patient who has massive left facial swelling. The boy can barely speak. He whispers that the swelling has been present for only 3 weeks. He lives in a village 36 miles from the city and has been off school for 4 months. On examination there is a disfiguring left maxillary mass, together with several clearly visible abdominal masses. A fine needle aspiration of one of these superficial abdominal swellings had revealed a mixture of large and small lymphocytes.
The treatment of Burkitt’s lymphoma should be straightforward. Cyclophosphamide commonly causes rapid tumour lysis. Prof Ankrah has started dexamethasone to reduce surrounding oedema. There is a difficulty, however. The hospital pharmacy has no cyclophosphamide. Instead, the parents of this boy will have to find and pay for the drug from one of several hundred private pharmacies in the city. Standard treatment for Burkitt’s lymphoma is 1 000mg cyclophosphamide per square metre every 2–3 weeks, and then beyond complete remission for another two courses. That would work out at roughly 1 500 mg per course for this young man; at least five courses will be needed.
We go to meet the hospital’s chief pharmacist to discover whether cyclophosphamide is expected to arrive any time soon. If the drug was in stock, each gram would cost 24 000 cedi (5 000 cedi is about UK£0.50). The pharmacist tells us that none is expected. He is reluctant to stock cyclophosphamide because demand for it is irregular. Komfo Anokye’s accountant stands at his side. I am told that as many as two in five patients abscond from the hospital without payment. Clinicians and pharmacists have been urged to recover costs before offering care or giving treatment. A new patient must give 100 000 cedi to the hospital on admission. Each dressing, syringe, needle, and set of disposable gloves is recorded by a nurse on the patient’s chart.
Accommodation, sanitation, food, and diagnostic investigations all have to be paid for. This is the pernicious world of user fees – or ‘cash and carry’ as Ghanaians call the system. Prof. Ankrah next leads us out of the hospital to two private pharmacies nearby. One does not have cyclophosphamide. The other does – 1g of the drug costs 35 000 cedi, making a minimum cost to the parents of over 250 000 cedi. For a village farming family that grows crops and tends livestock for a subsistence living, and which has already spent 100 000 cedi for the privilege of occupying a bed at Komfo Anokye, this further sum of money may well be far out of their reach. Will this boy get the treatment he needs? The medical team agrees that his prospects are not good.’
6Value For Money in the Health Sector: Policy and Budget Planning
sector, costs may still be an obstacle. If the family were able to make payment, the cost of the health care might put household finances under significant pressure and, indeed, may be catastrophic. Key issues coming to the fore, therefore, are supply systems in the public sector, levels of funding and the mechanisms for funding health care (in this case, in a public hospital, treatment requires private out-of-pocket expenditure).
Although the outcome of this case is uncertain, it does show that components of the required health service are available in some areas. This boy could gain access to a hospital and the appropriate medical staff, albeit at a cost that will impact on the family. In many areas of Ghana and, indeed, almost all countries in Africa, facilities and medical staff are not ‘easily’ accessible. A key characteristic identified by Horton is inequality in access to facilities and medical personnel across the different parts of Ghana. Distance from facilities (unavailability of facilities) and staff are obstacles. While the south of Ghana is better served (but not adequately, as Horton’s example illustrates), the more sparsely populated and rural north does less well.
The Regional Director of Health of the Northern Region, interviewed by Horton, referred to the:
• exodus of doctors, nurses and technicians to the south of the country; • absence of training facilities for staff; • unavailability of material incentives to draw doctors back; • absence of medical infrastructure to support doctors; and • need to decentralise resources and create a permanent career structure for health
workers.
The decentralisation of resources requires changes to financing systems and allocation mechanisms. The apparent rationale for not further decentralising funding (‘administrative capacity to manage large health budgets is just not present in the region’) also raises the perceived or actual issue of management capacity and systems.
Despite indicating other obstacles to health access in Ghana (such as transport, equipment, health-professions training and research), Horton provides evidence of progress and innovative solutions. In particular, he refers to the establishment of a district outreach system in the northern region, which has become operational and effective through the use of community members (some of whom cannot read or write) to record health events (incidents, treatments and outcomes) and to assess the impact of interventions. The use of motorcycles for visits to villages was a key innovation. In addition to monitoring, volunteers also educate. Trained traditional birth attendants complement the volunteers. Some report progress. Increased access to services, however, raises expectations, and community leaders are now faced with the problem of inadequate transport to higher-level health facilities.
Much has changed in Ghana since 2001, and our first case study looks at some aspects of the reforms introduced through focusing on maternal and child health.
2.3 Unpacking supply-side issues
Kirigia and Barry (2008) further unpack some of the supply-side issues raised by the Ghana case. While looking at individual inputs (such as health workers), they also focus on aspects of the health system as a whole that go beyond inputs. They classify the health challenges in Africa according to the following six categories:
• leadership and governance challenges; • shortages of (and inequalities between) health workers;

7Keynote Report 1 The Health Challenge in Africa and its Institutional Context
• corruption and inefficiencies in supply systems (‘rampant corruption in medical products and technologies procurement systems, unreliable supply systems, unaffordable prices, irrational use and wide variance in quality and safety’);
• lack of information and communications technology (ICT) and limited skills for the development of health management information systems;
• health financing problems (low investment, lack of financing policies and strategic plans, extensive out-of-pocket payments, lack of social safety nets, weak financial management); and
• lack of effective organisation and management of health services, and lack of access to both quality health services and basic amenities/environmental health services (sanitation, clean water, etc.).
2.4 Drivers of the demand for health care
A 2006 report of the WHO charted ‘the progress made to date in fighting disease and promoting health in the African region’, reviewing ‘success stories’ and looking ‘at areas where more efforts are needed’. The ‘central message’ asserted that socio-economic development in Africa is dependent on improvements in people’s health, that, for a large part, the necessary health care interventions are known, and that the key to getting services to people who need them lies in the improvement of health systems.
The report highlighted the following five broad areas of progress, obstacles and key strategies (WHO 2006):
• the ‘silent epidemic’ of maternal and child deaths; • ‘a vast range of preventable and treatable infectious diseases’; • growing health pressures from non-communicable diseases, mental health and
injuries; • an environment that poses significant health risks; and • building or rebuilding weak and/or dysfunctional health systems.
2.5 An overview of outcomes, outputs and inputs
Thus, the health challenges in Africa amount to an extensive list and, as can be seen from the above, there are many different entry points. Varying perspectives can be a problem in solving these health challenges. Commonly, finance departments and health departments differ on the key problems. While health departments focus on lack of funding, and providers on lack of autonomy, finance departments focus on lack of capacity (human resources, supply chain and financial management) and inefficiencies that are seen as resulting from this.
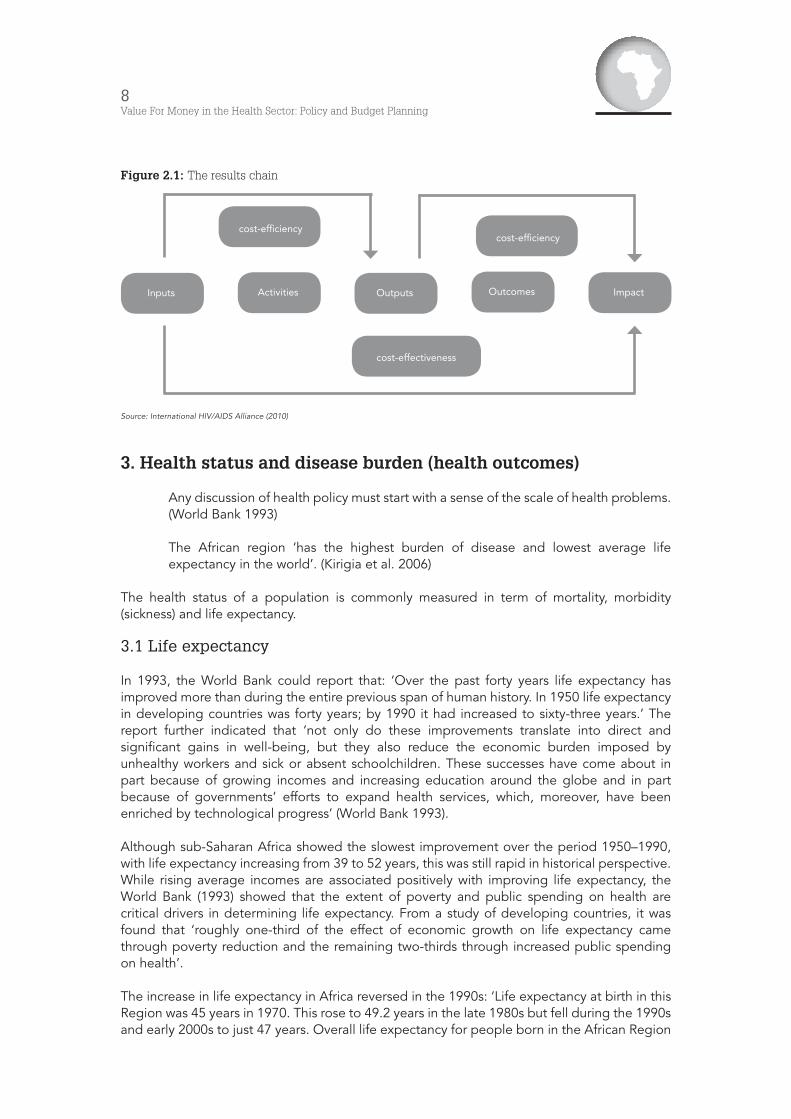
In order to have a common framework, the section that follows places components of the African challenge into the structure of ‘the results chain’ (See Figure 2.1): the flow from financial and other inputs into the health systems (budget allocations, human resources, and non-personnel inputs such as medicines), to activities and outputs (for example, number of hospital visits, number of clinic visits and actual immunisations) and to outcomes (health status of the population).
The focus on components of the results chain also provides us with an initial definition of value for money in health – the relationship between inputs and outcomes, defined in Figure 2.1 as cost-effectiveness.
8Value For Money in the Health Sector: Policy and Budget Planning
Figure 2.1: The results chain
Source: International HIV/AIDS Alliance (2010)
3. Health status and disease burden (health outcomes)
Any discussion of health policy must start with a sense of the scale of health problems. (World Bank 1993)
The African region ‘has the highest burden of disease and lowest average life expectancy in the world’. (Kirigia et al. 2006)
The health status of a population is commonly measured in term of mortality, morbidity (sickness) and life expectancy.
3.1 Life expectancy
In 1993, the World Bank could report that: ‘Over the past forty years life expectancy has improved more than during the entire previous span of human history. In 1950 life expectancy in developing countries was forty years; by 1990 it had increased to sixty-three years.’ The report further indicated that ‘not only do these improvements translate into direct and significant gains in well-being, but they also reduce the economic burden imposed by unhealthy workers and sick or absent schoolchildren. These successes have come about in part because of growing incomes and increasing education around the globe and in part because of governments’ efforts to expand health services, which, moreover, have been enriched by technological progress’ (World Bank 1993).
Although sub-Saharan Africa showed the slowest improvement over the period 1950–1990, with life expectancy increasing from 39 to 52 years, this was still rapid in historical perspective. While rising average incomes are associated positively with improving life expectancy, the World Bank (1993) showed that the extent of poverty and public spending on health are critical drivers in determining life expectancy. From a study of developing countries, it was found that ‘roughly one-third of the effect of economic growth on life expectancy came through poverty reduction and the remaining two-thirds through increased public spending on health’.
The increase in life expectancy in Africa reversed in the 1990s: ‘Life expectancy at birth in this Region was 45 years in 1970. This rose to 49.2 years in the late 1980s but fell during the 1990s and early 2000s to just 47 years. Overall life expectancy for people born in the African Region
Inputs
cost-efficiency
cost-effectiveness
OutputsActivities
cost-efficiency
ImpactOutcomes

9Keynote Report 1 The Health Challenge in Africa and its Institutional Context
in 2002 would be 54 years, if it were not for about six years of life lost due to the sole impact of HIV/AIDS’ (WHO 2006b).
Table 3.1 provides WHO estimates for 2008 on life expectancy for different WHO regions and for selected African countries. It shows that, in comparison with other regions, life expectancy in Africa is low and has edged up only very slowly over the period, after having fallen by the middle of the period. The table also shows the variation across Africa. While some countries in North Africa and some of the island economies continued to make good progress, life expectancy dropped dramatically in countries such as Lesotho and Zimbabwe.
Table 3.1: Life expectancy, 1990–2008, selected African countries (lowest and highest) and international country groupings
WHO member state Life expectancy at birth (years) Both sexes
1990 2000 2008
Tunisia 70 73 75
Mauritius 69 71 73
Libyan Arab Jamahiriya 69 71 73
Morocco 65 70 72
Seychelles 69 72 72
Algeria 66 69 71
Democratic Republic of the Congo 49 47 48
Somalia 46 48 48
Lesotho 61 50 47
Chad 49 47 46
Angola 42 44 46
Zimbabwe 61 44 42
WHO region
African Region 51 50 53
Region of the Americas 71 74 76
South-East Asia Region 58 62 65
European Region 72 72 75
Eastern Mediterranean Region 61 63 65
Western Pacific Region 69 72 75
Income group (global)
Low income 54 55 57
Lower middle income 62 65 67
Upper middle income 68 69 71
Upper middle income 76 78 80
Global 64 66 68
Source: WHO (2010a)
10Value For Money in the Health Sector: Policy and Budget Planning
3.2 Adult mortality
Adult mortality is commonly measured by the likelihood of a 15-year-old dying by the age of 60 (or what is referred to as ‘45q15’), expressed per 1 000 of the population (WHO 2006; Rajaratnam et al. 2010a). The most recent estimates available from the WHO are for 2008 (WHO 2010a). Rajaratnam et al. (2010a) provide new estimates for 187 countries, with published estimates for 1970, 1990 and 2010. Part of the rationale for their exercise is given as ‘substantial differences’ between other estimates, primarily of the United Nations Development Programme (UNDP) and the WHO, and the lack of transparency and replicability of other approaches. They classify sub-Saharan African countries into five groups on the basis of epidemiological profiles and geography, namely central, east, southern and west. The North African countries of Algeria, Egypt and Morocco are classified with the Middle East. While Rajaratnam et al’s data is more recent and built on improved methodologies, regional averages have not been published and we, consequently, revert to the WHO database in some cases. Another reason for utilising the WHO data is that they cover a wider range.
According to Rajaratnam et al. (2010a), in 2010 adult mortality for men globally was highest in Swaziland (765 per 1 000) and for women in Zambia (606 per 1 000), reflecting the general differential in adult mortality rates for men and women. These contrast with the lowest adult mortality globally for men in Iceland (65 per 1 000) and for women in Cyprus (38 per 1 000). The lowest female mortality rates in Africa in 2010 were in Tunisia (56 per 1000), followed by Cape Verde (93 per 1 000), with the rates of most countries ranging between 200 and Zambia’s 606 per 1 000 . The lowest male mortality rate in Africa in 2010 was also in Tunisia (109 per 1000), followed by São Tomé and Principe (201 per 1 000), with most rates ranging from around 300 to Swaziland’s 765.
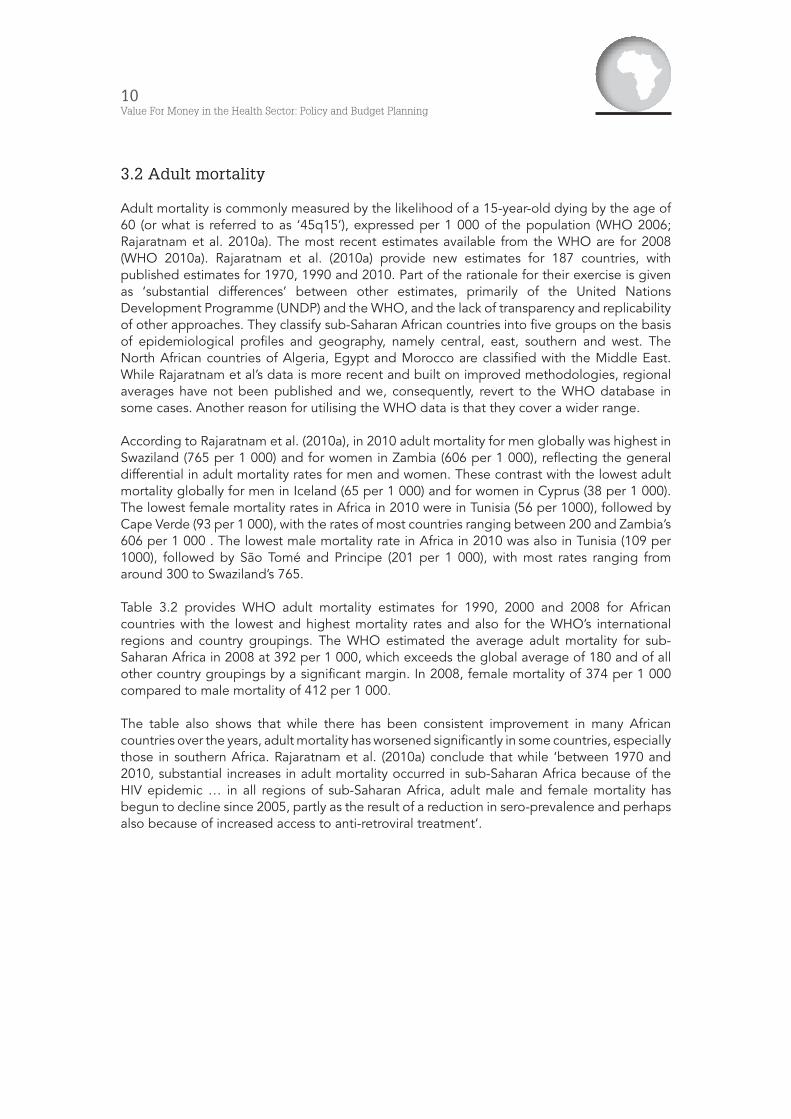
Table 3.2 provides WHO adult mortality estimates for 1990, 2000 and 2008 for African countries with the lowest and highest mortality rates and also for the WHO’s international regions and country groupings. The WHO estimated the average adult mortality for sub-Saharan Africa in 2008 at 392 per 1 000, which exceeds the global average of 180 and of all other country groupings by a significant margin. In 2008, female mortality of 374 per 1 000 compared to male mortality of 412 per 1 000.
The table also shows that while there has been consistent improvement in many African countries over the years, adult mortality has worsened significantly in some countries, especially those in southern Africa. Rajaratnam et al. (2010a) conclude that while ‘between 1970 and 2010, substantial increases in adult mortality occurred in sub-Saharan Africa because of the HIV epidemic … in all regions of sub-Saharan Africa, adult male and female mortality has begun to decline since 2005, partly as the result of a reduction in sero-prevalence and perhaps also because of increased access to anti-retroviral treatment’.
11Keynote Report 1 The Health Challenge in Africa and its Institutional Context
Table 3.2: Adult mortality, 1990–2008, selected African countries (lowest and highest) and international country groupings
WHO member state Adult mortality rate (years) Both sexes
1990 2000 2008
Tunisia 124 117 103
Morocco 164 135 118
Algeria 181 153 132
Libyan Arab Jamahiriya 178 156 138
Mauritius 193 172 160
Zambia 352 632 515
South Africa 271 392 520
Swaziland 230 444 620
Lesotho 251 521 685
Zimbabwe 285 711 772
Ranges of country values
Minimum 60 57 53
Median 206 197 175
Maximum 774 711 772
WHO region
African Region 371 421 392
Region of the Americas 162 140 126
South-East Asia Region 274 252 218
European Region 157 165 149
Eastern Mediterranean Region 242 217 203
Western Pacific Region 165 132 113
Income group
Low income 331 345 310
Lower middle income 227 205 178
Upper middle income 195 206 191
High income 117 98 87
Global 210 200 180
Source: WHO (2010a)
3.2 Child mortality
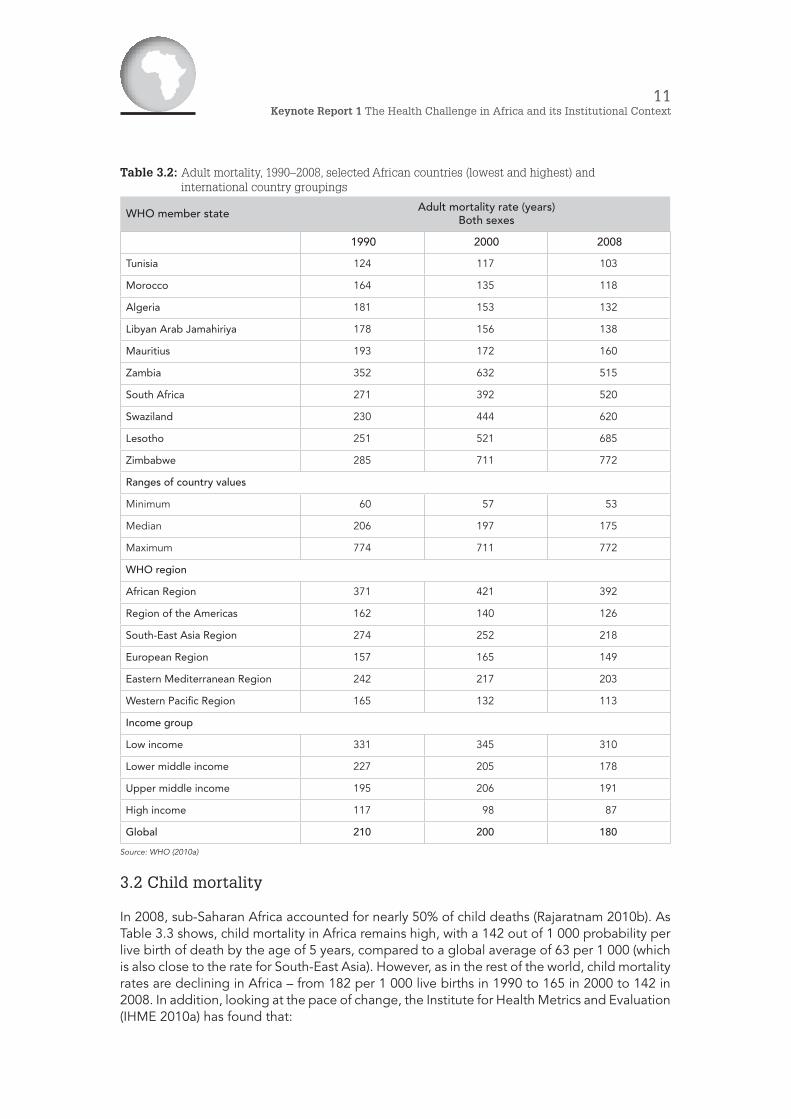
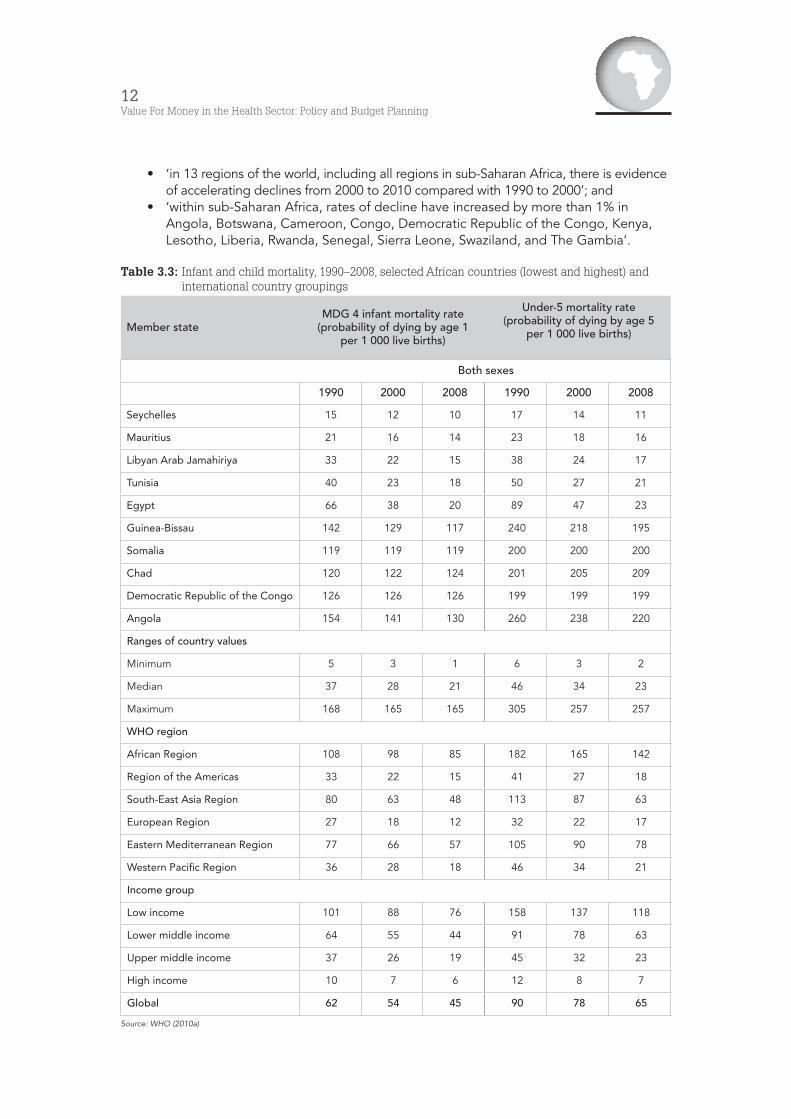
In 2008, sub-Saharan Africa accounted for nearly 50% of child deaths (Rajaratnam 2010b). As Table 3.3 shows, child mortality in Africa remains high, with a 142 out of 1 000 probability per live birth of death by the age of 5 years, compared to a global average of 63 per 1 000 (which is also close to the rate for South-East Asia). However, as in the rest of the world, child mortality rates are declining in Africa – from 182 per 1 000 live births in 1990 to 165 in 2000 to 142 in 2008. In addition, looking at the pace of change, the Institute for Health Metrics and Evaluation (IHME 2010a) has found that:
12Value For Money in the Health Sector: Policy and Budget Planning
• ‘in 13 regions of the world, including all regions in sub-Saharan Africa, there is evidence of accelerating declines from 2000 to 2010 compared with 1990 to 2000’; and
• ‘within sub-Saharan Africa, rates of decline have increased by more than 1% in Angola, Botswana, Cameroon, Congo, Democratic Republic of the Congo, Kenya, Lesotho, Liberia, Rwanda, Senegal, Sierra Leone, Swaziland, and The Gambia’.
Table 3.3: Infant and child mortality, 1990–2008, selected African countries (lowest and highest) and international country groupings
Member stateMDG 4 infant mortality rate
(probability of dying by age 1 per 1 000 live births)
Under-5 mortality rate (probability of dying by age 5
per 1 000 live births)
Both sexes
1990 2000 2008 1990 2000 2008
Seychelles 15 12 10 17 14 11
Mauritius 21 16 14 23 18 16
Libyan Arab Jamahiriya 33 22 15 38 24 17
Tunisia 40 23 18 50 27 21
Egypt 66 38 20 89 47 23
Guinea-Bissau 142 129 117 240 218 195
Somalia 119 119 119 200 200 200
Chad 120 122 124 201 205 209
Democratic Republic of the Congo 126 126 126 199 199 199
Angola 154 141 130 260 238 220
Ranges of country values
Minimum 5 3 1 6 3 2
Median 37 28 21 46 34 23
Maximum 168 165 165 305 257 257
WHO region
African Region 108 98 85 182 165 142
Region of the Americas 33 22 15 41 27 18
South-East Asia Region 80 63 48 113 87 63
European Region 27 18 12 32 22 17
Eastern Mediterranean Region 77 66 57 105 90 78
Western Pacific Region 36 28 18 46 34 21
Income group
Low income 101 88 76 158 137 118
Lower middle income 64 55 44 91 78 63
Upper middle income 37 26 19 45 32 23
High income 10 7 6 12 8 7
Global 62 54 45 90 78 65
Source: WHO (2010a)
13Keynote Report 1 The Health Challenge in Africa and its Institutional Context
3.4 Maternal mortality
In a recent update on global progress towards reducing maternal and child mortality (MDGs 4 and 5), the IHME (2010a) noted that:
As a percentage of overall adult mortality, maternal mortality is a tiny fraction. But the numbers are troubling for two reasons. First, maternal deaths are typically preventable, even in low-resource settings. Second, maternal mortality is a window into the overall strength of a country’s health system.
A pregnancy can test nearly all aspects of a health system: preventive care, counseling, surgery, drug administration, follow-up care, and emergency treatment. The number of women dying from maternal causes has historically shown that too many countries’ health systems were failing that test.
African countries feature significantly under countries with the most (and disproportionate) maternal deaths, from Nigeria with 4.4% of global births but 10.7% of maternal deaths in 2008 to Mali with 0.4% of global births but 1.1% of maternal deaths. In 2008, Nigeria, Ethiopia and the Democratic Republic of the Congo accounted for 20% of global maternal deaths.
Nevertheless, some African countries have made significant progress in recent years. The IHME (2010a) singles out Mali, which ‘had an MMR of 831 deaths for every 100,000 live births in 1990. Over the next 10 years, the MMR barely changed, dropping to 807. By 2008, though, the country’s MMR had declined to 670 – still high by global standards but a total decrease of nearly 17% in less than a decade’ (IHME 2010a).
3.5 Burden of disease
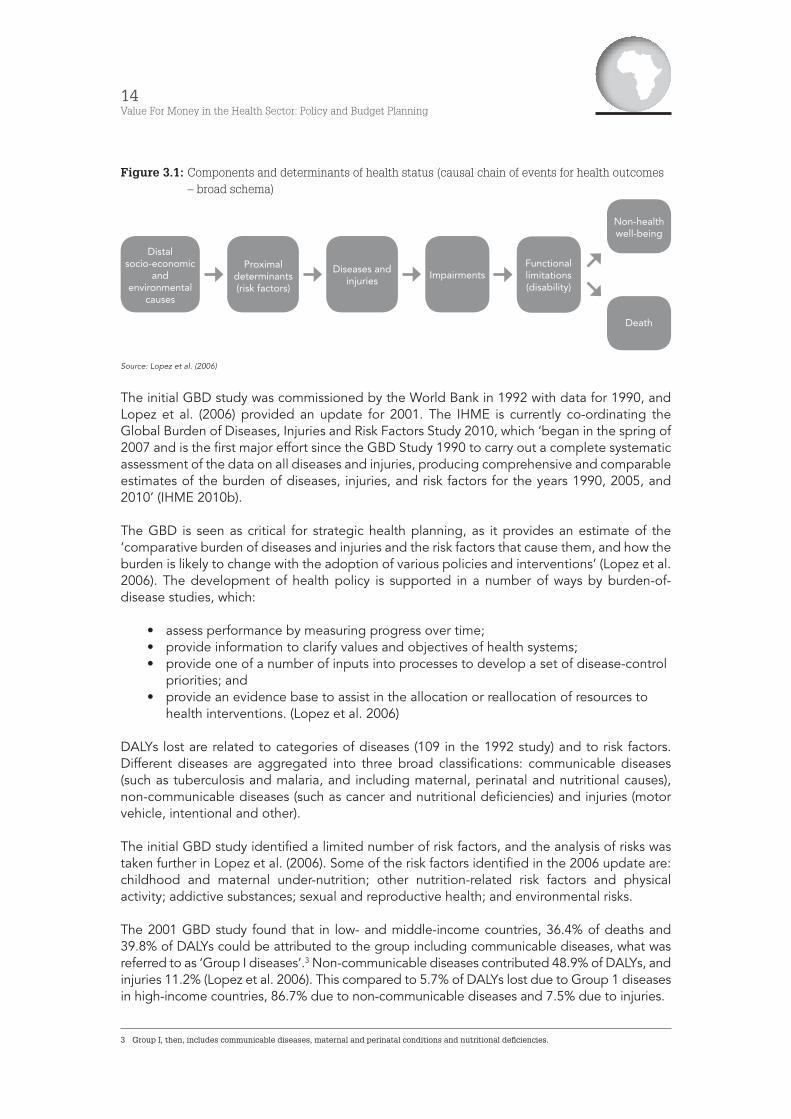
While mortality is commonly used to assess the extent of health challenges, it is incomplete as an indicator of health status because it does not take into account the losses related to other effects of illness and injuries such as handicap, pain and disability (World Bank 1993). The Global Burden of Disease (GBD) framework ‘incorporates data on non-fatal health outcomes into summary measures of population health’ (Lopez et al. 2006). It combines ‘losses from premature death’ and ‘loss of healthy life’ into the measure of disability-adjusted life-years (DALYs) lost (World Bank 1993).2 In the words of the Institute for Health Metrics and Evaluation, ‘a disability-adjusted life-year measures overall disease burden by calculating the years of healthy life lost due to illness, disability, or early death’. The GBD framework further classifies the sources of loss of life and disability into the diagnostic categories of the International Classification of Diseases and relates them to major risk factors. The framework underlying the approach is provided in Figure 3.1.
2 The DALY, thus, is the sum of years of life lost to premature mortality (YLL) and years of healthy life lost as a result of disability (YLD).
14Value For Money in the Health Sector: Policy and Budget Planning
Figure 3.1: Components and determinants of health status (causal chain of events for health outcomes – broad schema)
Source: Lopez et al. (2006)
The initial GBD study was commissioned by the World Bank in 1992 with data for 1990, and Lopez et al. (2006) provided an update for 2001. The IHME is currently co-ordinating the Global Burden of Diseases, Injuries and Risk Factors Study 2010, which ‘began in the spring of 2007 and is the first major effort since the GBD Study 1990 to carry out a complete systematic assessment of the data on all diseases and injuries, producing comprehensive and comparable estimates of the burden of diseases, injuries, and risk factors for the years 1990, 2005, and 2010’ (IHME 2010b).
The GBD is seen as critical for strategic health planning, as it provides an estimate of the ‘comparative burden of diseases and injuries and the risk factors that cause them, and how the burden is likely to change with the adoption of various policies and interventions’ (Lopez et al. 2006). The development of health policy is supported in a number of ways by burden-of-disease studies, which:
• assess performance by measuring progress over time; • provide information to clarify values and objectives of health systems; • provide one of a number of inputs into processes to develop a set of disease-control
priorities; and • provide an evidence base to assist in the allocation or reallocation of resources to
health interventions. (Lopez et al. 2006)
DALYs lost are related to categories of diseases (109 in the 1992 study) and to risk factors. Different diseases are aggregated into three broad classifications: communicable diseases (such as tuberculosis and malaria, and including maternal, perinatal and nutritional causes), non-communicable diseases (such as cancer and nutritional deficiencies) and injuries (motor vehicle, intentional and other).
The initial GBD study identified a limited number of risk factors, and the analysis of risks was taken further in Lopez et al. (2006). Some of the risk factors identified in the 2006 update are: childhood and maternal under-nutrition; other nutrition-related risk factors and physical activity; addictive substances; sexual and reproductive health; and environmental risks.
The 2001 GBD study found that in low- and middle-income countries, 36.4% of deaths and 39.8% of DALYs could be attributed to the group including communicable diseases, what was referred to as ‘Group I diseases’.3 Non-communicable diseases contributed 48.9% of DALYs, and injuries 11.2% (Lopez et al. 2006). This compared to 5.7% of DALYs lost due to Group 1 diseases in high-income countries, 86.7% due to non-communicable diseases and 7.5% due to injuries.
3 Group I, then, includes communicable diseases, maternal and perinatal conditions and nutritional deficiencies.
Distal socio-economic
and environmental
causes
Non-health well-being
Death
Proximal determinants (risk factors)
Diseases and injuries
ImpairmentsFunctional limitations (disability)
15Keynote Report 1 The Health Challenge in Africa and its Institutional Context
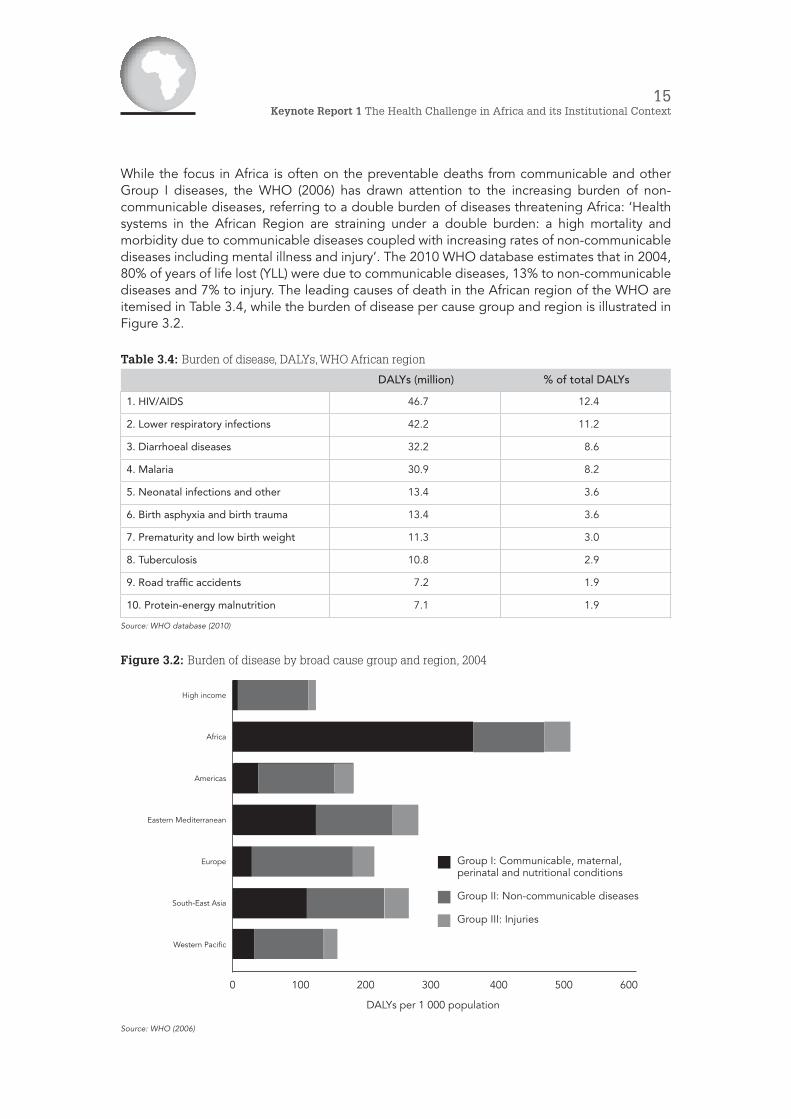
While the focus in Africa is often on the preventable deaths from communicable and other Group I diseases, the WHO (2006) has drawn attention to the increasing burden of non-communicable diseases, referring to a double burden of diseases threatening Africa: ‘Health systems in the African Region are straining under a double burden: a high mortality and morbidity due to communicable diseases coupled with increasing rates of non-communicable diseases including mental illness and injury’. The 2010 WHO database estimates that in 2004, 80% of years of life lost (YLL) were due to communicable diseases, 13% to non-communicable diseases and 7% to injury. The leading causes of death in the African region of the WHO are itemised in Table 3.4, while the burden of disease per cause group and region is illustrated in Figure 3.2.
Table 3.4: Burden of disease, DALYs, WHO African region
DALYs (million) % of total DALYs
1. HIV/AIDS 46.7 12.4
2. Lower respiratory infections 42.2 11.2
3. Diarrhoeal diseases 32.2 8.6
4. Malaria 30.9 8.2
5. Neonatal infections and other 13.4 3.6
6. Birth asphyxia and birth trauma 13.4 3.6
7. Prematurity and low birth weight 11.3 3.0
8. Tuberculosis 10.8 2.9
9. Road traffic accidents 7.2 1.9
10. Protein-energy malnutrition 7.1 1.9
Source: WHO database (2010)
Figure 3.2: Burden of disease by broad cause group and region, 2004
Source: WHO (2006)
High income
Africa
Americas
Eastern Mediterranean
Europe
South-East Asia
Western Pacific
0 100 200 300 400 500 600
DALYs per 1 000 population
Group I: Communicable, maternal, perinatal and nutritional conditions
Group II: Non-communicable diseases
Group III: Injuries
16Value For Money in the Health Sector: Policy and Budget Planning
4. Health service delivery (outputs)
Ideally, one would require a range of indicators covering the different levels of the health services, from primary care (mostly clinics and health centres), to secondary services (district and regional hospitals) and tertiary services (specialised and high-level hospitals), to measure service delivery. In addition to access and coverage, assessment of health service delivery requires information about the quality of services. However, data are a problem; the WHO (2006b) states that data are lacking for many countries. The availability of standardised systematic data on health service quality is more of problem than is access.
Both the WHO 2006 assessment of the health challenge and the WHO 2010 database carry indicators of health service coverage. One of the indicators that the WHO suggests for measuring the health service is ‘inpatient beds density’, which is regarded as ‘one of the few available indicators on a component of level of health service delivery’. This indicator can also be seen as an indicator of inputs, reflecting the available infrastructure, and is considered together with health workforce and essential medicines below.
Common indicators of the availability of health services are:
• immunisation and child health; • maternal health; and • disease-specific indicators.
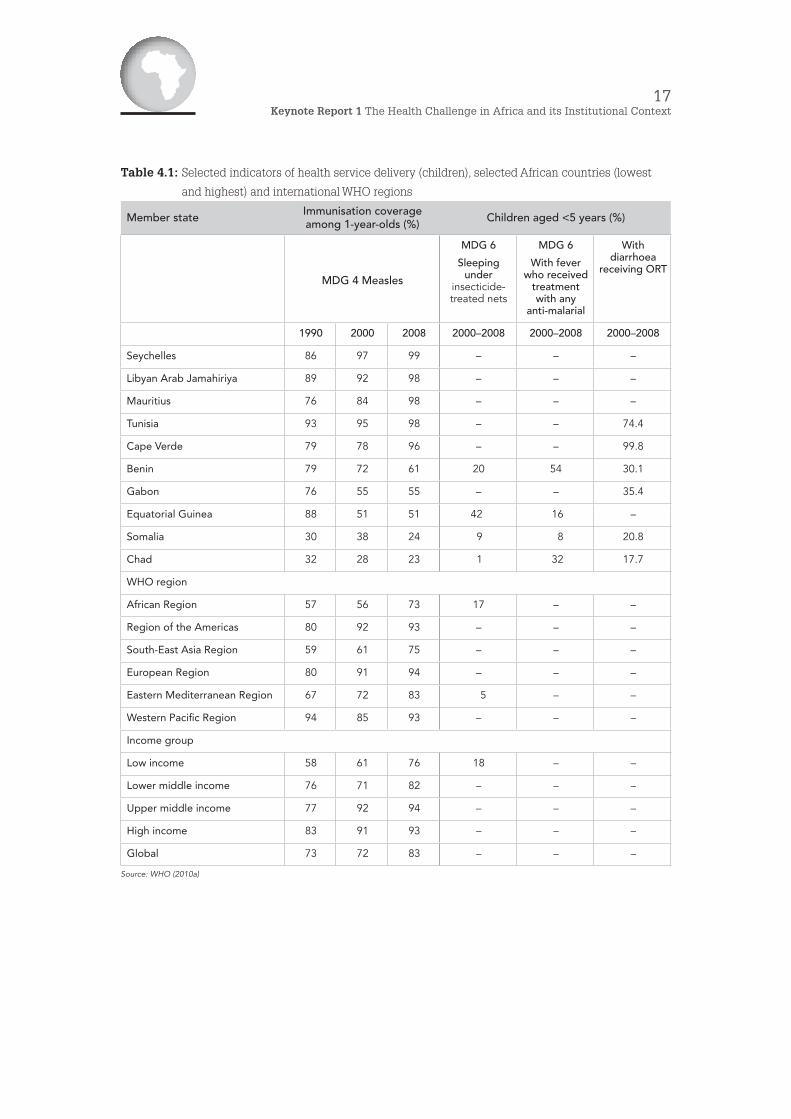
Table 4.1 provides information on selected service delivery indicators related to children. As can be seen, the data on interventions related to specific diseases (malaria and diarrhoea, in this case) are very uneven. Immunisation coverage data are fairly complete.
The average immunisation rates for the WHO African region increased strongly between 1990 and 2008, from 57% to 73%, but remain significantly below levels in other WHO regions except for the South-East Asia region (at 75% in 2008). In several countries (in the table, Benin, Gabon and Equatorial Guinea), immunisation levels have declined, and they remain very low in some countries (only 24% and 23% in Somalia and Chad, respectively).
17Keynote Report 1 The Health Challenge in Africa and its Institutional Context
Table 4.1: Selected indicators of health service delivery (children), selected African countries (lowest
and highest) and international WHO regions
Member state Immunisation coverage among 1-year-olds (%) Children aged <5 years (%)
MDG 4 Measles
MDG 6
Sleeping under
insecticide-treated nets
MDG 6
With fever who received
treatment with any
anti-malarial
With diarrhoea
receiving ORT
1990 2000 2008 2000–2008 2000–2008 2000–2008
Seychelles 86 97 99 – – –
Libyan Arab Jamahiriya 89 92 98 – – –
Mauritius 76 84 98 – – –
Tunisia 93 95 98 – – 74.4
Cape Verde 79 78 96 – – 99.8
Benin 79 72 61 20 54 30.1
Gabon 76 55 55 – – 35.4
Equatorial Guinea 88 51 51 42 16 –
Somalia 30 38 24 9 8 20.8
Chad 32 28 23 1 32 17.7
WHO region
African Region 57 56 73 17 – –
Region of the Americas 80 92 93 – – –
South-East Asia Region 59 61 75 – – –
European Region 80 91 94 – – –
Eastern Mediterranean Region 67 72 83 5 – –
Western Pacific Region 94 85 93 – – –
Income group
Low income 58 61 76 18 – –
Lower middle income 76 71 82 – – –
Upper middle income 77 92 94 – – –
High income 83 91 93 – – –
Global 73 72 83 – – –
Source: WHO (2010a)
18Value For Money in the Health Sector: Policy and Budget Planning
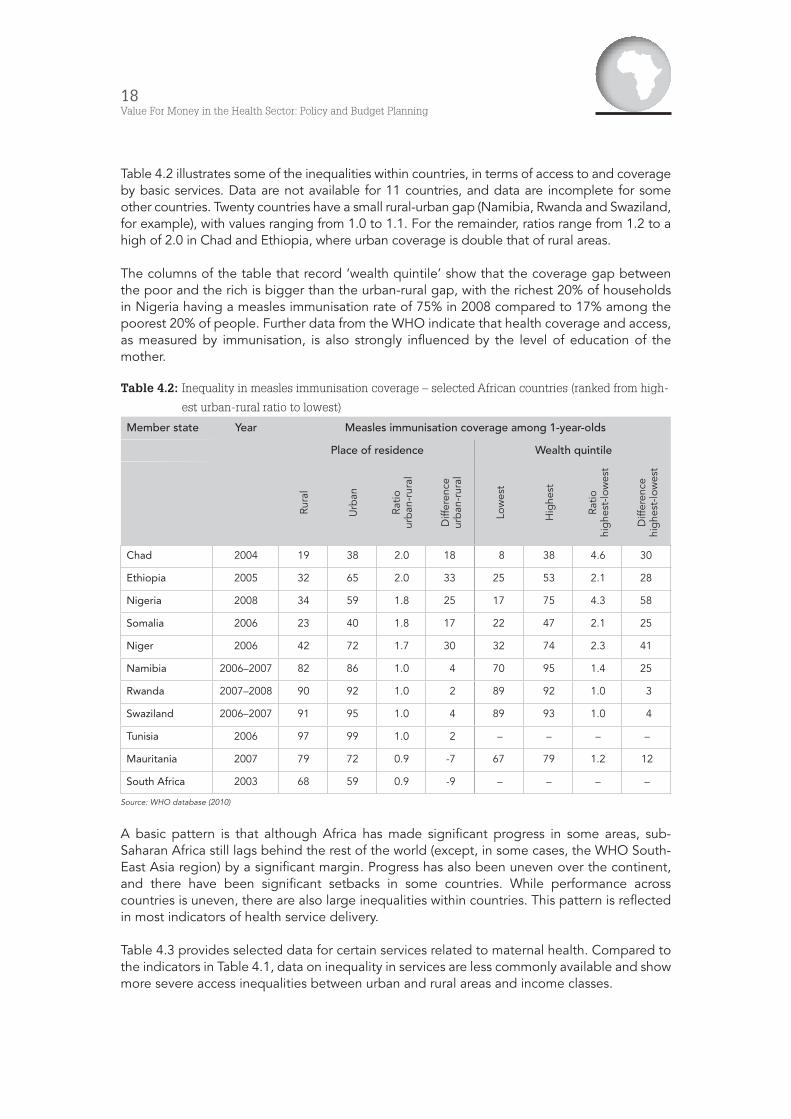
Table 4.2 illustrates some of the inequalities within countries, in terms of access to and coverage by basic services. Data are not available for 11 countries, and data are incomplete for some other countries. Twenty countries have a small rural-urban gap (Namibia, Rwanda and Swaziland, for example), with values ranging from 1.0 to 1.1. For the remainder, ratios range from 1.2 to a high of 2.0 in Chad and Ethiopia, where urban coverage is double that of rural areas.
The columns of the table that record ‘wealth quintile’ show that the coverage gap between the poor and the rich is bigger than the urban-rural gap, with the richest 20% of households in Nigeria having a measles immunisation rate of 75% in 2008 compared to 17% among the poorest 20% of people. Further data from the WHO indicate that health coverage and access, as measured by immunisation, is also strongly influenced by the level of education of the mother.
Table 4.2: Inequality in measles immunisation coverage – selected African countries (ranked from high-
est urban-rural ratio to lowest)
Member state Year Measles immunisation coverage among 1-year-olds
Place of residence Wealth quintile
Rura
l
Urb
an
Ratio
ur
ban
-rur
al
Diff
eren
ce
urb
an-r
ural
Low
est
Hig
hest
Ratio
hi
ghe
st-lo
wes
t
Diff
eren
ce
hig
hest
-low
est
Chad 2004 19 38 2.0 18 8 38 4.6 30
Ethiopia 2005 32 65 2.0 33 25 53 2.1 28
Nigeria 2008 34 59 1.8 25 17 75 4.3 58
Somalia 2006 23 40 1.8 17 22 47 2.1 25
Niger 2006 42 72 1.7 30 32 74 2.3 41
Namibia 2006–2007 82 86 1.0 4 70 95 1.4 25
Rwanda 2007–2008 90 92 1.0 2 89 92 1.0 3
Swaziland 2006–2007 91 95 1.0 4 89 93 1.0 4
Tunisia 2006 97 99 1.0 2 – – – –
Mauritania 2007 79 72 0.9 -7 67 79 1.2 12
South Africa 2003 68 59 0.9 -9 – – – –
Source: WHO database (2010)
A basic pattern is that although Africa has made significant progress in some areas, sub-Saharan Africa still lags behind the rest of the world (except, in some cases, the WHO South-East Asia region) by a significant margin. Progress has also been uneven over the continent, and there have been significant setbacks in some countries. While performance across countries is uneven, there are also large inequalities within countries. This pattern is reflected in most indicators of health service delivery.
Table 4.3 provides selected data for certain services related to maternal health. Compared to the indicators in Table 4.1, data on inequality in services are less commonly available and show more severe access inequalities between urban and rural areas and income classes.

19Keynote Report 1 The Health Challenge in Africa and its Institutional Context
Table 4.3: Selected indicators of health service delivery (maternal/reproductive health) – selected Afri-can countries (lowest and highest) and international WHO regions
Member state MDG 5
Antenatal care coverage – At least 1 visit(%)
MDG 5
Births attended by skilled health personnel
(%)
MDG 5
Contraceptive prevalence (%)
2000– 2009 1990–1999 2000–2008 2000–2008
Libyan Arab Jamahiriya – 94 100 –
Mauritius – 99 99 75.8
Algeria 89 77 95 61.4
Botswana 97 – 94 44.4
Djibouti 92 – 93 17.8
South Africa 92 84 91 60.3
Somalia 26 34 33 14.6
Eritrea 70 21 28 8.0
Niger 46 18 18 11.2
Chad 39 12 14 2.8
Ethiopia 28 – 6 14.7
WHO region
African Region 73 48 47 23.7
Region of the Americas 94 87 92 70.6
South-East Asia Region 75 40 49 57.5
European Region – 95 96 68.4
Eastern Mediterranean Region 65 43 59 42.8
Western Pacific Region 90 85 92 82.7
Global 78 62 66 62.3
Source: WHO database (2010) (view data qualifications in source)
5. Health funding and inputs
5.1 Overall health spending
As is clear from the previous sections, health outcomes in Africa – the incidence of diseases, illness and premature death – compare unfavourably with the rest of the world. On the one hand, these health outcomes are a component of low living standards; on the other hand, they are an obstacle to development. Bad health is both a result and a signpost of poverty. At the same time, it lowers development prospects because of its impact on the productivity of the people of Africa.
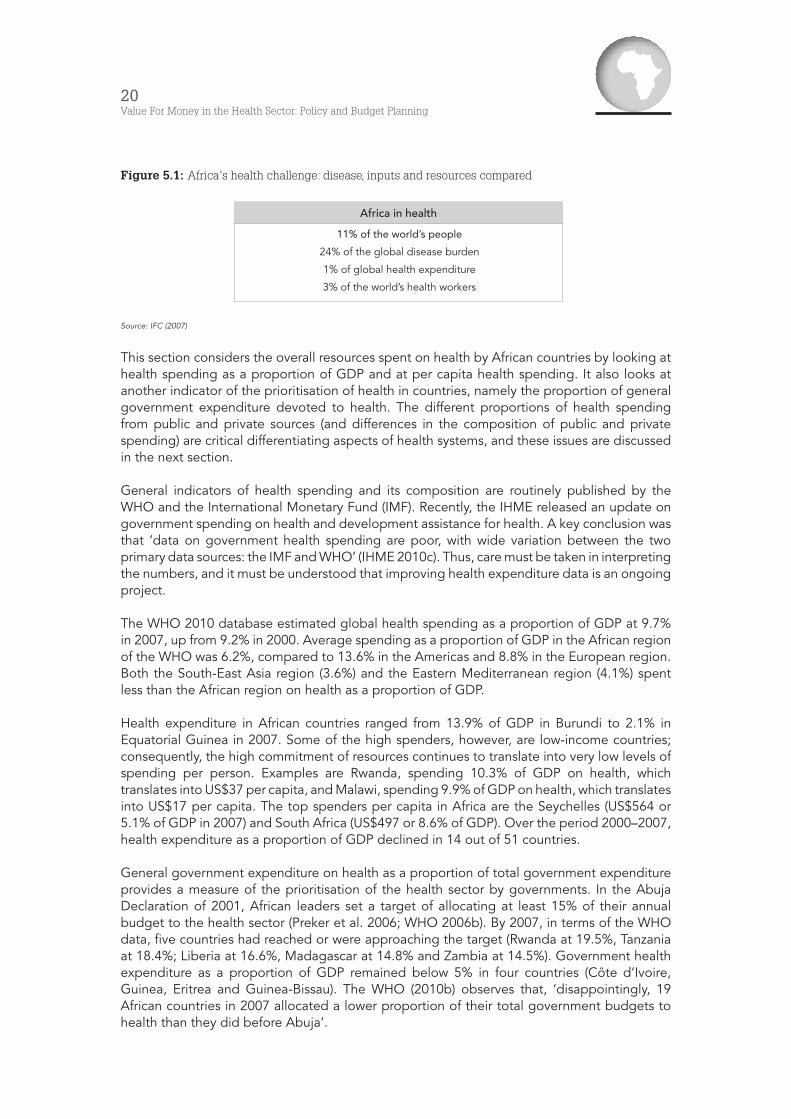
However, it is not only health outcomes in Africa that lag behind those in the rest of the world. The International Finance Corporation (IFC) has contrasted need or demand, as measured by disease burden, with resourcing or the supply side (see Figure 5.1).
20Value For Money in the Health Sector: Policy and Budget Planning
Figure 5.1: Africa’s health challenge: disease, inputs and resources compared
Africa in health
11% of the world’s people
24% of the global disease burden
1% of global health expenditure
3% of the world’s health workers
Source: IFC (2007)
This section considers the overall resources spent on health by African countries by looking at health spending as a proportion of GDP and at per capita health spending. It also looks at another indicator of the prioritisation of health in countries, namely the proportion of general government expenditure devoted to health. The different proportions of health spending from public and private sources (and differences in the composition of public and private spending) are critical differentiating aspects of health systems, and these issues are discussed in the next section.
General indicators of health spending and its composition are routinely published by the WHO and the International Monetary Fund (IMF). Recently, the IHME released an update on government spending on health and development assistance for health. A key conclusion was that ‘data on government health spending are poor, with wide variation between the two primary data sources: the IMF and WHO’ (IHME 2010c). Thus, care must be taken in interpreting the numbers, and it must be understood that improving health expenditure data is an ongoing project.
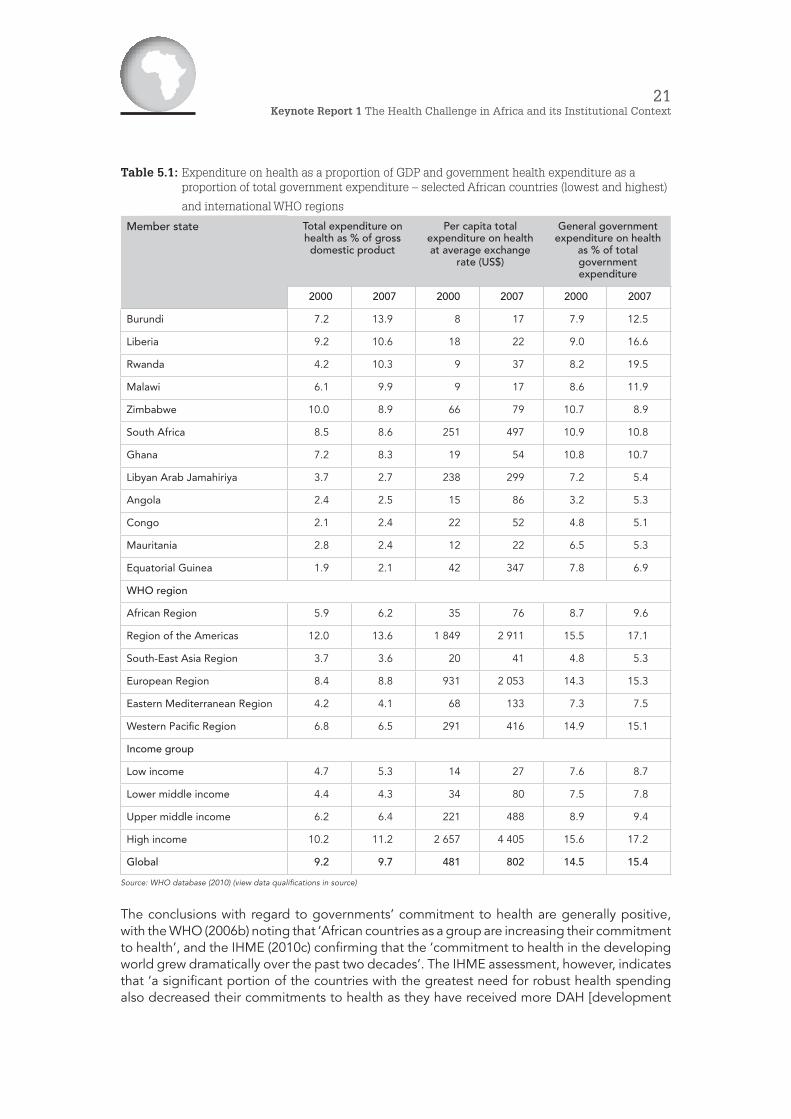
The WHO 2010 database estimated global health spending as a proportion of GDP at 9.7% in 2007, up from 9.2% in 2000. Average spending as a proportion of GDP in the African region of the WHO was 6.2%, compared to 13.6% in the Americas and 8.8% in the European region. Both the South-East Asia region (3.6%) and the Eastern Mediterranean region (4.1%) spent less than the African region on health as a proportion of GDP.
Health expenditure in African countries ranged from 13.9% of GDP in Burundi to 2.1% in Equatorial Guinea in 2007. Some of the high spenders, however, are low-income countries; consequently, the high commitment of resources continues to translate into very low levels of spending per person. Examples are Rwanda, spending 10.3% of GDP on health, which translates into US$37 per capita, and Malawi, spending 9.9% of GDP on health, which translates into US$17 per capita. The top spenders per capita in Africa are the Seychelles (US$564 or 5.1% of GDP in 2007) and South Africa (US$497 or 8.6% of GDP). Over the period 2000–2007, health expenditure as a proportion of GDP declined in 14 out of 51 countries.
General government expenditure on health as a proportion of total government expenditure provides a measure of the prioritisation of the health sector by governments. In the Abuja Declaration of 2001, African leaders set a target of allocating at least 15% of their annual budget to the health sector (Preker et al. 2006; WHO 2006b). By 2007, in terms of the WHO data, five countries had reached or were approaching the target (Rwanda at 19.5%, Tanzania at 18.4%; Liberia at 16.6%, Madagascar at 14.8% and Zambia at 14.5%). Government health expenditure as a proportion of GDP remained below 5% in four countries (Côte d’Ivoire, Guinea, Eritrea and Guinea-Bissau). The WHO (2010b) observes that, ‘disappointingly, 19 African countries in 2007 allocated a lower proportion of their total government budgets to health than they did before Abuja’.
21Keynote Report 1 The Health Challenge in Africa and its Institutional Context
Table 5.1: Expenditure on health as a proportion of GDP and government health expenditure as a proportion of total government expenditure – selected African countries (lowest and highest)
and international WHO regions
Member state Total expenditure on health as % of gross domestic product
Per capita total expenditure on health at average exchange
rate (US$)
General government expenditure on health
as % of total government expenditure
2000 2007 2000 2007 2000 2007
Burundi 7.2 13.9 8 17 7.9 12.5
Liberia 9.2 10.6 18 22 9.0 16.6
Rwanda 4.2 10.3 9 37 8.2 19.5
Malawi 6.1 9.9 9 17 8.6 11.9
Zimbabwe 10.0 8.9 66 79 10.7 8.9
South Africa 8.5 8.6 251 497 10.9 10.8
Ghana 7.2 8.3 19 54 10.8 10.7
Libyan Arab Jamahiriya 3.7 2.7 238 299 7.2 5.4
Angola 2.4 2.5 15 86 3.2 5.3
Congo 2.1 2.4 22 52 4.8 5.1
Mauritania 2.8 2.4 12 22 6.5 5.3
Equatorial Guinea 1.9 2.1 42 347 7.8 6.9
WHO region
African Region 5.9 6.2 35 76 8.7 9.6
Region of the Americas 12.0 13.6 1 849 2 911 15.5 17.1
South-East Asia Region 3.7 3.6 20 41 4.8 5.3
European Region 8.4 8.8 931 2 053 14.3 15.3
Eastern Mediterranean Region 4.2 4.1 68 133 7.3 7.5
Western Pacific Region 6.8 6.5 291 416 14.9 15.1
Income group
Low income 4.7 5.3 14 27 7.6 8.7
Lower middle income 4.4 4.3 34 80 7.5 7.8
Upper middle income 6.2 6.4 221 488 8.9 9.4
High income 10.2 11.2 2 657 4 405 15.6 17.2
Global 9.2 9.7 481 802 14.5 15.4
Source: WHO database (2010) (view data qualifications in source)
The conclusions with regard to governments’ commitment to health are generally positive, with the WHO (2006b) noting that ‘African countries as a group are increasing their commitment to health’, and the IHME (2010c) confirming that the ‘commitment to health in the developing world grew dramatically over the past two decades’. The IHME assessment, however, indicates that ‘a significant portion of the countries with the greatest need for robust health spending also decreased their commitments to health as they have received more DAH [development
22Value For Money in the Health Sector: Policy and Budget Planning
assistance for health]’. In three sub-regions of sub-Saharan Africa (Central, East and South), government health spending from own sources (what is termed ‘GGE-S’) declined as a proportion of general government expenditure between 1999–2002 and 2003–2006 (IHME 2010c).
5.2 Human resources
The 2006 World Health Report (WHO 2006c) documented the challenge of ensuring an adequate workforce to address global health challenges. Following on earlier work, the report estimated that countries with fewer than 2 to 2.5 health care professionals (counting only doctors, nurses and midwives) per 1 000 population would fail to achieve 80% coverage for certain basic services and, therefore, would face a ‘critical shortage’. It was estimated that 57 countries fell into this category, and that 36 of these were in southern Africa. ‘For all these countries to reach the target levels of health worker availability would require an additional 2.4 million professionals.’ (WHO 2006c)
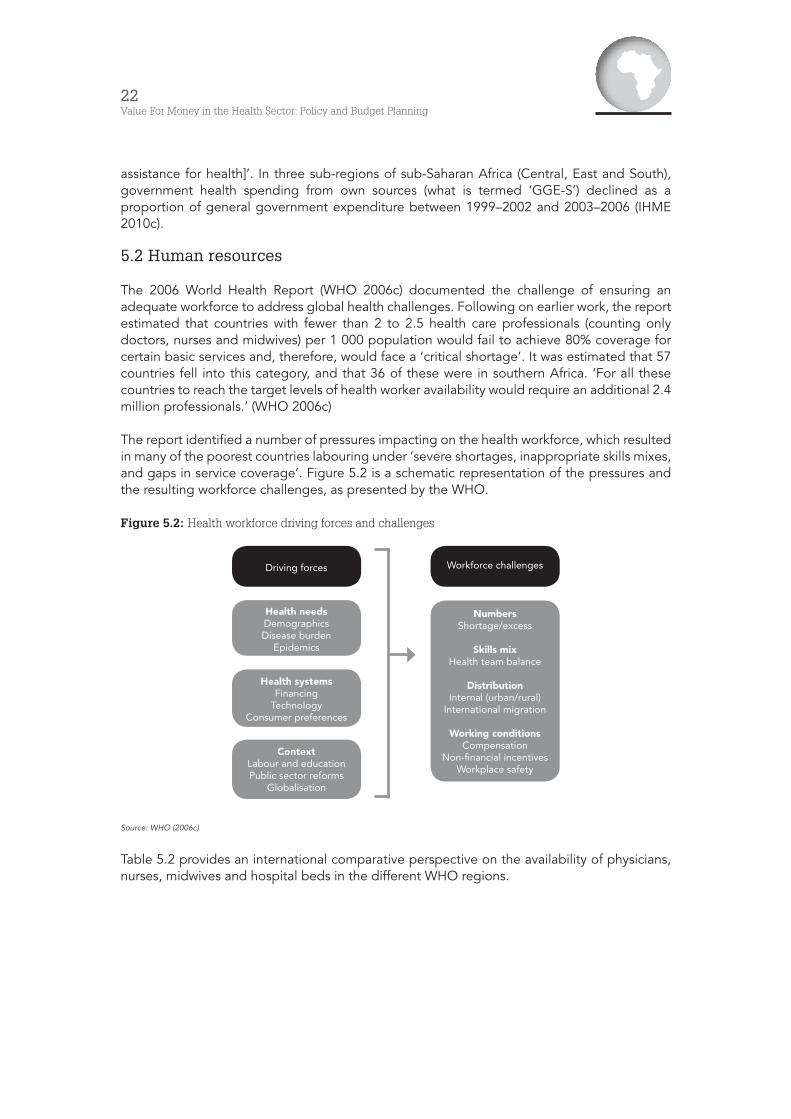
The report identified a number of pressures impacting on the health workforce, which resulted in many of the poorest countries labouring under ‘severe shortages, inappropriate skills mixes, and gaps in service coverage’. Figure 5.2 is a schematic representation of the pressures and the resulting workforce challenges, as presented by the WHO.
Figure 5.2: Health workforce driving forces and challenges
Source: WHO (2006c)
Table 5.2 provides an international comparative perspective on the availability of physicians, nurses, midwives and hospital beds in the different WHO regions.
Driving forces
Health needsDemographicsDisease burden
Epidemics
Health systemsFinancing
TechnologyConsumer preferences
ContextLabour and educationPublic sector reforms
Globalisation
Numbers Shortage/excess
Skills mixHealth team balance
DistributionInternal (urban/rural)
International migration
Working conditionsCompensation
Non-financial incentivesWorkplace safety
Workforce challenges
23Keynote Report 1 The Health Challenge in Africa and its Institutional Context
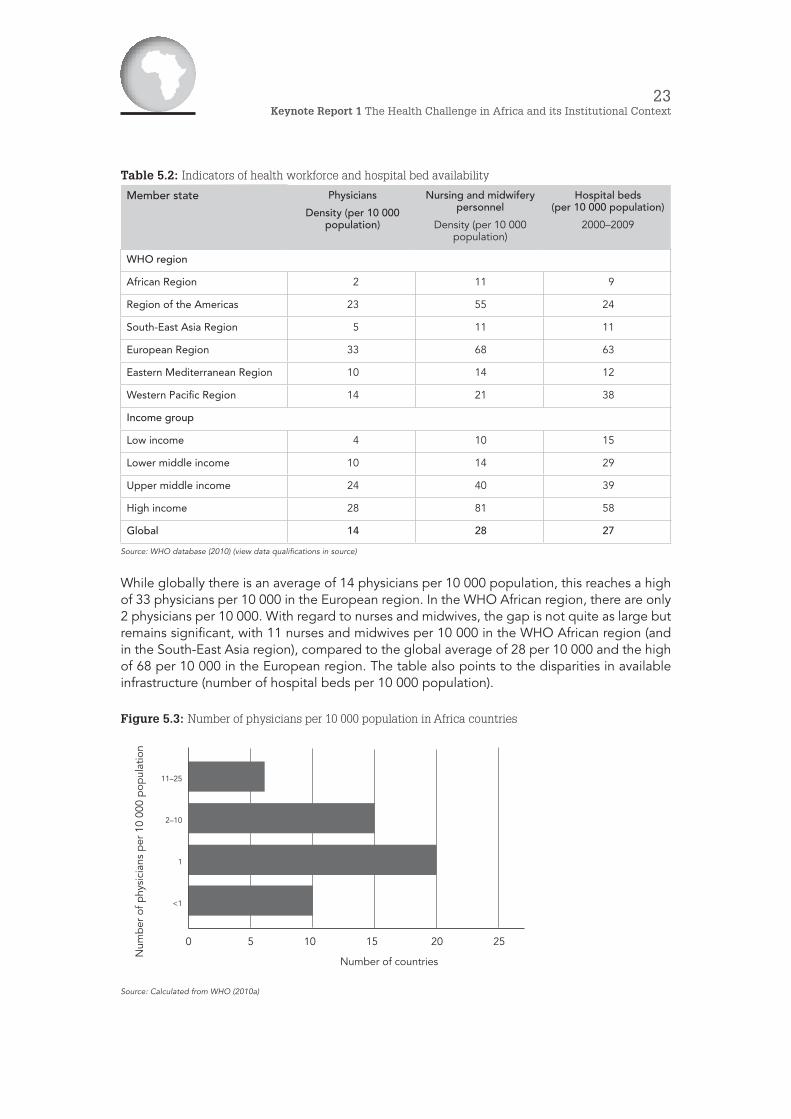
Table 5.2: Indicators of health workforce and hospital bed availability
Member state Physicians
Density (per 10 000 population)
Nursing and midwifery personnel
Density (per 10 000 population)
Hospital beds (per 10 000 population)
2000–2009
WHO region
African Region 2 11 9
Region of the Americas 23 55 24
South-East Asia Region 5 11 11
European Region 33 68 63
Eastern Mediterranean Region 10 14 12
Western Pacific Region 14 21 38
Income group
Low income 4 10 15
Lower middle income 10 14 29
Upper middle income 24 40 39
High income 28 81 58
Global 14 28 27
Source: WHO database (2010) (view data qualifications in source)
While globally there is an average of 14 physicians per 10 000 population, this reaches a high of 33 physicians per 10 000 in the European region. In the WHO African region, there are only 2 physicians per 10 000. With regard to nurses and midwives, the gap is not quite as large but remains significant, with 11 nurses and midwives per 10 000 in the WHO African region (and in the South-East Asia region), compared to the global average of 28 per 10 000 and the high of 68 per 10 000 in the European region. The table also points to the disparities in available infrastructure (number of hospital beds per 10 000 population).
Figure 5.3: Number of physicians per 10 000 population in Africa countries
Source: Calculated from WHO (2010a)
11–25
2–10
1
<1
0 5 10 15 20 25
Number of countries
Num
ber
of p
hysi
cian
s p
er 1
0 00
0 p
opul
atio
n
24Value For Money in the Health Sector: Policy and Budget Planning
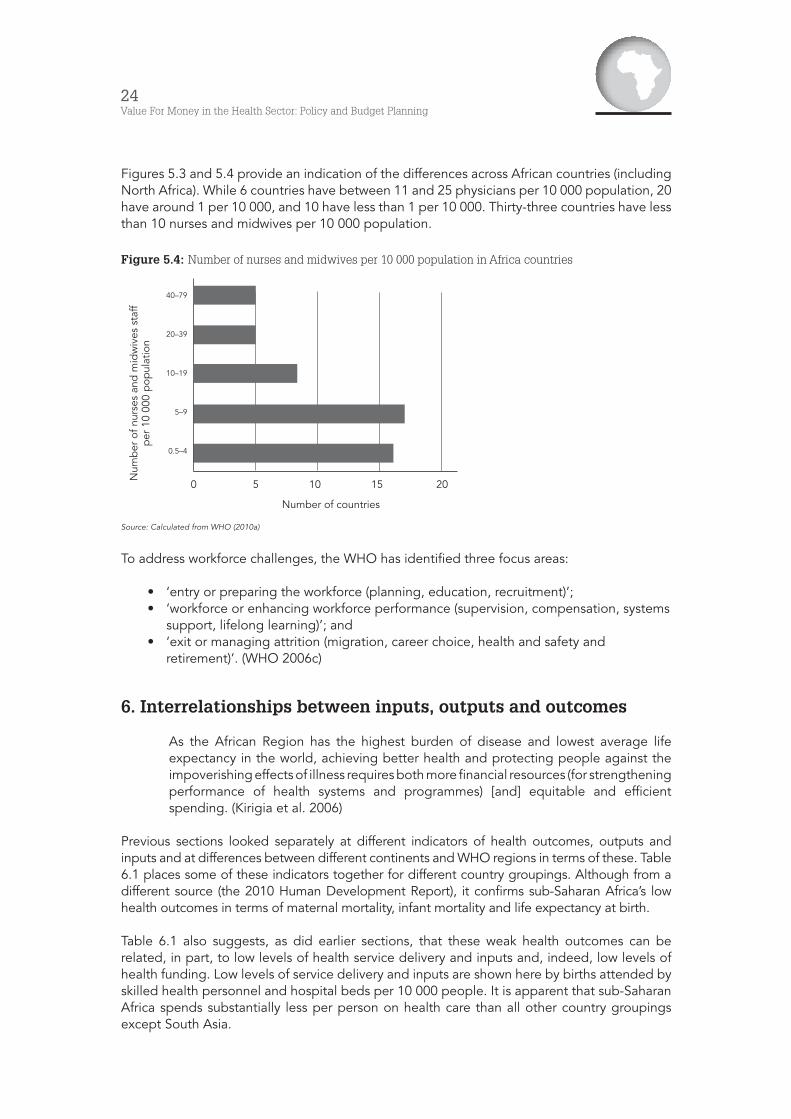
Figures 5.3 and 5.4 provide an indication of the differences across African countries (including North Africa). While 6 countries have between 11 and 25 physicians per 10 000 population, 20 have around 1 per 10 000, and 10 have less than 1 per 10 000. Thirty-three countries have less than 10 nurses and midwives per 10 000 population.
Figure 5.4: Number of nurses and midwives per 10 000 population in Africa countries
Source: Calculated from WHO (2010a)
To address workforce challenges, the WHO has identified three focus areas:
• ‘entry or preparing the workforce (planning, education, recruitment)’; • ‘workforce or enhancing workforce performance (supervision, compensation, systems
support, lifelong learning)’; and • ‘exit or managing attrition (migration, career choice, health and safety and
retirement)’. (WHO 2006c)
6. Interrelationships between inputs, outputs and outcomes
As the African Region has the highest burden of disease and lowest average life expectancy in the world, achieving better health and protecting people against the impoverishing effects of illness requires both more financial resources (for strengthening performance of health systems and programmes) [and] equitable and efficient spending. (Kirigia et al. 2006)
Previous sections looked separately at different indicators of health outcomes, outputs and inputs and at differences between different continents and WHO regions in terms of these. Table 6.1 places some of these indicators together for different country groupings. Although from a different source (the 2010 Human Development Report), it confirms sub-Saharan Africa’s low health outcomes in terms of maternal mortality, infant mortality and life expectancy at birth.
Table 6.1 also suggests, as did earlier sections, that these weak health outcomes can be related, in part, to low levels of health service delivery and inputs and, indeed, low levels of health funding. Low levels of service delivery and inputs are shown here by births attended by skilled health personnel and hospital beds per 10 000 people. It is apparent that sub-Saharan Africa spends substantially less per person on health care than all other country groupings except South Asia.
40–79
20–39
10–19
5–9
0.5–4
0 5 10 15 20
Number of countries
Num
ber
of n
urse
s an
d m
idw
ives
sta
ff
per
10
000
pop
ulat
ion

25Keynote Report 1 The Health Challenge in Africa and its Institutional Context
Table 6.1: Indicators of health outcomes, service delivery and inputs: sub-Saharan countries and other
country groupings
Country groups Maternal mortality
ratio
(deaths per 100 000 live
births)
Infant mortality
rate
(per 1 000 live births)
Life expectancy
at birth
(years)
Births attended by
skilled health
personnel
(%)
Hospital beds
(per 10 000 people)
Expenditure on health
(per capita PPP US$)
2003–2008 2008 2010 2000–2008 2000–2009 2007
Developed countries
OECD 8 5 80.3 99.5 62.9 4 221.5
Non-OECD 16 5 80.0 99.9 39.7 1 807.0
Developing countries
Arab States 238 38 69.1 76.6 16.0 286.6
East Asia and the Pacific 126 23 72.6 91.0 20.2 207.3
Europe and Central Asia 41 20 69.5 95.9 51.9 622.6
Latin America and
the Caribbean
122 19 74.0 91.4 24.1 732.3
South Asia 454 56 65.1 45.4 16.5 123.0
Sub-Saharan Africa 881 86 52.7 47.8 18.6 127.5
World 273 44 69.3 69.3 30.0 869.0
Source: UNDP (2010)
Several indicators, however, suggest that levels of funding and service availability are not the only factors impacting on weak health outcomes. Firstly, there is significant diversity in health outcomes and inputs between different countries in Africa. Some evidence suggests that variation in health outcomes cannot be understood simply in terms of inputs and spending, and that differences in technical and allocative efficiencies could be part of the explanation. Secondly, Table 6.1 indicates that South Asia, with slightly less spending and slightly lower health inputs, has significantly better health outcomes than does Africa. While various factors contribute to these different outcomes, the question is posed as to the relative efficiency of different health systems.
While in absolute and relative terms health input levels in many African countries remain low, the evidence indicates a need to focus on value for money and efficiency. In a number of areas, health spending in Africa has been increasing significantly, and is expected to increase further over coming decades (IFC 2007). It is imperative that this additional funding is utilised efficiently.
7. Health system context
Earlier sections reviewed the health challenges in Africa from the demand side (the ‘disproportionate’ burden of disease to be faced)4 and aspects of the supply side (the funding and sources of funds, and some of the inputs, primarily human resources).
4 Barbiero (2006), in addition to burden of disease, points to other factors interacting with burden of disease to escalate demand for health services – demography (continued population growth) and social change (urbanisation or the ‘urban crucible’). In terms of disease burden, he concludes that, indeed, Africa faces a quadruple threat if we consider the HIV/AIDS pandemic and the growing rate of deaths and disabilities from injuries in addition to the chronic and infectious causes of death.

26Value For Money in the Health Sector: Policy and Budget Planning
The WHO’s 2006 assessment of the African health challenge also reviews these different aspects and concludes that ‘national health systems’ constitute ‘Africa’s big health challenge’.
Various descriptions have been attached to the state of health systems in Africa. Barbiero (2006) refers to them as ‘fragile and under increasing stress’, while the WHO (2006) speaks of them as ‘weak and not fully functional’. The need for further health systems reform is generally accepted.
This section looks at health systems and health systems reform, identifying the key health system functions and components, and reform mechanisms or policy areas, and then considers the role of health and finance departments and the need for more dialogue. As Frenk (1994) succinctly puts it: ‘in order to better understand reform attempts it is necessary to develop a clear conception of the object of reform: the health system’.
7.1 Functions of a health system
Following Murray and Frenk (2000) and the WHO (2000), it is common to attribute four functions to health systems. A health system is defined more broadly than just the people and organisations providing medical care. It extends to: the organisations that steer the health system (by, for example, policy determination and regulation); the financing institutions (such as social insurance and private insurance funds); and organisations generating different inputs, from human resources (medical and nursing schools, for example) to medicines and other key inputs.
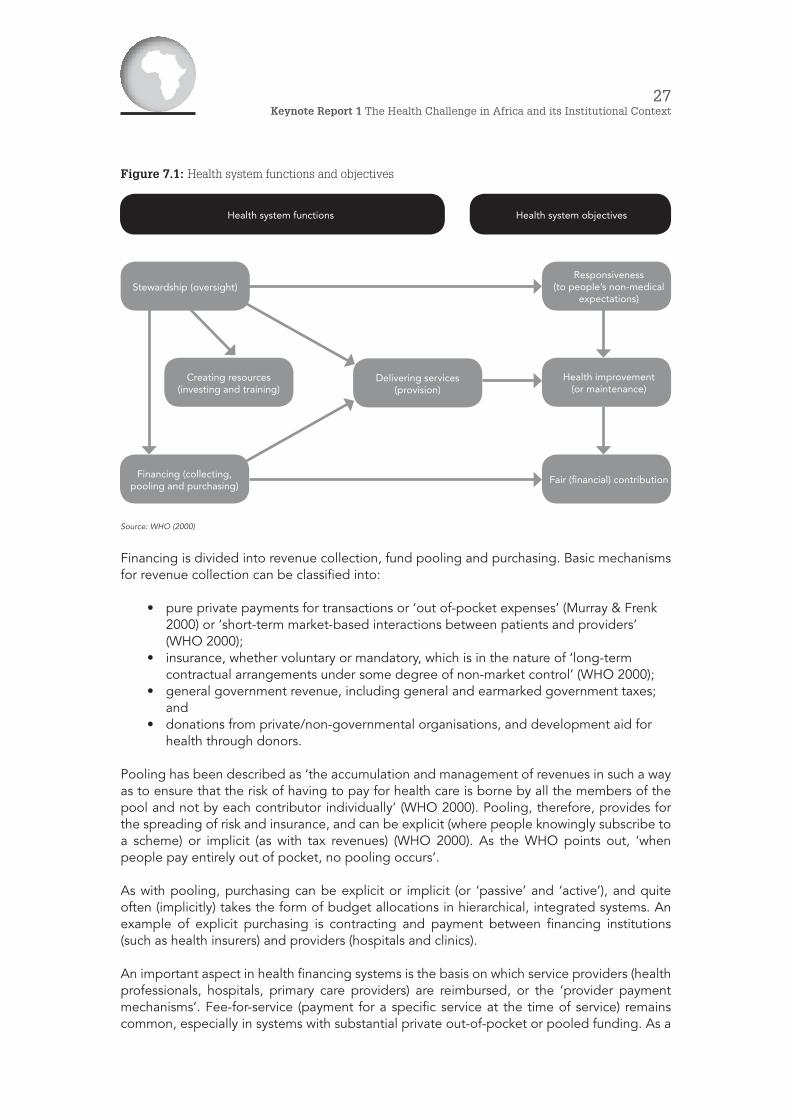
As set out in Figure 7.1, the key objectives of the health system are seen (usually) as improving or maintaining health, responding to people’s demands and needs, and ensuring fair financial contributions:
• improving health refers to increasing the average level of population health and reducing health inequalities within a population;
• responsiveness to the legitimate expectations of the population is divided into two major components, namely ‘respect for persons’ (including aspects like respect for dignity and respect for confidentiality) and ‘client orientation’ (including such aspects as prompt attention and access to basic amenities); and
• fairness is seen as addressing two components – firstly, people should not be subject to potentially catastrophic health costs as a result of seeking health care (in other words, there should be risk pooling) and, secondly, ‘poor households should pay less towards the health system than rich households’. (Murray & Frenk 2000)
Stewardship, which has been identified as a neglected aspect of the health system, is divided into six sub-functions:
• overall system design; • performance assessment; • priority setting; • inter-sectoral advocacy; • regulation; and • consumer protection. (Murray & Frenk 2000)
27Keynote Report 1 The Health Challenge in Africa and its Institutional Context
Figure 7.1: Health system functions and objectives
Source: WHO (2000)
Financing is divided into revenue collection, fund pooling and purchasing. Basic mechanisms for revenue collection can be classified into:
• pure private payments for transactions or ‘out of-pocket expenses’ (Murray & Frenk 2000) or ‘short-term market-based interactions between patients and providers’ (WHO 2000);
• insurance, whether voluntary or mandatory, which is in the nature of ‘long-term contractual arrangements under some degree of non-market control’ (WHO 2000);
• general government revenue, including general and earmarked government taxes; and
• donations from private/non-governmental organisations, and development aid for health through donors.
Pooling has been described as ‘the accumulation and management of revenues in such a way as to ensure that the risk of having to pay for health care is borne by all the members of the pool and not by each contributor individually’ (WHO 2000). Pooling, therefore, provides for the spreading of risk and insurance, and can be explicit (where people knowingly subscribe to a scheme) or implicit (as with tax revenues) (WHO 2000). As the WHO points out, ‘when people pay entirely out of pocket, no pooling occurs’.
As with pooling, purchasing can be explicit or implicit (or ‘passive’ and ‘active’), and quite often (implicitly) takes the form of budget allocations in hierarchical, integrated systems. An example of explicit purchasing is contracting and payment between financing institutions (such as health insurers) and providers (hospitals and clinics).
An important aspect in health financing systems is the basis on which service providers (health professionals, hospitals, primary care providers) are reimbursed, or the ‘provider payment mechanisms’. Fee-for-service (payment for a specific service at the time of service) remains common, especially in systems with substantial private out-of-pocket or pooled funding. As a
Stewardship (oversight)Responsiveness
(to people’s non-medical expectations)
Delivering services (provision)
Health improvement (or maintenance)
Fair (financial) contributionFinancing (collecting, pooling and purchasing)
Creating resources (investing and training)
Health system functions Health system objectives
28Value For Money in the Health Sector: Policy and Budget Planning
result of the incentive to over-service inherent in the fee-for-service model, various controls are needed in this environment, such as price regulation and co-payments where insurance plays a role.
An alternative to fee-for-service in the primary care environment is through capitation, ‘whereby health-care providers are paid a predetermined fee to cover all the health needs of each person registered with them. In the hospital environment fee-for-service can be replaced by a case-based system using some form of average of costs for specific services.’ One approach is to average cost according to diagnostically related groups. In such a system, ‘different pathologies are bundled into homogenous cost groups that are then ascribed an average treatment cost. A fixed reimbursement goes to the hospital regardless of how intensively it decides to treat patients or how long they stay there’. (WHO 2010b)
A slightly different approach to classifying health care financing is employed by Borowitz et al. (1999). They identify five different levels of the ‘resource allocation decision’, which point to the key decisions societies must make in allocating health resources. As with pooling and purchasing, these decisions often are not made explicitly but can be the aggregated results of a range of other decisions and activities. The decisions identified by Borowitz et al. relate to:
• the overall level of government resources to allocate to the health sector; • the geographical distribution of resources across regions; • allocation across ‘levels of the health care system’, including ‘primary health care,
outpatient speciality care and diagnostic tests, inpatient care, public health, education and research, capital, and administration’;
• allocation to the different health facilities at each level; and • allocation across inputs and outputs within each health facility.
The creation of resources (or resource generation) in Figure 7.1 refers to ‘the production of inputs to health services, for example human resources, facilities and equipment, medicines and knowledge or research’. Murray and Frenk (2000) include a range of organisations from ‘universities and other educational institutions, research centres, and companies producing specific technologies such as pharmaceutical products, devices and equipment’.
Delivering services (or service provision) in Figure 7.1 refers to ‘the combination of inputs into a production process that takes place in a particular organisational setting and that leads to the delivery of a series of interventions’ (Murray and Frenk 2000). A useful distinction is made between personal health services, ‘consumed directly by an individual’, and non-personal health services, ‘actions that are applied either to collectivities (e.g. mass health education) or to the non-human components of the environment (e.g. basic sanitation)’.
7.2 Generalisations about health system types
Countries differ significantly in terms of how organisations and institutions are structured in order to fulfil the above health functions. As Kutzin (2000) indicates, ‘often health systems are described by their predominant source of funding’. Although this has been found to be inadequate because there are other critical differentiators of health systems, it is often a good place to start. In this vein, the WHO (2000) identifies ‘a few basic designs that emerged and have been refined since the late 19th century’.
• The first model can be referred to as a ‘social insurance’ or ‘Bismarckian’ system. The WHO traces its origin to the late 19th century. Such systems aim ‘to cover all or most citizens through mandated employer and employee payments to insurance or sickness funds, while providing care through both public and private providers’.

29Keynote Report 1 The Health Challenge in Africa and its Institutional Context
• The second model refers to ‘national health systems’ or a ‘general tax-funded Beveridge system’ (Kutzin 2000), which is ‘slightly more recent’ in origin and in which planning and financing is centralised, ‘relying primarily on tax revenues and on public provision. Resources are traditionally distributed by budgets, sometimes on the basis of fixed ratios between populations and health workers or facilities.’ (WHO 2000)
• A third or ‘mixed model’ has more limited but still substantial state involvement, ‘sometimes providing coverage only for certain population groups and giving way for the rest of the populace to largely private finance, provision and ownership of facilities’.
As the WHO (2000) points out, ‘relatively pure examples, in which one or another model accounts for the bulk of resources or provision, are found mostly in rich countries; health systems in middle income countries, notably in Latin America, tend to be a mixture of two or even all three types’.
Figure 7.2: Broad types of health systems
Source: WHO (2000)
Moving beyond the simplicity of a three-way typology of health systems, Figure 7.3 shows some of the complexities in actual health systems by classifying specific country systems in terms of the three financing functions and in terms of composition of service providers. Figure 7.4 (providing an assessment for Argentina) reveals some additional complexity by pointing out that in the government sphere different levels of government play a role, and on the social insurance and private side there are personal health insurance and out-of-pocket payments.
National social health insurance
National health system
Universal coverage through mandated employer and employee payments to insurance or sickness funds while providing care both through the public
and private sector
Centralised state planning and financing, relying primarily on tax revenues and on public provision, resources distributed by budgets
Mixed health system
Substantial state financing and service delivery for some groups with the rest of the population relying on private financing, provision and ownership of facilities

30Value For Money in the Health Sector: Policy and Budget Planning
Figure 7.3: Characteristics of selected country health systems focusing on financing
(revenue collection, pooling, purchasing) and service provision
Note: Widths are proportional to estimates flows of funds.
Source: WHO (2000)
In Africa, country governments would generally not play as significant a role in either financing or provision as in the United Kingdom, and the insurance component would not be as significant as in Chile. Thus, most African countries would look more like Egypt and Bangladesh, with the government an important source of health financing, but with modest or insignificant social insurance; there would also be little private insurance but significant private spending, of which an important component is out-of-pocket expenditure. Donor funding is also significant in most African countries and is substantial in some countries (see Section 7.3 and Kirigia et al. 2006).
Private providers
Private providers
Private providers
Private providers
General taxation
General taxation
General taxation
General taxation
Out-of-pocket
Out-of-pocket
Out-of-pocket
Out-of- pocket
Ministry of Health
Health authorities
Other
Public Health Insurance Fund (FONASA)
Private Insurance Fund (ISAPREs)
Pri
vate
Insu
ranc
e
Ministry of Health M
inis
try
o
f H
ealt
h
Ministry of Health
Ministry of Health
Ministry of Health
Other governmental
Oth
er
go
vern
men
tal
Oth
er
go
vern
men
tal
Oth
er
go
vt.
No Pooling
Individual purchasing
No Pooling
Individual purchasing
No Pooling
Individual purchasing
No Pooling
Individual purchasing
National Health Service
National Health Service
United Kingdom (1994/95)
Chile (1991–1997)
Egypt (1994/95)
Bangladesh (1996/97)
Social insurance
Social insurance
Soci
al
insu
ranc
e
GPs
Soci
al
insu
ranc
e
Soci
al
insu
ranc
e
Donors
Do
nors
Revenuecollection
Pooling
Purchasing
Provision
Revenuecollection
Pooling
Purchasing
Provision
Revenuecollection
Pooling
Purchasing
Provision
Revenuecollection
Pooling
Purchasing
Provision

31Keynote Report 1 The Health Challenge in Africa and its Institutional Context
Figure 7.4: Financing and provision of health care in Argentina
Nat(2%)
Provincial(16%)
MUN(4%)
OSN(16%)
OSP(9%)
PAMI(9%)
PHI(16%)
OOP(28%)
General Taxation (2.2%)
Contrib. Social Insurance (34%)
Private Payments(44%)
Source: Cavagnero et al. (2006)
7.3 Sources of health spending in Africa
Government versus private
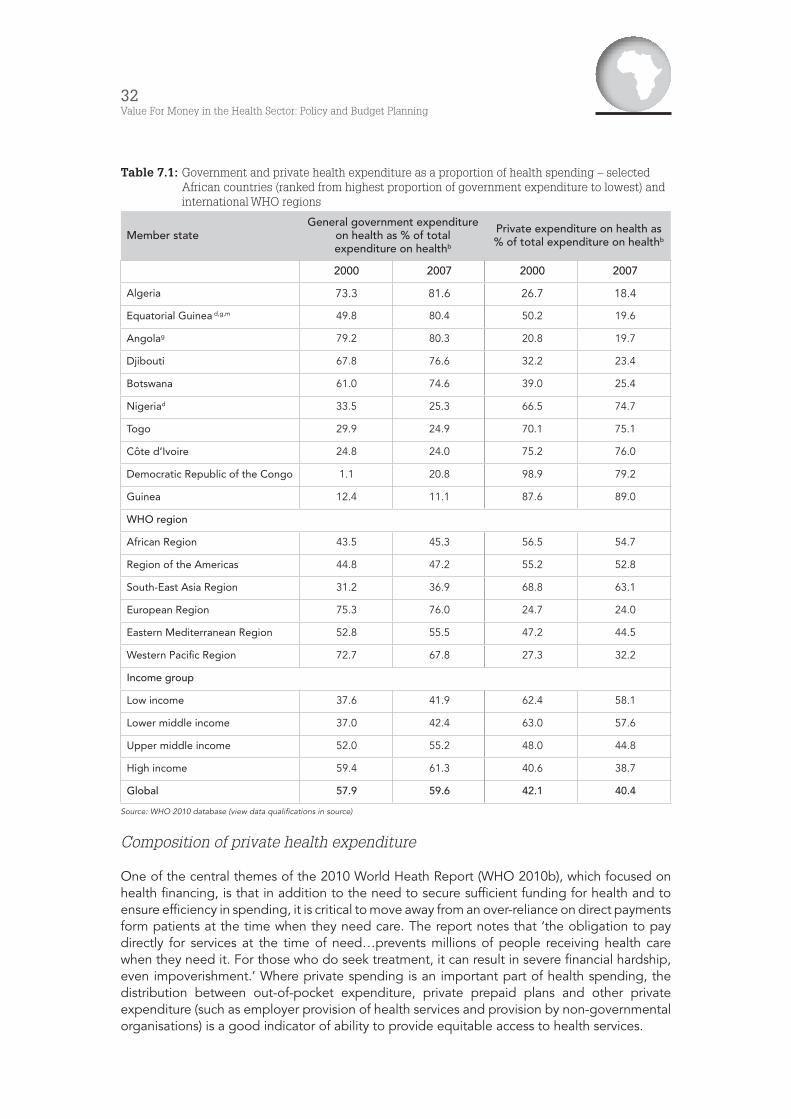
On average in 2007, general government expenditure contributed 45% to total health spending in Africa, and private spending contributed 55% (Table 7.1). Except for the South-East Asia region of the WHO (where private spending contributed 63%), this was the highest contribution of private spending from all WHO regions.
In 14 African countries, private expenditure made up more than 60% of health expenditure, in 27 between 30% and 59%, and in 10 between 0% and 29%. In Nigeria and Côte d’Ivoire, for example, private spending amounted to three-quarters of all health spending. The general conclusion remains that while the government plays a very large role in most African health systems, private payments, and to a large extent out-of-pocket payments (see below), are higher.
Social security spending on health as a proportion of government health expenditure
In 2007, 26 out of 51 WHO African members had no social security mechanisms (compulsory prepaid social insurance schemes, such as national or social health insurance) providing for health spending, implying that in these countries all government spending is from general government revenues. Six countries – Algeria, Egypt, Morocco, Tunisia, Cape Verde and Ghana – had social security schemes contributing more than 25% of government health spending. Ghana had the largest proportion of government expenditure coming from social security funds (48.6%), following the introduction of the National Health Insurance Act in 2003.
Public facilities SHI facilitiesPrivate
providers
32Value For Money in the Health Sector: Policy and Budget Planning
Table 7.1: Government and private health expenditure as a proportion of health spending – selected African countries (ranked from highest proportion of government expenditure to lowest) and international WHO regions
Member stateGeneral government expenditure
on health as % of total expenditure on healthb
Private expenditure on health as % of total expenditure on healthb
2000 2007 2000 2007
Algeria 73.3 81.6 26.7 18.4
Equatorial Guinea d,g,m 49.8 80.4 50.2 19.6
Angolag 79.2 80.3 20.8 19.7
Djibouti 67.8 76.6 32.2 23.4
Botswana 61.0 74.6 39.0 25.4
Nigeriad 33.5 25.3 66.5 74.7
Togo 29.9 24.9 70.1 75.1
Côte d’Ivoire 24.8 24.0 75.2 76.0
Democratic Republic of the Congo 1.1 20.8 98.9 79.2
Guinea 12.4 11.1 87.6 89.0
WHO region
African Region 43.5 45.3 56.5 54.7
Region of the Americas 44.8 47.2 55.2 52.8
South-East Asia Region 31.2 36.9 68.8 63.1
European Region 75.3 76.0 24.7 24.0
Eastern Mediterranean Region 52.8 55.5 47.2 44.5
Western Pacific Region 72.7 67.8 27.3 32.2
Income group
Low income 37.6 41.9 62.4 58.1
Lower middle income 37.0 42.4 63.0 57.6
Upper middle income 52.0 55.2 48.0 44.8
High income 59.4 61.3 40.6 38.7
Global 57.9 59.6 42.1 40.4
Source: WHO 2010 database (view data qualifications in source)
Composition of private health expenditure
One of the central themes of the 2010 World Heath Report (WHO 2010b), which focused on health financing, is that in addition to the need to secure sufficient funding for health and to ensure efficiency in spending, it is critical to move away from an over-reliance on direct payments form patients at the time when they need care. The report notes that ‘the obligation to pay directly for services at the time of need…prevents millions of people receiving health care when they need it. For those who do seek treatment, it can result in severe financial hardship, even impoverishment.’ Where private spending is an important part of health spending, the distribution between out-of-pocket expenditure, private prepaid plans and other private expenditure (such as employer provision of health services and provision by non-governmental organisations) is a good indicator of ability to provide equitable access to health services.

33Keynote Report 1 The Health Challenge in Africa and its Institutional Context
In 2007, among African WHO members, 60% of private expenditure came from out-of-pocket expenditure in a context where about 55% of all health spending was privately financed. This provides an indication of a significant direct health expenditure burden (or ‘cost-sharing’) on private households. Societies reduce the burden and risk of out-of-pocket expenditure either by funding health expenditure to a greater extent from general government tax revenue or by setting up mechanisms for pre-payment and risk-pooling – through either public schemes (social security) or private pre-paid plans. As we have seen, social security mechanisms to fund health expenditure are not common in Africa, especially in sub-Saharan Africa. Private pre-paid plans also play a limited role in Africa. In only two countries do they form a significant part of private spending – in South Africa at 66.2% and in Namibia at 64.4%. In 11 countries, private pre-paid plans contribute between 10% and 30% of private expenditure, in 20 countries between 0% to 9%, and in 18 countries there was no evidence of private pre-paid plans (WHO 2010 database).
External funding/development assistance for health
External sources play an important role in funding health services in a large proportion of African countries. Based on the WHO 2010 database, in 2007, five countries – Niger, Malawi, Mozambique, Liberia and Rwanda – were dependent on external sources for more than 50% of their health spending. A further nine countries funded between 30% and 50% of health spending from external sources, and 18 between 10% and 30%. Nineteen countries relied for less than 10% of health expenditure on external assistance.
The IHME (2010c) concludes that:
The relative share of DAH for sub-Saharan Africa has grown to the point where that region now receives more funding than all other regions combined. In 1990, sub-Saharan Africa received 10% of DAH, and from 1997 to 2000, sub-Saharan Africa actually received a smaller share of DAH than Latin America. By 2008, though, its share had grown to 29%, representing $6.92 billion. This growth primarily reflects the continued rise in funding for HIV/AIDS.
The IHME (2010c) further concludes that:
Over the past decade, the top health priorities for global health leaders have been HIV/AIDS, tuberculosis, and malaria, and this has been reflected in DAH [direct aid for health] funding patterns. Beginning with events such as the first Women Deliver conference in 2007, though, there has been a move to increase funding for maternal, newborn, and child health (MNCH) programs. More recently, the United Nations (UN) and other organizations have raised concerns about the emergence of non-communicable diseases (NCDs), such as cancer, heart disease, and diabetes, as a more prominent issue in the developing world. This is partly the result of economic improvements and reductions in the mortality of children and adults. As people live longer, their likelihood of developing a chronic disease increases.
While the evidence shows that DAH continues to grow, though at a slower pace, our analysis also raises questions about whether DAH is always aligned with need, as seen in the relationship between DAH and disability adjusted life years. Some countries with relatively low disease burdens continue to receive disproportionately high amounts of DAH, while some countries with greater disease burdens receive less.

34Value For Money in the Health Sector: Policy and Budget Planning
7.4 Policy and reform issues in Africa
Africa is confronting a growing and changing disease burden with limited financial and other resources. In addition, African health systems (the combination of organisations and institutions that need to confront the challenge and mesh resources to together) have failed to respond adequately to changing demands. The result is lagging health outcomes, which impact negatively on poverty and development prospects.
For health and finance ministries, the challenge is to find and agree on the reform options or policy alternatives that they should jointly advance to improve the prospects of coming to terms with the health challenges. There is general agreement that while increased financing and more resources are needed, these are often outside the control of governments (see Kutzin 2000), and also that increased funding will not be effective if it is not utilised efficiently.
The options for reform are myriad and a first challenge for moving forward is to achieve some agreement on the conceptual framework for thinking about reform options. This paper has set out the results framework, provided tools for assessing the disease burden, outlined the key functions of health systems and described in broad terms how health systems differ. This section briefly summarises a number of approaches to identifying reform options. It also refers to components of the public financial management cycle and budget reform, a key area of reform driven in recent decades by finance ministries.
Policy levels and reform components
Frenk (1994) adopts a comprehensive approach towards the ‘repertoire of policy options’. He identifies four sub-components of health reform, each corresponding to a specific policy level identified in Box 7.1.Source: Frenk (1994)
Frenk (1994) stresses that all four components of reform are interrelated and that, therefore, ‘a
comprehensive strategy must contemplate all four levels’. He, however, points out that while at some stages change at certain levels might be impossible or impolitic, it may still be possible to make progress at other levels. An ‘all or nothing approach’ is not necessary, although the interrelationships between the different levels have to be assessed and can become an obstacle to reform if a holistic view is not taken.
Box 7.1: Components of reform and policy levels
1. Restructuring or redesign at the systemic level - roles and responsibilities of main actors (for example, ‘principle for population eligibility, the public/private mix, public agencies involved’)
2. Reorientation or reprogramming (reprioritisaton) at the programmatic level for allocative efficiency
3. Reorganisation at the organisational level for technical efficiency (enhancing productivity)
4. Reinforcement at the instrumental level through information systems, research, technological development, human resource development
35Keynote Report 1 The Health Challenge in Africa and its Institutional Context
Macro- and microeconomic policies to improve value for money
The OECD (2010a), specifically in the context of value for money in health, distinguishes between two broad types of reform, namely macroeconomic policies to contain expenditure and microeconomic reforms on the demand and supply side to improve efficiencies. A differentiation is also made between these two broad ‘strategies’ (see Box 7.2):
• ‘short-term policies, aimed at expenditure restraints and largely operating through regulatory controls of a top-down nature’; and
• ‘long-term policies, aimed at increasing efficiency mainly by enhancing the incentives facing patients, providers and regulators’. (OECD 2010b)
Typical short-term or ‘command-and-control’ policies can hold expenditures down in the short term; however:
they do little or nothing to moderate the underlying pressures which are pushing health spending up over the medium-term. The experience of countries which promptly reduced health expenditure after previous recessions suggests that the reductions in health spending that follow the intensification of such policies are short-lived. It is even possible that measures taken to restrict costs in the short run can increase long-run spending – if necessary investments are delayed and desirable prevention policies are not implemented. (OECD 2010b)
Source: OECD 2010a&b
Health financing reform and eliminating waste
Focusing on the financing of health services and noting that according to various estimates ‘20–40% of all health spending is wasted through inefficiency’, the WHO (2010b) identifies three ‘health financing challenges’:
• to raise sufficient money for health by enhancing the effectiveness of revenue collection, the reprioritisation of budgets, innovative financing and the development and focus of aid for health;
Box 7.1: Macro- and microeconomic reforms to promote value for money in health
1. Macroeconomic policies aimed at expenditure restraint – wage and price control – budget caps – cost-shifting to private sector
2. Macroeconomic policies for efficiency 2.1 Demand side (disease prevention and health promotion; gate keeping/triaging;
care co-ordination; better patient/doctor contact; access to a PC doctor out-of-office hours)
2.2 Supply side (further shift from hospital to ambulatory care; enhancing the role of health-care purchasers; improving payment methods/incentives for hospitals; overseeing technological change and the pricing of medical goods; increases use of ICT for information transmission)

36Value For Money in the Health Sector: Policy and Budget Planning
• to remove the financial risks and barriers to access by moving to a system of prepayment and pooling of funds; and
• to improve the use of available sources.
The WHO (2010b) provides a long inventory of waste, which can be summarised in five broad categories:
• wasteful use of medicines and other health care products and services; • unmotivated health workers and inappropriate or costly skills mix; • wasteful health care services through inappropriate hospital admissions and length of
stay, inappropriate hospital size, medical errors and sub-optimal quality; • corruption and fraud; • the wrong mix of health interventions and inappropriate strategies.
While the inventory of interventions (‘direct and practical ways to reduce waste…[for] policy-makers to draw on according to their own needs, recognizing that there may be other opportunities in their own setting’) is lengthy, it can be distilled into the areas of information and training, regulation and monitoring, and incentives. With regard to incentives to promote efficiency, the following are identified:
• improved provider payment systems; • better remuneration of health care workers; • increased active purchasing; and • avoidance of fragmentation of funding flows.
While controls and co-payments have been introduced extensively to work against the tendency of over-servicing in a fee-for-service environment, these have limitations that lie behind the movement to capitation (a pre-determined fee to cover all the health needs of a person registered with a provider) in primary care settings and case-based systems in hospital services. A case-based system refers to the payment of an average amount for a specific type of case, irrespective of the actual cost of the case. In a diagnostic-related group system of reimbursement, different disease categories and interventions are placed in ‘homogenous cost groups that are then ascribed an average treatment cost. A fixed reimbursement goes to the hospital regardless of how intensively it decides to treat patients or how long they stay there’ (WHO 2010b).
Referring to the example of low salaries in the public sector leading to moonlighting by staff, the WHO (2010b) warns that ‘reducing inefficiency does not necessarily require reducing expenditure; inefficiency can result from insufficient, rather than too much, spending’.
Key system reforms in the context of a centralised system
More focused than the foregoing analyses, Ensor and Ronoh (2005) aim to assess the impact of organisational changes on the delivery of reproductive services. They place these organisational changes or reforms in the context of a ‘stylized schema of a historic centralised health system’ (see Figure 7.5). Some characteristics of such a centrally planned and financed system (the basis for systems in many low-income countries, as they point out) are:
• government financing and provision of services in government facilities in a bureaucratic and hierarchical system, implying direct control of central bureaucracies over service providers, centralised planning and restrictions (for example, on remuneration policy for providers);
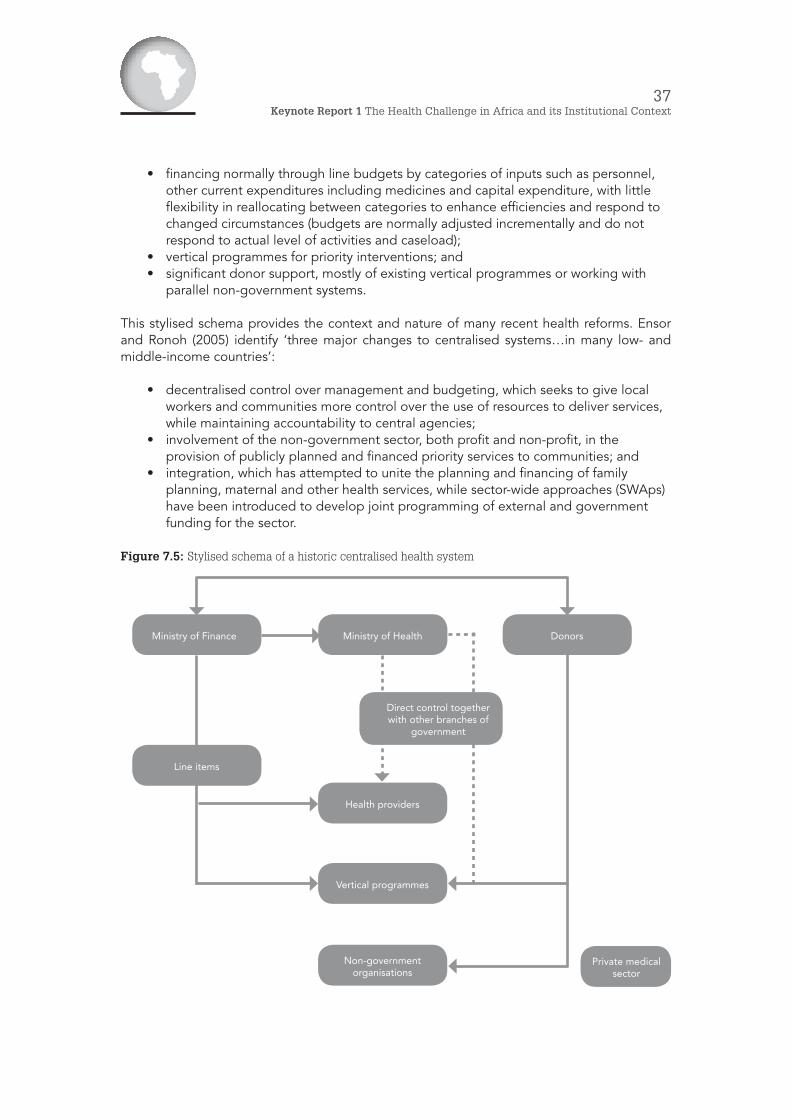
37Keynote Report 1 The Health Challenge in Africa and its Institutional Context
• financing normally through line budgets by categories of inputs such as personnel, other current expenditures including medicines and capital expenditure, with little flexibility in reallocating between categories to enhance efficiencies and respond to changed circumstances (budgets are normally adjusted incrementally and do not respond to actual level of activities and caseload);
• vertical programmes for priority interventions; and • significant donor support, mostly of existing vertical programmes or working with
parallel non-government systems.
This stylised schema provides the context and nature of many recent health reforms. Ensor and Ronoh (2005) identify ‘three major changes to centralised systems…in many low- and middle-income countries’:
• decentralised control over management and budgeting, which seeks to give local workers and communities more control over the use of resources to deliver services, while maintaining accountability to central agencies;
• involvement of the non-government sector, both profit and non-profit, in the provision of publicly planned and financed priority services to communities; and
• integration, which has attempted to unite the planning and financing of family planning, maternal and other health services, while sector-wide approaches (SWAps) have been introduced to develop joint programming of external and government funding for the sector.
Figure 7.5: Stylised schema of a historic centralised health system
Ministry of Finance Ministry of Health Donors
Direct control together with other branches of
government
Health providers
Vertical programmes
Line items
Private medicalsector
Non-government organisations
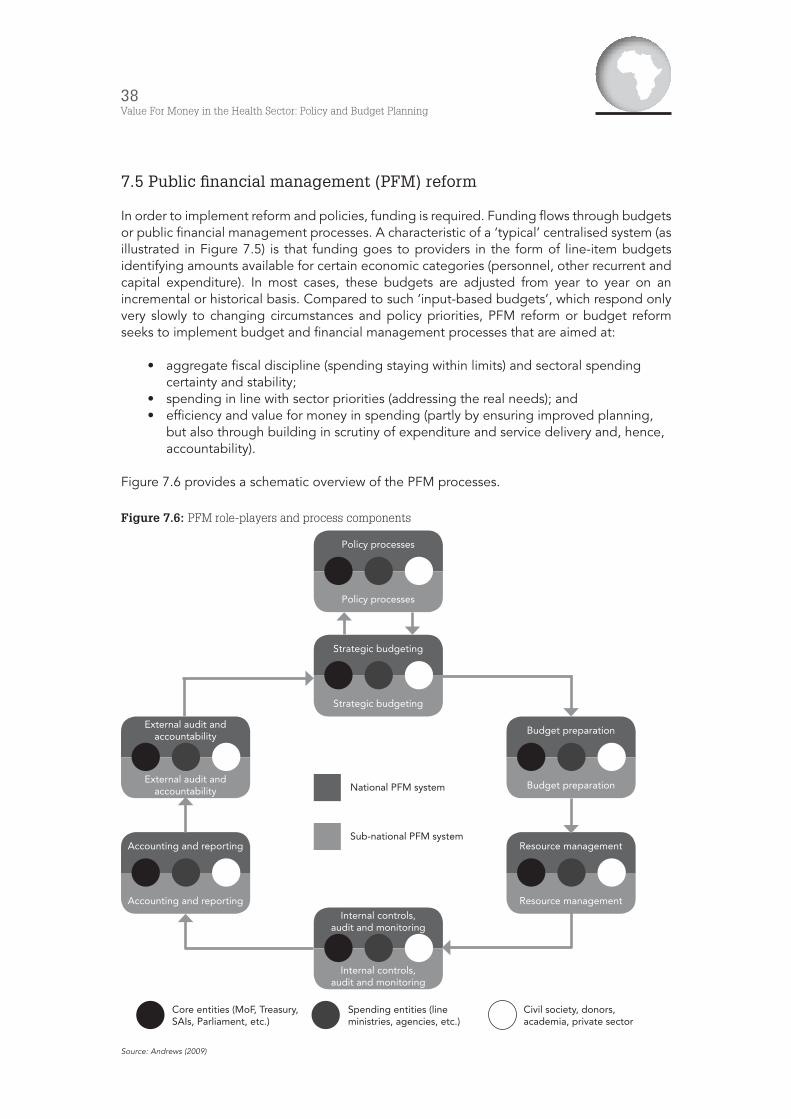
38Value For Money in the Health Sector: Policy and Budget Planning
7.5 Public financial management (PFM) reform
In order to implement reform and policies, funding is required. Funding flows through budgets or public financial management processes. A characteristic of a ‘typical’ centralised system (as illustrated in Figure 7.5) is that funding goes to providers in the form of line-item budgets identifying amounts available for certain economic categories (personnel, other recurrent and capital expenditure). In most cases, these budgets are adjusted from year to year on an incremental or historical basis. Compared to such ‘input-based budgets’, which respond only very slowly to changing circumstances and policy priorities, PFM reform or budget reform seeks to implement budget and financial management processes that are aimed at:
• aggregate fiscal discipline (spending staying within limits) and sectoral spending certainty and stability;
• spending in line with sector priorities (addressing the real needs); and • efficiency and value for money in spending (partly by ensuring improved planning,
but also through building in scrutiny of expenditure and service delivery and, hence, accountability).
Figure 7.6 provides a schematic overview of the PFM processes.
Figure 7.6: PFM role-players and process components
Source: Andrews (2009)
Policy processes
Policy processes
Strategic budgeting
Strategic budgeting
External audit and accountability
External audit and accountability
Budget preparation
Budget preparation
Accounting and reporting
Accounting and reporting
Resource management
Resource managementInternal controls,
audit and monitoring
Internal controls, audit and monitoring
National PFM system
Sub-national PFM system
Core entities (MoF, Treasury, SAIs, Parliament, etc.)
Spending entities (line ministries, agencies, etc.)
Civil society, donors, academia, private sector

39Keynote Report 1 The Health Challenge in Africa and its Institutional Context
Andrews (2007) explains ‘strategic budgeting’ as referring to the ‘policy-budget connection’ and determination of the resource envelope and ceilings. As can be seen in Figure 7.6, strategic budgeting is ideally fed from policy processes, which include ‘national and sectoral policy review and development processes’. For ‘policy effectiveness’, it is important to have ‘an effective link between policy and budgeting’ (Fölscher 2006).
This policy-budget interface is critical for a dialogue between health and financing ministries. In both ‘spheres’ (sectoral policy and central finance reform), there have been extensive reforms and tool development. Data and tools for assessing options have multiplied in the health sector. At the same time, PFM reform has proceeded in Africa ( Folscher 2006) and quite often has driven sectoral reforms in planning.
8. Conclusion
Africa faces a large and changing disease burden, with some commentators referring to a quadruple challenge – in addition to a continuing communicable disease burden and growing prevalence of non-communicable diseases, the continent is confronting the HIV/AIDS epidemic, and a high incidence of injury adds to the demand for health services.
Africa has to face this challenge with limited resources and health systems that have not developed dynamically and purposefully to address the demand. While resource scarcity is a significant problem, resources are often not used efficiently and, consequently, impacts are not being maximised.
Extensive advice is available about the reforms required to enhance value for money, and a long menu of policy options exists. Recently, the WHO (2010b) and the OECD (2010a, 2010b) set out inventories in this regard. In addition, and for some time, a wide and continuing range of experiences with health system reform across the world has been focused on improving both equity and efficiency in health care delivery. The literature provides many examples and approaches to classifying the options.
High-level reforms that have often been prescribed and implemented, also in Africa, are:
• the reform of financing systems (in order to extend sources of financing, to increase prepayment and risk-pooling and to enhance incentives for efficiency);
• restructuring the responsibilities of the public and the private sector in the health system;
• giving greater autonomy and accountability to service providers, with lower levels of government control (decentralisation); and
• increased co-ordination between different sources of financing (such as governments and donors) and greater integration of programmes.
In addition to these high-level reforms, which have been referred to as ‘macro-financial’, various ‘micro-level management reforms’ have been implemented (Frenk 2006). Indeed, going forward in defining the value for money in health agenda in Africa, it will be important to distinguish between the different levels of health system change or reform, finding the most effective entry points and keeping in mind the relationships between the different levels of reform. Frenk’s (1994) distinction between systemic changes (restructuring), programmatic changes (reorientation), organisational change (reorganisation) and institutional intelligence and support (reinforcement) is helpful in this regard.

40Value For Money in the Health Sector: Policy and Budget Planning
Countries in Africa have also experimented with reform at a number of levels and there is now a rich experience that can be utilised to inform future health/finance dialogues. Especially in the area of financing reforms, there is a range of more and less successful, and recent and longer-lived, experiments with prepayment and pooling systems (notably social and community health insurance), with increasing use of private sector delivery and with changing budgeting and reimbursement systems in the health sector. These financing strategies (the subject of the second CABRI health finance dialogue) rely strongly on management and monitoring and information systems, underlying the importance of the planned third CABRI health/finance dialogue, which is to focus on these issues.
41Keynote Report 1 The Health Challenge in Africa and its Institutional Context
References/BibliographyBarbiero V (2006) Africa health trends: A 21st century imperative. Washington DC: Woodrow
Wilson International Center for Scholars.
Barry S & Mensah O (2005) Health development planning in the African Region: A status report. African Health Monitor 6(1): 9–12.
Beattie A, Doherty J, Gilson Lucy, Lambo E & Shaw P (eds) (1996), Sustainable health care financing in southern Africa: Papers from an EDI Health Policy Seminar held in Johannesburg, South Africa. Washington DC: World Bank.
Borowitz M et al. (1999) Program report: Conceptual foundations for Central Asian republic health reform model. Almaty: ABT Associates for USAID.
Cavagnero E, Carrin G, Xu K & Aguilar-Rivera A (2006) Health financing in Argentina: An empirical study of health care expenditure and utilization. Working Papers: Innovations in Health Financing 8. Fundación Mexicana para la Salud, A. C./Instituto Nacional de Salud Pública.
Chatora R (2005) Healthcare financing in the African region. African Health Monitor 6(1): 13–16.
Chunling L, Schneider M, Gubbins P, Leach-Kemon K, Jamison D & Murray C (2010) Public financing of health in developing countries: A cross-national systematic analysis. The Lancet 375(9 723): 1 375–87.
Clarke G & Ostrowski C (2009) Improving ministry of health and ministry of finance relationships for increased health funding. Global Health Initiative Policy Brief. Washington DC: Woodrow Wilson International Center for Scholars.
Ensor T & Ronoh J (2005) Impact of organizational change on the delivery of reproductive services: A review of the literature. The International Journal of Health Planning and Management 20(3): 209–25.
Frenk J (1994) Dimensions of health system reform. Health Policy 27(1): 19–34.
Frenk J (2006) Bridging the divide: Global lessons from evidence-based health policy in Mexico. The Lancet 368(9 539): 954–961.
Folscher (2006), Introduction: African Experience with Budget Reform, in OECD Journal on Budgeting, Volume 6 number 2
Gilson L & Mills A (1995) Health sector reforms in sub-Saharan Africa: Lessons of the last 10 years. Health Policy 32: 215–43.
Gilson Let al. (2003) The SAZA study: Implementing health financing reform in South Africa and Zambia. Health Policy and Planning 18(1): 31–46.
Gunilla B et al. (2008) Health systems and the right to health: An assessment of 194 countries. The Lancet 372(9 655): 2 047–85.
Horton R (2001) Ghana: defining the African challenge. The Lancet 358: 2 141–49.
IHME (Institute for Health Metrics and Evaluation) (2010a) Building momentum: Global progress towards reducing maternal and child mortality. Washington DC: IHME.
IHME (2010b) Global burden of diseases, injuries, and risk factors study 2010. Available at: http://www.healthmetricsandevaluation.org/research/project/global-burden-diseases-injuries-and-risk-factors-study-2010. Accessed 3 March.
IHME (2010c) Financing global health 2010: Development assistance and country spending in economic uncertainty. Seattle: IHME.
42Value For Money in the Health Sector: Policy and Budget Planning
IFC (International Finance Corporation) (2007) The business of health in Africa: Partnering with the private sector to improve people’s lives. Washington DC: IFC.
Kaseje D (2006) Health care in Africa: Challenges, opportunities and an emerging model for improvement. Washington DC: The Woodrow Wilson International Center for Scholars.
Kirigia J, Preker A, Carrin G, Mwikisa C & Diarra-Nama A (2006) An overview of health financing patterns and the way forward in the WHO African region. East African Medical Journal 83(9) September (Supplement).
Kirigia J & Barry S (2008) Health challenges in Africa and the way forward. International Archives of Medicine 1(1): 27.
Kutzin J (2000) Towards universal health care coverage: A goal-oriented framework for policy analysis. GPE Discussion Paper. Geneva: WHO.
Lopez A, Mathers C, Ezzati M, Jamison D & Murray C (eds) (2006) Global burden of disease and risk factors. Washington DC: World Bank.
McIntyre D, Gilson L & Mutyambizi V (2005) Promoting equitable health care financing in the African context: Current challenges and future prospects. Equinet Discussion Paper (27).
Murray C & Frenk J (2000) A framework for assessing the performance of health systems. Bulletin of the World Health Organisation 78(6): 717–31.
Osewe P (2006) Strengthening the role of the private sector in expanding health coverage in Africa. Washington DC: Woodrow Wilson International Center for Scholars.
Organisation for Economic Co-operation and Development (OECD) (2010a) Value for money in health spending. OECD Health Policy Studies. Paris: OECD.
OECD (2010b) Health system priorities when money is tight. OECD health ministerial meeting. Paris: OECD.
Rajaratnam J et al. (2010a) Worldwide mortality in men and women aged 15–59 years from 1970 to 2010: A systematic analysis. The Lancet 375(9 727): 1 704–20.
Rajaratnam J et al. (2010b) Neonatal, postneonatal, childhood, and under-5 mortality for 187 countries, 1970–2010: A systematic analysis of progress towards Millennium Development Goal 4. The Lancet 375(9 730): 1 988–2 008.
Rusa L, Schneidman M, Fritsche G & Musango L (2009) Rwanda: Performance-based financing in the public sector. In Eischler et al. (eds) Performance incentives for global health: Potential and pitfalls. Washington DC: Center fro Global Development.
UNDP (United Nations Development programme) (2010) Human development report 2010. New York: Palgrave Macmillan.
World Bank (1993) World development report 1993: Investing in health. Washington DC: World Bank.
WHO (World Health Organisation) (2000) World health report 2000. Health systems: Improving performance. Geneva: WHO.
WHO (2005) World health report 2005: Make every mother and child count. Geneva: World Health Organisation.
WHO (2006a) Health situation analysis in the African Region: Basic indicators 2006. Brazzaville: WHO, Regional Office for Africa.
WHO (2006b) The African regional health report: The health of the people. Brazzaville: WHO, Regional Office for Africa.
43Keynote Report 1 The Health Challenge in Africa and its Institutional Context
WHO (2006c) The world health report 2006: Working together for health. Geneva: WHO.
WHO (2007) Everybody’s business: Strengthening health systems to improve health outcomes – WHO’s framework for action. Geneva: WHO.
WHO (2010a) World health statistics 2010. Geneva: WHO.
WHO (2010b) World health report 2010: Health systems financing – the path to universal coverage. Geneva: World Health Organisation.
GIZ does not necessarily share the views expressed in this publication. Responsibility for this content rests entirely with CABRI.
This publication has been produced with the kind assistance of the German Federal Ministry for Economic Cooperation and Development (BMZ) through the Deutsche Gesellschaft für Internationale Zusammenarbeit (GIZ) GmbH.