health co-benefits and transportation-related reductions ... · pdf filehealth co-benefits and...
TRANSCRIPT

Health Co-Benefits and Transportation-Related Reductionsin Greenhouse Gas Emissions in the Bay Area
Neil Maizlish, PhD, MPH, Epidemiologist
California Department of Public HealthCenter for Chronic Disease Prevention and Health Promotion
Presented at the Public Health Working Groupof the Climate Action Team, Sacramento
November 28, 2011

BackgroundGreen House Gas Emissions• California’s motorized transport sector accounts for 38% of
greenhouse gas emissions, GHG (179 MMT CO2E in 2003) Personal passenger vehicles account for 30% (79% of 38%)
• Pathways to reduce GHG emissions is through vehicle miles traveled Increased efficiency of fuel and vehicles Reducing vehicle miles traveled (less trips, mode switching
(SOV to mass transport), walking/bicycling (active transport)
• Facilitated through policy, programs, and projects impacting the built environment (housing, transportation, food production, etc.)
2
BackgroundHealth Status• Health status of a population is combined influence of biological and
environmental factors whose pathways traverse individuals, families, neighborhoods, communities, regions, and nations – social determinants of health
• Public health meets urban planning: policies and practice that influence the built environment (housing, transportation, infrastructure, economy) are key determinants of population health (Sustainable Communities, HiAP, AB32/SB375)
• Strategies to reduce GHG emissions influence the built environment in a way that impacts population health Do the strategies generate health co-benefits or harms? What strategies yield significant health co-benefits? How do we measure this?
3

Aims and Objectives of the Integrated Transport & Health Impact Model (I-THIM) aka Woodcock Health Co-Benefits Model*
• To estimate the health impacts of alternative strategies for reducing carbon dioxide emissions from transport. Lower carbon driving
• Lower carbon emission motor vehicles/fuels Increased active travel
• Replacing urban car and motorcycle trips with walking or bicycling.
4
* Woodcock J, Edwards P, Tonne C, Armstrong BG, Ashiru O, Banister D, et al. Public health benefits of strategies to reduce greenhouse-gas emissions: urban land transport. The Lancet 2009;374:1930-1943.
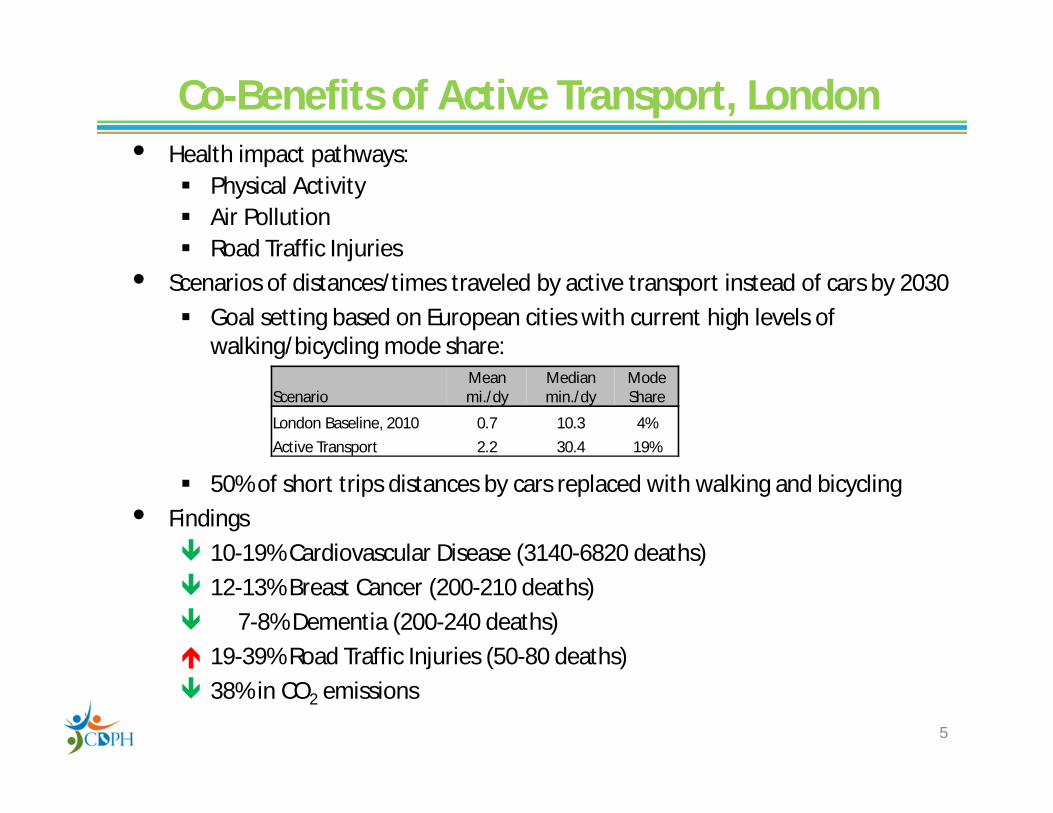
Co-Benefits of Active Transport, London• Health impact pathways:
Physical Activity Air Pollution Road Traffic Injuries
• Scenarios of distances/times traveled by active transport instead of cars by 2030 Goal setting based on European cities with current high levels of
walking/bicycling mode share:
50% of short trips distances by cars replaced with walking and bicycling• Findings
10-19% Cardiovascular Disease (3140-6820 deaths) 12-13% Breast Cancer (200-210 deaths) 7-8% Dementia (200-240 deaths) 19-39% Road Traffic Injuries (50-80 deaths) 38% in CO2 emissions
5
ScenarioMean mi./dy
Median min./dy
Mode Share
London Baseline, 2010 0.7 10.3 4%Active Transport 2.2 30.4 19%

Can Woodcock’s Active Transport Model Be Reproduced for Regional Transportation Plans in California?
California Department of Public Health:• Partner with MTC (regional MPO) and BAAQMD to apply
the I-THIM Health Co-Benefits Model of Active Transport to the Bay Area Test the feasibility Develop a tool kit and technical resources to assist
other MPOs apply the model to their geographic area
6

7
Methods for Assessing Health Outcomes for Active Transport
• Comparative Risk Assessment Disease Burden = Attributable Fraction × Disease Burden
↓Percent change in disease rates from BAU due
to shift in exposure distribution in the alternative scenario
•
RR is the relative risk of the health outcome at the given exposure level• For physical activity, exposure, x, is the hours per week spent in walking and
bicycling (and all other physical activity), • For air pollution, exposure, x, is the concentration of fine particulate matter
(PM2.5)• Burden of Disease
Disability Adjusted Life Year, DALY, is a measure of premature mortality and disability based on the years of life lost, YLL (years of expected life - age at death) + years lived with a disability, YLD
DALY = YLL + YLD
xxx
xxx
xxx
(BAU)Population
(Alt.)Population(BAU)PopulationAF
RR
RRRR
8
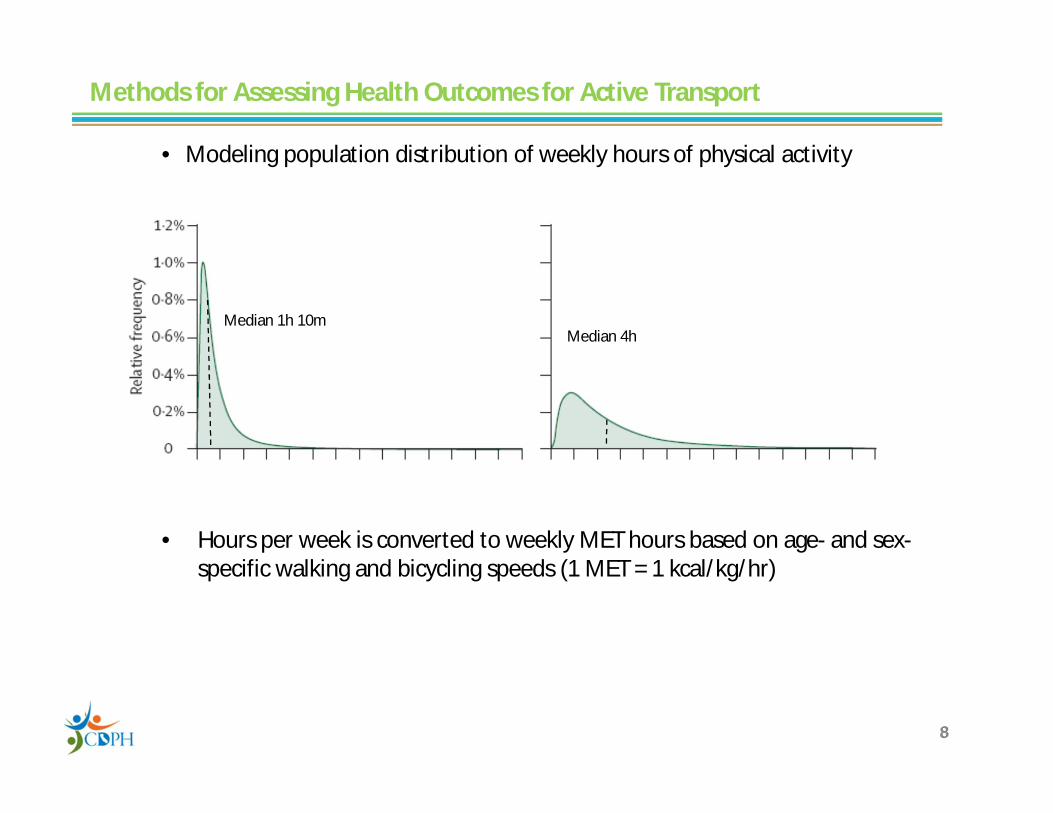
• Modeling population distribution of weekly hours of physical activity
• Hours per week is converted to weekly MET hours based on age- and sex-specific walking and bicycling speeds (1 MET = 1 kcal/kg/hr)
8
Methods for Assessing Health Outcomes for Active Transport
Hours per week Hours per week
Baseline Active Transport
Median 1h 10mMedian 4h
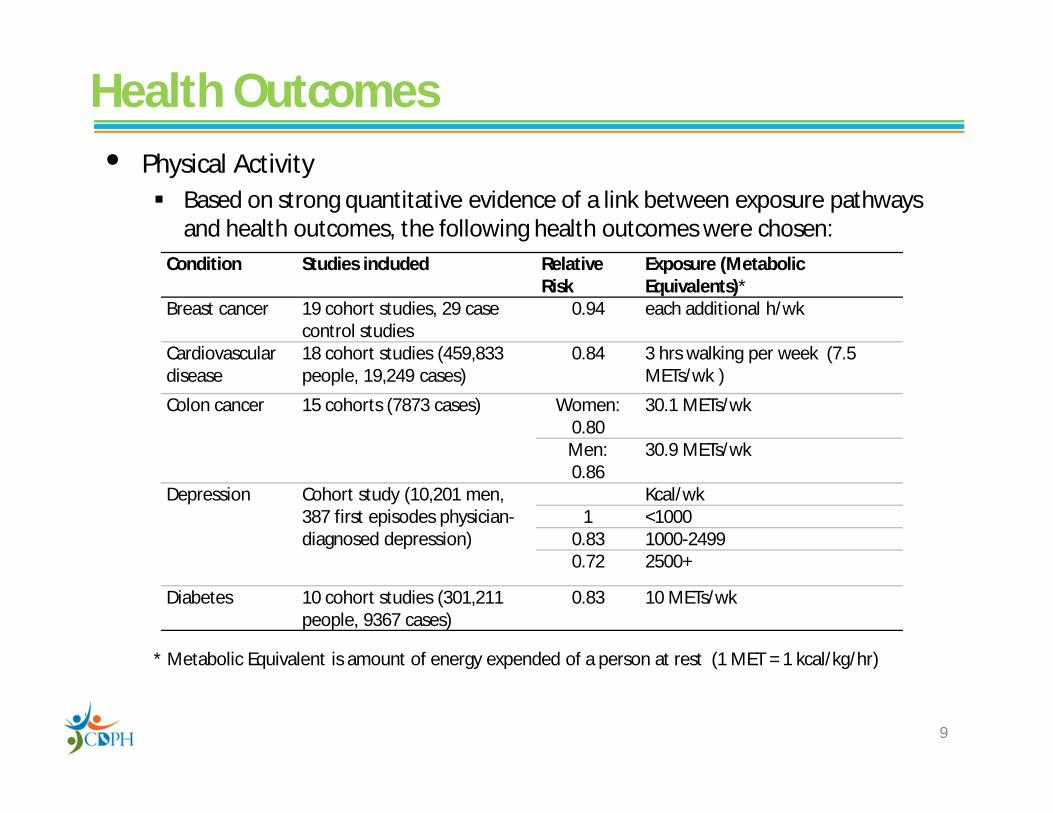
Health Outcomes• Physical Activity
Based on strong quantitative evidence of a link between exposure pathways and health outcomes, the following health outcomes were chosen:
* Metabolic Equivalent is amount of energy expended of a person at rest (1 MET = 1 kcal/kg/hr)
9
Condition Studies included Relative Risk
Exposure (Metabolic Equivalents)*
Breast cancer 19 cohort studies, 29 case control studies
0.94 each additional h/wk
Cardiovascular disease
18 cohort studies (459,833 people, 19,249 cases)
0.84 3 hrs walking per week (7.5 METs/wk )
Colon cancer 15 cohorts (7873 cases) Women: 0.80
30.1 METs/wk
Men: 0.86
30.9 METs/wk
Depression Cohort study (10,201 men, 387 first episodes physician-diagnosed depression)
Kcal/wk1 <1000
0.83 1000-2499 0.72 2500+
Diabetes 10 cohort studies (301,211 people, 9367 cases)
0.83 10 METs/wk
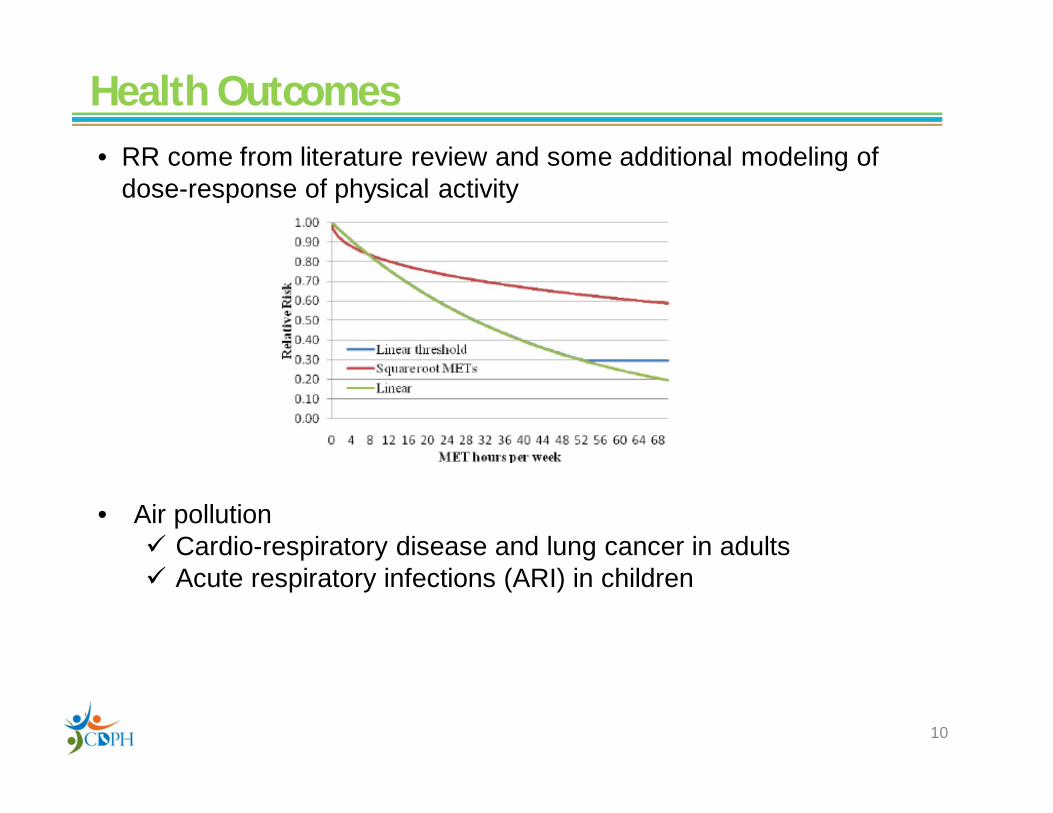
• RR come from literature review and some additional modeling of dose-response of physical activity
• Air pollution Cardio-respiratory disease and lung cancer in adults Acute respiratory infections (ARI) in children
Health Outcomes
10

Health Outcomes• Road Traffic Injuries: a mechanistic model based on injuries per miles
traveled by the victim (PMT) and the striking vehicle (VMT)
• Baseline Injury Risk:
• Scenario Injuries: IS1
• Stratified by roadway type and severity (fatal, serious)
11
Number of Injuries/FatalitiesStriking Vehicle, SV
Victim, V b p m c d hBicycle b rbb rbp rbm rbc rbd rbbPedestrian p rpb rpp . . . .Motorcycle m rmb rmp rmm . . .Car c rcb etc . . . .Bus d rdb . . . . .Truck h rhb . . . . .
00
00
VehStrikingVictim
Victim
VMTPMTInjuriesR
110 hSStrikingVeVictimS VMTPMTR

Structure of Model, Inputs & Outputs
I-THIM(Excel)
RRsGBD U.S.
Mean daily per capita PMT and
VMT by mode and roadway type
Goal Setting
Inter/intra-regional
mode sharebenchmarks
Travel demand/land use models
Travel SurveysHealth Interview Surveys
SAS
Physical ActivityScenarios
AirPollution
1. Mean travel distances, times, speeds bymode and scenario
2. CV of active transport travel times3. Age-sex ratios of walking/cycling times
Victim-Striking Vehicle Injury
Matrix by Roadway Type
SAS
ArcGIS
SWITRS
Injuries
Population Adjustments1. Age-sex distribution of regional/local population; 2. RR of regional population to U.S. health outcomes Output
In Disease/Injury Burden Deaths, YLL, YLD, DALYs in age-sex groupsfor each disease/injury category, up to 4
scenarios at a time
U.S. CensusCal. DOF
CDPH Vital Stats
Primary Data
OutputTons CO2
(Excel)
Vehicle emissions model (EMFAC)
Air shed model for PM2.5(MPEM)
Modeled Data
CO2 Emission-VMT Model(BASSTEGG)
12Aggregated Data
Legend

Data Sources for Replicating Woodcock’s Active Transport Model in California
Health Outcomes• Global Burden of Disease database for U.S. (DALYs)• SWITRS (traffic collisions)Physical Activity• Regional Travel Surveys (miles/minutes traveled by mode)• California Health Interview Survey (non-transport related physical activity)Carbon and Other Emissions• Vehicle emissions (EMFAC) and air shed models for PM2.5 (MPEM)• CO2 emissions per vehicle mile (MTC-BASSTEGG model)Scenarios• Output of travel demand and other models’ scenarios• Census/American Community Survey data on geographic variation of
walking and bicycling rates• Goal setting: health-based (minutes per week of physical activity) or GHG-
based (percent reduction in CO2 emissions from active transport)
13

Active Transport Scenarios for the Bay Area• What if whole Bay Area experiences the high levels of walking and cycling as the
current leading Bay Area cities and/or US Cities (Portland, Seattle, Boston, etc.)? Advantage of choosing local benchmarks
• Familiarity and acceptability of the model's results by local policy makers. • The common elements of civil administration, regulations (general plan
updates, mandates under SB375), and funding steams in the Bay Area• Strategies to achieve high level of active transport used by local standouts
may be more transferable within California regions than those imported from outside the region or state.
• Geography/topography • Converting a percentage of the large number of short automobile trips to active
transport In 2006, 45% of Bay Area car trips were < 3 miles; 60% of car trips were < 5
miles 50% of trips <1.5 miles walked and 50% of trips 1.5 to 5 miles bicycled
• How much would active transport have to substitute for vehicle miles traveled to meet the CO2 reductions envisioned by AB32 and Executive Order S-3-05 (45% reduction from 2000 baseline by 2035) in combination with other strategies (Lutsey, 2010)? 14

15
Mode
0
5
10
15
20
25
0 10 20 30 40 50 60Number of Cities
Perc
ent o
f Pop
ulat
ion
Bike & WalkWalk
Bike
Percent of Working Population Aged ≥16 Years with a Journey to Work by Bicycle or Walking, 54 Bay Area Cities, 2007-2009
Source: American Community Survey, 3 year detailed tables, 2007-2009* Walk or bicycle to work

City County
City population,
2007-9
Percent Commute
2007-9
Percent Commute
2035*A. Bicycle to WorkPalo Alto Santa Clara 58,879 7.5 12.5Berkeley Alameda 101,426 7.4 11.8Mountain View Santa Clara 70,890 3.2 7.6San Francisco San Francisco 807,515 2.8 5.1Rohnert Park Sonoma 40,583 2.4 5.7Midpoint of decile range 5.0 8.8
B. Walk to WorkBerkeley Alameda 101,426 16.6 21.2San Francisco San Francisco 807,515 10.0 11.8Palo Alto Santa Clara 58,879 6.0 16.0Morgan Hill Santa Clara 37,865 4.5 16.3Oakland Alameda 403,267 4.4 6.6
Midpoint of decile range 10.5 13.9
The Top Decile of 53 Bay Area Cities Whose Working Population Commutes to Work by Walking or Bicycling
16
* Linear extrapolation of 2000-2009 annual growth rates of bicycling and walkingSource: American Community Survey, 3 year detailed tables, 2007-2009
• Linking ACS journey-to-work (JTW) to total miles traveled per scenario in travel survey data:
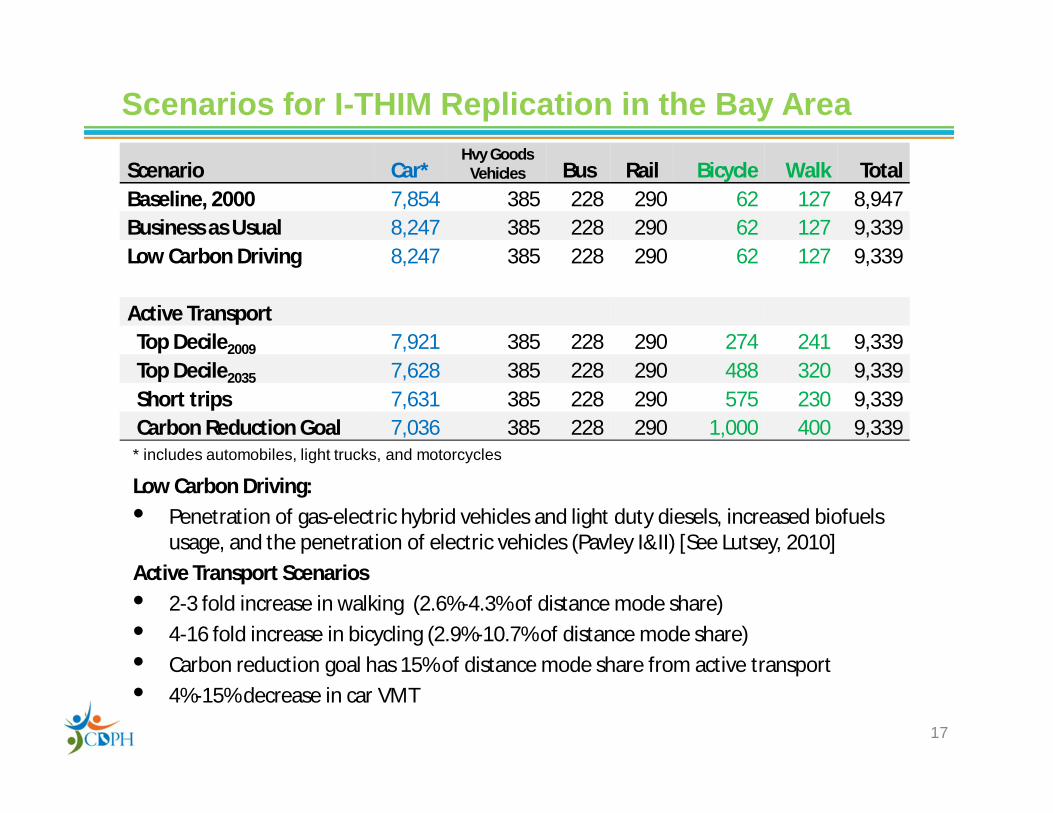
Scenario Car*Hvy Goods
Vehicles Bus Rail Bicycle Walk TotalBaseline, 2000 7,854 385 228 290 62 127 8,947 Business as Usual 8,247 385 228 290 62 127 9,339 Low Carbon Driving 8,247 385 228 290 62 127 9,339
Active TransportTop Decile2009 7,921 385 228 290 274 241 9,339Top Decile2035 7,628 385 228 290 488 320 9,339Short trips 7,631 385 228 290 575 230 9,339Carbon Reduction Goal 7,036 385 228 290 1,000 400 9,339
Scenarios for I-THIM Replication in the Bay Area
* includes automobiles, light trucks, and motorcycles
Low Carbon Driving: • Penetration of gas-electric hybrid vehicles and light duty diesels, increased biofuels
usage, and the penetration of electric vehicles (Pavley I&II) [See Lutsey, 2010]Active Transport Scenarios• 2-3 fold increase in walking (2.6%-4.3% of distance mode share)• 4-16 fold increase in bicycling (2.9%-10.7% of distance mode share)• Carbon reduction goal has 15% of distance mode share from active transport• 4%-15% decrease in car VMT
17
18
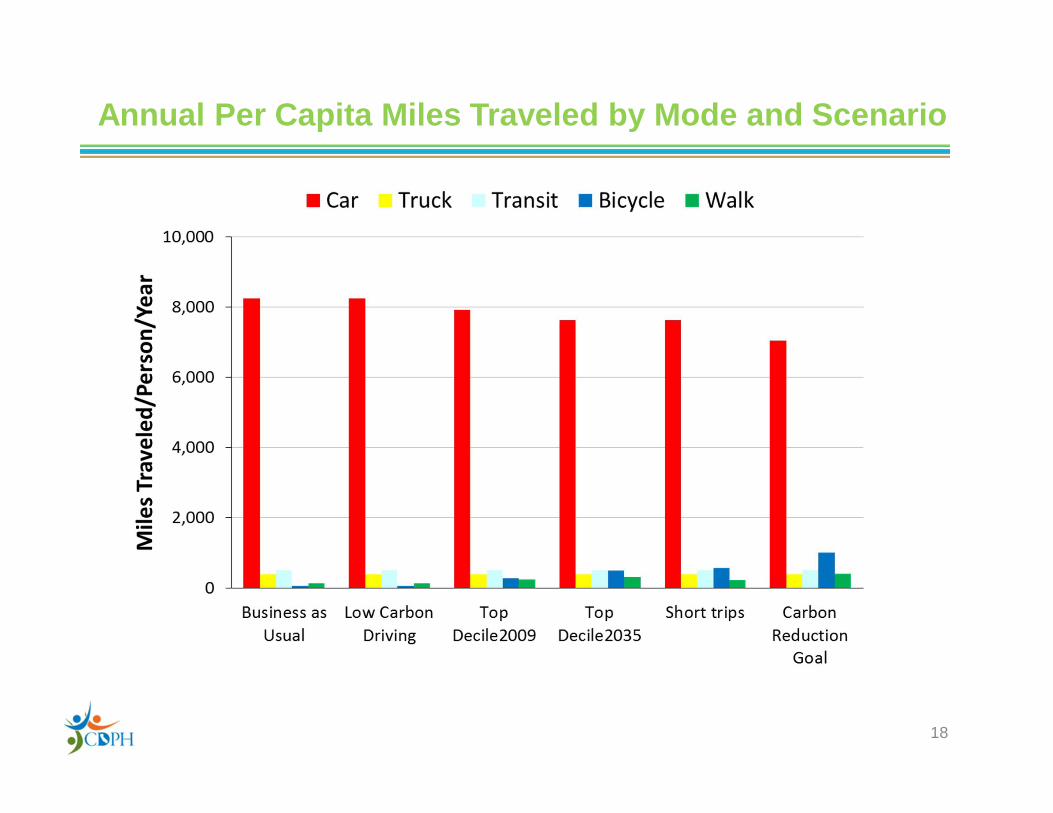
Annual Per Capita Miles Traveled by Mode and Scenario

Physical Activity Distribution by Scenario
19

Health Impacts of Active Transport Scenarios
20
Change in disease burden Change in premature deaths
Cardiovascular Dis. 6-15% 724-1895
Diabetes 6-15% 73-189
Depression 2-6% <2
Dementia 2-6% 38-132
Breast cancer 2-5% 15-48
Colon Cancer 2-6% 17-53
Road traffic crashes 19-39% 60-113

(Active transport15% of miles traveled)
Source of Health Benefit or Harm
Annual Health Benefits of Active Transport and Low Carbon Driving in the Bay Area Predictions from the Woodcock Model
21

Health Impacts of Active Transport Scenarios
22

Annual Aggregate Reductions in Passenger Vehicle Greenhouse Gas Emissions from Different Transport Scenarios, San Francisco Bay#
23
45% Reduction 2035 Goal
2000 Baseline27.9 MMTCO2
# Based on car VMT*BASSTEGG emission factor* Per capita reduction of 26%† Adjusted for double counting of mode choiceBAU, Business-as-Usual; LCD, Low Carbon Driving; TD, Top Decile of Cities; ATC, Active Transport Carbon Goal

Summary of FindingsAt 15% of all miles traveled by active transport• Disease reductions
↓ 14% of heart disease, stroke, and diabetes↓ 6-7% of dementia and depression↓ 5% of breast and colon cancerMajor public health impact; $34 billion annual health costs from CVD in California
• Injuries↑ 19% of injuries to pedestrian and bicyclists
• Physical activity accounts for almost all the health benefits; air pollution < 1%
• ~15% reductions in CO2 emissions• Low carbon driving is not as important as physical activity for generating
health co-benefits• Together, low carbon driving and active transport can achieve California’s
carbon reduction goals and optimize the health of the population
24

Strengths and LimitationsStrengths• Evidence-based and population-based approach to quantify health co-benefits and harms• Inputs are available from existing data from health and travel surveys, collision databases, and
emissions and air shed models• I-THIM could be a health co-benefits post-processor for travel and land use models that predict
changes in modal distances (VMT)• Runs on desktop computer in Excel (low cost/fast)Limitations• Simplifying assumptions
Co-benefits reported in a single accounting year Secular trends in exposure (PA, RTI, PM2.5) or disease rates not taken into account
• Other assumptions Travel distances from BATS2000 travel surveys more accurate than travel times; reported
walking and bicycling speeds in literature accurately reflect Bay Area walkers and bicyclists. Road traffic injuries and travel distances follow asymptotic power function as reported in
literature CV of active travel time from 7-day CHIS survey adequately describes variability over 1 week Scenarios fix miles traveled by transit, trucks, and rail; walking for transit not included (yet) Less overall travel is an option
• Other issues: Won’t health co-benefits be lost if walkers and bikers breathe polluted air next to busy traffic? Some studies show acute health effects, but on a population basis, co-benefits of physical activity far outweigh potential harms from increased exposure to polluted air (de Hartog, 2010)
25

Next Steps
• Report back to community (LHDs, MTC Pedestrian/Bicycle Committee, other MPOs and stakeholders)
• Prepare toolkit to make I-THIM easier to use by MPOs and others interested in replicating model in their region Preliminary workload projection to replicate I-THIM using CDPH templates and minimal
technical assistance is 20-40 person days, depending on data contingencies and staff skill sets which could draw from several local agencies (e.g., health department, MPO, ACB, universities, etc.)
• Provide technical assistance to MPOs that are interested in exploring I-THIM• Work with James Woodcock on model improvements
26

Acknowledgments• The Team
Linda Rudolph, CDPH (conceived the project), Sacramento Neil Maizlish, CDPH, Richmond James Woodcock, UKCRC Centre for Diet and Activity Research (CEDAR), UK Sean Co, Metropolitan Transportation Commission, Oakland Bart Ostro, Centre for Research in Environmental Epidemiology (CREAL), Spain Amir Fanai and David Fairley, Bay Area Air Quality Management District, San Francisco
• Other Contributors Caroline Rodier, Urban Land Use & Transportation Program, UC Davis Dr. Phil Edwards and Dr. Zaid Chalabi, London School of Hygiene and Tropical Medicine Colin Mathers, World Health Organization, Geneva Other staff from MTC, UCD, CDPH, Mike Zdeb (University at Albany, NY)
• Partial funding and grant support The California Endowment, Oakland Kaiser Permanente – Northern California Community Benefits Programs, Oakland Public Health Law and Policy, Oakland, CA Public Health Institute, Oakland
27

Bibliography
28
1. Woodcock J, Edwards P, Tonne C, Armstrong BG, Ashiru O, Banister D, et al. Public health benefits of strategies to reduce greenhouse-gas emissions: urban land transport. The Lancet 2009;374:1930-1943.
2. Mathers CD, Loncar D. Projections of global mortality and burden of disease from 2002 to 2030. PLoS Med 2006;3:2011-2030.3. World Health Organization. Disease and injury country estimates: Burden of disease. Geneva, Switzerland: World Health Organization; 2004
(www.who.int/healthinfo/global_burden_disease/estimates_country/en/index.html, accessed 8/2/2010).4. Metropolitan Transportation Commission. Transportation 2035: Change in Motion. Travel Forecasts for the San Francisco Bay Area, 2009 Regional
Transportation Plan, Vision 2035 Analysis. Data Summary. Table E.17 Trips by Mode by Trip Length: 2006 Base Year. Oakland, CA: Metropolitan Transportation Commission; 2007 (www.mtc.ca.gov/planning/2035_plan/tech_data_summary_report.pdf, accessed 8/2/2010).
5. Metropolitan Transportation Commission. San Francisco Bay Area Travel Survey 2000 Regional Travel Characteristics Report (Vols. I & II). Oakland, CA: Metropolitan Transportation Commission; 2004 (www.mtc.ca.gov/maps_and_data/datamart/survey/, accessed 8/2/2010).
6. US Department of Transportation. 2001 National Household Travel Survey. User's Guide. Version 4. Washington DC: US Department ofTransportation; 2005 (http://nhts.ornl.gov/download.shtml, accessed 8/2/2010).
7. UCLA Center for Health Policy Research. California Health Interview Survey (CHIS). Los Angeles: University of California; 2005.8. California Highway Patrol. 2008 Annual Report of Fatal and Injury Motor Vehicle Traffic Collisions. Statewide Integrated Traffic Records System
(SWITRS). Sacramento: California Highway Patrol; 2008 (www.chp.ca.gov/switrs/index.htm, accessed 8/2/2010).9. Lutsey, N. Cost-Effectiveness Assessment of Low-Carbon Vehicle and Fuel Technologies. In Transportation Research Record: Journal of the
Transportation Research Board, No. 2191, Transportation Research Board of the National Academies, Washington, D.C., pp. 90-99, 2010.10. de Hartog JJ, Boogaard H, Nijland H, Hoek G. Do the health benefits of cycling outweigh the risks? Environmental Health Perspectives
2010;118:1109–1116
Contact Information
Neil Maizlish ([email protected])
Report available at:
http://www.cdph.ca.gov/programs/CCDPHP/Documents/ITHIM_Technical_Report11-21-11.pdf
N Maizlish – 10/24/11