health care utilization survey in east jakarta and bogor ... utilization survey... · strategies...
TRANSCRIPT
STRATEGIES AGAINST FLU EMERGENCE
Health Care Utilization Survey in East Jakarta and Bogor District Indonesia
July 2, 2012
This publication was produced for review by the United States Agency for International
Development. It was prepared by Development Alternatives, Inc.

STRATEGIES AGAINST FLU EMERGENCE PROJECT
STRATEGIES AGAINST FLU EMERGENCE
Health Care Utilization Survey in
East Jakarta and Bogor District
Indonesia
Title:
Health Care Utilization Survey in
East Jakarta and Bogor District
Indonesia
Sponsoring office: USAID/Indonesia Office of Health
Contracting officer's technical representative: Artha Camellia
Contract number: AID-EDH-I-00-05-00004-00 Order number: AID-497-TO-11-00001 Contractor: DAI DAI project number: 1001470
Submitted: July 2, 2012
The views expressed in this publication do not necessarily reflect the views of the United States
Agency for International Development or the United States Government.

7/11/2012
1
Health Care Utilization Survey inEast Jakarta and Bogor District
Indonesia
1
Strategies Against Flu Emergence - DAIJohns Hopkins University Center for Communication Programs
Centers for Disease ControlWorld Health Organization
University of Indonesia Center for Health Research
Funded by USAID
June 2012
This study is made possible by the support of the American People through the United States Agency for International
Development (USAID.) The contents of this study are the sole responsibility of DAI and do not necessarily reflect the
views of USAID or the United States Government.
2
AcknowledgementsThis study was conducted as part of the USAID-funded Strategies Against Flu Emergence (SAFE) project
(contract # AID-EDH-I-00-05-00004-00), in support of the Government of Indonesia’s efforts to reduce the
impact of avian influenza (H5N1) on humans and animals. Many people contributed to the design
implementation and analysis that went into this research.
Special acknowledgment of Douglas Storey, Yunita Wahyuningrum and Jennifer Kreslake with JHU∙CCP who
led the design of the study, supervised field work and conducted analysis of the findings.
Thanks to Timothy M. Uyeki, Aaron D. Storms, Kathryn Lafond, Danielle A. Iuliano and Yekti Praptiningsih at
CDC Atlanta and Jakarta; and Graham Tallis and Oratai Rauyajin at WHO for substantial input into the design
of the study and the survey instrument. Special thanks to Aaron D. Storms for assistance with the sample
design.
At USAID/Jakarta, Artha Camellia, Bambang Heryanto and Kendra Chittenden helped shape the direction of
the study and provided careful insights into the interpretation of the results.
At the University of Indonesia Center for Health Research (PPK-UI), Christiana Rialine, Fitra Yelda and their
team coordinated all the field work and data management.
Thanks to the DAI and JHU∙CCP staff who also helped shape the study, develop the instruments and manage
the day to day implementation of this study: Maria I. Busquets, Basil Safi, Rekha Lal, Heri Haerudin and
Gabrielle Hunter.
Finally, a special thank you to the local governments of East Java and the district of Bogor for allowing us to
conduct the interviews and data collection.

7/11/2012
2
3
Part A:
STUDY DESIGN & FIELD WORK
4
INTRODUCTION
Infection from H5N1, the highly pathogenic avian influenza (AI) virus, results in high cases fatality
rates. Indonesia has the highest number of confirmed human cases of AI and one of the highest case
fatality rates in the world, 83 percent as of 29 May 2012.1 This high case fatality rate is widely attributed
to delays in care seeking, diagnosis and initiation of treatment for respiratory disease. Respiratory
disease and influenza-like illnesses (ILIs) are extremely common in Indonesia and experts estimate that
the actual number of H5N1 cases is several times higher than the confirmed total with many cases
unidentified, misidentified, or unreported. The western half of Java accounts for more than 68 percent
of all human cases in Indonesia. While H5N1 is not readily transmitted among humans, the virus is
endemic in animal populations in Indonesia, raising the possibility that H5N1 could at some point evolve
into a form more easily transmissible between humans, causing a pandemic that could kill millions. Both
direct and indirect exposure to live and domesticated birds, to poultry waste and to poultry in wet
markets is extremely common throughout Indonesia.
The USAID-funded SAFE project is designed to reduce this risk by simultaneously working to (1)
improve biosecurity practices in the poultry industry, thereby reducing bird to bird transmission and (2)
improve hygiene and poultry handling practices among the general public, thereby reducing bird to
human transmission, while 3) encouraging rapid care seeking and faster initiation of appropriate
treatment as early as possible after the onset of symptoms of respiratory disease.
Under the umbrella of the USAID Strategies Against Flu Emergence (SAFE) project and in
conjunction with the Centers for Disease Control Atlanta and Jakarta offices and the World Health
Organization Indonesia, a community-based household survey was conducted in East Jakarta and Bogor
District in West Java.
1 http://www.who.int/influenza/human_animal_interface/H5N1_cumulative_table_archives/en/index.html

7/11/2012
3
5
OBJECTIVES
The survey was designed to generate estimates of the seasonal influenza disease burden
and to determine the proportion of persons with ILI that seek care, their understanding of signs
and symptoms that indicate the need for care and decision-making about when and where to
seek care for respiratory illness. The findings from the HUS will be used in conjunction with
enhanced surveillance data collected in a separate study by CDC/Jakarta for the purpose of
developing disease burden estimates for seasonal influenza among East Jakarta district residents
who present as outpatients with ILI or as hospitalized patients with SARI (e.g. pneumonia).2
This survey also aims to understand perceptions about exposure to birds and of the risk of
H5N1 transmission. In addition, findings of the HUS will be used to inform preventive education
strategies at the community level to reduce bird to human transmission of H5N1 virus and to
reduce delays in care seeking that can result in higher than necessary mortality rates.
Through a competitive procurement process, Pusat Penelitian Kesehatan Universitas
Indonesia/PPK-UI (Center for Health Research at the Faculty of Public Health, University of
Indonesia) was selected as the research agency to conduct the fieldwork for HUS in East Jakarta
and Bogor District.
2 These calculations to be provided by CDC/Atlanta; analysis is in progress.
Fig. 1:EastJakarta
Fig. 2: Bogor
6
METHODOLOGY
Data collection was accomplished through a face-to-face survey in
households throughout East Jakarta and Bogor District in West Java.
The survey was administered primarily in Bahasa Indonesia (translated
from English). About 60 percent of the interviews in West Java were
conducted in Bahasa Sunda where Sundanese is the primary language.
Study sites
The study was conducted in the East Jakarta
District of DKI Jakarta and in the Bogor District in West
Java. In East Jakarta, study sites included the seven sub-
districts of Matraman, Pulogadung, Duren Sawit, Kramat
Jati, Pasar Rebo, Ciracas and Makasar, where enhanced
surveillance sites monitored by CDC/Jakarta are located
(community health centers (puskesmas) of Matraman,
Pulogadung, Duren Sawit and Kramat Jati, and the six
hospitals of Persahabatan, Budi Asih, Pasar Rebo,
Harapan Bunda, Islam Pondok Kopi and Haji Pondok
Gede.
In Bogor District, seven sub-districts were
randomly selected (Cijeruk, Cileungsi, Gunung Putri,
Citeureup, Ciampea, Cibinong and Rancabungur).

7/11/2012
4
Sampling Method
To estimate the proportion of persons living in East Jakarta that were hospitalized for respiratory illness in the prior year, we searched the literature for similar estimates from different international settings (including Kenya,3 Thailand, 4, 5 and Guatemala6) and spoke to experts conducting similar activities in Bangladesh and El Salvador. Estimates varied from site to site, and we selected a conservative estimate of 0.7 percent.
To estimate the proportion of persons hospitalized for respiratory illness (Step 1) at the East Jakarta sites, we looked at the pneumonia reports posted in the Provincial Health office website that detail the number of pneumonia cases (used as a surrogate for respiratory illness) that were admitted to each hospital in the district). These data indicated that 67 percent of hospitalized pneumonia cases in East Jakarta for the previous year were hospitalized at any one of our sites.
From this we were able to estimate that the proportion of persons living in East Jakarta that were hospitalized for respiratory illness at any one of our sites is 0.44 percent (67 percent of 0.7 percent).
3 Breiman RF, Olack B, Shultz A, Roder S, Kimani K, Feikin DR, et al. Healthcare-use for major infectious disease syndromes
in an informal settlement in Nairobi, Kenya. J Health Popul Nutr. 2011 Apr;29(2):123-33.4 Chamany S, Burapat C, Wannachaiwong Y, Limpakarnjanarat K, Premsri N, Zell ER, et al. Assessing the sensitivity of
surveillance for pneumonia in rural Thailand. Southeast Asian J Trop Med Public Health. 2008 May;39(3):549-56.5 Jordan HT, Prapasiri P, Areerat P, Anand S, Clague B, Sutthirattana S, et al. A comparison of population-based pneumonia
surveillance and health-seeking behavior in two provinces in rural Thailand. Int J Infect Dis. [Comparative Study]. 2009
May;13(3):355-61.6 Lindblade KA, Johnson AJ, Arvelo W, Zhang X, Jordan HT, Reyes L, et al. Low usage of government healthcare facilities for
acute respiratory infections in Guatemala: implications for influenza surveillance. BMC Public Health. 2011 Nov 24;11(1):885.
7
East Jakarta City
7 sub-districts 7 sub-districts
9 clusters (RW) per
kelurahan
9 clusters (RW) per
desa
Bogor District
20 households per
cluster (RW)
20 households per
cluster (RW)
Probability proportionate
to size (PPS)
Simple Random Sampling (SRS)
SAMPLING DESIGN
SRS
Purposive
sampling
Sampling Method (cont.)
In order to ensure that we detect a prevalence level of at least 0.4 percent (expected SARI cases hospitalized in our facilities) but up to 0.7 percent (highest value that we could find of SARI cases hospitalized in one of our facilities) with an alpha of 0.05 and power of 0.85, we would need survey data from 4,997 persons.
Based on data from the most recent Indonesia Demographic and Health Survey (2007) indicating that average household size is approximately 4 persons per household, this would require a sample of at least 1,250 households.
The resulting sample design is summarized in Figure 3.
Fig. 3: Sample Design
In each selected RW, list of households was obtained from either head of the RW or RT. Lists were validated and adjusted according to field conditions.
In each household, the interviewer asked to speak with the person who was most knowledgeable about the health condition of household members or was the main caregiver for household members.
8

7/11/2012
5
INSTRUMENT DEVELOPMENT
The instrument was developed in collaboration with USAID/Jakarta, CDC/Atlanta and Jakarta, WHO/Indonesia and SAFE. The questionnaire was designed to measure the following:• frequency of influenza-like illness in the previous two weeks,• proportion of cases of ILI that sought care at health care facility, • frequency of SARI (among all members of selected households) in the previous year, • proportion of cases of SARI that were admitted to any hospital and at enhanced
surveillance hospitals, • knowledge of risk factors for human infection with H5N1 virus, including direct contact
with sick/dead poultry, and indirect exposure (e.g. visiting a wet poultry market – also referred to commonly as traditional or live bird market),
• knowledge about human illness with H5N1 virus and health-care seeking behaviour for family member with ILI and exposure to sick and dying poultry,
• exposures to poultry, including slaughtering of sick or dying poultry, through animal husbandry practices (for residents who keep live birds), through visits to wet poultry markets and other indirect sources of contact, and through food handling practices with emphasis on handling and preparing poultry products and
• media habits, information sources and exposure to messages related to AI.
9
INSTRUMENT DEVELOPMENT (cont.)
The instrument was translated into Bahasa Indonesia before being pre-tested with sample household members in Depok and Bogor Municipality in December 2011.
Pre-testing of the instrument was conducted by researchers from PPK-UI, in the Cimanggis sub-district of Depok City and in the North Bogor sub-district of Bogor City. These two areas were selected based on their similarity to the field sites where data collection would actually be conducted, but neither one was selected for the actual study.
Pre-testing was designed to confirm the wording, flow and time spent for each respondent, and to ensure that respondents could answer each question. The pre-testing results were then sent to all partners for input. Detailed feedback on HUS pre-tests, including suggested revisions to specific questions were addressed.
10

7/11/2012
6
DATA COLLECTION MANAGEMENT
Prior to data collection activities, SAFE and PPK-UI obtained ethical clearance for the survey implementation from the Research Ethics Committee at the Faculty of Public Health of the University of Indonesia on December 21, 2011 and from the CDC Atlanta Institutional Review Board on February 8, 2012.
A three-day training program for field personnel, including field coordinators and interviewers, was conducted on 24-26 January 2012. It was attended by 32 interviewers, four field coordinators, SAFE and CDC Jakarta staff and researchers from PPK/UI.
Data collection was conducted from 8 February – 1 March 2012. In total, 2520 respondents were interviewed (1260 respondents in each district/city). Those households contained a total of 11,328 regular residents, 5,535 in East Jakarta and 5,793 in West Java for a mean household size of 4.4 and 4.6, respectively.
On average, 12 percent of households that were approached refused to participate (19 percent in East Jakarta City and 4 percent in Bogor District. On average, the interview time per respondent was approximately 45 minutes.
After all completed questionnaires were checked and edited, field coordinators selected 5 percent (n=120) of the questionnaires randomly and conducted a spot-check. This was done by revisiting the respondents and re-interviewing them on some important key questions on the same day or the day after the original interview. No major problems/discrepancies were identified by field coordinators.
11
DATA ENTRY MANAGEMENT
Questionnaires were double entered into a database using Epi-Data software. When any discrepancies were found, the data were crosschecked against the original questionnaires.
Construction of population and normalized weight variables
The final dataset contains two weighting variables: population weight and normalized weight. Different methods were applied to obtain the weight values in East Jakarta City and Bogor District, according to the sampling design used in each area.
• In East Jakarta City, the calculation of weights took into account the selection of sub-districts and households in each RW (both using the simple random sample method).
• In Bogor District, the calculation of weights took into account only the selection of households in the RW, since the selection of sub-districts was made proportional to the population size in each sub-district (PPS method).
When the population weight is used, the weighted proportion reflects the proportion from the total population (N= 7,100,632); while normalized weight reflects the proportion only from the total sample (N=2520). However the proportion should remain identical when either population or normalized weight is applied.
The normalized weight was used in statistical analyses.
12

7/11/2012
7
13
Household Characteristics
14
Table 1: Household Member Characteristics
by Survey Area
Household member
characteristics
East
Jakarta
(n=5535)
Bogor
(n=5793)
Total
(n=11328)
Gender
Male
Female
49.1
50.9
51.3
48.7
50.5
49.5
Age categories
Under 5
5-14
15-49
Over 50
8.3
17.0
54.2
20.5
9.9
22.0
54.7
13.3
9.3
20.3
54.5
15.8
Marital status
Single
Married
Divorced
Widowed
Separated
46.8
47.4
0.8
4.6
0.5
49.8
45.8
1.1
3.2
0.1
48.7
46.3
1.0
3.7
0.2
Highest education achieved
No school
Some primary
Completed primary
Completed lower secondary
Completed upper secondary
Academy
University
12.1
12.8
12.9
14.5
35.0
5.2
7.1
17.1
21.6
28.1
14.7
14.6
1.3
2.6
15.4
18.5
22.7
14.8
21.8
2.7
4.2
Household Characteristics
There were some differences in household composition between East Jakarta and Bogor due to the fact that East Jakarta is predominantly urban while West Java is predominantly rural (Table 1).
Households in East Jakarta had slightly more women than men, while Bogor had slightly more men than women.
Households in East Jakarta were a little older on average with fewer members in the Under 5 and 5 to 14 year old age categories and more in the Over 50 age group compared to Bogor.
East Jakarta households were also better educated on average with more than twice as many members having completed upper secondary, academy or university level education compared to Bogor.

7/11/2012
8
15
Characteristics of Respondents
(member most knowledgeable about household health)
Table 2: Characteristics of respondents
Characteristic
East
Jakarta
(n=1260)
Bogor
(n=1260)
Total
(n=2520)
Gender
(female %)
76.5 79.4 78.3*
Age
(mean years)
45.3 40.1 42.0*
Married
(%)
83.6 89.2 87.1*
Completed high
school
(%)
43.0 20.1 28.6*
Table 2 summarizes the
characteristics of the main
respondents (the member of each
household who was most
knowledgeable about the health
of other family members).
More than three-fourths were
female, with an average age of 45
in East Jakarta and 40 in West
Java.
More than 8 out of 10 were
currently married. In East Jakarta,
43 percent had completed at least
high school compared to 20
percent in West Java.
16
Table 3:
Household possessions by study area
Household possessions
East
Jakarta
(n=1260)
Bogor
(n=1260)
Total
(n=2520)
Color TV
Black & white TV
VCR
Video CD player
Stereo
CD stereo
Laser disc player
Karaoke machine
Keyboard instrument
Camera
Video camera
Personal computer
Air conditioner
Fixed line telephone
Mobile phone
Refrigerator or freezer
Microwave
Washing machine
Motorcycle
Automobile
Own (vs rent) home
Fan
Gas cooker
Sewing machine
Water pump
Rice cooker
Radio
Bicycle
98.6
0.9
3.2
75.5
12.1
13.9
2.7
10.1
4.1
31.9
9.0
42.3
16.4
35.3
94.1
84.9
11.8
52.2
79.1
15.7
72.2
95.2
93.1
22.7
71,0
86.4
59.9
64.2
88.0
1.4
2.0
53.8
21.1
8.0
1.5
6.5
4.2
14.0
3.9
17.9
7.0
10.1
87.6
55.0
5.0
24.4
61.5
8.9
82.7
53.5
90.5
12.9
59.9
77.9
34.0
51.1
92.0
1.2
2.4
61.8
17.8
10.2
1.9
7.8
4.2
20.6
5.8
27.0
10.4
19.4
90.0
66.0
7.5
34.7
68.0
11.4
78.8
68.9
91.4
16.5
64.0
81.1
43.5
55.9
Mean number of
possessions
13.1 10.0 11.1
Household Amenities
Households were asked to indicate which physical amenities they possessed as a proxy for socio-economic status. A list of 33 common household appliances or possessions was used (Table 3).
Ownership of a color television was nearly universal in East Jakarta and nearly 90 percent in Bogor. Over 40 percent of households in East Jakarta had a computer of some kind, compared to 18 percent in Bogor, while mobile phone ownership was 94 percent and 88 percent, respectively. Overall, more than two-thirds of households had a motorcycle and 11 percent owned an automobile (about twice as many in East Jakarta compared to Bogor). Sixty-four percent of households in East Jakarta owned a radio compared to 34 percent in Bogor.

7/11/2012
9
17
INPATIENT CARE AMONG
HOUSEHOLD MEMBERS
18
Households with Hospitalized Members in the Past Year
Table 4:
Percent of HHs with one or more members
hospitalized in past year
East
Jakarta
(n=1260)
Bogor
(n=1260)
Total
(n=2520)
One person 197
15.6%
150
11.9%
347
13.8%
More than
one person
13
1.0%
9
0.7%
22
0.9%
Of the 11,328 people
enumerated in 2,520 households
only 375 (14.9 percent of
households) were reported to
have been hospitalized in the 12
months preceding the survey.
More households in East Jakarta
reported a hospitalized member
compared to Bogor.
Overall, 13.8 percent of
households reported one
hospitalized member while 1
percent reported multiple
hospitalizations.
7/11/2012
10
19
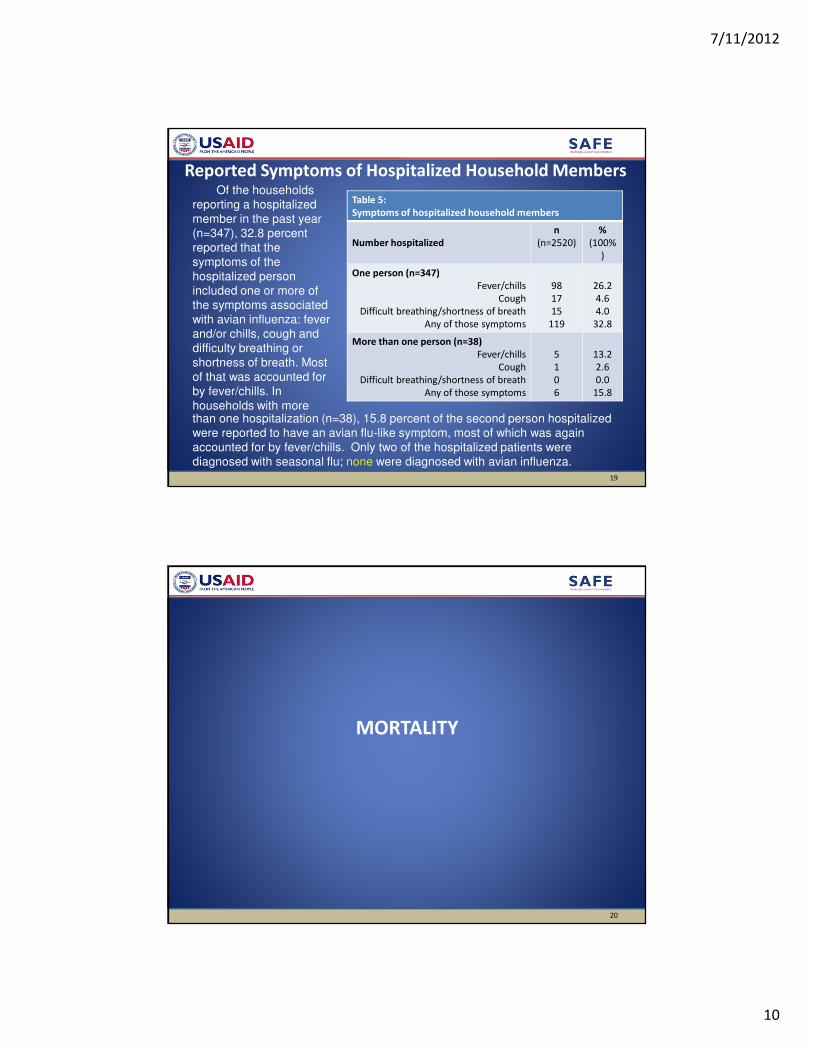
Reported Symptoms of Hospitalized Household Members
Table 5:
Symptoms of hospitalized household members
Number hospitalized
n
(n=2520)
%
(100%
)
One person (n=347)
Fever/chills
Cough
Difficult breathing/shortness of breath
Any of those symptoms
98
17
15
119
26.2
4.6
4.0
32.8
More than one person (n=38)
Fever/chills
Cough
Difficult breathing/shortness of breath
Any of those symptoms
5
1
0
6
13.2
2.6
0.0
15.8
Of the households
reporting a hospitalized
member in the past year
(n=347), 32.8 percent
reported that the
symptoms of the
hospitalized person
included one or more of
the symptoms associated
with avian influenza: fever
and/or chills, cough and
difficulty breathing or
shortness of breath. Most
of that was accounted for
by fever/chills. In
households with morethan one hospitalization (n=38), 15.8 percent of the second person hospitalized
were reported to have an avian flu-like symptom, most of which was again
accounted for by fever/chills. Only two of the hospitalized patients were
diagnosed with seasonal flu; none were diagnosed with avian influenza.
20
MORTALITY

7/11/2012
11
21
Deaths in the Household and Symptoms
Table 6:
Household deaths and symptoms of deceased in past year
East
Jakarta
(n=1260)
Bogor
(n=1260)
Total
(n=2520)
Number of deceased
Any
One
More than one
60 (4.8%)
53 (4.2%)
7 (0.1%)
29 (2.3%)
26 (2.1%)
3 (.002%)
89 (3.5%)
79 (3.1%)
10 (.004%)
Symptoms of deceased
Fever/chills
Cough
Difficult breathing/
shortness of breath
Pneumonia
1 (0.03%)
0 (0.0%)
2 (0.3%)
1 (0.03%)
0 (0.0%)
0 (0.0%)
2 (0.07%)
1 (0.03%)
1 (0.01%)
0 (0.0%)
4 (0.04%)
2 (0.02%)
Overall, there were 89
deaths reported in the
past 12 months; 3.5
percent of households
reported one or more
deaths.
Of those households,
only a very small
percentage (less than 0.1
percent) reported that the
deceased had
experienced avian
influenza-like symptoms,
including pneumonia.
None of the HHs with
multiple deaths reported death from the same symptoms.
Of the deceased, 49 percent were hospitalized within 30 days prior to death
and of those who were hospitalized, 95 percent sought some other care before
being admitted to the hospital (not shown).
22
HOUSEHOLD EXPOSURE TO POULTRY
7/11/2012
12
23
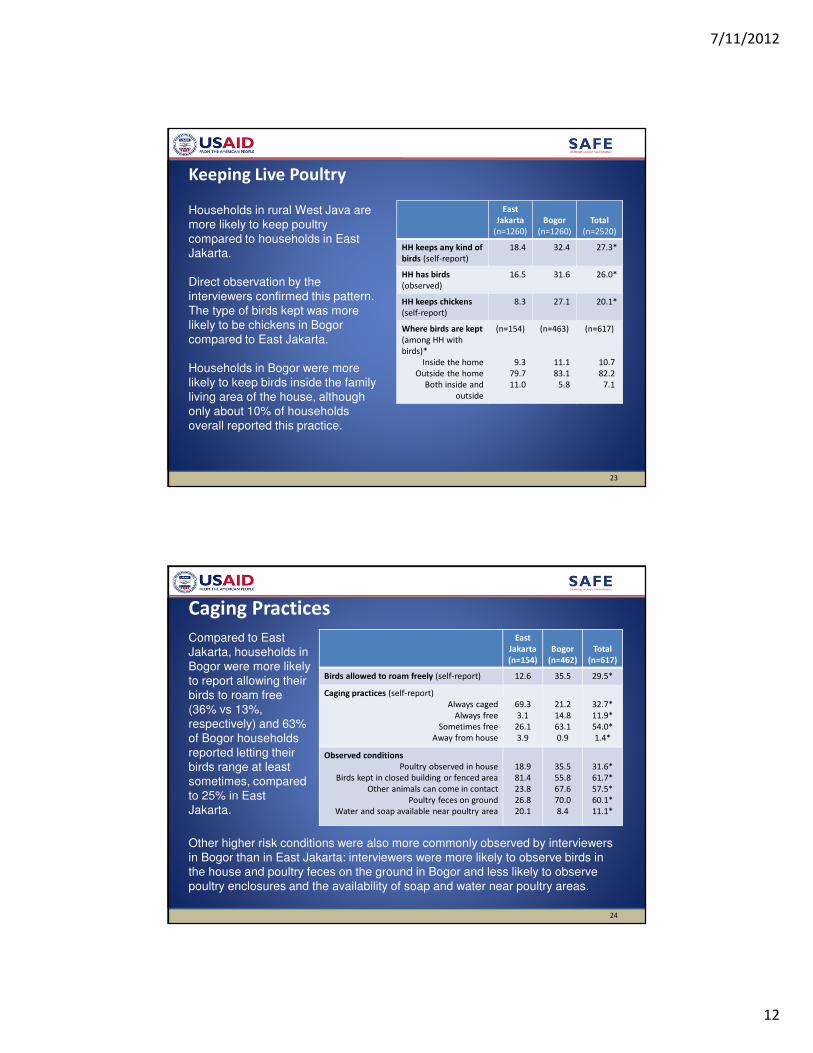
Keeping Live Poultry
East
Jakarta
(n=1260)
Bogor
(n=1260)
Total
(n=2520)
HH keeps any kind of
birds (self-report)
18.4 32.4 27.3*
HH has birds
(observed)
16.5 31.6 26.0*
HH keeps chickens
(self-report)
8.3 27.1 20.1*
Where birds are kept
(among HH with
birds)*
Inside the home
Outside the home
Both inside and
outside
(n=154)
9.3
79.7
11.0
(n=463)
11.1
83.1
5.8
(n=617)
10.7
82.2
7.1
Households in rural West Java are
more likely to keep poultry
compared to households in East
Jakarta.
Direct observation by the
interviewers confirmed this pattern.
The type of birds kept was more
likely to be chickens in Bogor
compared to East Jakarta.
Households in Bogor were more
likely to keep birds inside the family
living area of the house, although
only about 10% of households
overall reported this practice.
24
Caging Practices
East
Jakarta
(n=154)
Bogor
(n=462)
Total
(n=617)
Birds allowed to roam freely (self-report) 12.6 35.5 29.5*
Caging practices (self-report)
Always caged
Always free
Sometimes free
Away from house
69.3
3.1
26.1
3.9
21.2
14.8
63.1
0.9
32.7*
11.9*
54.0*
1.4*
Observed conditions
Poultry observed in house
Birds kept in closed building or fenced area
Other animals can come in contact
Poultry feces on ground
Water and soap available near poultry area
18.9
81.4
23.8
26.8
20.1
35.5
55.8
67.6
70.0
8.4
31.6*
61.7*
57.5*
60.1*
11.1*
Other higher risk conditions were also more commonly observed by interviewers
in Bogor than in East Jakarta: interviewers were more likely to observe birds in
the house and poultry feces on the ground in Bogor and less likely to observe
poultry enclosures and the availability of soap and water near poultry areas.
Compared to East
Jakarta, households in
Bogor were more likely
to report allowing their
birds to roam free
(36% vs 13%,
respectively) and 63%
of Bogor households
reported letting their
birds range at least
sometimes, compared
to 25% in East
Jakarta.

7/11/2012
13
25
Exposure through Poultry Care: Who USUALLY cares for poultry?
* Significant difference between E. Jakarta & Bogor
Generally, the head of household was reported to be in charge of poultry rearing
in household that keep birds, but in Bogor the female spouse was more likely to
bear responsibility for this job compared to East Jakarta. Small percentages of
children were also responsible.
26
Exposure through Poultry Care: Who EVER cares for poultry?
When asked about who in the household EVER cares for poultry, it became clear
that exposure to household poultry was widespread in the family. Two thirds of
female spouses, one quarter to one third of male children and about 10% of
female children provided some care. Other adults in the household help with
poultry rearing, too.
* Significant difference between E. Jakarta & Bogor

7/11/2012
14
27
Exposure through Commercial Activity
East
Jakarta
(n=1260)
Bogor
(n=1260)
Total
(n=2520)
Involved in some commercial poultry work 9.3 8.9 9.0
Selling live poultry 0.7 4.2 2.9*
Selling eggs 8.3 5.7 6.7*
Trading/transporting eggs or poultry 0.8 0.3 0.5
Slaughtering 0.2 0.3 0.2
Less than 10% of households indicated that they were involved in some kind
of commercial poultry work.
More reported selling poultry in Bogor, while more reported selling eggs in
East Jakarta.
28
Exposure through Consumption of Poultry Products
East
Jakarta
(n=1260)
Bogor
(n=1260)
Total
(n=2520)
Anyone eaten poultry in past 7
days*
78.5 69.2 72.6
Anyone eaten raw poultry products
(mostly eggs) in past 7 days
9.3 6.8 7.7
Main source of poultry products*
Supermarket
Wet market
Neighbor/friend/relative
Warung
Local farmer
Mobile vendor
Own production
Other (restaurant, slaughterer,
agent)
3.4
54.6
1.6
21.3
1.0
14.3
0.2
2.9
1.2
30.4
1.9
17.9
6.1
36.2
2.2
3.9
2.0
39.6
1.8
19.3
4.2
28.1
1.5
3.6
Potential exposure to
H5N1 through
consumption of
poultry products is
high. Nearly ¾ of
HHs reported
consuming poultry
products in the past
week and 8%
(slightly more in East
Jakarta than in
Bogor) reported
consuming raw
poultry products—
typically uncooked
eggs. Households
rely more on wet markets as a source of poultry products in E. Jakarta, while
households rely more on mobile vendors as a source in Bogor.

7/11/2012
15
29
Exposure Through Consumption of Eggs
East
Jakarta
(n=1260)
Bogor
(n=1260)
Total
(n=2520)
Anyone purchased eggs in past 7 days* 84.5 80.8 81.7
Main source of eggs*
Supermarket
Wet market
Neighbor/friend/relative
Warung
Local farmer
Mobile vendor
Own production
Other (restaurant, slaughterer, agent)
5.0
19.6
0.7
65.8
0.3
1.1
0.9
5.3
1.8
7.0
0.6
79.3
1.1
5.5
0.3
4.0
3.0
11.7
0.7
74.3
0.8
3.9
0.5
4.5
Over 80% of households purchased eggs in the past week. Warungs are major
source of eggs, somewhat more in Bogor than in Jakarta, while wet markets
are an important source of eggs in East Jakarta.
30
Exposure through the Wet Market
East Jakarta
(n=1260)
Bogor
(n=1260)
Total
(n=2520)
Ever Past 7
days
Ever Past 7
days
Ever Past 7
days
Does anyone in HH go to wet market?1, 2 93.6 62.9 39.8 39.8 48.3 48.3
Who?
Head of household2
Spouse1, 2
Male child
Female child2
Other male adult1
Other female adult2
56.3
75.9
16.0
17.5
10.5
22.4
25.7
46.9
4.4
5.9
2.6
10.2
54..4
72.5
16.0
20.0
12.4
15.0
18.9
25.9
3.2
4.5
3.0
4.3
55.1
73.8
16.0
19.1
11.7
17.7
21.4
33.6
3.6
5.0
2.9
6.5
1 Ever—district difference is significant2 Past 7 days—district difference is significant
Wet markets pose potentially the greatest risk of exposure to H5N1. Nearly half of all households reported that someone in the family went to a wet market in the past week. This was higher in East Jakarta where nearly 2/3 of households said that someone went to the wet market in the past week; 94% reported EVER going to the wet market. Most often it is the female spouse who goes to the wet market, followed by the head of household (55%), but significant proportions of male (16%) and female (19%) children are also exposed.

7/11/2012
16
31
Type of Wet Market Exposure in Past 7 Days
Type of exposure
East
Jakarta
(n=1260)
Bogor
(n=1260)
Total
(n=2520)
Been exposed to live birds
Handled live birds
Handled slaughtered poultry
Exposed to wild birds or bird feces
Visited traditional market
Bought poultry meat at traditional market
42.5
6.2
40.8
16.9
33.1
36.4
21.9
2.7
12.4
52.3
14.8
16.6
31.4*
4.0*
22.9*
39.2*
21.6*
23.9*
Types of exposure in the wet market varied somewhat between Bogor and East
Jakarta. In Bogor, those going to the wet market were more likely to be
exposed to wild birds or bird feces, while in East Jakarta exposure to live birds,
handling of slaughtered poultry and buying poultry meat were more common.
32
POSSIBLE EXPOSURE TO AI

7/11/2012
17
33
Household Exposure to Avian Outbreaks
Type of exposure
East
Jakarta
(n=1260)
Bogor
(n=1260)
Total
(n=2520)
Own chickens:
Any chickens fallen sick past 6
months?
How many died? (Half or more)
Any sudden deaths past 6
months?
8.0
0.7
11.2
21.9
5.5
16.9
31.4*
4.8*
16.0
Chickens in neighborhood:
Any chickens died past 6
months?
How many died? (Half or more)
Were any culled?
7.4
0.0
1.1
32.1
2.7
6.6
22.0*
2.3
5.8
The HUS asked a
series of questions
about deaths of
chickens in their own
flock or in the
neighborhood, which
could indicate an AI
outbreak. Households
in Bogor were more
likely to report that
some of their birds had
died and that birds had
died in their
neighborhood.
They were also more likely to report that the mortality involved half or more of their
own flock; 6% in Bogor reported those higher mortality rates, which was significantly
higher than in East Jakarta.
34
In an effort to examine
links between
hospitalization and wet
market exposure, the
survey asked whether
those hospitalized with
any of the main AI
symptoms (fever, cough
or shortness of breath) in
the past year had been
exposed to slaughtered
poultry at the wet market
in the past week. Of
those hospitalized for AI
symptoms, 39% reported
wet market exposure
while 28% reported no
wet market exposure.
Hospitalization and Exposure to Wet Markets

7/11/2012
18
35
Similarly, those
hospitalized for AI
symptoms in the past year
were more likely to have
shopped at a traditional
market in the past week.
Although these questions
used a different time frame
(past year, past week), the
correlation suggests a
pattern worthy of further
investigation.
Hospitalization and Exposure to Wet Markets
36
KNOWLEDGE & ATTITUDES
ABOUT AI & ILI

7/11/2012
19
37
General Knowledge of AI Risk
General knowledge of avian influenza is high:
• 97.2% of respondents say they have heard of AI
• 84.4% of those who know about AI know that
humans can get AI/flu burung
38
Knowledge of AI
Transmission
ModesHowever, specific knowledge of
how AI is transmitted was
superficial: 47% said AI was
transmitted through contact with
sick birds, 31% said through
general contact with poultry and
13% said through contact with
dead chickens.
Overall, no other mode of
transmission was mentioned by
more than 10% of respondents,
although residents in East Jakarta
were more likely to mention
contact with live chickens and
feces at the wet market and
consuming undercooked sick
chickens or eggs.
Mode of transmission mentioned
East
Jakarta
(n=1260)
Bogor
(n-1260)
Total
(n=2520)
Contact with…
Sick chickens
Sick chicken feces
Sick fighting cocks
Dead chickens
Sick wild birds
Sick chicken meat at home
Sick chicken meat wet market
Live chickens or feces at wet market
A person who has AI
With poultry in general
Feathers
Saliva
43.3
0.6
2.0
14.7
8.5
5.6
1.1
10.8
7.4
32.1
6.8
5.3
49.5
0.5
0.5
13.1
1.0
5.2
0.3
2.7
8.6
29.3
6.7
2.7
46.6
0.5
1.2*
13.8
4.5*
5.4
0.6*
6.5*
8.1
31.3
6.8
4.5
Feeding or caring for sick chickens 2.4 1.4 1.8
Eating…
Undercooked sick chicken or eggs
Raw chicken products
Sick chicken meat
Poultry in general
12.3
2.6
5.3
3.7
6.6
1.8
10.7
5.3
9.3*
2.2
6.8
6.8

7/11/2012
20
Symptom mentioned Seasonal flu Flu burung
Difficult/fast breathing* 2.8 13.2
Tight chest/congestion* 0.4 2.4
Fever 66.1 59.3
Cough* 33.9 11.4
Muscle ache* 2.4 1.5
Sore throat* 16.7 6.1
Stuffed/blocked nose* 29.6 5.6
Runny nose* 34.4 8.3
Sneezing* 44.7 7.5
Earache/ear discharge 0.1 0.1
Rash 0.5 1.0
Nausea/vomiting* 1.2 2.8
Seizures* 0.1 1.4
Knowledge of AI vs Seasonal Flu Symptoms
39
Regarding knowledge of symptoms of AI, the HUS data suggest that people may recognize some differences between AI and seasonal influenza.
They are more likely to correctly associate difficulty breathing and chest congestion with AI, while considering cough, nasal congestion and sneezing as more common in seasonal influenza.
Unfortunately, only about 15% associate difficulty breathing with AI, even though it is one of the most important signs besides fever.
40
Perceived Severity of AI and Seasonal Flu
mean s.e. p
Likelihood of dying from seasonal influenza
Likelihood of dying from AI
1.61
3.75
0.06
0.04
Difference between AI
and seasonal flu
is significant.
AI is perceived to be a more serious illness than seasonal influenza with
people rating AI more than twice as high on a six-point perceived severity
scale.

7/11/2012
21
41
CARESEEKING KNOWLEDGE & BEHAVIOR
42
Preferred Service Delivery Sites
East Jakarta
(n=1260)
Bogor
(n=1260)
Total
(n=2520)
Men Women Men Women Men Women
Preferred source of services
Public hospital
Private hospital
Sub-district puskesmas
Village puskesmas
Other government clinic
Private clinic
Pharmacy/shop
Traditional healer/dukun
Midwife
Other
27.1
17.9
26.0
27.3
1.8
44.4
12.9
8.0
2.4
17.1
25.3
18.7
31.6
32.2
0.9
41.8
11.2
6.1
12.2
13.2
9.0
14.7
26.4
23.1
0.6
30.9
8.7
4.1
9.5
42.8
8.6
15.6
28.8
30.4
0.8
28.5
6.0
6.7
30.1
34.0
15.6
15.9
26.2
24.9
1.1
35.8
10.2
5.5
6.9
33.5
14.8
16.7
29.8
31.1
0.8
33.4
7.9
6.5
23.5
26.4
General preferences for service providers favor the sub-district puskesmas,
village puskesmas, private clinics and midwives.
7/11/2012
22
43
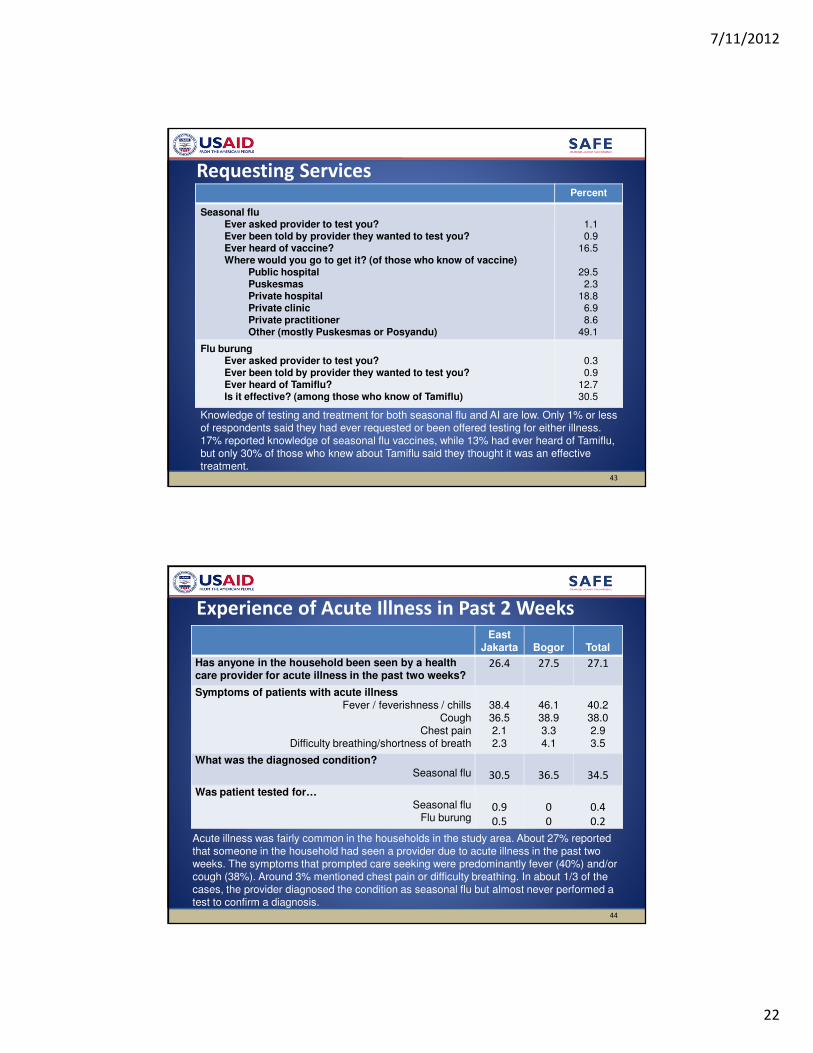
Requesting ServicesPercent
Seasonal fluEver asked provider to test you?Ever been told by provider they wanted to test you?Ever heard of vaccine?Where would you go to get it? (of those who know of vaccine)
Public hospitalPuskesmasPrivate hospitalPrivate clinicPrivate practitionerOther (mostly Puskesmas or Posyandu)
1.10.9
16.5
29.52.3
18.86.98.6
49.1
Flu burungEver asked provider to test you?Ever been told by provider they wanted to test you?Ever heard of Tamiflu?Is it effective? (among those who know of Tamiflu)
0.30.9
12.730.5
Knowledge of testing and treatment for both seasonal flu and AI are low. Only 1% or less of respondents said they had ever requested or been offered testing for either illness. 17% reported knowledge of seasonal flu vaccines, while 13% had ever heard of Tamiflu, but only 30% of those who knew about Tamiflu said they thought it was an effective treatment.
44
Experience of Acute Illness in Past 2 WeeksEast
Jakarta Bogor Total
Has anyone in the household been seen by a health care provider for acute illness in the past two weeks?
26.4 27.5 27.1
Symptoms of patients with acute illnessFever / feverishness / chills
CoughChest pain
Difficulty breathing/shortness of breath
38.436.52.12.3
46.138.93.34.1
40.238.02.93.5
What was the diagnosed condition?Seasonal flu 30.5 36.5 34.5
Was patient tested for…Seasonal flu
Flu burung0.9
0.5
0
0
0.4
0.2
Acute illness was fairly common in the households in the study area. About 27% reported that someone in the household had seen a provider due to acute illness in the past two weeks. The symptoms that prompted care seeking were predominantly fever (40%) and/or cough (38%). Around 3% mentioned chest pain or difficulty breathing. In about 1/3 of the cases, the provider diagnosed the condition as seasonal flu but almost never performed a test to confirm a diagnosis.

7/11/2012
23
45
Care seeking NormsWhat should you do if you/someone in
your family had…?
Fever
& cough
Fever, cough &
difficult breathing
You Family You Family
Bring to health center immediately 13.7 18.7 31.1 30.7
Bring to doctor immediately 14.9 23.0 47.4 49.6
Give medicine at home 14.3 12.4 4.6 4.2
Give fluids at home 4.9 2.3 0.6 0.2
Buy treatment from pharmacy or shop 20.1 19.0 7.5 7.0
Contact kader 0.06 0.12 0 0
Traditional treatment or get from dukun 3.2 1.8 1.4 1.3
Other (mostly use OTC treatment) 28.9 22.7 7.4 7.0
To explore care-seeking norms, the HUS asked respondents what should be done in case of fever & cough or fever, cough & difficulty breathing. People were more likely to say they should seek care immediately from the puskesmas or doctor if the more severe symptoms occurred. Thiswas true for both self and family members.
There was some evidence of preference for early self-treatment (giving medicines or fluids at home, seeking a remedy from a pharmacy or dukun), particularly when the symptoms were a little less severe.
46
Response to Acute Illness Events in Past 2 Weeks
East Jakarta
(n=1260)
Bogor
(n=1260)
Total
(n=2520)
Fever &
cough
Fever,
cough,
difficulty
breathing
Fever &
cough
Fever,
cough,
difficulty
breathing
Fever &
cough
Fever,
cough,
difficulty
breathing
Has anyone in the household
suddenly fallen ill with…
13.9 1.6 20.5 4.4 18.1 3.3
What did you do?
Waited
Gave medicine/fluids at home
Went to a pharmacy/shop
Went to private clinic
Went to healer/dukun
Went to private hospital
Went to puskesmas
Went to sub-district puskesmas
2.0
47.9
16.7
10.4
0.9
1.0
10.9
10.4
0
37.6
20.2
21.9
3.5
5.4
2.1
13.9
2.7
29.4
19.4
7.2
2.8
3.2
9.4
12.5
2.7
14.8
22.6
15.1
0
3.6
7.8
12.6
2.5
34.6
18.6
8.1
2.3
2.6
9.8
11.9
2.2
18.7
22.2
16.3
0.6
3.9
6.9
12.9
Regarding actual careseeking behavior, of those who suddenly fell ill with fever
and cough, more than half chose to self-treat at home or use remedies from a
pharmacy. Over 40% chose to self-treat even when the symptoms included
shortness of breath.

7/11/2012
24
47
Choice of Healthcare Provider for Fever, Cough, or Difficult Breathing
Of households where someone experienced an acute respiratory event, 62% (n=445) sought treatment (not shown).
Among households that sought treatment from a healthcare provider for these symptoms, private clinics were most commonly used (27%). Sub-district puskesmas (18%), village puskesmas (14%), and private doctors (13%) were used fairly commonly. It is notable that midwives are also visited for these symptoms (9%), slightly more so than private hospitals (7%) or public hospitals (4%).
Total(weighted)
%
Sources of professional care for household members seeking treatment for fever, cough, or difficult breathing in previous 2 weeks
First care-seeking household member (n=390)Private clinic
Sub-district puskesmas
Village puskesmas
Private doctor
Midwife
Public hospital
Private hospital
Nurse
Traditional healer
Second care-seeking household member (n=55)Private clinic
Sub-district puskesmas
Village puskesmas
Private doctor
Midwife
Public hospital
Private hospital
Nurse
Traditional healer
105
69
51
50
38
15
30
4
4
9
12
8
9
2
3
0
1
0
26.8
17.7
13.0
12.8
9.9
4.0
7.6
1.0
1.1
17.2
21.8
15.8
17.1
4.3
5.7
0.0
1.90.0
48
Choice of Healthcare Provider for other Acute SymptomsIn the prior two weeks, slightly fewer than 40% of respondents who sought care for an acute health event did so for symptoms that were not characteristic of AI (diarrhea, sore throat, nasal congestion, pneumonia or respiratory infection, headache, body ache, and others).
The choice of healthcare facility was similar to facilities used by patients with potential AI symptoms. The most popular source of care for these acute symptoms was a private clinic (20%, n=294 patients). As with the other sample, there was little difference in popularity between sub district puskesmas (16%), village puskesmas (15%), and private doctors (15%). Among these patients, midwives used by fewer patients (7%) than public or private hospitals (14% and 8%, respectively).
Total(weighted)
%
Sources of professional care for household members seeking treatment for other acute symptoms in previous 2 weeks
First care-seeking household member (n=273)Private clinic
Sub-district puskesmas
Village puskesmas
Private doctor
Midwife
Public hospital
Private hospital
Nurse
Traditional healer
Second care-seeking household member (n=21)Private clinic
Sub-district puskesmas
Village puskesmas
Private doctor
Midwife
Public hospital
Private hospital
Nurse
Traditional healer
55
46
40
40
22
38
23
14
3
6
0
4
4
0
2
0
2
1
20.1
17.0
14.6
14.6
7.9
13.9
8.3
5.0
1.0
27.6
0.0
19.0
18.2
0.0
8.9
0.0
7.9
4.0

7/11/2012
25
49
E.
Jakarta
(%)
Bogor
(%)
p
Reason for choosing specific healthcare
facility for fever/cough (n=190)
Quality of medicine
Accessibility of facility
Cost of services
Cost of medication
Hours/days of service
Quality of providers
Waiting time
Privacy
Availability of medicine in facility
How patients are treated
50.0
30.3
18.2
14.1
10.1
6.3
4.1
3.1
2.3
2.1
27.8
25.3
15.8
16.1
3.3
2.3
0.5
2.9
0.8
0.0
0.04
-
-
-
-
-
0.03
-
-
-
Important Factors in Choosing Healthcare Facility
Quality, accessibility, and cost were the most frequently cited reasons for choosing a facility among those households that sought treatment for patients with fever and cough.
Caregivers in East Jakarta were significantly more selective based on the perceived quality of medicine; half of the respondents provided this reason, compared to 28% in Bogor. Waiting time was significantly more important to East Jakarta respondents (4.1%) than respondents in Bogor (0.5%).
50
Symptomatic Households Not Seeking Care
E.
Jakarta
(%)
Bogor
(%)
p
Reasons for not seeking care at a facility for
fever/cough (n=228)
Did not feel they were sick enough
Received care at home
Felt patient was getting better on their own
Too expensive (can’t afford)
Didn't’have the time
No transportation
Too far to travel
Patient is too old to seek care
Work wouldn’t allow it
Nobody to take care of children
54.6
28.7
22.4
5.5
2.9
0.0
1.8
1.4
0.9
0.0
45.5
5.6
17.2
15.7
1.8
3.1
2.4
0.0
0.0
0.0
-
<0.001
-
0.03
-
-
-
-
-
-
Among households that reported NOT seeking care for members with fever, cough and difficulty breathing, the largest proportion (roughly half) said they didn’t think the patient was sick enough to need professional care.
Two reasons for not seeking care varied significantly by district. In East Jakarta, significantly more respondents chose to treat the patient at home (28.7%) compared to 6% in Bogor. A significantly higher proportion of respondents in Bogor said they did not seek treatment because they could not afford it (16%), compared to almost 6% in East Jakarta who reported cost as a reason.

7/11/2012
26
51
Waiting Time Before Seeking Facility-Based CareEast Jakarta
(n=46)
Bogor
(n=145)
Total
(n=191)
How long did you wait?
Less than 1 day
One to two days
Three to four days
More than 4 days
Never went to a facility
24.0
59.4
13.0
0.6
3.0
16.6
42.9
15.0
1.2
24.3
18.4
46.8
14.5
1.1
19.2
Why did you wait more than two days?
Didn’t think it was a serious illness
Thought it was a common illness
(n=7)
31.5
31.2
(n=24)
31.7
23.3
(n=31)
31.6
25.1
Why did you wait less than 2 days?
Thought it was a dangerous disease
Feel it is important to go to facility
(n=42)
19.7
63.5
(n=95)
45.6
40.6
(n=137)
37.7
47.6
Other reasons for waiting more than two days (open response)
Tried home/over-the-counter treatment first; illness didn’t respond after 2-3 days (n=6)
Waiting until they had enough money (n=4)
Logistics (transportation, availability) (n=3)
Patient is too young (<6 months old) (n=1)
Regarding waiting time to seek care for acute respiratory symptoms, more than 65% said they sought
care within 2 days, but 20% (mostly in Bogor) said they never went to a facility for care. Reasons for
waiting longer than two days were low risk perceptions (common illness, not serious) while reasons for
seeking care quickly were higher risk perception (thought it was dangerous) or a careseeking norm (felt
it was important to seek care).
52
Careseeking Knowledge: Wait or Not?E. Jakarta
(mean)Bogor (mean)
p
If fever or cough, best to seek immediate care.
(0=completely disagree; 5=completely agree)
Households with previous sudden fever/cough
Households with no previous sudden fever/cough
3.95
3.86
4.23
4.13
0.01
<0.001
Best to wait a few days upon falling ill before seeking
treatment; might take care of itself.
(0=completely disagree; 5=completely agree)
Households with previous sudden fever/cough
Households with no previous sudden fever/cough
1.73
1.65
1.64
1.90
-
<0.001
Previous household experience with sudden onset of fever/coughing and urban city each significantly
predicted respondents’ recognition of the need for immediate care. Overall, households that had
previously experienced sudden fever and coughing were more likely to say that it was best to seek
immediate care (mean=4.15) compared to households with no previous experience with these
symptoms (mean=4.03, p=0.02). Mean scores were higher in Bogor than in East Jakarta.
Households in East Jakarta) that had never experienced sudden fever/coughing were least likely to say
that it was best to seek immediate care for these symptoms, whereas households in Bogor that had
experienced sudden fever/cough were most likely to say it was best to seek immediate care.

7/11/2012
27
53
Careseeking Knowledge: Safe Waiting Time
E. Jakarta(mean)
Bogor(mean)
p
Number of days it is safe to wait after falling ill
Households with previous sudden fever/cough
Households with no previous sudden fever/cough
1.07
1.02
1.61
1.74
<0.01
<0.001
Number of days since falling ill it is NOT safe
(dangerous) to wait
Households with previous sudden fever/cough
Households with no previous sudden fever/cough
2.07
2.01
2.62
2.78
<0.01
<0.001
Despite expressing stronger beliefs in the importance of seeking immediate care, the amount of time
perceived to be safe to wait before seeking care was significantly higher among Bogor households
compared to those in E. Jakarta, both among households that had experienced fever/cough and those that
had not. Households in each district, regardless of previous experience with fever/cough, perceived a safe
window of time to be under 48 hours.
On average, households in Bogor (especially those with no previous experience with sudden fever/cough)
believed that it only became dangerous to wait to seek care until approximately 65 hours had passed after
developing symptoms. In contrast, households in E. Jakarta were significantly more accurate in identifying
the 48-hour time period (citing approximately 49 hours as being the point at which it becomes dangerous
to wait to seek care).
54
TOWARD BEHAVIORAL MESSAGING
What predicts knowledge, risk perceptions,
efficacy and careseeking?

7/11/2012
28
55
What Makes AI Salient?Recognizing Types of Exposure that Require Vigilance
Generally speaking, people are unlikely to practice protective health behaviors if a particular
health threat is not salient. Knowledge of and risk perceptions related to AI are known to
predict lower risk poultry rearing, poultry handling and hygiene behaviors, so it is likely that
they predict careseeking behavior as well. This section examines relationships between AI
knowledge, risk perceptions, efficacy and careseeking behavior.
Because there were no identified cases of AI in this sample, analysis of reactions to actual AI
cases was not possible.
As a proxy, we examined patterns of potential exposure in households that had ever or never
previously experienced possible symptoms of AI (sudden onset of fever/coughing, difficulty
breathing), then analyzed household characteristics, attitudes, risk perception and efficacy
associated with careseeking.
First, we examined patterns of potential exposure that result from routine household
shopping and poultry handling practices in East Jakarta and Bogor. In both districts, the only
factor that was different between households with and without sudden onset of fever and
cough was contact with another symptomatic patient within the past 7 days (not a known
exposure pathway for AI).
See tables on the following two pages.
56
Sudden
fever/cough
(ever)
No sudden
fever/cough
(ever)
p
Household raises:
Chickens
Ducks
Turkey, geese, entog
Birds
Poultry indoors:
Poultry kept indoors at any time (caged or uncaged)
Poultry roam freely indoors
In past 7 days:
Exposed to birds at wet market
Handled live birds at wet market
Handled slaughtered birds at wet market
Exposed to wild birds/bird feces
Visited traditional market with live poultry
Bought poultry meat at traditional market
In contact with symptomatic person
(%)
5.6
1.1
0.0
10.8
26.4
6.5
49.1
4.7
43.1
24.0
36.2
41.8
9.1
(%)
8.9
1.0
0.1
11.5
19.6
12.2
47.6
6.3
40.5
15.9
32.9
35.8
2.9
-
-
-
-
-
-
-
-
-
-
-
-
<0.01
Presence of Potential Exposures in Households
by Previous Experience with Symptoms:
East Jakarta

7/11/2012
29
57
Sudden
fever/cough
(ever)
No sudden
fever/cough
(ever)
p
Household raises:
Chickens
Ducks
Geese
Turkey
Birds
Poultry indoors:
Poultry kept indoors at any time (caged or uncaged)
Poultry roam freely indoors
In past 7 days:
Exposed to birds at wet market
Handled live birds at wet market
Handled slaughtered birds at wet market
Exposed to wild birds/bird feces
Visited traditional market with live poultry
Bought poultry meat at traditional market
In contact with symptomatic person
(%)
24.5
2.7
1.3
0.1
6.7
23.2
48.8
25.3
3.4
14.6
54.8
36.2
19.4
17.1
(%)
27.7
1.8
0.3
0.0
6.2
15.5
32.5
21.1
2.5
11.9
51.8
32.9
15.9
8.6
-
-
-
-
-
-
-
-
-
-
-
-
-
<0.01
Presence of Potential Exposures in Households
by Previous Experience with Symptoms:
Bogor
Effects of Knowledge and Risk Perceptions on Poultry
Keeping Practices
58
Although there were no significant differences in the occurrence of AI symptoms by
potential sources of H5N1 exposure, there was significant variation in knowledge of AI
and risk perception among households with different poultry-keeping practices. These
relationships often remained when controlling for indicators of socioeconomic status
(educational level, wealth as indicated by total household goods, and district).
In this sample, educational levels and number of household goods were lower among
households that owned chickens compared to households without chickens (p<0.001),
as well as among those that allowed poultry to roam indoors versus households that
owned poultry, but did not allow free indoor roaming (p<0.001). Socioeconomic
characteristics did not vary significantly between households that kept poultry in the
household (i.e., including caged) compared to those that only kept poultry outside the
house (not shown).

7/11/2012
30
59
Effect of Owning Chickens on AI Awareness & Knowledge
HHs with
Chickens
(n=406)
HHs
without
Chickens
(n=2114)
p
General Awareness
Awareness of AI (%)
Awareness that humans can get AI (%)
Knowledge of transmission modes
Contact with sick chicken
Chicken feces
Visiting wet market
Contact with sick wild birds
Handling sick chicken in wet market
Undercooked sick chicken/eggs
Humans (misconception)
92.2
85.5
50.1
1.4
0.0
1.4
0.0
10.0
2.9
95.0
93.8
49.2
0.4
0.8
5.2
0.8
5.6
9.1
0.01
<0.001
n.s.
n.s.
n.s.
0.003
0.04
0.03
0.01
Comparing households
that raised chickens (the
most common type of fowl
raised by this sample) to
those without chickens
revealed significant
differences in knowledge,
but chicken ownership was
not a strong predictor of
aspects of care-seeking or
risk perception.
Households that raised
chickens had significantly
lower awareness of AI as well as lower awareness that humans could contract AI (when controlling for
socioeconomic variables, p=0.001). Awareness of some transmission vector differed slightly (but
significantly). Notably, households without chickens incorrectly identified human transmission as an
exposure pathway for AI more than households with chickens while households with chickens were
more likely to mention consuming undercooked poultry products from sick chickens as a transmission
vector.
60
Effect of Owning Chickens on Care-Seeking Attitudes
and BeliefsHHs with
Chickens
(n=406)
HHs without
Chickens
(n=2114)
p
Care-Seeking
Reported likelihood of seeking care for fever/sore throat/difficult
breathing AND in contact with birds in prior 2 weeks (mean)
Reported likelihood of seeking care for fever/sore
throat/difficulty breathing AND been to wet market (mean)
Number of days respondent feels it’s safe to wait before seeking
care after someone falls ill (mean)
Number of days respondent feels it becomes dangerous if care-
seeking is delayed (mean)
3.47
3.41
1.66
2.68
3.69
3.61
1.41
2.43
0.02
0.02
0.053
0.056
In households with chickens, respondents were less likely to say they would seek care for
fever/cough/difficulty breathing even in the patient had been in recent contact with birds or at the the
wet market. They were more likely to say they would wait longer to seek care. However, none of those
differences were significant after controlling for socioeconomic status.

7/11/2012
31
61
Among all households with poultry (n=617), those that kept their poultry inside were less
likely to seek care fever/cough compared to households that kept their poultry outside,
even when controlling for wealth, education, and district (p=0.03) (not shown).
Nearly sixteen percent (15.8%) of households with poultry kept indoors sought care when
household members had fever/cough, compared to 45.2% of households that kept their
poultry outside the home. There were no other significant differences in knowledge, risk
perception, or care-seeking between households that raised poultry outside the house only,
compared to those that kept poultry inside the house (not shown).
However, these associations are particularly strong in households where poultry is allowed
to roam freely inside the household, instead of being caged. Those who allow poultry into
the house are less knowledgeable about some risk factors, less likely to believe that
immediate careseeking for fever/cough was necessary, less likely to believe they could
protect their family and seek necessary care, more likely to rely on traditional forms of
treatment and less likely to seek professional care. This suggests some complacency
regarding risk among those who live in closer proximity to birds.
Effects of Poultry Keeping Practices on Careseeking
62
Indoor Roaming Associated with
Lower Knowledge about AIAllow
Poultry to
Roam
Indoors
(n=156)
No
Indoor
Roamin
g
(n=458)
p
General awareness
Awareness of AI (%)
Awareness that humans can get AI (%)
Knowledge of transmission modes
Contact with sick chicken
Chicken feces
Visiting wet market
Handling sick chicken
Feeding/caring for sick chicken
Undercooked sick chicken/eggs
91.0
81.5
50.1
1.4
0.0
0.5
0.3
1.3
95.0
88.7
49.2
0.4
0.8
4.5
3.2
8.5
n.s.
0.05
n.s.
n.s.
n.s.
0.04
0.04
0.03
The complacency
hypothesis is supported
by evidence that
households that allowed
indoor roaming of poultry
(30% of households with
poultry) were less likely to
know that humans could
contract AI less likely to
mention that handling,
feeding, or caring for sick
chickens, and eating
undercooked sick chicken
or eggs were risk factors
for contracting AI.
After controlling for socioeconomic status (education, wealth, and district), awareness that humans
can get AI, as well as feeding or caring for sick chickens, no longer predicted letting poultry roam
indoors, but knowledge about handling sick chickens (OR=0.09, p=0.05) and knowledge that
undercooked sick chicken or eggs (OR=0.17, p=0.04) could transmit AI remained significant.

7/11/2012
32
63
Indoor Roaming Associated with
Lower Risk Perception and Lower Self-EfficacyAllow
Poultry to
Roam
Indoors
(n=156)
No Indoor
Roaming
(n=458)
p
Risk Perception / Self-Efficacy
(0=completely disagree; 5=completely agree)
Belief that immediate treatment is necessary for fever/cough (mean)
Confidence in protecting self/family from AI (mean)
Confidence in seeking medical care when needed (mean)
3.82
3.25
3.61
4.13
3.68
3.97
0.02
0.02
<0.001
Similarly, households that allowed indoor roaming of poultry had significantly weaker beliefs in the necessity of
immediate treatment for fever/cough, and were significantly less confident about their ability to seek medical care
when needed. Despite the fact that the majority of respondents in both groups (68% with indoor roaming and 77%
with no roaming, n.s.) directly cared for their own poultry, those in households with indoor roaming still expressed
lower confidence that they could protect their household from AI.
After controlling for socioeconomic status (education, wealth, and district), confidence remained significantly lower
among households with indoor roaming that they could protect themselves and their family from AI (p=0.03) and
that they could seek medical care when needed (p=0.001). These households also continued to express lower
agreement with the importance of seeking immediate care for fever/cough when controlling for socioeconomic
status (p=0.01).
64
Indoor Roaming Associated with
Lower Likelihood of Seeking CareAllow Poultry to
Roam Indoors
(n=156)
No Indoor
Roaming
(n=458) p
Care-Seeking (0=highly unlikely; 5=highly likely)
Reported likelihood of seeking care for fever/sore
throat/difficulty breathing (mean)
Reported likelihood of seeking care for fever/sore
throat/difficult breathing AND in contact with birds in
prior 2 weeks (mean)
3.48
3.31
3.66
3.62
n.s.
0.03
Careseeking intentions in the event of fever, sore throat and difficulty breathing did not significantly differ
according to indoor roaming in the household except among those that contact with birds in the previous
two weeks; this was significantly compared to other households that also owned poultry (contained or
kept outside). However, these differences were no longer significant after controlling for socioeconomic
status.
Households that allow indoor roaming of poultry were much more likely to use traditional treatment or
obtain treatment from a dukun compared to households that did not allow indoor roaming (OR=17.6,
p=0.014). The association was even stronger when controlling for district (OR=22.3, p<0.001).
Household wealth clearly plays a role in the likelihood of protective behaviors such as poultry keeping
practices and careseeking, but it does not appear to be the only factor affecting careseeking.

7/11/2012
33
65
Confidence about Self-Protection and Caregivers by
Previous Hospitalization Experiencemean s.e. p
Confidence in protecting self from AI (range 0-5, disagree to agree)
Among households (hh) with…
Hospitalizations for AI symptoms
Hospitalizations for other symptoms
No hospitalizations
Multiple members hospitalized
Among hh with any deaths
3.62
3.36*
3.72
3.62
3.16
3.62
0.03
0.04
0.09
0.04
0.49
0.16
0.02
If have AI, confident health care provider will give proper care
(0=completely disagree, 5=completely agree)
Among households with…
Hospitalizations for AI symptoms
Hospitalizations for other symptoms
No hospitalizations
Multiple members hospitalized
Among hh with any deaths
3.76
3.73
3.82
3.75
3.94
3.65
0.03
0.11
0.08
0.03
0.26
0.13
ns
Households where someone had been hospitalized with AI-like symptoms were less confident
about self-protection, perhaps they have experienced illness directly and realize that infection is
possible. Hospitalization did not affect confidence in caregivers.
66
Perceived Susceptibility by Previous
Hospitalization Experiencemean s.e. p
Likelihood of contracting AI
Among households…
Observed by surveyor to own poultry
Observed by surveyor to have poultry in house
Where >50% of flock had died from illness
That allow poultry to roam indoors
Among respondents who say AI is contracted via exposure to:
Contact with sick chicken
Contact with chicken feces
Handling chicken in wet market
1.66
1.75
1.77
1.78
1.85
1.70
1.32
1.09
0.05
0.08
0.12
0.19
0.12
0.06
0.39
0.30
ns
0.06
Consistent with earlier analyses, households observed to have chickens or to have them in the
house or that had previously experienced a sudden episode of mortality among their poultry
were not significantly more likely to believe they were susceptible to AI. Those who knew that AI
could be transmitted through contact with chicken feces or by handling chickens in the wet
market felt marginally less susceptible to AI, suggesting that they may have a false sense of
safety about buying poultry at the wet market.

7/11/2012
34
67
Careseeking Self-Efficacy by Poultry Ownershipmean s.e. p
Confident can seek care if needed
Among households…
Observed by surveyor to own poultry
Observed by surveyor to have poultry in house
That own poultry (self-report)
With no poultry (self-report)
That allow poultry to roam indoors
3.87
3.78
3.99*
3.87
3.61**
0.07
0.10
0.03
0.07
0.11
ns
0.04
<0.001
Confident can tell when need to seek care
Among households…
Observed by surveyor to own poultry
Observed by surveyor to have poultry in house
That own poultry (self-report)
With no poultry (self-report)
That allow poultry to roam indoors
3.82
3.78
3.83
3.89
3.62**
0.05
0.07
0.05
0.03
0.10
Ns
ns
<0.01
Poultry owners were more likely to express confidence in their ability to seek care if
needed, while those who allow poultry to roam indoors were less confident about seeking
care and knowing when to seek care.
68
Self-efficacy about Recovery and Self-Protection by Poultry Ownership
mean s.e. p
People with AI can recover if brought to puskesmas quickly
Among households…
Observed by surveyor to own poultry
Observed by surveyor to have poultry in house
That own poultry (self-report)
With no poultry (self-report)
That allow poultry to roam indoors
3.44
3.73*
3.44
3.38
3.52
0.06
0.10
0.06
0.04
0.12
<0.001
Confident can protect self from AI
Among households…
Observed by surveyor to own poultry
Observed by surveyor to have poultry in house
That own poultry (self-report)
With no poultry (self-report)
That allow poultry to roam indoors
3.56
3.30*
3.55
3.64
3.25*
0.07
0.15
0.07
0.04
0.15
0.03
0.02
Households observed to have poultry in the house were more confident than other groups in
their ability to recover from AI if brought to the puskesmas quickly. But they were LESS confident
about self-protection, suggesting that they don’t think there is much they can do to prevent
infection and choose to rely instead on rapid treatment if they become infected. As earlier
analysis showed, however, this group is also MORE likely to rely on traditional remedies and less
likely to seek care at all (see Slides 60 and 64).

7/11/2012
35
Other Careseeking Predictors: HH Characteristics
69
Among households that
had experienced fever and
cough, there were no
significant differences in
demographics (age of
respondent, education,
wealth, district),
knowledge of AI, or risk
perception between those
that sought treatment and
those that did not.
Sought
care for
fever/cough
(n=146)
Did not seek
care for
fever/cough
(n=231) p
DEMOGRAPHICS
Age (mean)
EducationNone
Some primary school
Primary school
Junior high school
High school
Academy
University
Number of household goods (mean)
DistrictEast Jakarta (% within district)
Bogor (% within district)
41.5
7.1
14.1
33.6
17.7
20.0
5.1
2.4
9.9
40.6
37.7
39.9
5.8
17.2
26.8
14.4
24.9
5.3
5.5
10.7
59.4
62.3
-
-
-
-
Other Careseeking Predictors: Knowledge & Risk Perception
70
Sought
care
for
fever/c
ough
(n=146)
Did not
seek
care for
fever/c
ough
(n=231)
p
Knowledge
Mention fever OR cough as AI symptoms (%)
Mention fever AND cough as AI symptoms (%)
Mention fever, cough, OR difficulty breathing as
AI symptoms (%)
Risk Perception
Perceived likelihood of death from AI if infected
(mean; 0=highly unlikely, 5=highly likely)
Perceived likelihood of self/family being
infected with AI (mean; 0=highly unlikely,
5=highly likely)
Belief that recovery from AI is possible with
rapid treatment (mean; 0=strongly disagree,
5=strongly agree)
61.5
11.0
39.9
3.74
1.85
3.54
58.1
11.1
36.7
3.87
1.62
3.40
-
-
-
-
-
-
Among households that
had experienced fever
and cough, there were
no significant
differences in measures
of knowledge or risk
perception between
those that sought
treatment and those that
did not.

7/11/2012
36
Predictors of Delay in Careseeking: HH Characteristics
71
Most of respondents who visited a facility for fever/cough did so within 48 hours.
Respondents who waited longer to seek care (48 hours or more) either had slightly lower levels of education or were the most educated (i.e., university) (approaching significance, p=0.06).
Time to seek care was significantly associated with wealth; having fewer household goods was associated with longer time to care-seeking (p=0.05)
Sought
care
<48
hours
(n=136)
Sought
care >48
hours
(n=30) p
DEMOGRAPHICS
Age (mean)
EducationNone
Some primary school
Primary school
Junior high school
High school
Academy
University
Number of household goods (mean)
DistrictEast Jakarta (% within district)
Bogor (% within district)
39.7
6.3
11.2
29.0
20.3
22.5
7.0
3.8
10.3
85.9
78.5
44.6
4.4
32.5
37.6
8.0
10.3
0.0
7.1
8.7
14.1
21.5
-
0.0
6
0.0
5
-
Predictors of Delay in Careseeking: Knowledge & Risk Perception
72
Sought
care
<48
hours
(n=136)
Sought
care
>48
hours
(n=30)
p
Knowledge
Mention fever OR cough as AI symptoms (%)
Mention fever AND cough as AI symptoms (%)
Mention fever, cough, OR difficulty breathing as
AI symptoms (%)
Risk Perception
Perceived likelihood of death from AI if infected
(mean; 0=highly unlikely, 5=highly likely)
Perceived likelihood of self/family being
infected with AI
(mean; 0=highly unlikely, 5=highly likely)
Belief that recovery from AI is possible with
rapid treatment
(mean; 0=strongly disagree, 5=strongly agree)
59.4
12.9
78.8
3.76
1.95
3.42
75.0
23.6
87.8
3.77
1.87
3.95
-
-
-
-
-
-
Among households that had sought
treatment for fever and cough, there
were no significant differences in
measures of knowledge or risk
perception between those that
sought treatment and those that did
not.
Although not significant, households
that waited to seek care correctly
identified AI symptoms more often
than households that sought care in
under 48 hours, as well as
expressing a stronger belief that
recovery from AI is possible with
rapid treatment. That these
households did not seek treatment
within the recommended 48 hours
suggests that they be over-
confidence about their ability to
identify and address AI, and
determined that their episodes of
fever/cough were not cause for
alarm.
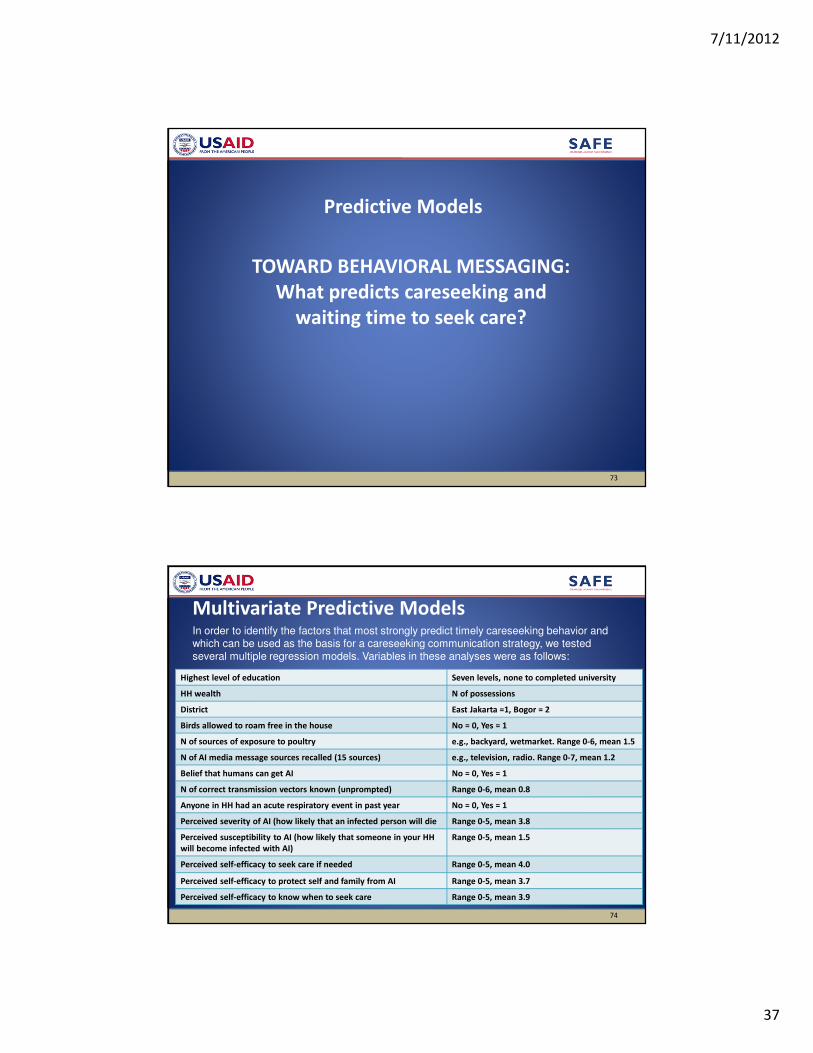
7/11/2012
37
73
TOWARD BEHAVIORAL MESSAGING:
What predicts careseeking and
waiting time to seek care?
Predictive Models
74
Multivariate Predictive ModelsIn order to identify the factors that most strongly predict timely careseeking behavior and which can be used as the basis for a careseeking communication strategy, we tested several multiple regression models. Variables in these analyses were as follows:
Highest level of education Seven levels, none to completed university
HH wealth N of possessions
District East Jakarta =1, Bogor = 2
Birds allowed to roam free in the house No = 0, Yes = 1
N of sources of exposure to poultry e.g., backyard, wetmarket. Range 0-6, mean 1.5
N of AI media message sources recalled (15 sources) e.g., television, radio. Range 0-7, mean 1.2
Belief that humans can get AI No = 0, Yes = 1
N of correct transmission vectors known (unprompted) Range 0-6, mean 0.8
Anyone in HH had an acute respiratory event in past year No = 0, Yes = 1
Perceived severity of AI (how likely that an infected person will die Range 0-5, mean 3.8
Perceived susceptibility to AI (how likely that someone in your HH
will become infected with AI)
Range 0-5, mean 1.5
Perceived self-efficacy to seek care if needed Range 0-5, mean 4.0
Perceived self-efficacy to protect self and family from AI Range 0-5, mean 3.7
Perceived self-efficacy to know when to seek care Range 0-5, mean 3.9

7/11/2012
38
75
Summary—Predictors of care-seeking*(+ positive relationship, - negative relationship)
Likelihood of seeking care if someone
suddenly develops fever, sore throat and
difficulty breathing+ Perceived self-efficacy to
seek care if needed
Number of AI messages
recalled +
Of all the predictor variables, the two that were significant were number of avian flu
messages recalled out of 15 sources that were used in previous AI prevention
campaigns (television, radio, billboard, poster, flyer/leaflet, booklet, newspaper,
community events, cadre, health facility, doctor, district health office, district animal
health office, community leader (RT/RW) and perceived self-efficacy to seek care if
needed.
Message implications: Strive for the highest reach possible with care seeking messages
and emphasize building confidence in the ability to seek care quickly as soon as
symptoms start to appear.
* Controlling for education, household wealth (possessions), district and 10 other variables.
76
Summary—Predictors of shorter waiting time to seek care*(+ positive relationship, - negative relationship)
Shorter waiting time before seeking care+
Perceived self-efficacy to
seek care if needed
District (Bogor) −
Residents of Bogor district said on average that it was safe to wait longer to seek care
after the appearance of AI-like symptoms (cough, sore throat, difficulty breathing),
while those who perceived AI to be a more severe health threat and those who
expressed greater confidence (self-efficacy) in their ability to seek care if needed gave a
shorter estimate of how long it was safe to wait to seek care after the appearance of AI-
like symptoms.
Message implications: Target residents of Bogor and emphasize how deadly AI can be,
as well as how easy it can be to seek care as soon as symptoms start to emerge.
* Controlling for education, household wealth (possessions), district and 10 other variables.
Perceived severity of AI+

7/11/2012
39
77
Summary—Predictors of self-efficacy to seek care*(+ positive relationship, - negative relationship)
Perceived self-efficacy to seek care
+
Perceived severity of AI
District (Bogor)
Residents of Bogor district expressed greater confidence in their ability to seek care as
did those with greater household wealth. Those who perceived AI to be a more severe
health threat and those who correctly knew more of the ways that AI can be
transmitted were also more likely to express higher self-efficacy to seek care when
needed.
Message implications: Target lower income families, emphasizing how serious an AI
infection can be and the ways in which AI can be transmitted.
* Controlling for education, household wealth (possessions), district and 10 other variables.
Household wealth
+ Number of correct AI
transmission vectors known
+
+
78
Summary—Predictors of self-efficacy to protect self & family*(+ positive relationship, - negative relationship)
Perceived self-efficacy to protect self & family
+
Perceived susceptibility to
AI
Education
Those with higher levels of education and those with higher care seeking self-efficacy were more
likely to say they were confident in their ability to protect themselves and their family from AI.
However, those who reported lower levels of recall of AI messages from previous campaigns and
those perceived themselves as more susceptible to AI infection were less likely to say they were
confident in their ability to protect themselves and their family from AI.
Message implications: Strive for maximum message reach. Emphasize the many ways people can
be exposed to the H5N1 virus, but how easy it can be to seek care quickly as soon as symptoms
emerge.
* Controlling for education, household wealth (possessions), district and 10 other variables.
Number of AI messages
recalled
Perceived self-efficacy to
seek care if needed
−
+
−
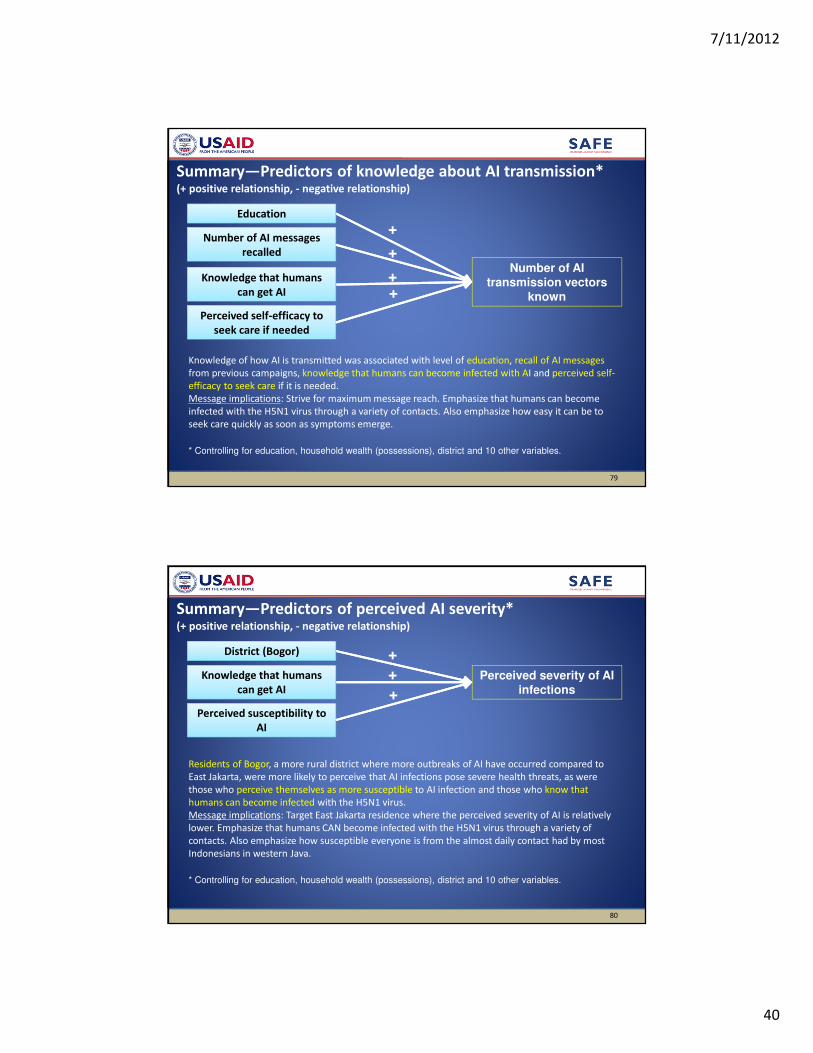
7/11/2012
40
79
Summary—Predictors of knowledge about AI transmission*(+ positive relationship, - negative relationship)
Number of AI transmission vectors
known+ Knowledge that humans
can get AI
Education
Knowledge of how AI is transmitted was associated with level of education, recall of AI messages
from previous campaigns, knowledge that humans can become infected with AI and perceived self-
efficacy to seek care if it is needed.
Message implications: Strive for maximum message reach. Emphasize that humans can become
infected with the H5N1 virus through a variety of contacts. Also emphasize how easy it can be to
seek care quickly as soon as symptoms emerge.
* Controlling for education, household wealth (possessions), district and 10 other variables.
Number of AI messages
recalled
Perceived self-efficacy to
seek care if needed
+
+
+
80
Summary—Predictors of perceived AI severity*(+ positive relationship, - negative relationship)
Perceived severity of AI infections+
Knowledge that humans
can get AI
District (Bogor)
Residents of Bogor, a more rural district where more outbreaks of AI have occurred compared to
East Jakarta, were more likely to perceive that AI infections pose severe health threats, as were
those who perceive themselves as more susceptible to AI infection and those who know that
humans can become infected with the H5N1 virus.
Message implications: Target East Jakarta residence where the perceived severity of AI is relatively
lower. Emphasize that humans CAN become infected with the H5N1 virus through a variety of
contacts. Also emphasize how susceptible everyone is from the almost daily contact had by most
Indonesians in western Java.
* Controlling for education, household wealth (possessions), district and 10 other variables.
Perceived susceptibility to
AI
+
+

7/11/2012
41
81
Summary—Predictors of perceived susceptibility to AI*(+ positive relationship, - negative relationship)
Perceived susceptibility to AI infections
+
Knowledge that humans
can get AI
HH wealth
Less wealthy households and those with lower levels of perceived self-efficacy to protect
themselves from AI were more likely to perceive themselves at greater risk (higher susceptibility).
Those who know that humans can become infected with AI and those who perceive AI as a severe
health threat were more likely to perceive themselves as susceptible.
Message implications: Target lower income households residence where the perceived severity of
AI is relatively lower. Emphasize that humans CAN become infected with the H5N1 virus and that
infection can have very serious consequences. Also emphasize how easy it can be to protect ones
family from infection through avoiding high risk exposures and practicing safe poultry handling
practices, as well as seeking care as soon as symptoms begin to emerge.
* Controlling for education, household wealth (possessions), district and 10 other variables.
Perceived severity of AI
−
+
Perceived self-efficacy to
protect self & family
−
MEDIA HABITS
& MESSAGE RECALL
82

7/11/2012
42
Total East Jakarta Bogor
TV 74.3 82.8 69.2
Radio 6.9 10.5 4.8
Newspaper 16.1 23.5 11.8
Pamphlets/Brochure 2.2 3.5 1.4
Poster 2.4 3.1 2.0
Internet Website 5.5 6.3 5.0
Private Doctor 11.9 5.3 15.8
Doctor at Health Center 22.4 28.5 18.8
Midwife 10.3 3.9 14.1
Cadre 13.8 11.4 15.2
Community meeting 1.5 3.5 0.3
Family/Relatives 7.4 9 6.5
Neighbor/Friend 21.0 24.3 19.1
Community or Religious Leader 6.8 11.9 3.8
Information Source about Health Issues
83
� Television reach is high, but interpersonal channels also matter.
Reliable source Usefulness
TV 37.4 55.2
Radio 0.7 2.8
Newspaper 0.9 7.2
Pamphlets/Brochure 0.2 0.8
Poster 0.2 0.5
Internet Website 1.4 3.6
Private Doctor 9.8 12.1
Doctor at Health Center 20.9 22.8
Midwife 4.9 7.7
Cadre 4.6 7.4
Community meeting 0.2 0.7
Family/Relatives 2.8 4.3
Neighbor/Friend 3.7 11
Community or Religious Leader 2.1 3.6
Reliable Source &
Usefulness of Health Information
84
� Trusted sources: TV and doctors

7/11/2012
43
Total East Jakarta Bogor
Never 50.1 45.3 53.0
Rarely 35.1 33.1 36.3
1-2 times per week 6.0 7.7 4.9
Three or more times
per week
8.8 13.9 5.8
Frequency of Reading Newspaper
85
Total East Jakarta Bogor
Never 69.2 66.6 70.6
Rarely 23.6 24.1 23.2
1-3 times per month 3.4 2.7 3.8
1-2 times per week 3.0 5 1.8
3-6 times per week 0.3 0.6 0.2
Everyday 0.6 1 0.4
Frequency of Reading Magazine
86
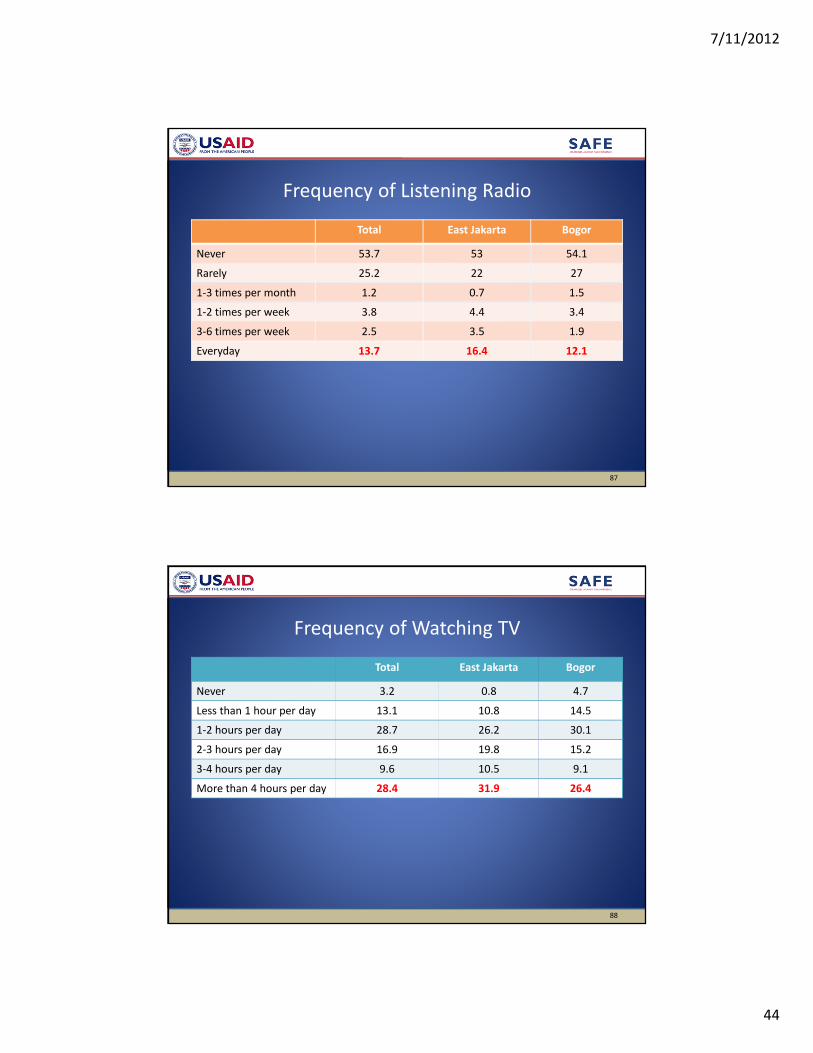
7/11/2012
44
Total East Jakarta Bogor
Never 53.7 53 54.1
Rarely 25.2 22 27
1-3 times per month 1.2 0.7 1.5
1-2 times per week 3.8 4.4 3.4
3-6 times per week 2.5 3.5 1.9
Everyday 13.7 16.4 12.1
Frequency of Listening Radio
87
Total East Jakarta Bogor
Never 3.2 0.8 4.7
Less than 1 hour per day 13.1 10.8 14.5
1-2 hours per day 28.7 26.2 30.1
2-3 hours per day 16.9 19.8 15.2
3-4 hours per day 9.6 10.5 9.1
More than 4 hours per day 28.4 31.9 26.4
Frequency of Watching TV
88
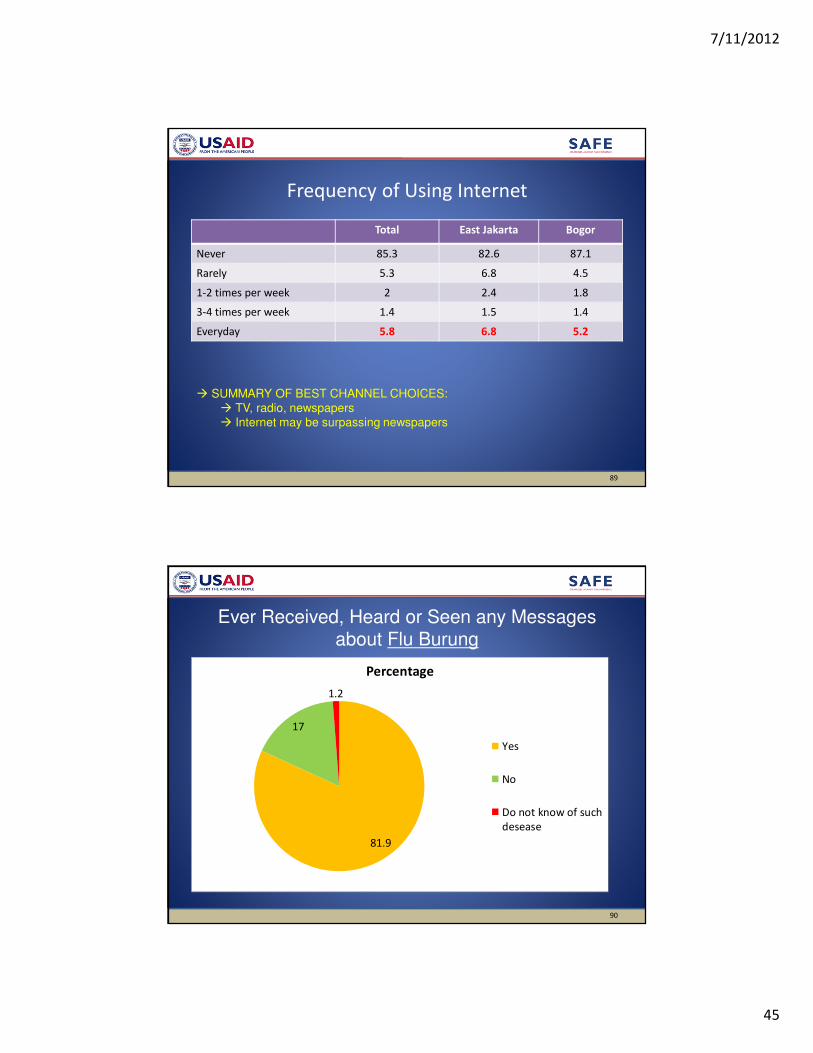
7/11/2012
45
Total East Jakarta Bogor
Never 85.3 82.6 87.1
Rarely 5.3 6.8 4.5
1-2 times per week 2 2.4 1.8
3-4 times per week 1.4 1.5 1.4
Everyday 5.8 6.8 5.2
Frequency of Using Internet
89
� SUMMARY OF BEST CHANNEL CHOICES:
� TV, radio, newspapers
� Internet may be surpassing newspapers
81.9
17
1.2
Percentage
Yes
No
Do not know of such
desease
Ever Received, Heard or Seen any Messages about Flu Burung
90

7/11/2012
46
Total East Jakarta Bogor
TV 90.4 88.6 92.3
Radio 4.1 4.3 3.8
Newspaper/Magazine/tabloid/book 10.7 14.3 6.8
Flyer/brochure/leaflet/poster/banner 3.9 5 2.7
Social network (events in the community,
cadre, RT/RW, family, neighbor, community
leader)
18.1 22.8 13
Government officer (Dinas Kesehatan dan
Dinas Peternakan, Local offices)
4.2 6.3 1.8
New media (internet website, text through
cellphone)
2.1 2.4 1.8
Puskesmas 3.3 5.4 1.9
Doctor 2 2.4 1.8
Information Sources for Flu Burung
91
� Television and social networks (interpersonal channels)
Total East Jakarta Bogor
Bury dead poultry 34.9 34 36
Report dead chicken 4.4 5 3.8
Hygiene & self-protection action 57.2 63.2 50.6
Flu Burung news 24.4 21.9 27.2
Recall of Flu Burung Message Topics
92

7/11/2012
47
29.1
70.7
0.2
Percentage
Yes
No
Don't know
Ever Heard/Seen Messages about Seasonal Influenza
93
Total East Jakarta Bogor
TV 51.1 55.9 48.3
Radio 1.8 2.6 1.3
Newspaper 4.0 5.9 2.8
Flyer/brochure/leaflet 1.9 2.6 1.5
Poster 1.2 2.6 0.2
Events in the community 0.8 2.2 0
Posyandu cadre 3 1.5 3.9
Puskesmas 6.2 8.5 4.8
Doctor 12 12.5 11.7
Health Office 1.5 1.5 1.3
RT/RW 2.2 1.5 2.6
Information Sources for Seasonal Influenza
94

7/11/2012
48
Total(n=762)
East Jakarta(n=372)
Bogor(n=390)
Avoiding close contact/keeping a distance 9 11 8
Not attending work/school 2 4 <1
Going to the doctor 16 18 13
Washing hands frequently 7 9 5
Taking medication 44 53 36
Receive influenza vaccine 1 1 1
Recall of Seasonal Influenza Message Topics
95
CONCLUSIONS &
STRATEGIC COMMUNICATION
IMPLICATIONS
96

7/11/2012
49
1. Urban/rural variations in strategy
•There are numerous differences between E. Jakarta and Bogor.
•An important messaging focus in East Jakarta should be on the
risks associated with potential exposures to H5N1 in the wet
markets, on which Jakarta residents rely for their poultry
products
•In Bogor (and in rural areas generally), there may be a sense of
false confidence stemming from constant exposure to birds and
greater exposure to outbreaks—which most people have
survived.
97
Conclusions: Strategic Implications and Priorities
2. Living Safely with Birds
•Routine daily exposure to birds is a fact of life in Indonesia, with almost
universal exposure to wet market risks among urban households.
•Most exposures to birds are not considered distinctive or noteworthy.
•Complacency regarding risks associated with bird exposures is common.
� Suggests an efficacy-based strategy framed around “living safely with
birds”.
– Flag certain types of exposure (e.g., handling live or slaughtered birds
at the wet market) as requiring vigilance.
– Educate patients to mention these distinctive types of exposure to
providers when seeking care.
– Educate providers to ask about these distinctive types of exposure
when seeing clients with respiratory illness.
98
Conclusions: Strategic Implications and Priorities
7/11/2012
50
3. Knowledge of distinctive AI symptoms
•General knowledge of AI and knowledge that AI is more
dangerous than seasonal flu are relatively high, but knowledge
of the distinctive AI symptom—sesak nafas (shortness of breath,
tightness in the chest)—is limited.
� Suggests a need to highlight sesak nafas as a danger sign
requiring prompt action.
•Do not need extensive education about biomedical distinctions;
Do need to focus on a few “differences that make a difference”.
99
Conclusions: Strategic Implications and Priorities
4. Barriers to care seeking
• Over 70% say they face no barriers to obtaining care; those
who identify barriers mention access hours and cost of
services.
• More than half report using private services (private clinics
and hospitals) because they are thought to provide accessible
quality care.
� Suggests a need to promote sources of quality care for
respiratory illness.
100
Conclusions: Strategic Implications and Priorities

7/11/2012
51
5. Response to acute events
•Most common responses to sudden onset of fever,
cough and tightness of breath are to obtain drugs from
pharmacy (22% overall), medicate/give fluids at home
(19% overall, 38% in E. Jakarta) and go to a private
clinic (16% overall, 22% in E. Jakarta).
�Suggests a need to discourage over-reliance on self-
treatment.
101
Conclusions: Strategic Implications and Priorities
6. Response timing
•65 percent report seeking care within 48 hours of onset of acute
illness episode
•24 percent report not seeking any kind of care for an acute
illness episode
•Those who perceive an AI infection as serious and feel confident
in their ability to seek care do so more quickly.
•Of those who waited less than 48 hours to seek care, HALF
(almost two-thirds in E. Jakarta) said they sought care because
they “felt it was important to go to a healthcare facility.”
� Suggests the need for a norms-based strategy: it is the right,
responsible thing to do to seek care within 48 hours if difficulty
breathing begins to occur
102
Conclusions: Strategic Implications and Priorities
7/11/2012
52
7. Communication channels
•Television has the greatest reach and has the highest reliability
and usefulness rating as a source of health information; is most
common source of flu burung and seasonal flu information.
•Interpersonal channels (doctors, neighbors, kaders) also play a
key role in the flow of health information.
– Suggests a mutually reinforcing strategy involving use of
television to inform, model positive behaviors and catalyze
community-level discussion about “safe living with birds.”
103
Conclusions: Strategic Implications and Priorities
Use television to inform about:
– Particular types of higher risk bird exposures as
transmission pathways
– Sesak nafas as a distinctive symptom requiring rapid care
seeking
– Inadequacy of self-treatment as a first response
– Two days (48 hours) as the critical response time period
– Encourage rapid care seeking as the “right thing to do”
(social norm)
– Model care seeking within 48 hours if sesak nafas begins
to develop
– Encourage interpersonal communication and social
support at the community level
Communication channels (cont.)
104

7/11/2012
53
Use community media, interpersonal outreach and signage to:
– Provide reminders at clinics and wet markets about
particular higher risk types of bird exposure
– Provide details about effective behaviors to “live safely
with birds”
– Encourage client-provider communication about higher
risk bird exposures and distinctive symptoms of AI (sesak
nafas).
Communication channels (cont.)
105
• Strive for the highest reach possible with care seeking
messages
• Take advantage of the powerful combination of “threat” AND
“efficacy”:
– Emphasize how deadly AI CAN be if treatment is not
sought as soon as possible after symptoms begin to appear
– Emphasize the many ways people can be exposed to the
H5N1 virus, given how common exposure to birds is in
Indonesian daily life
– Emphasize building confidence in the ability to seek care
quickly
General messaging implications
106