health care in europe – an overview...2007/01/15 · health care system universal coverage;...
TRANSCRIPT

1
Reinhard Busse, Prof. Dr. med. MPH FFPHDept. Health Care Management, Berlin University of Technology
(WHO Collaborating Centre for Health Systems Research and Management),Charité – University Medicine Berlin &
European Observatory on Health Systems and Policies
Health Care in Europe –An Overview
- 2 -Prof. Dr. Reinhard BussePotsdam, 15.1.2007
1. Actors and organisation: areBismarck´s and Beveridge´sgrandchildren look-alikes?
2. Financing3. Ensuring access and quality4. Services, costs and reimbursement5. Contribution to wealth/ productivity
http:/
/mig.
tu-be
rlin.de

2
- 3 -Prof. Dr. Reinhard BussePotsdam, 15.1.2007
Third-party Payer
Population Providers
- 4 -Prof. Dr. Reinhard BussePotsdam, 15.1.2007
Third-party payer
Population Providers
Collector of resources
http:/
/mig.
tu-be
rlin.de

3
- 5 -Prof. Dr. Reinhard BussePotsdam, 15.1.2007
Central government
Population Public providers
General taxation
Limited choice
Classical integrated NHS-type systems
NHS =payer &provider
- 6 -Prof. Dr. Reinhard BussePotsdam, 15.1.2007
Central government
Population Public providers
General taxation
Limited choice
Purchaser –provider
split
“NHS”
http:/
/mig.
tu-be
rlin.de

4
- 7 -Prof. Dr. Reinhard BussePotsdam, 15.1.2007
Central government
Population Public “autonomous”
providers
General taxation
Limited choice
Purchaser –provider
split
“NHS”
- 8 -Prof. Dr. Reinhard BussePotsdam, 15.1.2007
Central government
Population Limitedmore choice
(money follows patient)
Purchaser –provider
splitGeneral
taxation
Public “autonomous”providers
“NHS”
http:/
/mig.
tu-be
rlin.de

5
- 9 -Prof. Dr. Reinhard BussePotsdam, 15.1.2007
Central Regional governments
Population
Purchaser –provider
splitGeneral
taxation
Limitedmore choice
Public “autonomous”providers
“NHS”
- 10 -Prof. Dr. Reinhard BussePotsdam, 15.1.2007
Regional governments
Population Limitedmore choice
Purchaser –provider
splitGeneral
taxation
Public “autonomous”and privateproviders
“NHS”
http:/
/mig.
tu-be
rlin.de
6
- 11 -Prof. Dr. Reinhard BussePotsdam, 15.1.2007
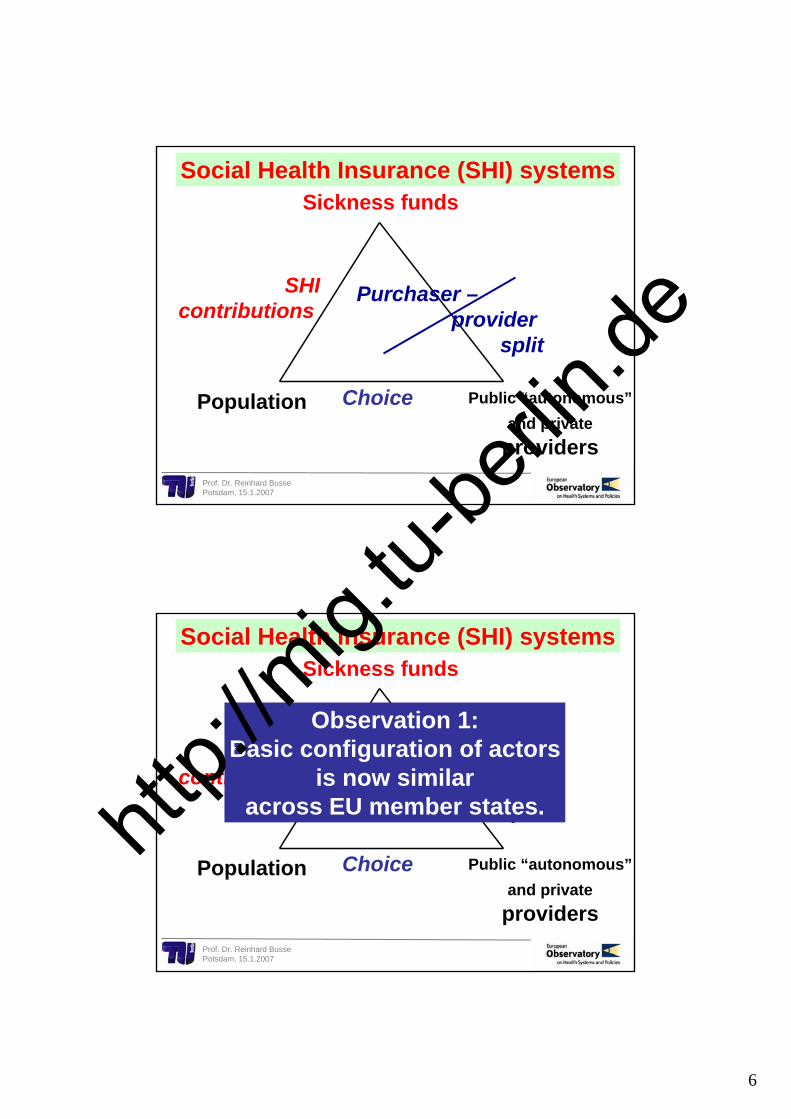
Sickness funds
Population Choice
Purchaser –provider
split
SHI contributions
Public “autonomous”and privateproviders
Social Health Insurance (SHI) systems
- 12 -Prof. Dr. Reinhard BussePotsdam, 15.1.2007
Sickness funds
Population Choice
Purchaser –provider
split
SHI contributions
Public “autonomous”and privateproviders
Social Health Insurance (SHI) systems
Observation 1:Basic configuration of actors
is now similaracross EU member states.htt
p://m
ig.tu-
berlin
.de

7
- 13 -Prof. Dr. Reinhard BussePotsdam, 15.1.2007
Third-party Payer
Population Providers
Taxes
Social HealthInsurance
contributions
Voluntary insurance
Out-of-pocket
prepaid
Third-party Payer
Population Providers
Taxes
Social HealthInsurance
contributions
Voluntary insurance
Out-of-pocket
EU-15
18%
public
12 new EU members
26%
5% 2%
75%
71%
http:/
/mig.
tu-be
rlin.de

8
Third-party Payer
Population Providers
Taxes
Social HealthInsurance
contributions
Voluntary insurance
Out-of-pocket
USA
18%
public
26%
5% 2%
75%
71%
45%
37%
14%
Third-party Payer
Population Providers
Taxes
Social HealthInsurance
contributions
Voluntary insurance
Out-of-pocket
CIS (ex-Soviet Union)
18%
public
26%
5% 2%
75%
71%
45%
37%
14%
46%
1%
50%
http:/
/mig.
tu-be
rlin.de
9
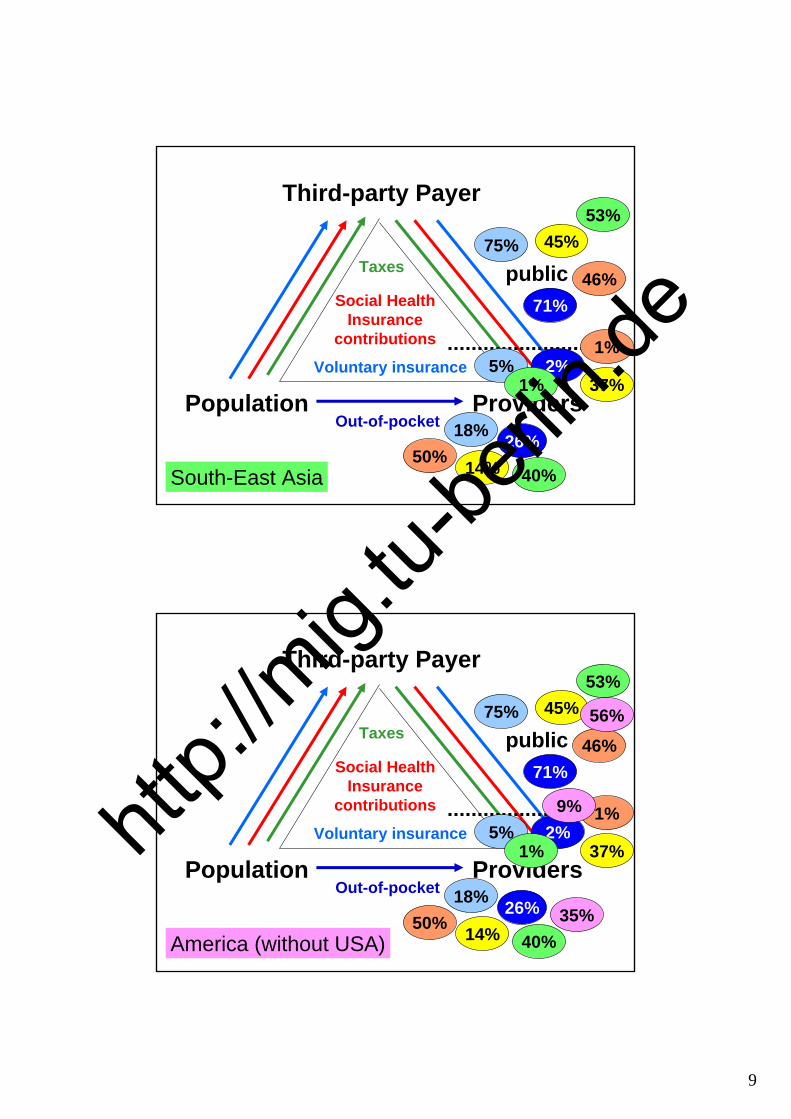
Third-party Payer
Population Providers
Taxes
Social HealthInsurance
contributions
Voluntary insurance
Out-of-pocket
South-East Asia
18%
public
26%
5% 2%
75%
71%
45%
37%
14%
46%
1%
50%
53%
1%
40%
Third-party Payer
Population Providers
Taxes
Social HealthInsurance
contributions
Voluntary insurance
Out-of-pocket
America (without USA)
18%
public
26%
5% 2%
75%
71%
45%
37%
14%
46%
1%
50%
53%
1%
40%
56%
9%
35%
http:/
/mig.
tu-be
rlin.de

10
0
1
2
3
4
5
6
7
8
9
10
11
12
13
14
15
16
1998 1999 2000 2001 2002 2003 2004 2005 2006
AustriaBelgiumBulgariaCyprusCzech RepublicDenmarkEstoniaFinlandFranceGermanyGreeceHungaryIrelandItalyLatviaLithuaniaLuxembourgMaltaNetherlandsPolandPortugalRomaniaSlovakiaSloveniaSpainSwedenUnited Kingdom
Total health expenditure as % of gross domestic product (GDP), WHO estimates
South-EastAsia
Africa
CISW
est. PacificA
merica
USA
East. Mediteranean
EU-15
12 newEU
Observation 2:There is a distinct European way
of financing health care.
http:/
/mig.
tu-be
rlin.de

11
- 21 -Prof. Dr. Reinhard BussePotsdam, 15.1.2007
Health careoutcome:
satisfaction, complica-tions etc.Structures
and organisation
Patients: demand, access
Process
Population healthstatus(need)
Health gain/
Outcome
Other sectors
Nutrition/ agriculture
Environment
Health care system
Fair and sustainable funding?
Needs-basedaccess?
Personnel well qualified?Institutions of high standards?
Technologies effective?
High-qualityresults?
Patients receivingappropriate services?
How much?Is it worth it?
Human resources
Techno-logies
Financial resources
Health careoutcome:
satisfaction, complica-tions etc.Structures
and organisation
Patients: demand, access
Process
Population healthstatus(need)
Healthgain/
Outcome
Other sectors
Nutrition/ agriculture
Environment
Health care system
Universalcoverage;
cost-sharinglimits
Professional (re-)certificationProvider (re-)accredition
Health Technology AssessmentConcentration of services
“Do the thing right“:Benchmarking/
league tables; registers
“Do the right thing“: ex ante Guidelines/ diseasemanagement programmes/ reminders; ex post Review
Human resources
Techno-logies
Financial resources
http:/
/mig.
tu-be
rlin.de

12
Health careoutcome:
satisfaction, complica-tions etc.Structures
and organisation
Patients: demand, access
Process
Population healthstatus(need)
Healthgain/
Outcome
Other sectors
Nutrition/ agriculture
Environment
Health care system
Universalcoverage;
cost-sharinglimits
Professional (re-)certificationProvider (re-)accredition
Health Technology AssessmentConcentration of services
“Do the thing right“:Benchmarking/
league tables; registers
“Do the right thing“: ex ante Guidelines/ diseasemanagement programmes/ reminders; ex post Review
Human resources
Techno-logies
Financial resources
Observation 3:EU health care systems
face the same challengesand are choosing
very similar answers.
0
2000
4000
6000
8000
10000
12000
0 1000 2000 3000 4000 5000 6000 7000 8000 9000 10000
Total cost (Euros)
Rei
mbu
rsem
ent (
Euro
s)
DenmarkEnglandFranceGermanyHungaryItalyNetherlandsPolandSpain
Unpublished data from HealthBASKET project (presentation: conference Berlin, 22.2.07)
Costs and reimbursement ofEuropean hospitals: hip replacement
Data embargoed until February 22
http:/
/mig.
tu-be
rlin.de

13
0
1000
2000
3000
4000
5000
6000
7000
8000
0 2000 4000 6000 8000 10000 12000 14000 16000
Total cost (Euros)
Rei
mbu
rsem
ent (
Euro
s)
DenmarkEnglandFranceGermanyHungaryItalyNetherlandsPolandSpain
Unpublished data from HealthBASKET project (presentation: conference Berlin, 22.2.07)
Costs and reimbursement ofEuropean hospitals: stroke
Data embargoed until February 22
- 26 -Prof. Dr. Reinhard BussePotsdam, 15.1.2007
0
1000
2000
3000
4000
5000
6000
7000
8000
0 2000 4000 6000 8000 10000 12000 14000 16000
Total cost (Euros)
Rei
mbu
rsem
ent (
Euro
s)
DenmarkEnglandFranceGermanyHungaryItalyNetherlandsPolandSpain
Unpublished data from HealthBASKET project (presentation: conference Berlin, 22.2.07)
Costs and reimbursement ofEuropean hospitals: stroke
Observation 4:Actual treatment and costs differ
in the EU - but mainly within,not systematically between countries.
Why do countries pretendthey need their own
specific reimbursement systems?htt
p://m
ig.tu-
berlin
.de
14
65
70
75
80
85
1976 1986 1996 2006 2016
AustriaBelgiumBulgariaCyprusCzech RepublicDenmarkEstoniaFinlandFranceGermanyGreeceHungaryIrelandItalyLatviaLithuaniaLuxembourgMaltaNetherlandsPolandPortugalRomaniaSlovakiaSloveniaSpainSwedenUnited Kingdom
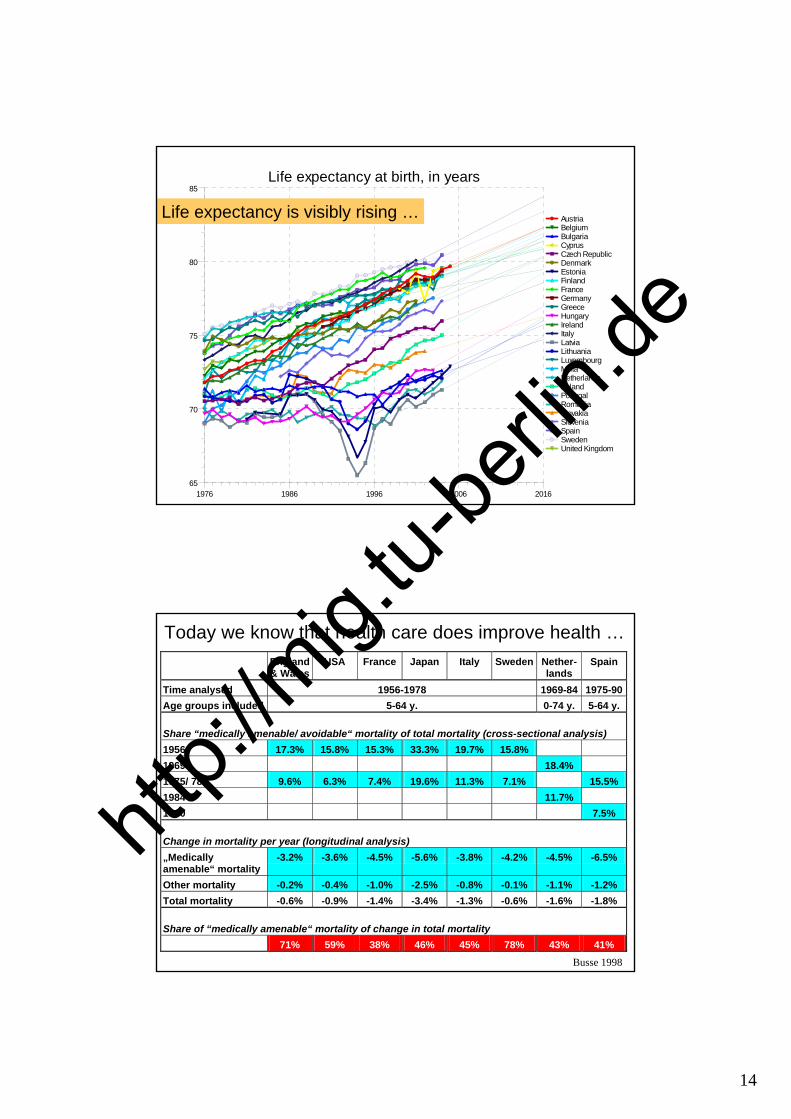
Life expectancy at birth, in years
Life expectancy is visibly rising …
England& Wales
USA France Japan Italy Sweden Nether-lands
Spain
Time analysed 1956-1978 1969-84 1975-90 Age groups included 5-64 y. 0-74 y. 5-64 y. Share “medically amenable/ avoidable“ mortality of total mortality (cross-sectional analysis) 1956 17.3% 15.8% 15.3% 33.3% 19.7% 15.8% 1969 18.4% 1975/ 78 9.6% 6.3% 7.4% 19.6% 11.3% 7.1% 15.5% 1984 11.7% 1990 7.5% Change in mortality per year (longitudinal analysis) „Medically amenable“ mortality
-3.2% -3.6% -4.5% -5.6% -3.8% -4.2% -4.5% -6.5%
Other mortality -0.2% -0.4% -1.0% -2.5% -0.8% -0.1% -1.1% -1.2% Total mortality -0.6% -0.9% -1.4% -3.4% -1.3% -0.6% -1.6% -1.8% Share of “medically amenable“ mortality of change in total mortality 71% 59% 38% 46% 45% 78% 43% 41%
Busse 1998
Today we know that health care does improve health …
http:/
/mig.
tu-be
rlin.de

15
Treatable Mortality: Men
0 50 100 150 200 250
SwedenNetherlands
FranceSpain
ItalyUK
GermanyIreland
FinlandAustria
SloveniaLithuaniaPortugal
PolandCzech Republic
EstoniaLatvia
HungaryBulgaria
Romania
Deaths/ 100 000 population
1990/912000/01/02
Treatable Mortality: Women
0 50 100 150 200 250
FranceSweden
SpainNetherlands
ItalyFinland
GermanyAustria Ireland
UKSloveniaPortugal
LithuaniaPoland
Czech RepublicEstonia
LatviaHungaryBulgaria
Romania
Deaths/ 100 000
1990/012000/01/02
Age-standardised death rates of treatable mortalityin 20 EU member states, 1990/91 and 2000/02
Newey, Nolte, McKee & Mossialos 2004
- 30 -Prof. Dr. Reinhard BussePotsdam, 15.1.2007
Rethinking investment in health: A virtuous cycle?
Suhrcke M, McKee M, Sauto Arce R, Tsolva S, Mortensen J.The Contribution of Health to the Economy in the European Union. Brussels: European Commission, 2005.
http:/
/mig.
tu-be
rlin.de

16
- 31 -Prof. Dr. Reinhard BussePotsdam, 15.1.2007
The return on investment
47%
$996
$676
$3,302
$5,200
France
274%
$1,478
$395
$4,732
$4,810
Sweden
229%
$1,325
$403
$4,992
$5,420
Italy
252%
$1,780
$506
$4,498
$5,180
Spain
148%Return on health expenditure
$1,561Increase in health income
attributable to health care
$630Increase in health
expenditure
$4,108Increase in total health
income
$6,000Increase in GDP per capita
UK
3 4 5 6 7 8 9 10 11 1265
70
75
80
85AustriaBelgiumBulgariaCyprusCzech RepublicDenmarkEstoniaFinlandFranceGermanyGreeceHungaryIrelandItalyLatviaLithuaniaLuxembourgMaltaNetherlandsPolandPortugalRomaniaSlovakiaSloveniaSpainSwedenUnited Kingdom
Y = 1.79X+61.97Y
X
X - Total health expenditure as % of gross domestic product (GDP), WHO estimates, 2002Y - Life expectancy at birth, in years, Last available
SpainFranceItaly
UK
Swe-den
http:/
/mig.
tu-be
rlin.de

17
200 300 400 500 600 700 800 900 100065
70
75
80
85AustriaBelgiumBulgariaCyprusCzech RepublicDenmarkEstoniaFinlandFranceGermanyGreeceHungaryIrelandItalyLatviaLithuaniaLuxembourgMaltaNetherlandsPolandPortugalRomaniaSlovakiaSloveniaSpainSwedenUnited Kingdom
Y = -0.01577X+82.55Y
X
X - Acute care hospital beds per 100000, 2002Y - Life expectancy at birth, in years, Last available
Don`t say: “the more – the better“ is always true:acute hospital beds/ capita vs. life expectancy
3 4 5 6 7 8 9 10 11 1265
70
75
80
85AustriaBelgiumBulgariaCyprusCzech RepublicDenmarkEstoniaFinlandFranceGermanyGreeceHungaryIrelandItalyLatviaLithuaniaLuxembourgMaltaNetherlandsPolandPortugalRomaniaSlovakiaSloveniaSpainSwedenUnited Kingdom
Y = 1.79X+61.97Y
X
X - Total health expenditure as % of gross domestic product (GDP), WHO estimates, 2002Y - Life expectancy at birth, in years, Last available
SpainFranceItaly
UK
Swe-den
EstoniaSlovakia
Romania
Back to spending vs. life expectancy …
Observation 5: If health care increaseswealth, then it is in our common EUinterest that low-spending countries
increase their health expenditure.
http:/
/mig.
tu-be
rlin.de

18
3 4 5 6 7 8 9 10 11 1265
70
75
80
85AustriaBelgiumBulgariaCyprusCzech RepublicDenmarkEstoniaFinlandFranceGermanyGreeceHungaryIrelandItalyLatviaLithuaniaLuxembourgMaltaNetherlandsPolandPortugalRomaniaSlovakiaSloveniaSpainSwedenUnited Kingdom
Y = 1.79X+61.97Y
X
X - Total health expenditure as % of gross domestic product (GDP), WHO estimates, 2002Y - Life expectancy at birth, in years, Last available
Hungary
Germany
Bulgaria
Latvia
- 36 -Prof. Dr. Reinhard BussePotsdam, 15.1.2007
This presentation and more material can befound on the following websites:
http://mig.tu-berlin.de
www.observatory.dkhttp:/
/mig.
tu-be
rlin.de