health canada’s surveillance tool tier system: findings
TRANSCRIPT

nutrients
Article
Evaluating Diet Quality of Canadian Adults UsingHealth Canada’s Surveillance Tool Tier System:Findings from the 2015 Canadian CommunityHealth Survey-Nutrition
Salma Hack 1, Mahsa Jessri 2 and Mary R. L’Abbé 1,*1 Department of Nutritional Sciences, Faculty of Medicine, University of Toronto, Toronto, ON M5S 1A8,
Canada; [email protected] Food Nutrition and Health Program, The University of British Columbia, Vancouver, ON V6T 1Z4, Canada;
[email protected]* Correspondence: [email protected]; Tel.: +416-946-7545
Received: 24 February 2020; Accepted: 9 April 2020; Published: 16 April 2020�����������������
Abstract: The 2014 Health Canada’s Surveillance Tool, Tier System (HCST) is a nutrient profilingmodel developed to evaluate adherence of food choices to dietary recommendations. With the recentrelease of the nationally representative Canadian Community Health Survey-Nutrition (CCHS-N)2015, this study used HCST to evaluate nutritional quality of the dietary intakes of Canadians inthe CCHS-N. Dietary intakes were ascertained using 24-hour dietary recalls from Canadians adults≥19 years (N = 13,605). Foods were categorized into four Tiers based on degree of adherence todietary recommendations according to thresholds for sodium, total fat, saturated fats, and sugars.Tier 1 and Tier 2 represented “recommended foods”, Tier 3 represents foods to “choose less often”,and Tier 4 represented foods “not recommended”. Across all dietary reference intakes (DRI) groups,most foods were categorized as Tier 1 for Vegetable and Fruits (2.2–3.8 servings/day), Tier 2 for GrainProducts (2.9–3.4 servings/day), Tier 3 for Milk and Alternatives (0.7–1 serving/day) or for Meat andAlternatives (1.1–1.6 servings/day). Consumption of foods from Tier 4 and “other foods” such ashigh fat/sugary foods, sugar-sweetened beverages, and alcohol, represented 24–26% and 21–23%kcal/day, for males and females, respectively. Canadians are eating more foods categorized as Tier1–3, rather than Tier 4. Adults with the highest intakes of Tier 4 and “other foods” had lower intakesof macronutrients and increased body mass index. These findings can be used by policy makers toassist in identifying targets for food reformulation at the nutrient level and quantitative guidance tosupport healthy food choices.
Keywords: Canadian Community Health Survey-Nutrition 2015; Health Canada’s Surveillance Tool;Tier System; dietary intakes; nutrient profiling; diet quality; nutrition policy
1. Introduction
According to the most recent 2019 Global Burden of Disease report (GBD), dietary risk factorscontributed to approximately 11 million deaths globally [1,2]. The GBD report indicated that amongall modifiable risk factors, which include unhealthy diets, physical inactivity, tobacco, and alcoholconsumption, dietary risk factors and tobacco use are the top two behavioral risk factors in Canadacausing both death and disability; therefore action is needed to improve dietary habits [1–4].
To assess the nutritional quality of Canadian dietary intakes, Health Canada developed the 2014Health Canada Surveillance Tool (HCST) Tier System, as a nutrient profiling tool used to determinethe healthfulness of foods and beverages based on thresholds for nutrients of public health concern i.e.,
Nutrients 2020, 12, 1113; doi:10.3390/nu12041113 www.mdpi.com/journal/nutrients
Nutrients 2020, 12, 1113 2 of 16
sodium, saturated fats, total fats, and sugars [5–8]. HCST classifies foods into four categories: Tier1, Tier 2, Tier 3, and Tier 4 and an additional group of “other foods”. Tiers 1 and 2 represent foodsthat Canadians should choose to consume most often, these foods are in line with Eating well WithCanada’s Food Guide (EWCFG) 2007; Tier 3 foods should be chosen less often, these foods are partiallyin line with EWCFG; while Tier 4 foods are items to limit, not in line with EWCFG (foods high insodium, total fats, saturated fats and sugars) [5–7]. Additionally, Health Canada created the “otherfoods” category for foods with no serving recommendations, such as sugar sweetened beverages,confectionaries, or alcohol, based on dietary guidelines and thus these foods along with Tier 4 foodsare foods to limit.
To our knowledge, no previous study has evaluated adherence of current dietary intakesof Canadians at the national level using the 2015 national nutrition survey data with the HCSTrecommendations, although an earlier study evaluated dietary intakes from the 2004 nutritionsurvey [6]. Considering the significant changes in dietary trends and food policies in the intervening11 years (2004–2015), this study examines the nutritional quality of Canadian diets using the HCSTnutrient profiling system and the latest national nutrition survey of Canadians.
The newly released 2015 CCHS-Nutrition provides the unique opportunity to update theseevaluations, to understand current diet quality, and to assess trends in Canadians’ intakes. With therelease of Canada’s 2019 Dietary Guidelines, Health Canada continues to recommend consumingand choosing foods low in sodium, sugars, and saturated fats [5,9]. New recommendationsoutlined in Canada’s 2019 Dietary Guidelines in conjunction with the HCST Tier system can provideevidence on dietary intakes of these nutrients in relation to foods and beverages consumed byCanadians. Dietary data reflecting the current nutritional quality of foods consumed by Canadiansis lacking, hindering policy and decision makers from developing relevant nutrition guidelines andrecommendations. This study aimed to investigate the diet quality of Canadian adults >19 years usingthe most recent 2015 CCHS-Nutrition, through application of 2014 HCST which assesses the nutritionalquality of foods choices based on thresholds for nutrients to limit.
2. Materials and Methods
2.1. Experimental Design
The 2015 CCHS-Nutrition is a voluntary, nationally representative nutrition survey conducted byStatistics Canada. The 2015 CCHS-Nutrition survey is a cross-sectional design with three samplingstages. Dietary intake interviews were computer assisted using a five-step automated multi-pass method(AMPM), adapted and modified for the Canadian population from the United States Department ofAgriculture (USDA). The survey was conducted January 2, 2015 to December 31, 2015, on all days ofthe week [10–12]. Two separate questionnaires were administered: a) 24-hour dietary recall, and b)a general health questionnaire to support the 24-hour dietary recall. This survey provides the mostcurrent nutrition data available on Canadians. The survey is nationally representative of twelveage–sex groups, which correspond to the Dietary Reference Intakes (DRI) groupings [10–12]. The finalsample included 20,487 respondents, with a 61.6% response rate [10]. Detailed information on thesampling of respondents can be found in The Canadian Community Health Survey, Nutrition CCHSuser-guide [10,11]. Socio-demographic and lifestyle characteristics were also collected using StatisticsCanada’s survey questionnaires [10,11].
2.2. Subjects
Surveyed participants for 2015 CCHS-Nutrition were those residing in Canada’s 10 provincesfor >1 year, excluding individuals living in: northern territories, on reserves, Aboriginal settlements,full-time members of the Canadian Armed Force, and institutionalized individuals [10]. For thepurpose of these analyses we excluded anyone with no food reported and missing energy intake asdefined by Statistics Canada [11], breastfeeding and pregnant women (n = 683). Single 24-hour dietary

Nutrients 2020, 12, 1113 3 of 16
recalls of males and females 618 years (n = 6199) were removed from analyses to focus on dietaryintakes of adults, leaving a total sample size of 13,605.
2.3. Classifying Foods in the 24-Hour Dietary Recall According to HCST
The current version, the 2015 Canadian Nutrient File (CNF), was used to estimate the nutrientcontent of food [11,12]. The CNF contains the nutritional composition of 5690 unique Canadian foodscommonly consumed, accounting for Canadian food fortification and composition regulations [5,10,12].Health Canada and Public Health Agency of Canada developed the CNF/Canada’s Food Guide (CFG)classification, enabling linkage of CNF food codes to four Eating Well with Canada’s Food Guide(EWCFG) food groups and 21 subgroups [10]. Foods reported in the detailed single day 24-hourdietary recall were linked with CNF 2015 to determine their nutritional composition. HCST uses thenutritional quality of food items according to the nutrient composition in the CNF, which representsa standard reference amount for foods commonly consumed by Canadians [5,6]. Foods were thencategorized based on the HCST Tier nutrient profiling system.
Health Canada developed upper and lower thresholds for the Tier system based on four nutrientsof public health concern: sodium, saturated fats, total fats, and sugars [5,8,10]. Cut-points were derivedfrom thresholds used for nutrient content claims, dietary reference intakes (DRI) for macronutrients,and nutrition standards for foods in schools [5].
Lower thresholds for fats and sodium content were based on thresholds for foods in order tomeet “low in” nutrient content claims for an amount of food commonly consumed in one sitting,termed the Reference Amount (RA) [5–7]. Foods categorized as Tier 1 must not exceed the lowerthresholds: 63 g/RA for fat, 6140 mg/RA for sodium, and 66 g/RA for sugar [5]. As there is no dailyvalue (DV) for sugar, upper and lower thresholds for sugar were determined from the recommendationby the Institute of Medicine (IOM) [5]. The 15% DV of sodium (>360 mg/RA), total fats (>10 g/RA),saturated fats (>2 g/RA), and sugars (>19 g) were set as the upper thresholds [5]. Foods from the24-hour dietary recalls were categorized as Tier 1 when nutrient values did not exceed any of the threelower thresholds for fat, sugar, and sodium; Tier 2 foods could exceed one or two lower thresholds butno upper thresholds. Tier 3 foods were foods with nutrient contents above all lower thresholds (i.e.,sodium, sugar, and total fat), and may exceed one upper threshold. Tier 4 represents foods that exceed>2 upper thresholds, however special consideration was given to foods belonging to the Meat andAlternative, and Milk and Alternative categories as they naturally have higher saturated fat content.For example, Tier 2 and Tier 3 legumes, nuts and seed, and others contain increased amounts of naturaloils, therefore these foods result in a shift in Tiers i.e., from Tier 3 to Tier 2 if the lower threshold forsodium and sugar and upper thresholds for saturated fat are not exceeded. [5]. Additional adjustmentsfor foods based on directional statements from CFG can be found in HCST [5].
2.4. “Other Foods” and Beverages
According to the CNF/CFG classification, nine groups of foods could not be classified according toTiers 1–4 [5]. Of these groups, five categories of foods were grouped as “other foods” representing thosenot recommended by EWCFG. These groups are: (1) saturated and/or trans-fats and oils; (2) high-fatand high sugar foods such as, candies, chocolates syrups; (3) high calorie beverages >40 kcal/100g;(4) low calorie beverages <40 kcal/100g; and (5) alcoholic beverages [5–7].
Foods classified as Tier 4 and “other foods” and beverages have no acceptable Canada FoodGuide Serving [5–7,13]. These foods have directional statements as food items to limit (similar to HCSTTier 4 foods such as: cakes, muffins, chocolates potato chips, or fruit flavored drinks etc.). This studydetermined energy contributions of Tier 4 and “other foods” and beverages outlined above for adultsby DRI age–sex groups as done previously [6].

Nutrients 2020, 12, 1113 4 of 16
2.5. Statistics
Analyses were completed using Statistical Analysis Software (SAS) version 9.4 (SAS Institute Inc.,Cary, NC, USA). Bootstrap balanced repeated replication with 500 repeats was used to estimatepopulation parameters i.e., confidence intervals, standard errors, and coefficients of variation.Survey weights provided with the master files were used for N = 13,605 adults, to ensure samplesfrom 2015 CCHS-Nutrition remain nationally representative [10,11]. Dietary intakes were assessedaccording to DRI age–sex groupings and additional lifestyle measures, which included smoking,physical activity, and Body Mass Index (BMI). PROC SURVEYREG and PROC SURVEYLOGISTIC wereused for continuous (e.g., servings from fruit and vegetables) and for categorical (e.g., lifestyle measures)analyses, respectively, adjusting for energy intake, age, and sex where appropriate. Results with two-tailed p-value 60.05 were reported as statistically significant.
2.6. Identification of Implausible Reporters
Previous studies have found participants with higher BMI (i.e., overweight and obese) tend tounder-report socially undesirable foods e.g., high fat and sugar foods, sugar-sweetened beveragesetc. This is recognized as selective misreporting [14]. In accordance with publications from the twocycles of CCHS (Jessri et al. (2015) and Garriguet et al. (2016)), we have categorized participantsbased on comparison of their estimated energy requirement (EER) to total energy expenditure(EER:TEE) [6,7,14–18]. EER was determined based on the equation developed by the Institute ofMedicine (IOM) accounting for age, sex, BMI, and physical activity [19]. For individuals with nomeasured height and weight (due to refusal, surrounding conditions, or did not permit measurements)to determine BMI, USDA energy levels were assigned to adult participants to determine EER basedon sex and physical activity levels for sedentary, low active, active, and very active [15,17–19].Adults were categorized as under-reporters if energy intake (EI) was <70%, plausible if EI was 70–142%,and over-reporters if EI was >142% [6,7,15,16].
2.7. Approvals
The data in this study was completed as secondary analyses. Data analysis was performed atthe Research Data Centre (RDC) of Statistics Canada, Toronto Ontario. A trained staff member at theToronto RDC vetted data before release.
3. Results
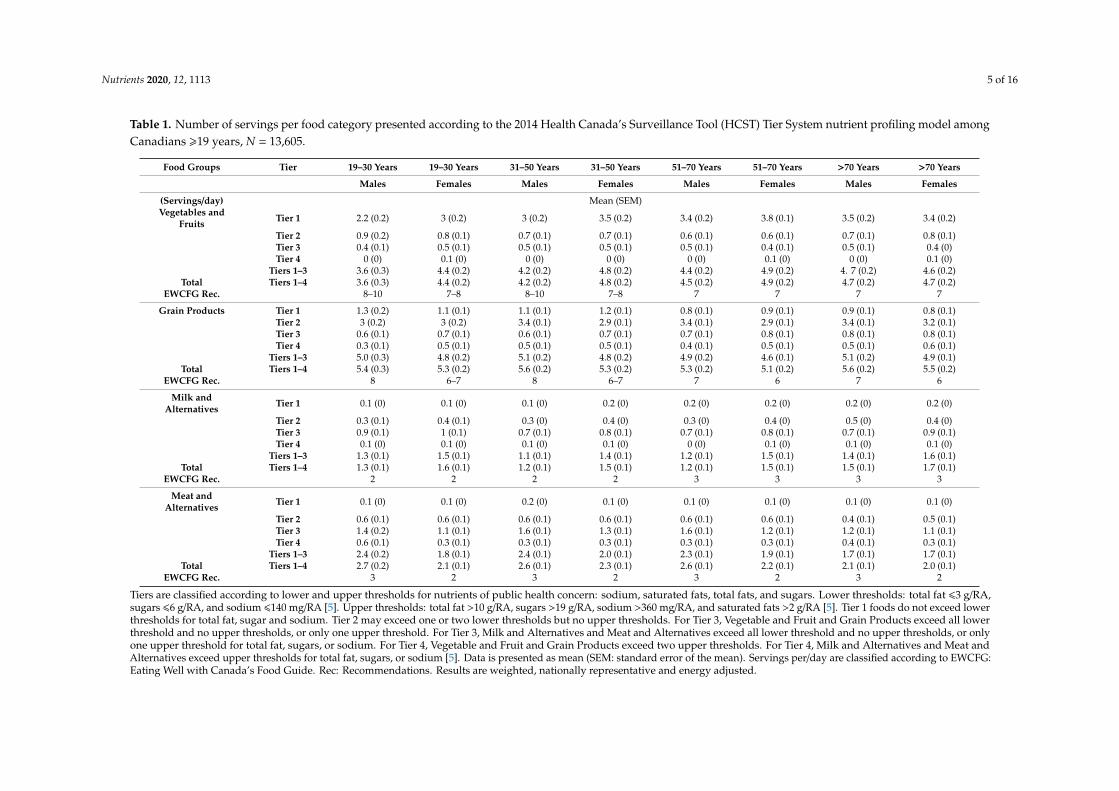
This study included 13,605 Canadian adults (ages >19 years). Table 1 shows average intakesof EWCFG food groups (servings/day) categorized into Tiers 1–4. Across all DRI age–sex groups,daily intake of foods from Tier 1–3 were below recommendations for all food categories except forwomen 31–50 years who met the recommendations for Meat and Alternatives. The majority of EWCFGservings were reported from Grain Products (Tier 2: 2.9 to 3.4 servings/day), followed by Vegetablesand Fruit (Tier 1: 2.2 to 3.8 servings/day), Meat and Alternatives (Tier 3: 1.1 to 1.6 servings/day),and Milk and Alternatives (Tier 3: 0.7 to 1 serving/day) for all DRI age–sex categories. Intakes of Meatand Alternatives among males decreased with age, with the highest intake reported as servings/day(Standard Error of the Mean (SEM); 2.69 (0.2) to 2.12 (0.1)) for males (19–30 years, to >70 years), and weremainly categorized as Tier 3. Consumption of Milk and Alternatives such as, dairy, cheeses, yogurt etc.,was the lowest among males, however dietary intakes improved across age groups 31–50 years to>70 years (1.19 (0.1) to 1.45 (0.1)). Canadian’s average intakes of Vegetables and Fruit was belowrecommendations. Across DRI age–sex categories, from 19–30 years to >70 years the average numberof servings/day of Vegetables and Fruit increased, with the exception of a slight decline among women51–70 years to >70 years (4.91(0.2) to 4.7 (0.2) servings/day; Table 1).
Nutrients 2020, 12, 1113 5 of 16
Table 1. Number of servings per food category presented according to the 2014 Health Canada’s Surveillance Tool (HCST) Tier System nutrient profiling model amongCanadians >19 years, N = 13,605.
Food Groups Tier 19–30 Years 19–30 Years 31–50 Years 31–50 Years 51–70 Years 51–70 Years >70 Years >70 Years
Males Females Males Females Males Females Males Females
(Servings/day) Mean (SEM)Vegetables and
Fruits Tier 1 2.2 (0.2) 3 (0.2) 3 (0.2) 3.5 (0.2) 3.4 (0.2) 3.8 (0.1) 3.5 (0.2) 3.4 (0.2)
Tier 2 0.9 (0.2) 0.8 (0.1) 0.7 (0.1) 0.7 (0.1) 0.6 (0.1) 0.6 (0.1) 0.7 (0.1) 0.8 (0.1)Tier 3 0.4 (0.1) 0.5 (0.1) 0.5 (0.1) 0.5 (0.1) 0.5 (0.1) 0.4 (0.1) 0.5 (0.1) 0.4 (0)Tier 4 0 (0) 0.1 (0) 0 (0) 0 (0) 0 (0) 0.1 (0) 0 (0) 0.1 (0)
Tiers 1–3 3.6 (0.3) 4.4 (0.2) 4.2 (0.2) 4.8 (0.2) 4.4 (0.2) 4.9 (0.2) 4. 7 (0.2) 4.6 (0.2)Total Tiers 1–4 3.6 (0.3) 4.4 (0.2) 4.2 (0.2) 4.8 (0.2) 4.5 (0.2) 4.9 (0.2) 4.7 (0.2) 4.7 (0.2)
EWCFG Rec. 8–10 7–8 8–10 7–8 7 7 7 7
Grain Products Tier 1 1.3 (0.2) 1.1 (0.1) 1.1 (0.1) 1.2 (0.1) 0.8 (0.1) 0.9 (0.1) 0.9 (0.1) 0.8 (0.1)Tier 2 3 (0.2) 3 (0.2) 3.4 (0.1) 2.9 (0.1) 3.4 (0.1) 2.9 (0.1) 3.4 (0.1) 3.2 (0.1)Tier 3 0.6 (0.1) 0.7 (0.1) 0.6 (0.1) 0.7 (0.1) 0.7 (0.1) 0.8 (0.1) 0.8 (0.1) 0.8 (0.1)Tier 4 0.3 (0.1) 0.5 (0.1) 0.5 (0.1) 0.5 (0.1) 0.4 (0.1) 0.5 (0.1) 0.5 (0.1) 0.6 (0.1)
Tiers 1–3 5.0 (0.3) 4.8 (0.2) 5.1 (0.2) 4.8 (0.2) 4.9 (0.2) 4.6 (0.1) 5.1 (0.2) 4.9 (0.1)Total Tiers 1–4 5.4 (0.3) 5.3 (0.2) 5.6 (0.2) 5.3 (0.2) 5.3 (0.2) 5.1 (0.2) 5.6 (0.2) 5.5 (0.2)
EWCFG Rec. 8 6–7 8 6–7 7 6 7 6
Milk andAlternatives Tier 1 0.1 (0) 0.1 (0) 0.1 (0) 0.2 (0) 0.2 (0) 0.2 (0) 0.2 (0) 0.2 (0)
Tier 2 0.3 (0.1) 0.4 (0.1) 0.3 (0) 0.4 (0) 0.3 (0) 0.4 (0) 0.5 (0) 0.4 (0)Tier 3 0.9 (0.1) 1 (0.1) 0.7 (0.1) 0.8 (0.1) 0.7 (0.1) 0.8 (0.1) 0.7 (0.1) 0.9 (0.1)Tier 4 0.1 (0) 0.1 (0) 0.1 (0) 0.1 (0) 0 (0) 0.1 (0) 0.1 (0) 0.1 (0)
Tiers 1–3 1.3 (0.1) 1.5 (0.1) 1.1 (0.1) 1.4 (0.1) 1.2 (0.1) 1.5 (0.1) 1.4 (0.1) 1.6 (0.1)Total Tiers 1–4 1.3 (0.1) 1.6 (0.1) 1.2 (0.1) 1.5 (0.1) 1.2 (0.1) 1.5 (0.1) 1.5 (0.1) 1.7 (0.1)
EWCFG Rec. 2 2 2 2 3 3 3 3
Meat andAlternatives Tier 1 0.1 (0) 0.1 (0) 0.2 (0) 0.1 (0) 0.1 (0) 0.1 (0) 0.1 (0) 0.1 (0)
Tier 2 0.6 (0.1) 0.6 (0.1) 0.6 (0.1) 0.6 (0.1) 0.6 (0.1) 0.6 (0.1) 0.4 (0.1) 0.5 (0.1)Tier 3 1.4 (0.2) 1.1 (0.1) 1.6 (0.1) 1.3 (0.1) 1.6 (0.1) 1.2 (0.1) 1.2 (0.1) 1.1 (0.1)Tier 4 0.6 (0.1) 0.3 (0.1) 0.3 (0.1) 0.3 (0.1) 0.3 (0.1) 0.3 (0.1) 0.4 (0.1) 0.3 (0.1)
Tiers 1–3 2.4 (0.2) 1.8 (0.1) 2.4 (0.1) 2.0 (0.1) 2.3 (0.1) 1.9 (0.1) 1.7 (0.1) 1.7 (0.1)Total Tiers 1–4 2.7 (0.2) 2.1 (0.1) 2.6 (0.1) 2.3 (0.1) 2.6 (0.1) 2.2 (0.1) 2.1 (0.1) 2.0 (0.1)
EWCFG Rec. 3 2 3 2 3 2 3 2
Tiers are classified according to lower and upper thresholds for nutrients of public health concern: sodium, saturated fats, total fats, and sugars. Lower thresholds: total fat 63 g/RA,sugars 66 g/RA, and sodium 6140 mg/RA [5]. Upper thresholds: total fat >10 g/RA, sugars >19 g/RA, sodium >360 mg/RA, and saturated fats >2 g/RA [5]. Tier 1 foods do not exceed lowerthresholds for total fat, sugar and sodium. Tier 2 may exceed one or two lower thresholds but no upper thresholds. For Tier 3, Vegetable and Fruit and Grain Products exceed all lowerthreshold and no upper thresholds, or only one upper threshold. For Tier 3, Milk and Alternatives and Meat and Alternatives exceed all lower threshold and no upper thresholds, or onlyone upper threshold for total fat, sugars, or sodium. For Tier 4, Vegetable and Fruit and Grain Products exceed two upper thresholds. For Tier 4, Milk and Alternatives and Meat andAlternatives exceed upper thresholds for total fat, sugars, or sodium [5]. Data is presented as mean (SEM: standard error of the mean). Servings per/day are classified according to EWCFG:Eating Well with Canada’s Food Guide. Rec: Recommendations. Results are weighted, nationally representative and energy adjusted.
Nutrients 2020, 12, 1113 6 of 16
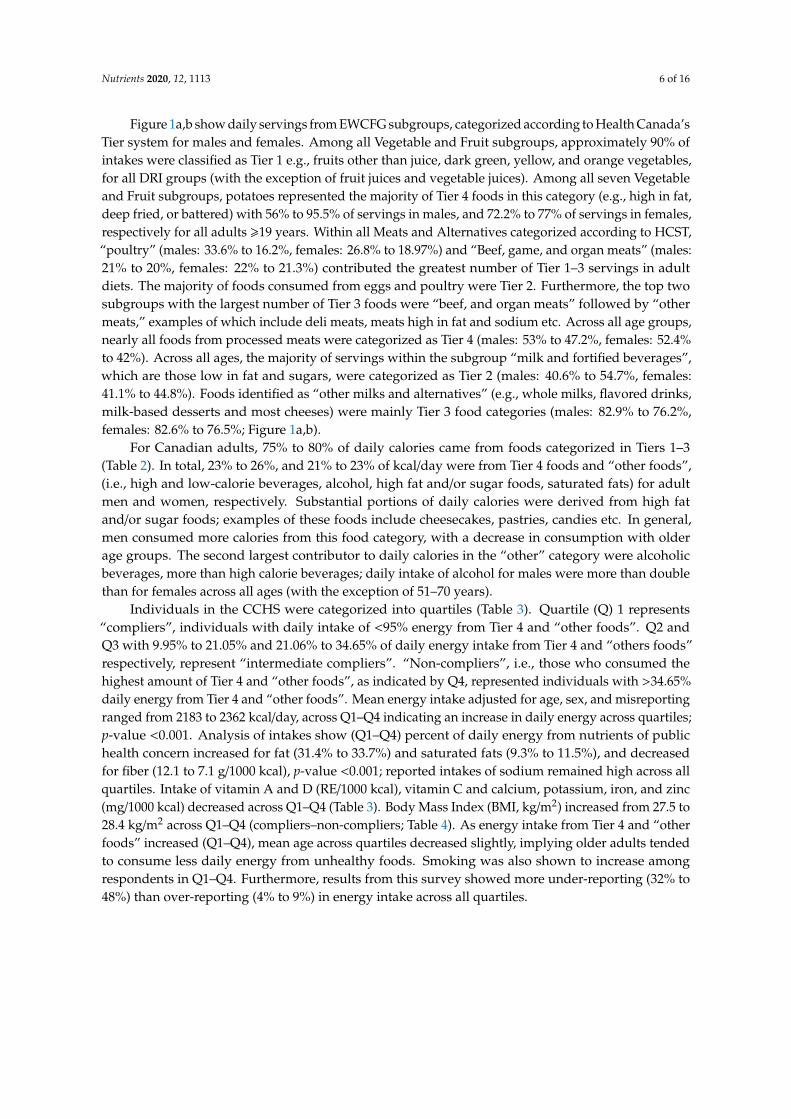
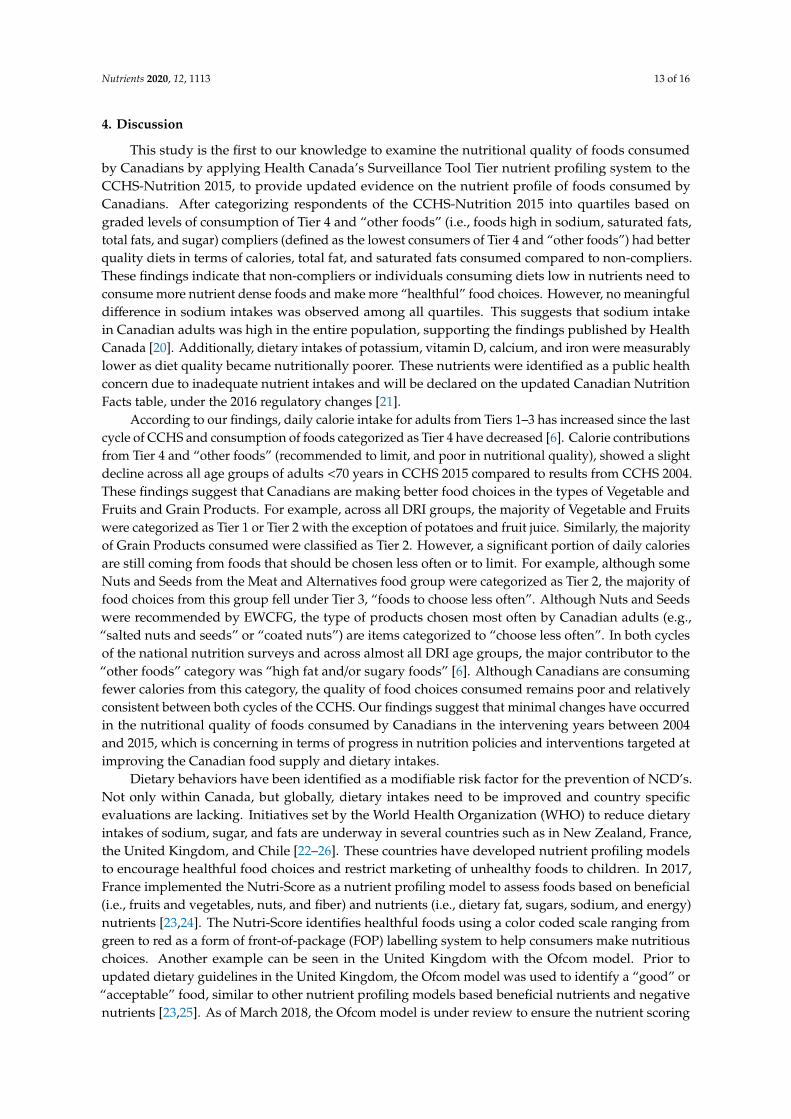
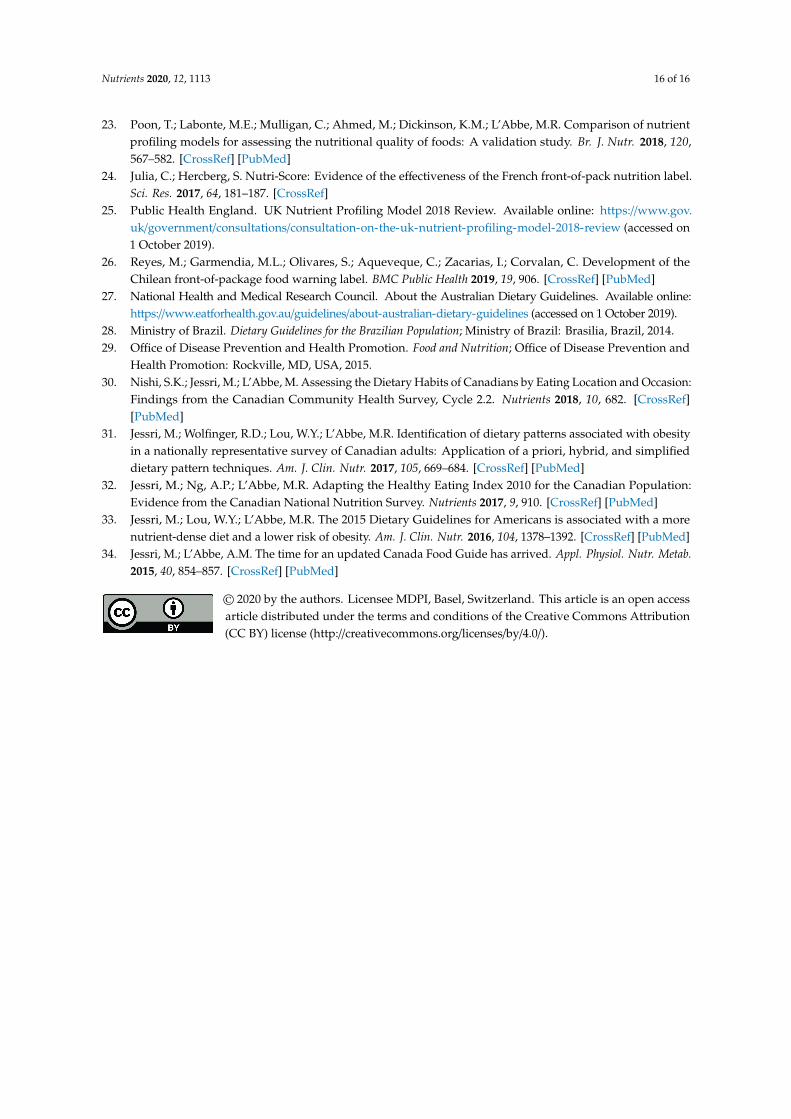
Figure 1a,b show daily servings from EWCFG subgroups, categorized according to Health Canada’sTier system for males and females. Among all Vegetable and Fruit subgroups, approximately 90% ofintakes were classified as Tier 1 e.g., fruits other than juice, dark green, yellow, and orange vegetables,for all DRI groups (with the exception of fruit juices and vegetable juices). Among all seven Vegetableand Fruit subgroups, potatoes represented the majority of Tier 4 foods in this category (e.g., high in fat,deep fried, or battered) with 56% to 95.5% of servings in males, and 72.2% to 77% of servings in females,respectively for all adults >19 years. Within all Meats and Alternatives categorized according to HCST,“poultry” (males: 33.6% to 16.2%, females: 26.8% to 18.97%) and “Beef, game, and organ meats” (males:21% to 20%, females: 22% to 21.3%) contributed the greatest number of Tier 1–3 servings in adultdiets. The majority of foods consumed from eggs and poultry were Tier 2. Furthermore, the top twosubgroups with the largest number of Tier 3 foods were “beef, and organ meats” followed by “othermeats,” examples of which include deli meats, meats high in fat and sodium etc. Across all age groups,nearly all foods from processed meats were categorized as Tier 4 (males: 53% to 47.2%, females: 52.4%to 42%). Across all ages, the majority of servings within the subgroup “milk and fortified beverages”,which are those low in fat and sugars, were categorized as Tier 2 (males: 40.6% to 54.7%, females:41.1% to 44.8%). Foods identified as “other milks and alternatives” (e.g., whole milks, flavored drinks,milk-based desserts and most cheeses) were mainly Tier 3 food categories (males: 82.9% to 76.2%,females: 82.6% to 76.5%; Figure 1a,b).
For Canadian adults, 75% to 80% of daily calories came from foods categorized in Tiers 1–3(Table 2). In total, 23% to 26%, and 21% to 23% of kcal/day were from Tier 4 foods and “other foods”,(i.e., high and low-calorie beverages, alcohol, high fat and/or sugar foods, saturated fats) for adultmen and women, respectively. Substantial portions of daily calories were derived from high fatand/or sugar foods; examples of these foods include cheesecakes, pastries, candies etc. In general,men consumed more calories from this food category, with a decrease in consumption with olderage groups. The second largest contributor to daily calories in the “other” category were alcoholicbeverages, more than high calorie beverages; daily intake of alcohol for males were more than doublethan for females across all ages (with the exception of 51–70 years).
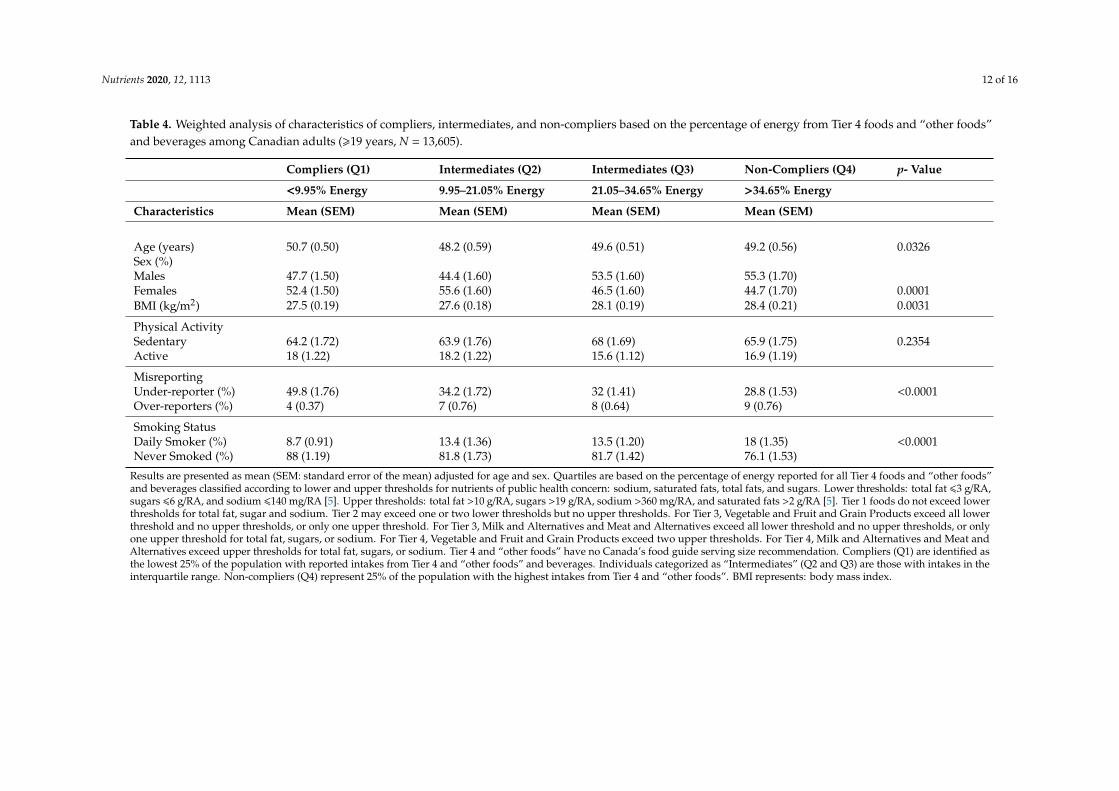
Individuals in the CCHS were categorized into quartiles (Table 3). Quartile (Q) 1 represents“compliers”, individuals with daily intake of <95% energy from Tier 4 and “other foods”. Q2 andQ3 with 9.95% to 21.05% and 21.06% to 34.65% of daily energy intake from Tier 4 and “others foods”respectively, represent “intermediate compliers”. “Non-compliers”, i.e., those who consumed thehighest amount of Tier 4 and “other foods”, as indicated by Q4, represented individuals with >34.65%daily energy from Tier 4 and “other foods”. Mean energy intake adjusted for age, sex, and misreportingranged from 2183 to 2362 kcal/day, across Q1–Q4 indicating an increase in daily energy across quartiles;p-value <0.001. Analysis of intakes show (Q1–Q4) percent of daily energy from nutrients of publichealth concern increased for fat (31.4% to 33.7%) and saturated fats (9.3% to 11.5%), and decreasedfor fiber (12.1 to 7.1 g/1000 kcal), p-value <0.001; reported intakes of sodium remained high across allquartiles. Intake of vitamin A and D (RE/1000 kcal), vitamin C and calcium, potassium, iron, and zinc(mg/1000 kcal) decreased across Q1–Q4 (Table 3). Body Mass Index (BMI, kg/m2) increased from 27.5 to28.4 kg/m2 across Q1–Q4 (compliers–non-compliers; Table 4). As energy intake from Tier 4 and “otherfoods” increased (Q1–Q4), mean age across quartiles decreased slightly, implying older adults tendedto consume less daily energy from unhealthy foods. Smoking was also shown to increase amongrespondents in Q1–Q4. Furthermore, results from this survey showed more under-reporting (32% to48%) than over-reporting (4% to 9%) in energy intake across all quartiles.

Nutrients 2020, 12, 1113 7 of 16Nutrients 2020, 12, x FOR PEER REVIEW 6 of 18
(a)
0% 10% 20% 30% 40% 50% 60% 70% 80% 90%100%
Fruits, Other Than Juice (19-30 years)Fruits, Other Than Juice (31-50 years)Fruits, Other Than Juice (51-70 years)
Fruits, Other Than Juice (>70years)Fruit Juice (19-30 years)Fruit Juice (31-50 years)Fruit Juice (51-70 years)
Fruit Juice (>70years)Vegetables, Dark Green (19-30 years)Vegetables, Dark Green (31-50 years)Vegetables, Dark Green (51-70 years)
Vegetables, Dark Green (>70years)Vegetables, Deep Yellow or Orange (19-30…Vegetables, Deep Yellow or Orange (31-50…Vegetables, Deep Yellow or Orange (51-70…
Vegetables, Deep Yellow or Orange…Vegetables, Potatoes (19-30 years)Vegetables, Potatoes (31-50 years)Vegetables, Potatoes (51-70 years)
Vegetables, Potatoes(>70years)Vegetables, Other (19-30 years)Vegetables, Other (31-50 years)Vegetables, Other (51-70 years)
Vegetables, Other (>70years)Vegetables, Juice and Cocktail (19-30 years)Vegetables, Juice and Cocktail (31-50 years)Vegetables, Juice and Cocktail (51-70 years)
Vegetables, Juice and Cocktail (>70years)Grain Products, Whole Grain (19-30 years)Grain Products, Whole Grain (31-50 years)Grain Products, Whole Grain (51-70 years)
Grain Products, Whole Grain (>70 years)Grain Products, Non Whole Grain,…Grain Products, Non Whole Grain,…Grain Products, Non Whole Grain,…Grain Products, Non Whole Grain,…
Grain Products, Non Whole Grain, Non…Grain Products, Non Whole Grain, Non…Grain Products, Non Whole Grain, Non…Grain Products, Non Whole Grain, Non…
Fluid Milk & Fortified Soy Beverages (19-…Fluid Milk & Fortified Soy Beverages (31-…Fluid Milk & Fortified Soy Beverages (51-…Fluid Milk & Fortified Soy Beverages (>70…
Other Milk and Alternatives (19-30 years)Other Milk and Alternatives (31-50 years)Other Milk and Alternatives (51-70 years)
Other Milk and Alternatives (>70 years)Beef, Game, & Organ Meats (19-30 years)Beef, Game, & Organ Meats (31-50 years)Beef, Game, & Organ Meats (51-70 years)
Beef, Game, & Organ Meats (>70 years)Other Meats (19-30 years)Other Meats (31-50 years)Other Meats (51-70 years)
Other Meats (>70 years)Poultry (19-30 years)Poultry (31-50 years)Poultry (51-70 years)
Poultry (>70 years)Fish (19-30 years)Fish (31-50 years)Fish (51-70 years)
Fish (>70 years)ShellFish (19-30 years)ShellFish (31-50 years)ShellFish (51-70 years)
ShellFish (>70 years)Legumes (19-30 years)Legumes (31-50 years)Legumes (51-70 years)
Legumes (>70 years)Nuts & Seeds (19-30 years)Nuts & Seeds (31-50 years)Nuts & Seeds (51-70 years)
Nuts & Seeds (>70 years)Eggs (19-30 years)Eggs (31-50 years)Eggs (51-70 years)
Eggs (>70 years)Processed Meats (19-30 years)Processed Meats (31-50 years)Processed Meats (51-70 years)
Processed Meats (>70 years)
Tier 1
Tier 2
Tier 3
Tier 4
Figure 1. Cont.

Nutrients 2020, 12, 1113 8 of 16Nutrients 2020, 12, x FOR PEER REVIEW 7 of 18
(b)
Figure 1. Weighted age-stratified analysis of foods consumed by food category based on the 2014
Health Canada’s Surveillance Tool, Tier system, among adults >19 years, N = 13,605 (a) males and (b)
females, results are energy adjusted. Tiers are classified according to lower and upper thresholds for
0% 20% 40% 60% 80% 100%
Fruits, Other Than Juice (19-30 years)Fruits, Other Than Juice (31-50 years)Fruits, Other Than Juice (51-70 years)
Fruits, Other Than Juice (>70years)Fruit Juice (19-30 years)Fruit Juice (31-50 years)Fruit Juice (51-70 years)
Fruit Juice (>70years)Vegetables, Dark Green (19-30 years)Vegetables, Dark Green (31-50 years)Vegetables, Dark Green (51-70 years)
Vegetables, Dark Green (>70years)Vegetables, Deep Yellow or Orange (19-30…
Vegetables, Deep Yellow or Orange (31-50 years)Vegetables, Deep Yellow or Orange (51-70 years)
Vegetables, Deep Yellow or Orange (>70years)Vegetables, Potatoes (19-30 years)Vegetables, Potatoes (31-50 years)Vegetables, Potatoes (51-70 years)
Vegetables, Potatoes(>70years)Vegetables, Other (19-30 years)Vegetables, Other (31-50 years)Vegetables, Other (51-70 years)
Vegetables, Other (>70years)Vegetables, Juice and Cocktail (19-30 years)Vegetables, Juice and Cocktail (31-50 years)Vegetables, Juice and Cocktail (51-70 years)
Vegetables, Juice and Cocktail (>70years)Grain Products, Whole Grain (19-30 years)Grain Products, Whole Grain (31-50 years)Grain Products, Whole Grain (51-70 years)
Grain Products, Whole Grain (>70 years)Grain Products, Non Whole Grain, Enriched…Grain Products, Non Whole Grain, Enriched…Grain Products, Non Whole Grain, Enriched…Grain Products, Non Whole Grain, Enriched…
Grain Products, Non Whole Grain, Non…Grain Products, Non Whole Grain, Non…Grain Products, Non Whole Grain, Non…Grain Products, Non Whole Grain, Non…
Fluid Milk & Fortified Soy Beverages (19-30…Fluid Milk & Fortified Soy Beverages (31-50…Fluid Milk & Fortified Soy Beverages (51-70…
Fluid Milk & Fortified Soy Beverages (>70 years)Other Milk and Alternatives (19-30 years)Other Milk and Alternatives (31-50 years)Other Milk and Alternatives (51-70 years)
Other Milk and Alternatives (>70 years)Beef, Game, & Organ Meats (19-30 years)Beef, Game, & Organ Meats (31-50 years)Beef, Game, & Organ Meats (51-70 years)
Beef, Game, & Organ Meats (>70 years)Other Meats (19-30 years)Other Meats (31-50 years)Other Meats (51-70 years)
Other Meats (>70 years)Poultry (19-30 years)Poultry (31-50 years)Poultry (51-70 years)
Poultry (>70 years)Fish (19-30 years)Fish (31-50 years)Fish (51-70 years)
Fish (>70 years)ShellFish (19-30 years)ShellFish (31-50 years)ShellFish (51-70 years)
ShellFish (>70 years)Legumes (19-30 years)Legumes (31-50 years)Legumes (51-70 years)
Legumes (>70 years)Nuts & Seeds (19-30 years)Nuts & Seeds (31-50 years)Nuts & Seeds (51-70 years)
Nuts & Seeds (>70 years)Eggs (19-30 years)Eggs (31-50 years)Eggs (51-70 years)
Eggs (>70 years)Processed Meats (19-30 years)Processed Meats (31-50 years)Processed Meats (51-70 years)
Processed Meats (>70 years)
Tier 1
Tier 2
Tier 3
Tier 4
Figure 1. Weighted age-stratified analysis of foods consumed by food category based on the 2014Health Canada’s Surveillance Tool, Tier system, among adults >19 years, N = 13,605 (a) males and (b)females, results are energy adjusted.

Nutrients 2020, 12, 1113 9 of 16
Tiers are classified according to lower and upper thresholds for nutrients of public health concern:sodium, saturated fats, total fats, and sugars. Lower thresholds: total fat 6 3 g/RA, sugars 6 6 g/RA,and sodium 6 140 mg/RA [5]. Upper thresholds: total fat >10 g/RA, sugars >19 g/RA, sodium >360mg/RA, and saturated fats >2 g/RA [5]. Tier 1 foods do not exceed lower thresholds for total fat, sugar,and sodium. Tier 2 may exceed one or two lower thresholds but no upper thresholds. For Tier 3,Vegetable and Fruit and Grain Products exceeded all lower threshold and no upper thresholds, or onlyone upper threshold. For Tier 3 Milk and Alternatives and Meat and Alternatives exceeded all lowerthreshold and no upper thresholds, or only one upper threshold for total fat, sugars, or sodium. For Tier4, Vegetable and Fruit and Grain Products exceeded two upper thresholds. For Tier 4, Milk andAlternatives and Meat and Alternatives exceeded upper thresholds for total fat, sugars, or sodium [5].

Nutrients 2020, 12, 1113 10 of 16
Table 2. Weighted analysis of energy contribution from Tier 1–3 and Tier 4 (foods recommended to limit) and “other foods” not recommended by Canada’s Food Guide.
Men,19–30 Years
Women,19–30 Years
Men,31–50 Years
Women,31–50 Years
Men,51–70 Years
Women,51–70 Years
Men,≥70 Years
Women,≥70 Years
Variable (kcal/day) Mean (SEM) Mean (SEM) Mean (SEM) Mean (SEM) Mean (SEM) Mean (SEM) Mean (SEM) Mean (SEM)
Tiers 1+2+3 1598 (54) 1169 (34) 1544 (31) 1171 (23) 1435 (27) 1102 (15) 1215 (19) 1015 (18)Tiers 4 246 (42) 122 (15) 175 (12) 108 (11) 157 (10) 118 (7) 162 (14) 119 (9)
Other Food/BeveragesAlcoholic Beverages 119 (21) 54 (9) 121 (12) 46 (4) 125 (10) 72 (8) 89 (8) 32 (4)
Beverages, High calorie (≥40 kcal/100g) 99 (12) 51 (6) 61 (6) 29 (2) 38 (3) 23 (3) 27 (3) 20 (3)Beverages, Low calorie (<40 kcal/100 g) 37 (10) 22 (4) 24 (2) 19 (2) 21 (2) 16 (2) 16 (2) 16 (1)
High fat and/ or sugar foods 133 (15) 113 (8) 145 (11) 105 (8) 128 (7) 113 (8) 117 (7) 86 (5)Meal replacements 4 (3) 3 (1) 1(1) 1 (1) 2 (1) 4 (2) 5 (1) 3 (1)
Saturated and/or trans fats and oils 47 (7) 36 (6) 43 (4) 42 (4) 47 (4) 36 (3) 54 (5) 37 (2)Uncategorized (ingredients, seasonings,
and unprepared foods) 30 (7) 12 (2) 19 (3) 16 (2) 15 (3) 11 (1) 9 (1) 7 (1)
Unsaturated fats and oils 84 (10) 55 (4) 74 (4) 59 (3) 89 (5) 62 (3) 70 (4) 57 (3)Supplements 6 (3) 2 (1) 2 (1) 4 (1) 1 (0.4) 5 (3) 0.04 (0.04) 0.47 (0.3)
Total energy from Tier 4 and “other foods”and beverages (kcal/day) 681 (62) 397 (21) 568 (21) 350 (14) 516 (20) 378 (15) 464 (19) 310 (13)
Total energy from Tier 4 and “other foods”and beverages (%) 26 (2) 23 (1) 24 (1) 21 (1) 23(1) 22(1) 24 (1) 21 (1)
Tiers are classified according to lower and upper thresholds for nutrients of public health concern: sodium, saturated fats, total fats, and sugars. Lower thresholds: total fat 63 g/RA,sugars 66 g/RA, and sodium 6140 mg/RA [5]. Upper thresholds: total fat >10 g/RA, sugars >19 g/RA, sodium >360 mg/RA, and saturated fats >2 g/RA [5]. Tier 1 foods do not exceed lowerthresholds for total fat, sugar and sodium. Tier 2 may exceed one or two lower thresholds but no upper thresholds. For Tier 3, Vegetable and Fruit and Grain Products exceed all lowerthreshold and no upper thresholds, or only one upper threshold. For Tier 3, Milk and Alternatives and Meat and Alternatives exceed all lower threshold and no upper thresholds, or onlyone upper threshold for total fat, sugars, or sodium. For Tier 4, Vegetable and Fruit and Grain Products exceed two upper thresholds. For Tier 4, Milk and Alternatives and Meat andAlternatives exceed upper thresholds for total fat, sugars, or sodium. Results are presented as mean (SEM: standard error of the mean).

Nutrients 2020, 12, 1113 11 of 16
Table 3. Weighted analysis of nutrient intakes by compliers, intermediates, and non-compliers based on the percentage of energy consumed from Tier 4 and “otherfood” and beverages among Canadian (>19 years, N = 13,605), adjusted for age, sex, and misreporting status (under-reporter, plausible reporter, and over-reporters).
Compliers (Q1) Intermediates (Q2) Intermediates (Q3) Non-Compliers (Q4) p-Value
<9.95% Energy 9.95–21.05% Energy 21.06–34.62% Energy >34.62% Energy
Nutrients Mean (SEM) Mean (SEM) Mean (SEM) Mean (SEM)
Energy (kcal/day) 2183 (20.2) 2269 (19.7) 2287 (19.8) 2362 (22.8) <0.0001Fat (% Energy) 31.4 (0.4) 33.3 (0.34) 33.2 (0.30) 33.7 (0.37) <0.0001
Saturated fat (% Energy) 9.3 (0.15) 10.7 (0.15) 11.2 (0.15) 11.5 (0.18) <0.0001Monounsaturated fat (% Energy) 12.15 (0.23) 12.44 (0.14) 12.41 (0.14) 12.27 (0.16) 0.5836Polyunsaturated fat (% Energy) 7.0 (0.14) 7.2 (0.17) 6.8 (0.11) 7.0 (0.16) 0.1262
Carbohydrates (% Energy) 48.8 (0.44) 46.8 (0.4) 47.1 (0.35) 44.7 (0.43) <0.0001Protein (% Energy) 19.1 (0.25) 17.7 (0.21) 15.7 (0.17) 14.3 (0.16) <0.0001Alcohol (% Energy) 0.68 (0.16) 2.23 (0.2) 3.96 (0.24) 7.40 (0.4) <0.0001
Dietary fiber (g/1000 kcal) 12.1 (0.2) 9.7 (0.17) 9.0 (0.13) 7.1 (0.19) <0.0001Vitamin A (RE/1000 kcal) 409 (13) 384 (16) 337 (10) 293 (13) <0.0001Vitamin D (RE/1000 kcal) 3.03 (0.10) 2.86 (0.12) 2.36 (0.07) 2.21 (0.09) <0.0001Thiamin (mg/1000 kcal) 0.95 (0.02) 0.88 (0.01) 0.84 (0.01) 0.71 (0.01) <0.0001Niacin (mg/1000 kcal) 23.46 (0.32) 22.37 (0.36) 19.70 (0.21) 18.46 (0.25) <0.0001
Riboflavin (mg/1000 kcal) 1.11 (0.02) 1.08 (0.01) 1.01 (0.01) 0.94 (0.01) <0.0001Vitamin B6 (ug/1000 kcal) 1.07 (0.02) 0.94 (0.02) 0.84 (0.01) 0.79 (0.02) <0.0001
Folate (ug/1000 kcal) 141 (3.5) 121 (2) 110 (1.8) 97 (4) <0.0001Vitamin B12 (ug/1000 kcal) 2.35 (0.08) 2.44 (0.10) 2.05 (0.07) 1.95 (0.11) 0.0003Vitamin C (mg/1000 kcal) 65.30 (2.34) 56.13 (2.04) 50.33 (1.90) 43.32 (3.23) <0.0001Calcium (mg/1000 kcal) 471.23 (8.39) 452.09 (8.61) 410.44 (6.92) 341.25 (6.09) <0.0001
Phosphorus (mg/1000 kcal) 780.75 (9.08) 720.57 (8.33) 651.49 (6.77) 591.97 (7.48) <0.0001Potassium (mg/ 1000 kcal) 1700.91 (18.99) 1534.07 (17.25) 1424.02 (15.63) 1263.46 (19.97) <0.0001
Sodium (mg/ 1000 kcal) 1479.31 (25.81) 1470.08 (21.14) 1482.01 (19.44) 1382.06 (17.49) 0.0002Magnesium (mg/ 1000 kcal) 195.31 (2.56) 174.81 (3.23) 158.99 (1.19) 140.76 (2.17) <0.0001
Iron (mg/ 1000 kcal) 7.49 (0.11) 6.85 (0.09) 6.55 (0.07) 5.66 (0.08) <0.0001Zinc (mg/ 1000 kcal) 6.45 (0.10) 5.92 (0.08) 5.33 (0.08) 4.62 (0.08) <0.0001
Results are presented as mean (SEM: standard error of the mean). Quartiles are based on the percentage of energy reported for all Tier 4 foods and “other foods” and beverages classifiedaccording to lower and upper thresholds for nutrients of public health concern: sodium, saturated fats, total fats, and sugars. Lower thresholds: total fat 63 g/RA, sugars 66 g/RA,and sodium 6140 mg/RA [5]. Upper thresholds: total fat >10 g/RA, sugars >19 g/RA, sodium >360 mg/RA, and saturated fats >2 g/RA [5]. Tier 1 foods do not exceed lower thresholds fortotal fat, sugar and sodium. Tier 2 may exceed one or two lower thresholds but no upper thresholds. For Tier 3, Vegetable and Fruit and Grain Products exceed all lower threshold and noupper thresholds, or only one upper threshold. For Tier 3, Milk and Alternatives and Meat and Alternatives exceed all lower threshold and no upper thresholds, or only one upperthreshold for total fat, sugars, or sodium. For Tier 4, Vegetable and Fruit and Grain Products exceed two upper thresholds. For Tier 4, Milk and Alternatives and Meat and Alternativesexceed upper thresholds for total fat, sugars, or sodium. Tier 4 and “other foods” have no Canada’s food guide serving size recommendation. Compliers (Q1) are identified as the lowest25% of the population with reported intakes from Tier 4 and “other foods” and beverages. Individuals categorized as “Intermediates” (Q2 and Q3) are those with intakes in the interquartilerange. Non-compliers (Q4) represent 25% of the population with the highest intakes from Tier 4 and “other foods”.
Nutrients 2020, 12, 1113 12 of 16
Table 4. Weighted analysis of characteristics of compliers, intermediates, and non-compliers based on the percentage of energy from Tier 4 foods and “other foods”and beverages among Canadian adults (>19 years, N = 13,605).
Compliers (Q1) Intermediates (Q2) Intermediates (Q3) Non-Compliers (Q4) p- Value
<9.95% Energy 9.95–21.05% Energy 21.05–34.65% Energy >34.65% Energy
Characteristics Mean (SEM) Mean (SEM) Mean (SEM) Mean (SEM)
Age (years) 50.7 (0.50) 48.2 (0.59) 49.6 (0.51) 49.2 (0.56) 0.0326Sex (%)Males 47.7 (1.50) 44.4 (1.60) 53.5 (1.60) 55.3 (1.70)Females 52.4 (1.50) 55.6 (1.60) 46.5 (1.60) 44.7 (1.70) 0.0001BMI (kg/m2) 27.5 (0.19) 27.6 (0.18) 28.1 (0.19) 28.4 (0.21) 0.0031
Physical ActivitySedentary 64.2 (1.72) 63.9 (1.76) 68 (1.69) 65.9 (1.75) 0.2354Active 18 (1.22) 18.2 (1.22) 15.6 (1.12) 16.9 (1.19)
MisreportingUnder-reporter (%) 49.8 (1.76) 34.2 (1.72) 32 (1.41) 28.8 (1.53) <0.0001Over-reporters (%) 4 (0.37) 7 (0.76) 8 (0.64) 9 (0.76)
Smoking StatusDaily Smoker (%) 8.7 (0.91) 13.4 (1.36) 13.5 (1.20) 18 (1.35) <0.0001Never Smoked (%) 88 (1.19) 81.8 (1.73) 81.7 (1.42) 76.1 (1.53)
Results are presented as mean (SEM: standard error of the mean) adjusted for age and sex. Quartiles are based on the percentage of energy reported for all Tier 4 foods and “other foods”and beverages classified according to lower and upper thresholds for nutrients of public health concern: sodium, saturated fats, total fats, and sugars. Lower thresholds: total fat 63 g/RA,sugars 66 g/RA, and sodium 6140 mg/RA [5]. Upper thresholds: total fat >10 g/RA, sugars >19 g/RA, sodium >360 mg/RA, and saturated fats >2 g/RA [5]. Tier 1 foods do not exceed lowerthresholds for total fat, sugar and sodium. Tier 2 may exceed one or two lower thresholds but no upper thresholds. For Tier 3, Vegetable and Fruit and Grain Products exceed all lowerthreshold and no upper thresholds, or only one upper threshold. For Tier 3, Milk and Alternatives and Meat and Alternatives exceed all lower threshold and no upper thresholds, or onlyone upper threshold for total fat, sugars, or sodium. For Tier 4, Vegetable and Fruit and Grain Products exceed two upper thresholds. For Tier 4, Milk and Alternatives and Meat andAlternatives exceed upper thresholds for total fat, sugars, or sodium. Tier 4 and “other foods” have no Canada’s food guide serving size recommendation. Compliers (Q1) are identified asthe lowest 25% of the population with reported intakes from Tier 4 and “other foods” and beverages. Individuals categorized as “Intermediates” (Q2 and Q3) are those with intakes in theinterquartile range. Non-compliers (Q4) represent 25% of the population with the highest intakes from Tier 4 and “other foods”. BMI represents: body mass index.
Nutrients 2020, 12, 1113 13 of 16
4. Discussion
This study is the first to our knowledge to examine the nutritional quality of foods consumedby Canadians by applying Health Canada’s Surveillance Tool Tier nutrient profiling system to theCCHS-Nutrition 2015, to provide updated evidence on the nutrient profile of foods consumed byCanadians. After categorizing respondents of the CCHS-Nutrition 2015 into quartiles based ongraded levels of consumption of Tier 4 and “other foods” (i.e., foods high in sodium, saturated fats,total fats, and sugar) compliers (defined as the lowest consumers of Tier 4 and “other foods”) had betterquality diets in terms of calories, total fat, and saturated fats consumed compared to non-compliers.These findings indicate that non-compliers or individuals consuming diets low in nutrients need toconsume more nutrient dense foods and make more “healthful” food choices. However, no meaningfuldifference in sodium intakes was observed among all quartiles. This suggests that sodium intakein Canadian adults was high in the entire population, supporting the findings published by HealthCanada [20]. Additionally, dietary intakes of potassium, vitamin D, calcium, and iron were measurablylower as diet quality became nutritionally poorer. These nutrients were identified as a public healthconcern due to inadequate nutrient intakes and will be declared on the updated Canadian NutritionFacts table, under the 2016 regulatory changes [21].
According to our findings, daily calorie intake for adults from Tiers 1–3 has increased since the lastcycle of CCHS and consumption of foods categorized as Tier 4 have decreased [6]. Calorie contributionsfrom Tier 4 and “other foods” (recommended to limit, and poor in nutritional quality), showed a slightdecline across all age groups of adults <70 years in CCHS 2015 compared to results from CCHS 2004.These findings suggest that Canadians are making better food choices in the types of Vegetable andFruits and Grain Products. For example, across all DRI groups, the majority of Vegetable and Fruitswere categorized as Tier 1 or Tier 2 with the exception of potatoes and fruit juice. Similarly, the majorityof Grain Products consumed were classified as Tier 2. However, a significant portion of daily caloriesare still coming from foods that should be chosen less often or to limit. For example, although someNuts and Seeds from the Meat and Alternatives food group were categorized as Tier 2, the majority offood choices from this group fell under Tier 3, “foods to choose less often”. Although Nuts and Seedswere recommended by EWCFG, the type of products chosen most often by Canadian adults (e.g.,“salted nuts and seeds” or “coated nuts”) are items categorized to “choose less often”. In both cyclesof the national nutrition surveys and across almost all DRI age groups, the major contributor to the“other foods” category was “high fat and/or sugary foods” [6]. Although Canadians are consumingfewer calories from this category, the quality of food choices consumed remains poor and relativelyconsistent between both cycles of the CCHS. Our findings suggest that minimal changes have occurredin the nutritional quality of foods consumed by Canadians in the intervening years between 2004and 2015, which is concerning in terms of progress in nutrition policies and interventions targeted atimproving the Canadian food supply and dietary intakes.
Dietary behaviors have been identified as a modifiable risk factor for the prevention of NCD’s.Not only within Canada, but globally, dietary intakes need to be improved and country specificevaluations are lacking. Initiatives set by the World Health Organization (WHO) to reduce dietaryintakes of sodium, sugar, and fats are underway in several countries such as in New Zealand, France,the United Kingdom, and Chile [22–26]. These countries have developed nutrient profiling modelsto encourage healthful food choices and restrict marketing of unhealthy foods to children. In 2017,France implemented the Nutri-Score as a nutrient profiling model to assess foods based on beneficial(i.e., fruits and vegetables, nuts, and fiber) and nutrients (i.e., dietary fat, sugars, sodium, and energy)nutrients [23,24]. The Nutri-Score identifies healthful foods using a color coded scale ranging fromgreen to red as a form of front-of-package (FOP) labelling system to help consumers make nutritiouschoices. Another example can be seen in the United Kingdom with the Ofcom model. Prior toupdated dietary guidelines in the United Kingdom, the Ofcom model was used to identify a “good” or“acceptable” food, similar to other nutrient profiling models based beneficial nutrients and negativenutrients [23,25]. As of March 2018, the Ofcom model is under review to ensure the nutrient scoring

Nutrients 2020, 12, 1113 14 of 16
system reflects current dietary guidance and changes to recommended energy intakes, free sugarsand sodium [25]. Chile and other countries in South America have introduced and approved front ofpackage warning labels identifying foods high in nutrients of public health concern [26].
The present study is the most recent to investigate both the quality and quantity of dietary intakesof Canadian adults using the 2014 HCST, a nutrient profiling model based on thresholds for sodium,saturated fats, total fats, and sugars. With data from the CCHS 2015, our results examined nutrients,servings, and calorie intake in different Tiers of foods. Through application of a nutrient-profiling modeldeveloped by researchers at Health Canada, we were able to produce quantitative data to describethe quality of Canadian dietary intakes relative to nutrients of public health concern. These findingsare of importance to Canadians, as they reflect the sum of the changes in the food supply and dietarychoices, and can be used to develop strategies and policies to help improve Canada’s food environment(e.g., Canada’s Food Guide to promote healthy eating) and to improve the nutritional quality of theCanadian food supply.
This study has several strengths. CCHS Nutrition 2015 is a nationally representative sample ofthe Canadian population. Respondents were administered a modified AMPM, which was improvedfrom the CCHS 2004 version. Another improvement was in the food module booklet; in this cycle,figures and diagrams were colored and were identified as “better quality” representing real-life itemssuch as glasses, bowls, plates etc. Another strength of this research is that CCHS 2015 collectedsocio-demographic and lifestyle characteristics such as measured anthropometric data (e.g., usedto calculate BMI), which were incorporated as covariates into our statistical models. Furthermore,we were able to adjust our results for misreporting, thus correcting for under-reporting of sociallyundesirable foods which has been shown to improve the validity of our findings [14–16]. However,caution needs to be exercised when interpreting these results as causal inference is not possible withcross-sectional surveys.
This study is not without limitations. It is important to acknowledge that changes in dietaryintakes between CCHS 2004 and CCHS 2015 may be due to differences in the versions of the CNF(CNF 2015 compared to CNF 2001b) used to assess nutrient composition, rather than improved foodchoices. Since the last national nutrition survey, reformulation of food products in the Canadianfood supply has been encouraged by Health Canada. As a result, foods in this survey may havebeen re-categorized into different Tiers reflecting improved food choices and accounting for changesin energy intake between both cycles of CCHS. An example reported by Garriguet et al. (2018),indicated that energy contributions from Italian salad dressing and baking chocolate have decreasedsince the CNF 2001b [16,20].
5. Conclusions
Overall Canadian dietary intakes are mainly from Tier 2 and Tier 3 foods. Tier 4 and “other foods”represent between 21% and 26% of daily energy intake for adults, with the majority of consumptioncoming from high fat and sugar foods and alcohol. Several countries have undergone revisions oftheir dietary guidelines, such as the USDA 2015–2020 Dietary Guidelines for Americans, The DietaryGuidelines for the Brazilian Population, the Australian Dietary Guidelines (2013), and the UnitedKingdom [25,27–29]. Updated evidence based on consumption of nutrients to limit and on adherence tothe recently released 2019 Canada’s Food Guide are warranted to assess the progress towards achievingthe WHO “best buy” policies [22]. Results from this study provide such evidence for Canadians,and can be used to improve the nutritional quality of the food supply and develop targeted policiessupporting healthier food choices for the population [6,7,15,16,30–34].
Author Contributions: Conceptualization, M.R.L. and M.J.; Formal analysis, S.H.; Funding acquisition, M.R.L.;Investigation, S.H., M.R.L., and M.J.; Methodology, M.R.L. and M.J.; Original coding, M.J.; Supervision, M.R.L. andM.J.; Visualization, S.H.; Writing—original draft, S.H.; Writing—review and editing, M.R.L. and M.J. All authorshave read and agreed to the published version of the manuscript.

Nutrients 2020, 12, 1113 15 of 16
Funding: This research was supported by the Burroughs Welcome Fund Innovation in Regulatory Science Award(M.R.L.), and by funds from The Canadian Institutes of Health Research (CIHR), The Canadian Foundation forInnovation, and Statistics Canada. M.J. was funded by the CIHR Banting Postdoctoral Fellowship.
Conflicts of Interest: The authors declare no conflict of interest.
References
1. Global Burden of Disease. Causes of Death Collaborators. Global, regional, and national age-sex-specificmortality for 282 causes of death in 195 countries and territories, 1980–2017: A systematic analysis for theGlobal Burden of Disease Study 2017. Lancet 2018, 392, 1736–1788. [CrossRef]
2. World Health Organization. Noncommunicable Diseases. Available online: http://www.who.int/en/news-room/fact-sheets/detail/noncommunicable-diseases (accessed on 1 October 2019).
3. Global Burden of Disease. Causes of Death Collaborators. Global, regional, and national age-sex specificmortality for 264 causes of death, 1980–2016: A systematic analysis for the Global Burden of Disease Study2016. Lancet 2017, 390, 1151–1210. [CrossRef]
4. World Health Organization. Noncommunicable Diseases Progress Monitor. Available online: https://www.who.int/nmh/publications/ncd-progress-monitor-2017/en/ (accessed on 1 October 2019).
5. Health Canada (Ed.) The Development and Use of a Surveillance Tool: The Classification of Foods in the CanadianNutrient File According to Eating Well with Canada’s Food Guide; Health Canada: Ottawa, ON, Canada, 2014.
6. Jessri, M.; Nishi, S.K.; L’Abbe, M.R. Assessing the Nutritional Quality of Diets of Canadian Adults Using the2014 Health Canada Surveillance Tool Tier System. Nutrients 2015, 7, 10447–10468. [CrossRef] [PubMed]
7. Jessri, M.; Nishi, S.K.; L’Abbe, M.R. Assessing the nutritional quality of diets of Canadian children andadolescents using the 2014 Health Canada Surveillance Tool Tier System. BMC Public Health 2016, 16, 381.[CrossRef] [PubMed]
8. World Health Organization. Nutrient Profiling: A Report of Technical Meeting. Available online: https://www.who.int/nutrition/publications/profiling/WHO_IASO_report2010/en/ (accessed on 1 October 2019).
9. Health Canada. Canada’s Food Guide; Health Canada: Ottawa, ON, Canada, 2019.10. Statistics Canada. Canadian Community Health Survey-Nutrition (CCHS); Statistics Canada: Ottawa, ON,
Canada, 2017.11. Health Canada. Reference Guide to Understanding and Using the Data; Health Canada: Ottawa, ON, Canada,
2017; p. 107.12. Health Canada. Nutrient Data. Available online: www.canada.ca/en/health-canada/services/food-nutrition/
healthy-eating/nutrient-data.html (accessed on 1 October 2019).13. Health Canada. Revision process for Canada’s Food Guide; Health Canada: Ottawa, ON, Canada, 2016.14. Jessri, M.; Lou, W.Y.; L’Abbe, M.R. Evaluation of different methods to handle misreporting in obesity research:
Evidence from the Canadian national nutrition survey. Br. J. Nutr. 2016, 115, 147–159. [CrossRef] [PubMed]15. Garriguet, D. Accounting for misreporting when comparing energy intake across time in Canada. Health Rep.
2018, 29, 3–12. [PubMed]16. Garriguet, D. Under-reporting of energy intakein the Canadian Community Health Survey. Health Rep. 2008,
19, 37. [PubMed]17. McCrory, M.A.; Hajduk, C.L.; Roberts, S.B. Procedures for screening out inaccurate reports of dietary energy
intake. Public Health Nutr. 2002, 5, 873–882. [CrossRef] [PubMed]18. Goldberg, G.R.; Black, A.E.; Jebb, S.A.; Cole, T.J.; Murgatroyd, P.R.; Coward, W.A.; Prentice, A.M.
Critical evaluation of energy intake data using fundamental principles of energy physiology: 1. Derivationof cut-off limits to identify under-recording. Eur. J. Clin. Nutr. 1991, 45, 569–581. [PubMed]
19. National Academy Press. Institute of Medicine. Dietary Reference Intakes for Energy, Carbohydrate, Fiber, Fat,Fatty Acids, Cholesterol, Protein and Amino Acids; National Academy Press: Washington, DC, USA, 2002.
20. Health Canada. Sodium Reduction in Processed Foods in Canada: An Evaluation of Progress toward VoluntaryTargets from 2012 to 2016; Health Canada: Ottawa, ON, Canada, 2018.
21. Canadian Food Inspection Agency. Nutrition Labelling; Canadian Food Inspection Agency: Ottawa, ON,Canada, 2019.
22. World Health Organization. Noncommunicable Diseases and Their Risk Factors; World Health Organization:Geneva, Switzerland, 2018.
Nutrients 2020, 12, 1113 16 of 16
23. Poon, T.; Labonte, M.E.; Mulligan, C.; Ahmed, M.; Dickinson, K.M.; L’Abbe, M.R. Comparison of nutrientprofiling models for assessing the nutritional quality of foods: A validation study. Br. J. Nutr. 2018, 120,567–582. [CrossRef] [PubMed]
24. Julia, C.; Hercberg, S. Nutri-Score: Evidence of the effectiveness of the French front-of-pack nutrition label.Sci. Res. 2017, 64, 181–187. [CrossRef]
25. Public Health England. UK Nutrient Profiling Model 2018 Review. Available online: https://www.gov.uk/government/consultations/consultation-on-the-uk-nutrient-profiling-model-2018-review (accessed on1 October 2019).
26. Reyes, M.; Garmendia, M.L.; Olivares, S.; Aqueveque, C.; Zacarias, I.; Corvalan, C. Development of theChilean front-of-package food warning label. BMC Public Health 2019, 19, 906. [CrossRef] [PubMed]
27. National Health and Medical Research Council. About the Australian Dietary Guidelines. Available online:https://www.eatforhealth.gov.au/guidelines/about-australian-dietary-guidelines (accessed on 1 October 2019).
28. Ministry of Brazil. Dietary Guidelines for the Brazilian Population; Ministry of Brazil: Brasilia, Brazil, 2014.29. Office of Disease Prevention and Health Promotion. Food and Nutrition; Office of Disease Prevention and
Health Promotion: Rockville, MD, USA, 2015.30. Nishi, S.K.; Jessri, M.; L’Abbe, M. Assessing the Dietary Habits of Canadians by Eating Location and Occasion:
Findings from the Canadian Community Health Survey, Cycle 2.2. Nutrients 2018, 10, 682. [CrossRef][PubMed]
31. Jessri, M.; Wolfinger, R.D.; Lou, W.Y.; L’Abbe, M.R. Identification of dietary patterns associated with obesityin a nationally representative survey of Canadian adults: Application of a priori, hybrid, and simplifieddietary pattern techniques. Am. J. Clin. Nutr. 2017, 105, 669–684. [CrossRef] [PubMed]
32. Jessri, M.; Ng, A.P.; L’Abbe, M.R. Adapting the Healthy Eating Index 2010 for the Canadian Population:Evidence from the Canadian National Nutrition Survey. Nutrients 2017, 9, 910. [CrossRef] [PubMed]
33. Jessri, M.; Lou, W.Y.; L’Abbe, M.R. The 2015 Dietary Guidelines for Americans is associated with a morenutrient-dense diet and a lower risk of obesity. Am. J. Clin. Nutr. 2016, 104, 1378–1392. [CrossRef] [PubMed]
34. Jessri, M.; L’Abbe, A.M. The time for an updated Canada Food Guide has arrived. Appl. Physiol. Nutr. Metab.2015, 40, 854–857. [CrossRef] [PubMed]
© 2020 by the authors. Licensee MDPI, Basel, Switzerland. This article is an open accessarticle distributed under the terms and conditions of the Creative Commons Attribution(CC BY) license (http://creativecommons.org/licenses/by/4.0/).