health and economic outcomes of hpv vaccination in latin...
TRANSCRIPT

SUMMARY 2: HPV Vaccination
Page 1 of 72
SUMMARY 2
Global Cervical Cancer Prevention
HPV Vaccination of Pre-Adolescent Girls Analyses
Summary of Prior Work
Sue J. Goldie1, Steven Sweet1
Affiliations: 1 Center for Health Decision Science, Harvard School of Public Health, Harvard University, Boston, Massachusetts, USA. Corresponding author: [email protected] Submitted: November 26, 2013 This summary document provides an overview of the projected impact and cost-effectiveness of HPV adolescent vaccination. Several prior publications listed in the reference section provide greater detail. However, since we provided extracted estimates for the Lancet Commission on Investing in Health we provide this summary as brief documentation for the model used to assess benefits in 72 GAVI-eligible countries and 33 Latin American and Caribbean countries.
SUMMARY 2: HPV Vaccination
Page 2 of 72
TABLE OF CONTENTS
I. Population-based companion model: data and assumptions
II. Comparative validation: companion model and stochastic models
III. Scale-up scenarios
IV. Results GAVI-Eligible Countries
V. References
VI. Appendix: Vaccine Costs
I. POPULATION-BASED COMPANION MODEL
Overview
The companion population-based model is a flexible tool that has been developed to reflect the main
features of HPV vaccines, and to project the potential impact (health and economic consequences) of
HPV vaccination at the population level in settings where data are very limited. The model is
constructed as a static cohort simulation model based on a structure similar to a simple decision tree,
and is programmed using Microsoft® Excel and Visual Basic for Applications, 6.3 (Microsoft Corporation,
Redmond, WA). The model tracks a cohort of girls at a target age (e.g., 9 years) through their lifetimes,
comparing health and cost outcomes with and without HPV vaccination programs. Unlike our more
complex empirically-calibrated micro-simulation models (Goldie 2007, Kim 2007a, Diaz 2008, Kim 2008,
Diaz 2010, Sharma 2011, Campos 2011), the companion model does not fully simulate the natural
history of HPV infection and cervical carcinogenesis. Instead, based on simplifying assumptions (i.e.,

SUMMARY 2: HPV Vaccination
Page 3 of 72
duration and stage distribution of, and mortality from, cervical cancer), which rely on insights from
analyses performed with the micro-simulation model, and using the best available data on local age-
specific incidence of cervical cancer and HPV 16,18 type distribution, and assumed vaccine efficacy and
coverage, the model estimates reduction in cervical cancer risk at different ages. By applying this
reduction to country-specific, age-structured population prospects incorporating background mortality
(UN 2009), the model calculates averted cervical cancer cases and deaths, and transforms them into
aggregated population health outcomes, years of life saved (YLS) and disability-adjusted life years
(DALYs) averted. DALYs are calculated using the standard approach by the Global Burden of Disease
(GBD) study (Murray 1996) although they are not age-weighted. The model also combines vaccination
program costs and direct medical treatment costs associated with cervical cancer over the course of
the simulation, and generates short-term financial costs, long-term economic outcomes (e.g., lifetime
costs), and incremental costs (expressed in 2005 international dollars) per DALY averted.
SUMMARY 2: HPV Vaccination
Page 4 of 72
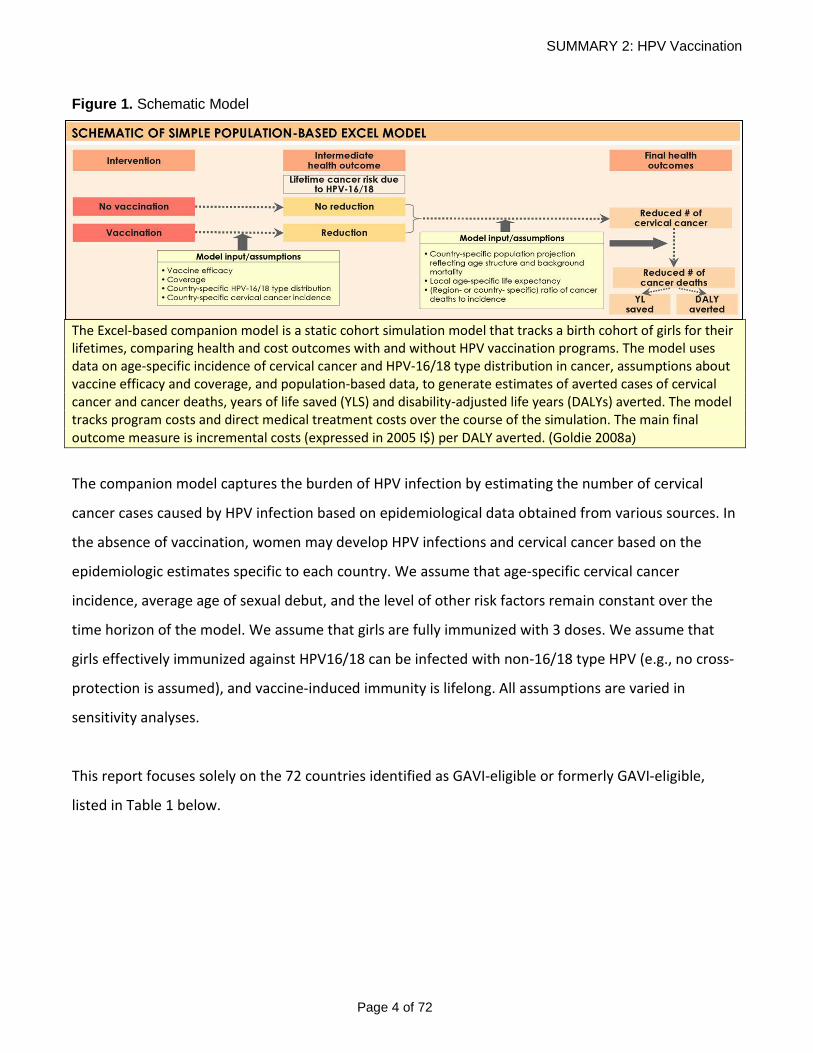
Figure 1. Schematic Model
The Excel-based companion model is a static cohort simulation model that tracks a birth cohort of girls for their lifetimes, comparing health and cost outcomes with and without HPV vaccination programs. The model uses data on age-specific incidence of cervical cancer and HPV-16/18 type distribution in cancer, assumptions about vaccine efficacy and coverage, and population-based data, to generate estimates of averted cases of cervical cancer and cancer deaths, years of life saved (YLS) and disability-adjusted life years (DALYs) averted. The model tracks program costs and direct medical treatment costs over the course of the simulation. The main final outcome measure is incremental costs (expressed in 2005 I$) per DALY averted. (Goldie 2008a)
The companion model captures the burden of HPV infection by estimating the number of cervical
cancer cases caused by HPV infection based on epidemiological data obtained from various sources. In
the absence of vaccination, women may develop HPV infections and cervical cancer based on the
epidemiologic estimates specific to each country. We assume that age-specific cervical cancer
incidence, average age of sexual debut, and the level of other risk factors remain constant over the
time horizon of the model. We assume that girls are fully immunized with 3 doses. We assume that
girls effectively immunized against HPV16/18 can be infected with non-16/18 type HPV (e.g., no cross-
protection is assumed), and vaccine-induced immunity is lifelong. All assumptions are varied in
sensitivity analyses.
This report focuses solely on the 72 countries identified as GAVI-eligible or formerly GAVI-eligible,
listed in Table 1 below.

SUMMARY 2: HPV Vaccination
Page 5 of 72
Table 1. Categorization of GAVI countries in current Excel model
Country GAVI-eligibility Cancer Incidence (Globocan 2008)
WHO GBD Region
Economic classification (World Bank)
Afghanistan GAVI 6.6 EMR D Low income Angola (formerly) GAVI 30 AFR D Lower middle income Armenia (formerly) GAVI 17.3 EUR B Lower middle income Azerbaijan (formerly) GAVI 10 EUR B Upper middle income Bangladesh GAVI 29.8 SEAR D Low income Benin GAVI 35 AFR D Low income Bhutan (formerly) GAVI 20.4 SEAR D Lower middle income Bolivia (formerly) GAVI 36.4 AMR D Lower middle income Burkina Faso GAVI 28.6 AFR D Low income Burundi GAVI 49.1 AFR E Low income Cambodia GAVI 27.4 WPR B Low income Cameroon GAVI 24 AFR D Lower middle income Central African Republic GAVI 19.4 AFR E Low income Chad GAVI 19.9 AFR D Low income Comoros GAVI 51.7 AFR D Low income Congo, Democratic Republic GAVI 21.3 AFR E Low income Congo, Republic of (Brazzaville) (formerly) GAVI 27.2 AFR E Lower middle income Cote d'Ivoire GAVI 26.9 AFR E Lower middle income Cuba (formerly) GAVI 23.1 AMR A Upper middle income Djibouti GAVI 12.7 EMR D Lower middle income Eritrea GAVI 12.9 AFR E Low income Ethiopia GAVI 18.8 AFR E Low income Georgia (formerly) GAVI 9.4 EUR B Lower middle income Ghana GAVI 39.5 AFR D Lower middle income Guinea GAVI 56.3 AFR D Low income Guinea-Bissau GAVI 35.1 AFR D Low income Guyana GAVI 44.7 AMR B Lower middle income Haiti GAVI 16 AMR D Low income

SUMMARY 2: HPV Vaccination
Page 6 of 72
Table 1. Categorization of GAVI countries in current Excel model (cont.)
Country GAVI-eligibility Cancer Incidence (Globocan 2008)
WHO GBD Region
Economic classification (World Bank)
Honduras (formerly) GAVI 37.8 AMR B Lower middle income India GAVI 27 SEAR D Lower middle income Indonesia (formerly) GAVI 12.7 SEAR B Lower middle income Kenya GAVI 23.4 AFR E Low income Kiribati (formerly) GAVI 9.5 (Micronesia) WPR B Lower middle income Korea, Democratic Republic GAVI 6.6 SEAR Low income Kyrgyzstan GAVI 26.5 EUR B Low income Lao People Democratic Republic GAVI 22.1 WPR B Lower middle income Lesotho GAVI 35 AFR E Lower middle income Liberia GAVI 41.8 AFR D Low income Madagascar GAVI 27.2 AFR D Low income Malawi GAVI 50.8 AFR E Low income Mali GAVI 37.7 AFR D Low income Mauritania GAVI 35.1 AFR D Lower middle income Moldova (formerly) GAVI 17.1 EUR C Lower middle income Mongolia (formerly) GAVI 28.4 WPR B Lower middle income Mozambique GAVI 50.6 AFR E Low income Myanmar GAVI 26.4 SEAR D Low income Nepal GAVI 32.4 SEAR D Low income Nicaragua GAVI 39.9 AMR D Lower middle income Niger GAVI 15.6 AFR D Low income Nigeria GAVI 33 AFR D Lower middle income Pakistan GAVI 19.5 EMR D Lower middle income Papua New Guinea GAVI 23.2 WPR B Lower middle income Rwanda GAVI 34.5 AFR E Low income Sao Thome and Principe GAVI 23.0 (Middle Africa) AFR D Lower middle income

SUMMARY 2: HPV Vaccination
Page 7 of 72
Table 1. Categorization of GAVI countries in current Excel model (cont.)
Country GAVI-eligibility Cancer Incidence (Globocan 2008)
WHO GBD Region
Economic classification (World Bank)
Senegal GAVI 34.7 AFR D Lower middle income Sierra Leone GAVI 41.9 AFR D Low income Solomon Islands GAVI 17.6 WPR B Lower middle income Somalia GAVI 20.3 EMR D Low income Sri Lanka (formerly) GAVI 11.8 SEAR B Lower middle income Sudan GAVI 7 EMR D Lower middle income Tajikistan GAVI 8.7 EUR B Low income Tanzania GAVI 50.9 AFR E Low income The Gambia GAVI 32.4 AFR D Low income Timor Leste (formerly) GAVI 11.4 SEAR B Lower middle income Togo GAVI 30 AFR D Low income Uganda GAVI 47.5 AFR E Low income Ukraine (formerly) GAVI 16.1 EUR C Lower middle income Uzbekistan GAVI 10.8 EUR B Lower middle income Viet Nam GAVI 11.5 WPR B Lower middle income Yemen GAVI 3 EMR D Lower middle income Zambia GAVI 52.8 AFR E Lower middle income Zimbabwe GAVI 47.4 AFR E Low income

SUMMARY 2: HPV Vaccination
Page 8 of 72
SELECTED ASSUMPTIONS FOR THE BASE CASE
Assumptions include: 1) the average mean duration of time between detection of invasive cancer and
death is 4-6 years for GAVI-eligible countries – with no effective cervical cancer screening (varied from
2–10 years in Goldie 2008a, 2008c); 2) ratio of mortality to incidence approximates 80% for GAVI-
eligible countries (range 50%–90%, in Goldie 2008c); and (3) in the absence of screening programs we
assume that asymptomatic local noninvasive cancer would not be detected, and thus, cancers detected
on the basis of symptoms are all at regional and distant stages – this assumption is restricted to GAVI-
eligible countries and countries with no population screening (of note, in analyses in which we included
non-GAVI eligible and GAVI-eligible countries, published elsewhere, different assumptions are used for
countries as they drastically differ in screening services, health services capacity and socioeconomic
profile – e.g., this necessitates different assumptions for Haiti and Argentina in terms of cancer stage at
detection). Please note that these assumptions were informed by the stochastic micro-simulation
model which explicitly models the natural history of HPV and cervical carcinogenesis, stage progression
conditional on several variables, etc. As we have explained in detail elsewhere, and in separate
documents, we used this more detailed model to ensure the simplifying assumptions of the “average”
at the population level used in the excel model are reasonable. Assessment of concordance and
validity between models, when restricted to the straightforward question of vaccine benefit
projections, showed close alignment. We include a sample of these results later in this document.
Alternatives to these assumptions were examined in sensitivity analysis.
Input Requirement Assumptions Variability Average age of HPV death by country Country-specific Model output Average age onset of vaccine preventable cancer case Country-specific Model output Number of preventable cancer cases (by country & year) Country-specific Model output Number of averted HPV deaths (by country and year) Country-specific Model output

SUMMARY 2: HPV Vaccination
Page 9 of 72
DALY Assumptions
DALY (Disability-Adjusted Life Years)
Baseline Parameters Used in Analyses Estimating Vaccine
Benefits
Baseline Parameters Used in Analyses Estimating Vaccine
Costs Relative to Benefits Discount rate, r 0 0.03 Age weight modulating factor, K 0 0 Constant, C 0.1658 0.1658 Age weight parameter, beta 0.04 0.04 r+beta 0.07 0.07 Duration of disability, L 6 6 Disability weight, D 0.075 0.075
Vaccination strategies assume three doses are required, and are distinguished by age of vaccination,
coverage level (defined as completion of a three-dose course) and vaccine efficacy. The base case
assumes 70% coverage at 100% efficacy to estimate the potential avertable burden without making
assumptions about the differential operational capacity to deliver the vaccine. Alternative coverage
rates are evaluated in sensitivity analyses. The model may be run as a single cohort for one-time
vaccination of a group of girls (e.g., 12-year-old girls in 2011), or for multiple cohorts (e.g., 9-year-olds
girls each year for 10 years). As the age of vaccination is a user-defined input, the model may also
consider catch-up vaccination of older girls. The model’s “base year” is the year in which the program
is initiated or the implementation decision is made (e.g., 2011 would be present time); all future costs
and benefits are discounted to this year. The “intervention year” cannot be earlier than the base year.
We assume vaccination is prior to sexual debut and in the past have used 9-12 years of age. The age is
user-defined and the model can accommodate any age. Of note, there is very little difference from
analyses that vaccinate 10, 11 and 12 year old girls given our simplifying assumptions. While this may
seem counter-intuitive, the reasons are as follows: (1) we assume sexual debut is older than age 12
and thus vaccine efficacy does not differ based on prior exposure to HPV 16 and 18 in these cohorts; (2)
the population size change between 10, 11 and 12 is not nearly as substantial and influential as the
year to year difference in the first years of life. The “real-world” difference in age groups between 9
and 12 (e.g., vaccinating at age 10 versus 11 versus 12) is the obtainable coverage in each country
based on local circumstances – for example, coverage can vary depending on programmatic strategy

SUMMARY 2: HPV Vaccination
Page 10 of 72
for vaccinating girls, location of primary services, whether school-based vaccination is employed, etc.)
Since in this analysis, coverage is “imposed” by the analyst, the differences between vaccinating 10 and
11 are small. All that being said, the model can accommodate any age specified by the user.
Proportion of cervical cancer cases attributable to HPV 16,18
We used estimates of the proportion of HPV 16,18 in women with cervical cancer from a large
retrospective, cross-sectional study of HPV genotypes among patients with invasive cervical cancer
during 1949-2009 (de Sanjose 2010; personal communication M. Diaz). More than 10,000 cases of
invasive cervical cancer were included and a common protocol was used for collection of specimens,
histological confirmation and classification, and HPV testing was centralized in two laboratories with
common protocols and parameters for quality control. Highly sensitive assays were used for HPV
detection, therefore, it was not necessary to correct for multiple types.
We ran sensitivity analyses on these estimates, assuming a flat rate of 70% of cancers attributable to
HPV 16 and 18, as well as utilizing country-specific estimates as opposed to regional estimates. In
general, the country-specific estimates may be considered less reliable than the regional estimates due
to limited sample size, variation in sensitivity of assays used to detect HPV DNA, and variation in the
defined population being considered (e.g., all women with cancer versus all women with HPV-positive
cancer). Finally, some “country-specific” estimates were derived from regional estimates when
country-specific data were unavailable.
For analyses conducted with the Excel-based model, screening is not considered. We have conducted
analyses using our microsimulation model that incorporate both screening and vaccination in
approximately 24 countries to date, and have documented and distributed those findings widely.
Publication list and results available on request.
Of note, to conduct a cost-effectiveness analysis in poor countries and assume the cost of treatment is
zero (based on the fact it is not available to all women) is not appropriate from an ethical and equity
perspective, because it imposes a double jeopardy (i.e., if a cervical cancer death is associated with

SUMMARY 2: HPV Vaccination
Page 11 of 72
zero costs, it will always be more cost-effective to not prevent and treat disease – an unacceptable
assumption – global equity mandates inclusion of consequences of disease- expressed in health and
economic metrics - albeit adjusted to reflect country-specific valuation and currency). The cost
estimates assume that while some treatment for cervical cancer is available, treatment for CIN1 or
CIN2/3 is not available. Costs for cervical cancer treatment represent an average treatment cost per
case (e.g., an average number of visits for treatment of cervical cancer) and are assumed to be realized
at around median survival time after cancer onset. In the base case, every cancer case is assumed to
incur cancer treatment costs although limited access to care may also be considered.
Cost-effectiveness analyses assume a modified societal perspective (meaning that direct non-medical
costs are not considered in the ratio), although the model may consider alternative perspectives (e.g.,
health care provider, payor). Future costs and health outcomes (years of life) are discounted by 3%
annually (DCPP, WHO CHOICE, Drummond 2005, Gold 1996), although the discount rate may be
adjusted by the user. The model allows for one-way and multi-way (deterministic) sensitivity analyses
of key variables (e.g., year of intervention, age at vaccination, coverage, program cost for 3 doses of
vaccine, etc.).
DATA AND SOURCES
Demographic Data
Demographic estimates for age-specific population size (in 1-year intervals) and age-specific life
expectancy (in five-year intervals) were from United Nations World Population Prospects 2010 data
(UN 2011) and 2009 World Health Organization (WHO) life tables (WHO Life Tables), respectively. In
years when no data were available (e.g., years 2051-2100) we used a growth factor calculated as a
function of a country’s population in 2049 and 2050. Because population estimates extend to 2110, the
model can vaccinate 9-year-olds only through year 2029. Exceptions to the use of these data included
three countries, Antigua and Barbuda, Dominica, and St. Kitts and Nevis, for which United Nations
World Population Prospects 2010 data were not available; instead the latest estimates available were
used (UN 2005). Similarly, estimates were not available for Kosovo, Marshall Islands, Seychelles and

SUMMARY 2: HPV Vaccination
Page 12 of 72
Tuvalu, in which case, we distributed total population by age structure evenly among all ages within a
band, and applied the growth rate to project for future years (World Facts).
Cancer Incidence (Globocan 2008)
While previous versions of the model utilized a hierarchical ranking of cervical cancer incidence data
(e.g., country-specific incidence rates from Cancer Incidence in Five Continents (CI5C) (volumes 1-9)
(Parkin 2005, Curado 2007); estimates from Cancer Incidence in Africa (Parkin 2003) (where applicable);
or estimates from Globocan 2008 (Ferlay 2010)), for this version of the model we elected to use one
source (Globocan 2008) for all countries. This decision reflects that fact that, according to the
International Agency for Research on Cancer, (1) incidence data derive from population-based cancer
registries, the most important source being Cancer Incidence in Five Continents (Parkin 2005, Curado
2007); (2) population-based cancer registries may cover entire national populations but more often
cover smaller, subnational areas, and, particularly in developing countries, only major cities; (3)
Globocan 2008 prioritizes incidence data in the following manner: national incidence data; local
incidence data and national mortality data with regional models built in the absence of (or low quality)
country-specific national or local incidence data; local incidence data and no mortality data; frequency
data; and no data, in which case Globocan 2008 presents the country-specific rates of neighboring
countries in the same region.
The Globocan 2008 database presents estimates of cancer incidence and mortality by age group, sex,
cancer, and country for the year 2008. It should be emphasized that:
• Incidence data are generally associated with some delay as they require time to be compiled
and published, but recent information can often be found in routine reports from the registries
themselves, commonly available via their websites.
• While the quality of information from most of the developing countries might not be of
sufficient quality, this information is still of unique importance as it often remains the only
relatively unbiaised source of information available on the profile of cancer.

SUMMARY 2: HPV Vaccination
Page 13 of 72
• Population-based cancer registries can also produce survival statistics by following up their vital
status of cancer patients. Survival probabilities can be used to estimate mortality from
incidence in the absence of mortality data.
• Mortality statistics are collected and made available by the WHO. While not all datasets are of
the same quality, their advantages are national coverage and long-term availability. For some
countries, coverage of the population is incomplete, so that the mortality rates produced are
implausibly low, and in others, the quality of cause of death information is poor. While almost
all the European and American countries have comprehensive death registration systems, most
African and Asian countries (including the populous countries of Nigeria, India and Indonesia)
do not. The Globocan 2008 estimates utilize the provisional estimates of the age- and sex-
specific deaths from cancer (of all types) for 2008 in each country of the world.
• National population estimates for 2008 were extracted from the United Nation (UN) population
division, the 2008 revision (UN 2009). These estimates may differ slightly (especially for older
age groups) from those prepared by national authorities
• The ASR is calculated using 5 age-groups 0-14, 15-44, 45-54, 55-64, 65+. The result may be
slightly different from that computed using the same data categorized using traditional 5-year
age bands.
Instead of using constant rates for age groups 15- to 39-year-olds, as in previous versions of the model,
we calculated a linear regression. Therefore, rates from 10- to 14-year-olds to 35- to 39-year-olds are
increasing. We assumed the rate reported for the age group 0- to 14-year-olds represented only the
group of 10- to 14-year-olds, with zero cases for 0- to 4-year-olds and 5- to 9-year-olds.

SUMMARY 2: HPV Vaccination
Page 14 of 72
Table 2. Summary of model inputs of age-specific cervical cancer incidence for the companion model. Globocan 2008 (Ferlay 2010)
Country 0-4 5-9 10-14 15-19 20-24 25-29 30-34 35-39 40-44 45-49 50-54 55-59 60-64 65-69 70-74 75-79 80-84 85-99
Afghanistan 0.0 0.0 0.0 0.4 0.9 1.3 1.8 2.2 9.3 19.7 23.3 21.7 20.6 14.0 17.6 22.3 22.3 22.3 Albania 0.0 0.0 0.0 4.5 6.6 8.7 10.8 12.9 15.0 18.0 19.4 21.4 20.1 17.0 11.5 3.0 3.0 3.0 Angola 0.0 0.0 0.3 1.8 3.3 4.8 6.3 7.8 54.1 62.8 84.1 109.3 116.5 106.1 115.0 63.3 63.30 63.30 Armenia 0.0 0.0 0.0 1.3 2.7 4.0 5.4 6.7 29.8 56.7 53.1 23.3 47.5 50.6 98.9 30.9 30.88 30.88 Azerbaijan 0.0 0.0 0.0 0.7 1.4 2.0 2.7 3.4 14.0 20.4 37.2 28.7 46.6 20.5 35.5 24.0 23.96 23.96 Bangladesh 0.0 0.0 0.0 1.4 2.9 4.3 5.8 7.2 54.4 79.5 100.4 104.8 84.5 122.4 91.8 51.2 51.15 51.15 Benin 0.0 0.0 0.0 1.7 3.5 5.2 7.0 8.7 53.7 102.4 92.3 122.4 130.6 120.1 132.7 70.5 70.48 70.48 Bhutan 0.0 0.0 0.0 1.4 2.8 4.1 5.5 6.9 37.7 60.2 67.7 67.4 70.9 50.1 42.2 36.3 36.28 36.28 Bolivia 0.0 0.0 0.0 3.4 6.8 10.2 13.6 17.0 73.2 106.2 91.0 97.6 78.5 90.0 128.3 122.7 122.73 122.73 Bosnia & Herzegovina 0.0 0.0 0.0 5.9 8.7 11.6 14.4 17.3 20.1 23.8 23.2 24.7 23.5 20.4 17.6 14.4 14.4 14.4 Burkina Faso 0.0 0.0 0.2 2.0 3.8 5.7 7.5 9.3 58.4 84.4 82.3 112.3 89.4 51.6 108.7 33.0 33.04 33.04 Burundi 0.0 0.0 0.3 2.8 5.3 7.7 10.2 12.7 90.8 107.7 153.7 162.4 216.5 143.6 179.7 83.1 83.07 83.07 Cambodia 0.0 0.0 0.0 1.2 2.5 3.7 5.0 6.2 52.1 63.1 84.8 103.4 73.8 92.6 114.0 89.3 89.26 89.26 Cameroon 0.0 0.0 1.0 2.2 3.4 4.6 5.8 7.0 37.7 59.8 77.2 99.7 78.6 62.0 53.2 64.9 64.87 64.87 Cape Verde 0.0 0.0 0.0 2.2 4.4 6.7 8.9 11.1 62.4 90.7 94.4 111.1 134.2 111.3 129.1 59.3 59.30 59.30 Central African Rep. 0.0 0.0 0.3 1.1 2.0 2.8 3.7 4.5 25.1 48.1 63.7 87.4 66.6 53.3 55.5 57.7 57.71 57.71 Chad 0.0 0.0 0.3 1.1 1.9 2.7 3.5 4.3 28.4 55.3 57.7 73.8 73.3 69.5 62.4 53.0 53.03 53.03 China 0.0 0.0 0.1 1.6 3.2 4.7 6.3 7.8 27.5 18.9 23.6 25.2 17.2 14.3 13.3 15.9 15.90 15.90 Comoros 0.0 0.0 0.0 3.4 6.8 10.3 13.7 17.1 94.2 105.1 148.2 143.1 225.9 178.7 184.3 111.1 111.08 111.08 Congo, Dem Rep 0.0 0.0 0.7 1.7 2.7 3.8 4.8 5.8 32.1 53.9 69.4 91.0 71.6 55.4 48.1 57.1 57.1 57.1 Congo, Republic of 0.0 0.0 0.0 1.1 2.1 3.2 4.2 5.3 31.7 74.0 93.6 130.6 103.5 72.3 65.8 68.2 68.2 68.2 Cote d'Ivoire 0.0 0.0 0.0 0.8 1.6 2.5 3.3 4.1 30.3 48.5 56.5 102.1 154.9 109.9 167.0 47.2 47.20 47.20 Cuba 0.0 0.0 0.0 5.0 9.9 14.9 19.8 24.8 33.5 42.7 46.7 48.7 43.6 54.1 48.4 36.5 36.5 36.5 Djibouti 0.0 0.0 0.0 0.7 1.3 2.0 2.6 3.3 18.6 22.8 35.6 43.8 43.4 45.6 69.6 49.5 49.48 49.48 Egypt 0.0 0.0 0.1 0.2 0.2 0.3 0.3 0.4 3.3 2.0 5.0 3.1 8.3 6.5 4.4 5.4 5.40 5.40 El Salvador 0.0 0.0 0.0 5.3 10.6 16.0 21.3 26.6 73.8 89.5 89.2 77.8 80.2 97.0 92.4 101.0 100.99 100.99 Eritrea 0.0 0.0 0.4 1.0 1.6 2.3 2.9 3.5 18.1 20.9 33.6 43.6 47.0 42.9 70.2 56.5 56.47 56.47 Ethiopia 0.0 0.0 0.9 1.8 2.7 3.7 4.6 5.5 29.9 31.7 47.3 57.2 74.3 61.2 92.0 73.5 73.50 73.50 Fiji 0.0 0.0 0.0 10.3 22.3 34.3 46.2 58.2 70.2 78.6 96.8 66.5 128.6 84.3 95.3 80.2 80.2 80.2 Georgia 0.0 0.0 0.0 0.9 1.9 2.8 3.8 4.7 18.6 25.7 25.6 28.9 17.2 26.8 28.0 28.1 28.13 28.13 Ghana 0.0 0.0 0.1 2.3 4.4 6.6 8.7 10.9 63.6 116.1 104.6 146.6 134.9 117.3 155.5 77.3 77.27 77.27 Guatemala 0.0 0.0 0.0 3.6 7.2 10.8 14.4 18.0 65.4 85.8 81.8 78.2 56.7 71.1 66.4 90.4 90.37 90.37 Guinea 0.0 0.0 0.0 3.3 6.6 9.8 13.1 16.4 90.6 156.4 143.5 202.9 194.8 172.3 246.8 111.7 111.7 111.7 Guinea-Bissau 0.0 0.0 0.0 2.4 4.9 7.3 9.8 12.2 59.3 92.5 90.8 108.6 136.4 102.6 132.3 68.7 68.7 68.7

SUMMARY 2: HPV Vaccination
Page 15 of 72
Table 2. Summary of model inputs of age-specific cervical cancer incidence (cont.) Globocan 2008 (Ferlay 2010) Country 0-4 5-9 10-14 15-19 20-24 25-29 30-34 35-39 40-44 45-49 50-54 55-59 60-64 65-69 70-74 75-79 80-84 85-99
Guyana 0.0 0.0 0.0 3.8 7.5 11.3 15.0 18.8 65.5 114.8 126.2 181.9 96.2 129.1 159.6 120.3 120.35 120.35 Haiti 0.0 0.0 0.0 0.6 1.2 1.7 2.3 2.9 8.9 36.0 22.7 32.9 66.8 0.0 131.0 226.7 226.72 226.72 Honduras 0.0 0.0 0.0 4.0 8.0 12.1 16.1 20.1 69.6 96.4 91.7 106.8 91.2 118.6 105.2 111.9 111.85 111.85 India 0.0 0.0 0.0 2.2 4.3 6.5 8.6 10.8 48.6 64.1 77.9 88.0 91.5 85.5 66.6 60.2 60.2 60.2 Indonesia 0.0 0.0 0.0 0.9 1.9 2.8 3.8 4.7 22.7 28.4 34.4 36.9 49.6 42.3 37.6 32.8 32.75 32.75 Iraq 0.0 0.0 0.0 0.3 0.6 1.0 1.3 1.6 6.0 6.4 7.7 9.9 8.3 9.5 8.9 8.1 8.10 8.10 Kenya 0.0 0.0 0.0 1.2 2.4 3.5 4.7 5.9 47.0 37.6 61.5 66.2 136.1 49.8 116.8 55.6 55.6 55.6 Kiribati 0.0 0.0 0.0 1.1 2.3 3.4 4.6 5.7 16.7 20.3 40.2 0.0 0.0 42.3 51.5 41.3 41.3 41.3 Korea, Dem Rep 0.0 0.0 0.0 1.0 2.1 3.1 4.2 5.2 20.2 18.2 16.8 12.9 8.2 8.8 11.0 11.9 11.91 11.91 Kosovo 0.0 0.0 0.0 5.7 7.9 10.1 12.3 14.5 16.7 20.3 40.2 40.9 41.6 42.3 51.5 41.3 41.3 41.3 Kyrgyzstan 0.0 0.0 0.0 2.0 4.1 6.1 8.2 10.2 39.5 73.6 58.7 45.6 54.6 47.5 50.5 74.0 74.0 74.0 Lao People Dem Rep 0.0 0.0 0.0 1.7 3.4 5.0 6.7 8.4 56.7 57.0 61.0 70.2 64.0 58.6 60.5 40.5 40.46 40.46 Lesotho 0.0 0.0 0.0 2.4 4.9 7.3 9.8 12.2 68.4 84.7 100.2 82.3 142.5 98.2 98.9 116.9 116.93 116.93 Liberia 0.0 0.0 0.0 2.0 4.1 6.1 8.2 10.2 60.6 102.4 100.6 152.2 175.5 142.3 208.5 81.5 81.46 81.46 Madagascar 0.0 0.0 0.1 1.7 3.3 4.8 6.4 8.0 48.8 58.5 74.0 76.5 96.3 104.7 119.8 80.5 80.54 80.54 Malawi 0.0 0.0 0.0 4.8 9.7 14.5 19.4 24.2 112.3 99.7 166.5 136.9 237.5 94.1 112.1 36.2 36.2 36.2 Mali 0.0 0.0 0.0 3.4 6.9 10.3 13.8 17.2 86.5 105.5 91.6 89.7 135.4 113.5 109.4 30.1 30.1 30.1 Marshall Island 0.0 0.0 0.0 5.7 7.9 10.1 12.3 14.5 16.7 20.3 40.2 40.9 41.6 42.3 51.5 41.3 41.3 41.3 Mauritania 0.0 0.0 0.0 2.4 4.8 7.1 9.5 11.9 60.6 90.7 90.3 110.2 136.3 104.1 137.9 67.7 67.73 67.73 Micronesia 0.0 0.0 0.0 5.7 7.9 10.1 12.3 14.5 16.7 20.3 40.2 40.9 41.6 42.3 51.5 41.3 41.3 41.3 Moldova 0.0 0.0 0.0 2.5 5.0 7.5 10.0 12.5 41.5 46.5 46.9 42.8 36.2 26.9 21.2 24.3 24.31 24.31 Mongolia 0.0 0.0 0.0 2.2 4.3 6.5 8.6 10.8 76.0 88.5 80.7 78.0 81.6 68.3 49.2 52.3 52.30 52.30 Morocco 0.0 0.0 0.0 0.5 0.9 1.4 1.8 2.3 19.3 39.1 59.4 56.5 41.2 47.2 31.3 39.7 39.70 39.70 Mozambique 0.0 0.0 0.1 3.8 7.4 11.1 14.7 18.4 98.1 101.0 145.4 144.9 222.3 159.6 159.1 95.4 95.4 95.4 Myanmar 0.0 0.0 0.1 2.4 4.6 6.9 9.1 11.4 54.8 68.8 70.5 81.8 76.2 69.1 79.6 61.4 61.38 61.38 Nepal 0.0 0.0 0.0 1.9 3.8 5.7 7.6 9.5 75.2 84.3 104.0 102.9 107.6 109.3 81.3 39.8 39.79 39.79 Nicaragua 0.0 0.0 0.0 4.3 8.6 13.0 17.3 21.6 74.3 104.6 72.7 108.2 124.8 125.2 119.7 103.5 103.50 103.50 Niger 0.0 0.0 0.0 0.8 1.6 2.3 3.1 3.9 28.3 43.9 45.1 38.9 75.9 61.6 39.2 15.3 15.3 15.3 Nigeria 0.0 0.0 0.0 1.1 2.2 3.3 4.4 5.5 41.9 107.3 87.9 125.1 120.1 128.0 110.4 86.4 86.4 86.4 Pakistan 0.0 0.0 0.0 1.2 2.3 3.5 4.6 5.8 43.6 50.2 64.2 65.4 59.6 64.9 47.6 27.9 27.9 27.9 Palestinian Territory 0.0 0.0 0.0 5.7 7.9 10.1 12.3 14.5 16.7 20.3 40.2 40.9 41.6 42.3 51.5 41.3 41.3 41.3 Papua New Guinea 0.0 0.0 0.0 2.5 5.1 7.6 10.2 12.7 56.8 57.1 61.8 59.1 91.1 10.9 27.7 86.1 86.05 86.05 Paraguay 0.0 0.0 0.0 2.7 5.4 8.1 10.8 13.5 50.4 79.1 95.1 99.0 125.2 127.4 113.6 119.5 119.5 119.5 Philippines 0.0 0.0 0.0 6.2 13.2 20.2 27.1 34.1 41.1 24.6 39.9 40.9 16.0 16.0 19.4 17.6 17.6 17.6 Rwanda 0.0 0.0 0.0 1.6 3.2 4.7 6.3 7.9 68.7 74.0 119.7 146.1 148.3 108.3 61.5 35.6 35.61 35.61

SUMMARY 2: HPV Vaccination
Page 16 of 72
Table 2. Summary of model inputs of age-specific cervical cancer incidence (cont.) Globocan 2008 (Ferlay 2010) Country 0-4 5-9 10-14 15-19 20-24 25-29 30-34 35-39 40-44 45-49 50-54 55-59 60-64 65-69 70-74 75-79 80-84 85-99
Samoa 0.0 0.0 0.0 3.2 24.6 45.9 67.3 88.6 110.0 49.9 70.5 45.1 55.6 61.7 61.7 61.7 61.7 61.7 Sao Thome (Middle Africa) 0.0 0.0 0.6 1.7 2.8 3.9 5.0 6.1 35.9 56.9 72.6 94.8 79.9 65.1 60.1 59.9 59.9 59.9
Senegal 0.0 0.0 0.0 2.2 4.5 6.7 9.0 11.2 60.8 91.3 90.0 109.9 135.7 103.1 137.9 63.5 63.5 63.5 Sierra Leone 0.0 0.0 0.0 2.2 4.4 6.6 8.8 11.0 60.5 102.6 100.5 152.8 175.4 141.1 204.0 78.4 78.37 78.37 Solomon Islands 0.0 0.0 0.0 1.2 2.3 3.5 4.6 5.8 34.2 52.4 40.6 70.9 45.0 30.1 92.3 43.5 43.50 43.50 Somalia 0.0 0.0 0.7 1.8 2.9 4.0 5.1 6.2 35.1 33.8 51.8 60.0 91.4 58.1 99.1 66.5 66.49 66.49 Sri Lanka 0.0 0.0 0.0 0.3 0.7 1.0 1.4 1.7 13.6 24.7 38.6 38.5 46.9 62.7 45.1 37.5 37.5 37.5 Sudan 0.0 0.0 0.0 0.3 0.5 0.8 1.0 1.3 6.3 9.7 19.2 30.7 19.0 26.7 48.4 44.1 44.10 44.10 Swaziland 0.0 0.0 0.0 3.9 7.8 11.6 15.5 19.4 101.2 130.2 134.3 112.5 189.5 124.7 138.1 181.3 181.3 181.3 Syria 0.0 0.0 0.0 0.2 0.4 0.5 0.7 0.9 3.8 3.9 6.2 7.4 5.3 6.6 8.5 4.0 4.0 4.0 Tajikistan 0.0 0.0 0.0 0.6 1.2 1.8 2.4 3.0 12.6 30.9 36.1 30.1 24.7 11.8 17.7 16.1 16.08 16.08 Tanzania 0.0 0.0 0.4 3.0 5.5 8.1 10.6 13.2 88.9 104.2 153.6 148.9 222.1 183.1 201.6 111.4 111.43 111.43 The Gambia 0.0 0.0 0.0 3.8 7.6 11.5 15.3 19.1 83.1 71.2 101.3 91.1 93.8 7.9 91.4 80.6 80.6 80.6 Timor Leste (South-Eastern Asia) 0.0 0.0 0.0 1.3 2.6 3.8 5.1 6.4 34.7 36.8 46.2 50.2 49.5 42.5 43.2 36.5 36.5 36.5
Togo 0.0 0.0 0.0 1.0 2.0 2.9 3.9 4.9 36.1 78.2 72.1 114.1 137.0 119.3 139.0 66.0 65.96 65.96 Tonga 0.0 0.0 0.0 5.7 7.9 10.1 12.3 14.5 16.7 20.3 40.2 40.9 41.6 42.3 51.5 41.3 41.3 41.3 Turkmenistan 0.0 0.0 0.0 1.1 1.6 2.2 2.7 3.3 3.8 12.0 22.5 12.8 32.3 35.4 22.6 47.2 47.2 47.2 Tuvalu 0.0 0.0 0.0 5.7 7.9 10.1 12.3 14.5 16.7 20.3 40.2 40.9 41.6 42.3 51.5 41.3 41.3 41.3 Uganda 0.0 0.0 0.1 2.6 5.2 7.7 10.3 12.8 92.5 111.7 154.1 176.0 209.7 104.3 157.1 54.0 54.0 54.0 Ukraine 0.0 0.0 0.0 2.4 4.8 7.2 9.6 12.0 33.3 39.7 32.7 32.7 25.4 27.0 25.2 17.8 17.80 17.80 Uzbekistan 0.0 0.0 0.0 0.7 1.5 2.2 3.0 3.7 14.3 25.9 35.5 41.2 34.5 32.4 38.7 24.4 24.4 24.4 Vanuatu 0.0 0.0 0.0 8.5 13.5 18.4 23.4 28.3 33.3 62.5 84.6 106.6 135.4 164.3 193.1 193.1 193.1 193.1 Viet Nam 0.0 0.0 0.0 1.1 2.2 3.2 4.3 5.4 34.1 21.7 36.4 41.4 27.9 20.8 26.9 16.7 16.7 16.7 Yemen 0.0 0.0 0.0 0.1 0.2 0.2 0.3 0.4 2.9 4.8 7.3 9.6 7.6 28.1 13.4 12.8 12.82 12.82 Zambia 0.0 0.0 0.2 2.9 5.6 8.2 10.9 13.6 103.2 97.0 139.5 185.3 224.5 210.6 239.9 60.1 60.09 60.09 Zimbabwe 0.0 0.0 0.0 2.0 4.0 5.9 7.9 9.9 93.5 99.1 116.4 149.0 207.3 201.6 164.3 137.8 137.8 137.8

SUMMARY 2: HPV Vaccination
Page 17 of 72
Proportion of cervical cancer cases attributable to HPV 16,18
We used estimates of the proportion of HPV 16,18 in women with cervical cancer from a large
retrospective, cross-sectional study of HPV genotypes among patients with invasive cervical cancer
during 1949-2009 (de Sanjose 2010; personal communication M. Diaz). More than 10,000 cases of
invasive cervical cancer were included and a common protocol was used for collection of specimens,
histological confirmation and classification, and HPV testing was centralized in two laboratories with
common protocols and parameters for quality control. Highly sensitive assays were used for HPV
detection, therefore, it was not necessary to correct for multiple types.
We ran sensitivity analyses on these estimates, assuming a flat rate of 70% of cancers attributable to
HPV 16 and 18, as well as utilizing country-specific estimates as opposed to regional estimates. In
general, the country-specific estimates may be considered less reliable than the regional estimates due
to limited sample size, variation in sensitivity of assays used to detect HPV DNA, and variation in the
defined population being considered (e.g., all women with cancer versus all women with HPV-positive
cancer). Finally, some “country-specific” estimates were derived from regional estimates when
country-specific data were unavailable.

SUMMARY 2: HPV Vaccination
Page 18 of 72
Table 3. Proportion of HPV 16,18 in cervical cancer used as model parameter estimate
Country Regional estimate Region Flat estimate Country-specific estimate
Afghanistan 84% Asia, South 70% 73% Angola 71% Sub-Saharan Africa, Central 70% 49% Armenia 70% Asia, Central 70% 80% Azerbaijan 70% Asia, Central 70% 80% Bangladesh 84% Asia, South 70% 71% Benin 71% Sub-Saharan Africa, West 70% 67% Bhutan 84% Asia, South 70% 77% Bolivia 68% Latin America, Andean 70% 38% Burkina Faso 71% Sub-Saharan Africa, West 70% 58% Burundi 71% Sub-Saharan Africa, East 70% 76% Cambodia 60% Asia, Southeast 70% 64% Cameroon 71% Sub-Saharan Africa, West 70% 49% Central African Republic 71% Sub-Saharan Africa, Central 70% 49% Chad 71% Sub-Saharan Africa, West 70% 49% Comoros 71% Sub-Saharan Africa, East 70% 76% Congo, Democratic Republic 71% Sub-Saharan Africa, Central 70% 49% Congo, Rep of (Brazzaville) 71% Sub-Saharan Africa, Central 70% 49% Cote d'Ivoire 71% Sub-Saharan Africa, West 70% 58% Cuba 68% Caribbean 70% 64% Djibouti 71% Sub-Saharan Africa, East 70% 76% Eritrea 71% Sub-Saharan Africa, East 70% 76% Ethiopia 71% Sub-Saharan Africa, East 70% 86% Georgia 70% Asia, Central 70% 80% Ghana 71% Sub-Saharan Africa, West 70% 58% Guinea 71% Sub-Saharan Africa, West 70% 51% Guinea-Bissau 71% Sub-Saharan Africa, West 70% 58% Guyana 68% Caribbean 70% 62% Haiti 68% Caribbean 70% 61% Honduras 68% Latin America, Central 70% 58% India 84% Asia, South 70% 79% Indonesia 60% Asia, Southeast 70% 75%

SUMMARY 2: HPV Vaccination
Page 19 of 72
Table 3. Proportion of HPV 16,18 in cervical cancer used as model parameter estimate (cont.) Country Regional estimate Region Flat estimate Country-specific estimate
Kenya 71% Sub-Saharan Africa, East 70% 61% Kiribati 60% Oceania 70% 75% Korea, Democratic Republic 70% Asia, East 70% 72% Kyrgyzstan 70% Asia, Central 70% 77% Lao People Dem Rep 60% Asia, Southeast 70% 77% Lesotho 71% Sub-Saharan Africa, Southern 70% 62% Liberia 71% Sub-Saharan Africa, West 70% 58% Madagascar 71% Sub-Saharan Africa, East 70% 76% Malawi 71% Sub-Saharan Africa, East 70% 76% Mali 71% Sub-Saharan Africa, West 70% 53% Mauritania 71% Sub-Saharan Africa, West 70% 58% Moldova 77% Europe, Eastern 70% 80% Mongolia 70% Asia, Central 70% 48% Mozambique 71% Sub-Saharan Africa, East 70% 69% Myanmar 60% Asia, Southeast 70% 64% Nepal 84% Asia, South 70% 79% Nicaragua 68% Latin America, Central 70% 53% Niger 71% Sub-Saharan Africa, West 70% 58% Nigeria 71% Sub-Saharan Africa, West 70% 70% Pakistan 84% Asia, South 70% 94% Papua New Guinea 60% Oceania 70% 75% Rwanda 71% Sub-Saharan Africa, East 70% 76% São Tomé and Príncipe 71% Sub-Saharan Africa, West 70% 49% Senegal 71% Sub-Saharan Africa, West 70% 44% Sierra Leone 71% Sub-Saharan Africa, West 70% 58% Solomon Islands 60% Oceania 70% 75% Somalia 71% Sub-Saharan Africa, East 70% 76% Sri Lanka 60% Asia, Southeast 70% 77% Sudan 71% Sub-Saharan Africa, East 70% 69% Tajikistan 70% Asia, Central 70% 77% Tanzania 71% Sub-Saharan Africa, East 70% 76% The Gambia 71% Sub-Saharan Africa, West 70% 58% Timor Leste 60% Asia, Southeast 70% 64%

SUMMARY 2: HPV Vaccination
Page 20 of 72
Table 3. Proportion of HPV 16,18 in cervical cancer used as model parameter estimate (cont.) Country Regional estimate Region Flat estimate Country-specific estimate Togo 71% Sub-Saharan Africa, West 70% 58% Uganda 71% Sub-Saharan Africa, East 70% 73% Ukraine 77% Europe, Eastern 70% 80% Uzbekistan 70% Asia, Central 70% 77% Viet Nam 60% Asia, Southeast 70% 64% Yemen 72% North Africa/Middle East 70% 67% Zambia 71% Sub-Saharan Africa, East 70% 76% Zimbabwe 71% Sub-Saharan Africa, Southern 70% 76%

SUMMARY 2: HPV Vaccination
Page 21 of 72
Comparison to previous published model (Goldie 2008a,b,c)
Previous applications of the model (e.g., Goldie 2008a,b,c) utilized different data sources: age-specific
population size from the 2004 revision of the UN World Population Prospects (UN 2005), age-specific
life expectancy from 2004 WHO life tables, and cervical cancer incidence data hierarchically ranked
from national registries or regional pools in Cancer Incidence on Five Continents (CI5C) (Parkin 2005),
Cancer in Africa (if applicable) (Parkin 2003), or Globocan 2002 (Ferlay 2004).
For these earlier analyses, we computed the prevalence of HPV 16,18 in women with cervical cancer
using a homogeneous source, the comprehensive meta-analysis from Smith et al. (2007). For those
countries with specific information, we used that or the pool of the country in cases where data were
available from more than one citation. For those countries without specific information, we performed
a regional pool. Smith et al. (2007) includes both single- and multiple-type HPV infections; women with
multiple HPV types are counted more than once, so the overall prevalence of HPV types adds to more
than 100%. Specifically, women with multiple types HPV 16 and 18 are counted twice; therefore the
HPV 16,18 distribution is inflated. To avoid this, we utilized a hierarchical classification, whereby
multiple types are assigned according to the most common type, and women are counted once. For
example, a woman with multiple types 16 and 18 is classified as HPV 16. This classification implies that
the prevalence of HPV 16 remains the same, while the prevalence of HPV 18 decreases in relation to
that used in the meta-analysis, as well as the HPV16,18 distribution. For this purpose, the prevalence
of HPV 18 was corrected for multiple types 16,18 when information was reported (provided by IARC).
The final prevalence of HPV 18 is the prevalence presented in the meta-analysis less the prevalence of
women with both types. For those studies with multiple types but no specific information available, we
used a 3.3% correction (overall average of the articles with available information on multiple types
16,18).
Finally, costs associated with cervical cancer were estimated in the same way, e.g., based on published
studies and previously described approximation methods, which leverage available data in select
countries and extrapolate to other countries based on per capita gross domestic product (GDP) and
other indicators (WHO CHOICE, Goldie 2005, Goldhaber-Fiebert 2006), but we utilized recently

SUMMARY 2: HPV Vaccination
Page 22 of 72
available data from the WHO on bed day costs and per capita GDP. Any differences in results between
the original published analyses and the current model are due to the combination of updating multiple
parameters (e.g., population estimates, life expectancy, cervical cancer incidence, type distribution in
cervical cancer, and costs); basic model assumptions, however, remained consistent between model
versions.

SUMMARY 2: HPV Vaccination
Page 23 of 72
II. COMPARATIVE VALIDATION: COMPANION MODEL AND STOCHASTIC MODELS
Overview of stochastic models
We have previously described a series of cervical cancer models that include an individual-based
stochastic model to simulate cervical carcinogenesis associated with all high-risk HPV types and a
dynamic model to simulate sexual transmission of HPV-16 and -18 infections between males and
females (Goldie 2007, Kim 2007a, Kim 2007b, Diaz 2008, Kim 2008, Diaz 2010, Sharma 2011, Campos
2011). A likelihood-based approach is used to calibrate these models to empirical data, including age-
and type-specific HPV prevalence, age-specific prevalence of cervical lesions, HPV type distribution
within women with normal cytology, cancer precursors and cervical cancer, and age-specific incidence
of cervical cancer. Our empirically calibrated models include countries in Asia (India, Thailand, and
Vietnam – Hanoi and Ho Chi Minh City), Africa (Zimbabwe, Tanzania, Nigeria, Kenya, Uganda,
Mozambique, South Africa), Latin America and the Caribbean (Brazil, Argentina, Chile, Colombia, Costa
Rica, Mexico, Peru), and the Middle East/North Africa (Lebanon, Algeria, Turkey).
Comparison of data inputs
Our companion and stochastic models differ on one major input, the source of cervical cancer
incidence. We have explained above our reasons to use Globocan 2008 (Ferlay 2010) estimates for the
companion model. For the stochastic models, we selected countries with the best available country-
specific epidemiological data, and therefore decided to use cancer incidence as reported in Cancer
Incidence in Five Continents (Curado 2007). The overall objective of the Cancer Incidence in Five
Continents (CI5C) series is to make available comparable data on cancer incidence from as wide a
range of geographical locations worldwide as possible. Traditionally, this has been through publication
of a volume containing tabulations of cancer incidence rates at approximately five-year intervals. The
volumes contain three basic elements:
1. tabulations from individual registries presenting incidence rates according to sex, age group,
and cancer site;
2. summary tables permitting comparisons between registries;
3. tables presenting indices of the validity and completeness of the different contributions.
SUMMARY 2: HPV Vaccination
Page 24 of 72
Nigeria
0.0
20.0
40.0
60.0
80.0
100.0
120.0
140.0
0-4 5-9 10-14
15-19
20-24
25-29
30-34
35-39
40-44
45-49
50-54
55-59
60-64
65-69
70-74
75+
Age
Inci
denc
e
Globocan 2008 CI5C vol 1-3
Mozambique
0.0
50.0
100.0
150.0
200.0
250.0
0-4 5-9 10-14
15-19
20-24
25-29
30-34
35-39
40-44
45-49
50-54
55-59
60-64
65-69
70-74
75+
Age
Inci
denc
e
Globocan 2008 CI5C vol 1
South Africa
0.020.040.060.080.0
100.0120.0140.0160.0180.0200.0
0-4 5-9 10-14
15-19
20-24
25-29
30-34
35-39
40-44
45-49
50-54
55-59
60-64
65-69
70-74
75+
Age
Inci
denc
e
Globocan 2008 CI5C vol 1-2
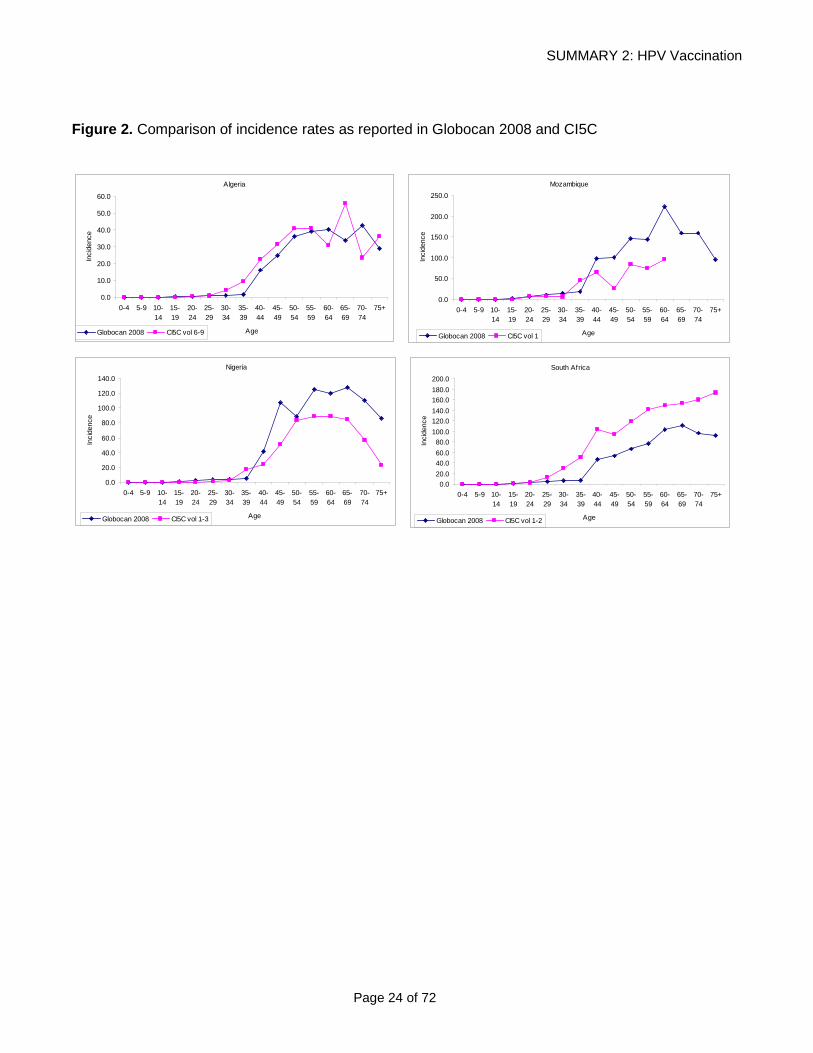
Figure 2. Comparison of incidence rates as reported in Globocan 2008 and CI5C
Algeria
0.0
10.0
20.0
30.0
40.0
50.0
60.0
0-4 5-9 10-14
15-19
20-24
25-29
30-34
35-39
40-44
45-49
50-54
55-59
60-64
65-69
70-74
75+
Age
Inci
denc
e
Globocan 2008 CI5C vol 6-9

SUMMARY 2: HPV Vaccination
Page 25 of 72
Uganda
0.0
50.0
100.0
150.0
200.0
250.0
0-4 5-9 10-14
15-19
20-24
25-29
30-34
35-39
40-44
45-49
50-54
55-59
60-64
65-69
70-74
75+
Age
Inci
denc
e
Globocan 2008 CI5C vol 1,7-9
Zimbabw e
0.0
50.0
100.0
150.0
200.0
250.0
300.0
0-4 5-9 10-14
15-19
20-24
25-29
30-34
35-39
40-44
45-49
50-54
55-59
60-64
65-69
70-74
75+
Age
Inci
denc
e
Globocan 2008 CI5C vol 7-9
Argentina
0.0
10.0
20.0
30.0
40.0
50.0
60.0
0-4 5-9 10-14
15-19
20-24
25-29
30-34
35-39
40-44
45-49
50-54
55-59
60-64
65-69
70-74
75+
Age
Inci
denc
e
Globocan 2008 CI5C vol 7-9
Brazil
0.0
20.0
40.0
60.0
80.0
100.0
120.0
0-4 5-9 10-14
15-19
20-24
25-29
30-34
35-39
40-44
45-49
50-54
55-59
60-64
65-69
70-74
75+
Age
Inci
denc
e
Globocan 2008 CI5C vol 5-9
Colombia
0.0
20.0
40.0
60.0
80.0
100.0
120.0
140.0
0-4 5-9 10-14
15-19
20-24
25-29
30-34
35-39
40-44
45-49
50-54
55-59
60-64
65-69
70-74
75+
Age
Inci
denc
e
Globocan 2008 CI5C vol 5-9
Chile
0.0
20.0
40.0
60.0
80.0
100.0
120.0
140.0
0-4 5-9 10-14
15-19
20-24
25-29
30-34
35-39
40-44
45-49
50-54
55-59
60-64
65-69
70-74
75+
Age
Inci
denc
e
Globocan 2008 CI5C vol 1,9
Peru
0.0
20.0
40.0
60.0
80.0
100.0
120.0
140.0
0-4 5-9 10-14
15-19
20-24
25-29
30-34
35-39
40-44
45-49
50-54
55-59
60-64
65-69
70-74
75+
Age
Inci
denc
e
Globocan 2008 CI5C vol 6-9
Costa Rica
0.0
20.0
40.0
60.0
80.0
100.0
120.0
0-4 5-9 10-14
15-19
20-24
25-29
30-34
35-39
40-44
45-49
50-54
55-59
60-64
65-69
70-74
75+
Age
Inci
denc
e
Globocan 2008 CI5C vol 5-9
As shown below in the graphs of incidence rates from the two sources, the Globocan 2008 estimates
fall within the incidence estimates reported by CI5C.

SUMMARY 2: HPV Vaccination
Page 26 of 72
India
0.0
20.0
40.0
60.0
80.0
100.0
120.0
140.0
0-4 5-9 10-14
15-19
20-24
25-29
30-34
35-39
40-44
45-49
50-54
55-59
60-64
65-69
70-74
75+
Age
Inci
denc
e
Globocan 2008 India, Chenai & Bangalore CI5C vol 5-9 India CI5C vol 5-9
Thailand
0.010.020.030.040.0
50.060.070.080.090.0
0-4 5-9 10-14
15-19
20-24
25-29
30-34
35-39
40-44
45-49
50-54
55-59
60-64
65-69
70-74
75+
Age
Inci
denc
e
Globocan 2008 CI5C vol 6-9
Turkey
0.0
5.0
10.0
15.0
20.0
25.0
0-4 5-9 10-14
15-19
20-24
25-29
30-34
35-39
40-44
45-49
50-54
55-59
60-64
65-69
70-74
75+
Age
Inci
denc
e
Globocan 2008 CI5C vol 9
Vietnam
0.0
20.0
40.0
60.0
80.0
100.0
120.0
140.0
160.0
0-4 5-9 10-14
15-19
20-24
25-29
30-34
35-39
40-44
45-49
50-54
55-59
60-64
65-69
70-74
75+
Age
Inci
denc
e
Viet Nam Globocan 2008 Viet Nam CI5C vol 7-8
Viet Nam (Hanoi) CI5C 8 Viet Nam (HCMC) CI5C 7-8
As shown below in the graphs of incidence rates from the two sources, the Globocan 2008 estimates
fall within the incidence estimates reported by CI5C.
Figure 3. Comparison of incidence rates from two sources and model bounds
Algeria: CC incidence with UB and LB
0.00
20.00
40.00
60.00
80.00
100.00
120.00
15- 20- 25- 30- 35- 40- 45- 50- 55- 60- 65- 70- 75-
INCIDENCE MININCIDENCE MAXLB MinUB MaxGlobocan

SUMMARY 2: HPV Vaccination
Page 27 of 72
Turkey: CC incidence with UB and LB
0
5
10
15
20
25
30
35
15- 20- 25- 30- 35- 40- 45- 50- 55- 60- 65- 70- 75- 80- 85+
LB MinUB MaxINCIDENCE MININCIDENCE MAXGlobocan
Nigeria: Target vs. Globocan 2008
0
20
40
60
80
100
120
140
160
20-24 25-29 30-34 35-39 40-44 45-49 50-54 55-59 60-64 65-69 70+
Age group
Rate
per
100
,000
wom
en
Target rate (1960-1969 registry)
Target LB
Target UB
Globocan 2008
South Africa: Target vs. Globocan 2008
0
20
40
60
80
100
120
140
20-24 25-29 30-34 35-39 40-44 45-49 50-54 55-59 60-64 65-69 70-74 75+
Age group
Rate
per
100
,000
wom
en
Target rate
Target LB
Target UB
Globocan 2008

SUMMARY 2: HPV Vaccination
Page 28 of 72
Comparative validation
To ensure the validity of simplifying assumptions identified for the companion population-based model
we compared results to our micro-simulation models when subject to those same assumptions. The
figure below presents the results of a comparison exercise assuming vaccination coverage of 70%. For
each country, an upper and lower bound of reduction in lifetime cancer risk is denoted by horizontal
bars as well as an expected mean (denoted by a black triangle) projected using the micro-simulation
model, and the corresponding mean reduction generated by the companion population-based model
(denoted with a red circle). While the mean reduction in lifetime risk of cancer varies reflecting
epidemiological differences in the proportion of HPV 16- and 18-related cancer, the average reduction
in cancer predicted with the Excel-based companion model falls within these bounds.
Figure 4. Comparative validity: reduction in lifetime risk of cancer as predicted by two models

SUMMARY 2: HPV Vaccination
Page 29 of 72
III. SCALE-UP SCENARIOS [updated analyses conducted for GAVI available elsewhere] Table 4. Projected HPV vaccination coverage by year and country, Sample of a Strategic Demand Forecast
Geography 2011 2012 2013 2014 2015 2016 2017 2018 2019 2020
Afghanistan 0% 0% 0% 0% 0% 0% 0% 0% 0% 0% Angola 0% 0% 0% 0% 0% 0% 0% 0% 0% 0% Armenia 0% 0% 0% 0% 0% 0% 0% 38% 71% 94% Azerbaijan 0% 0% 0% 0% 0% 0% 0% 0% 0% 0% Bangladesh 0% 0% 0% 0% 0% 0% 24% 48% 71% 95% Benin 0% 0% 0% 0% 0% 36% 68% 90% 90% 90% Bhutan 0% 0% 0% 0% 0% 38% 72% 96% 96% 96% Bolivia 0% 0% 36% 68% 90% 90% 90% 90% 90% 90% Burkina Faso 0% 0% 0% 0% 0% 0% 0% 36% 68% 90% Burundi 0% 0% 0% 0% 0% 40% 74% 99% 99% 99% Cambodia 0% 0% 0% 0% 0% 0% 0% 38% 71% 94% Cameroon 0% 0% 0% 0% 0% 0% 0% 0% 0% 36% Central African Republic 0% 0% 0% 0% 0% 0% 0% 25% 48% 65% Chad 0% 0% 0% 0% 0% 0% 0% 0% 0% 0% Comoros 0% 0% 0% 0% 0% 0% 0% 36% 68% 90% Congo, DR 0% 0% 0% 0% 0% 0% 0% 0% 22% 44% Congo, Rep. 0% 0% 0% 0% 0% 0% 0% 0% 36% 68% Cote d'Ivoire 0% 0% 0% 0% 0% 0% 0% 36% 68% 90% Cuba 0% 0% 40% 74% 99% 99% 99% 99% 99% 99% Djibouti 0% 0% 0% 0% 0% 0% 0% 0% 0% 36% Eritrea 0% 0% 0% 0% 0% 0% 0% 0% 0% 40% Ethiopia 0% 0% 0% 0% 0% 0% 0% 0% 0% 23% Gambia 0% 0% 0% 0% 39% 74% 98% 98% 98% 98% Georgia 0% 0% 0% 0% 0% 0% 0% 0% 39% 74% Ghana 0% 0% 0% 0% 38% 71% 94% 94% 94% 94% Guinea 0% 0% 0% 0% 0% 0% 0% 0% 0% 0%

SUMMARY 2: HPV Vaccination
Page 30 of 72
Table 4. Projected HPV vaccination coverage by year and country, Sample of a Strategic Demand Forecast (cont)
Geography 2011 2012 2013 2014 2015 2016 2017 2018 2019 2020
Guinea-Bissau 0% 0% 0% 0% 0% 0% 0% 0% 31% 59% Guyana 0% 0% 0% 0% 39% 74% 98% 98% 98% 98% Haiti 0% 0% 0% 0% 0% 0% 0% 0% 0% 0% Honduras 0% 0% 0% 0% 39% 74% 98% 98% 98% 98% India 0% 0% 0% 0% 0% 0% 0% 0% 0% 0% Indonesia 0% 0% 0% 0% 0% 0% 0% 0% 0% 0% Kenya 0% 0% 0% 0% 20% 41% 62% 84% 85% 86% Kiribati 0% 0% 0% 0% 0% 0% 0% 0% 0% 0% Korea, DPR 0% 0% 0% 0% 0% 0% 0% 0% 0% 0% Kyrgyzstan 0% 0% 0% 0% 0% 0% 40% 74% 99% 99% Lao PDR 0% 0% 0% 0% 0% 0% 0% 0% 0% 27% Lesotho 0% 0% 35% 66% 89% 90% 90% 90% 90% 90% Liberia 0% 0% 0% 0% 0% 0% 0% 29% 56% 75% Madagascar 0% 0% 0% 0% 0% 0% 0% 0% 35% 67% Malawi 0% 0% 0% 0% 0% 0% 40% 74% 99% 99% Mali 0% 0% 0% 0% 0% 0% 0% 33% 63% 85% Mauritania 0% 0% 0% 0% 0% 0% 0% 0% 0% 30% Moldova 0% 0% 0% 0% 0% 0% 0% 38% 71% 96% Mongolia 0% 0% 40% 74% 99% 99% 99% 99% 99% 99% Mozambique 0% 0% 0% 0% 0% 33% 63% 85% 86% 87% Myanmar 0% 0% 0% 0% 0% 0% 0% 0% 0% 0% Nepal 0% 0% 0% 0% 0% 36% 68% 90% 90% 90% Nicaragua 0% 0% 40% 74% 99% 99% 99% 99% 99% 99% Niger 0% 0% 0% 0% 0% 0% 0% 0% 0% 32% Nigeria 0% 0% 0% 0% 0% 0% 0% 0% 10% 21% Pakistan 0% 0% 0% 0% 0% 0% 0% 0% 18% 36% Papua New Guinea 0% 0% 0% 0% 0% 0% 0% 0% 0% 25%

SUMMARY 2: HPV Vaccination
Page 31 of 72
Table 4. Projected HPV vaccination coverage by year and country, Sample of a Strategic Demand Forecast (cont)
Geography 2011 2012 2013 2014 2015 2016 2017 2018 2019 2020
Rwanda 0% 0% 0% 40% 74% 99% 99% 99% 99% 99% Sao Tome e Principe 0% 0% 0% 0% 0% 0% 40% 74% 99% 99% Senegal 0% 0% 0% 0% 0% 37% 71% 94% 94% 94% Sierra Leone 0% 0% 0% 0% 0% 0% 33% 63% 85% 86% Solomon Islands 0% 0% 0% 0% 0% 0% 0% 0% 0% 0% Somalia 0% 0% 0% 0% 0% 0% 0% 0% 0% 0% Sri Lanka 0% 0% 0% 0% 0% 0% 0% 0% 0% 0% Sudan: North 0% 0% 0% 0% 0% 0% 0% 0% 0% 0% Sudan: South 0% 0% 0% 0% 0% 0% 0% 0% 0% 0% Tajikistan 0% 0% 0% 0% 0% 0% 0% 0% 0% 0% Tanzania 0% 0% 0% 0% 23% 46% 70% 94% 95% 95% Timor-Leste 0% 0% 0% 0% 0% 0% 0% 0% 0% 0% Togo 0% 0% 0% 0% 0% 0% 36% 68% 90% 90% Uganda 0% 0% 0% 17% 35% 53% 72% 73% 74% 75% Ukraine 0% 0% 0% 0% 0% 0% 0% 0% 0% 0% Uzbekistan 0% 0% 0% 0% 0% 0% 0% 0% 0% 0% Vietnam 0% 0% 0% 25% 50% 74% 99% 99% 99% 99% Yemen 0% 0% 0% 0% 0% 0% 0% 0% 0% 0% Zambia 0% 0% 0% 0% 0% 35% 67% 90% 90% 90% Zimbabwe 0% 0% 0% 0% 0% 32% 61% 82% 83% 84%

SUMMARY 2: HPV Vaccination
Page 32 of 72
Comparison of Sample Strategic Demand Forecast and previous vaccine roll-out scenarios (Wolfson
2008)
In a previous analysis (Goldie 2008c), we modeled vaccine roll-out scenarios (i.e., vaccination
introduced at different coverage levels) over a 10-year period, in which the year of introduction, years
to coverage, and maximum achievable coverage rate were based on the general framework and
assumptions used by Wolfson et al. (2008). We categorized the 72 GAVI-eligible countries according to
their achieved coverage for DPT3 (for Diptheria, Pertussis, and Tetanus) childhood vaccination and
2003 per capita gross national income (GNI). To reflect the additional challenges that are likely to be
posed by a three-dose vaccine for young adolescent girls, we conservatively constrained the maximum
coverage rate using an additional development indicator, the percentage of girls who are enrolled in
fifth grade (World Bank WDI). Based on the six categories used by Wolfson et al. (2008), the 72 GAVI
countries were characterized as follows: (1) high coverage (>80%), higher per capita GNI (US$ 480–
970); (2) high coverage (>80%), lower per capita GNI (US$ 170–450); (3) moderate coverage (>70%)
and per capita GNI (US$ 100–950); (4) India, moderate coverage (59%) and per capita GNI (US$ 530);
(5) lower coverage (50–69%) and per capita GNI (US$ 90–880); and (6) low coverage (25–49%) and per
capita GNI (US$ 250–740).
We assumed Category 1 rolls out in Year 1 (2010), maximum coverage is achieved in 3 years; Category
2 rolls out in Year 2 (2011)with maximum coverage achieved in 3 years; Category 3 rolls out in Year 3
(2012), maximum coverage achieved in 4 years; Category 4 (India) rolls out in Year 3 (2012), maximum
coverage achieved in 5 years; Categories 5 and 6 roll out in Years 4 (2013) and 5 (2014) respectively,
maximum coverage achieved in 5 years. We assumed coverage achieved in the initial year was a
category-specific percentage of country-specific DTP3 vaccination levels; for countries in categories 1
and 2 this was 50%, for those in categories 3 and 4 coverage was 30%, and for those in categories 5
and 6 it was 15%. The maximum coverage rate was constrained using the development indicator of
the percentage of girls enrolled in fifth grade (World Bank WDI) to reflect the challenges of a vaccine
targeting young adolescent girls. When this indicator was not available for a specific country, we used
the weighted average of the other countries within that category.

SUMMARY 2: HPV Vaccination
Page 33 of 72
Table 5. Previous roll-out scenario - vaccination coverage by year and country for 10-year vaccination scenario *
ASR Countries Year 1 Year 2 Year 3 Year 4 Year 5 Year 6 Year 7 Year 8 Year 9 Year 10
87.3 Haiti 6.5 14.3 22.2 30.0 37.9 45.8 68.6 Tanzania 40.5 55.8 71.2 86.5 86.5 86.5 86.5 86.5 86.5 61.6 Lesotho 41.5 50.6 59.7 68.9 68.9 68.9 68.9 68.9 68.9 68.9 55.0 Bolivia 40.5 55.2 69.9 84.7 84.7 84.7 84.7 84.7 84.7 84.7 53.7 Zambia 43.0 54.7 66.4 78.1 78.1 78.1 78.1 78.1 78.1 52.1 Zimbabwe 45.0 53.7 62.4 71.2 71.2 71.2 71.2 71.2 71.2 71.2 49.4 Rwanda 30.5 36.6 42.6 48.7 48.7 48.7 48.7 48.7 48.7 47.3 Guyana 46.5 52.7 58.8 65.0 65.0 65.0 65.0 65.0 65.0 65.0 47.2 Nicaragua 43.0 47.5 51.9 56.4 56.4 56.4 56.4 56.4 56.4 56.4 46.6 Malawi 30.5 33.9 37.2 40.6 40.6 40.6 40.6 40.6 40.6 42.8 Solomon Islands 40.0 55.1 70.3 85.4 85.4 85.4 85.4 85.4 85.4 85.4 42.7 Burundi 22.2 33.7 45.2 56.7 68.2 68.2 68.2 68.2 42.7 Comoros 10.0 33.2 56.3 79.5 79.5 79.5 79.5 79.5 79.5 42.7 Djibouti 21.3 37.2 53.1 69.0 84.9 84.9 84.9 84.9 42.7 Eritrea 35.5 48.4 61.2 74.1 74.1 74.1 74.1 74.1 74.1 42.7 Madagascar 9.2 18.0 26.8 35.7 44.5 53.4 53.4 42.7 Somalia 5.3 14.6 24.0 33.3 42.7 52.0 40.4 Papua New Guinea 9.2 20.8 32.5 44.2 55.9 67.6 67.6 38.7 Cambodia 37.0 46.3 55.5 64.8 64.8 64.8 64.8 64.8 64.8 36.3 Uganda 41.0 46.5 52.0 57.5 57.5 57.5 57.5 57.5 57.5 35.9 Ethiopia 10.4 12.9 15.4 17.9 20.4 23.0 23.0 35.7 Cameroon 40.0 47.8 55.6 63.5 63.5 63.5 63.5 63.5 63.5 63.5 35.2 Mali 46.5 58.8 71.0 83.3 83.3 83.3 83.3 83.3 83.3 35.0 Liberia 26.1 39.4 52.7 65.9 79.2 79.2 79.2 79.2 33.6 Mozambique 21.6 30.8 40.0 49.2 58.4 58.4 58.4 58.4 30.7 India 17.7 28.7 39.8 50.8 61.9 72.9 72.9 72.9 30.6 Honduras 45.5 54.6 63.8 72.9 72.9 72.9 72.9 72.9 72.9 72.9 30.5 Congo, Dem. Rep. 21.9 28.9 36.0 43.0 50.1 50.1 50.1 50.1 30.1 Cote d'Ivoire 8.4 24.1 39.7 55.4 71.0 86.7 86.7

SUMMARY 2: HPV Vaccination
Page 34 of 72
Table 5. Vaccination coverage by year and country for 10-year vaccination scenario * (cont.)
ASR Countries Year 1 Year 2 Year 3 Year 4 Year 5 Year 6 Year 7 Year 8 Year 9 Year 10
29.3 Benin 44.0 52.4 60.7 69.1 69.1 69.1 69.1 69.1 69.1 29.3 Ghana 42.0 49.6 57.2 64.7 64.7 64.7 64.7 64.7 64.7 29.3 Guinea-Bissau 24.0 36.9 49.9 62.8 75.7 75.7 75.7 75.7 29.3 Mauritania 21.3 29.7 38.0 46.4 54.7 54.7 54.7 54.7 29.3 Sierra Leone 9.6 20.8 32.0 43.3 54.5 65.7 65.7 29.3 Togo 27.5 41.7 55.9 70.1 70.1 70.1 70.1 70.1 70.1 28.8 Gambia, The 34.5 49.7 64.9 80.0 80.0 80.0 80.0 80.0 80.0 28.7 Kenya 22.8 38.4 53.9 69.5 85.1 85.1 85.1 85.1 28.6 Angola 7.1 15.2 23.3 31.5 39.6 47.8 28.5 Nigeria 3.8 17.9 32.1 46.2 60.4 74.6 28.0 Central African Republic 6.0 9.1 12.2 15.3 18.4 21.5 28.0 Chad 3.0 8.8 14.6 20.5 26.3 32.1 28.0 Guinea 10.4 23.0 35.6 48.2 60.8 73.4 73.4 27.6 Bangladesh 46.5 53.4 60.4 67.3 67.3 67.3 67.3 67.3 67.3 26.4 Bhutan 47.5 62.7 78.0 93.2 93.2 93.2 93.2 93.2 93.2 93.2 26.4 Nepal 22.5 37.6 52.6 67.7 82.8 82.8 82.8 82.8 26.2 Senegal 42.0 51.8 61.6 71.4 71.4 71.4 71.4 71.4 71.4 71.4 25.1 Congo, Rep. 9.8 21.2 32.7 44.2 55.7 67.2 67.2 24.6 Myanmar 21.9 34.4 47.0 59.5 72.1 72.1 72.1 72.1 23.4 Burkina Faso 40.5 52.4 60.7 76.1 76.1 76.1 76.1 76.1 76.1 21.6 Kyrgyz Republic 39.5 54.2 69.0 83.7 83.7 83.7 83.7 83.7 83.7 20.2 Cuba 49.5 65.7 81.9 98.1 98.1 98.1 98.1 98.1 98.1 98.1 20.0 Vietnam 47.5 60.5 73.5 86.5 86.5 86.5 86.5 86.5 86.5 86.5 19.9 Niger 43.0 49.8 56.7 63.5 63.5 63.5 63.5 63.5 63.5 18.0 Moldova 49.0 61.7 74.3 87.0 87.0 87.0 87.0 87.0 87.0 87.0 18.0 Mongolia 49.5 62.2 74.8 87.5 87.5 87.5 87.5 87.5 87.5 87.5 17.9 Korea, Dem. Rep. 23.7 36.6 49.5 62.3 75.2 75.2 75.2 75.2 17.5 Georgia 42.0 54.7 67.3 80.0 80.0 80.0 80.0 80.0 80.0 80.0 17.2 Sri Lanka 49.5 63.9 78.2 92.6 92.6 92.6 92.6 92.6 92.6 92.6
SUMMARY 2: HPV Vaccination
Page 35 of 72
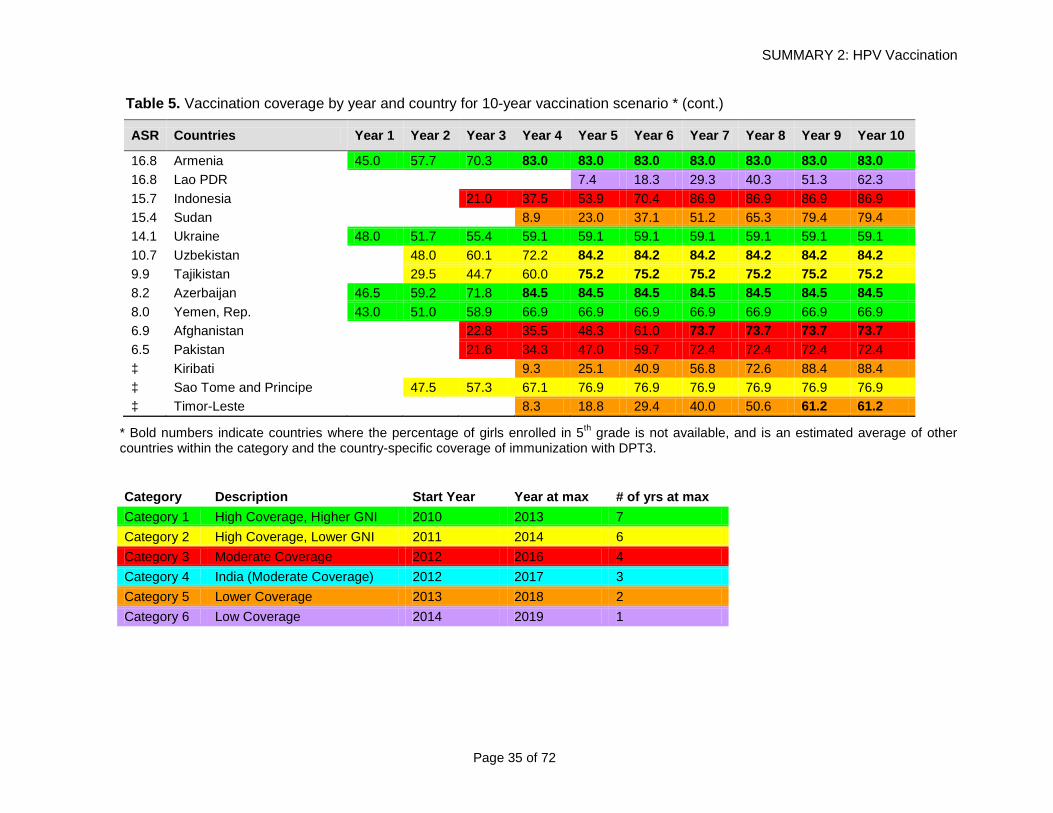
Table 5. Vaccination coverage by year and country for 10-year vaccination scenario * (cont.)
ASR Countries Year 1 Year 2 Year 3 Year 4 Year 5 Year 6 Year 7 Year 8 Year 9 Year 10
16.8 Armenia 45.0 57.7 70.3 83.0 83.0 83.0 83.0 83.0 83.0 83.0 16.8 Lao PDR 7.4 18.3 29.3 40.3 51.3 62.3 15.7 Indonesia 21.0 37.5 53.9 70.4 86.9 86.9 86.9 86.9 15.4 Sudan 8.9 23.0 37.1 51.2 65.3 79.4 79.4 14.1 Ukraine 48.0 51.7 55.4 59.1 59.1 59.1 59.1 59.1 59.1 59.1 10.7 Uzbekistan 48.0 60.1 72.2 84.2 84.2 84.2 84.2 84.2 84.2 9.9 Tajikistan 29.5 44.7 60.0 75.2 75.2 75.2 75.2 75.2 75.2 8.2 Azerbaijan 46.5 59.2 71.8 84.5 84.5 84.5 84.5 84.5 84.5 84.5 8.0 Yemen, Rep. 43.0 51.0 58.9 66.9 66.9 66.9 66.9 66.9 66.9 66.9 6.9 Afghanistan 22.8 35.5 48.3 61.0 73.7 73.7 73.7 73.7 6.5 Pakistan 21.6 34.3 47.0 59.7 72.4 72.4 72.4 72.4 ‡ Kiribati 9.3 25.1 40.9 56.8 72.6 88.4 88.4 ‡ Sao Tome and Principe 47.5 57.3 67.1 76.9 76.9 76.9 76.9 76.9 76.9 ‡ Timor-Leste 8.3 18.8 29.4 40.0 50.6 61.2 61.2
* Bold numbers indicate countries where the percentage of girls enrolled in 5th grade is not available, and is an estimated average of other countries within the category and the country-specific coverage of immunization with DPT3.
Category Description Start Year Year at max # of yrs at max Category 1 High Coverage, Higher GNI 2010 2013 7 Category 2 High Coverage, Lower GNI 2011 2014 6 Category 3 Moderate Coverage 2012 2016 4 Category 4 India (Moderate Coverage) 2012 2017 3 Category 5 Lower Coverage 2013 2018 2 Category 6 Low Coverage 2014 2019 1

SUMMARY 2: HPV Vaccination
Page 36 of 72
In general, in contrast with the Sample Strategic Demand Forecast, the roll-out scenario based on
Wolfson et al. (2008) predicted a more gradual scale-up for all countries, achieving lower maximum
coverage rates, but introducing the HPV vaccine earlier within a ten-year program. Noticeable
differences between the two roll-out scenarios include:
• Of the 72 GAVI-eligible countries, the Sample Strategic Demand Forecast assumes that 20 countries
will not implement HPV vaccine in the next 10 years, most significant being India. The roll-out
scenario based on Wolfson et al. (2008) reflected scale-up scenarios for all 72 countries, achieving a
maximum coverage of 32.1% to 92.6% in the 20 countries excluded by the Sample Strategic
Demand Forecast, including 72.9% in India.
• Of the remaining 52 GAVI-eligible countries, the Sample Strategic Demand Forecast predicts none
will implement HPV vaccine in the next two years. The roll-out scenario based on Wolfson et al.
(2008) predicted 19 of these countries would delay implementation until year 3 of the program.
• The Sample Strategic Demand Forecast estimates that 8 of the countries will not introduce the HPV
vaccine until year 10 of the program. The latest start year under the roll-out scenario based on
Wolfson et al. (2008) is year 5.
• For the majority (39) of the 52 GAVI-eligible countries predicted to introduce the HPV vaccine, the
Sample Strategic Demand Forecast is more optimistic about the maximum coverage achieved by
year 10 of the program, than the roll-out scenario based on Wolfson et al. (2008). Many (nearly 30)
maximum coverage levels in the Sample Strategic Demand Forecast reach 90% or above while only
3 countries in the roll-out scenario based on Wolfson et al. (2008) are expected to reach this level.
• In the Sample Strategic Demand Forecast, maximum coverage levels are expected to be reached
fairly quickly, with four countries reaching maximum coverage by year 5, two by year 6, and five
each by years 7, 8, and 9. Of the countries introducing the vaccine, five will initiate a program in
year 3, three in year 4, six in year 5, eight in year 6, six in year 7, nine in year 8, and seven in year 9.
In the roll-out scenario based on Wolfson et al. (2008), the majority of countries (40) are forecast to
introduce the HPV vaccine in years 1 or 2 of a 10-year program, with maximum coverage achieved
in years 4 or 5, respectively.
SUMMARY 2: HPV Vaccination
Page 37 of 72
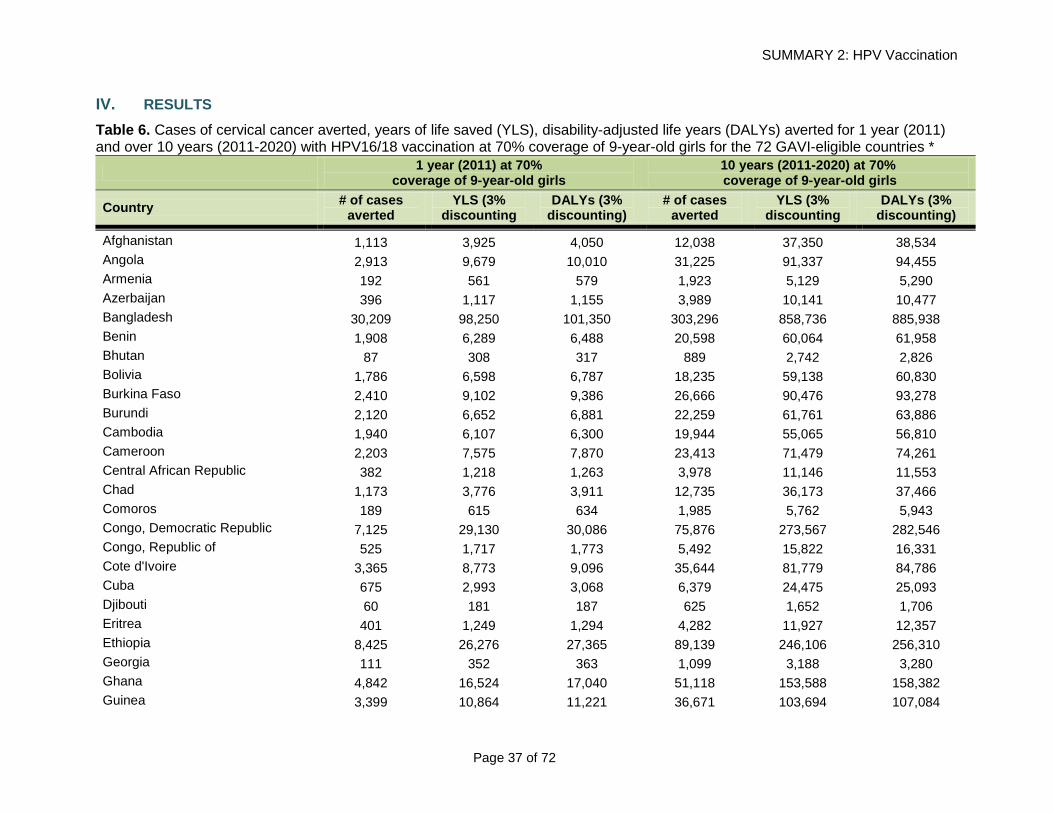
IV. RESULTS Table 6. Cases of cervical cancer averted, years of life saved (YLS), disability-adjusted life years (DALYs) averted for 1 year (2011) and over 10 years (2011-2020) with HPV16/18 vaccination at 70% coverage of 9-year-old girls for the 72 GAVI-eligible countries * 1 year (2011) at 70%
coverage of 9-year-old girls 10 years (2011-2020) at 70% coverage of 9-year-old girls
Country # of cases averted
YLS (3% discounting
DALYs (3% discounting)
# of cases averted
YLS (3% discounting
DALYs (3% discounting)
Afghanistan 1,113 3,925 4,050 12,038 37,350 38,534 Angola 2,913 9,679 10,010 31,225 91,337 94,455 Armenia 192 561 579 1,923 5,129 5,290 Azerbaijan 396 1,117 1,155 3,989 10,141 10,477 Bangladesh 30,209 98,250 101,350 303,296 858,736 885,938 Benin 1,908 6,289 6,488 20,598 60,064 61,958 Bhutan 87 308 317 889 2,742 2,826 Bolivia 1,786 6,598 6,787 18,235 59,138 60,830 Burkina Faso 2,410 9,102 9,386 26,666 90,476 93,278 Burundi 2,120 6,652 6,881 22,259 61,761 63,886 Cambodia 1,940 6,107 6,300 19,944 55,065 56,810 Cameroon 2,203 7,575 7,870 23,413 71,479 74,261 Central African Republic 382 1,218 1,263 3,978 11,146 11,553 Chad 1,173 3,776 3,911 12,735 36,173 37,466 Comoros 189 615 634 1,985 5,762 5,943 Congo, Democratic Republic 7,125 29,130 30,086 75,876 273,567 282,546 Congo, Republic of 525 1,717 1,773 5,492 15,822 16,331 Cote d'Ivoire 3,365 8,773 9,096 35,644 81,779 84,786 Cuba 675 2,993 3,068 6,379 24,475 25,093 Djibouti 60 181 187 625 1,652 1,706 Eritrea 401 1,249 1,294 4,282 11,927 12,357 Ethiopia 8,425 26,276 27,365 89,139 246,106 256,310 Georgia 111 352 363 1,099 3,188 3,280 Ghana 4,842 16,524 17,040 51,118 153,588 158,382 Guinea 3,399 10,864 11,221 36,671 103,694 107,084

SUMMARY 2: HPV Vaccination
Page 38 of 72
Table 6. Cases cervical cancer averted, years of life saved (YLS), disability-adjusted life years (DALYs) averted for 1 year (2011) and over 10 years (2011-2020) with HPV16/18 vaccination at 70% coverage of 9-year-old girls for the 72 GAVI-eligible countries * (cont.)
1 year (2011) at 70% coverage of 9-year-old girls
10 years (2011-2020) at 70% coverage of 9-year-old girls
Country # of cases averted
YLS (3% discounting
DALYs (3% discounting)
# of cases averted
YLS (3% discounting
DALYs (3% discounting)
Guinea-Bissau 272 927 957 2,932 8,836 9,119 Guyana 81 323 332 725 2,460 2,529 Haiti 1,020 1,981 2,059 10,468 17,808 18,511 Honduras 1,531 5,728 5,890 15,723 51,602 53,059 India 180,803 639,420 658,613 1,823,514 5,649,527 5,819,305 Indonesia 12,069 38,828 40,012 120,914 340,919 351,333 Kenya 4,661 15,788 16,272 50,203 151,776 156,396 Kiribati 5 16 17 47 145 149 Korea, Democratic Republic 505 2,303 2,363 4,890 19,324 19,833 Kyrgyzstan 499 1,727 1,779 5,058 15,657 16,123 Lao People Democratic Republic 612 2,240 2,307 6,271 20,003 20,609 Lesotho 198 742 765 2,000 6,565 6,769 Liberia 975 3,018 3,118 10,380 28,329 29,266 Madagascar 3,191 10,831 11,168 33,830 100,859 103,999 Malawi 3,634 14,081 14,521 39,042 133,082 137,230 Mali 2,256 9,324 9,593 24,495 89,927 92,504 Mauritania 597 2,061 2,125 6,266 19,086 19,680 Moldova 150 591 608 1,504 5,460 5,610 Mongolia 338 1,283 1,319 3,427 11,519 11,838 Mozambique 4,574 16,801 17,331 48,601 157,739 162,697 Myanmar 5,190 17,498 18,040 52,411 155,924 160,736 Nepal 6,478 24,532 25,240 66,126 217,422 223,731 Nicaragua 1,084 4,366 4,479 10,941 38,716 39,721 Niger 1,441 5,112 5,270 16,437 52,024 53,609 Nigeria 23,931 76,328 78,844 252,228 710,824 734,174

SUMMARY 2: HPV Vaccination
Page 39 of 72
Table 6. Cases cervical cancer averted, years of life saved (YLS), disability-adjusted life years (DALYs) averted for 1 year (2011) and over 10 years (2011-2020) with HPV16/18 vaccination at 70% coverage of 9-year-old girls for the 72 GAVI-eligible countries * (cont.)
1 year (2011) at 70% coverage of 9-year-old girls
10 years (2011-2020) at 70% coverage of 9-year-old girls
Country # of cases averted
YLS (3% discounting
DALYs (3% discounting)
# of cases averted
YLS (3% discounting
DALYs (3% discounting)
Pakistan 22,968 82,819 85,304 240,581 764,507 787,399 Papua New Guinea 682 2,759 2,838 7,125 25,304 26,026 Rwanda 1,875 6,547 6,750 20,184 62,634 64,569 Sao Thome 21 79 81 222 718 741 Senegal 2,382 8,657 8,917 25,392 81,806 84,257 Sierra Leone 1,153 3,829 3,955 12,405 36,392 37,576 Solomon Islands 44 166 171 464 1,529 1,572 Somalia 1,010 3,163 3,287 11,014 30,476 31,670 Sri Lanka 932 2,535 2,616 9,253 22,429 23,135 Sudan 1,764 4,436 4,596 18,326 40,387 41,841 Tajikistan 313 1,174 1,209 3,204 10,563 10,875 Tanzania 11,547 38,893 40,161 125,999 377,894 390,154 The Gambia 294 1,243 1,279 3,148 11,718 12,054 Timor Leste 90 335 345 983 3,245 3,342 Togo 1,211 3,525 3,644 12,727 32,564 33,659 Uganda 8,550 30,423 31,394 93,672 295,444 304,831 Ukraine 1,586 6,301 6,475 15,844 57,389 58,957 Uzbekistan 1,485 4,725 4,873 14,944 41,687 42,993 Viet Nam 3,741 14,139 14,540 37,416 123,878 127,394 Yemen 478 1,240 1,284 5,069 11,597 12,005 Zambia 2,858 9,490 9,816 30,862 90,719 93,825 Zimbabwe 3,069 10,093 10,409 31,986 92,229 95,114 Totals 402,093 1,392,251 1,435,443 4,138,748 12,592,941 12,983,899
* Our base case (70% coverage of 9-year-old girls) utilizes regional estimates for the proportion of 16/18 in cancer.

SUMMARY 2: HPV Vaccination
Page 40 of 72
COMPARISON TABLE (current model results, results originally reported in Goldie 2008c, and rotavirus results): DALYs averted and number of cervical cancer or rotavirus-associated deaths averted with a 1-year vaccination program at 70% coverage (9-year-old females for HPV; 0-year-old males and females for rotavirus) *
DALYs averted (3% discounting) # of deaths averted (no discounting)
Country Current model Goldie 2008c Rotavirus Current model Goldie 2008c Rotavirus
Afghanistan 4,050 5,338 245,807 890 1,062 10,114 Angola 10,010 6,302 171,102 2,330 1,328 6,953 Armenia 579 785 1,087 154 115 38 Azerbaijan 1,155 1,424 17,017 317 210 599 Bangladesh 101,350 90,193 206,289 24,167 19,038 7,335 Benin 6,488 5,604 42,154 1,526 1,222 1,567 Bhutan 317 1,457 1,031 70 297 36 Bolivia 6,787 6,764 13,050 1,429 1,275 455 Burkina Faso 9,386 6,141 112,303 1,928 978 4,368 Burundi 6,881 7,283 45,301 1,696 1,594 1,754 Cambodia 6,300 10,872 62,918 1,552 2,788 2,216 Cameroon 7,870 6,977 78,905 1,762 1,456 3,012 Central African Republic 1,263 1,054 19,112 306 239 749 Chad 3,911 3,419 78,341 938 839 3,093 Comoros 634 1,018 991 151 206 35 Congo, Democratic Republic 30,086 25,135 491,511 5,700 5,458 18,983 Congo, Republic of 1,773 2,048 6,830 420 407 254 Cote d'Ivoire 9,096 7,569 15,805 2,692 1,557 589 Cuba 3,068 2,355 403 540 528 13 Djibouti 187 854 2,311 48 169 84 Eritrea 1,294 5,398 10,877 321 1,057 384 Ethiopia 27,365 76,541 448,089 6,740 13,941 16,358 Georgia 363 1,168 1,725 89 136 59 Ghana 17,040 9,579 50,697 3,874 2,021 1,860 Guinea 11,221 113 47,863 2,719 26 1,780

SUMMARY 2: HPV Vaccination
Page 41 of 72
COMPARISON TABLE (current model results, results originally reported in Goldie 2008c, and rotavirus results): DALYs averted and number of cervical cancer or rotavirus-associated deaths averted with a 1-year vaccination program at 70% coverage (9-year-old females for HPV; 0-year-old males and females for rotavirus) * (cont.)
DALYs averted # of deaths averted (no discounting)
Country Current model Goldie 2008c Rotavirus Current model Goldie 2008c Rotavirus
Guinea-Bissau 957 1,297 10,488 218 254 400 Guyana 332 425 1,140 65 70 40 Haiti 2,059 12,314 27,032 816 2,311 960 Honduras 5,890 4,023 6,973 1,225 846 237 India 658,613 531,789 1,793,955 144,642 120,131 63,489 Indonesia 40,012 79,675 186,020 9,655 14,915 6,454 Kenya 16,272 18,047 138,038 3,729 4,922 5,164 Kiribati 17 24 121 4 5 4 Korea, DR 2,363 6,548 13,778 404 1,244 478 Kyrgyzstan 1,779 2,658 8,654 399 431 302 Lao PDR 2,307 2,435 16,116 490 460 578 Lesotho 765 789 882 158 145 36 Liberia 3,118 1,711 30,510 780 326 1,209 Madagascar 11,168 22,010 67,616 2,553 4,333 2,434 Malawi 14,521 11,952 89,813 2,907 2,409 3,455 Mali 9,593 5,624 102,390 1,805 1,455 4,013 Mauritania 2,125 1,506 11,199 478 316 405 Moldova 608 1,153 165 120 166 6 Mongolia 1,319 866 2,672 270 179 92 Mozambique 17,331 9,402 97,202 3,659 2,092 3,721 Myanmar 18,040 24,008 90,581 4,152 5,004 3,221 Nepal 25,240 18,235 48,412 5,182 3,738 1,725 Nicaragua 4,479 5,503 3,482 867 1,110 118 Niger 5,270 4,994 196,473 1,153 924 8,013 Nigeria 78,844 27,048 772,011 19,145 7,123 30,021

SUMMARY 2: HPV Vaccination
Page 42 of 72
COMPARISON TABLE (current model results, results originally reported in Goldie 2008c, and rotavirus results): DALYs averted and number of cervical cancer or rotavirus-associated deaths averted with a 1-year vaccination program at 70% coverage (9-year-old females for HPV; 0-year-old males and females for rotavirus) * (cont.)
DALYs averted # of deaths averted (no discounting)
Country Current model Goldie 2008c Rotavirus Current model Goldie 2008c Rotavirus
Pakistan 85,304 21,801 364,919 18,374 5,430 12,877 Papua New Guinea 2,838 6,528 19,719 546 1,216 699 Rwanda 6,750 8,786 71,870 1,500 2,024 2,716 Sao Thome 81 66 442 17 17 16 Senegal 8,917 7,168 51,820 1,906 1,368 1,870 Sierra Leone 3,955 2,156 57,351 922 475 2,358 Solomon Islands 171 609 528 35 113 18 Somalia 3,287 8,853 84,592 808 1,899 3,122 Sri Lanka 2,616 5,878 4,293 746 1,454 145 Sudan 4,596 10,637 71,235 1,411 2,535 2,552 Tajikistan 1,209 1,938 26,528 250 274 936 Tanzania 40,161 50,119 179,548 9,238 9,997 6,921 The Gambia 1,279 774 4,515 235 119 162 Timor L'Este 345 403 4,238 72 94 147 Togo 3,644 2,986 19,434 969 622 704 Uganda 31,394 33,813 160,191 6,840 7,026 6,173 Ukraine 6,475 7,211 693 1,269 1,051 24 Uzbekistan 4,873 7,460 38,891 1,188 1,168 1,349 Viet Nam 14,540 54,570 24,045 2,993 13,222 814 Yemen 1,284 3,783 67,792 382 974 2,406 Zambia 9,816 10,159 68,125 2,286 2,110 2,793 Zimbabwe 10,409 6,684 22,401 2,455 1,715 937 Total 1,435,440 1,331,809 7,230,412 321,677 287,759 269,002
* HPV vaccination program assumes introduction in 2011; rotavirus vaccination program assumes introduction in 2012. HPV vaccination program targets only girls; rotavirus program targets both boys and girls.

SUMMARY 2: HPV Vaccination
Page 43 of 72
COMPARISON TABLE (current model results, results originally reported in Goldie 2008c, and rotavirus results): Total financial costs (US$) at I$10/girl, number vaccinated, and deaths averted per 1000 vaccinated, for a 1-year and a 10-year program at 70% coverage of 9 year old females (HPV) or 0-year-old males and females (rotavirus)*
Total Costs (US$) Number vaccinated Deaths averted per 1000 vaccinated
Current model
Goldie 2008c Rotavirus Current
model Goldie 2008c Rotavirus Current
model Goldie 2008c Rotavirus
1-year program $175 million $164 million $402 million 22,967,896 21,686,147 52,638,998 14.01 12.70 5.11
10-year program $1.6 billion $1.5 billion $4 billion 238,253,187 224,796,020 533,827,703 13.90 12.68 5.18
* For Cuba, Korea, Somalia, Timor Leste and Zimbabwe, as these countries do not have conversion rates, I$ = US$ was used. For all countries, future financial costs (i.e., years 2013 – 2021) are discounted 3% annually to reflect net present value.

SUMMARY 2: HPV Vaccination
Page 44 of 72
Table 7. Sensitivity analysis: cases of cervical cancer averted with HPV16/18 vaccination at 70% coverage of 9-year-old girls in a one-year program (2011), under various estimates of HPV16/18 proportion in cancer, for 72 GAVI-eligible countries
1 year (2011) at 70% coverage of 9-year-old girls
Country Regional
estimates of HPV16/18 in
cancer
70% estimate of HPV16/18 in
cancer
Country-specific estimate of HPV16/18 in
cancer
Afghanistan 1,113 925 966 Angola 2,913 2,881 2,036 Armenia 192 191 219 Azerbaijan 396 395 452 Bangladesh 30,209 25,101 25,568 Benin 1,908 1,887 1,797 Bhutan 87 72 80 Bolivia 1,786 1,831 1,002 Burkina Faso 2,410 2,383 1,974 Burundi 2,120 2,096 2,276 Cambodia 1,940 2,280 2,091 Cameroon 2,203 2,178 1,540 Central African Republic 382 377 267 Chad 1,173 1,160 820 Comoros 189 187 202 Congo, Democratic Republic 7,125 7,045 4,981 Congo, Republic of 525 519 367 Cote d'Ivoire 3,365 3,327 2,757 Cuba 675 692 637 Djibouti 60 59 64 Eritrea 401 397 431 Ethiopia 8,425 8,331 10,224 Georgia 111 111 127 Ghana 4,842 4,788 3,967 Guinea 3,399 3,361 2,458 Guinea-Bissau 272 269 223 Guyana 81 83 74 Haiti 1,020 1,046 911 Honduras 1,531 1,570 1,289 India 180,803 150,235 169,550 Indonesia 12,069 14,185 15,178 Kenya 4,661 4,610 4,043 Kiribati 5 5 6 Korea, Democratic Republic 505 504 515 Kyrgyzstan 499 498 551 Lao People Democratic Republic 612 719 795 Lesotho 198 196 174

SUMMARY 2: HPV Vaccination
Page 45 of 72
Table 7. Cases of cervical cancer averted with HPV16/18 vaccination at 70% coverage of 9-year-old girls in a one-year program (2011), under various estimates of HPV16/18 proportion in cancer, for 72 GAVI-eligible countries (cont.)
1 year (2011) at 70% coverage of 9-year-old girls
Country Regional
estimates of HPV16/18 in
cancer
70% estimate of HPV16/18 in
cancer
Country-specific estimate of HPV16/18 in
cancer
Liberia 975 964 799 Madagascar 3,191 3,155 3,426 Malawi 3,634 3,594 3,902 Mali 2,256 2,231 1,679 Mauritania 597 591 489 Moldova 150 135 155 Mongolia 338 337 233 Mozambique 4,574 4,523 4,433 Myanmar 5,190 6,100 5,595 Nepal 6,478 5,383 6,052 Nicaragua 1,084 1,112 842 Niger 1,441 1,425 1,181 Nigeria 23,931 23,664 23,495 Pakistan 22,968 19,085 25,492 Papua New Guinea 682 801 857 Rwanda 1,875 1,854 2,013 Sao Thome 21 21 15 Senegal 2,382 2,355 1,470 Sierra Leone 1,153 1,140 944 Solomon Islands 44 52 56 Somalia 1,010 999 1,085 Sri Lanka 932 1,095 1,211 Sudan 1,764 1,744 1,707 Tajikistan 313 312 345 Tanzania 11,547 11,418 12,397 The Gambia 294 291 241 Timor Leste 90 105 97 Togo 1,211 1,197 992 Uganda 8,550 8,454 8,841 Ukraine 1,586 1,435 1,642 Uzbekistan 1,485 1,482 1,639 Viet Nam 3,741 4,397 4,033 Yemen 478 465 447 Zambia 2,858 2,826 3,068 Zimbabwe 3,069 3,035 3,308 Totals 402,093 364,277 384,794

SUMMARY 2: HPV Vaccination
Page 46 of 72
Table 8. Incremental cost-effectiveness ratios (ICERs, discounted $/DALY averted, and expressed as percentage of per capita GDP) for a 1-year program (2011) of HPV16/18 vaccination at 70% coverage of 9-year-old girls, at various costs per vaccinated girl, for 72 GAVI-eligible countries *
Country
Per capita GDP
(newest year
available)
I$5 per vaccinated girl I$10 per vaccinated girl I$25 per vaccinated girl
ICER ($/DALY averted)
ICER as % of per
capita GDP
ICER ($/DALY averted)
ICER as % of per
capita GDP
ICER ($/DALY averted)
ICER as % of per
capita GDP
Afghanistan 955 250 26% 600 63% 1,670 175% Angola 6,035 C/S C/S C/S C/S 210 3% Armenia 5,354 C/S C/S 70 1% 400 7% Azerbaijan 9,869 20 0% 200 2% 760 8% Bangladesh 1,643 C/S C/S C/S C/S 170 10% Benin 1,576 C/S C/S 10 1% 210 13% Bhutan 5,289 C/S C/S C/S C/S 210 4% Bolivia 4,816 C/S C/S C/S C/S 180 4% Burkina Faso 1,247 C/S C/S 60 5% 310 25% Burundi 405 C/S C/S 30 7% 190 47% Cambodia 2,150 10 0% 90 4% 350 16% Cameroon 2,264 C/S C/S 60 3% 400 18% Central African Republic 783 70 9% 240 31% 730 93% Chad 1,360 10 1% 160 12% 600 44% Comoros 1,089 C/S C/S 0 0% 140 13% Congo, Democratic Republic 345 60 17% 180 52% 530 154% Congo, Republic of 4,214 C/S C/S 50 1% 340 8% Cote d'Ivoire 1,885 C/S C/S C/S C/S 250 13% Cuba N/A C/S C/S 50 N/A 270 N/A Djibouti 2,288 60 3% 250 11% 810 35% Eritrea 542 100 18% 290 54% 850 157% Ethiopia 1,033 60 6% 210 20% 660 64% Georgia 5,035 60 1% 260 5% 840 17% Ghana 1,625 C/S C/S 0 0% 180 11% Guinea 1,083 C/S C/S C/S C/S 110 10%

SUMMARY 2: HPV Vaccination
Page 47 of 72
Table 8. Incremental cost-effectiveness ratios (ICERs, discounted $/DALY averted, and expressed as percentage of per capita GDP) for a 1-year program (2011) of HPV16/18 vaccination at 70% coverage of 9-year-old girls, at various costs per vaccinated girl, for 72 GAVI-eligible countries * (cont.)
Country
Per capita GDP
(newest year
available)
I$5 per vaccinated girl I$10 per vaccinated girl I$25 per vaccinated girl
ICER ($/DALY averted)
ICER as % of per
capita GDP
ICER ($/DALY averted)
ICER as % of per
capita GDP
ICER ($/DALY averted)
ICER as % of per
capita GDP
Guinea-Bissau 1,177 C/S C/S 50 4% 300 25% Guyana 3,092 C/S C/S 70 2% 310 10% Haiti 1,102 120 11% 320 29% 930 84% Honduras 3,890 C/S C/S C/S C/S 160 4% India 3,586 C/S C/S C/S C/S 180 5% Indonesia 4,293 100 2% 280 7% 810 19% Kenya 1,635 C/S C/S 110 7% 470 29% Kiribati 2,450 160 7% 420 17% 1,170 48% Korea, Democratic Republic N/A 130 N/A 380 N/A 1,100 N/A Kyrgyzstan 2,257 0 0% 100 4% 390 17% Lao PDR 2,543 40 2% 150 6% 490 19% Lesotho 1,533 0 0% 120 8% 480 31% Liberia 416 C/S C/S 60 14% 250 60% Madagascar 961 C/S C/S 80 8% 340 35% Malawi 876 C/S C/S 30 3% 200 23% Mali 1,057 C/S C/S 30 3% 230 22% Mauritania 1,930 C/S C/S C/S C/S 190 10% Moldova 3,087 C/S C/S 100 3% 400 13% Mongolia 3,997 C/S C/S 20 1% 190 5% Mozambique 935 C/S C/S 50 5% 250 27% Myanmar 1,201 C/S C/S 50 4% 300 25% Nepal 1,190 C/S C/S C/S C/S 140 12% Nicaragua 2,766 C/S C/S 20 1% 170 6% Niger 723 70 10% 230 32% 690 95% Nigeria 2,363 C/S C/S 30 1% 300 13%

SUMMARY 2: HPV Vaccination
Page 48 of 72
Table 8. Incremental cost-effectiveness ratios (ICERs, discounted $/DALY averted, and expressed as percentage of per capita GDP) for a 1-year program (2011) of HPV16/18 vaccination at 70% coverage of 9-year-old girls, at various costs per vaccinated girl, for 72 GAVI-eligible countries * (cont.)
Country
Per capita GDP
(newest year
available)
I$5 per vaccinated girl I$10 per vaccinated girl I$25 per vaccinated girl
ICER ($/DALY averted)
ICER as % of per
capita GDP
ICER ($/DALY averted)
ICER as % of per
capita GDP
ICER ($/DALY averted)
ICER as % of per
capita GDP
Pakistan 2,674 C/S C/S 40 1% 300 11% Papua New Guinea 2,454 30 1% 140 6% 460 19% Rwanda 1,155 C/S C/S 40 3% 260 23% Sao Thome 1,880 C/S C/S 70 4% 350 19% Senegal 1,917 C/S C/S C/S C/S 200 10% Sierra Leone 821 C/S C/S 60 7% 270 33% Solomon Islands 2,689 50 2% 190 7% 590 22% Somalia N/A 40 N/A 180 N/A 600 N/A Sri Lanka 5,040 130 3% 340 7% 990 20% Sudan 2,239 270 12% 680 30% 1,910 85% Tajikistan 2,147 150 7% 390 18% 1,100 51% Tanzania 1,423 C/S C/S C/S C/S 160 11% The Gambia 1,400 C/S C/S 20 1% 220 16% Timor Leste 921 110 12% 270 29% 750 81% Togo 991 C/S C/S 70 7% 320 32% Uganda 1,263 C/S C/S 10 1% 180 14% Ukraine 6,658 C/S C/S 50 1% 360 5% Uzbekistan 3,090 80 3% 260 8% 800 26% Viet Nam 3,181 90 3% 260 8% 780 25% Yemen 2,485 740 30% 1,640 66% 4,340 175% Zambia 1,550 C/S C/S 20 1% 220 14% Zimbabwe N/A C/S C/S C/S C/S 110 N/A
* Our base case (70% coverage of 9-year-old girls) utilizes regional estimates for the proportion of 16/18 in cancer.

SUMMARY 2: HPV Vaccination
Page 49 of 72
Table 9. Sensitivity analysis: incremental cost effectiveness ratios (ICERs, discounted $/DALY averted) for a one-year program (2011) of HPV16/18 vaccination at 70% coverage of 9-year-old girls, at various costs per vaccinated girl and under various estimates of HPV16/18 proportion in cancer, for 72 GAVI-eligible countries *
Country I$5 per vaccinated girl I$10 per vaccinated girl I$25 per vaccinated girl
Regional estimate
70% estimate
Country-specific estimate
Regional estimate
70% estimate
Country-specific estimate
Regional estimate
70% estimate
Country-specific estimate
Afghanistan 250 320 300 600 750 710 1,670 2,030 1,940 Angola C/S C/S C/S C/S C/S 10 210 220 420 Armenia C/S C/S C/S 70 70 40 400 400 330 Azerbaijan 20 20 C/S 200 210 160 760 760 640 Bangladesh C/S C/S C/S C/S 20 20 170 230 230 Benin C/S C/S C/S 10 10 10 210 210 230 Bhutan C/S C/S C/S C/S 10 C/S 210 290 250 Bolivia C/S C/S C/S C/S C/S 90 180 170 410 Burkina Faso C/S C/S C/S 60 60 100 310 320 400 Burundi C/S C/S C/S 30 30 30 190 190 170 Cambodia 10 C/S 0 90 70 80 350 280 320 Cameroon C/S C/S C/S 60 60 160 400 410 650 Central African Rep. 70 80 140 240 240 380 730 740 1,090 Chad 10 10 80 160 160 290 600 610 920 Comoros C/S C/S C/S 0 0 C/S 140 140 120 Congo, Dem. Rep. 60 60 110 180 180 280 530 530 780 Congo, Republic of C/S C/S C/S 50 50 130 340 340 540 Cote d'Ivoire C/S C/S C/S C/S C/S C/S 250 260 370 Cuba C/S C/S C/S 50 50 60 270 260 290 Djibouti 60 60 40 250 250 220 810 830 750 Eritrea 100 100 90 290 290 260 850 860 780 Ethiopia 60 60 30 210 210 160 660 660 530 Georgia 60 70 40 260 260 210 840 840 720 Ghana C/S C/S C/S 0 0 30 180 190 250

SUMMARY 2: HPV Vaccination
Page 50 of 72
Table 9. Sensitivity analysis: incremental cost effectiveness ratios (ICERs, discounted $/DALY averted) for a one-year program (2011) of HPV16/18 vaccination at 70% coverage of 9-year-old girls, at various costs per vaccinated girl and under various estimates of HPV16/18 proportion in cancer, for 72 GAVI-eligible countries * (cont.)
Country I$5 per vaccinated girl I$10 per vaccinated girl I$25 per vaccinated girl
Regional estimate
70% estimate
Country-specific estimate
Regional estimate
70% estimate
Country-specific estimate
Regional estimate
70% estimate
Country-specific estimate
Guinea C/S C/S C/S C/S C/S 10 110 110 190 Guinea-Bissau C/S C/S C/S 50 50 90 300 300 380 Guyana C/S C/S C/S 70 60 80 310 300 350 Haiti 120 110 140 320 310 370 930 900 1,050 Honduras C/S C/S C/S C/S C/S 20 160 150 210 India C/S C/S C/S C/S 20 0 180 250 200 Indonesia 100 70 60 280 220 200 810 680 630 Kenya C/S C/S 10 110 110 150 470 470 560 Kiribati 160 130 110 420 340 310 1,170 980 910 Korea, Dem. Rep. 130 130 130 380 380 370 1,100 1,110 1,080 Kyrgyzstan 0 0 C/S 100 100 80 390 390 340 Lao PDR 40 20 10 150 120 100 490 410 360 Lesotho 0 0 20 120 130 160 480 490 570 Liberia C/S C/S 10 60 60 90 250 250 320 Madagascar C/S C/S C/S 80 80 60 340 340 310 Malawi C/S C/S C/S 30 30 20 200 200 180 Mali C/S C/S C/S 30 40 80 230 240 350 Mauritania C/S C/S C/S C/S C/S 20 190 200 270 Moldova C/S 10 C/S 100 120 90 400 450 380 Mongolia C/S C/S C/S 20 20 70 190 190 320 Mozambique C/S C/S C/S 50 50 50 250 260 260 Myanmar C/S C/S C/S 50 20 30 300 240 270 Nepal C/S C/S C/S C/S 10 C/S 140 180 150 Nicaragua C/S C/S C/S 20 20 50 170 160 240 Niger 70 80 110 230 230 300 690 700 860

SUMMARY 2: HPV Vaccination
Page 51 of 72
Table 9. Sensitivity analysis: incremental cost effectiveness ratios (ICERs, discounted $/DALY averted) for a one-year program (2011) of HPV16/18 vaccination at 70% coverage of 9-year-old girls, at various costs per vaccinated girl and under various estimates of HPV16/18 proportion in cancer, for 72 GAVI-eligible countries * (cont.)
Country I$5 per vaccinated girl I$10 per vaccinated girl I$25 per vaccinated girl
Regional estimate
70% estimate
Country-specific estimate
Regional estimate
70% estimate
Country-specific estimate
Regional estimate
70% estimate
Country-specific estimate
Nigeria C/S C/S C/S 30 30 30 300 310 310 Pakistan C/S C/S C/S 40 80 30 300 390 260 Papua New Guinea 30 10 10 140 100 90 460 380 350 Rwanda C/S C/S C/S 40 50 30 260 260 230 Sao Thome C/S C/S 10 70 70 150 350 350 550 Senegal C/S C/S C/S C/S C/S 80 200 210 420 Sierra Leone C/S C/S C/S 60 60 90 270 280 350 Solomon Islands 50 30 30 190 150 130 590 490 450 Somalia 40 40 30 180 180 160 600 610 550 Sri Lanka 130 90 80 340 280 240 990 830 740 Sudan 270 270 280 680 690 710 1,910 1,930 1,980 Tajikistan 150 150 130 390 390 340 1,100 1,100 990 Tanzania C/S C/S C/S C/S C/S C/S 160 170 140 The Gambia C/S C/S C/S 20 20 50 220 220 290 Timor Leste 110 80 90 270 220 240 750 630 690 Togo C/S C/S 0 70 70 110 320 330 410 Uganda C/S C/S C/S 10 10 10 180 190 170 Ukraine C/S C/S C/S 50 70 50 360 410 340 Uzbekistan 80 80 60 260 260 220 800 800 720 Viet Nam 90 60 80 260 210 240 780 650 710 Yemen 740 770 810 1,640 1,690 1,770 4,340 4,460 4,650 Zambia C/S C/S C/S 20 20 10 220 230 200 Zimbabwe C/S C/S C/S C/S C/S C/S 110 110 90
* Our base case (70% coverage of 9-year-old girls) utilizes regional estimates for the proportion of 16/18 in cancer.

SUMMARY 2: HPV Vaccination
Page 52 of 72
Table 10. Sensitivity analysis: incremental cost effectiveness ratios (ICERs, discounted $/YLS) for a one-year program (2011) of HPV16/18 vaccination at 70% coverage of 9-year-old girls, at various costs per vaccinated girl and under various estimates of HPV16/18 proportion in cancer, for 72 GAVI-eligible countries *
Country I$5 per vaccinated girl I$10 per vaccinated girl I$25 per vaccinated girl
Regional estimate
70% estimate
Country-specific estimate
Regional estimate
70% estimate
Country-specific estimate
Regional estimate
70% estimate
Country-specific estimate
Afghanistan 260 330 310 620 770 730 1,720 2,090 2,000 Angola C/S C/S C/S C/S C/S 10 220 220 430 Armenia C/S C/S C/S 70 70 50 410 410 340 Azerbaijan 20 20 C/S 210 210 160 780 780 660 Bangladesh C/S C/S C/S C/S 20 20 180 240 230 Benin C/S C/S C/S 10 10 10 210 220 230 Bhutan C/S C/S C/S C/S 10 C/S 220 300 250 Bolivia C/S C/S C/S C/S C/S 90 180 180 420 Burkina Faso C/S C/S C/S 60 60 100 320 330 420 Burundi C/S C/S C/S 30 40 30 190 200 180 Cambodia 10 C/S 0 100 70 80 360 290 330 Cameroon C/S C/S C/S 60 60 160 420 420 670 Central African Rep. 80 80 150 250 250 390 760 770 1,130 Chad 10 10 80 160 170 300 620 630 950 Comoros C/S C/S C/S 0 0 C/S 140 150 130 Congo, Dem. Rep. 70 70 120 190 190 290 550 550 800 Congo, Republic of C/S C/S C/S 50 50 130 350 350 560 Cote d'Ivoire C/S C/S C/S C/S C/S C/S 260 270 380 Cuba C/S C/S C/S 50 50 60 280 270 300 Djibouti 60 60 40 250 260 230 840 850 770 Eritrea 110 110 90 300 300 270 880 890 810 Ethiopia 60 60 40 220 220 160 680 690 550 Georgia 70 70 40 270 270 220 860 860 740 Ghana C/S C/S C/S 0 0 30 190 190 260

SUMMARY 2: HPV Vaccination
Page 53 of 72
Table 10. Sensitivity analysis: incremental cost effectiveness ratios (ICERs, discounted $/YLS) for a one-year program (2011) of HPV16/18 vaccination at 70% coverage of 9-year-old girls, at various costs per vaccinated girl and under various estimates of HPV16/18 proportion in cancer, for 72 GAVI-eligible countries * (cont.)
Country I$5 per vaccinated girl I$10 per vaccinated girl I$25 per vaccinated girl
Regional estimate
70% estimate
Country-specific estimate
Regional estimate
70% estimate
Country-specific estimate
Regional estimate
70% estimate
Country-specific estimate
Guinea C/S C/S C/S C/S C/S 10 110 110 190 Guinea-Bissau C/S C/S C/S 50 60 90 300 310 400 Guyana C/S C/S C/S 70 70 90 320 310 360 Haiti 120 120 150 330 320 380 960 940 1,090 Honduras C/S C/S C/S C/S C/S 20 160 150 210 India C/S C/S C/S C/S 20 0 190 250 210 Indonesia 100 70 60 280 230 210 840 700 650 Kenya C/S C/S 10 110 120 150 480 490 570 Kiribati 170 130 120 430 350 320 1,200 1,010 940 Korea, Dem. Rep. 140 140 130 390 390 380 1,130 1,140 1,110 Kyrgyzstan 0 0 C/S 100 100 80 400 400 350 Lao PDR 40 20 10 160 120 100 510 420 370 Lesotho 0 0 20 130 130 160 500 510 590 Liberia C/S C/S 10 60 60 90 250 260 330 Madagascar C/S C/S C/S 80 80 70 350 350 320 Malawi C/S C/S C/S 30 30 20 200 210 180 Mali C/S C/S C/S 40 40 80 240 240 360 Mauritania C/S C/S C/S C/S C/S 20 200 200 280 Moldova C/S 10 C/S 100 120 90 410 460 390 Mongolia C/S C/S C/S 20 20 80 200 200 330 Mozambique C/S C/S C/S 50 50 60 260 260 270 Myanmar C/S C/S C/S 50 20 30 310 240 280 Nepal C/S C/S C/S C/S 10 C/S 140 190 160 Nicaragua C/S C/S C/S 20 20 50 170 170 250 Niger 80 80 110 240 240 310 720 720 890

SUMMARY 2: HPV Vaccination
Page 54 of 72
Table 10. Sensitivity analysis: incremental cost effectiveness ratios (ICERs, discounted $/YLS) for a one-year program (2011) of HPV16/18 vaccination at 70% coverage of 9-year-old girls, at various costs per vaccinated girl and under various estimates of HPV16/18 proportion in cancer, for 72 GAVI-eligible countries * (cont.)
Country I$5 per vaccinated girl I$10 per vaccinated girl I$25 per vaccinated girl
Regional estimate
70% estimate
Country-specific estimate
Regional estimate
70% estimate
Country-specific estimate
Regional estimate
70% estimate
Country-specific estimate
Nigeria C/S C/S C/S 30 30 30 310 320 320 Pakistan C/S C/S C/S 40 80 30 310 410 270 Papua New Guinea 30 10 10 140 110 100 470 390 360 Rwanda C/S C/S C/S 50 50 40 270 270 240 Sao Thome C/S C/S 10 70 70 150 360 360 570 Senegal C/S C/S C/S C/S C/S 90 210 210 430 Sierra Leone C/S C/S C/S 60 60 90 280 290 370 Solomon Islands 50 30 30 190 150 140 600 500 460 Somalia 40 40 30 180 190 160 620 630 570 Sri Lanka 130 100 80 350 290 250 1,020 850 760 Sudan 280 280 290 700 710 730 1,980 2,000 2,050 Tajikistan 150 150 130 400 400 350 1,130 1,130 1,020 Tanzania C/S C/S C/S C/S C/S C/S 170 170 150 The Gambia C/S C/S C/S 20 30 50 220 230 300 Timor Leste 110 80 100 270 220 250 770 650 710 Togo C/S C/S 0 70 70 110 330 340 430 Uganda C/S C/S C/S 10 10 10 190 190 180 Ukraine C/S C/S C/S 50 80 50 370 420 350 Uzbekistan 80 80 60 270 270 230 830 830 740 Viet Nam 90 70 80 270 220 240 800 670 730 Yemen 770 800 840 1,700 1,750 1,830 4,490 4,620 4,820 Zambia C/S C/S C/S 20 20 10 230 230 210 Zimbabwe C/S C/S C/S C/S C/S C/S 110 120 90
* Our base case (70% coverage of 9-year-old girls) utilizes regional estimates for the proportion of 16/18 in cancer.

SUMMARY 2: HPV Vaccination
Page 55 of 72
Table 11. Sensitivity analysis: incremental cost-effectiveness ratios (ICERs, discounted $/DALY averted) for a 1-year program (2011) of HPV16/18 vaccination at 70% coverage of 9-year-old girls, 72 GAVI-eligible countries, at various costs per vaccinated girl and under various assumptions regarding cancer costs *
1 year (2011) at 70% coverage of 9-year-old girls
1 year (2011) at 70% coverage of 9-year-old girls (cancer costs at 50%)
Country I$5 per vaccinated girl
I$10 per vaccinated girl
I$25 per vaccinated girl
I$5 per vaccinated girl
I$10 per vaccinated girl
I$25 per vaccinated girl
Afghanistan 250 600 1,670 300 660 1,720 Angola C/S C/S 210 C/S 60 340 Armenia C/S 70 400 40 140 470 Azerbaijan 20 200 760 100 290 840 Bangladesh C/S C/S 170 C/S 60 230 Benin C/S 10 210 0 70 270 Bhutan C/S C/S 210 C/S 70 300 Bolivia C/S C/S 180 C/S 60 240 Burkina Faso C/S 60 310 30 110 360 Burundi C/S 30 190 20 70 220 Cambodia 10 90 350 50 130 390 Cameroon C/S 60 400 30 140 490 Central African Republic 70 240 730 120 280 780 Chad 10 160 600 80 230 670 Comoros C/S 0 140 0 50 190 Congo, Democratic Republic 60 180 530 90 210 550 Congo, Republic of C/S 50 340 20 120 410 Cote d'Ivoire C/S C/S 250 C/S 70 400 Cuba C/S 50 270 30 100 320 Djibouti 60 250 810 120 310 880 Eritrea 100 290 850 140 330 890 Ethiopia 60 210 660 100 250 700 Georgia 60 260 840 130 320 900 Ghana C/S 0 180 0 60 240 Guinea C/S C/S 110 C/S 30 160

SUMMARY 2: HPV Vaccination
Page 56 of 72
Table 11. Incremental cost-effectiveness ratios (ICERs, discounted $/DALY averted) for a 1-year program (2011) of HPV16/18 vaccination at 70% coverage of 9-year-old girls, 72 GAVI-eligible countries, at various costs per vaccinated girl and under various assumptions regarding cancer costs * (cont.)
1 year (2011) at 70% coverage of 9-year-old girls
1 year (2011) at 70% coverage of 9-year-old girls (cancer costs at 50%)
Country I$5 per vaccinated girl
I$10 per vaccinated girl
I$25 per vaccinated girl
I$5 per vaccinated girl
I$10 per vaccinated girl
I$25 per vaccinated girl
Guinea-Bissau C/S 50 300 30 110 350 Guyana C/S 70 310 30 110 350 Haiti 120 320 930 160 360 970 Honduras C/S C/S 160 C/S 50 210 India C/S C/S 180 C/S 60 250 Indonesia 100 280 810 140 320 860 Kenya C/S 110 470 60 170 530 Kiribati 160 420 1,170 210 460 1,210 Korea, Democratic Republic 130 380 1,100 190 430 1,160 Kyrgyzstan 0 100 390 50 150 440 Lao PDR 40 150 490 80 190 530 Lesotho 0 120 480 60 180 540 Liberia C/S 60 250 30 90 280 Madagascar C/S 80 340 40 130 390 Malawi C/S 30 200 10 70 240 Mali C/S 30 230 20 80 280 Mauritania C/S C/S 190 C/S 60 270 Moldova C/S 100 400 50 150 450 Mongolia C/S 20 190 10 70 240 Mozambique C/S 50 250 20 90 300 Myanmar C/S 50 300 20 110 360 Nepal C/S C/S 140 C/S 40 190 Nicaragua C/S 20 170 10 60 210 Niger 70 230 690 110 270 730 Nigeria C/S 30 300 10 110 380

SUMMARY 2: HPV Vaccination
Page 57 of 72
Table 11. Incremental cost-effectiveness ratios (ICERs, discounted $/DALY averted) for a 1-year program (2011) of HPV16/18 vaccination at 70% coverage of 9-year-old girls, 72 GAVI-eligible countries, at various costs per vaccinated girl and under various assumptions regarding cancer costs * (cont.)
1 year (2011) at 70% coverage of 9-year-old girls
1 year (2011) at 70% coverage of 9-year-old girls (cancer costs at 50%)
Country I$5 per vaccinated girl
I$10 per vaccinated girl
I$25 per vaccinated girl
I$5 per vaccinated girl
I$10 per vaccinated girl
I$25 per vaccinated girl
Pakistan C/S 40 300 20 110 370 Papua New Guinea 30 140 460 70 180 500 Rwanda C/S 40 260 20 90 310 Sao Thome C/S 70 350 30 130 410 Senegal C/S C/S 200 C/S 70 270 Sierra Leone C/S 60 270 30 100 320 Solomon Islands 50 190 590 90 230 630 Somalia 40 180 600 90 230 650 Sri Lanka 130 340 990 170 390 1,030 Sudan 270 680 1,910 340 750 1,980 Tajikistan 150 390 1,100 190 430 1,140 Tanzania C/S C/S 160 C/S 50 220 The Gambia C/S 20 220 10 80 270 Timor Leste 110 270 750 130 290 780 Togo C/S 70 320 30 120 370 Uganda C/S 10 180 10 60 240 Ukraine C/S 50 360 30 130 440 Uzbekistan 80 260 800 130 310 860 Viet Nam 90 260 780 130 300 820 Yemen 740 1,640 4,340 820 1,720 4,410 Zambia C/S 20 220 10 80 280 Zimbabwe C/S C/S 110 C/S 30 190
* Our base case (70% coverage of 9-year-old girls) utilizes regional estimates for the proportion of 16/18 in cancer.

SUMMARY 2: HPV Vaccination
Page 58 of 72
Table 12. Incremental cost-effectiveness ratios (ICERs, discounted $/YLS) for a 1-year program (2011) of HPV16/18 vaccination at 70% coverage of 9-year-old girls, 72 GAVI-eligible countries, at various costs per vaccinated girl and under various assumptions regarding cancer costs *
1 year (2011) at 70% coverage of 9-year-old girls
1 year (2011) at 70% coverage of 9-year-old girls (cancer costs at 50%)
Country I$5 per vaccinated girl
I$10 per vaccinated girl
I$25 per vaccinated girl
I$5 per vaccinated girl
I$10 per vaccinated girl
I$25 per vaccinated girl
Afghanistan 260 620 1,720 310 680 1,780 Angola C/S C/S 220 C/S 60 360 Armenia C/S 70 410 40 150 490 Azerbaijan 20 210 780 110 300 860 Bangladesh C/S C/S 180 C/S 60 240 Benin C/S 10 210 0 70 280 Bhutan C/S C/S 220 C/S 70 310 Bolivia C/S C/S 180 C/S 60 250 Burkina Faso C/S 60 320 30 120 370 Burundi C/S 30 190 20 70 230 Cambodia 10 100 360 50 140 400 Cameroon C/S 60 420 30 150 510 Central African Republic 80 250 760 120 290 810 Chad 10 160 620 80 240 690 Comoros C/S 0 140 0 50 190 Congo, Democratic Republic 70 190 550 90 210 570 Congo, Republic of C/S 50 350 20 120 420 Cote d'Ivoire C/S C/S 260 C/S 70 410 Cuba C/S 50 280 30 100 330 Djibouti 60 250 840 130 320 910 Eritrea 110 300 880 150 340 920 Ethiopia 60 220 680 110 260 730 Georgia 70 270 860 130 330 930 Ghana C/S 0 190 0 60 250 Guinea C/S C/S 110 C/S 30 160

SUMMARY 2: HPV Vaccination
Page 59 of 72
Table 12. Incremental cost-effectiveness ratios (ICERs, discounted $/YLS) for a 1-year program (2011) of HPV16/18 vaccination at 70% coverage of 9-year-old girls, 72 GAVI-eligible countries, at various costs per vaccinated girl and under various assumptions regarding cancer costs * (cont.)
1 year (2011) at 70% coverage of 9-year-old girls
1 year (2011) at 70% coverage of 9-year-old girls (cancer costs at 50%)
Country I$5 per vaccinated girl
I$10 per vaccinated girl
I$25 per vaccinated girl
I$5 per vaccinated girl
I$10 per vaccinated girl
I$25 per vaccinated girl
Guinea-Bissau C/S 50 300 30 110 360 Guyana C/S 70 320 30 120 360 Haiti 120 330 960 170 380 1,000 Honduras C/S C/S 160 C/S 50 220 India C/S C/S 190 C/S 60 260 Indonesia 100 280 840 140 330 880 Kenya C/S 110 480 60 180 550 Kiribati 170 430 1,200 210 470 1,250 Korea, Democratic Republic 140 390 1,130 190 440 1,190 Kyrgyzstan 0 100 400 50 150 450 Lao PDR 40 160 510 80 200 550 Lesotho 0 130 500 60 190 560 Liberia C/S 60 250 30 90 290 Madagascar C/S 80 350 40 130 400 Malawi C/S 30 200 20 70 250 Mali C/S 40 240 20 90 290 Mauritania C/S C/S 200 C/S 70 280 Moldova C/S 100 410 50 150 460 Mongolia C/S 20 200 10 70 250 Mozambique C/S 50 260 30 100 300 Myanmar C/S 50 310 20 110 370 Nepal C/S C/S 140 C/S 40 200 Nicaragua C/S 20 170 10 60 220 Niger 80 240 720 120 280 760 Nigeria C/S 30 310 10 110 400

SUMMARY 2: HPV Vaccination
Page 60 of 72
Table 12. Incremental cost-effectiveness ratios (ICERs, discounted $/YLS) for a 1-year program (2011) of HPV16/18 vaccination at 70% coverage of 9-year-old girls, 72 GAVI-eligible countries, at various costs per vaccinated girl and under various assumptions regarding cancer costs * (cont.)
1 year (2011) at 70% coverage of 9-year-old girls
1 year (2011) at 70% coverage of 9-year-old girls (cancer costs at 50%)
Country I$5 per vaccinated girl
I$10 per vaccinated girl
I$25 per vaccinated girl
I$5 per vaccinated girl
I$10 per vaccinated girl
I$25 per vaccinated girl
Pakistan C/S 40 310 20 110 380 Papua New Guinea 30 140 470 70 180 510 Rwanda C/S 50 270 20 100 320 Sao Thome C/S 70 360 30 130 420 Senegal C/S C/S 210 C/S 70 280 Sierra Leone C/S 60 280 30 100 330 Solomon Islands 50 190 600 100 230 650 Somalia 40 180 620 90 240 670 Sri Lanka 130 350 1,020 180 400 1,070 Sudan 280 700 1,980 350 780 2,050 Tajikistan 150 400 1,130 200 440 1,180 Tanzania C/S C/S 170 C/S 60 230 The Gambia C/S 20 220 10 80 280 Timor Leste 110 270 770 140 300 800 Togo C/S 70 330 40 120 380 Uganda C/S 10 190 10 70 240 Ukraine C/S 50 370 30 130 450 Uzbekistan 80 270 830 130 320 880 Viet Nam 90 270 800 130 310 840 Yemen 770 1,700 4,490 850 1,780 4,570 Zambia C/S 20 230 10 80 290 Zimbabwe C/S C/S 110 C/S 30 200
* Our base case (70% coverage of 9-year-old girls) utilizes regional estimates for the proportion of 16/18 in cancer.
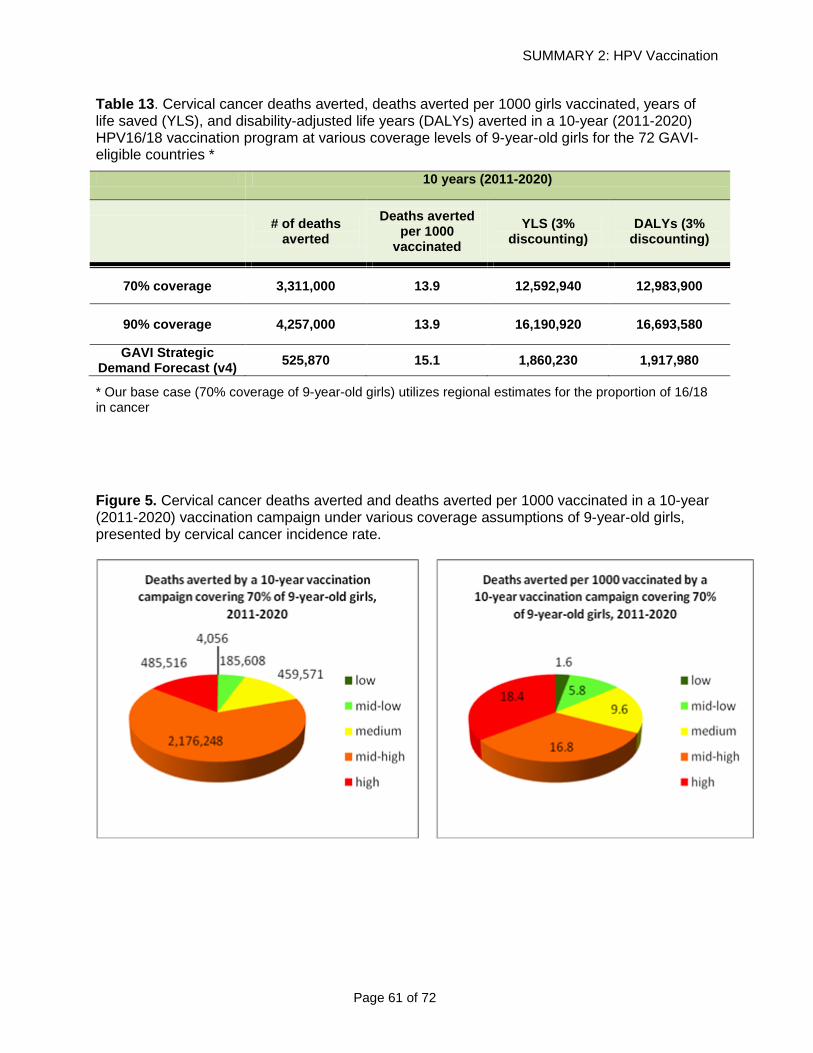
SUMMARY 2: HPV Vaccination
Page 61 of 72
Table 13. Cervical cancer deaths averted, deaths averted per 1000 girls vaccinated, years of life saved (YLS), and disability-adjusted life years (DALYs) averted in a 10-year (2011-2020) HPV16/18 vaccination program at various coverage levels of 9-year-old girls for the 72 GAVI-eligible countries *
10 years (2011-2020)
# of deaths
averted Deaths averted
per 1000 vaccinated
YLS (3% discounting)
DALYs (3% discounting)
70% coverage 3,311,000 13.9 12,592,940 12,983,900
90% coverage 4,257,000 13.9 16,190,920 16,693,580
GAVI Strategic Demand Forecast (v4) 525,870 15.1 1,860,230 1,917,980
* Our base case (70% coverage of 9-year-old girls) utilizes regional estimates for the proportion of 16/18 in cancer
Figure 5. Cervical cancer deaths averted and deaths averted per 1000 vaccinated in a 10-year (2011-2020) vaccination campaign under various coverage assumptions of 9-year-old girls, presented by cervical cancer incidence rate.

SUMMARY 2: HPV Vaccination
Page 62 of 72
Figure 6. Cervical cancer deaths averted and deaths averted per 1000 vaccinated in a 10-year (2011-2020) vaccination campaign under various coverage assumptions of 9-year-old girls, presented by geographical region.
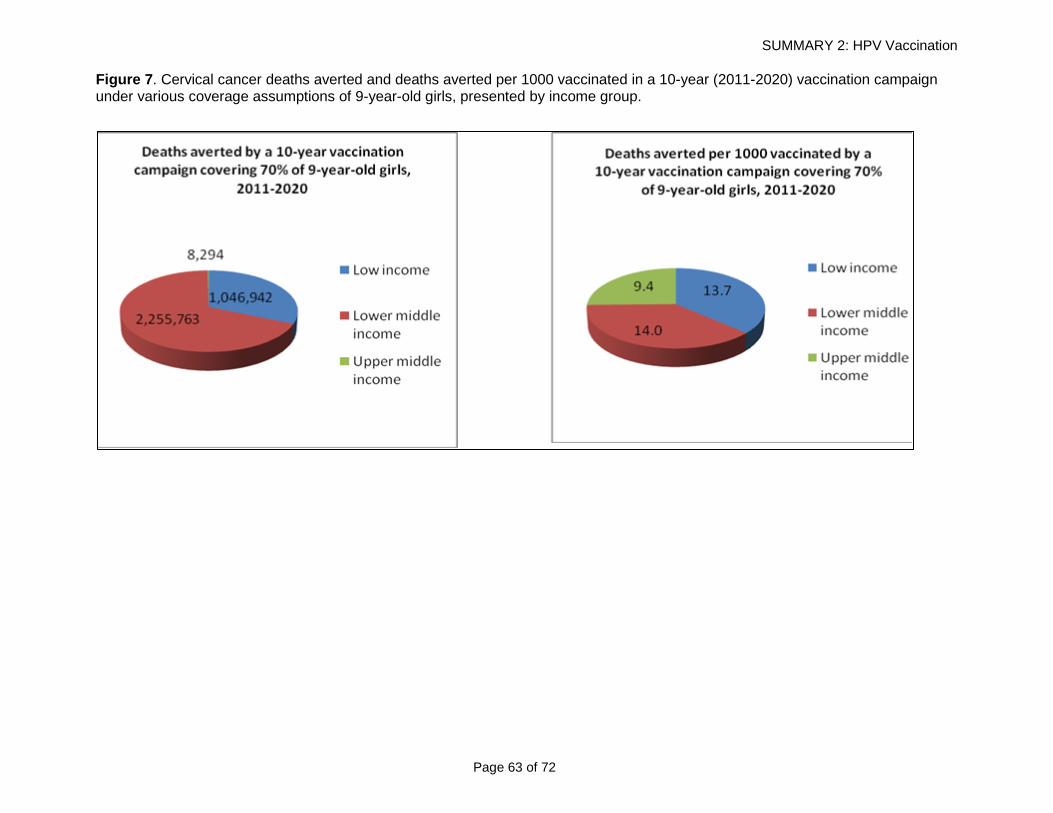
SUMMARY 2: HPV Vaccination
Page 63 of 72
Figure 7. Cervical cancer deaths averted and deaths averted per 1000 vaccinated in a 10-year (2011-2020) vaccination campaign under various coverage assumptions of 9-year-old girls, presented by income group.

SUMMARY 2: HPV Vaccination
Page 64 of 72
V. REFERENCES
Acharya A, Diaz-Ortega JL, Tambini G, de Quadros C, Arita I. Cost-effectiveness of measles elimination in Latin America and the Caribbean: a prospective analysis. Vaccine. 2002;20(27-28):3332-41.
Campos NG, Kim JJ, Castle PE, Ortendahl J, O’Shea M, Diaz M, Goldie SJ. Health and economic impact of HPV 16/18 vaccination and cervical cancer screening in Eastern Africa. Int J Cancer. 2011. doi: 10.1002/ijc.26269.
Curado MP, Edwards B, Shin HR, Storm H, Ferlay J, Heanue M, Boyle P, eds. Cancer incidence in five continents, Vol. IX. IARC Scientific Publications No. 160. Lyon, IARC:2007.
de Sanjose S, Quint WG, Alemany L, Geraets DT, Klaustermeier JE, Lloveras B, Tous S, Felix A, Bravo LE, Shin HR, Vallejos CS, de Ruiz PA, Lima MA, Guimera N, Clavero O, Alejo M, Llombart-Bosch A, Cheng-Yang C, Tatti SA, Kasamatsu E, Iljazovic E, Odida M, Prado R, Seoud M, Grce M, Usubutun A, Jain A, Suarez GA, Lombardi LE, Banjo A, Menéndez C, Domingo EJ, Velasco J, Nessa A, Chichareon SC, Qiao YL, Lerma E, Garland SM, Sasagawa T, Ferrera A, Hammouda D, Mariani L, Pelayo A, Steiner I, Oliva E, Meijer CJ, Al-Jassar WF, Cruz E, Wright TC, Puras A, Llave CL, Tzardi M, Agorastos T, Garcia-Barriola V, Clavel C, Ordi J, Andújar M, Castellsagué X, Sánchez GI, Nowakowski AM, Bornstein J, Muñoz N, Bosch FX; on behalf of the Retrospective International Survey and HPV Time Trends Study Group. Human papillomavirus genotype attribution in invasive cervical cancer: a retrospective cross-sectional worldwide study. Lancet Oncol. 2010 Nov;11(11):1048-56.
Diaz M, de Sanjose S, Ortendahl J, O’Shea M, Goldie SJ, Bosch FX, Kim JJ. Cost-effectiveness of human papillomavirus vaccination and screening in Spain. Eur J Cancer. 2010;46(16);2973-85.
Diaz M, Kim JJ, Albero G, de Sanjosé S, Clifford G, Bosch FX, Goldie SJ. Health and economic impact of HPV 16 and 18 vaccination and cervical cancer screening in India. Br J Cancer. 2008;99(2):230-8.
Disease Control Priorities Project (DCPP). Chapter 20. Vaccine Preventable Diseases. Available online at http://www.dcp2.org/pubs/DCP/20/Section/2684 (Last accessed March 16, 2008).
Drummond MF, Sculpher MJ, Torrance GW, O’Brien BJ, Stoddart GL, editors. Methods for the economic evaluation of health care programs. 3rd edition New York, NY: Oxford University Press; 2005.
Ferlay J, Bray F, Pisani P, Parkin DM. GLOBOCAN2002. Cancer incidence, mortality and prevalence worldwide. IARC Cancer BaseNo. 5 Version 2.0. Lyon, France: IARC Press; 2004.
Ferlay J, Shin HR, Bray F, Forman D, Mathers C, Parkin DM. GLOBOCAN 2008, Cancer incidence and mortality worldwide. IARC CancerBase No. 10 [Internet]. Lyon, France: IARC; 2010. Available online at http://globocan.iarc.fr (Last accessed July 25, 2011).
GAVI Alliance. Countries eligible for support. Available online at http://www.gavialliance.org/support/apply/countries-eligible-for-support/ (Last accessed July 27, 2011).

SUMMARY 2: HPV Vaccination
Page 65 of 72
Gold MR, Siegel JE, Russell LB, Weinstein MC, editors. Cost-effectiveness in health and medicine. New York, NY: Oxford University Press; 1996.
Goldhaber-Fiebert JD, Goldie SJ. Estimating the cost of cervical cancer screening in five developing countries. Cost Eff Resour Alloc. 2006;4:13.
Goldie SJ, Diaz M, Constenla D, Alvis N, Andrus JK, Kim SY. Mathematical models of cervical cancer prevention in Latin America and the Caribbean. Vaccine. 2008;26(S11):L59-72.
Goldie SJ, Diaz M, Kim SY, Levin CE, Minh HV, Kim JJ. Mathematical models of cervical cancer prevention in the Asia Pacific region. Vaccine. 2008;26(S12):M17-29.
Goldie SJ, Gaffikin L, Goldhaber-Fiebert JD, Gordillo-Tobar A, Levin C, Wright TC, et al. Cost-effectiveness of cervical cancer screening in five developing countries. N Engl J Med. 2005;353(20):2158–68.
Goldie SJ, Kim JJ, Kobus K, Goldhaber-Fiebert JD, Salomon J, O’Shea MKH, Bosch FX, de Sanjose S, Franco EL. Cost-effectiveness of HPV 16, 18 vaccination in Brazil. Vaccine. 2007;25:6257-70.
Goldie SJ, O'Shea MK, Campos NG, Diaz M, Sweet SJ, Kim SY. Health and economic outcomes of HPV 16,18 vaccination in 72 GAVI-eligible countries. Vaccine. 2008;26(32):4080-93
Kim JJ, Andres-Beck B, Goldie SJ. The value of including boys in an HPV vaccination programme: a cost-effectiveness analysis in a low-resource setting. Br J Cancer 2007;97(9):1322–8.
Kim JJ, Kobus KE, Diaz M, O'Shea M, Van Minh H, Goldie SJ. Exploring the cost-effectiveness of HPV vaccination in Vietnam: insights for evidence-based cervical cancer prevention policy. Vaccine. 2008;26(32):4015-24.
Kim JJ, Kuntz KM, Stout NK, Mahmud S, Villa LL, Franco EL, et al. Multi-parameter calibration of a natural history model of cervical cancer. Am J Epidemiol 2007;166:137–50.
Kim SY, Sweet S, Chang J, Goldie SJ. Comparative evaluation of the potential impact of rotavirus versus HPV vaccination in GAVI-eligible countries: a preliminary analysis focused on the relative disease burden. BMC Infect Dis. 2011;11:174.
Kou U. Guidelines for estimating costs of introducing vaccines into the national immunization system. Department of Vaccines and Biologicals. Geneva: World Health Organization; 2002. Available online at http://whqlibdoc.who.int/hq/2002/WHO_V&B_02.11.pdf (Last accessed April 1, 2008).
Murray CJL, Lopez AD. Estimating causes of death: new methods and global and regional applications for 1990. In The Global Burden of Disease, ed. C.J.L. Murray and A.D. Lopez, 117-200.Vol. 1 of Global Burden of Disease and Injury Series. Cambridge, MA: Harvard University Press. 1996.
Parkin DM, Ferlay J, Hamdi-Chérif M, Sitas F, Thomas JO, Wabinga H, Whelan SL (eds), Cancer in Africa Epidemiology and Prevention. IARC Scientific Publications No. 153. Lyon, IARC, 2003.

SUMMARY 2: HPV Vaccination
Page 66 of 72
Parkin DM, Whelan SL, Ferlay J, Storm H, eds. Cancer incidence in five continents, vol. I–VIII. IARC CancerBase No. 7. Lyon; 2005.
Sharma M, Ortendahl J, van der Ham E, Sy S, Kim JJ. Cost-effectiveness of human papillomavirus vaccination and cervical cancer screening in Thailand. BJOG. 2012;119(2):166-76. doi: 10.1111/j.1471-0528.2011.02974.x.
Smith JS, Lindsay L, Hoots B, Keys J, Franceschi S, Winer R, Clifford GM. Human papillomavirus type distribution in invasive cervical cancer and high-grade cervical lesions: A meta-analysis update. Int J Cancer. 2007;121:621–32.
United Nations (UN), Department of Economic and Social Affairs, Population Division. World Population Prospects: The 2008 Revision. CD-ROM Edition - Extended Dataset (United Nations publications, Sales No. E.05.XIII.12). 2009.
United Nations (UN), Department of Economic and Social Affairs, Population Division. World Population Prospects: The 2004 Revision. CD-ROM Edition - Extended Dataset. United Nations publications, Sales No. E.05.XIII.12. 2005.
United Nations. Member states. Available online at http://www.un.org/en/members/index.shtml (Last accessed July 27, 2011).
Walker D, Mosqueira NR, Penny ME, Lanata CF, Clark AD, Sanderson CF, Fox-Rushby JA. Variation in the costs of delivering routine immunization services in Peru. Bull World Health Organ. 2004;82(9):676-82
Wolfson LJ, Gasse F, Lee-Martin SP, Lydon P, Magan A, Tibouti A, Johns B, Hutubessy R, Salama P, Okwo-Bele JM. Estimating the costs of achieving the WHO–UNICEF Global Immunization Vision and Strategy, 2006–2015. Bull World Health Organ. 2008;86:27–39.
World Bank. Country and lending groups. Available online at http://data.worldbank.org/about/country-classifications/country-and-lending-groups (Last accessed July 27, 2011).
World Bank World Development Indicators, WDI Online. Available online at http://data.worldbank.org/indicator (Last accessed January 24, 2008).
World Facts. Facts about Seychelles. Available at: http://worldfacts.us/Seychelles.htm (Last accessed August 1, 2011).
World Health Organization (WHO). Life tables for WHO member states; 2004. Previously available at http://www.who.int/whosis/database/life tables/life tables.cfm (Last accessed January 29, 2008).
World Health Organization (WHO). Life tables for WHO member states: 2009. Available online at: http://www.who.int/healthinfo/statistics/mortality_life_tables/en/ (Last accessed July 26, 2011).

SUMMARY 2: HPV Vaccination
Page 67 of 72
World Health Organization. Monitoring vaccine wastage at country level. 2005. Available at whqlibdoc.who.int/hq/2005/WHO_V&B_03.18.Rev.1_eng.pdf. (Last accessed July 26, 2011)
World Health Organization. http://www.who.int/vaccines-documents/DocsPDF05/www811.pdf. (Last accessed 17 April 2008).
World Health Organization (WHO) Statistical Information System: CHOICE (CHOosing Interventions that are Cost Effective). Available online at http://www.who.int/choice/en/ (Last accessed February 12, 2008).
SUMMARY 2: HPV Vaccination
Page 68 of 72
VI. APPENDIX
APPROXIMATION OF COSTS
Overview
Since the country-specific programmatic costs to deliver the HPV vaccine to a young adolescent age
group are not yet known, we use a composite value defined as the ‘cost per vaccinated girl’, which we
assume includes the vaccine cost per dose multiplied by the three required doses, wastage of vaccine
and supplies, freight and supplies, administration, immunization support and programmatic costs
(Acharya 2002, Kou 2002, Walker 2004, Wolfson 2008, WHO CHOICE, WHO 2005). As described in
previously published manuscripts (Goldie 2008a,b,c), we distinguish costs dependent on vaccine price
(e.g., vaccine wastage, insurance and security fees associated with freight into the country) from those
that would theoretically be independent and therefore fixed (e.g., supplies, administration, vaccine
support and monitoring/programmatic expenses). We do not include the incremental costs of scaling
up vaccination that might be expected after certain thresholds of coverage (e.g., 60%, 70%, 80%) are
attained, although explore a wide range of incremental costs associated with initiating a new program.
Cancer treatment costs
Other costs required for the model (e.g., cancer costs) are based on published studies and previously
described approximation methods, which leverage available data in select countries and extrapolate to
other countries based on per capita gross domestic product (GDP) and other indicators (Goldie 2008
a,b,c, Goldie 2007; Goldhaber-Fiebert 2006). We use previously documented methods to estimate
costs associated with cervical cancer (Goldie 2008 a,b,c, Goldie 2007, Goldhaber-Fiebert 2006). We
reviewed the published literature, national economic data, manufacturer prices, and unpublished
reports to produce initial cost estimates. Costs originally reported in dollars from other years were
converted to local currency units (LCUs) using year-specific exchange rates, adjusted for inflation using
country-specific inflation rates, and then converted from local currency units to International dollars
using Purchasing Power Parity (PPP) exchange rates (World Bank WDI). When data are unavailable for
country-specific cost estimates for cervical cancer treatment, we adapt primary cost data collected

SUMMARY 2: HPV Vaccination
Page 69 of 72
from countries within the same region (Goldie 2005, Goldhaber-Fiebert 2006) by scaling costs
appropriately to the new country using a relationship between hospital bed day costs and the country-
specific per capita GDP. Because the relationship between GDP and hospital bed day charges is unlikely
to be linear, the hospital inpatient day costs for each country are plotted against the natural log of the
per capita GDP for selected regions, as fully detailed by Goldie et al. (2008 a,b,c).
Vaccination costs
Since the country-specific programmatic costs to deliver the HPV vaccine to a young adolescent age
group are not yet known, we use a composite value defined as the ‘cost per vaccinated girl’, which
contains the following components:
Appendix Table 1. Components of the “cost per vaccinated girl”
Component Depends on vaccine
price
Vaccine dose (three doses) yes
Vaccine wastage yes
Immunization supplies (syringes etc.) no
Supplies wastage no
Freight into the country yes (security fees)
Administration charges no
Vaccine support (cold chain, injection safety and operational costs
such as delivery within the country)
no
Monitoring and programmatic services (incremental costs for
implementing a young adolescent vaccination program)
no
Categories directly dependent on vaccine price include vaccine wastage and freight into the country
(since this component also includes insurance and security, which tend to increase as costs of items
shipped increase). These costs are considered tradable goods and carry an international dollar price
that is independent of the country setting. These costs are converted to and from Local Currency Units

SUMMARY 2: HPV Vaccination
Page 70 of 72
using U.S. dollar direct exchange rates, since by definition, for tradable goods, 1 International Dollar is
equal to 1 U.S. dollar.
Categories less dependent on vaccine price include supplies and supplies wastage (although supply
wastage does depend on the supply price), administration, vaccine support and
monitoring/programmatic expenses. Categories such as administration, support and programmatic
components are considered non-tradable inputs (mostly salaries), and tend to vary with the level of
development (i.e., GDP) of a country; as relative salaries increase, so do the costs for these inputs
when expressed in International dollars. These costs are converted to and from Local Currency
Units using Purchasing Power Parity conversion rates. A fully detailed explanation of the methods used,
can be found in Goldie et al. (2008 a,b,c).

SUMMARY 2: HPV Vaccination
Page 71 of 72
Appendix Table 2. Country-specific cervical cancer treatment costs (2005 International $)
Country Direct medical costs - treatment cervical cancer
Stage I Stage II-IV
Afghanistan 967.53 1409.03 Angola 2807.71 3481.85 Armenia 1722.32 1953.59 Azerbaijan 1810.42 2053.53 Bangladesh 1111.47 1618.65 Benin 1381.12 1712.73 Bhutan 1665.07 2424.85 Bolivia 2163.16 1821.93 Burkina Faso 1199.68 1487.72 Burundi 713.07 884.28 Cambodia 889.51 1008.95 Cameroon 1804.90 2238.26 Central African Republic 936.72 1161.63 Chad 1403.17 1740.07 Comoros 965.93 1197.86 Congo, Democratic Republic 660.40 818.97 Congo, Repub of (Brazzaville) 1547.64 1919.23 Cote d'Ivoire 2742.38 3400.83 Cuba 1868.32 1573.60 Djibouti 1201.46 1749.70 Eritrea 922.78 1144.34 Ethiopia 919.29 1140.01 Georgia 1613.72 1830.41 Ghana 1303.25 1616.17 Guinea 1139.65 1413.29 Guinea-Bissau 1154.01 1431.09 Guyana 1660.22 1398.33 Haiti 1056.62 889.94 Honduras 1974.42 1662.97 India 1304.54 1899.80 Indonesia 1007.14 1142.38 Kenya 1401.16 1737.59 Kiribati 1141.25 1294.51 Korea, Democratic Republic 1203.14 1752.13 Kyrgyzstan 1188.97 1348.63 Lao People Dem Republic 946.17 1073.22 Lesotho 1308.64 1622.85 Liberia 700.99 869.30 Madagascar 1091.67 1353.78 Malawi 900.44 1116.64 Mali 1162.20 1441.25 Mauritania 1621.08 2010.30 Moldova 1333.11 1512.13 Mongolia 1217.15 1380.60 Mozambique 942.98 1169.40

SUMMARY 2: HPV Vaccination
Page 72 of 72
Appendix Table 2. Country-specific cervical cancer treatment costs (2005 Int $) cont.
Country Direct medical costs - treatment cervical cancer
Stage I Stage II-IV
Myanmar 1186.63 1728.09 Nepal 1103.30 1606.75 Nicaragua 1597.28 1345.32 Niger 899.74 1115.77 Nigeria 1663.45 2062.85 Pakistan 1278.16 1861.39 Papua New Guinea 1005.36 1140.36 Rwanda 1076.54 1335.03 Sao Thome 1452.43 1801.17 Senegal 1583.11 1963.23 Sierra Leone 933.23 1157.31 Solomon Islands 1060.84 1203.29 Somalia 912.69 1329.15 Sri Lanka 1062.96 1205.70 Sudan 1144.80 1667.17 Tajikistan 1132.30 1284.35 Tanzania 1216.67 1508.80 The Gambia 1268.84 1573.49 Timor Leste 698.99 792.85 Togo 1015.84 1259.75 Uganda 1104.71 1369.96 Ukraine 2048.88 2324.02 Uzbekistan 1251.17 1419.18 Viet Nam 1085.65 1231.43 Yemen 1280.44 1864.71 Zambia 1258.70 1560.92 Zimbabwe 1768.92 2193.65