healing, project summar · correlations between microdamage and microdamage healing in the...
TRANSCRIPT

Healing, Project Summar

FOREWORD
Public Law 102-240, the Intermodal Surface Transportation Efficiency Act (ISTEA) of 1991, directed the Federal Highway Administration in Section 6016 to enter into a 5-year contract research program with the Western Research Institute (WRI) of the University of Wyoming. The title of this research program is Fundamental Properties of Asphalts and Modified Asphalts, Contract No. DTFH6 1 -92-C-00 170. As part of this contract, Task K-Microdamage Healing in Asphalt and Asphalt Concrete was performed by the Texas Transportation Institute of Texas A&M University and North Carolina State University.
This report details the results of the Task K subcontract; the main body of the WRI report will be published subsequently. The results of Task K have advanced our understanding, both theoretically and in terms of measurement, of fatigue damage, especially fatigue cracking, in asphalt pavements. It explicitly and quantitatively considers the impact of healing, the regaining of pavement strength and integrity upon standing without traffic (resting), on fatigue life. This research is expected to forrn the basis of specification testing for fatigue susceptibility and the improvement of fatigue life of asphalt pavements.
7 7 6 ~ T. Pau Teng, P.E.
Director, Office of 1nfkaIphlcture Research and Development
NOTICE
This document is disseminated under the sponsorship of the Department of Transportation in the interest of information exchange. The United States Government assumes no liability for its contents or use thereof. This report does not constitute a standard, specification, or regulation.
The United States Government does not endorse products or manufacturers. Trade and manufacturers' names appear in this report only because they are considered essential to the object of the document.

7. Author(s) I 8. Performing Organization Report No.
Dallas N. Little, Robert L. Lytton, Devon Williams and C. W. Chen , Research Report 7229
Technical Report Documen~
9. Performing Organization Name and Address
Texas Transportation Institute The Texas A&M University System College Station, Texas 77843-3 135
1. Report No.
FHWA-RD-98-141
yicrodamage Heal i ng i n Asphalt and Asphalt Concrete, Volume I: Microdamage and Microdamage Healing, P r o j e c t Summary Report
I 10. Work Unit No. (TRAIS)
June 2001 6. Performing Organization Code
1 1. Contract or Grant No.
DTFH6 1 -92-C-00 1 70
2. Government Accession No.
12. Sponsoring Agency Name and Address
Western Research Institute (WRI) P.O. Box 3395 University Station Laramie, Wyoming 8207 1
3. Recipient's Catalog No.
4. Title and Subtitle
13. Type of Report and Period Covered
Final: February 1 998
5. Report Date
14. Sponsoring Agency Code
15. Supplementary Notes
Research performed in cooperation with the Federal Highway Administration. Research Project Title: Fundamental Properties of Asphalts and Modified Asphalts Task K - Microdamage Healing in Asphalt and Asphalt Concrete 16. Abstract
Volume 1 is a summary report which chronicles the research highlights of the entire study of microdamage healing in asphalt concrete. The primary objectives of the study were to: (1) Demonstrate that microdamage healing occurs and that it can be measured in the laboratory and in the field, (2) Confirm that the same fracture properties that control propagation of visible cracks control the propagation of microcracks, (3) Identify the asphalt constituents which influence microdamage and microdamage healing, (4) Establish appropriate correlations between microdamage and microdamage healing in the laboratory and in the field and (5) Predict the effect of microdamage healing on pavement performance and develop the appropriate constitutive damage models that account for the effects of microdamage healing on the performance of asphalt concrete pavement layers. Volume 1 describes the success of the project in obtaining each research objective.
17. Key Words
asphalt concrete, microcracks, microdamage healing, binders
18. Distribution Statement
No restrictions. This document is available to the public through NTIS: National Technical Information Service 5285 Port Royal Road
tio on Page
I Springfield, Virginia 22 1 6 1
DOT F 1700.7 (8-72)
19. Security Classif.(of this report)
Unclassified Reproduction of completed page authorized
20. Security Classif.(of this page)
Unclassified 2 1. No. of Pages
84 22. Price
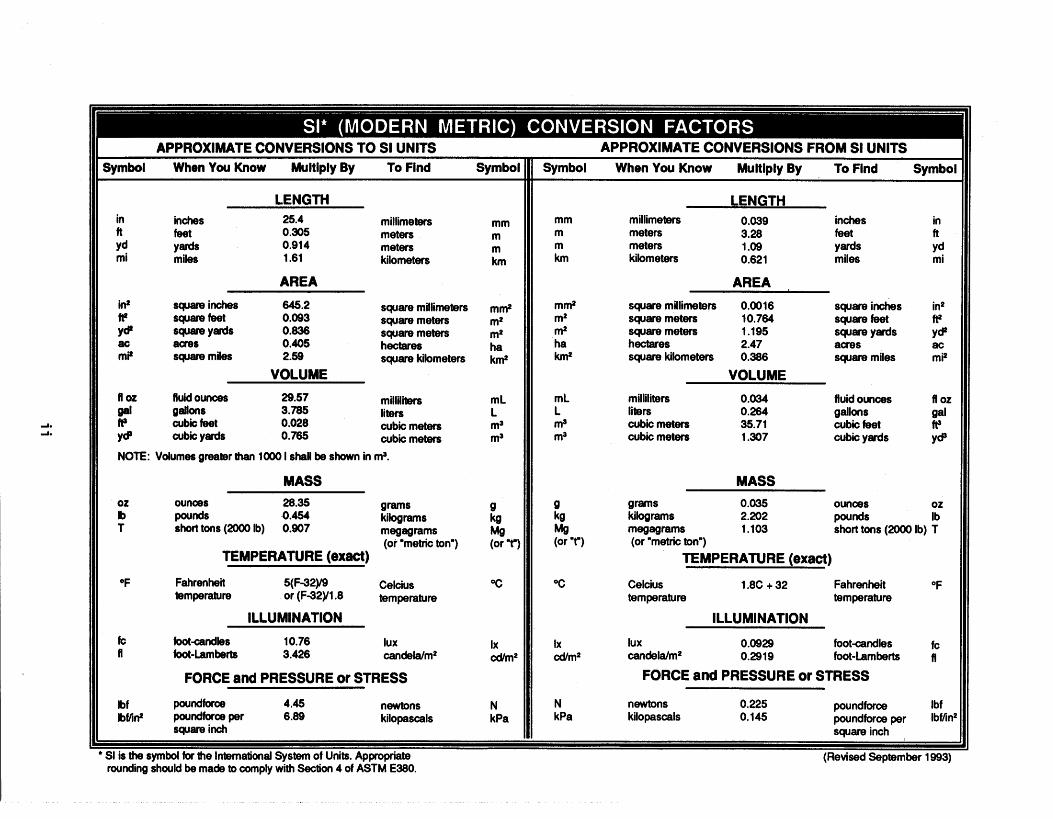
111 APPROXIMATE CONVERSIONS TO SI UNITS APPROXIMATE CONVERSIONS FROM SI UNITS
LENGTH in inches 25.4 millimeters ft feet 0.305 meters yd Y- 0.91 4 meters mi miles 1.61 kilometers
AREA
II
in2 square inches 645.2 square millimeters fP square feet 0.093 square meters Y@ Square yards 0.836 square meters ac acres 0.405 hectares mP square miles 2.59 square kilometers
VOLUME
fl oz fluid ounces 29.57 milliliters @ O ~ S 3.785 liters fta cubic feet 0.028 cubic meters Y@ cubic yards 0.765 cubic meters
NOTE: Volumes greabr than 1000 1 shall be shown in m3.
Symbol When You Know Multlply By To Find Symbol
MASS
Symbol When You Know Multiply By To Find Symbol
oz ounces 28.35 grams Ib pounds 0.454 kilograms T short tons (2000 Ib) 0.907 megagrams
(or "metric ton") TEMPERATURE (exact)
OF Fahrenheii 5(F32)/9 Celcius temperature or(F32p1.8 temperature
ILLUMINATION
fc foot-candles 10.76 lux fl foot-lam berts 3.426 candela/m2
FORCE and PRESSURE or STRESS
Ibf poundforce 4.45 newtons IbflinP ~ n d f o r ~ p e r 6.89 kilopascals
square inch
mm m m km
mm2 m2 m2 ha km2
mL L m3 m3
g kg Ms (or "t")
OC
Ix d m 2
N kPa
LENGTH millimeters 0.039 inches meters 3.28 feet meters 1.09 kilometers
yards 0.621 miles
AREA
square millimeters 0.001 6 square inches square meters 10.764 square feet square meters 1 .I95 square yards hectares 2.47 acres square kilometers 0.386 square miles
VOLUME
milliliters 0.034 fluid ounces liters 0.264 gallons cubic meters 35.71 cubic feet cubic meters 1 .307 cubic yards
MASS
grams 0.035 ounces kilograms 2.202 pounds megagrams 1 .I03 short tons (2000 Ib) T (or "metric ton")
TEMPERATURE (exact)
Celcius 1.8C + 32 Fahrenheit OF temperature temperature
ILLUMINATION
lux 0.0929 foot~andles fc candela/m2 0.2919 foot-lamberts fl
FORCE and PRESSURE or STRESS
newtons 0.225 poundforc~ Ibf kilopascals 0.145 poundforce per Ibf/in2
square inch
' SI is the symbol for the International System of Units. Appropriate rounding should be made to comply with Section 4 of ASTM E380.
(Revised ~e*mber 1 993)

TABLE OF CONTENTS
Section Page
. . . . . . . . . . . . . . . . . . . . . . . . . . . . . . . . . . . . . . . . . . . . . . . . . . . . . . . PROJECTSUMMARY 1 . . . . . . . . . . . . . . . . . . . . . . . . . . . . . . . . . . . . . . . . . . . . . . Background and Objectives 1
. . . . . . . . . . . . . . . . . . . . . Volume 1 : Microdamage Healing . Project Summary Report 1 Volume 2: Evidence of Microdamage Healing . . . . . . . . . . . . . . . . . . . . . . . . . . . . . . . . 3
. . . . . . . . . . . . . . . . . . . . . . . . . Volume 3: Micromechanics Fatigue and Healing Model 5 Volume 4: Viscoelastic Continuum Damage Fatigue Model of Asphalt Concrete with
. . . . . . . . . . . . . . . . . . . . . . . . . . . . . . . . . . . . . . . . . . . . . Microdarnage Healing 7
. . . . . . . . . . . . . . . . . . . . . . . . . . . . . . . . . . . . . . . . . . . . . . . CHAPTER 1 : INTRODUCTION 8
CHAPTER 2: BACKGROUND . . . . . . . . . . . . . . . . . . . . . . . . . . . . . . . . . . . . . . . . . . . . . . . . 9 Mechanism of Fatigue . . . . . . . . . . . . . . . . . . . . . . . . . . . . . . . . . . . . . . . . . . . . . . . . . . 9
. . . . . . . . . . . . . . . . . . . . . . . . . . . . . . . . . . . Approaches to Fatigue Analysis: General 14 Pertinent Fatigue Damage Evaluation Methods . . . . . . . . . . . . . . . . . . . . . . . . . . . . . . 14
CHAPTER 3: EVIDENCE OF HEALING IN THE LITERATURE . . . . . . . . . . . . . . . . . . . . 25 Historical Evidence of Healing in Polymers and Asphalt . . . . . . . . . . . . . . . . . . . . . . . . 25 Recent Developments in Research Affecting Fracture Healing . . . . . . . . . . . . . . . . . . 27
CHAPTER 4: PREDICTION OF FATIGUE DAMAGE AND HEALING USING WSCOELASTIC CONSTITUTIVE THEORY AND WORK POTENTIAL THEORY
. . . . . . . . . . . . . . . . . . . . . . . . . . . . . . . . . . . . . IN A CONTINUUM DAMAGE MODEL 33 Evaluation of Microdarnage Healing in Flexural Fatigue Experiments . . . . . . . . . . . . . . 33 Prediction of Fatigue Damage and Healing in Asphalt Using a Viscoelastic Constitutive and Work Potential Damage Model . . . . . . . . . . . . . . . . . . . . . . . . . . . . . . . . . . . . . . . 37
CHAPTER 5: PREDICTION OF FATIGUE DAMAGE AND HEALING USING A . . . . . . . . . . . . . . . . . . . . . . MICROMECHANICS FATIGUE AND HEALING MODEL 44
CHAPTER 6: LABORATORY AND FIELD EVIDENCE OF MICRODAMAGE HEALING . . . . . . . . . . . . . . . . . . . . . . . . . . . . . . . . . . . . . . . . . . . . . . . . . . . . . . . . . . . . . 48
. . . . . . . . . . . . . . . . . . . . . . . . . . Laboratory Evidence of Healing . The Healing Index 48 Discussion of Experimental Data Linking Mechanical Fatigue Testing of Mixtures. Chemical Compositional Measurements. and Surface Energy Density Measurements
. . . . . . . . . . . . . . . . . . . . . . . . . . . . . . . . . . . . . . . . . . . . . . . . oftheBitumensStudied 53 Field Evaluation of Test Sections at the FHWA Turner-Fairbank Highway Research Center . . . . . . . . . . . . . . . . . . . . . . . . . . . . . . . . . . . . . . . . . . . . . . . . . . . . . . . . . . . . . 62 Healing Assessment of MnRoad Section . . . . . . . . . . . . . . . . . . . . . . . . . . . . . . . . . . . . 67 US 70 in North Carolina . . . . . . . . . . . . . . . . . . . . . . . . . . . . . . . . . . . . . . . . . . . . . . . 67
iii

TABLE OF CONTENTS (continued)
Section P a s
Conclusions fiom Field Experiments . . . . . . . . . . . . . . . . . . . . . . . . . . . . . . . . . . . . . . 70
CHAPTER 7: CONCLUSIONS AND RECOMMENDATIONS . . . . . . . . . . . . . . . . . . . . . . . 71 Conclusions . . . . . . . . . . . . . . . . . . . . . . . . . . . . . . . . . . . . . . . . . . . . . . . . . . . . . . . . . 71
. . . . . . . . . . . . . . . . . . . . . . . . . . . . . . . . . . . . . . . . . . . . . . . . . . . . Recommendations 73
REFERENCES . . . . . . . . . . . . . . . . . . . . . . . . . . . . . . . . . . . . . . . . . . . . . . . . . . . . . . . . . . . . 74
Figure
LIST OF FIGURES
Page
Schematic Location of Shear and Tensile Stress Zone in the Asphalt Concrete Layer Under a Tire . . . . . . . . . . . . . . . . . . . . . . . . . . . . . . . . . . . . . . . . . . . . . . . . . . . . . . . . . 9
Schematic of Microcrack Density Due to Thermal Stresses . . . . . . . . . . . . . . . . . . . . . 10
Stress Intensity Factors as a Function of Crack Length in an Asphalt Concrete Layer . . 1 1
Sample Illustration Showing Determination of Ni From Dissipated Energy Data Experiment Conducted at 20°C . . . . . . . . . . . . . . . . . . . . . . . . . . . . . . . . . . . . . . . . . .13
Illustration of the Relationship of the Parts of the Crack Growth Process as Related to the Rate of Change of Dissipated Energy Per Load Cycle, dWIdN . . . . . . . . . . . . . . 13
Hysteretic Stress-Strain Behavior with Neghgible Damage: (a) Controlled-Stress Tests; (b) Controlled-Strain Tests . . . . . . . . . . . . . . . . . . . . . . . . . . . . . . . . . . . . . . . . . . . . . . 30
Application of CP to the Data in Figure 6: (a) Controlled-Stress Tests; (b) Controlled- StrainTest . . . . . . . . . . . . . . . . . . . . . . . . . . . . . . . . . . . . . . . . . . . . . . . . . . . . . . . . . . 30
Effect of Rest Periods on Stress-Strain Behavior (With Negligible Damage): (a) Controlled-Stress Test; (b) Controlled-Strain Test . . . . . . . . . . . . . . . . . . . . . . . . . . . . 3 1
Application of CP to the Data in Figure 8: (a) Controlled-Stress Test; (b) Controlled- Strain Test . . . . . . . . . . . . . . . . . . . . . . . . . . . . . . . . . . . . . . . . . . . . . . . . . . . . . . . . . . 32
StresdPseudo-Strain Behavior Before and After Rest Periods With Significant Damage: (a) Controlled-Stress Test; (b) Controlled-Strain Tests . . . . . . . . . . . . . . . . . . . . . . . . . 32
Flexural Stiffiess Versus Number of Cycles to Failure in Flexural Beam Fatigue Testing With and Without Rest Periods (at 20°C) . . . . . . . . . . . . . . . . . . . . . . . . . . . . . . . . . . . 34
Typical Flexural Stiffiess as a Function of Fatigue Damage and Rest Periods: (a) 20°C Healing; (b) 60°C Healing . . . . . . . . . . . . . . . . . . . . . . . . . . . . . . . . . . . . . . . . . . . . . . 34
Graphical Representation of Healing Comparison Methods . . . . . . . . . . . . . . . . . . . . . 37
StressIPseudo-Strain Behavior and Pseudo-Stiflhess Changes in: (a) Controlled-Strain Mode; (b) Controlled-Stress Mode . . . . . . . . . . . . . . . . . . . . . . . . . . . . . . . . . . . . . . . . 40

LIST OF FIGURES (continued)
Page
Change in Normalized Pseudo Stiffness as Damage Grows: (a) AAD Mixture: (b) AAM Mixture . . . . . . . . . . . . . . . . . . . . . . . . . . . . . . . . . . . . . . . . . . . . . . . . . . . . . . . . . . . . . .
Change in Pseudo Stiffness Before and After a Rest Period . . . . . . . . . . . . . . . . . . . . . 41
Change in Crack Length During Loading Cycles and Reduction of Mean Crack Length FollowingRestPeriods ................................................45
Relationship Between Dissipated PSE and Loading Cycles and the Ability of the CDM to Match the Data . . . . . . . . . . . . . . . . . . . . . . . . . . . . . . . . . . . . . . . . . . . . . . . . . . . - 4 6
Data About (Before and After) the First Rest Period Collected During the Fatigue Tests . . . . . . . . . . . Presented in Transformed Pseudo-Energy Values for Samples M/DG/21 49
Healing Index Versus Ordinal Number of Rest Periods for Asphalt Bitumens Prepared With Selected Bitumens . . . . . . . . . . . . . . . . . . . . . . . . . . . . . . . . . . . . . . . . . . . . . . . . 57
Model of the HI Versus Length of Rest Period in Terms of Short-Term Healing Rate
. . . . . . . . . . . . . . . . . . . . . . . . . . . . . . . . . . . . . . and Long-Term Healing Rate ( 4 ) 57
Relation Between the Early Healing Index Rate, h,, and the Non-Polar Surface
Energy . . . . . . . . . . . . . . . . . . . . . . . . . . . . . . . . . . . . . . . . . . . . . . . . . . . . . . . . . . . . . 60
Relation Between the Long-Term Healing Index Rate, 4, and the Polar Surface
Ener gy............................................................. 60
r, . . . . . . . . . . . . . . . . . . . . . . . . . . Empirical Relation Between h, and the Ratio - 61 r,w
Changes in Phase Velocity During Fatigue Loading and Rest Periods (102 mm AC 5 Section) . . . . . . . . . . . . . . . . . . . . . . . . . . . . . . . . . . . . . . . . . . . . . . . . . . . . . . . . . . . . 64
Changes in Phase Velocity During Fatigue Loading and Rest Periods (102 rnm AC 20 Section) . . . . . . . . . . . . . . . . . . . . . . . . . . . . . . . . . . . . . . . . . . . . . . . . . . . . . . . . . . . . 65
Changes in Flexural Stiffness During Fatigue Life of Asphalt Concrete . . . . . . . . . . . . . 66

LIST OF FIGURES (continued)
Figure Page
. . . . . . . . . . . . . . . . . . . . . . . . . . . . . . . . . 28 Healing Indices of Different Test Locations 66
. . . . . . . . . . . . . . . . . . . . . . . . . . . . . . . . . . . . 29 Healing of Asphalt Concrete of Cell 25 68
. . . . . . . . . . . . . . . . . . . . . . . . . 30 Average Healing Indices for Low-Volume Road Cells 68
3 1 Change in the Elastic Modulus as a Function of Asphalt Concrete (AC) Mid-Depth Temperature During: (a) the 24-hour rest period in US 70, NC; (b) the 36-hour rest
. . . . . . . . . . . . . . . . . . . . . . . . . . . . . . . . . . . . . . . . . . . . . . . . period in Mn/Road, MN 69

LIST OF TABLES
Page
1 Healing Coefficients Inferred From Field Fatigue Data . . . . . . . . . . . . . . . . . . . . . . . . . 19
2 Comparison of Healing Potentials of Mixtures Prepared With Two Different Binders (AADandAAM) . . . . . . . . . . . . . . . . . . . . . . . . . . . . . . . . . . . . . . . . . . . . . . . . . . . . . 36
3 Summary of Fatigue Lives for Controlled-Strain Cyclic Tests . . . . . . . . . . . . . . . . . . . . 43
4 Asphalt Composition Matrices Provided by Western Research Institute . . . . . . . . . . . . 51
5 Healing (or Wetting) Surface Energies of Various Asphalts (m/~/m~) as Measured Using WilhelmyPlate . . . . . . . . . . . . . . . . . . . . . . . . . . . . . . . . . . . . . . . . . . . . . . . . . . . . . . . 53
6 Constituents, h,,h2, and Spacing Factor, h, , Used to Fit HI to Ordinal Number of Rest
Periods Data Using Nonlinear Model . . . . . . . . . . . . . . . . . . . . . . . . . . . . . . . . . . . . . . 58
PROJECT SUMMARY
Background and Objectives
This final report documents the findings of a four and one-half year study of "Microdancage Healing in Asphalt and Asphalt Concrete " The study is identified as Task K in a larger overall study under the direction of Western Research Institute entitled "Fundamental Properties of Asphalts and Modified Asphalts. " The study was sponsored by the Federal Highway Administration (FHWA) under contract number DTFH6 1 -92-C-00 170. Work in Task K was a joint effort between the Texas Transportation Institute (TTI) of Texas A&M University and the Department of Civil Engineering at North Carolina State University (NCSU).
The final report is divided, for reasons of readability and ease of documentation, into four volumes: (1) Microdamage Healing - Project Summary Report, (2) Evidence of Microdamage Healing, (3) Micromechanics Fatigue and Healing Model, and (4) Viscoelastic Continuum Damage Fatigue Model.
There were five primary study objectives:
1. Demonstrate that microdamage healing occurs and that it can be measured in the laboratory and in the field.
2. Confrm that the same fracture properties that control propagation of visible cracks control the propagation of microcracks, and determine the effects of microdamage healing on these fracture properties and basic fracture parameters.
3. Identify the asphalt constituents that influence microdamage and microdamage healing.
4. Establish appropriate correlations between microdamage and microdamage healing in the laboratory and in the field.
5. Predict the effect of microdamage healing on pavement performance and develop the appropriate constitutive damage models that account for the effects of microdamage healing on the performance of asphalt concrete pavement layers.
By satisfying the objectives of this research, the FHWA will be able to:
1. Establish the validity and significance of microdamage healing in flexible pavement design and analysis.
2. Identify how microdamage healing can be utilized in pavement design and analysis. 3. Maximize pavement performance life by selecting asphalt binders that match the
level of microdamage healing to the level of traffic.
Volume 1: Microdamage Healing - Project Summary Report
Volume 1 is a summary report that chronicles the research highlights of the entire study.

Volume 1 describes the success of the project in addressing the project objectives as summarized in the following paragraphs.
The initial research objective was to demonstrate that healing occurs and can be measured both in the laboratory and in the field. Healing was verified on laboratory test samples that demonstrated that dissipated pseudo-strain energy (DPSE) with each cycle of loading, which steadily decreased during cyclic, controlled-strain loading, was recovered after rest periods. The level and rate of the recovered DPSE varied in a logical manner corresponding to changes in the duration of the rest period and the temperature during the rest period. A parameter called the Healing Index (HI) was developed to quantify the magnitude of healing. Furthermore, a Micromechanics Fatigue and Healing Model was developed in this study on the basis of the basic laws of fracture and microcrack growth. This model predicts the size distribution of microcracks and the growth of the microcracks as the fatigue process continues. The model, which is based on a relationship between stiffness loss during the fatigue process (due to microcrack damage) and the rate of change in DPSE, reveals a reduced average length of microcracks in the sample following rest periods. The MFHM model can be used to accurately calculate (by reverse calculation techniques) pertinent material properties and the rate of change in DPSE during the fatigue and healing process at temperatures below 25°C. However, the back- calculated pertinent material properties and the rate of change in DPSE cannot be accurately predicted using the MFHM at temperatures above about 25°C. This is because below 25"C, the change in damage during cyclic loading is almost all due to microcrack growth and healing. However, at the higher temperatures, plastic deformation occurs to a considerable extent, and plastic damage is not accounted for by the MFHM.
Convincing evidence of healing on the basis of field data fhther verifies the occurrence of and ability to measure microdamage and healing. The stiffness of damaged roadways was found to recover or increase after rest periods where the stiffness was measured using in situ surface wave techniques. Experiments that verify healing were performed on U.S. 70 in North Carolina, the Minnesota Road Project (MnROAD) project, and the Accelerated Loading Facility in McLean, Virginia.
The second research objective, using the MFHM which is based on fracture mechanics principles, was to confirm that the same fracture properties that control the propagation of visible cracks also control the propagation of microcracks and determine the effects of microdamage healing on the basic fracture properties and the fatigue life.
The third objective was to identify the asphalt constituents that influence microdamage and microdamage healing. Five asphalts ranging widely in aromatic, amphoteric, and wax contents were considered, and asphalts with low amphoteric and high aromatic contents were found to be better healers. However, the most important relationship between binder properties and healing was based on surface energy, which was shown to be fbndamentally related to fracture and healing in a landmark study by Richard Schapery. More specifically, two components of surface energy (the polar and the non-polar component) were found to explain experimental data on the

rate of early healing and the development of long-term healing.
The fourth objective was to establish appropriate correlations between microdamage and microdamage healing in the laboratory and in the field. This was accomplished, as evidence verifies that a very significant level of recovery or healing occurs in the field following rest periods, and this level of recovery is in agreement with the magnitude of healing measured in the laboratory.
Finally, the project sought to predict the effect of microdamage healing on pavement performance and to develop an appropriate damage model. Two complementary approaches to the accomplishment of this objective were developed in this research. One was the development of the viscoelastic continuum damage mechanics model (CDM) and the second was the micromechanics fatigue and healing model 0. The CDM can be used to assess fatigue life from either controlled-strain or controlled-stress fatigue experiments and the direct effects of rest periods (healing) on damage. Whereas the CDM offers an assessment of generic damage, the MFHM offers considerable insight into how material properties of the mixture af5ect fracture rate, healing rate, and the net rate of crack growth or fatigue, which is a balance between fracture rate and healing rate.
Volume 2: Evidence of Microdamage Healing
Volume 2 documents laboratory and field testing that provides the evidence that microdamage healing is real and measurable and that it has a significant impact on pavement performance.
Part of the laboratory experiments to evaluate the impact of rest periods were performed at North Carolina State University (NCSU). In these experiments, fatigue damage was induced through flexural beam experiments. Damage was recorded as the flexural stiffness of the beam became smaller during the flexural fatigue experiment and as the dynamic modulus of elasticity (as measured from impact resonance) became smaller. The experiment included two very different asphalt binders: AAD and AAM. The experiment clearly demonstrated that the rest periods introduced after fatigue damage allowed significant recovery in the flexural and dynamic modulus. The recovery was attributed to the healing of microcracks within the sample. The time of the rest period and the temperature of the sample during the rest period were found to significantly affect the degree of healing. The healing potentials of AAD and AAM asphalt cements were evaluated using four different indicators. Each indicator showed AAM to be a significantly better healer than AAD.
A separate series of laboratory testing was performed at Texas A&M University's Texas Transportation Institute (TTI). These tests consisted of controlled-strain haversine loading direct tensile tests and controlled-strain trapezoidal loading direct tensile tests. The change and rate of change in DPSE were recorded throughout the test and after rest periods introduced during the fatigue tests. The recovered DPSE after the rest period normalized by the DPSE before the rest

period defined a Healing Index term (HI) used to quantify healing. Although healing was found to be dependent on the temperature of the mixture during the rest period and the length of the rest period, it was also found to be highly dependent on the type of asphalt cement. Asphalt AAM was found to provide much better healing properties than asphalt AAD, which is in agreement with the work of NCSU where significantly different testing protocols were used.
A discussion is presented in Volume 2 that explains the importance of transforming the dissipated energy into pseudo dissipated energy in order to accurately evaluate the relative ability of the various mixtures to heal. The transformation to pseudo-strain energy can be tedious and painfully slow. However, a linear transformation protocol is presented, that is acceptably accurate and efficient. This protocol was used in this research to calculate pseudo dissipated energies for the mixtures compared.
The TTI laboratory work demonstrated that several factors may influence the measure of microdamage healing apart fiom crack healing: molecular structuring or steric hardening, temperature confoundment, and stress relaxation during loading and rest periods. Each factor is discussed with respect to its role in influencing microdamage and microdamage healing. The conclusions are that: 1) molecular structuring is not of significance or importance for the rest periods and test protocols used in this study; 2) temperature increase upon loading or dissipation during rest periods was minimal in these experiments and had an insignificant impact on measured properties because of the nature of the test protocol, number of loading cycles used, and length of rest periods and 3) stress relaxation is accounted for in the determination of the pseudo-strain energy data as they relate to microdamage healing.
The influence of several factors as they affect microdamage healing (the healing index) are discussed. These include the effects of low density polyethylene (LDPE) as an asphalt additive, the effects of age-hardening (including the effects of hydrated lime as an inhibitor of hardening), the effect of five different binders (exhibiting very different compositional properties), and the effect of different mixture types (dense graded mixtures versus stone mastic type mixtures).
The most notable finding presented in this chapter is the difference in healing indices among the five virgin binders evaluated. A strong relationship between surface energy of the binder and the magnitude of healing and the rate of realization of maximum healing is presented. This relationship agrees with the fundamental (fracture mechanics based) explanation of fatigue presented in Volume 3. In this fhdamental relationship, the fatigue process is presented as a balance between the fracture during loading and healing or recovery during periods of rest.
Volume 2 completes the evidence of microdamage healing with convincing field evidence. Wave speed and attenuation measurements were made on in situ pavements. The stress wave test and analysis successllly detected fatigue damage growth and microdamage healing of asphalt pavements (at the FHWA's Turner-Fairbank Highway Research Center - Accelerated Loading Facility) with different asphalt layer thicknesses and viscosities and demonstrated the importance of microdamage healing during rest periods on pavement performance. The ability of stress wave

testing to measure microdamage and healing in the field was further evaluated at the Minnesota Road Project (Mn/ROAD) on seven pavement test sections at the site. The results fbrther confirmed that the stress wave analysis can be used to monitor microdamage growth and healing in the field. The conclusion of the field study was that, although healing of asphalt concrete pavements in the field is more difficult to measure than in the controlled setting of a laboratory, it can be accurately detected using stress wave analysis. The fact that healing does occur in pavements in the field during rest periods suggests that the performance and service life of the pavement will be increased if rest periods are introduced, or if binders are used that heal more quickly and completely.
Volume 3: Micromechanics Fatigue and Healing Model
Volumes 3 and 4 present two different ways of describing the fatigue cracking in mixes. In both volumes, the sample being tested is damaged. The two approaches differ in their ways of characterizing cracking. In Volume 3, it is assumed that all of the damage is due to cracking and obeys the fracture and healing laws that have been established for viscoelastic materials. In this approach the material properties that are relevant to these fracture and healing laws may be measured independently of the sample that is tested in fatigue. The resulting model of fatigue cracking and healing is the Micromechanics Fracture and Healing Model 0. In Volume 4, the sample is assumed to suffer a generic "damage" with which no material properties are associated. Instead, model coefficients are found by analysis of the sample DPSE data. The resulting model is the continuum damage model (CDM). Volume 3 contains a description of the tests that were run and interpreted using the MFHM at 4'C, 25OC, and 40'C. At the lower temperatures (4'C and 25'C), the MFHM model was used to calculate the cohesive fracture and healing surface energies that were measured independently using a Wilhemy Plate apparatus. The calculated and measured values matched well within reasonable experimental error. However, at 40°C, the calculated surface energies did not match the measured values, indicating that a mechanism other than fracture and healing was operating at the higher temperature. The most likely damage mechanism to operate at the higher temperature is plastic flow. This suggests that a continuum damage model (CDM) at the higher temperatures will probably be of a different form with different sets of model coefficients than what was found to fit the fracture and healing damage mechanism at the lower temperatures as discussed in Volume 4. The most likely dividing line between the fracture and healing mechanism and the plastic flow mechanism is the stress free temperature of the asphalt concrete mixture.
Three events occur simultaneously in asphalt mixtures under strain-controlled fatigue loading. These are relaxation, fiacture, and healing. Relaxation of stress is a direct result of asphalt molecular structure. Fracture can be regarded as the growth of microcracks or macrocracks during loading, and healing is the recovery of the asphalt structure during rest periods. Healing is at least partly due to the recovery of bonding strength at the closure of fracture faces. The relaxation and healing mechanisms extend the performance life of asphalt mixtures while fatigue damage degrades their quality.

The theories of fracture mechanics are well established for time-independent materials, such as metals. However, analysis methods to characterize the behavior of time-dependent viscoelastic materials are rare. A number of approximate interrelationships between linear elastic and viscoelastic properties have been developed; however, they are only applicable to quasi-static problems. Finding a closed-form solution to quantify the response of viscoelastic materials under general loading conditions is one of the objectives of a portion of the study described in this volume. A second objective of this portion of the research was to show that the same fracture properties that control the propagation of visible cracks control the propagation of microcracks.
The third objective was to show that the microfracture and healing properties that can be calculated from the measured results of tensile fatigue tests match the cohesive fracture and healing properties of the asphalt binder that can be measured independently. It is this third objective that demonstrates closure: The microfracture and healing theory proposed in this report actually does predict the measured results.
An extended background review of the literature, which supports much of the development of the models presented in this volume, is presented in the Ph.D. dissertation of Chen (1997). This volume presents a finite element model that is used to calculate the fracture properties of asphalt mixtures and to calculate damage behavior (average crack length and density of crack distribution) during fatigue testing. The fracture properties and damage assessment is based on dissipated pseudo-strain energy, which is recorded throughout the test. Based on the microfracture and healing model, a fundamental relation of viscoelastic fracture was derived and is presented in this volume. This fundamental law is used to describe the rate or speed of fracture and the rate or speed of microfracture healing based on fundamental properties of the mixture and its components. The law defines the fatigue process as being a balance between the rate of fracture and the rate of healing. The fundamental relationship identifies component and global mixture properties that affect fiacture and healing. Tests to measure these material properties show potential for development into specification tests. Among these are the surface energy tests for binders and aggregates and mixture tensile and compressive compliance tests. The reasonableness of the approach is demonstrated by the fact that the fundamental relationship of viscoelastic fracture mechanics was used to calculate fracture and healing surface energies from actual fatigue test dissipated pseudo-strain energy data, and fundamental mixture fracture properties were calculated from these data. The calculated mixture surface energies were within a reasonable range of those measured separately for the binder and mixture, as discussed in Volume 3.
The analytical methods presented in this volume demonstrate a reduction in average rnicrocrack length following rest periods and that the same fundamental fracture parameters that influence macrocrack growth (fractures larger than about 7.5 mrn) also control rnicrocrack growth.
Volume 4: Viscoelastic Continuum Damage Fatigue Model of Asphalt Concrete with Microdamage Healing
A mechanistic approach to fatigue characterization of asphalt-aggregate mixtures is presented in this volume. This approach is founded on a uniaxial viscoelastic constitutive model that accounts for damage evolution under cyclic loading conditions. The elastic-viscoelastic correspondence principle is applied in order to evaluate damage growth and healing in cyclic loading separately from time-dependent characteristics of the material. The damage growth during loading cycles and healing during rest periods are modeled using work potential theory, a continuum damage theory based on thermodynamics of irreversible processes. Internal state variable formulation was used in developing the analytical representation model. Tensile uniaxial fatigue tests were performed in the controlled-strain mode with different strain amplitudes to determine model parameters. The resulting constitutive model successfilly predicts the damage growth of asphalt concrete under monotonic loading at varying strain rates and damage growth and recovery due to complex loading histories, in both controlled-strain and controlled-stress modes, composed of randomly applied multi-level loading with different loading rates and varying durations of rest.
Fatigue lives of two different mixtures were predicted with reasonable accuracy using the constitutive model for the constant stress-strain amplitude cyclic loading histories with and without rest periods. A standard uniaxial fatigue test protocol is proposed by simplifying the experimental approach used in developing the constitutive model.
CHAPTER 1: INTRODUCTION
This volume is an overview of the findings and highlights of Task K of the study entitled, "Fundamental Properties of Asphalt, and Modified Asphalts." Other volumes develop the theory or demonstrate the empirical evidence in more rigorous detail. However, this volume should provide sufficient detail for most readers interested in the application and implementation of the research findings.
This volume describes the completion of tasks geared to satisfy the research objectives as outlined in the third paragraph of the project summary. This volume is divided into seven chapters. Following this introduction, Chapter 2 discusses pertinent points of reference in the history of fatigue testing. The chapter begins with a discussion of the mechanisms of the fracture process as viewed by the research team. Specific attention is then given to the Superpave approach developed in the Strategic Highway Research Program (SHRP), and the Superpave approach is then compared with the other two approaches developed in this study.
Chapter 3 provides, from the literature, a record of the general evidence of healing and its influence on the fatigue process. Chapter 4 discusses the prediction of fatigue damage and the effect of healing during the fatigue process using the tools of viscoelastic constitutive theory and work potential theory. Chapter 5 discusses the prediction of the same fatigue process and including the effects of healing on the basis of a Micromechanics Fatigue and Healing Model 0. Chapter 6 explains how microdamage healing was verified in the laboratory based on recovered dissipated pseudo-strain energy, and based on recovered stiffness determined on actual pavements. Chapter 6 further discusses how micromechanics is used to identify mixture properties which contribute to and strongly influence microdamage healing. A unified theory of microdamage healing is postulated and verified. Finally, Chapter 7 presents a summary of accomplishments toward the research objectives and recommendations for further work.
CHAPTER 2: BACKGROUND
Mechanism of Fatigue
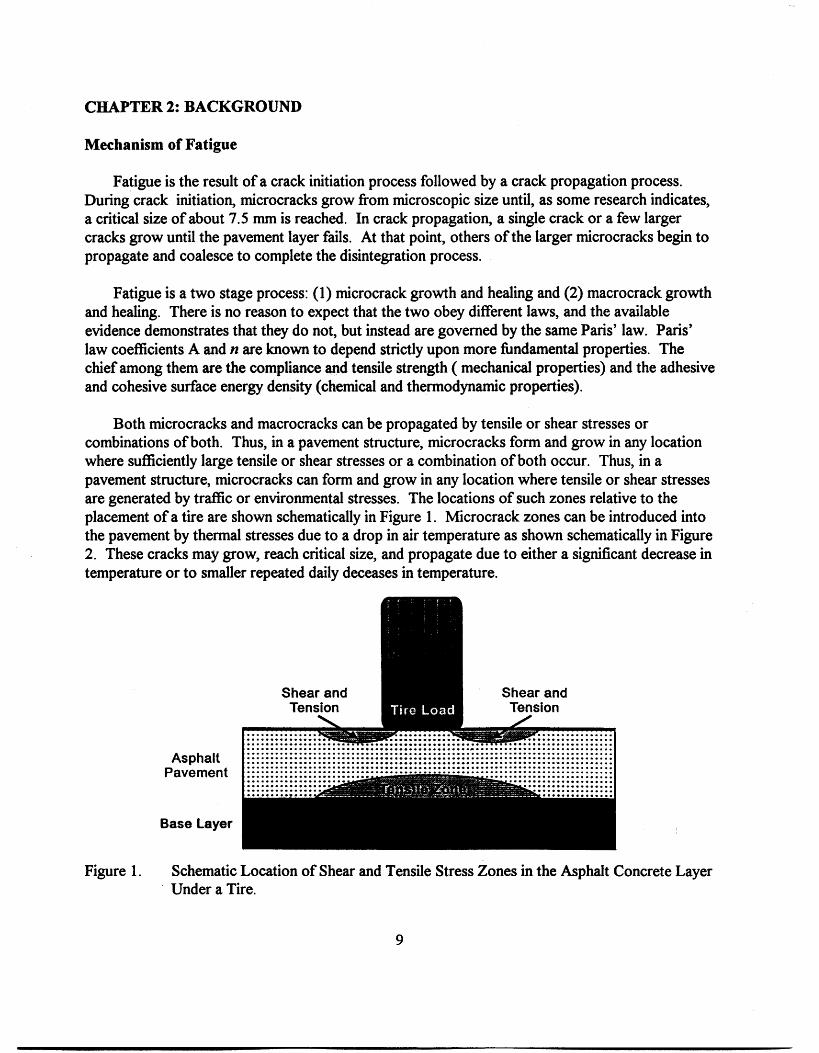
Fatigue is the result of a crack initiation process followed by a crack propagation process. During crack initiation, microcracks grow fi-om microscopic size until, as some research indicates, a critical size of about 7.5 mrn is reached. In crack propagation, a single crack or a few larger cracks grow until the pavement layer fails. At that point, others of the larger microcracks begin to propagate and coalesce to complete the disintegration process.
Fatigue is a two stage process: (1) microcrack growth and healing and (2) macrocrack growth and healing. There is no reason to expect that the two obey different laws, and the available evidence demonstrates that they do not, but instead are governed by the same Paris' law. Paris' law coefficients A and n are known to depend strictly upon more fundamental properties. The chief among them are the compliance and tensile strength ( mechanical properties) and the adhesive and cohesive surface energy density (chemical and thermodynamic properties).
Both microcracks and macrocracks can be propagated by tensile or shear stresses or combinations of both. Thus, in a pavement structure, microcracks form and grow in any location where sufficiently large tensile or shear stresses or a combination of both occur. Thus, in a pavement structure, microcracks can form and grow in any location where tensile or shear stresses are generated by traffic or environmental stresses. The locations of such zones relative to the placement of a tire are shown schematically in Figure 1. Microcrack zones can be introduced into the pavement by thermal stresses due to a drop in air temperature as shown schematically in Figure 2. These cracks may grow, reach critical size, and propagate due to either a significant decrease in temperature or to smaller repeated daily deceases in temperature.
Asphalt Pavement
Base Layer
Figure 1. Schematic Location of Shear and Tensile Stress Zones in the Asphalt Concrete Layer Under a Tire.

Microcrack Tensile Density Stresses
Asphalt Pavement
Base Layer
Figure 2. Schematic of Microcrack Density Due to Thermal Stresses.
The same pattern of microcracks may develop because of contractile stresses exacerbated by the embrittlement of the asphalt pavement through aging. Any tensile or shear stress applied to a field where microcracks exist may cause them to grow, to reach critical size, and then to propagate as macrocracks.
Paris' law states that the "crack speed," dddN, depends upon the size of the J-integral or its elastic equivalent, the stress intensity factors due to tension (IQ and shear &). The distribution of K, and K, varies with depth and may be calculated using finite element methods. The K, and K, values induced by traffic are shown in Figure 3 for cracks initiating at the surface and at the bottom of the asphalt layer. Surface initiation is more common in thick asphalt layers (2200 rnrn) and bottom initiation is more common in intermediate thickness layers (50-200 mm).
The number of traffic load cycles, N , to cause a crack to penetrate through the full depth of the pavement surface layer is the sum of the number of load cycles for crack initiation, N,, and the number of load cycles required for the macrocrack to propagate to the surface, Np .

Both Ni and N, obey Paris' law as modified to include both fiacture and healing. The actual number of load cycles required in each process is calculated by following the growth of a crack. Not only does the stress-intensity factor change with crack length, but the values of the Paris' law coefficients A and n for both fiacture and healing also vary depending upon whether the crack is momentarily growing along the surface of an aggregate (adhesive fiacture) or in the mastic surrounding the aggregate (cohesive fracture), or temporarily arrested by an object blocking its path (crack arrest).
Crack Length
Crack Initiating at the Bottom
Crack Len
Crack IniWg at SUfface
Figure 3. Stress Intensity Factors as a Function of Crack Length in an Asphalt Concrete Layer.
The beam fatigue tests that were performed in the Strategic Highway Research Program A-003A contract provided an excellent opportunity to observe the two phases of crack growth: initiation and propagation (Lytton et al., 1993). The tests included both "constant-strain" and "constant-stress" tests, which made the process of separating the two phases of crack growth simpler.
In the constant-strain fatigue test, no crack propagation occurred and only the damage due to the formation and growth of distributed microcracks was observed. This was observed principally

with two measurements: the stiffness of the beam fatigue sample decreased and the rate of change of dissipated energy per load cycle continued to change with the increasing number of load applications.
Numerous measurements of the beam deflections and the dissipated energy per load cycle permitted the use of a finite element model of microfracture damage to be used together with a systems identification method to determine the fracture properties of the mixture being tested.
In the constant stress test, crack propagation did occur after a period of crack initiation. A clear separation of the two phases was observed in the plot of the rate of change of dissipated energy per load cycle versus the number of load cycles. At the beginning of the crack propagation phase, the rate of change of dissipated energy increased rapidly above the rather steady increase in the rate of change that characterized the previous crack initiation phase.
The fracture properties that were computed from the constant-strain fatigue tests were successfblly used to compute the growth of microcracks and the rate of change of dissipated energy per load cycle in the constant-stress fatigue tests during the crack initiation phase. The same fi-acture properties were successfblly used to compute the growth of the visible crack in the crack propagation phase.
Two distinctively different parts of the crack growth process were observed consistently in the "constant stress" tests. The first part consisted of a steady growth of the rate of change of dissipated energy per load cycle, dWIdN. In this part, microcracks grew in length until some reached a critical size, which was calculated to be 7.5 mrn . At that point, macrocrack growth began. In the second part of the crack growth process the rate of change of dissipated energy per load cycle accelerated as the single macrocrack demanded a much greater expenditure of energy to drive it to greater lengths. A graph of the rate of change of dissipated energy, dWIdN, versus the number of load cycles, N, is shown in Figure 4. These two parts of the crack growth process, illustrated in Figure 5, have been known to exist qualitatively for many years, during which they were termed the "crack initiation" and "crack propagation" phases. The distinction between the two parts is refined by focusing on the rate of change of dissipated energy, dWIdN, as shown in Figure 5. The Paris' law coefficients, A and n, which predicted microcrack growth also predicted the growth of the macrocrack

1 . Fitted (Lab)
1,000 10,000
Load Cycle
Figure 4. Sample Illustration Showing Determination of Ni From Dissipated Energy Data Experiment Conducted at 20°C.
Ni Nf
m N Figure 5. Illustration of the Relationship of the Parts of the Crack Growth Process as Related
to the Rate of Change of Dissipated Energy Per Load Cycle, dW/dN.

Approaches to Fatigue Analysis: General
The study of microdamage healing in asphalt concrete has potentially great implications in the design and production of asphalt concrete pavements. The fatigue service life of asphalt concrete evolves as the result of competing mechanisms: damage and healing. Maximizing the healing component extends the life of these materials in service.
However, the problem at hand goes deeper than empirically maximizing the healing effect. A more extensive investigation of the mechanical properties of asphalt concrete mixtures leads to a more clear understanding of the relation between fracture and healing and basic constitutive properties, and illustrates which characteristics of asphalts and aggregates are fbndamental to encouraging healing and discouraging fracture in field applications. These fbndamental properties include chemical effects like surface energy, and measurable mixture characteristics like tensile and creep compliances. Explaining the observed mechanical behavior of asphalt mixtures with fundamental engineering mechanics provides an ideal springboard for predicting field behavior, which is difficult to imitate in the laboratory.
Asphalt microdamage healing is the natural antidote to asphalt damage. The study of asphalt fatigue and the associated effect of healing can be divided generally into three methods. The first, and probably the oldest method, is a direct test of asphalt concrete specimens repeatedly loaded or strained to "failure," which is determined by a preset criterion of maximum strain or minimum stiffness. The second is a direct application of continuum mechanics in tracking the behavior observed in fatigue specimens, and marking their failure by a material-specific damage parameter. The third simulates specimen degradation with key assumptions about the nature of the microdamage, and seeks to relate the condition of energy dissipation rate change and changing stiffness to a state of internal damage isolated on cracking.
Pertinent Fatigue Damage Evaluation Methods
As stated above, there are three approaches to fatigue testing and modeling , each of which can introduce the effects of healing in a model of the material's life cycle. These methods will be discussed as a classical or traditional approach, a continuum mechanics approach, and finally a fracture-modeling approach.
Traditional Approach
The traditional approach stems from a combination of phenomenological observation and laboratory-tabulated data derived from the materials tested. In its many variations, this method is a regression analysis used to relate observed damage such as losses in stiffness of asphalt concrete specimens to details of the mixture characteristics (i.e., air voids, voids filled with bitumen, etc.) and test-induced stresses and strains.
Perhaps the best known model of this type is a simple exponential relationship, presented as:
where: N, = fatigue life; eo = initial applied tensile strain; and a,b = constants derived of fitting the data.
When the constants are fitted to experimental data, the resulting relationship applies only to the specimens tested. This method allows one to evaluate the relative fatigue performance of asphalt mixtures. This model has often (but not always) been used in the literature to fit data derived from tests performed on asphalt mixtures tested at frequencies of 10 hz and above, thus relying on the elastic behavior of the asphalt mixture to characterize its fatigue response. As strain-controlled test data were collected, another trend became clear: that stiffer mixtures lasted fewer cycles in this test mode. To account for this potentially confounding variable, researchers including Monismith et al. (1985), adjusted the exponential model as follows:
where: Nf = fatigue life; eo = initial applied tensile strain; So = initial mix stiffness, generally from the 200th cycle; and
qb,c = constants derived of fitting the data.
When this model is used to characterize strain-controlled tests, it describes a smooth degradation in fatigue response down to a fatigue endurance limit or stifhess at which the fatigue life is theoretically infinite. Fatigue limits such as these are textbook attributes of steels and other elastic materials. However, this interpretation does not apply directly to the complex loading scenarios common to in-service pavements. Controlled-strain tests were considered appropriate for thin pavement structures whereas controlled-stress tests were used for thick asphalt layers or very stiff pavement structures. In seeking a more general approach, researchers have sought fatigue models independent of loading mode. This has been attempted historically through the comparison of fatigue life to dissipated energy, which is the product of stress and strain. Clearly, it seems that a variable dependent on both key mechanical responses measured in this test could address all types of behavior.
The "energy" approach has been investigated by many researchers, including Chomton and Valayer (1972), van Dijk (1975), van Dijk and Visser (1 977), and Tayebali et a1.(1 9B), and generally results in a model of the form:
where: Nf = fatigue life; W, = cumulative dissipated energy to failure; and

A, z = constants derived of fitting the data.
This advance was seen as relating the fatigue behavior to the final test cycle as well as the initial cycle through the use of the cumulative dissipated energy. With this approach, a pre- selected limit of cumulative dissipated energy is selected to judge failure of a specimen.
In practice, the models are calibrated to the traditional strain-controlled test. The cumulative dissipated energy is the sum of the energy dissipated during each cycle. This is relatively simple to accomplish in a strain-controlled test with limited error. The loop area, and therefore the cycle- specific dissipated energy, will vary almost exclusively with the measured stress in a strain- controlled, high-frequency test. This is illustrated using the following equation (Tayebali et al. 1994) for sinusoidal loading:
where: wi = dissipated energy at load cycle i; ei = applied tensile strain amplitude at load cycle i; Si = mixture stiffness at load cycle i; and +i = phase shift between stress and strain at load cycle i.
For controlled-strain loading, the strain remains constant at its initial setting. Additionally, the phase angle has been shown to change only with temperature (Kim et al., 1998), and not with cracking damage. Therefore, if the goal of the test is to determine the effect of fatigue cracking (the underlying purpose of fatigue testing) based on mixture or sample properties, the above equation becomes:
Thus, the dissipated energy is simply proportional to the stiffness of the mix, which changes with each load cycle. As the mixture stiffness is the ratio of the stress to the constant strain, in reality, this model relates dissipated energy to recorded load. Pavement temperature and, therefore, the phase angle, is controlled in service by environmental factors, and tests that induce hysteresis heating to the extent that a significant shift in mixture temperature occurs (even 2°C) do not evaluate the material within its in-service operating conditions. Thus, for straincontrol, the total dissipated energy varies only with measured stress with each fatigue cycle and the number of cycles the specimen lasts until failure. Additionally, each mixture will exhibit a specific relationship between stress and strain at the applied strain rate, or strain amplitude and frequency combination. Therefore, this "energy" approach becomes a restatement of the classic theory in strain-controlled tests with a slightly different shape of the fatigue curve:
where: $ = (N, w,)Mr, a shaping factor;

wo is energy dissipated during the initial cycle; and all other entities are as previously presented.
The shaping factor is on one hand a multiplier to account for whether the test is stress- or strain- controlled. In a stress-controlled test, where the initial strain is less than that recorded on the final cycle, the Jr-term will be less than 1. The opposite trend in Jr is to be expected for the strain- controlled test. This energy ratio factor simply allows adjustment of the "prediction" curves to fit test data. Interestingly, the maximum change in dissipated energy per cycle (from initial to final) has an effect on the modeled fatigue life of the mixture, but it is clouded by the reliance on this term in exponential regression, as advanced below:
Substituting initial dissipated energy (w,):
In the end, it is found that initial dissipated energy can be related to fatigue life with three fit constants and a shaping factor that account directly for the mode of loading and the variation in stifiess of the material throughout the test. However, both independent variables depend greatly on the applied strain rate and the individual mixture mechanical properties. Neither of these factors are theoretically accounted for in the models. Only a time-dependent constitutive relationship can do so. Asphalt concrete mixtures are viscoelastic, and this model type (equation 8) adjusts for viscoelastic effects only in terms of the phase angle.
This approach was adapted in the course of SHRP contract A-003A. Numerous mixtures were tested in the in strain-controlled regime and it was determined (Tayebali et al., 1994) that fatigue life varied significantly with initial-cycle dissipated energy and a factor associated with air voids. As previously discussed, these findings identified specimen volumetrics and testing procedures as the greatest determinants of fatigue life. Additionally, none of these models identify a damage state with any of the test data (Tayebali et al., 1994), and so their phenomenological nature is confirmed. The weighting or averaging approach of dissipated energy precludes material state description, relating instead a material response (stiffness loss) to energy dissipation. However, should these models be rigorously applied throughout a fatigue test, they provide the ability to account for recovered energy and to algebraically determine its effect on the test data. The lack of constitutive properties precludes advanced evaluation of the results based on material composition or unique constitutive properties.
Whichever method is selected for fatigue testing - extensive testing at a variety of strain, stress, or energy levels and temperatures or the surrogate testing - the fatigue models described by equations 1 through 8 still depend on a substantial shift factor to account for the difference between cycles to fatigue failure in traditional laboratory experiments and actual data from the field. As an example, consider the Asphalt Institute's fatigue model used as the basis for the
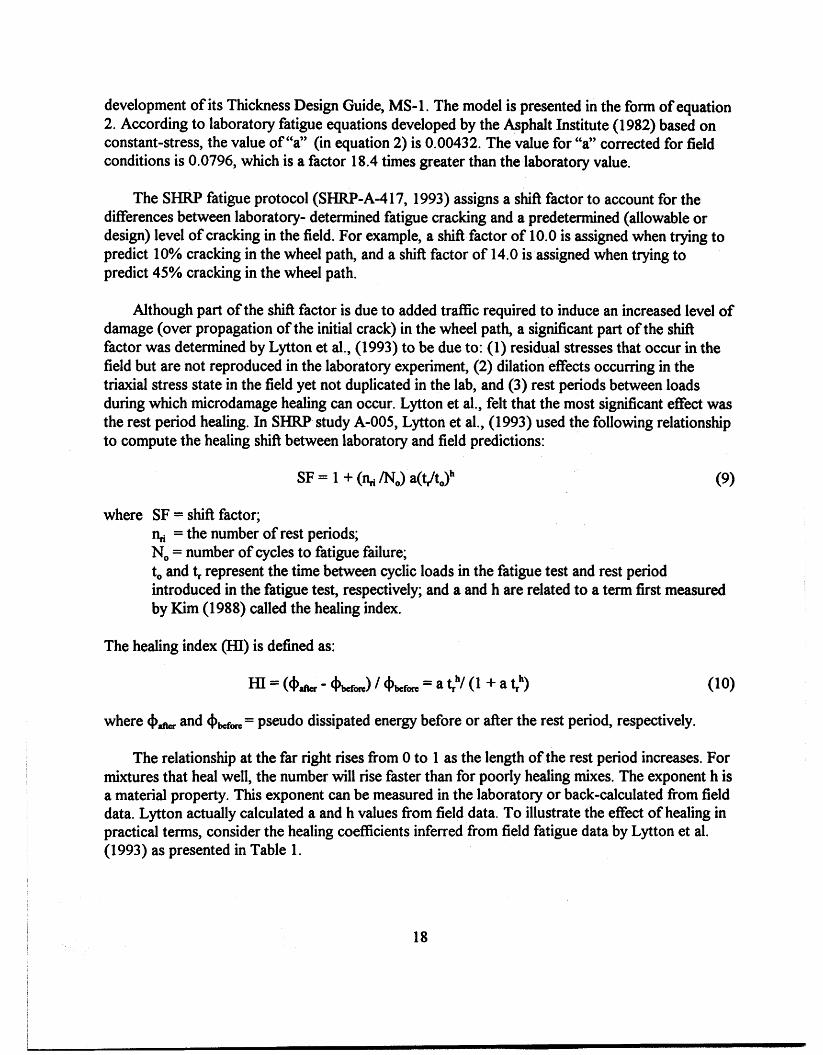
development of its Thickness Design Guide, MS-1. The model is presented in the form of equation 2. According to laboratory fatigue equations developed by the Asphalt Institute (1982) based on constant-stress, the value of "a" (in equation 2) is 0.00432. The value for "a" corrected for field conditions is 0.0796, which is a factor 18.4 times greater than the laboratory value.
The SHRP fatigue protocol (SHRP-A-417, 1993) assigns a shift factor to account for the differences between laboratory- determined fatigue cracking and a predetermined (allowable or design) level of cracking in the field. For example, a shift factor of 10.0 is assigned when trying to predict 10% cracking in the wheel path, and a shift factor of 14.0 is assigned when trying to predict 45% cracking in the wheel path.
Although part of the shift factor is due to added traffic required to induce an increased level of damage (over propagation of the initial crack) in the wheel path, a significant part of the shift factor was determined by Lytton et al., (1993) to be due to: (1) residual stresses that occur in the field but are not reproduced in the laboratory experiment, (2) dilation effects occurring in the triaxial stress state in the field yet not duplicated in the lab, and (3) rest periods between loads during which microdamage healing can occur. Lytton et al., felt that the most significant effect was the rest period healing. In SHRP study A-005, Lytton et al., (1993) used the following relationship to compute the healing shift between laboratory and field predictions:
where SF = shift factor; n,, = the number of rest periods; No = number of cycles to fatigue failure; to and t, represent the time between cyclic loads in the fatigue test and rest period introduced in the fatigue test, respectively; and a and h are related to a term first measured by Kim (1988) called the healing index.
The healing index (HI) is defined as:
where 4, and +,, = pseudo dissipated energy before or after the rest period, respectively.
The relationship at the far right rises from 0 to 1 as the length of the rest period increases. For mixtures that heal well, the number will rise faster than for poorly healing mixes. The exponent h is a material property. This exponent can be measured in the laboratory or back-calculated from field data. Lytton actually calculated a and h values from field data. To illustrate the effect of healing in practical terms, consider the healing coefficients inferred from field fatigue data by Lytton et al. (1993) as presented in Table 1.
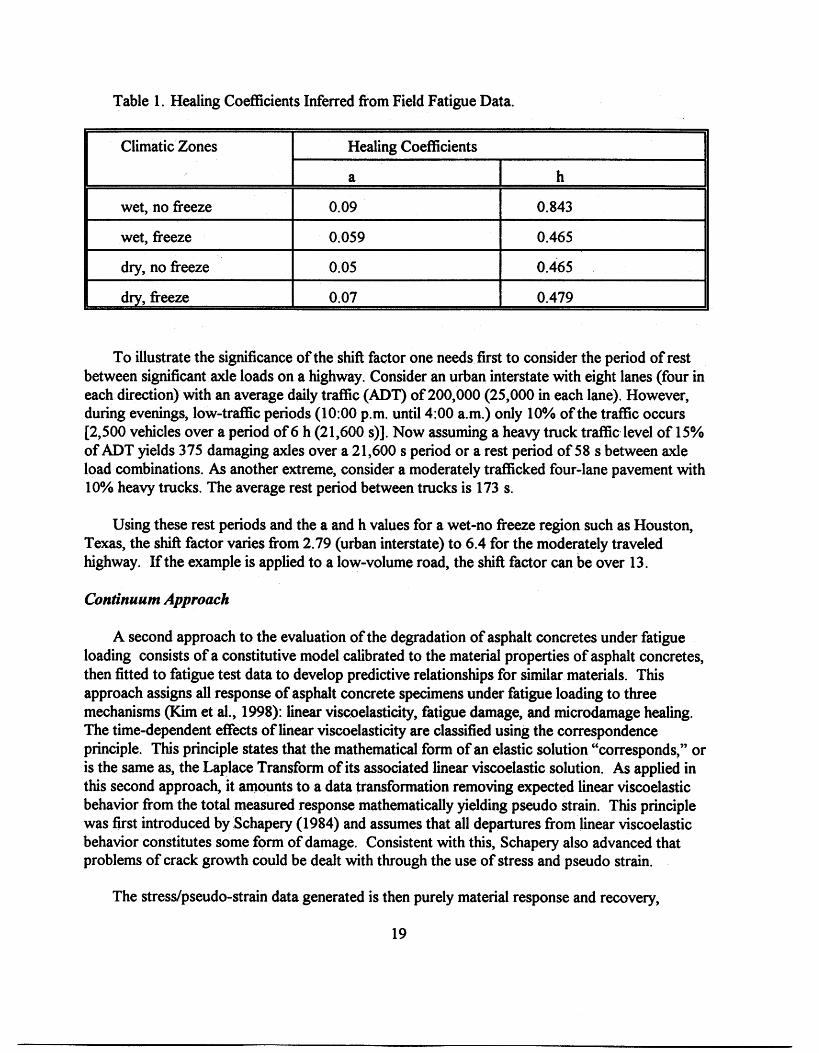
Table 1. Healing Coefficients Inferred from Field Fatigue Data.
Climatic Zones
To illustrate the significance of the shift factor one needs first to consider the period of rest between significant axle loads on a highway. Consider an urban interstate with eight lanes (four in each direction) with an average daily traffic (ADT) of 200,000 (25,000 in each lane). However, during evenings, low-traffic periods (10:OO p.m. until 4:00 a.m.) only 10% of the traffic occurs [2,500 vehicles over a period of 6 h (21,600 s)]. Now assuming a heavy truck traffic4evel of 15% of ADT yields 375 damaging axles over a 21,600 s period or a rest period of 58 s between axle load combinations. As another extreme, consider a moderately trafficked four-lane pavement with 10% heavy trucks. The average rest period between trucks is 173 s.
Using these rest periods and the a and h values for a wet-no freeze region such as Houston, Texas, the shift factor varies from 2.79 (urban interstate) to 6.4 for the moderately traveled highway. If the example is applied to a low-volume road, the shift factor can be over 13.
Continuum Approach
A second approach to the evaluation of the degradation of asphalt concretes under fatigue loading consists of a constitutive model calibrated to the material properties of asphalt concretes, then fitted to fatigue test data to develop predictive relationships for similar materials. This approach assigns all response of asphalt concrete specimens under fatigue loading to three mechanisms (Kim et al., 1 998): linear viscoelasticity, fatigue damage, and microdamage healing. The time-dependent effects of linear viscoelasticity are classified using the correspondence principle. This principle states that the mathematical form of an elastic solution "corresponds," or is the same as, the Laplace Transform of its associated linear viscoelastic solution. As applied in this second approach, it amounts to a data transformation removing expected linear viscoelastic behavior from the total measured response mathematically yielding pseudo strain. This principle was first introduced by Schapery (1984) and assumes that all departures from linear viscoelastic behavior constitutes some form of damage. Consistent with this, Schapery also advanced that problems of crack growth could be dealt with through the use of stress and pseudo strain.
The stresdpseudo-strain data generated is then purely material response and recovery,

characterized as damage and healing, respectively. As the constitutive model is continuum-based, it is very general and does not distinguish whether the damage is specifically fracture or evolves in other forms such as plastic deformation. This permits the freedom to assign all damage a single variable, denoted by an internal state function, S,. As experiments in this research were performed without temperature change, the general uniaxial form of this constitutive relationship is:
where: a = stress; eR = pseudo strain; and Sm = internal state variable of damage.
This general constitutive model accounts for the response of the viscoelastic body and damage by a "C" function as:
where: C(Sm) = internal function of damage.
Since the relaxation modulus (p) in linear viscoelasticity is assumed to be constant, the insertion of the damage function as presented above correlates damage with the change in stiffness of the material. The use of damage to describe stiffness permits the assignment of all changes in stiffness to damage, which in a continuum model is not identified in form. The changes in stiffiess (constitutive properties) highlighted in this model are then specifically categorized into three selected functions in this constitutive relationship:
where: I = initial pseudo stiffness; F = a damage function fit to the change in the slope (i.e., pseudo stiffness) of each
transformed hysteresis loop of stress versus pseudo strain; G = hysteresis function delineating loading versus unloading paths; and H = healing function representing the change in the pseudo stiffness due to rest
periods.
The G function can be omitted when applied to predictive analysis, such as determining the fatigue life of a specimen. Simply put, the constitutive relationship above relates the uniaxial stress evolved in a controlled-strain test to an initial pseudo stiffness and the applied strain level in a material without damage. When damage occurs, this response is algebraically modulated by the two functions F and H. A closer look at these two components is helpful in describing how this model works.

The damage function, F, is an algebraic adjustment of the pseudo stiffness, accounting for both the loading mode and the rate of stiffness loss as follows:
where: Cl(Sln) =
eRm = eRs =
c10 - c i ~ ( S d ~ ' * ; peak pseudo strain in each cycle; shift in pseudo strain due to accumulated permanent deformation in the stress-controlled mode; S,/S,, which normalizes pseudo stiffness against the pseudo stiffness
calculated at failure; and C,, C,,, C,, = coefficients of regression.
The factor in brackets is an adjustment that algebraically isolates that strain behavior due to a unique load cycle. All accumulated strain would be accounted for in the E ~ ~ - term. This factor would be unity for a controlled-strain test as no accumulation of permanent deformation is expected. In other words, although the continuum model does not assign modes to damage evolved within a specimen, this provision excludes plastic deformation from the list of sources available for energy loss. This can be a confounding factor should a constitutive relationship be proposed including temperature (omitted from this research) as well as the controlled-stress testing mode.
The normalization of the pseudo stiffness factor, S,, also depends heavily on the failure pseudo stiffness. However, the pseudo stiffness observed at failure is a function not only of the damage evolution determined in part by F, but also by the healing behavior determined by H, as will be discussed later. This can cause significant retrofitting of the numerous constants used to develop the constitutive model.
In summary, the damage function F is responsible for algebraically reducing the predicted stress evolved in the specimen during uniaxial, controlled-strain fatigue loading, and its counterpart for the healing regime of the test, H, accounts for the recovery during rest periods and the adjustment of the predicted stress levels thereafter. This healing function is a much more complex series of fits, which are related to the overall predicted stress just as F is: an additive adjustment.
Three types of behavior were observed by Kim et al. (1998) in the calibration of this model about rest periods: an immediate recovery, a more rapid loss of pseudo stiffness upon the re- commencement of cyclic loading, and a settling out of the effect that was defined when the curve became more stable and assumed the characteristic exponential decline of stiffness (actually, pseudo stiffness ) during fatigue testing. These three phenomena each have a term in Kim's treatment of healing, represented by the following expression:

i
H = (~4.-,963 when S R C S ' j - 1
where
= SR (pseudo stiffness) before the im rest period; I i
SC, = SR without rest period at the point when SR is equal to SBR for the case with a rest period;
C2(S2) = C, + C,, (S2IC22 = a function representing the increase of SR during rest periods due to microdamage healing; and
C3(S3) = CM - C3, (S3)'32 = a fbnction representing the reduction in SR after rest periods due to damage evolution.
This complex mass of adjustment constants is actually the equation for three fitted curves. The C2 fbnction calculates the shift in the predicted (observed) stress due to active healing during the rest period. The C, function fits the accelerated degradation, which occurs upon the reloading of healed asphalt concrete specimens. The conditional term is simply a shift in the stress level which is the result of the position calculated by the C, and C, functions until the pseudo stiffness has declined back to the stress level reached before the rest period. Kim's approach attributes material characteristics not only to the healing achieved during a rest period, but also to the relative effect of that healing potential in subsequent cycling. Once the C2 and C3 functions have placed the predicted pseudo stiffness at the pre-rested level, a conditional term adjusts for the effect on fatigue life generated by the individual healing period. It is this conditional term that directly impacts evaluation of the failure criteria. Each healing period will figure additively into the value of the H function at any given time with a single algebraic term for each rest period.
The failure criteria for these tests is an adjustment of the traditional approach, simply:
where C, is equivalent to the effect of fatigue damage in reducing pseudo stiffness. Using this approach the constitutive relationship for controlled strain, uniaxial tensile fatigue tests, the sample is judged to fail when pseudo stiffness falls below half its original value. This is a responsible move given the compatibility it gives the evaluation of this model with the traditional approach. Essentially, the pseudo stiffness decline as would be expected without rest periods is added to the total recovery produced by the cumulative effect of rest periods and a total expected pseudo stiffness is calculated and compared with the original.
The application of this model in design and practice is limited, however, by the lack of fundamental properties related to the evolution of damage and recovery. The only measurable property directly incorporated in the model is pseudo stiffness, and this is difficult at best to relate

to mixture characteristics or material properties of the asphalt or aggregate composition. The reliance on observed failure states for calibration of the predictive model also undermines the assessment of damage states across the boundaries of test and sample conditions.
Fracture Modeling Approach
A third approach to fatigue modeling was developed at Texas A&M University under the direction of Dr. Robert Lytton. Lytton's model characterizes asphalt concrete solely on first principles of fracture and is fitted to fatigue test data through a rigorous process of systematic mathematical simulation of a test specimen. The observed response of the actual fatigue specimen is compared with the mathematically generated simulation, and model constants necessary to accomplish the fit are tabulated. The model was refined by Chia-Wei Chen (1997).
Consideration of Lytton's model is aided by understanding a few basic points. First, there is no failure criteria mentioned, and this is by design. Gauging the "current" state of a material by comparison to a final state confounds analysis. Second, the pseudo-strain energy is gauged by using a "reference modulus," which is computed using the maximum measured stress and the maximum pseudo strain in a strain-controlled test. Third, the key material state or condition variable is not the amount of energy dissipated under a stresdpseudo-strain curve as appears in Kim's continuum damage model. Rather, cracking intensity and mode are linked to the rate of change of dissipated energy per applied load cycle.
Lytton's model is developed directly from the application of fracture mechanics in viscoelastic media as first developed by Schapery. The model coefficients are determined from a finite element analysis of the laboratory data and then a systems identification analysis to refine the fit of the finite element analysis.
The laboratory data analysis begins with the transformation of the observed stress strain data to stresdpseudo-strain data. This is accomplished with the constitutive relationship:
where C = dddt during a loading or unloading ramp in which a constant strain rate, C, is maintained.
The reference modulus is defined as that quantity such that the maximum tensile pseudo strain (ee& for each loading cycle is equal to the maximum engineering strain observed in the test data. This relates pseudo strains to stresses through Hooke's law. The stresdpseudo-strain relationships are then used to calculate the pseudo energy dissipated in each load cycle throughout the fatigue test. The rate of change in dissipated pseudo energy, dWIdN, throughout the test is used with the
change in stiffness (FZ) at each cycle. These data, along with creep and other fbndarnental property relationships evident in the data, are applied in the ensuing micromechanics finite element analysis.
The finite element model applies continuum fracture mechanics (as opposed to Kim's continuum damage mechanics) to the derivation of a finite element formulation of asphalt concrete with a crack. This formulation is expanded to account for a Weibull size distribution of cracks. This distribution shifts to simulate the effect of repeated load cycles. This inter-relation of properties is governed by a relationship that equates the change in pseudo stiffness to dissipated pseudo energy and microfracture properties.
This relationship is rectified with the laboratory observation through a system identification method discussed in detail in Volume 3. Initial, or seed, values are input into the analysis and altered until the predicted dW/dN matches that developed from lab data with minimal enor of fit. Once the analysis has reached a minimum error, the microfracture parameters are backcalculated.
This modeling technique is very powerfbl in that the analysis depends heavily on fbndarnental mechanical properties. These fundamental relationships allow secondary analysis of mixtures based on typically measured properties, like creep and relaxation moduli, and direct chemical evaluations like the surface energy density of the asphalt and aggregate surface. Only this type of model allows one to consider the correspondence between fbndamental properties of mixture components, such as the surface energy properties of an asphalt cement and aggregate, and the test response of the product. Additionally, the effect of relatively well-understood specification-grade properties such as creep compliance are directly evaluated for their contribution to fracture behavior. The link between controllable properties and performance is not present in the other modeling schemes previously discussed.
The microfracture model assumes that fracture is the only method of energy dissipation in the asphalt concrete samples analyzed, invalidating the model as a sole predictor at high temperatures. However, this leads to the powefil corollary that, if the fatigue degradation of a mixture can be successfblly solved exclusively by this model, then fatigue as a result of microcrack damage and crack propagation is the appropriate damage process. This has major implications for seasonal modeling of pavements in different climatic regions.

CHAPTER 3: EVIDENCE OF HEALING IN THE LITERATURE
Historical Evidence of Healing in Polymers and Asphalt
Bazin and Saunier (1967) introduced rest periods to asphalt concrete beam samples that had previously been failed under uniaxial tensile testing. They reported that a dense graded asphalt concrete mix could recover 90% of its original tensile strength after 3 days of recovery at 25 OC. The researchers then performed cyclic fatigue tests. In these tests an asphalt concrete beam was loaded cyclicly until fatigue failure occurred. The beam was then allowed to rest and recover, and a cyclic load was again applied until fatigue failure reoccurred. The ratio of number of cycles to failure after the rest period to number of cycles to failure before the rest period was evaluated. This ratio was over 50% after a day of rest and with a 1.47 kPa pressure used to press the crack faces together. This research clearly showed the evidence of healing even though the rest periods and pressures were not necessarily realistic in terms of their ability to duplicate pavement conditions.
Despite the relatively small amount of historical research in the area of asphalt concrete healing, the mechanism of healing within polymeric materials has been studied intensely. Prager and Time11 (198 1) described the healing phenomenon:
"When two pieces of the same amorphous polymeric material are brought into contact at a temperature above the glass transition, the junction surface gradually develops increasing mechanical strength until, at long enough contact times, the 1 1 1 fracture strength of the virgin material is reached. At this point the junction surface has in all respects become indistinguishable from any other surface that might be located within the bulk material we say the junction has healed."
Wool and O'Connor (1981) identified stages of the healing process that influence mechanical and spectroscopic measurements: (a) surface rearrangement, (b) surface approach, (c) wetting, (d) diffusion, and (e) randomization. Kim and Wool (1983) introduced the concept of minor chains and described the diffusion model. Later, de Gennes (1971) explained the microscopic sequences in a reptation model related to the Kim and Wool (1983) diffusion and minor chains model. The term "reptation" was defined as a chain traveling in a snake-like fashion, due to thermal fluctuation, through a tube-like region created by the presence of neighboring chains in a three-dimensional network. de Gemes (1971) explained that the wiggling motions occur rapidly, that their magnitudes are small, and that in a time scale greater than that of the wiggling motions, a chain, on average, moves coherently back and forth along the center line of the tube in a certain diffusion constant, keeping its arc length constant.
Macromechanically, the most common technique used to describe the healing properties of polymers is to measure fracture mechanics parameters of a specimen that has healed. The fracture properties often used to evaluate healing potential are: energy release rate, GI; stress intensity factor, KI ; fracture stress, a,; and fi-acture strain, These properties are dependent on the
duration of the healing period, temperature, molecular weight, and pressure applied during the healing period.
Kim and Wool (1983) used the critical energy release rate, G, to define the portion of a chain that escapes from the tube-like regions defined earlier and influence the healing process through reptation-type interaction. Their model predicted that:
where t is the duration of the healing period, and M is the molecular weight. They also proposed the following experimental relationship:
where a, is the fracture healing strength, and a,, is the original strength.
The temperature dependence of healing mechanisms has been reported by many researchers: Jud and Kausch (1979); Wool and 07Connor (198 1); and Wool (1 980). An increase in the test temperature shifts the recovery response to shorter times. Wool constructed master healing curves by time-temperature superposition. Researchers in the area of polymer healing have also reported on the restoration of secondary bonds between chains of microstructural components and that Van der Wads forces or London dispersion forces play a very important role in healing. Surface forces, electrostatic forces, and hydrogen bonding have been reported to induce adhesive healing. It has also been pointed out that adhesive forces and the bulk viscoelastic properties of the "hinterland" adjacent to the interface are the most important factors in the adhesion of elastomers.
Other healing research (de Zeeuw and Pontente, 1977; Bucknall et al., 1980), touts the orientation and interpenetration of the flowing material as influencing the strength of the crack healing effect and that this flow is dependent on healing temperature, contact period, and the extent of melt displacement.
In order to understand the healing mechanism of asphalt concrete, it is helpfbl to keep the healiig models developed for polymers in mind. Petersen (1984) claims that the association force (secondary bond) is the main factor controlling the physical properties of asphalt. That is, the higher the polarity, the stronger the association force is, and the more viscous the fiaction is, even if molecular weights are relatively low. Petersen also presented a vivid description of the effect of degree of peptization on the flow properties as follows:
"Consider what happens when a highly polar asphaltene fraction having a strong tendency to self-associate is added to a petrolene fraction having a relatively poor solvent power for the asphaltenes. Intermolecular agglomeration will result, producing large, interacting, viscosity-building networks. Conversely, when an asphaltene fraction is added to a petrolene fi-action having relatively high solvent power for the asphaltenes, molecular agglomerates are broken up or dispersed to form smaller associated species with less inter-association; thus, the viscosity-

building effect of the asphaltenes is reduced."
Traxler (1960) also suggested that the degree of dispersion of the asphalt components is inversely related to the complex (non-Newtonian) flow properties of the asphalt.
Recent Developments in Research Affecting Fracture Healing
A very significant breakthrough in the understanding of the effect of the composition of the asphalt on the healing of asphalt was made by Little et al. (1 987). They found that healing was directly proportional to the amount of longer-chained aliphatic molecules in the saturates and long- chained aliphatic side chains in the napthene aromatics, polar aromatics, and asphaltenes generic fractions. They used methylene to methyl ratio (MMHC) as a quantifier of the nature of the long- chained aliphatic molecules and side chains. The MMHC is defined as the ratio of the number of methyl and methylene carbon atoms in independent aliphatic molecules or aliphatic chains attached to cycloalkanes or aromatic centers. Little et al. (1987) also found indications that the L. E. T. C. settling test is a predictor of healing but did not have sufficient data to thoroughly investigate this hypothesis. However, this finding is in keeping with Petersen's view of the effects of peptization on flow properties.
Prapnnachari (1992) continued some of the healing work and tried to relate fracture healing with relaxation spectra. He found evidence that the healing index and the relaxation spectra are indeed related. However, in their research, Little and Prapmachari (1991) discovered that the same methylene to methyl ratio determined by Benson to be a significant indicator of the healing index is also indicative of the relaxation properties of the asphalt cement binders. Prapmachari used the FTIR to evaluate the asphalt cement while being stretched. Aliphatic appendages or "side chains" were found to significantly influence the relaxation properties of the binders tested. This finding in conjunction with the finding of Little et al. (1987) with regard to the effect of MMHC on healiig index places added significance on fkther studies of the effects of aliphatic appendages on the various generic fiactions.
Perhaps these findings of Little et al., (1987) and Prapnnachari and Little (1 991) are verifications of Petersen's thoughts concerning the effect of association forces and dispersion on the flow and hence fracture healing properties of asphalt concrete. The extensive studies of Western Research Institute (WRI) in the Strategic Highway Research Program (SHRP) have provided a much more complete model of asphalt composition and microstructure. This leads to a better understanding of how the compositional factors in the asphalt binder and in the mix interact to influence healing.
A major breakthrough in the SHRP study by WRI was the development of a more accurate microstructural model of asphalt cement. Whereas asphalt has often been popularly viewed in the past as a micellar model, the new model pictures the microstructure of the asphalt as a continuous, three-dimensional association of polar molecules dispersed in a fluid of non-polar or relatively low- polarity molecules. This model differs from the older micellar model in several ways. First, the micellar model postulates that the asphalt is a colloidal system with particles of a dimension that is

very large on a molecular scale, representing agglomerations of many individual asphalt molecules. By contrast, the "new" model views the asphalt molecular structure as very small, with no large- scale assemblages of molecules. Instead, the structure depends upon instantaneous bonding among the wide variety of polar molecules dispersed in the asphalt.
The "new" model pictures the asphalt's molecular structure as continually forming and reforming as energy flows to and from the asphalt through the medium of external loading and temperature fluctuations. The "new" model stresses the importance of the polar asphalt molecules in mediating performance to a greater degree than does the micellar model. The principal class of molecules affecting performance might be the amphoteric materials the ones that have at least one negative and one positive charge in the same molecule.
Thus this "latest" model of the asphalt microstructure is most certainly one that accommodates the phenomenon of "healing." In this model, the viscoelastic properties of the asphalt, and its response to load and temperature-induced stress, result directly from the making and breaking of bonds between polar molecules. When the asphalt is subjected to stress, these secondary bonds are broken and reformed continuously. The result is that the molecules move relative to each other. This is an excellent description of "healing."
At first glance, the "new" three-dimensional model offered by SHRP may seem to contradict the strong positive relationship between MMHC, or the cumulative effect of aliphatic appendages, and healing. The three-dimensional model would seem to relate healing to continuous making and reforming of secondary (polar-activated) bonds whereas the MMHC indicates a dominant influence of non-polar aliphatics. However, upon more carefbl consideration, the effect of aliphatic appendages may be to act as tiny buffers or springs that inhibit agglomeration of the more polar fraction. This may help preserve a more dispersed structure and superior ability to flow across micro-fracture faces, or the aliphatic appendages may actually act in a reptation-type interaction with polar molecules in a synergistic fashion that has yet to be defined.
The latest SHRP studies do indeed offer encouragement that the healing phenomenon can be better understood by carefully considering the DPF model in an experimental matrix of mechanical healing tests.
Kim et al., (1990) used the elastic-viscoelastic correspondence principle (CP) to evaluate the hysteretic behavior of asphalt concrete. This principle simply states that one can reduce a viscoelastic (time-dependent) problem to an elastic (time-independent) problem merely by working in an appropriately transformed domain and substituting elastic moduli.
The nonlinear viscoelastic CP was developed by Schapery in 1984. He suggested that the constitutive equations for certain nonlinear viscoelastic media are identical to those for the nonlinear elastic case, but stresses and strains are not necessarily physical quantities in the viscoelastic body. Instead, they are "pseudo" parameters in the form of a convolution integral.

This principle's application to the hysteretic stress-strain behavior of asphalt concrete was illustrated using actual data. Repetitive uniaxial testing was performed under two completely diKerent sets of testing conditions in order to demonstrate the applicability of the pseudo-strain concept. The details of the testing conditions included the following:
Test 1 Test 2
Controlled-stress test Controlled-strain test Compressive loading Tensile loading Haversine wave form Saw-tooth wave form 0.2 dcycle 1 dcycle Short rest periods (1,4,8,16 s) Long rest periods (5,10,20,40 min) Densely graded asphalt concrete Sand-asphalt (AC)
When cyclic loading is applied to asphaltic mixtures, hysteresis loops are usually observed from the stress-strain curves with changing dissipated energy (i.e., area inside the stress-strain curve) as cycling continues. Based on the control mode (controlled-stress versus controlled- strain), two different trends are observed in the stress-strain behavior, as are illustrated in Figure 6. It is noted here that the stress and strain levels in Figure 6 are low enough not to induce any significant damage in the specimens. Relaxation moduli are determined fiom the mixtures, and pseudo strains are calculated using the convolution integral. The data presented in Figure 6 are replotted in Figure 7 using the pseudo strains instead of the physical strain on the abscissa. The figures indicate that, regardless of the control mode, the hysteric behavior from cyclic loading disappears when pseudo strain is used, except for the first cycle, during which some minor adjustments occur in the specimen and test setup. It is also noted that the stresdpseudo-strain behavior is linear.
The same approach is employed to investigate the ability of the CP to account for the relaxation effect during rest periods. Figure 8 presents the hysteresis loops observed in the controlled-strain and controlled-stress testing before and after rest periods. Again, the stress and strain levels are kept low so as not to induce any damage. A significant increase in the dissipated energy is observed after the rest period, irrespective of the control mode. Pseudo strains are calculated and plotted against the stress values in Figure 9. The use of pseudo strain successllly eliminates the effect of relaxation and results in a linear, elastic-like behavior between the stress and pseudo strain.
On the basis of the observations made fiom Figures 7 and 9, it can be concluded that, as long as the damage induced by the cyclic loading is negligible, the pseudo strain can be utilized to eliminate the time-dependence of asphaltic mixtures fiom the hysteretic behavior, irrespective of mode of control, loading type (tension versus compression), loading rate, wave form, or length of rest period. It is this use of pseudo strain that makes it possible to evaluate the healing mechanism during rest periods separately from the relaxation.

Figure 6. Hysteretic Stress-S train Behavior with Negligible Damage : (a) Controlled-Stress Test; @) Controlled-Strain Test.
Pseudo Strdn
Figure 7. Application of CP to the Data in Figure 6: (a) Controlled-Stress Test; (b) Controlled-Strain Test.

Figure 8. Effect of Rest Periods on Stress-Strain Behavior (With Negligible Damage): (a) Controlled-Stress Test; (b) Controlled-Strain Test.
To evaluate fracture healing, the load amplitude is increased to a level at which significant damage growth can be expected during cyclic loading. Again a significant increase in the dissipated energy is observed by comparing the stress-strain diagrams before and after the rest periods. This recovery of energy could result from either relaxation or healing, or both. As mentioned previously, one cannot determine how much recovery in the dissipated energy is related to healing merely by looking at stress-strain diagrams. Therefore, pseudo strains were calculated for both the controlled-stress and controlled-strain tests and plotted against the stresses in Figure 10. Different stresdpseudo-strain behavior is observed in Figure 10 compared with that in Figure 9, where negligible damage occurred. Because the beneficial effect of the relaxation phenomenon now has been accounted for by using pseudo strain, changes in the stresdpseudo- strain curves during the rest periods, as observed in Figure 10, must result from the fracture healing of microcracks.
One can determine the propensity for microcrack healing in different mixtures by measuring the difference in areas under the stress-pseudo strain curves before and after a rest period and normalizing it by the stress-pseudo strain area before the rest period. This method has been used successfblly in differentiating the healing potentials of various binders.

-
t as.os_!hl I . 0 .001
31 4 Pseudo Straln
Figure 9. Application of CP to the Data in Figure 8: (a) Controlled-Stress Test; @) Controlled-Strain Test.
20
40 d n . raet pnlod - - - ucrtoad~ng path baford 10 40 d n . rert period
unbdlrg path attar 40 dn. rert pdod
'
8 o
Figure 10. Stress/Pseudo-Strain Behavior Before and After Rest Periods With Significant Damage: (a) Controlled-Stress Test; @) Controlled-Strain Test.
32

CHAPTER 4: PREDICTION OF FATIGUE DAMAGE AND HEALING USING VISCOELASTIC CONSTITUTIVE THEORY AND WORK POTENTIAL THEORY IN A CONTINUUM DAMAGE MODEL
Evaluation of Microdamage Healing in Flexural Fatigue Experiments
Kim et al., (1 998) evaluated the effects of rest periods on the fatigue life in repeated load flexural beam fatigue experiments conducted at 20°C. He evaluated three distinct loading histories: 1) repetitive loading at 20°C without extended periods, 2) repetitive loading at 20" C with three rest periods at 20°C' and 3) repetitive loading at 20°C with three rest periods at 60°C.
Kim et al., (1998) fabricated asphalt concrete beams for flexural fatigue testing with identical bitumen contents and compacted asphalt slabs (fiom which test beams were cut) with a roller-type compactor to an air void content of 4.0%. Each beam was fabricated with Watsonville granite and either one of two bitumens from the SHRP Library: AAD or AAM.
During the testing sequence flexural stiffness was measured continuously and dynamic modulus of elasticity was determined periodically using an impact resonance method. Both measures of "stiffness" defined a classic S-shape damage curve for load-controlled fatigue, as shown in Figure 11 (with no rest periods).
During test sequences 2 and 3, where rest periods were introduced, the "rested stiffness7' was determined after 200 load cycles following the rest period. This was done to allow stabilization of the loading and measurement devices. The rest period in these experiments was 24 hours, and after 60°C healing sequences, the specimen was allowed to come to 20°C temperature equilibrium before the test was resumed and before measurements were taken.
Rest periods were found to extend the fatigue life by essentially shifting the fatigue curve to the right. After each rest period, the modulus or stifiess follows a negative curve down until it reestablishes the curvature that would have occurred without rest periods. According to Kim et al., (1998), this is the point where the healed microcracks have reopened to the extent that occurred prior to the introduction of the rest periods. At this point additional cracks began to develop and the benefit of the rest period is not apparent in terms of the rate of damage (stiffness loss) but is evident only in the horizontal shifts in the fatigue relationship. This is illustrated in Figure 12 where damage is recorded in terms of loss of flexural stiffness. Figure 11 compares the solid S-curve developed in fatigue testing without rest periods and the dashed line, which

I - no rest periods - .- wl rest periods (
Failed at \ * - - Failed at ' /- - . 30000
\ 14500 ?
50% Stiffness
0 I0000 20000 30000 40000
Number of Cycles
Figure 1 1. Flexural Stiffiess Versus Number of Cycles to Failure in Flexural Beam Fatigue Testing With and Without Rest Periods (at 20°C).
60 C Healing
50% Stiffness \
I
s0O.w I a a Fgled at I 5oo.00~ 0 10000 20000 0 10000 20000 30000 4oooc
so000 40000 Number of Cycles Number of Cycles
\
Failed at 38000
Figure 12. Typical Flexural Stiffness as a Function of Fatigue Damage and Rest Periods: (a) 20" C Healing; (b) 60" C Healing.

represents the shift (due to healing - rest periods) in the plot of flexural stiffness versus loading cycles (fiom Figure 12). In this case the dashed curve connects the last data point representing loss of flexural stiffness versus number of fatigue cycles prior to the introduction of each rest period.
The percentage increase in number of cycles to failure was calculated based on the differences between control tests without rest periods and healing tests where the specimens were allowed three rest periods. Using this method, the AAM mixtures show a much greater potential to heal than the AAD mixtures at both temperatures. Also, for both mixtures, the higher healing temperature results in greater increases in the number of cycles to failure. The number of cycles to failure, N, for the AAM control tests are significantly lower than those for the AAD control tests, which contributes to the large difference between the two mixtures using this healing indicator. The percentages reported are averages of at least two replicate tests at 4% air voids.
In an effort to eliminate the effects of the different number of cycles to failure for the control tests, a damage indicator was developed by Kim et al., (1998). The damage indicator is defined as the ratio between the number of cycles a specimen has endured at a particular rest period and the number of cycles to failure for that particular specimen. Alternatively, the damage indicator can be described as the percentage of fatigue life consumed at a specific time. The percentage increases in modulus and flexural stiffhess at rest periods with similar (or common) damage indicators are reported in Table 2 for mixtures prepared with bitumen AAD and AAM. The damage indicator shows that the AAM mixture is a better healer than the AAD mixture but does not explain the difference in healing as affected by temperatures. It is unclear why the damage indicator shows higher healing at 20°C than at 60°C in the AAD mixture.
The horizontal increase is the ratio between the increase in fatigue life due to the three rest periods and number of cycles to failure. The increase in cycles to failure due to healing is determined by evaluating when the modulus or stiffness returns to the value prior to the rest period. This is graphically illustrated in Figure 13. Each value that is reported in Table 2 is an average of at least three specimens. This method is actually a measure of how long it takes for the healed surfaces to refracture once fatigue loading resumes. It indicates the healed material's resistance to damage evolution. Assuming that a better healing temperature only increases the number of healed cracks and not the strength of the healed cracks, this indicator cannot conclusively evaluate the effect of healing temperatures. At higher temperatures, the ratio of the number of cycles gained due to the rest periods, N (numerator) and N, (denominator), increase by the same number of cycles. The magnitude of the increase is such that the indicator (ratio of the two) essentially remains the same for a specific mixture.

Table 2. Comparison of Healing Potentials of Mixtures Prepared With Two Different Binders (AAD and AAM).
I Percent Increase
Number of Cycles to Failure
Method of
Comparison
Common Damage Indicator
Horizontal Increase I 52 1 47 1 32 1 25
Note: All fatigue testing was done at 20°C.
Bitumen AAM
A fourth method of evaluating the healing potential of the two mixtures is to compare the drop in modulus and flexural stiffness before each rest period to the corresponding increase after the rest period. This indicates that AAM has a greater healing potential than AAD and that the higher temperature increases healing. The values reported are averages for both flexural stiffness and dynamic modulus of elasticity at all rest periods for specimens with approximately 4% air voids.
Bitumen AAD
Healing @ 20°C
All four methods of evaluating the healing potential indicate that AAM is a better healer than AAD. This has been observed in uniaxial cyclic fatigue testing of the two mixtures as well.
Healing @ 20°C
Healing @ 60°C
Healing @ 60°C

I - 7 Horizontal Increase=
Damage indicator = 0.6f - i+- \ 50% Stiffness
Failed at 30000 400.00 ' 1
I I
0 10000 20000 30000
Number of Cycles
Figure 13. Graphical Representation of Healing Comparison Methods.
Prediction of Fatigue Damage and Healing in Asphalt Using a Viscoelastic Constitutive and Work Potential Damage Model Theory
Kim et al. (1998) categorized the constitutive factors affecting modeling of fatigue damage into three components: linear viscoelasticity, fatigue damage, and microdarnage healing. In microdamage healing, they included all mechanisms, except linear viscoelastic relaxation, as contributing to the recovery of stifbess or strength during rest periods. These mechanisms include: fracture healing, molecular structuring or steric hardening, and nodlinear viscoelastic relaxation. They used the correspondence principle employing the pseudo-strain concept to eliminate the time- dependence of the material from the hysteresis stress-strain behavior. Then work potential theory, a continuum damage theory based on irreversible thermodynamics principles, was employed to model the mechanical behavior of asphalt concrete undergoing damage growth and microdarnage healing. A damage parameter, based on the generation of microcrack growth, was also used in the modeling of damage as an alternative approach to work potential theory.

Correspondence Ainciple
As discussed in Chapter 3, Schapery (1984) proposed an elastic-viscoelastic correspondence principle (CP) that can be applicable to both linear and nonlinear viscoelastic materials, with or without aging. According to his correspondence principle, for the case of a growing traction boundary surface, the viscoelastic problem can be reduced to an elastic case by using physical stresses and pseudo strains.
For linear viscoelastic materials, a uniaxial stress-strain relationship is:
which can be rewritten as:
a = ER E"
if we define
where E, is reference modulus that is an arbitrary constant. eR is the so-calledpseudo strain. A correspondence can be found between equation (21) and a linear elastic stress-strain relationship.
Experimental verification of the correspondence principle is documented by Kim et. al., (1998) using uniaxial monotonic and cyclic data for asphalt concrete under a wide range of test conditions including both compression and tension, controlled-strain and controlled-stress modes, etc.
Damage Mechanics
Schapery proposed the following time-dependent damage parameter based on a generalization of a microcrack growth law:
f
where p=(l+N)k; N is the exponent in a-eR relationship; and k=(l+l/m) or k=l/m depending on

characteristics of a failure zone. The parameter m is the exponent in the power law relationship between creep compliance and time.
Using the elastic-viscoelastic correspondence principle and the time-dependent damage parameter, S , Kim et al. (1 998) proposed a constitutive model that describes the mechanical behavior of asphalt concrete under uniaxial tensile cyclic loading without rest periods as follows:
where I = initial pseudo stiffness;
R = R
%? E~ -eS = effective pseudo strain; and
4 = the shift in eR represents accumulated permanent deformation in each stress /
pseudo-strain cycle under the controlled-stress mode.
The fbnction F represents the change in the slope of each a-eR loop as damage grows as shown in Figure 14, while the hysteresis fbnction G represents the difference between loading and unloading paths in each cycle. The mathematical representations of the fbnctions F and G can be found in Kim et al. (1998). The effective pseudo strain was used to account for the permanent pseudo strain accumulated in the controlled-stress mode shown in Figure 14. In the validation study (Kim et al. 1998), this model successfblly predicted the mechanical behavior of asphalt concrete all the way up to failure under both controlled-strain and -stress modes.
Although the damage parameter, S, success~lly described the damage growth in asphalt concrete, it may not be directly used to describe the microdamage healing because this parameter is developed based on the generalization of the microcrack growth law. Since the purpose of this research was to develop a constitutive model that can account for both the damage growth and microdamage healing, the work potential theory seemed to be more appropriate for this purpose because of its generality. Therefore, using the work potential theory, the constitutive model equation (23) was extended to account for both the damage growth and healing as follows:
where H = the healing function representing the change in secant pseudo stiffness due to rest periods.
It should be noted that the fbnctions F and H characterize the changes in SR due to damage growth and healing, respectively, and the function G accounts for the difference in stress values between loading and unloading paths. Since the cyclic change in SR is required to characterize the
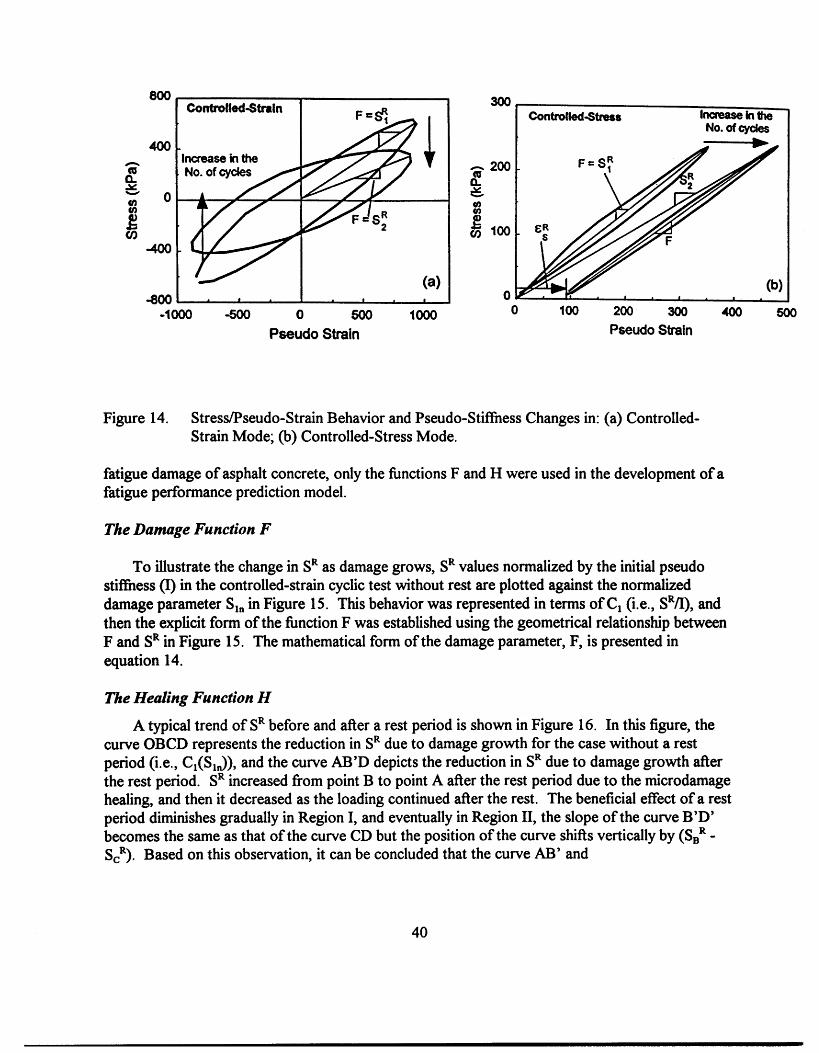
ControbdS~ln
Increase &I the
-1000 -500 0 MK) lo00
Pseudo Strain
Corttrdled-Stress I m h t h - No. of cydes
0 100 200 300 ((00 500
Pseudo Strain
Figure 14. StresdPseudo-Strain Behavior and Pseudo-Stiffness Changes in: (a) Controlled- Strain Mode; (b) Controlled-Stress Mode.
fatigue damage of asphalt concrete, only the functions F and H were used in the development of a fatigue performance prediction model.
The Damage Function F
To illustrate the change in SR as damage grows, SR values normalized by the initial pseudo stiffness (I) in the controlled-strain cyclic test without rest are plotted against the normalized damage parameter S,, in Figure 15. This behavior was represented in terms of C, (i.e., SR/I), and then the explicit form of the knction F was established using the geometrical relationship between F and SR in Figure 15. The mathematical form of the damage parameter, F, is presented in equation 14.
The Healing Function H
A typical trend of SR before and after a rest period is shown in Figure 16. In this figure, the curve OBCD represents the reduction in SR due to damage growth for the case without a rest period (i.e., C,(S,,J), and the curve AB'D depicts the reduction in SR due to damage growth after the rest period. SR increased from point B to point A after the rest period due to the microdamage healing, and then it decreased as the loading continued after the rest. The beneficial effect of a rest period diminishes gradually in Region I, and eventually in Region 11, the slope of the curve B'D' becomes the same as that of the curve CD but the position of the curve shifts vertically by (SBR - ScR). Based on this observation, it can be concluded that the curve AB' and

Figure 15. Change in Normalized Pseudo Stiffness as Damage Grows: (a) AAD Mixture; (b) AAM Mixture.
1 .o Region I
0 10 20 30 40 50 No. of Cycles
Figure 16. Change in Pseudo Stiffness Before and After a Rest Period.

the curve B'D' represent, respectively, reestablishment of damage in the healed zone and damage growth in virgin material. The mathematical form of the H-parameter is presented as equation 15.
Accurate modeling of the changes in SR during and after rest periods requires two internal state variables: one for the increase of SR during rest periods due to microdamage healing (Sa and the other for the reduction in SR after rest periods due to damage evaluation (S,). A careful study of the experimental data resulted in an equation for the healing function H is developed by Kim et al. (1998).
Validation of these models using compound loading histories composed of multilevel loading and varying rest periods under both controlled-strain and controlled-stress modes was successM. The validation results and analytical details involved in developing these models are presented in Volume 4. Only important observations necessary to highlight the physical implications of the model are discussed here.
Fatigue Performance hediction Modeling
The experimental study presented above suggests that the change in SR can be represented by two functions, C, and H. It also can be concluded from Figure 15 and visual observation of the fatigue tests that C, decreases much faster near the failure, and that the reduction in SR by 50% from the initial SR value can be effectively used as the failure criterion irrespective of the mode of loading and the stredstrain amplitude used.
These findings lead to the following fatigue performance prediction model:
Failure occurs when C, + H < 0.5 (26)
The left-hand term is a finction of the three internal state finctions (ISF's), which represent the damage growth in virgin and healed materials, respectively. These ISF's demonstrate a significant difference between mixtures AAD and AAM. This trend is well displayed in Figure 15.
A limited validation study was performed on the fatigue performance prediction model equation (26) using fatigue test data from AAD and AAM mixtures under the controlled-strain mode. Table 3 summarizes the validation results. A good agreement is seen between the measured and predicted values. Without counting the case of the AAM mixture without rest periods at 0.001-unit strain amplitude in Table 3, the maximum percent error between the predicted and the measured N;s was 6%. The major reason for 143% error in the AAM specimen with 0.001-unit strain amplitude is the abnormal rate of pseudo stiffness change, especially near failure, compared with other AAM specimens tested for the determination of the model coefficients. Recognizing that only one specimen was tested in each of the strain histories shown in Table 2 and thus the sample-to-sample variation affected the prediction accuracy directly, less than 10% error in 7 out of 8 cases is deemed satisfactory.

Table 3. Summary of Fatigue Lives for Controlled-Strain Cyclic Tests.
Mix Strain wlo Rest w/Rest W n g
Amp. . Measured (Unit) Measured Predicted % Measured Predicted %
Error Error
0.0014 4,400 4,470 2 1 3,000 12,500 4 195 AAD
0.00 1 21,100 2 1,800 3 22,500' NIA~ NIA 7'
0.0006 230,000 241,600 5 N/A NIA NIA NIA
0.0014 3,800 3,950 4 5,l 00' N/A NIA 34' AAM
0.001 13,500 32,800 143 71,000 75,400 6 426
0.0007 161,000 159,500 1 N/ A NIA N/A N/ A
a Specimens failed before the designed number of rest periods were applied. Not available.
The essence of the Kim et al. (1998) constitutive model is that it can be effectively used to predict fatigue behavior independently of the mode of loading (i.e., controlled-stress or controlled-strain). Furthermore, to adequately predict fatigue damage using the constitutive model, it is imperative to account for the effects of microdamage healing.

CHAPTER 5: PREDICTION OF FATIGUE DAMAGE AND HEALING USING A MICROMECHANICS FATIGUE AND HEALING MODEL
In this study Lytton et al. (1996) and Chen (1997) developed an analysis approach based on continuum damage mechanics (CDM) and micromechanics to assess microdamage healing. The first task was to apply this micromechanics fracture healing model (MFHM) and derive a finite element formulation with which the fracture properties of asphalt mixtures could be calculated. By using Griffith's (1920, 192 1) model for total energy per unit area for a cracked element and the MFHM concept, they were able to develop a mechanical equation to describe damage due to the growth of multiple microcracks under loading. The Weibull distribution was then utilized to simulate microcrack growth and size distribution with each load repetition. The details of this approach are discussed in Volume 3 (Lytton et al. 1998).
This approach resulted in a relationship between the ratio of the reduced modulus of the asphalt sample under loading, E', to the modulus of the undamaged sample, E, and the change in dissipated pseudo-strain energy per load cycle, dWldN. As previously described, pseudo strain energy (PSE) was calculated using the viscoelastic correspondence principle. According to the relationship, the ratio of reduced modulus due to damage and original modulus of the undamaged specimen, Ef/E, is not only a fhnction of dW1dN but also certain material properties of the mixture including Paris fracture constants A and n and the Weibull crack distribution parameters p and y. These parameters and their application are discussed in detail in Volume 3.
This measured value of dW1dN is used in analyzing the laboratory tests that were made to determine the material properties that are related to microcracking. This use of the measured rate of change of dissipated pseudolstrain energy is explained in Volume 3 and particularly in equations (60) through (74) of that Volume.
The finite element formulation developed in this study accounts for the development of a distribution of microcracks according to GriEth7s theory. These microcracks develop perpendicular to the application of the tensile load and grow according to a Weibull distribution during cyclic loading. Damage is recorded as the modulus in the direction of the applied tensile load and is reduced during the process of microcrack growth. The ratio of reduced modulus, E', to the original modulus, E, is related to the rate of change in dissipated pseudo strain energy, dWldN and basic fracture properties, including the Paris parameters A and n and other parameters that explain microcrack distribution ( p, d, and q) as well as the cohesive surface energy density of
the mixture, r, the stress state in the sample (a and r ) and the average crack length c . The
relationship is presented conceptually as:
E' - = F(dW/dN,An,p,d,q,r, 2 , o andr) E
(27)
where F( ) represents a fhnction of all of the variables listed. The exact form of equation 27 is

presented, developed, and discussed in Volume 3.
Chen (1997) developed a finite element model of a cylindrical test sample subjected to direct tensile, controlled-strain loading. Using the relationship shown conceptually in equation (27), Chen recorded the ratio of reduced stiffness and dW1dN throughout the test sequence and then used a system identification method to determine the basic fracture properties and the Weibull distribution of crack length (including the expected value of crack length). Figure 17 illustrates a calculated distribution of average microcrack length as a finction of load application. Note the increase in average microcrack length as load cycles increase and the reduction in average microcrack length following a rest period during which microcrack healing occurs.
The dramatic reduction in average microcrack length after the rest period stems from a recovery in PSE and a concomitant recovery in pseudo stiffness. These reflect microcrack healing.
Load Cycle N
Figure 17. Change in Crack Length During Loading Cycles and Reduction of Mean Crack Length Following Rest Periods.
Note: After 22 loading cycles in loading period No. 1 a 2 minute rest period is introduced before beginning loading cycles No.2. The rest period produces a 50% reduction in average crack length.
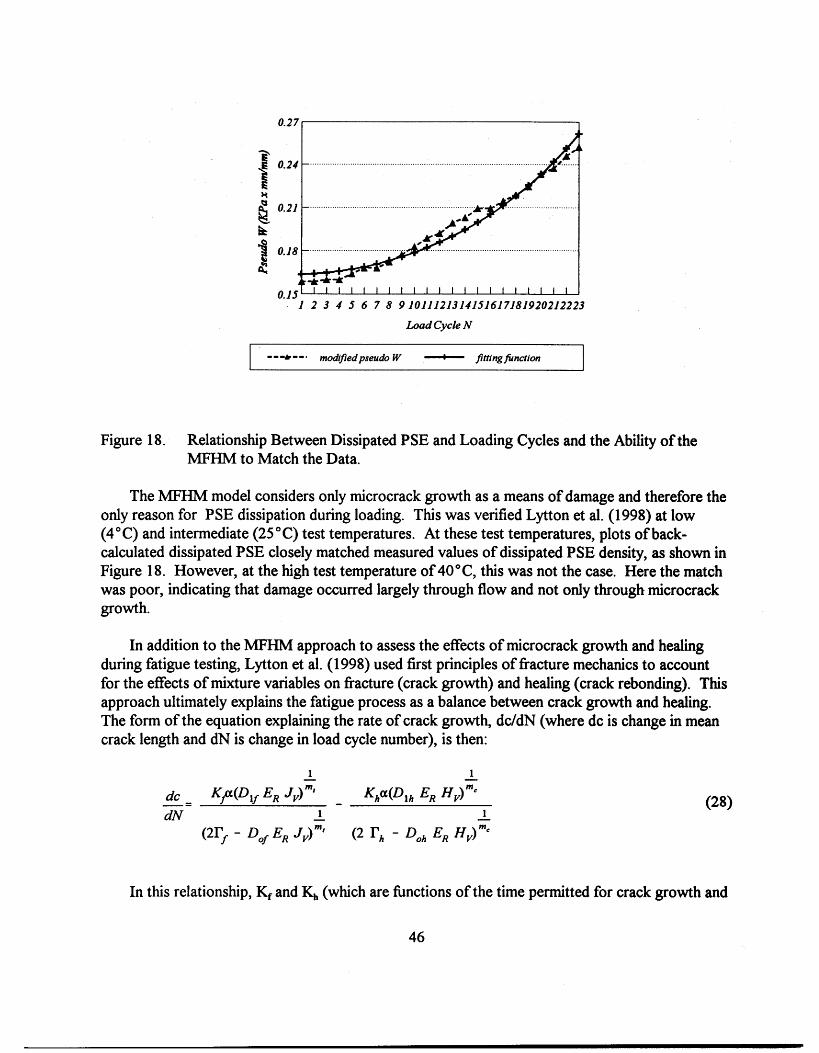
1 2 3 4 5 6 7 8 91011121314151617181920212223
Load Cycle N
Figure 18. Relationship Between Dissipated PSE and Loading Cycles and the Ability of the MFHM to Match the Data.
The MFHM model considers only microcrack growth as a means of damage and therefore the only reason for PSE dissipation during loading. This was verified Lytton et al. (1998) at low (4" C) and intermediate (25 " C) test temperatures. At these test temperatures, plots of back- calculated dissipated PSE closely matched measured values of dissipated PSE density, as shown in Figure 18. However, at the high test temperature of 40°C, this was not the case. Here the match was poor, indicating that damage occurred largely through flow and not only through microcrack growth.
In addition to the MFHM approach to assess the effects of microcrack growth and healing during fatigue testing, Lytton et al. (1998) used first principles of fracture mechanics to account for the effects of mixture variables on fracture (crack growth) and healing (crack rebonding). This approach ultimately explains the fatigue process as a balance between crack growth and healing. The form of the equation explaining the rate of crack growth, dc/dN (where dc is change in mean crack length and dN is change in load cycle number), is then:
In this relationship, K, and K, (which are fbnctions of the time permitted for crack growth and

healing) are constants; a is the length of the process zone before the crack surface; D, and D,, are components of tensile compliance; D, and D,, are components of compressive compliance; E, is a reference modulus; J, is the viscoelastic J-integral (the change in dissipated pseudohtrain energy per unit of crack growth area from one tensile load cycle to the next); & is the viscoelastic H- integral (the change in dissipated pseudo-strain energy per unit of crack healing area from one compressive cycle to the next); m, is the slope of the tensile compliance relationship; m, is the slope of the compressive compliance relationship; I?, is the surface energy density of a crack surface in fiacture (dewetting); and rh is the surface energy density of a crack surface in healing (wetting).
The micromechanics model hrther verifies that crack growth is the mechanism of damage in the samples subjected to repeated tensile fatigue loading as values of I?, and I?, were back- calculated from the dissipated PSE data and the micromechanics fracture relationship described by equation 27. The back-calculated values for I?, and I?,, were in reasonable agreement with measured values of surface energy densities for the asphalts and aggregates used in this study at temperatures below 25 "C. No such agreement exists above this temperature, indicating that above this temperature the damage mechanism is not primarily microcracking. Having measured all of the components of the total surface energy separately, it was possible to compare these back- calculated values of I' with the independently measured values. The two values compared very well based on experiments at or below 25 "C, as is shown in Tables 5 through 10 of Volume 3.
CHAPTER 6: LABORATORY AND FIELD EVIDENCE OF MICRODAMAGE HEALING
Laboratory Evidence of Healing - The Healing Index
General Discussion
The ability of an asphalt mixture to recover from damage occurring during a controlled-strain fatigue test was assessed using the concept of the healing index (HI). This index (HI) is defined as the ratio of the recovered dissipated PSE following a rest period to dissipated PSE measured prior to the rest period:
Healing Index = HI = f$$, -&J
4 where
ad = Dissipated pseudo-strain energy (PSE) when the damaged sample is loaded ah = Dissipated pseudo-strain energy (PSE) when the healed sample is loaded.
Controlled-strain fatigue testing was performed on 100-mrn-diameter by 200-mm-high cylindrical samples of asphalt concrete prepared by kneading compaction with an air void content of 4.0% and with a tolerance of 0.25%. Each mixture was prepared with 5.0% bitumen. The initial load on each sample consisted of the application of 350 microstrain over a period of 0.5-s. The strain was held for 10-s and then removed over a 0 5 s period. This trapezoidal strain was used to calculate the characteristic compliance of each mixture, which is an important material property used in the micromechanics model. Following the initial trapezoidal function, the controlled- strain experiment consisted of haversine loading applied of 0.1-s with a 0 5 s rest period between haversine load applications.
The strain induced during each haversine load was converted to pseudo strain by adjusting the strain wave form for the effects of relaxation with application of the Boltzmann superposition principle. This process is explained in detail in Volume 2. This conversion to pseudo strain eliminates the time-dependent effects. A resulting plot of pseudo strain versus pseudo stress represents the hysteresis plot of PSE that produces cracks and crack growth. Figure 19 is an example of the PSE hysteresis plot of sample M/DG/21. Notice the substantially increased level of PSE following the rest period compared with that before the rest period. This trend was consistent with all samples tested, but the degree of PSE recovery varied significantly with the different materials evaluated.
The healing index is simply a "picture" of the change (recovery) that a sample undergoes during a rest period. The HI is actually a recovery in stiffness of the mixture at the stress required to produce a target strain (350 microstrain in this series of testing). The HI is therefore not a material property like compliance or relaxation moduli. Since the HI is not a fundamental property, its values have rightly been questioned as being possibly tainted by the mechanisms of
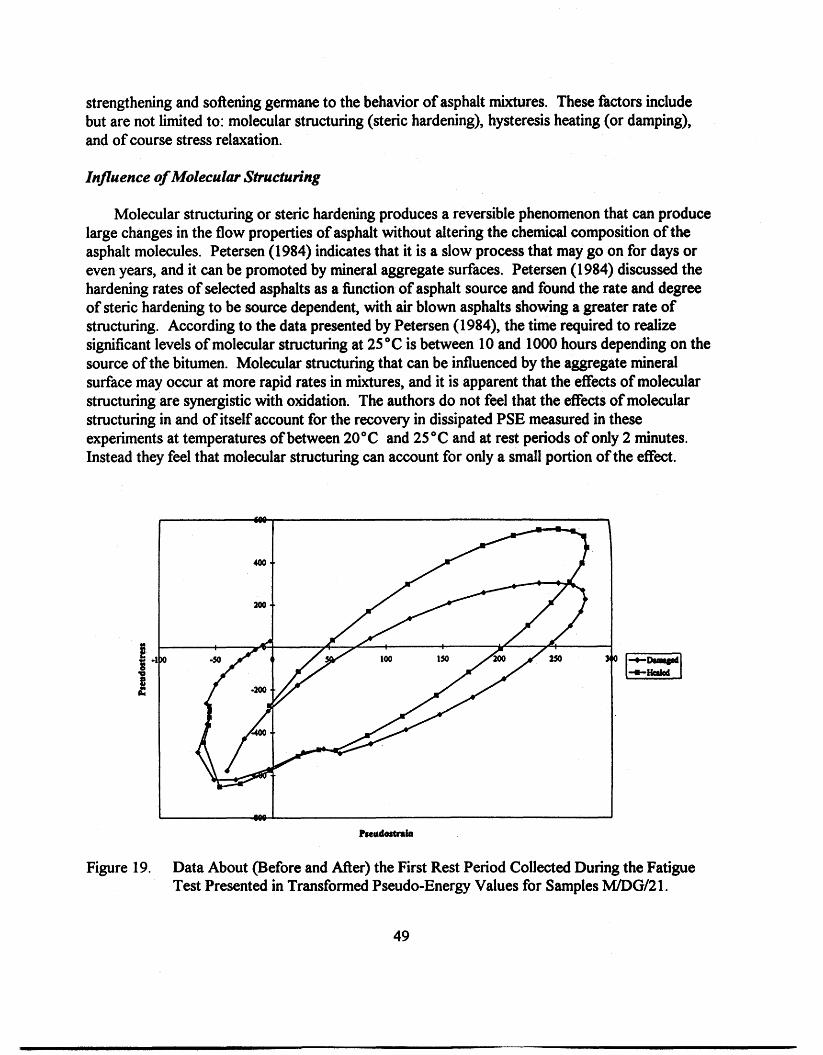
strengthening and softening germane to the behavior of asphalt mixtures. These factors include but are not limited to: molecular structuring (steric hardening), hysteresis heating (or damping), and of course stress relaxation.
Influence of Molecular Structuring
Molecular structuring or steric hardening produces a reversible phenomenon that can produce large changes in the flow properties of asphalt without altering the chemical composition of the asphalt molecules. Petersen (1984) indicates that it is a slow process that may go on for days or even years, and it can be promoted by mineral aggregate surfaces. Petersen (1984) discussed the hardening rates of selected asphalts as a finction of asphalt source and found the rate and degree of steric hardening to be source dependent, with air blown asphalts showing a greater rate of structuring. According to the data presented by Petersen (1984), the time required to realize significant levels of molecular structuring at 25 "C is between 10 and 1000 hours depending on the source of the bitumen. Molecular structuring that can be influenced by the aggregate mineral surface may occur at more rapid rates in mixtures, and it is apparent that the effects of molecular structuring are synergistic with oxidation. The authors do not feel that the effects of molecular structuring in and of itself account for the recovery in dissipated PSE measured in these experiments at temperatures of between 20°C and 25 "C and at rest periods of only 2 minutes. Instead they feel that molecular structuring can account for only a small portion of the effect.
Figure 19. Data About (Before and After) the First Rest Period Collected During the Fatigue Test Presented in Transformed Pseudo-Energy Values for Samples M/DG/21.
Confounding Effects of Temperafure
The analysis of the effects of temperature on the mixture response due to hysteresis heating under the type of haversine loading used in this testing is discussed in detail in Volume 2. Asphalt samples must undergo a considerable number of fatigue cycles (thousands) to develop significant temperature changes, which would affect the modulus of the mixture. This is likely due to the need for the asphalt, which exhibits the damping behavior in tensile tests, to heat the aggregate, which comprises approximately 95% by mass of the mixtures tested in these experiments. Once heated, the mixtures cool at a very slow rate, which must decrease with cooling as the thermal gradient between the specimen and its surroundings diminishes. Work by Di Bennedetto et al. (1996) in fatigue testing at a loading rate of lOHz required 75,000 cycles to increase the temperature of a mixture by 1.2"C. This apparently represents a steady-state condition. He also observed that the specimen required at least 1000-s to lose one-half the heat developed during loading. It is unlikely that global heating had an effect on specimens (in these experiments), which are tested for 200 cycles per loading sequence. To check this, the samples were monitored during testing at TTI by placing thermocouples on the exterior of the samples. The temperature fluctuation during the experiment fiom the time the test was begun to the time the rest period was complete was always less than O.OS°C. It is the authors' opinion that the application of 200 loads (damage cycle) at two cycles per s followed by a 2-minute rest period does not provide a significant swing in temperature increase or dissipation to affect the stiffness of the mixture. Localized crack tip heating could indicate a potential for greater molecular mobility and activity at the crack tip, however, as well as a change in the environment in which the asphalt surface interactions occur in the vicinity of the crack with respect to the molecular motion and interaction. This is discussed in Volume 2.
Influence of Specimen Stiffness
Specimen stiffness, in a strain-controlled experiment such as those performed in this study, exerts a powerfbl effect on both the rate of material declination and the potential for temperature evolution. Obviously, since only the applied strain can be controlled, stiffer mixtures will undergo much more rigorous testing in terms of the energy applied to them in a given number of cycles. This energy will be dissipated in a number of ways in asphalt specimens, chiefly through cracking damage and damping.
Damping is dependent directly on the stress amplitude. Since the strain amplitude is controlled in the haversine wave test, the damping is directly proportional to the material stifiess at the time of loading. Thus, the damping will decline with successive loading dependent on the rate of damage. The degree of the effect that stiffness exerts on damping (and therefore the potential for temperature evolution) can only be assessed after the relaxation behavior is removed fiom the scenario, so as to isolate the effects.
Stiffness exerts a great influence on the damage to be developed in the sample in strain- controlled tests of any kind. In the absence of relaxation, it directly relates the dissipated energy to

the applied strain. Since relaxation behavior is present in asphalt mixes and independent of damage, the relaxation effects must be removed from the data before assessing the rate of damage applied to the material. The transformation to dissipated PSE as was done in this study makes this analysis more complete and accurate.
The HI becomes a simple yet powerfbl index by which to evaluate PSE recovery following rest periods. The value of HI has been found to be strongly and statistically significantly affected by the source of the bitumen, additives to the bitumen, the temperature of testing, the length of the rest period and the number of rest periods introduced during a fatigue process, according to Little et al. (1998).
Consideration of Bitumen Composition
Particular emphasis in this study was given to the effects of the chemical and physical nature of the bitumen on the healing index. Asphalt binders were selected, with the help of Dr. Jan Branthaver of Western Research Institute, according to their chemical compositional differences, as shown in Table 4. This matrix in Table 4 serves as a guide for direct evaluation of healing rates with respect to chemical composition. Direct evaluation of the compositional effects was performed by a statistical contrast/comparison test of the mixture data as will be discussed subsequently. As evinced in Table 4, the selected SHRP binders vary in wax, amphoteric, and aromatic quantities.
Table 4. Asphalt Composition Matrices Provided by Western Research Institute.
Am~hoteric Content Wax Content
Aromatic Content
High
High
LOW
Low
l LOW I A A M - I I A A D - I I
AAB-1
AAM- 1
Wax Content
It was the opinion of the research team that strong differences in these compositional factors would have the strongest tendency to affect the healing potential of the mixtures prepared with these bitumens. The aromatic molecules form stacks of molecules due to their flat shape, and the electrons in the aromatic rings interact with one another to form pi-pi bonds. This pi-pi interaction is unique in aromatic molecules and deserves study as to its possible effect on the fatigue process
AAD- 1
AAG- 1
High Low

and in particular microdamage healing. The amphoteric structure is equally interesting and deserving of investigation as a chemical entity that may affect fiacture and healing. An amphoteric material is one that can exhibit either an acidic or basic character. In asphalt this actually means that the asphalt molecule has both an acid and a base group (one or more of each) on the same molecule. Data have provided strong evidence that amphoterics play an important role in building the polar-polar bonds that give asphalt its unique properties. Jones (1992) explains that this interaction makes the asphalt molecules able to form "chains" of weak polar-polar interactions. These chains are the foundation of the network described in the SHRP asphalt model where the asphalt is considered to consist of two entities: interactive polars and non-polars. An example of an amphoteric asphalt molecule is one that has both an acid (i.e, carboxylic acid (COOH)) and basic unit (i.e, sulfoxide (S=O)) on the same molecule. Such a structure allows the molecule to interact at the two sites with two other molecules and continue, not terminate, the interactive or chain-building process among asphalt molecules. The contribution of amphoterics to the general interactivity among asphalt molecules would seem to make amphoterics a factor in the process of flow, dispersion, and healing, Finally, the wax content of the asphalt is important. Waxes are long, aliphatic molecules that may either be amorphous or crystalline in nature depending on the proximity of their arrangement. Interactive forces among waxy molecules include the weak Van der Waals force developed as the long chains of hydrocarbons intertwine and weakly interact.
The aromatics, amphoteric and wax contents of asphalt binders, and their interactions should s e c t the flow and aging characteristics of the binders and hence the fraaure and healing characteristics of the binders. An additional parameter of considerable importance is the herteroratom content. High concentrations of heteroatoms such as sulfur, oxygen, and nitrogen promote polarity. The effects of the heteroatoms are indirectly accounted for when considering the aromatic and amphoteric parameters.
Consideration of Surface Energy
Asphalt concrete is a composite blend of bitumen and aggregate (of a number of size fractions). Unlike other composites, comparatively little has been done to characterize the asphalt-aggregate bond thermodynamically in terms of adhesion and cohesion. The thermodynamic change in the surface free energy is the theoretical work required to break an interface, or to form one. Knowledge of the energy required to sever and reform an interfacial bond would certainly be an important contribution in explaining the fatigue process. The more energy required to sever a bond in the surrounding media, the more work would be required to propagate the crack (other factors being equal). The effect of surface energy on the re- establishment (healing of the crack) is equally as important although perhaps not as clearly apparent. The concept will be discussed subsequently based on data collected in these experiments.
Surface energy density (SED) is explained by Schapery (1988) to be an integral part of the fracture and healing processes. Furthermore, Lytton et al. (1998) propose an allied theory of how the rate of fracture and the rate of healing (in asphalt mixtures) can be explained by the first

principles of fiacture originated by Schapery and considering the effects of SED. Since SED is a measurable parameter for both of the two major components of the asphalt mixture (bitumen and aggregate), and since it is related findarnentally to fiacture and healing theory, the authors considered it wise to develop a theoretical understanding that links SED to the fatigue process and hopefblly to explain differences in fatigue and healing among different bitumens and aggregates based on their different SED values (for both bitumen and aggregate). Furthermore, it should follow that SED values of the bitumens should relate to differences in the aromatic, amphoteric, and wax contents of these bitumens.
Discussion of Experimental Data Linking Mechanical Fatigue Testing of Mixtures, Chemical Compositional Measurements, and Surface Energy Density Measurements of the Bitumens Studied
Surface energy testing was performed in the Chemical Engineering Department at Texas A&M University by Elphingstone (1997) using the Wilhemly plate device. The test centers around the use of a highly sensitive balance, the Cahn C2000, married to a computer-controlled motor and data acquisition module. In the experiment, asphalt-coated plates are lowered into and pulled out of different fluids (water, glycerol, and ethylene glycol). The angles of wetting and dewetting are very carefblly measured during the process, and the rate of advancement and extraction are very carehlly controlled. The protocol measures a surface energy of wetting and a surface energy of de-wetting. The surface energy of wetting is thought to be directly related to the potential for microcrack healing, and the results of this testing are summarized in Table 5 for the five binders included in the experiment.
Table 5. Healing (or Wetting) Surface Energies of Various Asphalts ( d m 2 ) as Measured Using Wilhelmy Plate.
r pW 0 P r r Material 0 CJ CJ 0
10.1 0.5 9.4
AAM- 1 58.2 0.1 5.3 0.1 2.9 0.1 5.6 0.2 0.4 0.1
Note: I' = Total Surface energy density (SED) (mean values)
= Liftshitz-Van der Waals component of SED (mean values) = Acid-base component of SED (mean values)
a = Standard deviations of values I? = Acid component of SED (mean values)
= Base component of SED (mean values)

Two components of thermodynamic surface energy (F) of either wetting or de-wetting have been identified (Good and Van Oss, 1991): Lifshitz-Van der Waals rW) and Lewis Acid-Base (l?). These two components can be used to explain cohesive bonding interactions within the asphalt concrete specimen. Actually both cohesive and adhesive fracture and healing can and do occur. The cohesive fracture and healing is where the crack advances or heals in the binder or mastic region and the adhesive fracture is where the crack advances or heals at the aggregate interface. This discussion is limited to cohesive fracture, which is a significant portion. In fact we believe that most of the healing occurs in cohesive regions, between two mastic surfaces. However, a model of adhesive fracture has been proposed by Lytton in Volume 3. Surface energies of different aggregates were measured as reported in Volume 3, and the surface energy differences among different aggregate types were found to be great. The differences are overpowering when compared with the smaller differences among the various binders, even though the binders were selected based on their wide range of chemical property differences (e.g., amphoteric, aromatics, and waxes).
Lifshitz-Van der Waals effects are the interactions of electron shells of neighboring molecules whereas the acid-base component is due to acid-base interactions among constituent molecules. The Lifshitz-Van der Waals effects are complex and related not only to weak secondary interactions such as Londen Van der Waal forces but also to positional and geometric hindrance effects. The acid-base effects generally dominate for asphalt-aggregate components and are important in the development of strong adhesive bonds that are resistant to the effects of water. The acid-base interaction component, in turn, consists of two components of its own: a Lewis acid parameter and a Lewis base parameter. The acid-base interactions can include stronger forces like hydrogen bonds. The surface energies of the five bitumens were determined from the sum of the Lifshitz-Van der Waals component and the acid-base component.
Fracture and Healing Models Accounting for Suflce Energy
The fbndamental relation of cohesive fracture mechanics as stated by Schapery (1984) was derived from first principles of fracture:
where I', = the surface energy density of a crack surface (units: FL ") ; E, = reference modulus (units: FL-*) used to make equation (10) dimensionally
correct; D,(tJ = tensile creep compliance at time t that is required for a crack to move through a
distance which is the length of the process zone ahead of the crack top (units: F' L~) ; and
J, = the viscoelastic J-integral, which is the change in dissipated PSE per unit of crack area fiom one tensile load cycle to the next (units: FL-').

It is an energy balance: The energy given up on the right-hand side of the equation is taken up by the newly created crack surfaces on the left-hand side of the equation. After expanding the first principles approach to healing speed, Schapery (1989) derived a relationship between healing
speed, 6 , and several material properties including surface energy:
reference modulus, a constant derived of the stress transformation; Poisson's ratio; compressive creep compliance constant (Do is assumed to equal zero); healing integral; wetting surface energy; creep compliance slope; fitting constants; and size of the crack healing zone.
Lytton et al. (1998), on the other hand, used Schapery's findmental fracture equation to postulate a direct parallel cohesive healing process as the reversal of fracture:
Note this is an inverse of the relationship between healing rate and surface energy rh7 and the healing integrals Ii& from the relationship in equation (3 1). K, is a fitting constant.
Schapery's healing model was developed for a linear, isotropic, viscoelastic material assuming interfacial forces of attraction and external or applied loading. This inclusion of surface forces is significant in that it accounts for the case where complete contact of the fractured surfaces is not initially achieved by loading, but rather the healing process is driven in significant part by the attractive forces on the fractured surface. This makes for a self-sustaining process available in some quantity to all systems, virtually regardless of the instantaneous loading regime. The surfaces in Schapery's scheme are assumed to be "locally flat" but not necessarily so throughout the cracked regime. A key representation in Schapery's equation of healing rate to the consideration of microcrack healing in asphalt mixtures is the direct relationship between surface energy and the rate

of microfracture healing, i.e., a greater surface energy signifies a greater potential for healing, all other component remaining the same. It is also important to note that the form of equation (3 1) was developed by assuming that the Do component of the power law compliance is zero. If this were not so, then a more complex form for the healing rate equation will result.
Since the Lytton healing rate model was derived by essentially reversing the fracture laws, it results in a relationship where the healing speed is inversely related to the surface energy, which is seen as an inhibitor to the healing process. Viewed from a conservation of energy standpoint, the surface energy is an energy density required to close a given area of surface crack. The lower the surface energy density, the greater the degree of healing that will proceed under otherwise equal conditions. Viewed in this manner, a higher surface energy density reduces the amount of crack surface that can be closed with the same amount of available energy. Lytton viewed surface energy not as acting as an attractive force between asphalt surfaces on either side of a crack face but as an impedence toward closure or reformation of the cracked surface.
Unified Model of Fracture Healing
Figure 20 presents the healing index for the five bitumens evaluated as a M i o n of the ordinal rest period (i.e., the number of sequential rest periods applied during the experiment). The healing indices in this plot are calculated as explained earlier based on PSE recovered following rest periods. As can be seen from the plot, two bitumens (AAD and AAB) respond with an appreciable immediate level of healing but with no apparent increase in healing throughout the experiment. On the other hand, bitumens AAF, AAG, and AAM show a substantial increase in healing index with additional rest periods. From this relationship it is apparent that some binders, for example AAM, continue to heal with the application of rest periods. The data in Figure 20 are averages of between six and nine samples for each point. The replicates demonstrate the repeatability of the trends. Conceptually one might imagine a fracture that partially heals during a rest period but that re-opens or re-fractures during the fatigue process. Although the fracture healing is not complete, the partial healing delays crack growth. The introduction of more rest periods at the same cracked surface seems to stimulate more of a healing response and hence a greater delay in fracture propagation leading to a greater fatigue life. A similar trend was noted when the healing index was plotted for the various bitumens against the length of a single rest period.
The sampled healing index data were fitted to a general nonlinear model through nonlinear regression. A conceptual picture of the model is presented in Figure 2 1. The model consists of two slopes:
h , which corresponds to short-term healing that is rapidly realized in the asphalt mixtures and

15 20 2s
Rest Period
Figure 20. Healing Index Versus Ordinal Number of Rest Periods for Asphalt Bitumens Prepared with Selected Bitumens.
Time of Rest
Figure 21. Model of the HI Versus Length of Rest Period in Terms of Short-Term Healing Rate
(h,) and Long-Term Healing Rate (h2) .

h which is long-term healing realized more slowly and throughout the test. Also included in
the model is a spacing factor, $ (the maximum percentage of healing that can be achieved by the short-term healing rate). The average healing indices calculated for each specimen per time increment were fitted to the model through a linear transformation. The resulting short- and long- term slopes are as presented in Table 6.
Table 6. Constituents I; I; and Spacing Factor, $, Used to Fit HI to Ordinal Number of Rest 1' 2
Periods Data Using Nonlinear Model.
Parameter
4
4 2
h,
AAD- 1
Bitumen
In the course of analyzing the measured healing data, it was discovered that the actual rate of
dh healing, - is governed by two separate healing mechanisms, one of which is controlled by the dt '
non-polar (Lifschitz-Von der Wads) and the other is controlled by the polar (Lewis acid-base) components of the surface energy densities, r,, and I?,, respectively. Both healing rates occur simultaneously and govern the actual healing rate according to the relation:
where:
'17 h2 = the healing rates generated by the non-polar (I&) and polar (r,) surface
energies;
h = the actual healing rate;
(AtX, = the rest period between load applications; and
h,, = a factor that varies between 0 and 1 and represents the maximum degree of healing
that can be achieved by the asphalt binder.
The theories explaining the two healing rates were developed by Lytton in this project (h,) and
Schapery (4) in 1989. The forms of these two theoretical relations are given above in Equation
(32) for h1 and Equation (3 1) for (h,).
The forms of these relations (equations 3 1 and 32) become more complicated when the glassy compressive compliance of the asphalt mixture, D,, is not zero. Because of their greater complexity, they will not be reported here.
A striking difference between the two formulations is in the ratio of the surface energy r to
the healing integral H,,. The early healing rate depends largely upon h1 which, in turn, depends
upon wLW. The long-term healing rate slows down to approach 4, which depends upon the
ratio I?& the reciprocal of the healing rate governed by the non-polar surface energy.
The empirical evidence of these relations comes from the healing index, HI, measurements that were made and discussed in Volume 2. Although the healing index is a normalized, dimensionless number and is not the same as the actual length of the zone that is healed, it is still an indication of the rate at which healing proceeds. The rates of change of healing index were determined by non-
linear regression analysis. The graph of h,, the early healing index rate, and the non-polar surface
energy component, r,,, is shown in Figure 22. The graph of h the long-term healing rate,
and the polar surface energy component r,, is shown in Figure 23. The two relations reveal the inverse and direct relations predicted by Equations (32) and (3 l), respectively.

R" = 0.7797 -- 0 4
* 0
I 1 I I I
1.5 1.7 1.9 2.1 2.3 2.5
Short-Tenn Healing Rate
Figure 22. Relation Between the Early Healing Index Rate, h , and the Non-Polar Surface
Energy.
0.2 0.3 0.4 0.5 0.6 0.7
Long-Term Healing Rate
Figure 23. Relation Between the Long-Term Healing Index Rate I; 2' and the Polar Surface
Energy.

The rate of crack healing per load cycle, - , is given by an equation that is similar to a equation (33), as shown below:
The value of hp was found empirically to depend upon the ratio of the surface energies, r,I?,,, the polar divided by the non-polar component. Figure 24 shows this empirical relation, which suggests that maximum healing may be achieved by an asphalt binder with a surface energy ratio less than 0.5. This is only part of the picture, however, since it is certain that h,, must also depend upon the compliance of the asphalt mix. All of the relations suggest a very productive line of firther inquiry into the healing properties.
Ratio (ABILW)
L Figure 24. Empirical Relation Between $ and the Ratio - . r,w

In summary, the total healing rate is the result of the external energy contribution, which is converted into the formation of the "closed surface." The rate at which this happens is the sum of two effects explained by Lytton and Schapery, respectively. Lytton's theory explains the resistance offered by the Lifshitz-Van der Waals component, and Schapery's theory explains the contribution to be expected from the polar interactions across the fracture surface and within the resulting mixture by polar forces and acid-base components. These two mechanisms act from the very beginning of the crack-face contact, but it is anticipated that the Lifshitz-Van der Waals component comes to equilibrium far sooner than does the acid-base component. This is the reason for the continuation of
the long-range effect ( slope h, ) after the additive effect of the short-range effects are
accounted for.
An inverse relationship between Lifshitz-Van der Wads surface energy and healing, Figure 22, and a direct relationship between acid-base surface energy and healing, Figure 23, implies that the acid base component is favorable to healing whereas the LW component is not. The healing potential of a binder is thereby maximized if the acid-base component is maximized and the LW component is minimized. Statistical analysis via a linear contrast across the compositional matrices in Table 4 indicates significantly (a = 0.005) that a low amphoteric content and a high aromatic content would exhibit higher acid-base surface energies and lower LW surface energies. This would promote better healing. Each of the bitumens studied exhibited greater LW components than acid- base components; so, for this set of bitumens, it is also implied that a lower overall surface energy is beneficial to healing.
The interaction that promotes excellent cohesive healing is complex, as is illustrated for the five bitumens studied here. Perhaps the best way to express the desired surface energy properties of a binder to promote good healing properties is a low total surface energy with a high acid-base component and a low Lifshitz-Van der Waals component.
Field Evaluation of Test Sections at the FHWA Turner-Fairbank Highway Research Center
Selected Pavements
Four pavement sections were selected. These sections consisted of full factorial combinations of two thicknesses (102 mm and 204 mm) of two types of asphalt layers (AC 5 and AC 20) placed on a homogeneous and consistent subgrade prepared to a depth of 457 mm.
ALF Test Procedure
The ALF applies cyclic loading with a period of 10 s per cycle. The wheel on the ALF weighs 53.4 kN and is 3 18 mm wide with a tire pressure of 689.5 kPa. The position of the wheel was controlled to produce normally distributed wandering transversely to the direction of traffic. Wander was introduced in the loading sequence to minimize rutting and accentuate the distress mode of fatigue cracking. The pavements were subjected to repetitions of a group of loading cycles followed

by a 24-hour rest period. During the ALF loading and rest periods, the pavement temperature was maintained at 20°C using a temperature control system associated with the ALF. This temperature control system, along with other details regarding the ALF setup as well as details of the testing protocol, are presented in Volume 2.
Surface wave tests were performed to determine the in situ stiffness of the pavements as a measure of damage during the ALF loading procedure. Surface wave measurements were recorded before any load was applied, immediately after each group of loading, and at the end of the 24-hour rest periods.
Fatigue Damage Growth
Figures 25 and 26 present the surface wave speed changes at selected positions within the wander path of the ALF (positions 1 through 5). Points with a "-" symbol represent the data collected immediately after a group of loading cycles while those with a "+" symbol indicate the data obtained at the end of a 24-hour rest period.
The effect of rest periods on the phase velocity and therefore the elastic modulus or stifiess of the pavements investigated can be checked by simply evaluating the positions of the "-" and 'Y' symbols in Figures 25 and 26. In most cases the phase velocity increased after the rest period. This increase may be attributed to relaxation, steric hardening, or healing of microcracks. In this analysis no attempt was made to distinguish the proportional amount of healing. Instead all aspects were linked together and called microdamage healing. Kim points out in Volume 2 that work by Sias (1996) on beam fatigue testing of asphalt concrete samples subjected to rest periods follow a very similar trend to what is seen on the ALF sections. This is shown in Figure 27.
In order to quantify healing in the ALF sections, another form of the healing index was used. In this case the healing index (HI) is defined as:
" before
where V,, = phase velocity after completion of each loading group and V, = phase velocity after a 24-hour rest period.
Figure 28 presents this form of the healing index at each position of the surface velocity measurement. Regardless of the pavement type, the trend is that a greater HI is recorded closer to the centerline of the tire path. This trend suggests that more fatigue damage results in a greater magnitude of microdamage healing. Because the location of the load was normally distributed, the probability that the wheel loads each point is as follows:
Center (positions 1 and 5): 0.61 15.24 cm (position 2): 0.46 30.48 cm (position 3): 0.19 45.72 cm (position 4): 0.04

a crr 500 . s Q AC 6 -Position t (center) I AC 6 - Positlon 2 (16.24 cm)
Number of Loading Cycles
g1m. V +
: sm. e AC 6 - Porttion 3 (30.48 cm)
0 50000 1OOOOO 1- 200000 250000
Number of Loading Cycles
- 250 1
0 50000 1OOOOO 150000 200000 250000
Number of Lording Cycles
Number of Loading Cycler
0 50000 1OOOOO 150000 200000 250000
Number of Loading Cycles
250 1 . . 1 0 SOW0 100000 150000 200000 250000
Number of Loading Cycles
Figure 25. Changes in Phase Velocity During Fatigue Loading and Rest Periods (102 mm AC 5 Section).
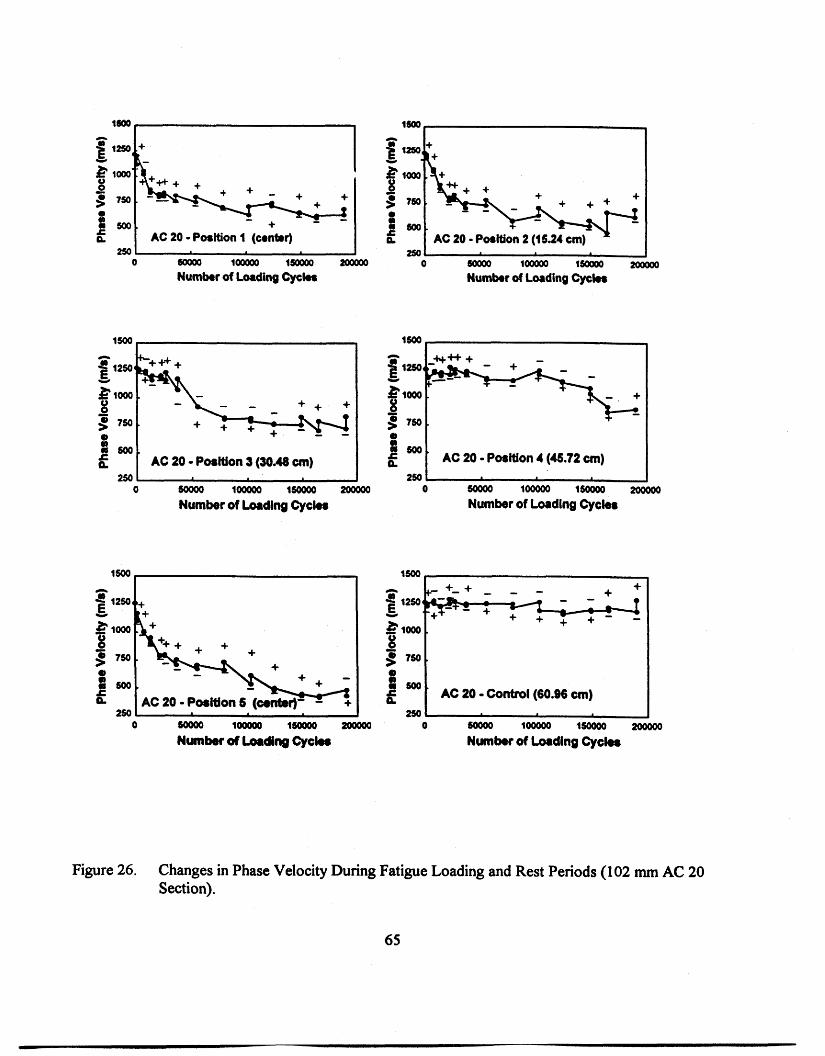
Numbw of Loading Cyckr
250 1 I 1 . I 0 m 1OOOOO 1- 2wooo
Number of Loading Cych
0 #KK)O l o o m 1soooo 200000
Numkr of Loading Qekr
-
0 50000 1OOOOO 150000 200000 Number of Loadlng C y c k
0 soow 1OOOOO 1soooo 200000 0 50000 1OOOOO 150000 2ooooo Number of Lordirrg C y c h N u m b of Loading Cycler
Figure 26. Changes in Phase Velocity During Fatigue Loading and Rest Periods (102 mm AC 20 Section).

0 20000 40000 60000 80000
Number of Cycles
Figure 27. Changes in Flexural Stiffness During Fatigue Life of Asphalt Concrete.
1 2 3 4 5
Position
# AC 5 (104 mm) AC 20 (1 04 mm)
AC 5 (208 mm) 6] AC 20 (208 mrn)
Figure 28. Healing Indices of Different Test Locations.
66
Position 2 is expected to coincide with the highest level of surface shear stresses as it is in the proximity of the edge of the tire. Since surface-induced fatigue damage is highest under the edge or wall of the tire, it is consistent to see a greater opportunity for healing in the most fatigue-damaged section of the loading path. This is discussed in detail in Volume 2.
Healing Assessment of Mn/ROAD Sections
Volume 2 discusses in detail the testing at the MnROAD sections. Testing here was performed to measure the effects of healing. At MnROAD, the low-volume road section was periodically closed to traffic for 24-hour periods. Seven test pavements were selected for study. The pavements were selected based on the thickness af the asphalt and base and the design life of the pavement.
A healing index of the type described in equation (35) was used to quantity healing or recovery in elastic modulus as measured by surface wave velocity. Temperature variations were accounted for as discussed in Volume 2. The healing indices (temperature corrected) for the MnROAD low- volume test sections are summarized in Figures 29 and 30. Figure 29 is a summary of each of the subsections in section CZS. Figure 30 is a summary of the average healing indices of all five low- volume sections (each with several subsections) tested.
In all low-volume road sections, the average HI'S demonstrate an overall positive effect of healing or rest periods. However, it is important to note the factors that may influence the ability to measure healing in the field. Several variables may have significantly affected healing at MnROAD that were not as influential in the ALF studies or in the laboratory experiments. First of all, the temperature was maintained constant in the ALF and laboratory experiments. This was not the case at MnROAD, and the temperature corrections necessary to compensate for this effect are only approximate. Furthermore, the frequency of the loading in the lab and in the ALF studies was much more demanding than on MnROAD, and the MiiROAD sections were subjected to much longer periods of rest between regularly programmed loads, making the effect of the longer healing periods less evident. In other words, considerable healing may have occurred during the lengthy intervals between regular loading. Finally, other environmental factors doubtlessly affected the healing potential at MnROAD. Moisture content of the sections varied depending on the amount of precipitation prior to testing. Moisture affects the response of the permeable asphalt mixture.
US 70 in North Carolina
Figure 3 1 compares elastic moduli determined fiom surface wave measurements for two pavements: US 70 in North Carolina and the MnROAD Project. In Figure 3 la the US 70 data are presented. The data recorded over various times and pavement temperatures show that after a 24- hour rest period the elastic modulus is substantially higher than the modulus recorded at the same temperature before the 24-hour rest period. The US 70 pavement was subjected to considerable traffic before introduction of the 24-hour rest period and was hence damaged to some level by the traffic. Figure 3 1 b for the MnROAD pavement shows no such change in elastic modulus after a 36-
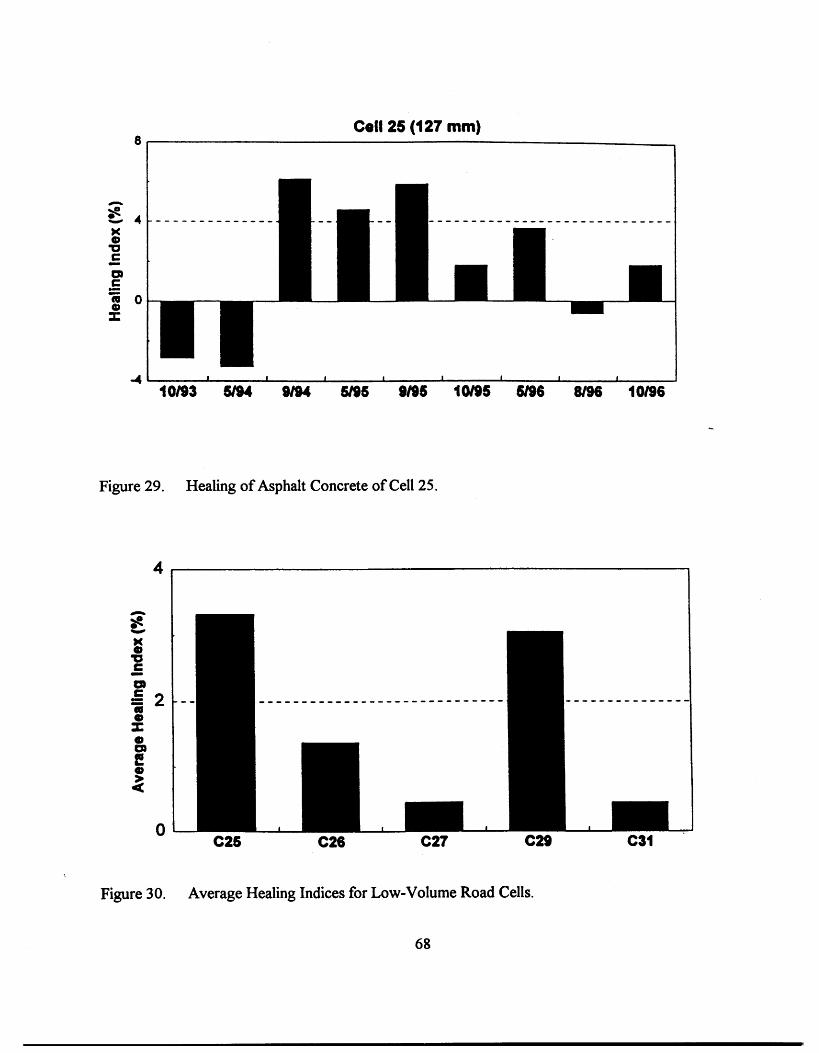
Cell 25 (127 mm) 8
Figure 29. Healing of Asphalt Concrete of Cell 25.
Figure 30. Average Healing Indices for Low-Volume Road Cells.
68

Point A (7:30 am, 1 st day)
0
Night
20 25 30
Temperature (C)
P
Day 1 0
Night + Day 2
5 10 15
Temperature (C)
Figure 3 1. Change in the Elastic Modulus as a Function of Asphalt Concrete (AC) Mid-Depth Temperature During: (a) the 24-Hour Rest Period in US 70, NC; b) the 36-Hour Rest Period in MnIRoad, MN.

hour rest period. The elastic moduli determined in day 1 and day 2 are essentially the same. The striking difference is that the MnROAD pavement shown here was not subjected to significant truck traffic and was hence essentially undamaged when the 36-hour rest period was introduced. This comparison seems to provide impressive evidence for the effect of microdamage healing on pavement.
Conclusions of Field Experiments
Healing of asphalt concrete pavements in the field is more difficult to measure than under controlled conditions, but can be detected by the use of stress wave testing and analysis. The fact that healing does occur in pavements and can be measured in the field suggests that the performance and service life of the pavement will be increased if rest periods are introduced.
Asphalt binders with low LW surface energy components and high acid-base surface energy components are predisposed to exhibit better healing performance in controlled-strain fatigue testing. Based on the suite of bitumens tested in this study, bitumens that have low amphoteric and high aromatic contents possess the desirable surface energy properties and are, therefore, superior healers. It is imperative, however, to understand that other mixture traits also affect fiacture speed and healing speed. According to the complete theory of microfracture healing as developed by R. L. Lytton and presented in Volume 3, the rate of healing of asphalt mixtures is profoundly affected not only by mixture surface energy density, but also by the mixture properties of creep compliance, the slope of the creep compliance versus time of the loading relationship, and the Poisson's ratio of the mixture.
This study demonstrates that microdamage healing occurs during rest periods of reasonable length simulative of actual intermittent periods between design axle loads. This healing has a significant influence on fatigue damage. The effect of healing is bitumen-dependent and can be related to fundamental chemical and physical properties of the bitumen.

CHAPTER 7: CONCLUSIONS AND RECOMMENDATIONS
Conclusions
A number of important conclusions pertinent to the project objectives set forth in the project overview section of this report can be drawn from this research. These are presented in this chapter under the heading associated with the specific task or topic germane to that conclusion.
Laboratory Evidence of Microdamage Healing
Microdamage healing occurs and has been verified based on beam fatigue and direct tensile fatigue experiments in both controlled-stress and controlled-strain modes of testing. Microdamage healing has been quantified in several forms. The work of Kim et al. (1998) documented healing during beam fatigue testing on the basis o t (1) extended repetitions to fatigue failure due to the application of rest periods, (2) significant recovery of stiffiess at selected levels of damage due to the introduction of rest periods, and (3) a horizontal shift in the S-shaped pseudo-stiffness relationship (indicating extended fatigue life) due to the introduction of rest periods.
Stress wave measurements provide an effective method of assessing changes in stiffness during cyclic loading and hence can be effectively used to monitor damage and healing in laboratory experiments.
Microdamage healing occurs and can be verified fiom controlled-strain, direct tensile cyclic fatigue tests. Microdamage healing quantified in the form of the healing index is essentially a normalized value of recovered pseudo energy following rest periods. These measurements (performed at Texas Transportation Institute) are repeatable and provide the same rank order assessment of mixture healing capability as do the measurements made by Kim et al. at North Carolina State University.
Factors other than microcrack healing can and do affect the recovery of dissipated energy after rest periods. These include relaxation effects, temperature dissipation, and molecular structuring. However, the effects of each of these phenomena have been assessed and are deemed to either be effectively accounted for in the analysis protocol or to be of little practicable effect on the quantification of microdamage healing.
Field Evidence of Microdamage Healing
Evidence of microdamage healing fiom field experiments was documented from surface wave testing performed on US 70 in North Carolina, the Turner-Fairbank Accelerated Loading Facility in McLean, Virginia, and the MnRoad Project. The documentation of healing in these pavement tests is consistent with laboratory measured microdamage healing.
Healing of asphalt concrete pavements in the field is more difficult to measure than under
controlled conditions but can be detected by stress wave tests. The fact that healing does occur and can be measured in the field during rest periods suggests that the performance and service life of the pavement will be increased if rest periods are introduced.
Prediction of Microdamage and Microdamage Healing Using Vwcoelastic Continuum Damage Theory and Work Potential Theory
The viscoelastic continuum damage fatigue model employing the pseudo-strain transformation and work potential theory successllly predicts damage growth as well as recovery. This has been verified during complex cyclic loading histories, in both controlled-stress and controlled- strain modes of loading and under randomly applied multi-level loading with different loading rates and with varying durations of rest.
The error between predicted and measured number of cycles to failure of asphalt mixtures subjected to the complex loading histories cited above can be reasonably expected to be less than 10%.
Based on the continuum damage approach, a fatigue test protocol suitable for standard, specification-type testing has been developed. This protocol employs a set of uniaxial tensile tests for viscoelastic characterization as well as the characterization of internal state functions representing the fatigue damage growth and microdamage healing in asphalt-aggregate mixtures. A step-wise analysis procedure based on viscoelasticity and work potential theory has also been developed for determining model coefficients.
Prediction of Microdamage and Microdamage Healing Using a Micromechanics Fracture and Healing Model
Models based on the first principles of fiacture and healing provide considerable insight into the mechanisms of fiacture and healing and provide an acceptable explanation for the mechanisms of rnicrodamage fiacture and healing and define the component and mixture properties that affect and control the rate of fiacture and healing.
The most important component properties that affect the rate of fiacture and healing are the surface energies of the aggregate and bitumen. The surface energy of the asphalt binder can be separated into a polar and a non-polar component. Good healing properties are associated with a low total surface energy (including a low non-polar component) and a high polar component of surface energy.
The most important mixture properties with respect to the rate of fiacture and healing are the tensile compliance (fiacture) and the compressive compliance (healing).
Two different models of rnicrodamage healing were compared based on experimental data: the Lytton model (equation 32) and the Schapery (1984) model (equation 3 1). Both models employ the important material properties of surface energy and compliance. Both models were found to

provide valuable insight to the process of microdamage healing, with the Lytton model explaining short-term healing and the Schapery model explaining long-term healing. The non- polar component of surface energy was found to be associated with the short-term healing and to vary inversely with the rate of short-term healing (Lytton's model). The polar component of surface energy was found to be strongly associated with long-term healing and to vary directly with the rate of long-term healing (Schapery's model).
A unified model combining Lytton's and Schapery's approach is presented, which attempts to explain the simultaneous interaction of al l effects.
Surface energies of fracture and healing back-calculated from experimental data agreed well with measured values on bitumens using the Wilhelmy plate and on aggregates using the Cahn balance for tests performed at 25°C or lower. However, tests performed at higher temperatures yielded back-calculated values of surface energies that were considerably different from measured values. This demonstrates that the micromechanics model based on fiacture does not apply at higher temperatures (as one would logically expect) due to the dominant effects of plastic flow.
The ~nicromechanics-based MFHM showed a high level of sensitivity not only to temperature but also to sample size. Cyclic fatigue tests performed on long samples of 200 mm by 100 mm revealed that the back-calculated surface energies sometimes agreed with cohesive surface energies measured on bitumens and sometimes agreed with adhesive surface energies (which were calculated from surfm energy measurements on bitumens and aggregates). On the contrary, cyclic fatigue tests performed on short samples of 100 mm by 100 mm demonstrated that the back-calculated surfice energies were a complex combination of adhesive and cohesive surface energies. This can possibly be explained by the complex state of stress developed in a short cylinder due to the overlapping end-load effects. The long samples apparently have a simple, direct tensile, stress state within the middle third of the sample where critical pseudo- strain measurements are made. This simple stress state may allow either adhesive or cohesive fracture and healing to dominate depending on the nature and properties of the mixture.
Recommendations
The micromechanics model offers tremendous potential to help understand the mechanisms of fracture and healing, and thus fatigue, more completely. Certainly, cohesive and adhesive surface energies are critical material properties in these mechanisms as are mixture tensile and compressive compliances. It is important to ver@ this model on mixtures with an extended array of mixture components (bitumens (aged and unaged and with and without additives), aggregates, and mixture types).
Equipment is now available and has been purchased at TTI that allows measurement of surface energies on samples of up to 100 grams in mass and under a wide range of pressures and temperatures. This state-of-the-science equipment offers a timely opportunity to provide more insight into the role of surface energy on mixture performance and to develop specification-type testing based on these measurements.

REFERENCES
Asphalt Institute (1 982) "Research and Development of the Asphalt Institutes' Thickness Design Manual (MS- I)," 9~ ed Research Report 82-2.
Bazin, P. and Saunier, J. B. (1967) Proceedings, Second International Conference on the Structural Design of Asphalt Pavements, Ann Arbor, Michigan.
Buchnall, C.B., Drinkwater, LC., and Smith, G.R., (1 980) "Hot Plate Welding of Plastics: Factors Mecting Weld Strength," Polymer Engineering and Science, V.20, N. 6, pp. 432-440.
Chen, C. W., (1997) "Mechanistic Approach to the Evaluation of Microdamage in Asphalt Mixes," Ph.D. Dissertation, Civil Engineering, Texas A&M University.
Chomton, G. and Valayer, P. J., (1972) "Applied Rheology of Asphalt Mixes, Practical Application," Proceedings, Third International Conference on the Structural Design of Asphalt Pavements, London, Vol. I.
de Gennes, P.G., (1 971) Journal of Chemistry and Physzcs, 5 5, 572.
de Zeeuw, K. and Pontente, H., (1 977) Soc. Plast. Eng., 23.
Di Benedetto, H. S., Soltani, A. A. and Chaverot, P. (1 996) 'Tatigue of Bituminous Mixes: A Pertinent Approach of Its Measurement of Its Characterization," Eurasphalt and Eurobitume Congress.
Elphingstone, G.M., (1997) "Adhesion and Cohesion in Asphalt-Aggregate Systems," Ph.D. Dissertation, Texas A&M University.
Good, R. J. and Van Oss, C. J., (1991) in "Modern Approach to Wettability: Theory and Applications," (M.E. Schrader and G. Loeb, eds.), Plenum Press, New York, pp. 1-27.
Griffith, A.A., (1920) "The Phenomena of Rupture and Flow in Solids, Philosophical Transactions," Series A, Volume 221, 1920, pp 163- 198.
Griffth, A. A., (1 92 1) Phil. Transactions Royal Society, 22 1, 163.
Jones, David (1 992) Primer on Asphalt Chemistry.
Jud, K. and Kausch, H.H., (1979) Polymer Bulletin 1, 697.
Kim, Y. and Wool, R.P., (1983) "A Theory of Healing at Polymer-Polymer Interface," Macromolecules, 1 6.
16. Kim, Y. Richard, (1 988) 'Evaluation of Healing and Constitutive Modeling of Asphalt Concrete by Means of the Theory of Nonlinear Viscoelasticity and Damage Mechanics," Ph. .D. Dissertation, Texas A& M University.
1 7. Kim, R. Y ., Lee, H. J., and Little, D.N. (1 998) ''Fundamental Properties of Asphalts and Modified Asphalts," Volume 4, Final Report, Texas A&M University.
18. Kim, Y. R., Little, D.N., and Benson, F.C., (1 990) "Chemical and Mechanical Evaluation of Healing Mechanism of Asphalt Concrete," The Association of Asphalt Paving Technologists, Vol. 59, p 240-272.
19. Little, D.N., Kim, Y. R., and Benson, F. C., (1 987) "nvestigation of the Mechanism of Healing in Asphalt," Report to the National Science Foundation, Texas A&M University.
20. Little, D.N., and Prapnnachari, S., (1991) "Investigation of the Microstructural Mechanisms of Relaxation and Fracture Healing in Asphalt," A n d Report to the Air Force Office of Scienrific Research.
2 1. Little, D.N., Lytton, R. L., Williams, D., Chen, C. W. , and Kim, Y.R., (1 997) "Healing of Microdamage in Asphalt and Asphalt Concrete," Draft Final Report Project 7229, Texas A&M University.
22. Lytton, R. L., Uzan, J., Fernando, E.G., Roque, R., Hiltunen, D., and Stoffels, S. M. (1993) "Development and Validation of Performance Prediction Model and Specifications for Asphalt Binders and Paving Mixes," Report SHRP-A-35 7.
23. Lytton, R. L., (1993) "Development and Validation of Performance Prediction Models and Specifications for Asphalt Binders and Paving Mixes," SHRP -A-357 Project Report.
24. Lytton, R. L., Chen, C. W., and Little, D.N., (1998) "A Micromechanics Fracture and Healing Model for Asphalt Concrete," Final Report Project 7229, Volume 3, Task K - Microdamage Healing in Asphalt and Asphalt Concrete, Texas A&M University.
25. Monisrnith, C. L., Epps, J. A., and Finn, F. N., (1985) "Improved Asphalt Mix Design, " Proceedings, The Association of Asphalt Paving Technologist, Vol. 5 4.
26. Petersen, J. C., (1 984) Chemical Composition of Asphalts Related to Asphalt Durability: State of the Art, Transportation Research Board No. 999, pp. 13-3 0.
27. Prapnnachari, S., (1992) Investigation of the Microstructural Mechanism of Relaxation in Asphalt, Ph. D. Dissertation, Texas A&M University.
28. Prager, S. and Tirrell, M., (198 1) "The Healing Process at Polymer-Polymer Interfaces," Journal of Chemical Physics, V.75, N. 10 pp. 5 194-5 198.

29. SHRP-A4 1 7 (1 994), Accelerated Performance - Related Tests for Asphalt-Aggregate Mixes and Their Use in Mix Design and Analysis Systems.
30. Schapery, R.A., (1973) "A Theory of Crack Growth in Visct.-Elastic Media," ReportMM2764- 73-1, Mechanics and Materials Research Center, Texas A&M University.
3 1. Schapery, R.A., (1984) "Correspondence Principles and a Generalized J-integral for Large Deformation and Fracture Analysis of Viscoelastic Media," Znt. J Fract., 25, pp 195-223.
32. Schapery, R.A., (1988) "Theory of Mechanical Behavior of Elastic Media with Growth Damage and Other Changes in Structure," Report No. MA4 5 762-88-1, Texas A& M University.
33. Schapery, R.A., (1989) "On the Mechanics of Crack Closing and Bonding in Linear Viscoelastic Media," International Journal of Fracture, V. 25, p p. 1 63 - 1 89.
34. Sias, J.E., (1996) "Nonlinear Viscoelastic Constitutive Equations for Composites Based on Work Potentials," Mechanics USA 1994 (Proc. 12" US. National Congress of Applied Mechrmics), Appl. Mech. Rev., 47, pp.269-275.
3 5. Tayebali, A., Rowe, G., and Sousa, J., (1 992) "Fatigue Response of Asphalt -Aggregate Mixtures," Paper Presented at the Annual Meeting of the Association of AqhZt Paving Technologist, Charleston, S .C.
36. Tayebali, A. A,, Deacon, J. A., Coplantz, J. S., Harvey, J. T., and Monismith, C.L. (1994) "Mix and Mode-of Loading Effects on Fatigue Response of Asphalt-Aggregate Mixes," Proceedings, The Association of Asphalt Paving Technologists, V. 63, pp. 1 1 8- 1 5 1.
37. Trader, R. N., (1 960) American Chemistry Society, 5 -4.
38. van Dijk, W. (1 975) "Practical Fatigue Characterization of Bituminous Mixes," Proceed?ngs, The Association of Asphalt Paving Technologist, Phoenix, Arizona V. 44.
39. van Dijk, W. and Visser, W., (1977) 'The Energy Approach to Fatigue for Pavement Design," Proceedings, Association of Asphalt Paving Technologists, San Antonio, Texas.
40. Wool, R. P. and O'Connor, K. M. (1 98 1) Journal of Applied Physics, 52, 5953.
41. Wool, R. P., (1980) "Material Damage in Polymers," Workshop on a Continuum Mechanics Approach to Damage and Life Prediction, National Science Foundation, pp. 28-35.
