headings in calibri bold - national oceanography centre balan alex director dst angela hatton...
TRANSCRIPT

Sensor Development
ACHIEVEMENTS AND FORWARD LOOK
MATT MOWLEM
HEAD OCEAN TECHNOLOGY AND ENGINEERING GROUP
Ocean Technology and Engineering Group (OTEG)
Mission (ldquoTo develop novel
technology and engineering
resulting in the greatest impact
for environmental and marine
sciencerdquo)
Ocean Technology and Engineering Group (OTEG)
Mission (ldquoTo develop novel
technology and engineering
resulting in the greatest impact
for environmental and marine
sciencerdquo)
TWG
Enterprise
MARSIC
Enterprise and
Research Impact
Marine Data Products
NMF
Scientific Engineering
Scientific Ship
Systems
Sensors amp Moorings
Ocean Engineering
MARS
ROV
Gliders
AUV Ops
AUV Development
MAS Development
BODC
Head of PSMSL
OTE
Multi-disciplinary
Mechanical Engineering
Electronics amp Software
Science
Associate Head of OTE
Electronics amp Communications
Mechanical Engineering
Head of OTEG Matt Mowlem
Mechanical Engineering Kevin Saw
Jim Wyatt
Stephen Shorter
Robin Brown
Andy Staszkiewicz
Associate Head of OTEG Paul Bell
Richard Cooke
Electronics amp Communications
Steve Mack
Peter Foden
Jeff Pugh
John Kenny
Emlyn Jones
Les Bradley
Geoff Hargreaves
Chris Balfour
Analytical Science Socratis
Loucaides
Jeroen Broeders
Electronics amp Software
Chris Cardwell
John Walk Andrew
Morris
Geoff Shannon
Mechanical Engineering David Jones
Multidisciplinary Robin Pascal
Catalin Balan
Alex Beaton
Director DST Angela Hatton
Director NOC Ed Hill
Greg Slavik
Martin Arundel
Sebastian Steigenberger
Geraldine Turner
John McQuillan
Annika Simpson
Julie Robidart
Miguel Charcos
Allison Schaap
Dave Owsianka
Max Grand
Urska Martincic
George Dadd Hannah Wright
Jake Ludgate
Despo Polyviou
Neil Milliken
OTEG admin PA Patsy Beckerleg
Dave McCann
Ed Mawji
Key
Southampton
OTEG Liverpool
University of Southampton
Ocean Technology and Engineering Group
Post MARS bull Sensors
bull Water physics (CTD)
bull Water chemistry
bull Water biology
bull Sediment flow and properties
bull Wave height breaking
bull Sea level
bull Sea surface fluxes
bull Enabling systems
bull Metrology standards
bull Interoperability and metadata
bull Comms amp Data flow
bull Sensors on platforms
bull Autonomous sea level
bull Samplers
bull Continuous water
bull Gas tight water
bull Particles
bull Genomics
bull Landers and benthic
systems
bull Communication systems
bull Sterile probes vehicles
bull Vehicles Gliders
electronics
optics
manufacturing
Microfluidics
Lab on a chip
Assay optimisation
Integrated
systems
Biofouling
mitigation
Platforms amp comms
OTEG expertise
GOOS EOV
GOOS EOV
Summary of the Tasks outlined in SenseOCEAN mapped onto
the current state of the art
biogeochemical model of the
ocean system
Marine Sensors Technologies and TRL
Microfabricated Solid State Electrochemistry bull Salinity 7
bull Dissolved oxygen 7
Optodes optical sensors bull Gases inc methane 6
bull pH pCO2 7 bull Radionuclide 3
Lab on Chip Cytometer bull Whole cells (label free) 5
bull Labelled cells 5
bull Microplastics 4
bull Bead assays 3
Lab on Chip Chemistry bull Inorganic Nutrients 8
bull Organic Nutrients 5
bull Trace metals 7
bull pH 7 TA 4 DIC 3 pCO2 4 bull Small organics eg PAH PCBs (f-pM) 5
bull Proteins and large organics (copies L) 4
bull Nucleic Acids (copies L) 6
bull Radionuclide 3
2016 Highlights
Demo test Kiel Fjord Sept 2016
12122016 Title of Presentation 13
Kiel Preliminary Results pH
Preliminary LOC data from T Yin (NOC) and TU Graz team
(Optodes)
NOC chemical sensor platform
bull Now operational for several
parameters
bull Platform technology - easy to
adapt to other absorbance-based
assays
bull Works at pressure (deepest
deployment to date 4800 m)
bull Small enough for gliderAUV
deployment
bull Low power (year long deployment
on batteries achieved)
Reagent
housing
LOC
sensor
housing
20 cm
56
cm
LOC Sensor Analytical method Measurement type LODprecision
Nitrate + nitrite Griess assay (with Cd
reduction)
Colourimetry (absorbance) 20 nM
pH Thymol blue Dual wavelength
absorbance 0001 pH units
Phosphate Molybdenum blue (modified) Colourimetry (absorbance) 30 nM
Iron (II) Iron (III) Ferrozine (with ascorbic acid
reduction for Fe (III))
Colourimetry (absorbance)
20 nM
Silicate Silicomolybdic acid Colourimetry (absorbance) 20 nM
Ammonium OPA + membrane Fluorescence 1 nM
Total alkalinity BCG with TMT or single
step
Dual wavelength
absorbance (2 microM)
DIC Membrane+ C of NaOH Conductivity (2 microM)
Organic N and P UV digester + inorganic
system Colourimetry (absorbance) (20 nM)
NERC Macronutrient Cycles Nitrate in a river
Hampshire Avon deployment site Sensor after deployment in River
Nitrate sensor in river
NERC Macronutrient Cycles Nitrate in a river
Nutrient Challenge Nitrate and phosphate in a
Maumee River Ohio
Maumee River Ohio
SenseOCEAN Dissolved iron in Kiel Fjord
7950
8000
8050
8100
8150
8200
8250
8300
623 624 625 626 627 628 629
pH
Date
Gullmar fjord Sweden June 2015
NOC pH sensor field tests
CMEP Tropical coastal waters
Deployment
location
Allison Schaap
CMEP Tropical coastal waters
0
1
2
3
4
5
6
7
8
0
05
1
15
2
2514 1
20
0
14 1
80
0
15 0
00
0
15
0
60
0
15 1
20
0
15 1
80
0
16 0
00
0
16 0
60
0
16 1
20
0
16 1
80
0
17 0
00
0
17 0
60
0
17 1
20
0
17 1
80
0
Dep
th (
m)
Nit
rate
(micro
M)
Ph
osp
hate
(micro
M)
C
hlo
rop
hyll (
microg
L)
Chlorophyll Nitrate Phosphate Depth
DELVE Nitrate in glacial meltwater
Nitrate sensor
deployed in glacial
streams draining
Greenland Ice Sheet
Sub-zero
temperatures and
highly turbid waters
DELVE Nitrate in glacial meltwater
Nitrate deployment on gliders
Celtic Sea April 2015
Alex Vincent amp Maeve Lohan NOC SOES (U Soton)
Temperature
(degC)
Chlorophyll
(mgm3)
Nitrate
(microM)
FixO3 TNA Year-long unattended in the Arctic
LOC nitrate sensors deployed
in two moorings on Fram
Straight for one year (50 ndash 80 m
deep two measurements per
day) Funded by FixO3
Biosensing
Figure and work by MN Tsaloglou
Image courtesy of our partners Aptamer
solutions
httpwwwaptamersolutionscouk
Contract Research Aptamer Antibody PAH sensor proof
of concept
Naphthalene aptamer sensor
(Kd = 13 plusmn 03 nM)
Phenanthrene aptamer sensor
(Kd = 995 plusmn 208 nM)
Fluorescence Curves for Aptamer Beacons in Seawater
Naphthalene aptamer sensor
(Kd = 13 plusmn 03 nM)
Phenanthrene aptamer sensor
(Kd = 995 plusmn 208 nM)
BBSRC sustainable aquaculture Pathogens in
Shellfisheries Water
Water-borne pathogens are (typically) difficult to measure
bull Very diverse (bacteria viruses parasites virulent and non-virulent strains)
bull Low concentration low infectious dose (eg Norovirus ge18 viral particles)
bull Lack of good bio-analytical methods (many canrsquot be cultured)
bull Diseases of unknown origin
Salmonella spp
Norovirus
Cryptosporidium
Quantitation of Microorganisms in Natural Waters
using the LabCard NASBA
New NASBA Assays for E coli DNA
Challenges
bull High genomic diversity In the environment
bull Genome size is approx 4000-5000 unique genes
bull gt2000 sequenced genomes
bull Approx 300 core genes
bull Target sequences are not always unique
Miriam Land et al (2015) Funct Integr Genomics 15 141-161
Bioinformatics methods were employed to find E coli sequences that werehellip
bull Unique to E coli
bull Ubiquitous in E coli strains
Confirmed experimentally using library of E coli (ECOR) and non-E coli bacteria from different hosts and
geographical locations
Monthly evaluation of the existing and new assays
using ldquorealrdquo water samples
11032016 1214Google Maps
Page 1 of 1ht tps wwwgooglecoukmaps50 8078436 -27419603 259769mdata=3m11e3
Google Maps
Imagery copy2016 TerraMetrics Map data copy2016 Google 20 km
Samples Collected in
Southwest England
Preliminary Results from Month One Sample Plate Assay Mean (n=3)
(CFU 100 mL)
RNA Assay after thermal
induction
(Cell Equivalents 100 mL)
DNA assay
(Genome Copy 100 mL)
Comment
Saline inshore (bathing water) 21 Not Detected Not Detected Possible to detect ge 10 cells in pure
culture Negative result due to
inhibitors
Spiked saline
(E coli type) 6533 3100 8500 RNA underestimation DNA
overestimation
Estuarine 1933 900 3200 RNA underestimation DNA
overestimation
Spiked estuarine (E coli type)
6600 400 8700 RNA underestimation DNA
overestimation
Tertiary sewage treatment works
(post UV) 121500
Not Detected Not Detected Sample inhibition
Tertiary sewage treatment works
(pre-UV)
274667 Not Detected Not Detected Sample inhibition
Secondary sewage treatment works 149000 Not Detected Not Detected Sample inhibition
Positive control
(E coli type) 274667 211500 430200 RNA underestimation DNA
overestimation
Negative control 0 Not Detected Not Detected
Other developments A New One-step NASBA
Development of new reagent
preservation methods
Optimisation of primer annealing
and thermo-tolerant enzymes
0
1000
2000
3000
4000
5000
6000
0 10 20 30
Am
ou
nt
of
Pro
du
ct
(Flu
ore
scen
ce)
Time (minutes)
ConventionalNASBA
Optimised One-Step NASBA
A New LOC for Spacial Multiplexing on Chip
Six chamber chip supporting six replicate
One-step NASBA reactions
Uses centrifugal force to achieve mixing of
sample with dehydrated reagents
Reaction chamber
Reagent reservoir
Air reservoir
BBSRC sustainable aquaculture Cytometer for HAB
detection and quantification Simultaneous measurement of electrical (impedance) and optical properties of individual cells
In-lab prototype
No air required for optics or operation (suitable for deep sea)
Challenges include sample concentration and optical detection limits (power in chip)
CT-DO Sensor Commercialisation
Data Flow
bull Easily discover sensors and their metadata
bull Sensors and sensor observations discoverable accessible and useable via the web
bull Seamlessly integrate sensors from Sense Ocean Network with sensors from other networks
The standards
Sensor passes UUID through to
base station
Platform
Satellite
Base station
Data centre
Data delivery by SOS server and linked ocean
data server
Proposed approach NERC
Linked data
(RDF SPARQL)
server
UUID SensorML
SSN (OWL)
JSON LD
netCDF EGO 11 CF16 LD
Reference for netCDF
Link Data conventions Yu J et al Towards Linked
Data Conventions for
Delivery of Environmental
Data Using netCDF pages
102-112 Springer ISBN
978-3-319-15993-5
Send data + UUID Publish
OampMRDF
ltomOM_Observation
gmlid=ExampleOutOfBandNetCDFldquo xmlnsom=httpwwwopengisnetom20 xmlnsxsi=httpwwww3org2001XMLSchema‐instanceldquo xmlnsxlink=httpwwww3org1999xlink
xmlnsgml=httpwwwopengisnetgml32 xsischemaLocation=httpwwwopengisnetom20 httpschemasopengisnetom20observationxsdgt ltgmldescriptiongtObservation instance with remote resultltgmldescriptiongt ltomtype xlinkhref=httpwwwopengisnetdefobservationTypeOGC‐OM20OM_TimeSeriesObservationgt ltomphenomenonTimegt
ltgmlTimePeriodgmlid=phenomenonTime-JULD-1gt ltgmlbeginPositiongt2015‐01‐11T17222500ltgmlbeginPositiongt ltgmlendPositiongt2015‐01‐11T18222500ltgmlendPositiongt ltgmlTimePeriodgt
ltomphenomenonTimegt ltomresultTimegt ltgmlTimeInstant gmlid=resultTime-DATE_UPDATEgt ltgmltimePositiongt2015‐01‐11T18222500ltgmltimePositiongt ltgmlTimeInstantgt ltomresultTimegt ltomprocedure xlinkhref=rdquohttplinkeddevbodcacuksysteminstanceTOOL0969_1234rdquogt ltomobservedProperty xlinkhref=rdquocompositeTOOL0969xmlrdquogt ltomfeatureOfInterest xlinkhref=httpvocabnercacukcollectionS26currentMAT00640gt ltomresultgt ltsweDataStreamgt ltsweelementType name=Componentsgt ltsweDataRecordgt ltswefield name=timegt ltsweQuantitygt ltswelabelgtTIMEltswelabelgt ltsweuom code=s gt ltsweQuantitygt ltswefieldgt ltswefield name=Temp xlinkhref=httpvocabnercacukcollectionP01currentTEMPPR01gt ltsweQuantitygt ltswelabelgtTemperature of the water bodyltswelabelgt ltsweuom code=Cel xlinkhref=rdquohttpvocabnercacukcollectionP06currentUPAArdquo gt ltsweQuantitygt ltswefieldgt ltswefield name=WC_dissO2_optode xlinkhref=httpvocabnercacukcollectionP01currentDOXYOP01gt ltsweQuantitygt ltswelabelgtConcentration of oxygen O2 per unit volume of the water body [dissolved plus reactive particulate phase] by in-situ oxygen optodeltswelabelgt ltsweuom code=umolL xlinkhref=rdquohttpvocabnercacukcollectionP06currentUPOXrdquogt ltsweQuantitygt ltswefieldgt ltswefield name=WC_dissO2_uncalib_2 xlinkhref=httpvocabnercacukcollectionP01currentDOXYUZ02gt ltsweQuantitygt ltswelabelgtConcentration (second sensor) of oxygen O2 CAS 7782-44-7 per unit volume of the water body [dissolved plus reactive particulate phase] by in-situ sensor and no calibration against sample dataltswelabelgt ltsweuom code= xlinkhref=rdquohttpvocabnercacukcollectionP06currentUPCTrdquo gt ltsweQuantitygt ltswefieldgt ltsweDataRecordgt ltsweelementTypegt ltsweencodinggt ltsweBinaryEncoding byteEncoding=raw byteOrder=bigEndiangt ltswemembergt ltsweComponent ref=applicationx-netcdf dataType=httpwwwunidataucaredusoftwarenetcdfgt ltswemembergt ltsweBinaryEncodinggt ltsweencodinggt ltswevalues xlinkhref=http1921711351578080erddaptabledapC_Users_thogar_Desktop_Gdata_5cbc_92e8_e1d6ncgt ltsweDataStreamgt ltomresultgt ltomOM_Observationgt
Publication amp Discovery
Mainly for machine to machine access
2017 Forward look
Marine Sensors Technologies and TRL
2011201620212026 Microfabricated Solid State Electrochemistry bull Salinity 5-8-9-9
bull Dissolved oxygen 4-7-9-9
Optodes optical sensors bull Gases inc methane 6-6-8-9
bull pH pCO2 4-6-8-9
bull Radionuclide 1-3-5-8
Lab on Chip Cytometer bull Whole cells (label free) 4-5-7-9
bull Labelled cells 3-5-6-8
bull Microplastics 2-4-7-9
bull Bead assays 2-3-6-8
Lab on Chip Chemistry bull Inorganic Nutrients 6-8-9-9
bull Organic Nutrients 2-5-7-9
bull Trace metals 4-7-8-9
bull pH 5-7-9-9 TA 2-4-7-9 DIC 2-4-9-9 pCO2 2-4-6-8
bull Small organics eg PAH PCBs (f-pM) 2-5-6-8
bull Proteins and large organics (copies L) 2-4-6-7
bull Nucleic Acids (copies L) 5-6-7-9
bull Radionuclide 1-3-5-7
LOC Sensor Subsystems
developed
Benchtop
system
Shipboard
measurements
In situ
deployment
Nitrate
pH
Phosphate
Iron -
Silicate 2017 2016
Ammonium Late 2017
Total alkalinity 2017 2017
DIC very close 2017 Late 2017
Organic N and P 2017 2017
OTEG LOC sensors development status
LOC Sensor River
estuary
Coastal At depth Glacial
melt
Year- long
(unattended)
Glider or AUV Argo
float
Nitrate 2017
pH 2017
Phosphate 2017 2018 2017 2017
Iron 2017
Silicate 2016 2017 2017 2018 2017
OTEG LOC sensors ndash in situ deployments projected
2017 Forward look highlights
SenseOCEAN final year deployments demonstrations
bull Demonstration on Apex (PROVOR) (Nitrate Phosphate pH)
Platforms targeted for demonstration
AUV
(AWI)
Bouys
(lLEGOS-
CNRS)
Floats
(LEGOS-CNRS)
Shallow cabled and
deep sea observatory
(AWI)
2017 Forward look highlights
SenseOCEAN final year deployments demonstrations
bull Demonstration on Apex (PROVOR) (Nitrate Phosphate pH)
Integration into SLOCUM glider
2017 Forward look highlights
SenseOCEAN final year deployments demonstrations
bull Demonstration on Apex (PROVOR) (Nitrate Phosphate pH)
Integration into SLOCUM glider
Integration into ALR and trials for ETI
ETI CCSMV - Project
The Concept The Taxi
The sensors
CCS Sensors package commercial
SeapHOx SBE52 CTD SEAFET SBE43F DO
CCS Sensors package NOC
lab on a chip
TRL 7 pH Phosphate Nitrate
TRL 4-7 TA DIC
2017 Forward look highlights
SenseOCEAN final year deployments demonstrations
bull Demonstration on Apex (PROVOR) (Nitrate Phosphate pH)
Integration into SLOCUM glider
Integration into ALR and trials for ETI
Pathogen detection in the field
CTDO product launch
LOC license agreement commercialisation
Acknowledgements Work by current and past members of OTEG
Group head Matt Mowlem
Subgroup heads
Robin Pascal (Multidisciplinary)
Socratis Loucaides (Analytical science)
Chris Cardwell (Electronics amp Software)
Kevin Saw (Mechanical)
Photos from Dave Owsianka
Alex Beaton Martin Arundell
and others
Collaborators at
University of Southampton
NOC
Plymouth Marine Laboratory
Scottish Marine Institute
GEOMAR and others

Ocean Technology and Engineering Group (OTEG)
Mission (ldquoTo develop novel
technology and engineering
resulting in the greatest impact
for environmental and marine
sciencerdquo)
Ocean Technology and Engineering Group (OTEG)
Mission (ldquoTo develop novel
technology and engineering
resulting in the greatest impact
for environmental and marine
sciencerdquo)
TWG
Enterprise
MARSIC
Enterprise and
Research Impact
Marine Data Products
NMF
Scientific Engineering
Scientific Ship
Systems
Sensors amp Moorings
Ocean Engineering
MARS
ROV
Gliders
AUV Ops
AUV Development
MAS Development
BODC
Head of PSMSL
OTE
Multi-disciplinary
Mechanical Engineering
Electronics amp Software
Science
Associate Head of OTE
Electronics amp Communications
Mechanical Engineering
Head of OTEG Matt Mowlem
Mechanical Engineering Kevin Saw
Jim Wyatt
Stephen Shorter
Robin Brown
Andy Staszkiewicz
Associate Head of OTEG Paul Bell
Richard Cooke
Electronics amp Communications
Steve Mack
Peter Foden
Jeff Pugh
John Kenny
Emlyn Jones
Les Bradley
Geoff Hargreaves
Chris Balfour
Analytical Science Socratis
Loucaides
Jeroen Broeders
Electronics amp Software
Chris Cardwell
John Walk Andrew
Morris
Geoff Shannon
Mechanical Engineering David Jones
Multidisciplinary Robin Pascal
Catalin Balan
Alex Beaton
Director DST Angela Hatton
Director NOC Ed Hill
Greg Slavik
Martin Arundel
Sebastian Steigenberger
Geraldine Turner
John McQuillan
Annika Simpson
Julie Robidart
Miguel Charcos
Allison Schaap
Dave Owsianka
Max Grand
Urska Martincic
George Dadd Hannah Wright
Jake Ludgate
Despo Polyviou
Neil Milliken
OTEG admin PA Patsy Beckerleg
Dave McCann
Ed Mawji
Key
Southampton
OTEG Liverpool
University of Southampton
Ocean Technology and Engineering Group
Post MARS bull Sensors
bull Water physics (CTD)
bull Water chemistry
bull Water biology
bull Sediment flow and properties
bull Wave height breaking
bull Sea level
bull Sea surface fluxes
bull Enabling systems
bull Metrology standards
bull Interoperability and metadata
bull Comms amp Data flow
bull Sensors on platforms
bull Autonomous sea level
bull Samplers
bull Continuous water
bull Gas tight water
bull Particles
bull Genomics
bull Landers and benthic
systems
bull Communication systems
bull Sterile probes vehicles
bull Vehicles Gliders
electronics
optics
manufacturing
Microfluidics
Lab on a chip
Assay optimisation
Integrated
systems
Biofouling
mitigation
Platforms amp comms
OTEG expertise
GOOS EOV
GOOS EOV
Summary of the Tasks outlined in SenseOCEAN mapped onto
the current state of the art
biogeochemical model of the
ocean system
Marine Sensors Technologies and TRL
Microfabricated Solid State Electrochemistry bull Salinity 7
bull Dissolved oxygen 7
Optodes optical sensors bull Gases inc methane 6
bull pH pCO2 7 bull Radionuclide 3
Lab on Chip Cytometer bull Whole cells (label free) 5
bull Labelled cells 5
bull Microplastics 4
bull Bead assays 3
Lab on Chip Chemistry bull Inorganic Nutrients 8
bull Organic Nutrients 5
bull Trace metals 7
bull pH 7 TA 4 DIC 3 pCO2 4 bull Small organics eg PAH PCBs (f-pM) 5
bull Proteins and large organics (copies L) 4
bull Nucleic Acids (copies L) 6
bull Radionuclide 3
2016 Highlights
Demo test Kiel Fjord Sept 2016
12122016 Title of Presentation 13
Kiel Preliminary Results pH
Preliminary LOC data from T Yin (NOC) and TU Graz team
(Optodes)
NOC chemical sensor platform
bull Now operational for several
parameters
bull Platform technology - easy to
adapt to other absorbance-based
assays
bull Works at pressure (deepest
deployment to date 4800 m)
bull Small enough for gliderAUV
deployment
bull Low power (year long deployment
on batteries achieved)
NOC chemical sensor platform
bull Now operational for several
parameters
bull Platform technology - easy to
adapt to other absorbance-based
assays
bull Works at pressure (deepest
deployment to date 4800 m)
bull Small enough for gliderAUV
deployment
bull Low power (year long deployment
on batteries achieved)
Reagent
housing
LOC
sensor
housing
20 cm
56
cm
LOC Sensor Analytical method Measurement type LODprecision
Nitrate + nitrite Griess assay (with Cd
reduction)
Colourimetry (absorbance) 20 nM
pH Thymol blue Dual wavelength
absorbance 0001 pH units
Phosphate Molybdenum blue (modified) Colourimetry (absorbance) 30 nM
Iron (II) Iron (III) Ferrozine (with ascorbic acid
reduction for Fe (III))
Colourimetry (absorbance)
20 nM
Silicate Silicomolybdic acid Colourimetry (absorbance) 20 nM
Ammonium OPA + membrane Fluorescence 1 nM
Total alkalinity BCG with TMT or single
step
Dual wavelength
absorbance (2 microM)
DIC Membrane+ C of NaOH Conductivity (2 microM)
Organic N and P UV digester + inorganic
system Colourimetry (absorbance) (20 nM)
NERC Macronutrient Cycles Nitrate in a river
Hampshire Avon deployment site Sensor after deployment in River
Nitrate sensor in river
NERC Macronutrient Cycles Nitrate in a river
Nutrient Challenge Nitrate and phosphate in a
Maumee River Ohio
Maumee River Ohio
SenseOCEAN Dissolved iron in Kiel Fjord
7950
8000
8050
8100
8150
8200
8250
8300
623 624 625 626 627 628 629
pH
Date
Gullmar fjord Sweden June 2015
NOC pH sensor field tests
CMEP Tropical coastal waters
Deployment
location
Allison Schaap
CMEP Tropical coastal waters
0
1
2
3
4
5
6
7
8
0
05
1
15
2
2514 1
20
0
14 1
80
0
15 0
00
0
15
0
60
0
15 1
20
0
15 1
80
0
16 0
00
0
16 0
60
0
16 1
20
0
16 1
80
0
17 0
00
0
17 0
60
0
17 1
20
0
17 1
80
0
Dep
th (
m)
Nit
rate
(micro
M)
Ph
osp
hate
(micro
M)
C
hlo
rop
hyll (
microg
L)
Chlorophyll Nitrate Phosphate Depth
DELVE Nitrate in glacial meltwater
Nitrate sensor
deployed in glacial
streams draining
Greenland Ice Sheet
Sub-zero
temperatures and
highly turbid waters
DELVE Nitrate in glacial meltwater
Nitrate deployment on gliders
Celtic Sea April 2015
Alex Vincent amp Maeve Lohan NOC SOES (U Soton)
Temperature
(degC)
Chlorophyll
(mgm3)
Nitrate
(microM)
FixO3 TNA Year-long unattended in the Arctic
LOC nitrate sensors deployed
in two moorings on Fram
Straight for one year (50 ndash 80 m
deep two measurements per
day) Funded by FixO3
Biosensing
Figure and work by MN Tsaloglou
Image courtesy of our partners Aptamer
solutions
httpwwwaptamersolutionscouk
Contract Research Aptamer Antibody PAH sensor proof
of concept
Naphthalene aptamer sensor
(Kd = 13 plusmn 03 nM)
Phenanthrene aptamer sensor
(Kd = 995 plusmn 208 nM)
Fluorescence Curves for Aptamer Beacons in Seawater
Naphthalene aptamer sensor
(Kd = 13 plusmn 03 nM)
Phenanthrene aptamer sensor
(Kd = 995 plusmn 208 nM)
BBSRC sustainable aquaculture Pathogens in
Shellfisheries Water
Water-borne pathogens are (typically) difficult to measure
bull Very diverse (bacteria viruses parasites virulent and non-virulent strains)
bull Low concentration low infectious dose (eg Norovirus ge18 viral particles)
bull Lack of good bio-analytical methods (many canrsquot be cultured)
bull Diseases of unknown origin
Salmonella spp
Norovirus
Cryptosporidium
Quantitation of Microorganisms in Natural Waters
using the LabCard NASBA
New NASBA Assays for E coli DNA
Challenges
bull High genomic diversity In the environment
bull Genome size is approx 4000-5000 unique genes
bull gt2000 sequenced genomes
bull Approx 300 core genes
bull Target sequences are not always unique
Miriam Land et al (2015) Funct Integr Genomics 15 141-161
Bioinformatics methods were employed to find E coli sequences that werehellip
bull Unique to E coli
bull Ubiquitous in E coli strains
Confirmed experimentally using library of E coli (ECOR) and non-E coli bacteria from different hosts and
geographical locations
Monthly evaluation of the existing and new assays
using ldquorealrdquo water samples
11032016 1214Google Maps
Page 1 of 1ht tps wwwgooglecoukmaps50 8078436 -27419603 259769mdata=3m11e3
Google Maps
Imagery copy2016 TerraMetrics Map data copy2016 Google 20 km
Samples Collected in
Southwest England
Preliminary Results from Month One Sample Plate Assay Mean (n=3)
(CFU 100 mL)
RNA Assay after thermal
induction
(Cell Equivalents 100 mL)
DNA assay
(Genome Copy 100 mL)
Comment
Saline inshore (bathing water) 21 Not Detected Not Detected Possible to detect ge 10 cells in pure
culture Negative result due to
inhibitors
Spiked saline
(E coli type) 6533 3100 8500 RNA underestimation DNA
overestimation
Estuarine 1933 900 3200 RNA underestimation DNA
overestimation
Spiked estuarine (E coli type)
6600 400 8700 RNA underestimation DNA
overestimation
Tertiary sewage treatment works
(post UV) 121500
Not Detected Not Detected Sample inhibition
Tertiary sewage treatment works
(pre-UV)
274667 Not Detected Not Detected Sample inhibition
Secondary sewage treatment works 149000 Not Detected Not Detected Sample inhibition
Positive control
(E coli type) 274667 211500 430200 RNA underestimation DNA
overestimation
Negative control 0 Not Detected Not Detected
Other developments A New One-step NASBA
Development of new reagent
preservation methods
Optimisation of primer annealing
and thermo-tolerant enzymes
0
1000
2000
3000
4000
5000
6000
0 10 20 30
Am
ou
nt
of
Pro
du
ct
(Flu
ore
scen
ce)
Time (minutes)
ConventionalNASBA
Optimised One-Step NASBA
A New LOC for Spacial Multiplexing on Chip
Six chamber chip supporting six replicate
One-step NASBA reactions
Uses centrifugal force to achieve mixing of
sample with dehydrated reagents
Reaction chamber
Reagent reservoir
Air reservoir
BBSRC sustainable aquaculture Cytometer for HAB
detection and quantification Simultaneous measurement of electrical (impedance) and optical properties of individual cells
In-lab prototype
No air required for optics or operation (suitable for deep sea)
Challenges include sample concentration and optical detection limits (power in chip)
CT-DO Sensor Commercialisation
Data Flow
bull Easily discover sensors and their metadata
bull Sensors and sensor observations discoverable accessible and useable via the web
bull Seamlessly integrate sensors from Sense Ocean Network with sensors from other networks
The standards
Sensor passes UUID through to
base station
Platform
Satellite
Base station
Data centre
Data delivery by SOS server and linked ocean
data server
Proposed approach NERC
Linked data
(RDF SPARQL)
server
UUID SensorML
SSN (OWL)
JSON LD
netCDF EGO 11 CF16 LD
Reference for netCDF
Link Data conventions Yu J et al Towards Linked
Data Conventions for
Delivery of Environmental
Data Using netCDF pages
102-112 Springer ISBN
978-3-319-15993-5
Send data + UUID Publish
OampMRDF
ltomOM_Observation
gmlid=ExampleOutOfBandNetCDFldquo xmlnsom=httpwwwopengisnetom20 xmlnsxsi=httpwwww3org2001XMLSchema‐instanceldquo xmlnsxlink=httpwwww3org1999xlink
xmlnsgml=httpwwwopengisnetgml32 xsischemaLocation=httpwwwopengisnetom20 httpschemasopengisnetom20observationxsdgt ltgmldescriptiongtObservation instance with remote resultltgmldescriptiongt ltomtype xlinkhref=httpwwwopengisnetdefobservationTypeOGC‐OM20OM_TimeSeriesObservationgt ltomphenomenonTimegt
ltgmlTimePeriodgmlid=phenomenonTime-JULD-1gt ltgmlbeginPositiongt2015‐01‐11T17222500ltgmlbeginPositiongt ltgmlendPositiongt2015‐01‐11T18222500ltgmlendPositiongt ltgmlTimePeriodgt
ltomphenomenonTimegt ltomresultTimegt ltgmlTimeInstant gmlid=resultTime-DATE_UPDATEgt ltgmltimePositiongt2015‐01‐11T18222500ltgmltimePositiongt ltgmlTimeInstantgt ltomresultTimegt ltomprocedure xlinkhref=rdquohttplinkeddevbodcacuksysteminstanceTOOL0969_1234rdquogt ltomobservedProperty xlinkhref=rdquocompositeTOOL0969xmlrdquogt ltomfeatureOfInterest xlinkhref=httpvocabnercacukcollectionS26currentMAT00640gt ltomresultgt ltsweDataStreamgt ltsweelementType name=Componentsgt ltsweDataRecordgt ltswefield name=timegt ltsweQuantitygt ltswelabelgtTIMEltswelabelgt ltsweuom code=s gt ltsweQuantitygt ltswefieldgt ltswefield name=Temp xlinkhref=httpvocabnercacukcollectionP01currentTEMPPR01gt ltsweQuantitygt ltswelabelgtTemperature of the water bodyltswelabelgt ltsweuom code=Cel xlinkhref=rdquohttpvocabnercacukcollectionP06currentUPAArdquo gt ltsweQuantitygt ltswefieldgt ltswefield name=WC_dissO2_optode xlinkhref=httpvocabnercacukcollectionP01currentDOXYOP01gt ltsweQuantitygt ltswelabelgtConcentration of oxygen O2 per unit volume of the water body [dissolved plus reactive particulate phase] by in-situ oxygen optodeltswelabelgt ltsweuom code=umolL xlinkhref=rdquohttpvocabnercacukcollectionP06currentUPOXrdquogt ltsweQuantitygt ltswefieldgt ltswefield name=WC_dissO2_uncalib_2 xlinkhref=httpvocabnercacukcollectionP01currentDOXYUZ02gt ltsweQuantitygt ltswelabelgtConcentration (second sensor) of oxygen O2 CAS 7782-44-7 per unit volume of the water body [dissolved plus reactive particulate phase] by in-situ sensor and no calibration against sample dataltswelabelgt ltsweuom code= xlinkhref=rdquohttpvocabnercacukcollectionP06currentUPCTrdquo gt ltsweQuantitygt ltswefieldgt ltsweDataRecordgt ltsweelementTypegt ltsweencodinggt ltsweBinaryEncoding byteEncoding=raw byteOrder=bigEndiangt ltswemembergt ltsweComponent ref=applicationx-netcdf dataType=httpwwwunidataucaredusoftwarenetcdfgt ltswemembergt ltsweBinaryEncodinggt ltsweencodinggt ltswevalues xlinkhref=http1921711351578080erddaptabledapC_Users_thogar_Desktop_Gdata_5cbc_92e8_e1d6ncgt ltsweDataStreamgt ltomresultgt ltomOM_Observationgt
Publication amp Discovery
Mainly for machine to machine access
2017 Forward look
Marine Sensors Technologies and TRL
2011201620212026 Microfabricated Solid State Electrochemistry bull Salinity 5-8-9-9
bull Dissolved oxygen 4-7-9-9
Optodes optical sensors bull Gases inc methane 6-6-8-9
bull pH pCO2 4-6-8-9
bull Radionuclide 1-3-5-8
Lab on Chip Cytometer bull Whole cells (label free) 4-5-7-9
bull Labelled cells 3-5-6-8
bull Microplastics 2-4-7-9
bull Bead assays 2-3-6-8
Lab on Chip Chemistry bull Inorganic Nutrients 6-8-9-9
bull Organic Nutrients 2-5-7-9
bull Trace metals 4-7-8-9
bull pH 5-7-9-9 TA 2-4-7-9 DIC 2-4-9-9 pCO2 2-4-6-8
bull Small organics eg PAH PCBs (f-pM) 2-5-6-8
bull Proteins and large organics (copies L) 2-4-6-7
bull Nucleic Acids (copies L) 5-6-7-9
bull Radionuclide 1-3-5-7
LOC Sensor Subsystems
developed
Benchtop
system
Shipboard
measurements
In situ
deployment
Nitrate
pH
Phosphate
Iron -
Silicate 2017 2016
Ammonium Late 2017
Total alkalinity 2017 2017
DIC very close 2017 Late 2017
Organic N and P 2017 2017
OTEG LOC sensors development status
LOC Sensor River
estuary
Coastal At depth Glacial
melt
Year- long
(unattended)
Glider or AUV Argo
float
Nitrate 2017
pH 2017
Phosphate 2017 2018 2017 2017
Iron 2017
Silicate 2016 2017 2017 2018 2017
OTEG LOC sensors ndash in situ deployments projected
2017 Forward look highlights
SenseOCEAN final year deployments demonstrations
bull Demonstration on Apex (PROVOR) (Nitrate Phosphate pH)
Platforms targeted for demonstration
AUV
(AWI)
Bouys
(lLEGOS-
CNRS)
Floats
(LEGOS-CNRS)
Shallow cabled and
deep sea observatory
(AWI)
2017 Forward look highlights
SenseOCEAN final year deployments demonstrations
bull Demonstration on Apex (PROVOR) (Nitrate Phosphate pH)
Integration into SLOCUM glider
2017 Forward look highlights
SenseOCEAN final year deployments demonstrations
bull Demonstration on Apex (PROVOR) (Nitrate Phosphate pH)
Integration into SLOCUM glider
Integration into ALR and trials for ETI
ETI CCSMV - Project
The Concept The Taxi
The sensors
CCS Sensors package commercial
SeapHOx SBE52 CTD SEAFET SBE43F DO
CCS Sensors package NOC
lab on a chip
TRL 7 pH Phosphate Nitrate
TRL 4-7 TA DIC
2017 Forward look highlights
SenseOCEAN final year deployments demonstrations
bull Demonstration on Apex (PROVOR) (Nitrate Phosphate pH)
Integration into SLOCUM glider
Integration into ALR and trials for ETI
Pathogen detection in the field
CTDO product launch
LOC license agreement commercialisation
Acknowledgements Work by current and past members of OTEG
Group head Matt Mowlem
Subgroup heads
Robin Pascal (Multidisciplinary)
Socratis Loucaides (Analytical science)
Chris Cardwell (Electronics amp Software)
Kevin Saw (Mechanical)
Photos from Dave Owsianka
Alex Beaton Martin Arundell
and others
Collaborators at
University of Southampton
NOC
Plymouth Marine Laboratory
Scottish Marine Institute
GEOMAR and others

Ocean Technology and Engineering Group (OTEG)
Mission (ldquoTo develop novel
technology and engineering
resulting in the greatest impact
for environmental and marine
sciencerdquo)
TWG
Enterprise
MARSIC
Enterprise and
Research Impact
Marine Data Products
NMF
Scientific Engineering
Scientific Ship
Systems
Sensors amp Moorings
Ocean Engineering
MARS
ROV
Gliders
AUV Ops
AUV Development
MAS Development
BODC
Head of PSMSL
OTE
Multi-disciplinary
Mechanical Engineering
Electronics amp Software
Science
Associate Head of OTE
Electronics amp Communications
Mechanical Engineering
Head of OTEG Matt Mowlem
Mechanical Engineering Kevin Saw
Jim Wyatt
Stephen Shorter
Robin Brown
Andy Staszkiewicz
Associate Head of OTEG Paul Bell
Richard Cooke
Electronics amp Communications
Steve Mack
Peter Foden
Jeff Pugh
John Kenny
Emlyn Jones
Les Bradley
Geoff Hargreaves
Chris Balfour
Analytical Science Socratis
Loucaides
Jeroen Broeders
Electronics amp Software
Chris Cardwell
John Walk Andrew
Morris
Geoff Shannon
Mechanical Engineering David Jones
Multidisciplinary Robin Pascal
Catalin Balan
Alex Beaton
Director DST Angela Hatton
Director NOC Ed Hill
Greg Slavik
Martin Arundel
Sebastian Steigenberger
Geraldine Turner
John McQuillan
Annika Simpson
Julie Robidart
Miguel Charcos
Allison Schaap
Dave Owsianka
Max Grand
Urska Martincic
George Dadd Hannah Wright
Jake Ludgate
Despo Polyviou
Neil Milliken
OTEG admin PA Patsy Beckerleg
Dave McCann
Ed Mawji
Key
Southampton
OTEG Liverpool
University of Southampton
Ocean Technology and Engineering Group
Post MARS bull Sensors
bull Water physics (CTD)
bull Water chemistry
bull Water biology
bull Sediment flow and properties
bull Wave height breaking
bull Sea level
bull Sea surface fluxes
bull Enabling systems
bull Metrology standards
bull Interoperability and metadata
bull Comms amp Data flow
bull Sensors on platforms
bull Autonomous sea level
bull Samplers
bull Continuous water
bull Gas tight water
bull Particles
bull Genomics
bull Landers and benthic
systems
bull Communication systems
bull Sterile probes vehicles
bull Vehicles Gliders
electronics
optics
manufacturing
Microfluidics
Lab on a chip
Assay optimisation
Integrated
systems
Biofouling
mitigation
Platforms amp comms
OTEG expertise
GOOS EOV
GOOS EOV
Summary of the Tasks outlined in SenseOCEAN mapped onto
the current state of the art
biogeochemical model of the
ocean system
Marine Sensors Technologies and TRL
Microfabricated Solid State Electrochemistry bull Salinity 7
bull Dissolved oxygen 7
Optodes optical sensors bull Gases inc methane 6
bull pH pCO2 7 bull Radionuclide 3
Lab on Chip Cytometer bull Whole cells (label free) 5
bull Labelled cells 5
bull Microplastics 4
bull Bead assays 3
Lab on Chip Chemistry bull Inorganic Nutrients 8
bull Organic Nutrients 5
bull Trace metals 7
bull pH 7 TA 4 DIC 3 pCO2 4 bull Small organics eg PAH PCBs (f-pM) 5
bull Proteins and large organics (copies L) 4
bull Nucleic Acids (copies L) 6
bull Radionuclide 3
2016 Highlights
Demo test Kiel Fjord Sept 2016
12122016 Title of Presentation 13
Kiel Preliminary Results pH
Preliminary LOC data from T Yin (NOC) and TU Graz team
(Optodes)
NOC chemical sensor platform
bull Now operational for several
parameters
bull Platform technology - easy to
adapt to other absorbance-based
assays
bull Works at pressure (deepest
deployment to date 4800 m)
bull Small enough for gliderAUV
deployment
bull Low power (year long deployment
on batteries achieved)
NOC chemical sensor platform
bull Now operational for several
parameters
bull Platform technology - easy to
adapt to other absorbance-based
assays
bull Works at pressure (deepest
deployment to date 4800 m)
bull Small enough for gliderAUV
deployment
bull Low power (year long deployment
on batteries achieved)
Reagent
housing
LOC
sensor
housing
20 cm
56
cm
LOC Sensor Analytical method Measurement type LODprecision
Nitrate + nitrite Griess assay (with Cd
reduction)
Colourimetry (absorbance) 20 nM
pH Thymol blue Dual wavelength
absorbance 0001 pH units
Phosphate Molybdenum blue (modified) Colourimetry (absorbance) 30 nM
Iron (II) Iron (III) Ferrozine (with ascorbic acid
reduction for Fe (III))
Colourimetry (absorbance)
20 nM
Silicate Silicomolybdic acid Colourimetry (absorbance) 20 nM
Ammonium OPA + membrane Fluorescence 1 nM
Total alkalinity BCG with TMT or single
step
Dual wavelength
absorbance (2 microM)
DIC Membrane+ C of NaOH Conductivity (2 microM)
Organic N and P UV digester + inorganic
system Colourimetry (absorbance) (20 nM)
NERC Macronutrient Cycles Nitrate in a river
Hampshire Avon deployment site Sensor after deployment in River
Nitrate sensor in river
NERC Macronutrient Cycles Nitrate in a river
Nutrient Challenge Nitrate and phosphate in a
Maumee River Ohio
Maumee River Ohio
SenseOCEAN Dissolved iron in Kiel Fjord
7950
8000
8050
8100
8150
8200
8250
8300
623 624 625 626 627 628 629
pH
Date
Gullmar fjord Sweden June 2015
NOC pH sensor field tests
CMEP Tropical coastal waters
Deployment
location
Allison Schaap
CMEP Tropical coastal waters
0
1
2
3
4
5
6
7
8
0
05
1
15
2
2514 1
20
0
14 1
80
0
15 0
00
0
15
0
60
0
15 1
20
0
15 1
80
0
16 0
00
0
16 0
60
0
16 1
20
0
16 1
80
0
17 0
00
0
17 0
60
0
17 1
20
0
17 1
80
0
Dep
th (
m)
Nit
rate
(micro
M)
Ph
osp
hate
(micro
M)
C
hlo
rop
hyll (
microg
L)
Chlorophyll Nitrate Phosphate Depth
DELVE Nitrate in glacial meltwater
Nitrate sensor
deployed in glacial
streams draining
Greenland Ice Sheet
Sub-zero
temperatures and
highly turbid waters
DELVE Nitrate in glacial meltwater
Nitrate deployment on gliders
Celtic Sea April 2015
Alex Vincent amp Maeve Lohan NOC SOES (U Soton)
Temperature
(degC)
Chlorophyll
(mgm3)
Nitrate
(microM)
FixO3 TNA Year-long unattended in the Arctic
LOC nitrate sensors deployed
in two moorings on Fram
Straight for one year (50 ndash 80 m
deep two measurements per
day) Funded by FixO3
Biosensing
Figure and work by MN Tsaloglou
Image courtesy of our partners Aptamer
solutions
httpwwwaptamersolutionscouk
Contract Research Aptamer Antibody PAH sensor proof
of concept
Naphthalene aptamer sensor
(Kd = 13 plusmn 03 nM)
Phenanthrene aptamer sensor
(Kd = 995 plusmn 208 nM)
Fluorescence Curves for Aptamer Beacons in Seawater
Naphthalene aptamer sensor
(Kd = 13 plusmn 03 nM)
Phenanthrene aptamer sensor
(Kd = 995 plusmn 208 nM)
BBSRC sustainable aquaculture Pathogens in
Shellfisheries Water
Water-borne pathogens are (typically) difficult to measure
bull Very diverse (bacteria viruses parasites virulent and non-virulent strains)
bull Low concentration low infectious dose (eg Norovirus ge18 viral particles)
bull Lack of good bio-analytical methods (many canrsquot be cultured)
bull Diseases of unknown origin
Salmonella spp
Norovirus
Cryptosporidium
Quantitation of Microorganisms in Natural Waters
using the LabCard NASBA
New NASBA Assays for E coli DNA
Challenges
bull High genomic diversity In the environment
bull Genome size is approx 4000-5000 unique genes
bull gt2000 sequenced genomes
bull Approx 300 core genes
bull Target sequences are not always unique
Miriam Land et al (2015) Funct Integr Genomics 15 141-161
Bioinformatics methods were employed to find E coli sequences that werehellip
bull Unique to E coli
bull Ubiquitous in E coli strains
Confirmed experimentally using library of E coli (ECOR) and non-E coli bacteria from different hosts and
geographical locations
Monthly evaluation of the existing and new assays
using ldquorealrdquo water samples
11032016 1214Google Maps
Page 1 of 1ht tps wwwgooglecoukmaps50 8078436 -27419603 259769mdata=3m11e3
Google Maps
Imagery copy2016 TerraMetrics Map data copy2016 Google 20 km
Samples Collected in
Southwest England
Preliminary Results from Month One Sample Plate Assay Mean (n=3)
(CFU 100 mL)
RNA Assay after thermal
induction
(Cell Equivalents 100 mL)
DNA assay
(Genome Copy 100 mL)
Comment
Saline inshore (bathing water) 21 Not Detected Not Detected Possible to detect ge 10 cells in pure
culture Negative result due to
inhibitors
Spiked saline
(E coli type) 6533 3100 8500 RNA underestimation DNA
overestimation
Estuarine 1933 900 3200 RNA underestimation DNA
overestimation
Spiked estuarine (E coli type)
6600 400 8700 RNA underestimation DNA
overestimation
Tertiary sewage treatment works
(post UV) 121500
Not Detected Not Detected Sample inhibition
Tertiary sewage treatment works
(pre-UV)
274667 Not Detected Not Detected Sample inhibition
Secondary sewage treatment works 149000 Not Detected Not Detected Sample inhibition
Positive control
(E coli type) 274667 211500 430200 RNA underestimation DNA
overestimation
Negative control 0 Not Detected Not Detected
Other developments A New One-step NASBA
Development of new reagent
preservation methods
Optimisation of primer annealing
and thermo-tolerant enzymes
0
1000
2000
3000
4000
5000
6000
0 10 20 30
Am
ou
nt
of
Pro
du
ct
(Flu
ore
scen
ce)
Time (minutes)
ConventionalNASBA
Optimised One-Step NASBA
A New LOC for Spacial Multiplexing on Chip
Six chamber chip supporting six replicate
One-step NASBA reactions
Uses centrifugal force to achieve mixing of
sample with dehydrated reagents
Reaction chamber
Reagent reservoir
Air reservoir
BBSRC sustainable aquaculture Cytometer for HAB
detection and quantification Simultaneous measurement of electrical (impedance) and optical properties of individual cells
In-lab prototype
No air required for optics or operation (suitable for deep sea)
Challenges include sample concentration and optical detection limits (power in chip)
CT-DO Sensor Commercialisation
Data Flow
bull Easily discover sensors and their metadata
bull Sensors and sensor observations discoverable accessible and useable via the web
bull Seamlessly integrate sensors from Sense Ocean Network with sensors from other networks
The standards
Sensor passes UUID through to
base station
Platform
Satellite
Base station
Data centre
Data delivery by SOS server and linked ocean
data server
Proposed approach NERC
Linked data
(RDF SPARQL)
server
UUID SensorML
SSN (OWL)
JSON LD
netCDF EGO 11 CF16 LD
Reference for netCDF
Link Data conventions Yu J et al Towards Linked
Data Conventions for
Delivery of Environmental
Data Using netCDF pages
102-112 Springer ISBN
978-3-319-15993-5
Send data + UUID Publish
OampMRDF
ltomOM_Observation
gmlid=ExampleOutOfBandNetCDFldquo xmlnsom=httpwwwopengisnetom20 xmlnsxsi=httpwwww3org2001XMLSchema‐instanceldquo xmlnsxlink=httpwwww3org1999xlink
xmlnsgml=httpwwwopengisnetgml32 xsischemaLocation=httpwwwopengisnetom20 httpschemasopengisnetom20observationxsdgt ltgmldescriptiongtObservation instance with remote resultltgmldescriptiongt ltomtype xlinkhref=httpwwwopengisnetdefobservationTypeOGC‐OM20OM_TimeSeriesObservationgt ltomphenomenonTimegt
ltgmlTimePeriodgmlid=phenomenonTime-JULD-1gt ltgmlbeginPositiongt2015‐01‐11T17222500ltgmlbeginPositiongt ltgmlendPositiongt2015‐01‐11T18222500ltgmlendPositiongt ltgmlTimePeriodgt
ltomphenomenonTimegt ltomresultTimegt ltgmlTimeInstant gmlid=resultTime-DATE_UPDATEgt ltgmltimePositiongt2015‐01‐11T18222500ltgmltimePositiongt ltgmlTimeInstantgt ltomresultTimegt ltomprocedure xlinkhref=rdquohttplinkeddevbodcacuksysteminstanceTOOL0969_1234rdquogt ltomobservedProperty xlinkhref=rdquocompositeTOOL0969xmlrdquogt ltomfeatureOfInterest xlinkhref=httpvocabnercacukcollectionS26currentMAT00640gt ltomresultgt ltsweDataStreamgt ltsweelementType name=Componentsgt ltsweDataRecordgt ltswefield name=timegt ltsweQuantitygt ltswelabelgtTIMEltswelabelgt ltsweuom code=s gt ltsweQuantitygt ltswefieldgt ltswefield name=Temp xlinkhref=httpvocabnercacukcollectionP01currentTEMPPR01gt ltsweQuantitygt ltswelabelgtTemperature of the water bodyltswelabelgt ltsweuom code=Cel xlinkhref=rdquohttpvocabnercacukcollectionP06currentUPAArdquo gt ltsweQuantitygt ltswefieldgt ltswefield name=WC_dissO2_optode xlinkhref=httpvocabnercacukcollectionP01currentDOXYOP01gt ltsweQuantitygt ltswelabelgtConcentration of oxygen O2 per unit volume of the water body [dissolved plus reactive particulate phase] by in-situ oxygen optodeltswelabelgt ltsweuom code=umolL xlinkhref=rdquohttpvocabnercacukcollectionP06currentUPOXrdquogt ltsweQuantitygt ltswefieldgt ltswefield name=WC_dissO2_uncalib_2 xlinkhref=httpvocabnercacukcollectionP01currentDOXYUZ02gt ltsweQuantitygt ltswelabelgtConcentration (second sensor) of oxygen O2 CAS 7782-44-7 per unit volume of the water body [dissolved plus reactive particulate phase] by in-situ sensor and no calibration against sample dataltswelabelgt ltsweuom code= xlinkhref=rdquohttpvocabnercacukcollectionP06currentUPCTrdquo gt ltsweQuantitygt ltswefieldgt ltsweDataRecordgt ltsweelementTypegt ltsweencodinggt ltsweBinaryEncoding byteEncoding=raw byteOrder=bigEndiangt ltswemembergt ltsweComponent ref=applicationx-netcdf dataType=httpwwwunidataucaredusoftwarenetcdfgt ltswemembergt ltsweBinaryEncodinggt ltsweencodinggt ltswevalues xlinkhref=http1921711351578080erddaptabledapC_Users_thogar_Desktop_Gdata_5cbc_92e8_e1d6ncgt ltsweDataStreamgt ltomresultgt ltomOM_Observationgt
Publication amp Discovery
Mainly for machine to machine access
2017 Forward look
Marine Sensors Technologies and TRL
2011201620212026 Microfabricated Solid State Electrochemistry bull Salinity 5-8-9-9
bull Dissolved oxygen 4-7-9-9
Optodes optical sensors bull Gases inc methane 6-6-8-9
bull pH pCO2 4-6-8-9
bull Radionuclide 1-3-5-8
Lab on Chip Cytometer bull Whole cells (label free) 4-5-7-9
bull Labelled cells 3-5-6-8
bull Microplastics 2-4-7-9
bull Bead assays 2-3-6-8
Lab on Chip Chemistry bull Inorganic Nutrients 6-8-9-9
bull Organic Nutrients 2-5-7-9
bull Trace metals 4-7-8-9
bull pH 5-7-9-9 TA 2-4-7-9 DIC 2-4-9-9 pCO2 2-4-6-8
bull Small organics eg PAH PCBs (f-pM) 2-5-6-8
bull Proteins and large organics (copies L) 2-4-6-7
bull Nucleic Acids (copies L) 5-6-7-9
bull Radionuclide 1-3-5-7
LOC Sensor Subsystems
developed
Benchtop
system
Shipboard
measurements
In situ
deployment
Nitrate
pH
Phosphate
Iron -
Silicate 2017 2016
Ammonium Late 2017
Total alkalinity 2017 2017
DIC very close 2017 Late 2017
Organic N and P 2017 2017
OTEG LOC sensors development status
LOC Sensor River
estuary
Coastal At depth Glacial
melt
Year- long
(unattended)
Glider or AUV Argo
float
Nitrate 2017
pH 2017
Phosphate 2017 2018 2017 2017
Iron 2017
Silicate 2016 2017 2017 2018 2017
OTEG LOC sensors ndash in situ deployments projected
2017 Forward look highlights
SenseOCEAN final year deployments demonstrations
bull Demonstration on Apex (PROVOR) (Nitrate Phosphate pH)
Platforms targeted for demonstration
AUV
(AWI)
Bouys
(lLEGOS-
CNRS)
Floats
(LEGOS-CNRS)
Shallow cabled and
deep sea observatory
(AWI)
2017 Forward look highlights
SenseOCEAN final year deployments demonstrations
bull Demonstration on Apex (PROVOR) (Nitrate Phosphate pH)
Integration into SLOCUM glider
2017 Forward look highlights
SenseOCEAN final year deployments demonstrations
bull Demonstration on Apex (PROVOR) (Nitrate Phosphate pH)
Integration into SLOCUM glider
Integration into ALR and trials for ETI
ETI CCSMV - Project
The Concept The Taxi
The sensors
CCS Sensors package commercial
SeapHOx SBE52 CTD SEAFET SBE43F DO
CCS Sensors package NOC
lab on a chip
TRL 7 pH Phosphate Nitrate
TRL 4-7 TA DIC
2017 Forward look highlights
SenseOCEAN final year deployments demonstrations
bull Demonstration on Apex (PROVOR) (Nitrate Phosphate pH)
Integration into SLOCUM glider
Integration into ALR and trials for ETI
Pathogen detection in the field
CTDO product launch
LOC license agreement commercialisation
Acknowledgements Work by current and past members of OTEG
Group head Matt Mowlem
Subgroup heads
Robin Pascal (Multidisciplinary)
Socratis Loucaides (Analytical science)
Chris Cardwell (Electronics amp Software)
Kevin Saw (Mechanical)
Photos from Dave Owsianka
Alex Beaton Martin Arundell
and others
Collaborators at
University of Southampton
NOC
Plymouth Marine Laboratory
Scottish Marine Institute
GEOMAR and others

GOOS EOV
GOOS EOV
Summary of the Tasks outlined in SenseOCEAN mapped onto
the current state of the art
biogeochemical model of the
ocean system
Marine Sensors Technologies and TRL
Microfabricated Solid State Electrochemistry bull Salinity 7
bull Dissolved oxygen 7
Optodes optical sensors bull Gases inc methane 6
bull pH pCO2 7 bull Radionuclide 3
Lab on Chip Cytometer bull Whole cells (label free) 5
bull Labelled cells 5
bull Microplastics 4
bull Bead assays 3
Lab on Chip Chemistry bull Inorganic Nutrients 8
bull Organic Nutrients 5
bull Trace metals 7
bull pH 7 TA 4 DIC 3 pCO2 4 bull Small organics eg PAH PCBs (f-pM) 5
bull Proteins and large organics (copies L) 4
bull Nucleic Acids (copies L) 6
bull Radionuclide 3
2016 Highlights
Demo test Kiel Fjord Sept 2016
12122016 Title of Presentation 13
Kiel Preliminary Results pH
Preliminary LOC data from T Yin (NOC) and TU Graz team
(Optodes)
NOC chemical sensor platform
bull Now operational for several
parameters
bull Platform technology - easy to
adapt to other absorbance-based
assays
bull Works at pressure (deepest
deployment to date 4800 m)
bull Small enough for gliderAUV
deployment
bull Low power (year long deployment
on batteries achieved)
NOC chemical sensor platform
bull Now operational for several
parameters
bull Platform technology - easy to
adapt to other absorbance-based
assays
bull Works at pressure (deepest
deployment to date 4800 m)
bull Small enough for gliderAUV
deployment
bull Low power (year long deployment
on batteries achieved)
Reagent
housing
LOC
sensor
housing
20 cm
56
cm
LOC Sensor Analytical method Measurement type LODprecision
Nitrate + nitrite Griess assay (with Cd
reduction)
Colourimetry (absorbance) 20 nM
pH Thymol blue Dual wavelength
absorbance 0001 pH units
Phosphate Molybdenum blue (modified) Colourimetry (absorbance) 30 nM
Iron (II) Iron (III) Ferrozine (with ascorbic acid
reduction for Fe (III))
Colourimetry (absorbance)
20 nM
Silicate Silicomolybdic acid Colourimetry (absorbance) 20 nM
Ammonium OPA + membrane Fluorescence 1 nM
Total alkalinity BCG with TMT or single
step
Dual wavelength
absorbance (2 microM)
DIC Membrane+ C of NaOH Conductivity (2 microM)
Organic N and P UV digester + inorganic
system Colourimetry (absorbance) (20 nM)
NERC Macronutrient Cycles Nitrate in a river
Hampshire Avon deployment site Sensor after deployment in River
Nitrate sensor in river
NERC Macronutrient Cycles Nitrate in a river
Nutrient Challenge Nitrate and phosphate in a
Maumee River Ohio
Maumee River Ohio
SenseOCEAN Dissolved iron in Kiel Fjord
7950
8000
8050
8100
8150
8200
8250
8300
623 624 625 626 627 628 629
pH
Date
Gullmar fjord Sweden June 2015
NOC pH sensor field tests
CMEP Tropical coastal waters
Deployment
location
Allison Schaap
CMEP Tropical coastal waters
0
1
2
3
4
5
6
7
8
0
05
1
15
2
2514 1
20
0
14 1
80
0
15 0
00
0
15
0
60
0
15 1
20
0
15 1
80
0
16 0
00
0
16 0
60
0
16 1
20
0
16 1
80
0
17 0
00
0
17 0
60
0
17 1
20
0
17 1
80
0
Dep
th (
m)
Nit
rate
(micro
M)
Ph
osp
hate
(micro
M)
C
hlo
rop
hyll (
microg
L)
Chlorophyll Nitrate Phosphate Depth
DELVE Nitrate in glacial meltwater
Nitrate sensor
deployed in glacial
streams draining
Greenland Ice Sheet
Sub-zero
temperatures and
highly turbid waters
DELVE Nitrate in glacial meltwater
Nitrate deployment on gliders
Celtic Sea April 2015
Alex Vincent amp Maeve Lohan NOC SOES (U Soton)
Temperature
(degC)
Chlorophyll
(mgm3)
Nitrate
(microM)
FixO3 TNA Year-long unattended in the Arctic
LOC nitrate sensors deployed
in two moorings on Fram
Straight for one year (50 ndash 80 m
deep two measurements per
day) Funded by FixO3
Biosensing
Figure and work by MN Tsaloglou
Image courtesy of our partners Aptamer
solutions
httpwwwaptamersolutionscouk
Contract Research Aptamer Antibody PAH sensor proof
of concept
Naphthalene aptamer sensor
(Kd = 13 plusmn 03 nM)
Phenanthrene aptamer sensor
(Kd = 995 plusmn 208 nM)
Fluorescence Curves for Aptamer Beacons in Seawater
Naphthalene aptamer sensor
(Kd = 13 plusmn 03 nM)
Phenanthrene aptamer sensor
(Kd = 995 plusmn 208 nM)
BBSRC sustainable aquaculture Pathogens in
Shellfisheries Water
Water-borne pathogens are (typically) difficult to measure
bull Very diverse (bacteria viruses parasites virulent and non-virulent strains)
bull Low concentration low infectious dose (eg Norovirus ge18 viral particles)
bull Lack of good bio-analytical methods (many canrsquot be cultured)
bull Diseases of unknown origin
Salmonella spp
Norovirus
Cryptosporidium
Quantitation of Microorganisms in Natural Waters
using the LabCard NASBA
New NASBA Assays for E coli DNA
Challenges
bull High genomic diversity In the environment
bull Genome size is approx 4000-5000 unique genes
bull gt2000 sequenced genomes
bull Approx 300 core genes
bull Target sequences are not always unique
Miriam Land et al (2015) Funct Integr Genomics 15 141-161
Bioinformatics methods were employed to find E coli sequences that werehellip
bull Unique to E coli
bull Ubiquitous in E coli strains
Confirmed experimentally using library of E coli (ECOR) and non-E coli bacteria from different hosts and
geographical locations
Monthly evaluation of the existing and new assays
using ldquorealrdquo water samples
11032016 1214Google Maps
Page 1 of 1ht tps wwwgooglecoukmaps50 8078436 -27419603 259769mdata=3m11e3
Google Maps
Imagery copy2016 TerraMetrics Map data copy2016 Google 20 km
Samples Collected in
Southwest England
Preliminary Results from Month One Sample Plate Assay Mean (n=3)
(CFU 100 mL)
RNA Assay after thermal
induction
(Cell Equivalents 100 mL)
DNA assay
(Genome Copy 100 mL)
Comment
Saline inshore (bathing water) 21 Not Detected Not Detected Possible to detect ge 10 cells in pure
culture Negative result due to
inhibitors
Spiked saline
(E coli type) 6533 3100 8500 RNA underestimation DNA
overestimation
Estuarine 1933 900 3200 RNA underestimation DNA
overestimation
Spiked estuarine (E coli type)
6600 400 8700 RNA underestimation DNA
overestimation
Tertiary sewage treatment works
(post UV) 121500
Not Detected Not Detected Sample inhibition
Tertiary sewage treatment works
(pre-UV)
274667 Not Detected Not Detected Sample inhibition
Secondary sewage treatment works 149000 Not Detected Not Detected Sample inhibition
Positive control
(E coli type) 274667 211500 430200 RNA underestimation DNA
overestimation
Negative control 0 Not Detected Not Detected
Other developments A New One-step NASBA
Development of new reagent
preservation methods
Optimisation of primer annealing
and thermo-tolerant enzymes
0
1000
2000
3000
4000
5000
6000
0 10 20 30
Am
ou
nt
of
Pro
du
ct
(Flu
ore
scen
ce)
Time (minutes)
ConventionalNASBA
Optimised One-Step NASBA
A New LOC for Spacial Multiplexing on Chip
Six chamber chip supporting six replicate
One-step NASBA reactions
Uses centrifugal force to achieve mixing of
sample with dehydrated reagents
Reaction chamber
Reagent reservoir
Air reservoir
BBSRC sustainable aquaculture Cytometer for HAB
detection and quantification Simultaneous measurement of electrical (impedance) and optical properties of individual cells
In-lab prototype
No air required for optics or operation (suitable for deep sea)
Challenges include sample concentration and optical detection limits (power in chip)
CT-DO Sensor Commercialisation
Data Flow
bull Easily discover sensors and their metadata
bull Sensors and sensor observations discoverable accessible and useable via the web
bull Seamlessly integrate sensors from Sense Ocean Network with sensors from other networks
The standards
Sensor passes UUID through to
base station
Platform
Satellite
Base station
Data centre
Data delivery by SOS server and linked ocean
data server
Proposed approach NERC
Linked data
(RDF SPARQL)
server
UUID SensorML
SSN (OWL)
JSON LD
netCDF EGO 11 CF16 LD
Reference for netCDF
Link Data conventions Yu J et al Towards Linked
Data Conventions for
Delivery of Environmental
Data Using netCDF pages
102-112 Springer ISBN
978-3-319-15993-5
Send data + UUID Publish
OampMRDF
ltomOM_Observation
gmlid=ExampleOutOfBandNetCDFldquo xmlnsom=httpwwwopengisnetom20 xmlnsxsi=httpwwww3org2001XMLSchema‐instanceldquo xmlnsxlink=httpwwww3org1999xlink
xmlnsgml=httpwwwopengisnetgml32 xsischemaLocation=httpwwwopengisnetom20 httpschemasopengisnetom20observationxsdgt ltgmldescriptiongtObservation instance with remote resultltgmldescriptiongt ltomtype xlinkhref=httpwwwopengisnetdefobservationTypeOGC‐OM20OM_TimeSeriesObservationgt ltomphenomenonTimegt
ltgmlTimePeriodgmlid=phenomenonTime-JULD-1gt ltgmlbeginPositiongt2015‐01‐11T17222500ltgmlbeginPositiongt ltgmlendPositiongt2015‐01‐11T18222500ltgmlendPositiongt ltgmlTimePeriodgt
ltomphenomenonTimegt ltomresultTimegt ltgmlTimeInstant gmlid=resultTime-DATE_UPDATEgt ltgmltimePositiongt2015‐01‐11T18222500ltgmltimePositiongt ltgmlTimeInstantgt ltomresultTimegt ltomprocedure xlinkhref=rdquohttplinkeddevbodcacuksysteminstanceTOOL0969_1234rdquogt ltomobservedProperty xlinkhref=rdquocompositeTOOL0969xmlrdquogt ltomfeatureOfInterest xlinkhref=httpvocabnercacukcollectionS26currentMAT00640gt ltomresultgt ltsweDataStreamgt ltsweelementType name=Componentsgt ltsweDataRecordgt ltswefield name=timegt ltsweQuantitygt ltswelabelgtTIMEltswelabelgt ltsweuom code=s gt ltsweQuantitygt ltswefieldgt ltswefield name=Temp xlinkhref=httpvocabnercacukcollectionP01currentTEMPPR01gt ltsweQuantitygt ltswelabelgtTemperature of the water bodyltswelabelgt ltsweuom code=Cel xlinkhref=rdquohttpvocabnercacukcollectionP06currentUPAArdquo gt ltsweQuantitygt ltswefieldgt ltswefield name=WC_dissO2_optode xlinkhref=httpvocabnercacukcollectionP01currentDOXYOP01gt ltsweQuantitygt ltswelabelgtConcentration of oxygen O2 per unit volume of the water body [dissolved plus reactive particulate phase] by in-situ oxygen optodeltswelabelgt ltsweuom code=umolL xlinkhref=rdquohttpvocabnercacukcollectionP06currentUPOXrdquogt ltsweQuantitygt ltswefieldgt ltswefield name=WC_dissO2_uncalib_2 xlinkhref=httpvocabnercacukcollectionP01currentDOXYUZ02gt ltsweQuantitygt ltswelabelgtConcentration (second sensor) of oxygen O2 CAS 7782-44-7 per unit volume of the water body [dissolved plus reactive particulate phase] by in-situ sensor and no calibration against sample dataltswelabelgt ltsweuom code= xlinkhref=rdquohttpvocabnercacukcollectionP06currentUPCTrdquo gt ltsweQuantitygt ltswefieldgt ltsweDataRecordgt ltsweelementTypegt ltsweencodinggt ltsweBinaryEncoding byteEncoding=raw byteOrder=bigEndiangt ltswemembergt ltsweComponent ref=applicationx-netcdf dataType=httpwwwunidataucaredusoftwarenetcdfgt ltswemembergt ltsweBinaryEncodinggt ltsweencodinggt ltswevalues xlinkhref=http1921711351578080erddaptabledapC_Users_thogar_Desktop_Gdata_5cbc_92e8_e1d6ncgt ltsweDataStreamgt ltomresultgt ltomOM_Observationgt
Publication amp Discovery
Mainly for machine to machine access
2017 Forward look
Marine Sensors Technologies and TRL
2011201620212026 Microfabricated Solid State Electrochemistry bull Salinity 5-8-9-9
bull Dissolved oxygen 4-7-9-9
Optodes optical sensors bull Gases inc methane 6-6-8-9
bull pH pCO2 4-6-8-9
bull Radionuclide 1-3-5-8
Lab on Chip Cytometer bull Whole cells (label free) 4-5-7-9
bull Labelled cells 3-5-6-8
bull Microplastics 2-4-7-9
bull Bead assays 2-3-6-8
Lab on Chip Chemistry bull Inorganic Nutrients 6-8-9-9
bull Organic Nutrients 2-5-7-9
bull Trace metals 4-7-8-9
bull pH 5-7-9-9 TA 2-4-7-9 DIC 2-4-9-9 pCO2 2-4-6-8
bull Small organics eg PAH PCBs (f-pM) 2-5-6-8
bull Proteins and large organics (copies L) 2-4-6-7
bull Nucleic Acids (copies L) 5-6-7-9
bull Radionuclide 1-3-5-7
LOC Sensor Subsystems
developed
Benchtop
system
Shipboard
measurements
In situ
deployment
Nitrate
pH
Phosphate
Iron -
Silicate 2017 2016
Ammonium Late 2017
Total alkalinity 2017 2017
DIC very close 2017 Late 2017
Organic N and P 2017 2017
OTEG LOC sensors development status
LOC Sensor River
estuary
Coastal At depth Glacial
melt
Year- long
(unattended)
Glider or AUV Argo
float
Nitrate 2017
pH 2017
Phosphate 2017 2018 2017 2017
Iron 2017
Silicate 2016 2017 2017 2018 2017
OTEG LOC sensors ndash in situ deployments projected
2017 Forward look highlights
SenseOCEAN final year deployments demonstrations
bull Demonstration on Apex (PROVOR) (Nitrate Phosphate pH)
Platforms targeted for demonstration
AUV
(AWI)
Bouys
(lLEGOS-
CNRS)
Floats
(LEGOS-CNRS)
Shallow cabled and
deep sea observatory
(AWI)
2017 Forward look highlights
SenseOCEAN final year deployments demonstrations
bull Demonstration on Apex (PROVOR) (Nitrate Phosphate pH)
Integration into SLOCUM glider
2017 Forward look highlights
SenseOCEAN final year deployments demonstrations
bull Demonstration on Apex (PROVOR) (Nitrate Phosphate pH)
Integration into SLOCUM glider
Integration into ALR and trials for ETI
ETI CCSMV - Project
The Concept The Taxi
The sensors
CCS Sensors package commercial
SeapHOx SBE52 CTD SEAFET SBE43F DO
CCS Sensors package NOC
lab on a chip
TRL 7 pH Phosphate Nitrate
TRL 4-7 TA DIC
2017 Forward look highlights
SenseOCEAN final year deployments demonstrations
bull Demonstration on Apex (PROVOR) (Nitrate Phosphate pH)
Integration into SLOCUM glider
Integration into ALR and trials for ETI
Pathogen detection in the field
CTDO product launch
LOC license agreement commercialisation
Acknowledgements Work by current and past members of OTEG
Group head Matt Mowlem
Subgroup heads
Robin Pascal (Multidisciplinary)
Socratis Loucaides (Analytical science)
Chris Cardwell (Electronics amp Software)
Kevin Saw (Mechanical)
Photos from Dave Owsianka
Alex Beaton Martin Arundell
and others
Collaborators at
University of Southampton
NOC
Plymouth Marine Laboratory
Scottish Marine Institute
GEOMAR and others

GOOS EOV
Summary of the Tasks outlined in SenseOCEAN mapped onto
the current state of the art
biogeochemical model of the
ocean system
Marine Sensors Technologies and TRL
Microfabricated Solid State Electrochemistry bull Salinity 7
bull Dissolved oxygen 7
Optodes optical sensors bull Gases inc methane 6
bull pH pCO2 7 bull Radionuclide 3
Lab on Chip Cytometer bull Whole cells (label free) 5
bull Labelled cells 5
bull Microplastics 4
bull Bead assays 3
Lab on Chip Chemistry bull Inorganic Nutrients 8
bull Organic Nutrients 5
bull Trace metals 7
bull pH 7 TA 4 DIC 3 pCO2 4 bull Small organics eg PAH PCBs (f-pM) 5
bull Proteins and large organics (copies L) 4
bull Nucleic Acids (copies L) 6
bull Radionuclide 3
2016 Highlights
Demo test Kiel Fjord Sept 2016
12122016 Title of Presentation 13
Kiel Preliminary Results pH
Preliminary LOC data from T Yin (NOC) and TU Graz team
(Optodes)
NOC chemical sensor platform
bull Now operational for several
parameters
bull Platform technology - easy to
adapt to other absorbance-based
assays
bull Works at pressure (deepest
deployment to date 4800 m)
bull Small enough for gliderAUV
deployment
bull Low power (year long deployment
on batteries achieved)
NOC chemical sensor platform
bull Now operational for several
parameters
bull Platform technology - easy to
adapt to other absorbance-based
assays
bull Works at pressure (deepest
deployment to date 4800 m)
bull Small enough for gliderAUV
deployment
bull Low power (year long deployment
on batteries achieved)
Reagent
housing
LOC
sensor
housing
20 cm
56
cm
LOC Sensor Analytical method Measurement type LODprecision
Nitrate + nitrite Griess assay (with Cd
reduction)
Colourimetry (absorbance) 20 nM
pH Thymol blue Dual wavelength
absorbance 0001 pH units
Phosphate Molybdenum blue (modified) Colourimetry (absorbance) 30 nM
Iron (II) Iron (III) Ferrozine (with ascorbic acid
reduction for Fe (III))
Colourimetry (absorbance)
20 nM
Silicate Silicomolybdic acid Colourimetry (absorbance) 20 nM
Ammonium OPA + membrane Fluorescence 1 nM
Total alkalinity BCG with TMT or single
step
Dual wavelength
absorbance (2 microM)
DIC Membrane+ C of NaOH Conductivity (2 microM)
Organic N and P UV digester + inorganic
system Colourimetry (absorbance) (20 nM)
NERC Macronutrient Cycles Nitrate in a river
Hampshire Avon deployment site Sensor after deployment in River
Nitrate sensor in river
NERC Macronutrient Cycles Nitrate in a river
Nutrient Challenge Nitrate and phosphate in a
Maumee River Ohio
Maumee River Ohio
SenseOCEAN Dissolved iron in Kiel Fjord
7950
8000
8050
8100
8150
8200
8250
8300
623 624 625 626 627 628 629
pH
Date
Gullmar fjord Sweden June 2015
NOC pH sensor field tests
CMEP Tropical coastal waters
Deployment
location
Allison Schaap
CMEP Tropical coastal waters
0
1
2
3
4
5
6
7
8
0
05
1
15
2
2514 1
20
0
14 1
80
0
15 0
00
0
15
0
60
0
15 1
20
0
15 1
80
0
16 0
00
0
16 0
60
0
16 1
20
0
16 1
80
0
17 0
00
0
17 0
60
0
17 1
20
0
17 1
80
0
Dep
th (
m)
Nit
rate
(micro
M)
Ph
osp
hate
(micro
M)
C
hlo
rop
hyll (
microg
L)
Chlorophyll Nitrate Phosphate Depth
DELVE Nitrate in glacial meltwater
Nitrate sensor
deployed in glacial
streams draining
Greenland Ice Sheet
Sub-zero
temperatures and
highly turbid waters
DELVE Nitrate in glacial meltwater
Nitrate deployment on gliders
Celtic Sea April 2015
Alex Vincent amp Maeve Lohan NOC SOES (U Soton)
Temperature
(degC)
Chlorophyll
(mgm3)
Nitrate
(microM)
FixO3 TNA Year-long unattended in the Arctic
LOC nitrate sensors deployed
in two moorings on Fram
Straight for one year (50 ndash 80 m
deep two measurements per
day) Funded by FixO3
Biosensing
Figure and work by MN Tsaloglou
Image courtesy of our partners Aptamer
solutions
httpwwwaptamersolutionscouk
Contract Research Aptamer Antibody PAH sensor proof
of concept
Naphthalene aptamer sensor
(Kd = 13 plusmn 03 nM)
Phenanthrene aptamer sensor
(Kd = 995 plusmn 208 nM)
Fluorescence Curves for Aptamer Beacons in Seawater
Naphthalene aptamer sensor
(Kd = 13 plusmn 03 nM)
Phenanthrene aptamer sensor
(Kd = 995 plusmn 208 nM)
BBSRC sustainable aquaculture Pathogens in
Shellfisheries Water
Water-borne pathogens are (typically) difficult to measure
bull Very diverse (bacteria viruses parasites virulent and non-virulent strains)
bull Low concentration low infectious dose (eg Norovirus ge18 viral particles)
bull Lack of good bio-analytical methods (many canrsquot be cultured)
bull Diseases of unknown origin
Salmonella spp
Norovirus
Cryptosporidium
Quantitation of Microorganisms in Natural Waters
using the LabCard NASBA
New NASBA Assays for E coli DNA
Challenges
bull High genomic diversity In the environment
bull Genome size is approx 4000-5000 unique genes
bull gt2000 sequenced genomes
bull Approx 300 core genes
bull Target sequences are not always unique
Miriam Land et al (2015) Funct Integr Genomics 15 141-161
Bioinformatics methods were employed to find E coli sequences that werehellip
bull Unique to E coli
bull Ubiquitous in E coli strains
Confirmed experimentally using library of E coli (ECOR) and non-E coli bacteria from different hosts and
geographical locations
Monthly evaluation of the existing and new assays
using ldquorealrdquo water samples
11032016 1214Google Maps
Page 1 of 1ht tps wwwgooglecoukmaps50 8078436 -27419603 259769mdata=3m11e3
Google Maps
Imagery copy2016 TerraMetrics Map data copy2016 Google 20 km
Samples Collected in
Southwest England
Preliminary Results from Month One Sample Plate Assay Mean (n=3)
(CFU 100 mL)
RNA Assay after thermal
induction
(Cell Equivalents 100 mL)
DNA assay
(Genome Copy 100 mL)
Comment
Saline inshore (bathing water) 21 Not Detected Not Detected Possible to detect ge 10 cells in pure
culture Negative result due to
inhibitors
Spiked saline
(E coli type) 6533 3100 8500 RNA underestimation DNA
overestimation
Estuarine 1933 900 3200 RNA underestimation DNA
overestimation
Spiked estuarine (E coli type)
6600 400 8700 RNA underestimation DNA
overestimation
Tertiary sewage treatment works
(post UV) 121500
Not Detected Not Detected Sample inhibition
Tertiary sewage treatment works
(pre-UV)
274667 Not Detected Not Detected Sample inhibition
Secondary sewage treatment works 149000 Not Detected Not Detected Sample inhibition
Positive control
(E coli type) 274667 211500 430200 RNA underestimation DNA
overestimation
Negative control 0 Not Detected Not Detected
Other developments A New One-step NASBA
Development of new reagent
preservation methods
Optimisation of primer annealing
and thermo-tolerant enzymes
0
1000
2000
3000
4000
5000
6000
0 10 20 30
Am
ou
nt
of
Pro
du
ct
(Flu
ore
scen
ce)
Time (minutes)
ConventionalNASBA
Optimised One-Step NASBA
A New LOC for Spacial Multiplexing on Chip
Six chamber chip supporting six replicate
One-step NASBA reactions
Uses centrifugal force to achieve mixing of
sample with dehydrated reagents
Reaction chamber
Reagent reservoir
Air reservoir
BBSRC sustainable aquaculture Cytometer for HAB
detection and quantification Simultaneous measurement of electrical (impedance) and optical properties of individual cells
In-lab prototype
No air required for optics or operation (suitable for deep sea)
Challenges include sample concentration and optical detection limits (power in chip)
CT-DO Sensor Commercialisation
Data Flow
bull Easily discover sensors and their metadata
bull Sensors and sensor observations discoverable accessible and useable via the web
bull Seamlessly integrate sensors from Sense Ocean Network with sensors from other networks
The standards
Sensor passes UUID through to
base station
Platform
Satellite
Base station
Data centre
Data delivery by SOS server and linked ocean
data server
Proposed approach NERC
Linked data
(RDF SPARQL)
server
UUID SensorML
SSN (OWL)
JSON LD
netCDF EGO 11 CF16 LD
Reference for netCDF
Link Data conventions Yu J et al Towards Linked
Data Conventions for
Delivery of Environmental
Data Using netCDF pages
102-112 Springer ISBN
978-3-319-15993-5
Send data + UUID Publish
OampMRDF
ltomOM_Observation
gmlid=ExampleOutOfBandNetCDFldquo xmlnsom=httpwwwopengisnetom20 xmlnsxsi=httpwwww3org2001XMLSchema‐instanceldquo xmlnsxlink=httpwwww3org1999xlink
xmlnsgml=httpwwwopengisnetgml32 xsischemaLocation=httpwwwopengisnetom20 httpschemasopengisnetom20observationxsdgt ltgmldescriptiongtObservation instance with remote resultltgmldescriptiongt ltomtype xlinkhref=httpwwwopengisnetdefobservationTypeOGC‐OM20OM_TimeSeriesObservationgt ltomphenomenonTimegt
ltgmlTimePeriodgmlid=phenomenonTime-JULD-1gt ltgmlbeginPositiongt2015‐01‐11T17222500ltgmlbeginPositiongt ltgmlendPositiongt2015‐01‐11T18222500ltgmlendPositiongt ltgmlTimePeriodgt
ltomphenomenonTimegt ltomresultTimegt ltgmlTimeInstant gmlid=resultTime-DATE_UPDATEgt ltgmltimePositiongt2015‐01‐11T18222500ltgmltimePositiongt ltgmlTimeInstantgt ltomresultTimegt ltomprocedure xlinkhref=rdquohttplinkeddevbodcacuksysteminstanceTOOL0969_1234rdquogt ltomobservedProperty xlinkhref=rdquocompositeTOOL0969xmlrdquogt ltomfeatureOfInterest xlinkhref=httpvocabnercacukcollectionS26currentMAT00640gt ltomresultgt ltsweDataStreamgt ltsweelementType name=Componentsgt ltsweDataRecordgt ltswefield name=timegt ltsweQuantitygt ltswelabelgtTIMEltswelabelgt ltsweuom code=s gt ltsweQuantitygt ltswefieldgt ltswefield name=Temp xlinkhref=httpvocabnercacukcollectionP01currentTEMPPR01gt ltsweQuantitygt ltswelabelgtTemperature of the water bodyltswelabelgt ltsweuom code=Cel xlinkhref=rdquohttpvocabnercacukcollectionP06currentUPAArdquo gt ltsweQuantitygt ltswefieldgt ltswefield name=WC_dissO2_optode xlinkhref=httpvocabnercacukcollectionP01currentDOXYOP01gt ltsweQuantitygt ltswelabelgtConcentration of oxygen O2 per unit volume of the water body [dissolved plus reactive particulate phase] by in-situ oxygen optodeltswelabelgt ltsweuom code=umolL xlinkhref=rdquohttpvocabnercacukcollectionP06currentUPOXrdquogt ltsweQuantitygt ltswefieldgt ltswefield name=WC_dissO2_uncalib_2 xlinkhref=httpvocabnercacukcollectionP01currentDOXYUZ02gt ltsweQuantitygt ltswelabelgtConcentration (second sensor) of oxygen O2 CAS 7782-44-7 per unit volume of the water body [dissolved plus reactive particulate phase] by in-situ sensor and no calibration against sample dataltswelabelgt ltsweuom code= xlinkhref=rdquohttpvocabnercacukcollectionP06currentUPCTrdquo gt ltsweQuantitygt ltswefieldgt ltsweDataRecordgt ltsweelementTypegt ltsweencodinggt ltsweBinaryEncoding byteEncoding=raw byteOrder=bigEndiangt ltswemembergt ltsweComponent ref=applicationx-netcdf dataType=httpwwwunidataucaredusoftwarenetcdfgt ltswemembergt ltsweBinaryEncodinggt ltsweencodinggt ltswevalues xlinkhref=http1921711351578080erddaptabledapC_Users_thogar_Desktop_Gdata_5cbc_92e8_e1d6ncgt ltsweDataStreamgt ltomresultgt ltomOM_Observationgt
Publication amp Discovery
Mainly for machine to machine access
2017 Forward look
Marine Sensors Technologies and TRL
2011201620212026 Microfabricated Solid State Electrochemistry bull Salinity 5-8-9-9
bull Dissolved oxygen 4-7-9-9
Optodes optical sensors bull Gases inc methane 6-6-8-9
bull pH pCO2 4-6-8-9
bull Radionuclide 1-3-5-8
Lab on Chip Cytometer bull Whole cells (label free) 4-5-7-9
bull Labelled cells 3-5-6-8
bull Microplastics 2-4-7-9
bull Bead assays 2-3-6-8
Lab on Chip Chemistry bull Inorganic Nutrients 6-8-9-9
bull Organic Nutrients 2-5-7-9
bull Trace metals 4-7-8-9
bull pH 5-7-9-9 TA 2-4-7-9 DIC 2-4-9-9 pCO2 2-4-6-8
bull Small organics eg PAH PCBs (f-pM) 2-5-6-8
bull Proteins and large organics (copies L) 2-4-6-7
bull Nucleic Acids (copies L) 5-6-7-9
bull Radionuclide 1-3-5-7
LOC Sensor Subsystems
developed
Benchtop
system
Shipboard
measurements
In situ
deployment
Nitrate
pH
Phosphate
Iron -
Silicate 2017 2016
Ammonium Late 2017
Total alkalinity 2017 2017
DIC very close 2017 Late 2017
Organic N and P 2017 2017
OTEG LOC sensors development status
LOC Sensor River
estuary
Coastal At depth Glacial
melt
Year- long
(unattended)
Glider or AUV Argo
float
Nitrate 2017
pH 2017
Phosphate 2017 2018 2017 2017
Iron 2017
Silicate 2016 2017 2017 2018 2017
OTEG LOC sensors ndash in situ deployments projected
2017 Forward look highlights
SenseOCEAN final year deployments demonstrations
bull Demonstration on Apex (PROVOR) (Nitrate Phosphate pH)
Platforms targeted for demonstration
AUV
(AWI)
Bouys
(lLEGOS-
CNRS)
Floats
(LEGOS-CNRS)
Shallow cabled and
deep sea observatory
(AWI)
2017 Forward look highlights
SenseOCEAN final year deployments demonstrations
bull Demonstration on Apex (PROVOR) (Nitrate Phosphate pH)
Integration into SLOCUM glider
2017 Forward look highlights
SenseOCEAN final year deployments demonstrations
bull Demonstration on Apex (PROVOR) (Nitrate Phosphate pH)
Integration into SLOCUM glider
Integration into ALR and trials for ETI
ETI CCSMV - Project
The Concept The Taxi
The sensors
CCS Sensors package commercial
SeapHOx SBE52 CTD SEAFET SBE43F DO
CCS Sensors package NOC
lab on a chip
TRL 7 pH Phosphate Nitrate
TRL 4-7 TA DIC
2017 Forward look highlights
SenseOCEAN final year deployments demonstrations
bull Demonstration on Apex (PROVOR) (Nitrate Phosphate pH)
Integration into SLOCUM glider
Integration into ALR and trials for ETI
Pathogen detection in the field
CTDO product launch
LOC license agreement commercialisation
Acknowledgements Work by current and past members of OTEG
Group head Matt Mowlem
Subgroup heads
Robin Pascal (Multidisciplinary)
Socratis Loucaides (Analytical science)
Chris Cardwell (Electronics amp Software)
Kevin Saw (Mechanical)
Photos from Dave Owsianka
Alex Beaton Martin Arundell
and others
Collaborators at
University of Southampton
NOC
Plymouth Marine Laboratory
Scottish Marine Institute
GEOMAR and others

Marine Sensors Technologies and TRL
Microfabricated Solid State Electrochemistry bull Salinity 7
bull Dissolved oxygen 7
Optodes optical sensors bull Gases inc methane 6
bull pH pCO2 7 bull Radionuclide 3
Lab on Chip Cytometer bull Whole cells (label free) 5
bull Labelled cells 5
bull Microplastics 4
bull Bead assays 3
Lab on Chip Chemistry bull Inorganic Nutrients 8
bull Organic Nutrients 5
bull Trace metals 7
bull pH 7 TA 4 DIC 3 pCO2 4 bull Small organics eg PAH PCBs (f-pM) 5
bull Proteins and large organics (copies L) 4
bull Nucleic Acids (copies L) 6
bull Radionuclide 3
2016 Highlights
Demo test Kiel Fjord Sept 2016
12122016 Title of Presentation 13
Kiel Preliminary Results pH
Preliminary LOC data from T Yin (NOC) and TU Graz team
(Optodes)
NOC chemical sensor platform
bull Now operational for several
parameters
bull Platform technology - easy to
adapt to other absorbance-based
assays
bull Works at pressure (deepest
deployment to date 4800 m)
bull Small enough for gliderAUV
deployment
bull Low power (year long deployment
on batteries achieved)
NOC chemical sensor platform
bull Now operational for several
parameters
bull Platform technology - easy to
adapt to other absorbance-based
assays
bull Works at pressure (deepest
deployment to date 4800 m)
bull Small enough for gliderAUV
deployment
bull Low power (year long deployment
on batteries achieved)
Reagent
housing
LOC
sensor
housing
20 cm
56
cm
LOC Sensor Analytical method Measurement type LODprecision
Nitrate + nitrite Griess assay (with Cd
reduction)
Colourimetry (absorbance) 20 nM
pH Thymol blue Dual wavelength
absorbance 0001 pH units
Phosphate Molybdenum blue (modified) Colourimetry (absorbance) 30 nM
Iron (II) Iron (III) Ferrozine (with ascorbic acid
reduction for Fe (III))
Colourimetry (absorbance)
20 nM
Silicate Silicomolybdic acid Colourimetry (absorbance) 20 nM
Ammonium OPA + membrane Fluorescence 1 nM
Total alkalinity BCG with TMT or single
step
Dual wavelength
absorbance (2 microM)
DIC Membrane+ C of NaOH Conductivity (2 microM)
Organic N and P UV digester + inorganic
system Colourimetry (absorbance) (20 nM)
NERC Macronutrient Cycles Nitrate in a river
Hampshire Avon deployment site Sensor after deployment in River
Nitrate sensor in river
NERC Macronutrient Cycles Nitrate in a river
Nutrient Challenge Nitrate and phosphate in a
Maumee River Ohio
Maumee River Ohio
SenseOCEAN Dissolved iron in Kiel Fjord
7950
8000
8050
8100
8150
8200
8250
8300
623 624 625 626 627 628 629
pH
Date
Gullmar fjord Sweden June 2015
NOC pH sensor field tests
CMEP Tropical coastal waters
Deployment
location
Allison Schaap
CMEP Tropical coastal waters
0
1
2
3
4
5
6
7
8
0
05
1
15
2
2514 1
20
0
14 1
80
0
15 0
00
0
15
0
60
0
15 1
20
0
15 1
80
0
16 0
00
0
16 0
60
0
16 1
20
0
16 1
80
0
17 0
00
0
17 0
60
0
17 1
20
0
17 1
80
0
Dep
th (
m)
Nit
rate
(micro
M)
Ph
osp
hate
(micro
M)
C
hlo
rop
hyll (
microg
L)
Chlorophyll Nitrate Phosphate Depth
DELVE Nitrate in glacial meltwater
Nitrate sensor
deployed in glacial
streams draining
Greenland Ice Sheet
Sub-zero
temperatures and
highly turbid waters
DELVE Nitrate in glacial meltwater
Nitrate deployment on gliders
Celtic Sea April 2015
Alex Vincent amp Maeve Lohan NOC SOES (U Soton)
Temperature
(degC)
Chlorophyll
(mgm3)
Nitrate
(microM)
FixO3 TNA Year-long unattended in the Arctic
LOC nitrate sensors deployed
in two moorings on Fram
Straight for one year (50 ndash 80 m
deep two measurements per
day) Funded by FixO3
Biosensing
Figure and work by MN Tsaloglou
Image courtesy of our partners Aptamer
solutions
httpwwwaptamersolutionscouk
Contract Research Aptamer Antibody PAH sensor proof
of concept
Naphthalene aptamer sensor
(Kd = 13 plusmn 03 nM)
Phenanthrene aptamer sensor
(Kd = 995 plusmn 208 nM)
Fluorescence Curves for Aptamer Beacons in Seawater
Naphthalene aptamer sensor
(Kd = 13 plusmn 03 nM)
Phenanthrene aptamer sensor
(Kd = 995 plusmn 208 nM)
BBSRC sustainable aquaculture Pathogens in
Shellfisheries Water
Water-borne pathogens are (typically) difficult to measure
bull Very diverse (bacteria viruses parasites virulent and non-virulent strains)
bull Low concentration low infectious dose (eg Norovirus ge18 viral particles)
bull Lack of good bio-analytical methods (many canrsquot be cultured)
bull Diseases of unknown origin
Salmonella spp
Norovirus
Cryptosporidium
Quantitation of Microorganisms in Natural Waters
using the LabCard NASBA
New NASBA Assays for E coli DNA
Challenges
bull High genomic diversity In the environment
bull Genome size is approx 4000-5000 unique genes
bull gt2000 sequenced genomes
bull Approx 300 core genes
bull Target sequences are not always unique
Miriam Land et al (2015) Funct Integr Genomics 15 141-161
Bioinformatics methods were employed to find E coli sequences that werehellip
bull Unique to E coli
bull Ubiquitous in E coli strains
Confirmed experimentally using library of E coli (ECOR) and non-E coli bacteria from different hosts and
geographical locations
Monthly evaluation of the existing and new assays
using ldquorealrdquo water samples
11032016 1214Google Maps
Page 1 of 1ht tps wwwgooglecoukmaps50 8078436 -27419603 259769mdata=3m11e3
Google Maps
Imagery copy2016 TerraMetrics Map data copy2016 Google 20 km
Samples Collected in
Southwest England
Preliminary Results from Month One Sample Plate Assay Mean (n=3)
(CFU 100 mL)
RNA Assay after thermal
induction
(Cell Equivalents 100 mL)
DNA assay
(Genome Copy 100 mL)
Comment
Saline inshore (bathing water) 21 Not Detected Not Detected Possible to detect ge 10 cells in pure
culture Negative result due to
inhibitors
Spiked saline
(E coli type) 6533 3100 8500 RNA underestimation DNA
overestimation
Estuarine 1933 900 3200 RNA underestimation DNA
overestimation
Spiked estuarine (E coli type)
6600 400 8700 RNA underestimation DNA
overestimation
Tertiary sewage treatment works
(post UV) 121500
Not Detected Not Detected Sample inhibition
Tertiary sewage treatment works
(pre-UV)
274667 Not Detected Not Detected Sample inhibition
Secondary sewage treatment works 149000 Not Detected Not Detected Sample inhibition
Positive control
(E coli type) 274667 211500 430200 RNA underestimation DNA
overestimation
Negative control 0 Not Detected Not Detected
Other developments A New One-step NASBA
Development of new reagent
preservation methods
Optimisation of primer annealing
and thermo-tolerant enzymes
0
1000
2000
3000
4000
5000
6000
0 10 20 30
Am
ou
nt
of
Pro
du
ct
(Flu
ore
scen
ce)
Time (minutes)
ConventionalNASBA
Optimised One-Step NASBA
A New LOC for Spacial Multiplexing on Chip
Six chamber chip supporting six replicate
One-step NASBA reactions
Uses centrifugal force to achieve mixing of
sample with dehydrated reagents
Reaction chamber
Reagent reservoir
Air reservoir
BBSRC sustainable aquaculture Cytometer for HAB
detection and quantification Simultaneous measurement of electrical (impedance) and optical properties of individual cells
In-lab prototype
No air required for optics or operation (suitable for deep sea)
Challenges include sample concentration and optical detection limits (power in chip)
CT-DO Sensor Commercialisation
Data Flow
bull Easily discover sensors and their metadata
bull Sensors and sensor observations discoverable accessible and useable via the web
bull Seamlessly integrate sensors from Sense Ocean Network with sensors from other networks
The standards
Sensor passes UUID through to
base station
Platform
Satellite
Base station
Data centre
Data delivery by SOS server and linked ocean
data server
Proposed approach NERC
Linked data
(RDF SPARQL)
server
UUID SensorML
SSN (OWL)
JSON LD
netCDF EGO 11 CF16 LD
Reference for netCDF
Link Data conventions Yu J et al Towards Linked
Data Conventions for
Delivery of Environmental
Data Using netCDF pages
102-112 Springer ISBN
978-3-319-15993-5
Send data + UUID Publish
OampMRDF
ltomOM_Observation
gmlid=ExampleOutOfBandNetCDFldquo xmlnsom=httpwwwopengisnetom20 xmlnsxsi=httpwwww3org2001XMLSchema‐instanceldquo xmlnsxlink=httpwwww3org1999xlink
xmlnsgml=httpwwwopengisnetgml32 xsischemaLocation=httpwwwopengisnetom20 httpschemasopengisnetom20observationxsdgt ltgmldescriptiongtObservation instance with remote resultltgmldescriptiongt ltomtype xlinkhref=httpwwwopengisnetdefobservationTypeOGC‐OM20OM_TimeSeriesObservationgt ltomphenomenonTimegt
ltgmlTimePeriodgmlid=phenomenonTime-JULD-1gt ltgmlbeginPositiongt2015‐01‐11T17222500ltgmlbeginPositiongt ltgmlendPositiongt2015‐01‐11T18222500ltgmlendPositiongt ltgmlTimePeriodgt
ltomphenomenonTimegt ltomresultTimegt ltgmlTimeInstant gmlid=resultTime-DATE_UPDATEgt ltgmltimePositiongt2015‐01‐11T18222500ltgmltimePositiongt ltgmlTimeInstantgt ltomresultTimegt ltomprocedure xlinkhref=rdquohttplinkeddevbodcacuksysteminstanceTOOL0969_1234rdquogt ltomobservedProperty xlinkhref=rdquocompositeTOOL0969xmlrdquogt ltomfeatureOfInterest xlinkhref=httpvocabnercacukcollectionS26currentMAT00640gt ltomresultgt ltsweDataStreamgt ltsweelementType name=Componentsgt ltsweDataRecordgt ltswefield name=timegt ltsweQuantitygt ltswelabelgtTIMEltswelabelgt ltsweuom code=s gt ltsweQuantitygt ltswefieldgt ltswefield name=Temp xlinkhref=httpvocabnercacukcollectionP01currentTEMPPR01gt ltsweQuantitygt ltswelabelgtTemperature of the water bodyltswelabelgt ltsweuom code=Cel xlinkhref=rdquohttpvocabnercacukcollectionP06currentUPAArdquo gt ltsweQuantitygt ltswefieldgt ltswefield name=WC_dissO2_optode xlinkhref=httpvocabnercacukcollectionP01currentDOXYOP01gt ltsweQuantitygt ltswelabelgtConcentration of oxygen O2 per unit volume of the water body [dissolved plus reactive particulate phase] by in-situ oxygen optodeltswelabelgt ltsweuom code=umolL xlinkhref=rdquohttpvocabnercacukcollectionP06currentUPOXrdquogt ltsweQuantitygt ltswefieldgt ltswefield name=WC_dissO2_uncalib_2 xlinkhref=httpvocabnercacukcollectionP01currentDOXYUZ02gt ltsweQuantitygt ltswelabelgtConcentration (second sensor) of oxygen O2 CAS 7782-44-7 per unit volume of the water body [dissolved plus reactive particulate phase] by in-situ sensor and no calibration against sample dataltswelabelgt ltsweuom code= xlinkhref=rdquohttpvocabnercacukcollectionP06currentUPCTrdquo gt ltsweQuantitygt ltswefieldgt ltsweDataRecordgt ltsweelementTypegt ltsweencodinggt ltsweBinaryEncoding byteEncoding=raw byteOrder=bigEndiangt ltswemembergt ltsweComponent ref=applicationx-netcdf dataType=httpwwwunidataucaredusoftwarenetcdfgt ltswemembergt ltsweBinaryEncodinggt ltsweencodinggt ltswevalues xlinkhref=http1921711351578080erddaptabledapC_Users_thogar_Desktop_Gdata_5cbc_92e8_e1d6ncgt ltsweDataStreamgt ltomresultgt ltomOM_Observationgt
Publication amp Discovery
Mainly for machine to machine access
2017 Forward look
Marine Sensors Technologies and TRL
2011201620212026 Microfabricated Solid State Electrochemistry bull Salinity 5-8-9-9
bull Dissolved oxygen 4-7-9-9
Optodes optical sensors bull Gases inc methane 6-6-8-9
bull pH pCO2 4-6-8-9
bull Radionuclide 1-3-5-8
Lab on Chip Cytometer bull Whole cells (label free) 4-5-7-9
bull Labelled cells 3-5-6-8
bull Microplastics 2-4-7-9
bull Bead assays 2-3-6-8
Lab on Chip Chemistry bull Inorganic Nutrients 6-8-9-9
bull Organic Nutrients 2-5-7-9
bull Trace metals 4-7-8-9
bull pH 5-7-9-9 TA 2-4-7-9 DIC 2-4-9-9 pCO2 2-4-6-8
bull Small organics eg PAH PCBs (f-pM) 2-5-6-8
bull Proteins and large organics (copies L) 2-4-6-7
bull Nucleic Acids (copies L) 5-6-7-9
bull Radionuclide 1-3-5-7
LOC Sensor Subsystems
developed
Benchtop
system
Shipboard
measurements
In situ
deployment
Nitrate
pH
Phosphate
Iron -
Silicate 2017 2016
Ammonium Late 2017
Total alkalinity 2017 2017
DIC very close 2017 Late 2017
Organic N and P 2017 2017
OTEG LOC sensors development status
LOC Sensor River
estuary
Coastal At depth Glacial
melt
Year- long
(unattended)
Glider or AUV Argo
float
Nitrate 2017
pH 2017
Phosphate 2017 2018 2017 2017
Iron 2017
Silicate 2016 2017 2017 2018 2017
OTEG LOC sensors ndash in situ deployments projected
2017 Forward look highlights
SenseOCEAN final year deployments demonstrations
bull Demonstration on Apex (PROVOR) (Nitrate Phosphate pH)
Platforms targeted for demonstration
AUV
(AWI)
Bouys
(lLEGOS-
CNRS)
Floats
(LEGOS-CNRS)
Shallow cabled and
deep sea observatory
(AWI)
2017 Forward look highlights
SenseOCEAN final year deployments demonstrations
bull Demonstration on Apex (PROVOR) (Nitrate Phosphate pH)
Integration into SLOCUM glider
2017 Forward look highlights
SenseOCEAN final year deployments demonstrations
bull Demonstration on Apex (PROVOR) (Nitrate Phosphate pH)
Integration into SLOCUM glider
Integration into ALR and trials for ETI
ETI CCSMV - Project
The Concept The Taxi
The sensors
CCS Sensors package commercial
SeapHOx SBE52 CTD SEAFET SBE43F DO
CCS Sensors package NOC
lab on a chip
TRL 7 pH Phosphate Nitrate
TRL 4-7 TA DIC
2017 Forward look highlights
SenseOCEAN final year deployments demonstrations
bull Demonstration on Apex (PROVOR) (Nitrate Phosphate pH)
Integration into SLOCUM glider
Integration into ALR and trials for ETI
Pathogen detection in the field
CTDO product launch
LOC license agreement commercialisation
Acknowledgements Work by current and past members of OTEG
Group head Matt Mowlem
Subgroup heads
Robin Pascal (Multidisciplinary)
Socratis Loucaides (Analytical science)
Chris Cardwell (Electronics amp Software)
Kevin Saw (Mechanical)
Photos from Dave Owsianka
Alex Beaton Martin Arundell
and others
Collaborators at
University of Southampton
NOC
Plymouth Marine Laboratory
Scottish Marine Institute
GEOMAR and others

NOC chemical sensor platform
bull Now operational for several
parameters
bull Platform technology - easy to
adapt to other absorbance-based
assays
bull Works at pressure (deepest
deployment to date 4800 m)
bull Small enough for gliderAUV
deployment
bull Low power (year long deployment
on batteries achieved)
Reagent
housing
LOC
sensor
housing
20 cm
56
cm
LOC Sensor Analytical method Measurement type LODprecision
Nitrate + nitrite Griess assay (with Cd
reduction)
Colourimetry (absorbance) 20 nM
pH Thymol blue Dual wavelength
absorbance 0001 pH units
Phosphate Molybdenum blue (modified) Colourimetry (absorbance) 30 nM
Iron (II) Iron (III) Ferrozine (with ascorbic acid
reduction for Fe (III))
Colourimetry (absorbance)
20 nM
Silicate Silicomolybdic acid Colourimetry (absorbance) 20 nM
Ammonium OPA + membrane Fluorescence 1 nM
Total alkalinity BCG with TMT or single
step
Dual wavelength
absorbance (2 microM)
DIC Membrane+ C of NaOH Conductivity (2 microM)
Organic N and P UV digester + inorganic
system Colourimetry (absorbance) (20 nM)
NERC Macronutrient Cycles Nitrate in a river
Hampshire Avon deployment site Sensor after deployment in River
Nitrate sensor in river
NERC Macronutrient Cycles Nitrate in a river
Nutrient Challenge Nitrate and phosphate in a
Maumee River Ohio
Maumee River Ohio
SenseOCEAN Dissolved iron in Kiel Fjord
7950
8000
8050
8100
8150
8200
8250
8300
623 624 625 626 627 628 629
pH
Date
Gullmar fjord Sweden June 2015
NOC pH sensor field tests
CMEP Tropical coastal waters
Deployment
location
Allison Schaap
CMEP Tropical coastal waters
0
1
2
3
4
5
6
7
8
0
05
1
15
2
2514 1
20
0
14 1
80
0
15 0
00
0
15
0
60
0
15 1
20
0
15 1
80
0
16 0
00
0
16 0
60
0
16 1
20
0
16 1
80
0
17 0
00
0
17 0
60
0
17 1
20
0
17 1
80
0
Dep
th (
m)
Nit
rate
(micro
M)
Ph
osp
hate
(micro
M)
C
hlo
rop
hyll (
microg
L)
Chlorophyll Nitrate Phosphate Depth
DELVE Nitrate in glacial meltwater
Nitrate sensor
deployed in glacial
streams draining
Greenland Ice Sheet
Sub-zero
temperatures and
highly turbid waters
DELVE Nitrate in glacial meltwater
Nitrate deployment on gliders
Celtic Sea April 2015
Alex Vincent amp Maeve Lohan NOC SOES (U Soton)
Temperature
(degC)
Chlorophyll
(mgm3)
Nitrate
(microM)
FixO3 TNA Year-long unattended in the Arctic
LOC nitrate sensors deployed
in two moorings on Fram
Straight for one year (50 ndash 80 m
deep two measurements per
day) Funded by FixO3
Biosensing
Figure and work by MN Tsaloglou
Image courtesy of our partners Aptamer
solutions
httpwwwaptamersolutionscouk
Contract Research Aptamer Antibody PAH sensor proof
of concept
Naphthalene aptamer sensor
(Kd = 13 plusmn 03 nM)
Phenanthrene aptamer sensor
(Kd = 995 plusmn 208 nM)
Fluorescence Curves for Aptamer Beacons in Seawater
Naphthalene aptamer sensor
(Kd = 13 plusmn 03 nM)
Phenanthrene aptamer sensor
(Kd = 995 plusmn 208 nM)
BBSRC sustainable aquaculture Pathogens in
Shellfisheries Water
Water-borne pathogens are (typically) difficult to measure
bull Very diverse (bacteria viruses parasites virulent and non-virulent strains)
bull Low concentration low infectious dose (eg Norovirus ge18 viral particles)
bull Lack of good bio-analytical methods (many canrsquot be cultured)
bull Diseases of unknown origin
Salmonella spp
Norovirus
Cryptosporidium
Quantitation of Microorganisms in Natural Waters
using the LabCard NASBA
New NASBA Assays for E coli DNA
Challenges
bull High genomic diversity In the environment
bull Genome size is approx 4000-5000 unique genes
bull gt2000 sequenced genomes
bull Approx 300 core genes
bull Target sequences are not always unique
Miriam Land et al (2015) Funct Integr Genomics 15 141-161
Bioinformatics methods were employed to find E coli sequences that werehellip
bull Unique to E coli
bull Ubiquitous in E coli strains
Confirmed experimentally using library of E coli (ECOR) and non-E coli bacteria from different hosts and
geographical locations
Monthly evaluation of the existing and new assays
using ldquorealrdquo water samples
11032016 1214Google Maps
Page 1 of 1ht tps wwwgooglecoukmaps50 8078436 -27419603 259769mdata=3m11e3
Google Maps
Imagery copy2016 TerraMetrics Map data copy2016 Google 20 km
Samples Collected in
Southwest England
Preliminary Results from Month One Sample Plate Assay Mean (n=3)
(CFU 100 mL)
RNA Assay after thermal
induction
(Cell Equivalents 100 mL)
DNA assay
(Genome Copy 100 mL)
Comment
Saline inshore (bathing water) 21 Not Detected Not Detected Possible to detect ge 10 cells in pure
culture Negative result due to
inhibitors
Spiked saline
(E coli type) 6533 3100 8500 RNA underestimation DNA
overestimation
Estuarine 1933 900 3200 RNA underestimation DNA
overestimation
Spiked estuarine (E coli type)
6600 400 8700 RNA underestimation DNA
overestimation
Tertiary sewage treatment works
(post UV) 121500
Not Detected Not Detected Sample inhibition
Tertiary sewage treatment works
(pre-UV)
274667 Not Detected Not Detected Sample inhibition
Secondary sewage treatment works 149000 Not Detected Not Detected Sample inhibition
Positive control
(E coli type) 274667 211500 430200 RNA underestimation DNA
overestimation
Negative control 0 Not Detected Not Detected
Other developments A New One-step NASBA
Development of new reagent
preservation methods
Optimisation of primer annealing
and thermo-tolerant enzymes
0
1000
2000
3000
4000
5000
6000
0 10 20 30
Am
ou
nt
of
Pro
du
ct
(Flu
ore
scen
ce)
Time (minutes)
ConventionalNASBA
Optimised One-Step NASBA
A New LOC for Spacial Multiplexing on Chip
Six chamber chip supporting six replicate
One-step NASBA reactions
Uses centrifugal force to achieve mixing of
sample with dehydrated reagents
Reaction chamber
Reagent reservoir
Air reservoir
BBSRC sustainable aquaculture Cytometer for HAB
detection and quantification Simultaneous measurement of electrical (impedance) and optical properties of individual cells
In-lab prototype
No air required for optics or operation (suitable for deep sea)
Challenges include sample concentration and optical detection limits (power in chip)
CT-DO Sensor Commercialisation
Data Flow
bull Easily discover sensors and their metadata
bull Sensors and sensor observations discoverable accessible and useable via the web
bull Seamlessly integrate sensors from Sense Ocean Network with sensors from other networks
The standards
Sensor passes UUID through to
base station
Platform
Satellite
Base station
Data centre
Data delivery by SOS server and linked ocean
data server
Proposed approach NERC
Linked data
(RDF SPARQL)
server
UUID SensorML
SSN (OWL)
JSON LD
netCDF EGO 11 CF16 LD
Reference for netCDF
Link Data conventions Yu J et al Towards Linked
Data Conventions for
Delivery of Environmental
Data Using netCDF pages
102-112 Springer ISBN
978-3-319-15993-5
Send data + UUID Publish
OampMRDF
ltomOM_Observation
gmlid=ExampleOutOfBandNetCDFldquo xmlnsom=httpwwwopengisnetom20 xmlnsxsi=httpwwww3org2001XMLSchema‐instanceldquo xmlnsxlink=httpwwww3org1999xlink
xmlnsgml=httpwwwopengisnetgml32 xsischemaLocation=httpwwwopengisnetom20 httpschemasopengisnetom20observationxsdgt ltgmldescriptiongtObservation instance with remote resultltgmldescriptiongt ltomtype xlinkhref=httpwwwopengisnetdefobservationTypeOGC‐OM20OM_TimeSeriesObservationgt ltomphenomenonTimegt
ltgmlTimePeriodgmlid=phenomenonTime-JULD-1gt ltgmlbeginPositiongt2015‐01‐11T17222500ltgmlbeginPositiongt ltgmlendPositiongt2015‐01‐11T18222500ltgmlendPositiongt ltgmlTimePeriodgt
ltomphenomenonTimegt ltomresultTimegt ltgmlTimeInstant gmlid=resultTime-DATE_UPDATEgt ltgmltimePositiongt2015‐01‐11T18222500ltgmltimePositiongt ltgmlTimeInstantgt ltomresultTimegt ltomprocedure xlinkhref=rdquohttplinkeddevbodcacuksysteminstanceTOOL0969_1234rdquogt ltomobservedProperty xlinkhref=rdquocompositeTOOL0969xmlrdquogt ltomfeatureOfInterest xlinkhref=httpvocabnercacukcollectionS26currentMAT00640gt ltomresultgt ltsweDataStreamgt ltsweelementType name=Componentsgt ltsweDataRecordgt ltswefield name=timegt ltsweQuantitygt ltswelabelgtTIMEltswelabelgt ltsweuom code=s gt ltsweQuantitygt ltswefieldgt ltswefield name=Temp xlinkhref=httpvocabnercacukcollectionP01currentTEMPPR01gt ltsweQuantitygt ltswelabelgtTemperature of the water bodyltswelabelgt ltsweuom code=Cel xlinkhref=rdquohttpvocabnercacukcollectionP06currentUPAArdquo gt ltsweQuantitygt ltswefieldgt ltswefield name=WC_dissO2_optode xlinkhref=httpvocabnercacukcollectionP01currentDOXYOP01gt ltsweQuantitygt ltswelabelgtConcentration of oxygen O2 per unit volume of the water body [dissolved plus reactive particulate phase] by in-situ oxygen optodeltswelabelgt ltsweuom code=umolL xlinkhref=rdquohttpvocabnercacukcollectionP06currentUPOXrdquogt ltsweQuantitygt ltswefieldgt ltswefield name=WC_dissO2_uncalib_2 xlinkhref=httpvocabnercacukcollectionP01currentDOXYUZ02gt ltsweQuantitygt ltswelabelgtConcentration (second sensor) of oxygen O2 CAS 7782-44-7 per unit volume of the water body [dissolved plus reactive particulate phase] by in-situ sensor and no calibration against sample dataltswelabelgt ltsweuom code= xlinkhref=rdquohttpvocabnercacukcollectionP06currentUPCTrdquo gt ltsweQuantitygt ltswefieldgt ltsweDataRecordgt ltsweelementTypegt ltsweencodinggt ltsweBinaryEncoding byteEncoding=raw byteOrder=bigEndiangt ltswemembergt ltsweComponent ref=applicationx-netcdf dataType=httpwwwunidataucaredusoftwarenetcdfgt ltswemembergt ltsweBinaryEncodinggt ltsweencodinggt ltswevalues xlinkhref=http1921711351578080erddaptabledapC_Users_thogar_Desktop_Gdata_5cbc_92e8_e1d6ncgt ltsweDataStreamgt ltomresultgt ltomOM_Observationgt
Publication amp Discovery
Mainly for machine to machine access
2017 Forward look
Marine Sensors Technologies and TRL
2011201620212026 Microfabricated Solid State Electrochemistry bull Salinity 5-8-9-9
bull Dissolved oxygen 4-7-9-9
Optodes optical sensors bull Gases inc methane 6-6-8-9
bull pH pCO2 4-6-8-9
bull Radionuclide 1-3-5-8
Lab on Chip Cytometer bull Whole cells (label free) 4-5-7-9
bull Labelled cells 3-5-6-8
bull Microplastics 2-4-7-9
bull Bead assays 2-3-6-8
Lab on Chip Chemistry bull Inorganic Nutrients 6-8-9-9
bull Organic Nutrients 2-5-7-9
bull Trace metals 4-7-8-9
bull pH 5-7-9-9 TA 2-4-7-9 DIC 2-4-9-9 pCO2 2-4-6-8
bull Small organics eg PAH PCBs (f-pM) 2-5-6-8
bull Proteins and large organics (copies L) 2-4-6-7
bull Nucleic Acids (copies L) 5-6-7-9
bull Radionuclide 1-3-5-7
LOC Sensor Subsystems
developed
Benchtop
system
Shipboard
measurements
In situ
deployment
Nitrate
pH
Phosphate
Iron -
Silicate 2017 2016
Ammonium Late 2017
Total alkalinity 2017 2017
DIC very close 2017 Late 2017
Organic N and P 2017 2017
OTEG LOC sensors development status
LOC Sensor River
estuary
Coastal At depth Glacial
melt
Year- long
(unattended)
Glider or AUV Argo
float
Nitrate 2017
pH 2017
Phosphate 2017 2018 2017 2017
Iron 2017
Silicate 2016 2017 2017 2018 2017
OTEG LOC sensors ndash in situ deployments projected
2017 Forward look highlights
SenseOCEAN final year deployments demonstrations
bull Demonstration on Apex (PROVOR) (Nitrate Phosphate pH)
Platforms targeted for demonstration
AUV
(AWI)
Bouys
(lLEGOS-
CNRS)
Floats
(LEGOS-CNRS)
Shallow cabled and
deep sea observatory
(AWI)
2017 Forward look highlights
SenseOCEAN final year deployments demonstrations
bull Demonstration on Apex (PROVOR) (Nitrate Phosphate pH)
Integration into SLOCUM glider
2017 Forward look highlights
SenseOCEAN final year deployments demonstrations
bull Demonstration on Apex (PROVOR) (Nitrate Phosphate pH)
Integration into SLOCUM glider
Integration into ALR and trials for ETI
ETI CCSMV - Project
The Concept The Taxi
The sensors
CCS Sensors package commercial
SeapHOx SBE52 CTD SEAFET SBE43F DO
CCS Sensors package NOC
lab on a chip
TRL 7 pH Phosphate Nitrate
TRL 4-7 TA DIC
2017 Forward look highlights
SenseOCEAN final year deployments demonstrations
bull Demonstration on Apex (PROVOR) (Nitrate Phosphate pH)
Integration into SLOCUM glider
Integration into ALR and trials for ETI
Pathogen detection in the field
CTDO product launch
LOC license agreement commercialisation
Acknowledgements Work by current and past members of OTEG
Group head Matt Mowlem
Subgroup heads
Robin Pascal (Multidisciplinary)
Socratis Loucaides (Analytical science)
Chris Cardwell (Electronics amp Software)
Kevin Saw (Mechanical)
Photos from Dave Owsianka
Alex Beaton Martin Arundell
and others
Collaborators at
University of Southampton
NOC
Plymouth Marine Laboratory
Scottish Marine Institute
GEOMAR and others

NOC chemical sensor platform
bull Now operational for several
parameters
bull Platform technology - easy to
adapt to other absorbance-based
assays
bull Works at pressure (deepest
deployment to date 4800 m)
bull Small enough for gliderAUV
deployment
bull Low power (year long deployment
on batteries achieved)
Reagent
housing
LOC
sensor
housing
20 cm
56
cm
LOC Sensor Analytical method Measurement type LODprecision
Nitrate + nitrite Griess assay (with Cd
reduction)
Colourimetry (absorbance) 20 nM
pH Thymol blue Dual wavelength
absorbance 0001 pH units
Phosphate Molybdenum blue (modified) Colourimetry (absorbance) 30 nM
Iron (II) Iron (III) Ferrozine (with ascorbic acid
reduction for Fe (III))
Colourimetry (absorbance)
20 nM
Silicate Silicomolybdic acid Colourimetry (absorbance) 20 nM
Ammonium OPA + membrane Fluorescence 1 nM
Total alkalinity BCG with TMT or single
step
Dual wavelength
absorbance (2 microM)
DIC Membrane+ C of NaOH Conductivity (2 microM)
Organic N and P UV digester + inorganic
system Colourimetry (absorbance) (20 nM)
NERC Macronutrient Cycles Nitrate in a river
Hampshire Avon deployment site Sensor after deployment in River
Nitrate sensor in river
NERC Macronutrient Cycles Nitrate in a river
Nutrient Challenge Nitrate and phosphate in a
Maumee River Ohio
Maumee River Ohio
SenseOCEAN Dissolved iron in Kiel Fjord
7950
8000
8050
8100
8150
8200
8250
8300
623 624 625 626 627 628 629
pH
Date
Gullmar fjord Sweden June 2015
NOC pH sensor field tests
CMEP Tropical coastal waters
Deployment
location
Allison Schaap
CMEP Tropical coastal waters
0
1
2
3
4
5
6
7
8
0
05
1
15
2
2514 1
20
0
14 1
80
0
15 0
00
0
15
0
60
0
15 1
20
0
15 1
80
0
16 0
00
0
16 0
60
0
16 1
20
0
16 1
80
0
17 0
00
0
17 0
60
0
17 1
20
0
17 1
80
0
Dep
th (
m)
Nit
rate
(micro
M)
Ph
osp
hate
(micro
M)
C
hlo
rop
hyll (
microg
L)
Chlorophyll Nitrate Phosphate Depth
DELVE Nitrate in glacial meltwater
Nitrate sensor
deployed in glacial
streams draining
Greenland Ice Sheet
Sub-zero
temperatures and
highly turbid waters
DELVE Nitrate in glacial meltwater
Nitrate deployment on gliders
Celtic Sea April 2015
Alex Vincent amp Maeve Lohan NOC SOES (U Soton)
Temperature
(degC)
Chlorophyll
(mgm3)
Nitrate
(microM)
FixO3 TNA Year-long unattended in the Arctic
LOC nitrate sensors deployed
in two moorings on Fram
Straight for one year (50 ndash 80 m
deep two measurements per
day) Funded by FixO3
Biosensing
Figure and work by MN Tsaloglou
Image courtesy of our partners Aptamer
solutions
httpwwwaptamersolutionscouk
Contract Research Aptamer Antibody PAH sensor proof
of concept
Naphthalene aptamer sensor
(Kd = 13 plusmn 03 nM)
Phenanthrene aptamer sensor
(Kd = 995 plusmn 208 nM)
Fluorescence Curves for Aptamer Beacons in Seawater
Naphthalene aptamer sensor
(Kd = 13 plusmn 03 nM)
Phenanthrene aptamer sensor
(Kd = 995 plusmn 208 nM)
BBSRC sustainable aquaculture Pathogens in
Shellfisheries Water
Water-borne pathogens are (typically) difficult to measure
bull Very diverse (bacteria viruses parasites virulent and non-virulent strains)
bull Low concentration low infectious dose (eg Norovirus ge18 viral particles)
bull Lack of good bio-analytical methods (many canrsquot be cultured)
bull Diseases of unknown origin
Salmonella spp
Norovirus
Cryptosporidium
Quantitation of Microorganisms in Natural Waters
using the LabCard NASBA
New NASBA Assays for E coli DNA
Challenges
bull High genomic diversity In the environment
bull Genome size is approx 4000-5000 unique genes
bull gt2000 sequenced genomes
bull Approx 300 core genes
bull Target sequences are not always unique
Miriam Land et al (2015) Funct Integr Genomics 15 141-161
Bioinformatics methods were employed to find E coli sequences that werehellip
bull Unique to E coli
bull Ubiquitous in E coli strains
Confirmed experimentally using library of E coli (ECOR) and non-E coli bacteria from different hosts and
geographical locations
Monthly evaluation of the existing and new assays
using ldquorealrdquo water samples
11032016 1214Google Maps
Page 1 of 1ht tps wwwgooglecoukmaps50 8078436 -27419603 259769mdata=3m11e3
Google Maps
Imagery copy2016 TerraMetrics Map data copy2016 Google 20 km
Samples Collected in
Southwest England
Preliminary Results from Month One Sample Plate Assay Mean (n=3)
(CFU 100 mL)
RNA Assay after thermal
induction
(Cell Equivalents 100 mL)
DNA assay
(Genome Copy 100 mL)
Comment
Saline inshore (bathing water) 21 Not Detected Not Detected Possible to detect ge 10 cells in pure
culture Negative result due to
inhibitors
Spiked saline
(E coli type) 6533 3100 8500 RNA underestimation DNA
overestimation
Estuarine 1933 900 3200 RNA underestimation DNA
overestimation
Spiked estuarine (E coli type)
6600 400 8700 RNA underestimation DNA
overestimation
Tertiary sewage treatment works
(post UV) 121500
Not Detected Not Detected Sample inhibition
Tertiary sewage treatment works
(pre-UV)
274667 Not Detected Not Detected Sample inhibition
Secondary sewage treatment works 149000 Not Detected Not Detected Sample inhibition
Positive control
(E coli type) 274667 211500 430200 RNA underestimation DNA
overestimation
Negative control 0 Not Detected Not Detected
Other developments A New One-step NASBA
Development of new reagent
preservation methods
Optimisation of primer annealing
and thermo-tolerant enzymes
0
1000
2000
3000
4000
5000
6000
0 10 20 30
Am
ou
nt
of
Pro
du
ct
(Flu
ore
scen
ce)
Time (minutes)
ConventionalNASBA
Optimised One-Step NASBA
A New LOC for Spacial Multiplexing on Chip
Six chamber chip supporting six replicate
One-step NASBA reactions
Uses centrifugal force to achieve mixing of
sample with dehydrated reagents
Reaction chamber
Reagent reservoir
Air reservoir
BBSRC sustainable aquaculture Cytometer for HAB
detection and quantification Simultaneous measurement of electrical (impedance) and optical properties of individual cells
In-lab prototype
No air required for optics or operation (suitable for deep sea)
Challenges include sample concentration and optical detection limits (power in chip)
CT-DO Sensor Commercialisation
Data Flow
bull Easily discover sensors and their metadata
bull Sensors and sensor observations discoverable accessible and useable via the web
bull Seamlessly integrate sensors from Sense Ocean Network with sensors from other networks
The standards
Sensor passes UUID through to
base station
Platform
Satellite
Base station
Data centre
Data delivery by SOS server and linked ocean
data server
Proposed approach NERC
Linked data
(RDF SPARQL)
server
UUID SensorML
SSN (OWL)
JSON LD
netCDF EGO 11 CF16 LD
Reference for netCDF
Link Data conventions Yu J et al Towards Linked
Data Conventions for
Delivery of Environmental
Data Using netCDF pages
102-112 Springer ISBN
978-3-319-15993-5
Send data + UUID Publish
OampMRDF
ltomOM_Observation
gmlid=ExampleOutOfBandNetCDFldquo xmlnsom=httpwwwopengisnetom20 xmlnsxsi=httpwwww3org2001XMLSchema‐instanceldquo xmlnsxlink=httpwwww3org1999xlink
xmlnsgml=httpwwwopengisnetgml32 xsischemaLocation=httpwwwopengisnetom20 httpschemasopengisnetom20observationxsdgt ltgmldescriptiongtObservation instance with remote resultltgmldescriptiongt ltomtype xlinkhref=httpwwwopengisnetdefobservationTypeOGC‐OM20OM_TimeSeriesObservationgt ltomphenomenonTimegt
ltgmlTimePeriodgmlid=phenomenonTime-JULD-1gt ltgmlbeginPositiongt2015‐01‐11T17222500ltgmlbeginPositiongt ltgmlendPositiongt2015‐01‐11T18222500ltgmlendPositiongt ltgmlTimePeriodgt
ltomphenomenonTimegt ltomresultTimegt ltgmlTimeInstant gmlid=resultTime-DATE_UPDATEgt ltgmltimePositiongt2015‐01‐11T18222500ltgmltimePositiongt ltgmlTimeInstantgt ltomresultTimegt ltomprocedure xlinkhref=rdquohttplinkeddevbodcacuksysteminstanceTOOL0969_1234rdquogt ltomobservedProperty xlinkhref=rdquocompositeTOOL0969xmlrdquogt ltomfeatureOfInterest xlinkhref=httpvocabnercacukcollectionS26currentMAT00640gt ltomresultgt ltsweDataStreamgt ltsweelementType name=Componentsgt ltsweDataRecordgt ltswefield name=timegt ltsweQuantitygt ltswelabelgtTIMEltswelabelgt ltsweuom code=s gt ltsweQuantitygt ltswefieldgt ltswefield name=Temp xlinkhref=httpvocabnercacukcollectionP01currentTEMPPR01gt ltsweQuantitygt ltswelabelgtTemperature of the water bodyltswelabelgt ltsweuom code=Cel xlinkhref=rdquohttpvocabnercacukcollectionP06currentUPAArdquo gt ltsweQuantitygt ltswefieldgt ltswefield name=WC_dissO2_optode xlinkhref=httpvocabnercacukcollectionP01currentDOXYOP01gt ltsweQuantitygt ltswelabelgtConcentration of oxygen O2 per unit volume of the water body [dissolved plus reactive particulate phase] by in-situ oxygen optodeltswelabelgt ltsweuom code=umolL xlinkhref=rdquohttpvocabnercacukcollectionP06currentUPOXrdquogt ltsweQuantitygt ltswefieldgt ltswefield name=WC_dissO2_uncalib_2 xlinkhref=httpvocabnercacukcollectionP01currentDOXYUZ02gt ltsweQuantitygt ltswelabelgtConcentration (second sensor) of oxygen O2 CAS 7782-44-7 per unit volume of the water body [dissolved plus reactive particulate phase] by in-situ sensor and no calibration against sample dataltswelabelgt ltsweuom code= xlinkhref=rdquohttpvocabnercacukcollectionP06currentUPCTrdquo gt ltsweQuantitygt ltswefieldgt ltsweDataRecordgt ltsweelementTypegt ltsweencodinggt ltsweBinaryEncoding byteEncoding=raw byteOrder=bigEndiangt ltswemembergt ltsweComponent ref=applicationx-netcdf dataType=httpwwwunidataucaredusoftwarenetcdfgt ltswemembergt ltsweBinaryEncodinggt ltsweencodinggt ltswevalues xlinkhref=http1921711351578080erddaptabledapC_Users_thogar_Desktop_Gdata_5cbc_92e8_e1d6ncgt ltsweDataStreamgt ltomresultgt ltomOM_Observationgt
Publication amp Discovery
Mainly for machine to machine access
2017 Forward look
Marine Sensors Technologies and TRL
2011201620212026 Microfabricated Solid State Electrochemistry bull Salinity 5-8-9-9
bull Dissolved oxygen 4-7-9-9
Optodes optical sensors bull Gases inc methane 6-6-8-9
bull pH pCO2 4-6-8-9
bull Radionuclide 1-3-5-8
Lab on Chip Cytometer bull Whole cells (label free) 4-5-7-9
bull Labelled cells 3-5-6-8
bull Microplastics 2-4-7-9
bull Bead assays 2-3-6-8
Lab on Chip Chemistry bull Inorganic Nutrients 6-8-9-9
bull Organic Nutrients 2-5-7-9
bull Trace metals 4-7-8-9
bull pH 5-7-9-9 TA 2-4-7-9 DIC 2-4-9-9 pCO2 2-4-6-8
bull Small organics eg PAH PCBs (f-pM) 2-5-6-8
bull Proteins and large organics (copies L) 2-4-6-7
bull Nucleic Acids (copies L) 5-6-7-9
bull Radionuclide 1-3-5-7
LOC Sensor Subsystems
developed
Benchtop
system
Shipboard
measurements
In situ
deployment
Nitrate
pH
Phosphate
Iron -
Silicate 2017 2016
Ammonium Late 2017
Total alkalinity 2017 2017
DIC very close 2017 Late 2017
Organic N and P 2017 2017
OTEG LOC sensors development status
LOC Sensor River
estuary
Coastal At depth Glacial
melt
Year- long
(unattended)
Glider or AUV Argo
float
Nitrate 2017
pH 2017
Phosphate 2017 2018 2017 2017
Iron 2017
Silicate 2016 2017 2017 2018 2017
OTEG LOC sensors ndash in situ deployments projected
2017 Forward look highlights
SenseOCEAN final year deployments demonstrations
bull Demonstration on Apex (PROVOR) (Nitrate Phosphate pH)
Platforms targeted for demonstration
AUV
(AWI)
Bouys
(lLEGOS-
CNRS)
Floats
(LEGOS-CNRS)
Shallow cabled and
deep sea observatory
(AWI)
2017 Forward look highlights
SenseOCEAN final year deployments demonstrations
bull Demonstration on Apex (PROVOR) (Nitrate Phosphate pH)
Integration into SLOCUM glider
2017 Forward look highlights
SenseOCEAN final year deployments demonstrations
bull Demonstration on Apex (PROVOR) (Nitrate Phosphate pH)
Integration into SLOCUM glider
Integration into ALR and trials for ETI
ETI CCSMV - Project
The Concept The Taxi
The sensors
CCS Sensors package commercial
SeapHOx SBE52 CTD SEAFET SBE43F DO
CCS Sensors package NOC
lab on a chip
TRL 7 pH Phosphate Nitrate
TRL 4-7 TA DIC
2017 Forward look highlights
SenseOCEAN final year deployments demonstrations
bull Demonstration on Apex (PROVOR) (Nitrate Phosphate pH)
Integration into SLOCUM glider
Integration into ALR and trials for ETI
Pathogen detection in the field
CTDO product launch
LOC license agreement commercialisation
Acknowledgements Work by current and past members of OTEG
Group head Matt Mowlem
Subgroup heads
Robin Pascal (Multidisciplinary)
Socratis Loucaides (Analytical science)
Chris Cardwell (Electronics amp Software)
Kevin Saw (Mechanical)
Photos from Dave Owsianka
Alex Beaton Martin Arundell
and others
Collaborators at
University of Southampton
NOC
Plymouth Marine Laboratory
Scottish Marine Institute
GEOMAR and others
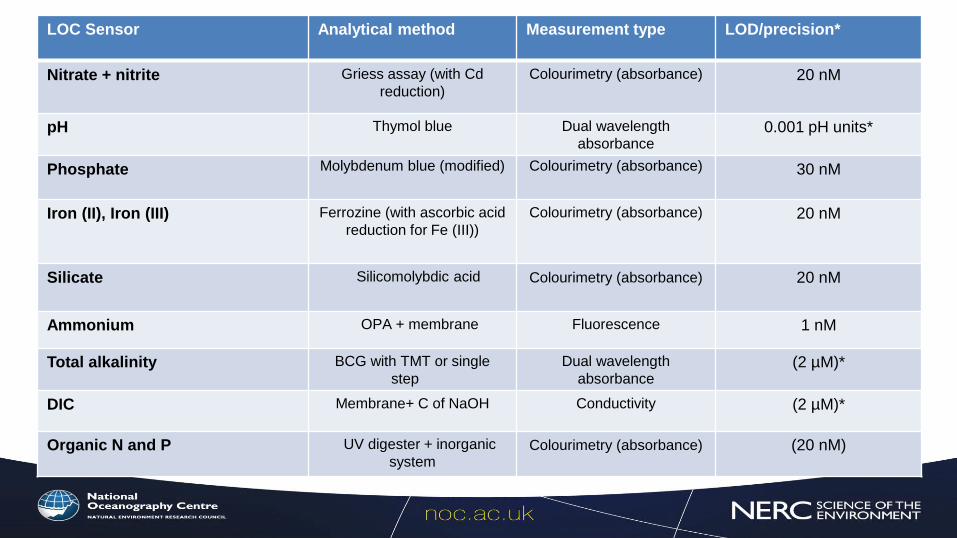

NERC Macronutrient Cycles Nitrate in a river
Nutrient Challenge Nitrate and phosphate in a
Maumee River Ohio
Maumee River Ohio
SenseOCEAN Dissolved iron in Kiel Fjord
7950
8000
8050
8100
8150
8200
8250
8300
623 624 625 626 627 628 629
pH
Date
Gullmar fjord Sweden June 2015
NOC pH sensor field tests
CMEP Tropical coastal waters
Deployment
location
Allison Schaap
CMEP Tropical coastal waters
0
1
2
3
4
5
6
7
8
0
05
1
15
2
2514 1
20
0
14 1
80
0
15 0
00
0
15
0
60
0
15 1
20
0
15 1
80
0
16 0
00
0
16 0
60
0
16 1
20
0
16 1
80
0
17 0
00
0
17 0
60
0
17 1
20
0
17 1
80
0
Dep
th (
m)
Nit
rate
(micro
M)
Ph
osp
hate
(micro
M)
C
hlo
rop
hyll (
microg
L)
Chlorophyll Nitrate Phosphate Depth
DELVE Nitrate in glacial meltwater
Nitrate sensor
deployed in glacial
streams draining
Greenland Ice Sheet
Sub-zero
temperatures and
highly turbid waters
DELVE Nitrate in glacial meltwater
Nitrate deployment on gliders
Celtic Sea April 2015
Alex Vincent amp Maeve Lohan NOC SOES (U Soton)
Temperature
(degC)
Chlorophyll
(mgm3)
Nitrate
(microM)
FixO3 TNA Year-long unattended in the Arctic
LOC nitrate sensors deployed
in two moorings on Fram
Straight for one year (50 ndash 80 m
deep two measurements per
day) Funded by FixO3
Biosensing
Figure and work by MN Tsaloglou
Image courtesy of our partners Aptamer
solutions
httpwwwaptamersolutionscouk
Contract Research Aptamer Antibody PAH sensor proof
of concept
Naphthalene aptamer sensor
(Kd = 13 plusmn 03 nM)
Phenanthrene aptamer sensor
(Kd = 995 plusmn 208 nM)
Fluorescence Curves for Aptamer Beacons in Seawater
Naphthalene aptamer sensor
(Kd = 13 plusmn 03 nM)
Phenanthrene aptamer sensor
(Kd = 995 plusmn 208 nM)
BBSRC sustainable aquaculture Pathogens in
Shellfisheries Water
Water-borne pathogens are (typically) difficult to measure
bull Very diverse (bacteria viruses parasites virulent and non-virulent strains)
bull Low concentration low infectious dose (eg Norovirus ge18 viral particles)
bull Lack of good bio-analytical methods (many canrsquot be cultured)
bull Diseases of unknown origin
Salmonella spp
Norovirus
Cryptosporidium
Quantitation of Microorganisms in Natural Waters
using the LabCard NASBA
New NASBA Assays for E coli DNA
Challenges
bull High genomic diversity In the environment
bull Genome size is approx 4000-5000 unique genes
bull gt2000 sequenced genomes
bull Approx 300 core genes
bull Target sequences are not always unique
Miriam Land et al (2015) Funct Integr Genomics 15 141-161
Bioinformatics methods were employed to find E coli sequences that werehellip
bull Unique to E coli
bull Ubiquitous in E coli strains
Confirmed experimentally using library of E coli (ECOR) and non-E coli bacteria from different hosts and
geographical locations
Monthly evaluation of the existing and new assays
using ldquorealrdquo water samples
11032016 1214Google Maps
Page 1 of 1ht tps wwwgooglecoukmaps50 8078436 -27419603 259769mdata=3m11e3
Google Maps
Imagery copy2016 TerraMetrics Map data copy2016 Google 20 km
Samples Collected in
Southwest England
Preliminary Results from Month One Sample Plate Assay Mean (n=3)
(CFU 100 mL)
RNA Assay after thermal
induction
(Cell Equivalents 100 mL)
DNA assay
(Genome Copy 100 mL)
Comment
Saline inshore (bathing water) 21 Not Detected Not Detected Possible to detect ge 10 cells in pure
culture Negative result due to
inhibitors
Spiked saline
(E coli type) 6533 3100 8500 RNA underestimation DNA
overestimation
Estuarine 1933 900 3200 RNA underestimation DNA
overestimation
Spiked estuarine (E coli type)
6600 400 8700 RNA underestimation DNA
overestimation
Tertiary sewage treatment works
(post UV) 121500
Not Detected Not Detected Sample inhibition
Tertiary sewage treatment works
(pre-UV)
274667 Not Detected Not Detected Sample inhibition
Secondary sewage treatment works 149000 Not Detected Not Detected Sample inhibition
Positive control
(E coli type) 274667 211500 430200 RNA underestimation DNA
overestimation
Negative control 0 Not Detected Not Detected
Other developments A New One-step NASBA
Development of new reagent
preservation methods
Optimisation of primer annealing
and thermo-tolerant enzymes
0
1000
2000
3000
4000
5000
6000
0 10 20 30
Am
ou
nt
of
Pro
du
ct
(Flu
ore
scen
ce)
Time (minutes)
ConventionalNASBA
Optimised One-Step NASBA
A New LOC for Spacial Multiplexing on Chip
Six chamber chip supporting six replicate
One-step NASBA reactions
Uses centrifugal force to achieve mixing of
sample with dehydrated reagents
Reaction chamber
Reagent reservoir
Air reservoir
BBSRC sustainable aquaculture Cytometer for HAB
detection and quantification Simultaneous measurement of electrical (impedance) and optical properties of individual cells
In-lab prototype
No air required for optics or operation (suitable for deep sea)
Challenges include sample concentration and optical detection limits (power in chip)
CT-DO Sensor Commercialisation
Data Flow
bull Easily discover sensors and their metadata
bull Sensors and sensor observations discoverable accessible and useable via the web
bull Seamlessly integrate sensors from Sense Ocean Network with sensors from other networks
The standards
Sensor passes UUID through to
base station
Platform
Satellite
Base station
Data centre
Data delivery by SOS server and linked ocean
data server
Proposed approach NERC
Linked data
(RDF SPARQL)
server
UUID SensorML
SSN (OWL)
JSON LD
netCDF EGO 11 CF16 LD
Reference for netCDF
Link Data conventions Yu J et al Towards Linked
Data Conventions for
Delivery of Environmental
Data Using netCDF pages
102-112 Springer ISBN
978-3-319-15993-5
Send data + UUID Publish
OampMRDF
ltomOM_Observation
gmlid=ExampleOutOfBandNetCDFldquo xmlnsom=httpwwwopengisnetom20 xmlnsxsi=httpwwww3org2001XMLSchema‐instanceldquo xmlnsxlink=httpwwww3org1999xlink
xmlnsgml=httpwwwopengisnetgml32 xsischemaLocation=httpwwwopengisnetom20 httpschemasopengisnetom20observationxsdgt ltgmldescriptiongtObservation instance with remote resultltgmldescriptiongt ltomtype xlinkhref=httpwwwopengisnetdefobservationTypeOGC‐OM20OM_TimeSeriesObservationgt ltomphenomenonTimegt
ltgmlTimePeriodgmlid=phenomenonTime-JULD-1gt ltgmlbeginPositiongt2015‐01‐11T17222500ltgmlbeginPositiongt ltgmlendPositiongt2015‐01‐11T18222500ltgmlendPositiongt ltgmlTimePeriodgt
ltomphenomenonTimegt ltomresultTimegt ltgmlTimeInstant gmlid=resultTime-DATE_UPDATEgt ltgmltimePositiongt2015‐01‐11T18222500ltgmltimePositiongt ltgmlTimeInstantgt ltomresultTimegt ltomprocedure xlinkhref=rdquohttplinkeddevbodcacuksysteminstanceTOOL0969_1234rdquogt ltomobservedProperty xlinkhref=rdquocompositeTOOL0969xmlrdquogt ltomfeatureOfInterest xlinkhref=httpvocabnercacukcollectionS26currentMAT00640gt ltomresultgt ltsweDataStreamgt ltsweelementType name=Componentsgt ltsweDataRecordgt ltswefield name=timegt ltsweQuantitygt ltswelabelgtTIMEltswelabelgt ltsweuom code=s gt ltsweQuantitygt ltswefieldgt ltswefield name=Temp xlinkhref=httpvocabnercacukcollectionP01currentTEMPPR01gt ltsweQuantitygt ltswelabelgtTemperature of the water bodyltswelabelgt ltsweuom code=Cel xlinkhref=rdquohttpvocabnercacukcollectionP06currentUPAArdquo gt ltsweQuantitygt ltswefieldgt ltswefield name=WC_dissO2_optode xlinkhref=httpvocabnercacukcollectionP01currentDOXYOP01gt ltsweQuantitygt ltswelabelgtConcentration of oxygen O2 per unit volume of the water body [dissolved plus reactive particulate phase] by in-situ oxygen optodeltswelabelgt ltsweuom code=umolL xlinkhref=rdquohttpvocabnercacukcollectionP06currentUPOXrdquogt ltsweQuantitygt ltswefieldgt ltswefield name=WC_dissO2_uncalib_2 xlinkhref=httpvocabnercacukcollectionP01currentDOXYUZ02gt ltsweQuantitygt ltswelabelgtConcentration (second sensor) of oxygen O2 CAS 7782-44-7 per unit volume of the water body [dissolved plus reactive particulate phase] by in-situ sensor and no calibration against sample dataltswelabelgt ltsweuom code= xlinkhref=rdquohttpvocabnercacukcollectionP06currentUPCTrdquo gt ltsweQuantitygt ltswefieldgt ltsweDataRecordgt ltsweelementTypegt ltsweencodinggt ltsweBinaryEncoding byteEncoding=raw byteOrder=bigEndiangt ltswemembergt ltsweComponent ref=applicationx-netcdf dataType=httpwwwunidataucaredusoftwarenetcdfgt ltswemembergt ltsweBinaryEncodinggt ltsweencodinggt ltswevalues xlinkhref=http1921711351578080erddaptabledapC_Users_thogar_Desktop_Gdata_5cbc_92e8_e1d6ncgt ltsweDataStreamgt ltomresultgt ltomOM_Observationgt
Publication amp Discovery
Mainly for machine to machine access
2017 Forward look
Marine Sensors Technologies and TRL
2011201620212026 Microfabricated Solid State Electrochemistry bull Salinity 5-8-9-9
bull Dissolved oxygen 4-7-9-9
Optodes optical sensors bull Gases inc methane 6-6-8-9
bull pH pCO2 4-6-8-9
bull Radionuclide 1-3-5-8
Lab on Chip Cytometer bull Whole cells (label free) 4-5-7-9
bull Labelled cells 3-5-6-8
bull Microplastics 2-4-7-9
bull Bead assays 2-3-6-8
Lab on Chip Chemistry bull Inorganic Nutrients 6-8-9-9
bull Organic Nutrients 2-5-7-9
bull Trace metals 4-7-8-9
bull pH 5-7-9-9 TA 2-4-7-9 DIC 2-4-9-9 pCO2 2-4-6-8
bull Small organics eg PAH PCBs (f-pM) 2-5-6-8
bull Proteins and large organics (copies L) 2-4-6-7
bull Nucleic Acids (copies L) 5-6-7-9
bull Radionuclide 1-3-5-7
LOC Sensor Subsystems
developed
Benchtop
system
Shipboard
measurements
In situ
deployment
Nitrate
pH
Phosphate
Iron -
Silicate 2017 2016
Ammonium Late 2017
Total alkalinity 2017 2017
DIC very close 2017 Late 2017
Organic N and P 2017 2017
OTEG LOC sensors development status
LOC Sensor River
estuary
Coastal At depth Glacial
melt
Year- long
(unattended)
Glider or AUV Argo
float
Nitrate 2017
pH 2017
Phosphate 2017 2018 2017 2017
Iron 2017
Silicate 2016 2017 2017 2018 2017
OTEG LOC sensors ndash in situ deployments projected
2017 Forward look highlights
SenseOCEAN final year deployments demonstrations
bull Demonstration on Apex (PROVOR) (Nitrate Phosphate pH)
Platforms targeted for demonstration
AUV
(AWI)
Bouys
(lLEGOS-
CNRS)
Floats
(LEGOS-CNRS)
Shallow cabled and
deep sea observatory
(AWI)
2017 Forward look highlights
SenseOCEAN final year deployments demonstrations
bull Demonstration on Apex (PROVOR) (Nitrate Phosphate pH)
Integration into SLOCUM glider
2017 Forward look highlights
SenseOCEAN final year deployments demonstrations
bull Demonstration on Apex (PROVOR) (Nitrate Phosphate pH)
Integration into SLOCUM glider
Integration into ALR and trials for ETI
ETI CCSMV - Project
The Concept The Taxi
The sensors
CCS Sensors package commercial
SeapHOx SBE52 CTD SEAFET SBE43F DO
CCS Sensors package NOC
lab on a chip
TRL 7 pH Phosphate Nitrate
TRL 4-7 TA DIC
2017 Forward look highlights
SenseOCEAN final year deployments demonstrations
bull Demonstration on Apex (PROVOR) (Nitrate Phosphate pH)
Integration into SLOCUM glider
Integration into ALR and trials for ETI
Pathogen detection in the field
CTDO product launch
LOC license agreement commercialisation
Acknowledgements Work by current and past members of OTEG
Group head Matt Mowlem
Subgroup heads
Robin Pascal (Multidisciplinary)
Socratis Loucaides (Analytical science)
Chris Cardwell (Electronics amp Software)
Kevin Saw (Mechanical)
Photos from Dave Owsianka
Alex Beaton Martin Arundell
and others
Collaborators at
University of Southampton
NOC
Plymouth Marine Laboratory
Scottish Marine Institute
GEOMAR and others

CMEP Tropical coastal waters
0
1
2
3
4
5
6
7
8
0
05
1
15
2
2514 1
20
0
14 1
80
0
15 0
00
0
15
0
60
0
15 1
20
0
15 1
80
0
16 0
00
0
16 0
60
0
16 1
20
0
16 1
80
0
17 0
00
0
17 0
60
0
17 1
20
0
17 1
80
0
Dep
th (
m)
Nit
rate
(micro
M)
Ph
osp
hate
(micro
M)
C
hlo
rop
hyll (
microg
L)
Chlorophyll Nitrate Phosphate Depth
DELVE Nitrate in glacial meltwater
Nitrate sensor
deployed in glacial
streams draining
Greenland Ice Sheet
Sub-zero
temperatures and
highly turbid waters
DELVE Nitrate in glacial meltwater
Nitrate deployment on gliders
Celtic Sea April 2015
Alex Vincent amp Maeve Lohan NOC SOES (U Soton)
Temperature
(degC)
Chlorophyll
(mgm3)
Nitrate
(microM)
FixO3 TNA Year-long unattended in the Arctic
LOC nitrate sensors deployed
in two moorings on Fram
Straight for one year (50 ndash 80 m
deep two measurements per
day) Funded by FixO3
Biosensing
Figure and work by MN Tsaloglou
Image courtesy of our partners Aptamer
solutions
httpwwwaptamersolutionscouk
Contract Research Aptamer Antibody PAH sensor proof
of concept
Naphthalene aptamer sensor
(Kd = 13 plusmn 03 nM)
Phenanthrene aptamer sensor
(Kd = 995 plusmn 208 nM)
Fluorescence Curves for Aptamer Beacons in Seawater
Naphthalene aptamer sensor
(Kd = 13 plusmn 03 nM)
Phenanthrene aptamer sensor
(Kd = 995 plusmn 208 nM)
BBSRC sustainable aquaculture Pathogens in
Shellfisheries Water
Water-borne pathogens are (typically) difficult to measure
bull Very diverse (bacteria viruses parasites virulent and non-virulent strains)
bull Low concentration low infectious dose (eg Norovirus ge18 viral particles)
bull Lack of good bio-analytical methods (many canrsquot be cultured)
bull Diseases of unknown origin
Salmonella spp
Norovirus
Cryptosporidium
Quantitation of Microorganisms in Natural Waters
using the LabCard NASBA
New NASBA Assays for E coli DNA
Challenges
bull High genomic diversity In the environment
bull Genome size is approx 4000-5000 unique genes
bull gt2000 sequenced genomes
bull Approx 300 core genes
bull Target sequences are not always unique
Miriam Land et al (2015) Funct Integr Genomics 15 141-161
Bioinformatics methods were employed to find E coli sequences that werehellip
bull Unique to E coli
bull Ubiquitous in E coli strains
Confirmed experimentally using library of E coli (ECOR) and non-E coli bacteria from different hosts and
geographical locations
Monthly evaluation of the existing and new assays
using ldquorealrdquo water samples
11032016 1214Google Maps
Page 1 of 1ht tps wwwgooglecoukmaps50 8078436 -27419603 259769mdata=3m11e3
Google Maps
Imagery copy2016 TerraMetrics Map data copy2016 Google 20 km
Samples Collected in
Southwest England
Preliminary Results from Month One Sample Plate Assay Mean (n=3)
(CFU 100 mL)
RNA Assay after thermal
induction
(Cell Equivalents 100 mL)
DNA assay
(Genome Copy 100 mL)
Comment
Saline inshore (bathing water) 21 Not Detected Not Detected Possible to detect ge 10 cells in pure
culture Negative result due to
inhibitors
Spiked saline
(E coli type) 6533 3100 8500 RNA underestimation DNA
overestimation
Estuarine 1933 900 3200 RNA underestimation DNA
overestimation
Spiked estuarine (E coli type)
6600 400 8700 RNA underestimation DNA
overestimation
Tertiary sewage treatment works
(post UV) 121500
Not Detected Not Detected Sample inhibition
Tertiary sewage treatment works
(pre-UV)
274667 Not Detected Not Detected Sample inhibition
Secondary sewage treatment works 149000 Not Detected Not Detected Sample inhibition
Positive control
(E coli type) 274667 211500 430200 RNA underestimation DNA
overestimation
Negative control 0 Not Detected Not Detected
Other developments A New One-step NASBA
Development of new reagent
preservation methods
Optimisation of primer annealing
and thermo-tolerant enzymes
0
1000
2000
3000
4000
5000
6000
0 10 20 30
Am
ou
nt
of
Pro
du
ct
(Flu
ore
scen
ce)
Time (minutes)
ConventionalNASBA
Optimised One-Step NASBA
A New LOC for Spacial Multiplexing on Chip
Six chamber chip supporting six replicate
One-step NASBA reactions
Uses centrifugal force to achieve mixing of
sample with dehydrated reagents
Reaction chamber
Reagent reservoir
Air reservoir
BBSRC sustainable aquaculture Cytometer for HAB
detection and quantification Simultaneous measurement of electrical (impedance) and optical properties of individual cells
In-lab prototype
No air required for optics or operation (suitable for deep sea)
Challenges include sample concentration and optical detection limits (power in chip)
CT-DO Sensor Commercialisation
Data Flow
bull Easily discover sensors and their metadata
bull Sensors and sensor observations discoverable accessible and useable via the web
bull Seamlessly integrate sensors from Sense Ocean Network with sensors from other networks
The standards
Sensor passes UUID through to
base station
Platform
Satellite
Base station
Data centre
Data delivery by SOS server and linked ocean
data server
Proposed approach NERC
Linked data
(RDF SPARQL)
server
UUID SensorML
SSN (OWL)
JSON LD
netCDF EGO 11 CF16 LD
Reference for netCDF
Link Data conventions Yu J et al Towards Linked
Data Conventions for
Delivery of Environmental
Data Using netCDF pages
102-112 Springer ISBN
978-3-319-15993-5
Send data + UUID Publish
OampMRDF
ltomOM_Observation
gmlid=ExampleOutOfBandNetCDFldquo xmlnsom=httpwwwopengisnetom20 xmlnsxsi=httpwwww3org2001XMLSchema‐instanceldquo xmlnsxlink=httpwwww3org1999xlink
xmlnsgml=httpwwwopengisnetgml32 xsischemaLocation=httpwwwopengisnetom20 httpschemasopengisnetom20observationxsdgt ltgmldescriptiongtObservation instance with remote resultltgmldescriptiongt ltomtype xlinkhref=httpwwwopengisnetdefobservationTypeOGC‐OM20OM_TimeSeriesObservationgt ltomphenomenonTimegt
ltgmlTimePeriodgmlid=phenomenonTime-JULD-1gt ltgmlbeginPositiongt2015‐01‐11T17222500ltgmlbeginPositiongt ltgmlendPositiongt2015‐01‐11T18222500ltgmlendPositiongt ltgmlTimePeriodgt
ltomphenomenonTimegt ltomresultTimegt ltgmlTimeInstant gmlid=resultTime-DATE_UPDATEgt ltgmltimePositiongt2015‐01‐11T18222500ltgmltimePositiongt ltgmlTimeInstantgt ltomresultTimegt ltomprocedure xlinkhref=rdquohttplinkeddevbodcacuksysteminstanceTOOL0969_1234rdquogt ltomobservedProperty xlinkhref=rdquocompositeTOOL0969xmlrdquogt ltomfeatureOfInterest xlinkhref=httpvocabnercacukcollectionS26currentMAT00640gt ltomresultgt ltsweDataStreamgt ltsweelementType name=Componentsgt ltsweDataRecordgt ltswefield name=timegt ltsweQuantitygt ltswelabelgtTIMEltswelabelgt ltsweuom code=s gt ltsweQuantitygt ltswefieldgt ltswefield name=Temp xlinkhref=httpvocabnercacukcollectionP01currentTEMPPR01gt ltsweQuantitygt ltswelabelgtTemperature of the water bodyltswelabelgt ltsweuom code=Cel xlinkhref=rdquohttpvocabnercacukcollectionP06currentUPAArdquo gt ltsweQuantitygt ltswefieldgt ltswefield name=WC_dissO2_optode xlinkhref=httpvocabnercacukcollectionP01currentDOXYOP01gt ltsweQuantitygt ltswelabelgtConcentration of oxygen O2 per unit volume of the water body [dissolved plus reactive particulate phase] by in-situ oxygen optodeltswelabelgt ltsweuom code=umolL xlinkhref=rdquohttpvocabnercacukcollectionP06currentUPOXrdquogt ltsweQuantitygt ltswefieldgt ltswefield name=WC_dissO2_uncalib_2 xlinkhref=httpvocabnercacukcollectionP01currentDOXYUZ02gt ltsweQuantitygt ltswelabelgtConcentration (second sensor) of oxygen O2 CAS 7782-44-7 per unit volume of the water body [dissolved plus reactive particulate phase] by in-situ sensor and no calibration against sample dataltswelabelgt ltsweuom code= xlinkhref=rdquohttpvocabnercacukcollectionP06currentUPCTrdquo gt ltsweQuantitygt ltswefieldgt ltsweDataRecordgt ltsweelementTypegt ltsweencodinggt ltsweBinaryEncoding byteEncoding=raw byteOrder=bigEndiangt ltswemembergt ltsweComponent ref=applicationx-netcdf dataType=httpwwwunidataucaredusoftwarenetcdfgt ltswemembergt ltsweBinaryEncodinggt ltsweencodinggt ltswevalues xlinkhref=http1921711351578080erddaptabledapC_Users_thogar_Desktop_Gdata_5cbc_92e8_e1d6ncgt ltsweDataStreamgt ltomresultgt ltomOM_Observationgt
Publication amp Discovery
Mainly for machine to machine access
2017 Forward look
Marine Sensors Technologies and TRL
2011201620212026 Microfabricated Solid State Electrochemistry bull Salinity 5-8-9-9
bull Dissolved oxygen 4-7-9-9
Optodes optical sensors bull Gases inc methane 6-6-8-9
bull pH pCO2 4-6-8-9
bull Radionuclide 1-3-5-8
Lab on Chip Cytometer bull Whole cells (label free) 4-5-7-9
bull Labelled cells 3-5-6-8
bull Microplastics 2-4-7-9
bull Bead assays 2-3-6-8
Lab on Chip Chemistry bull Inorganic Nutrients 6-8-9-9
bull Organic Nutrients 2-5-7-9
bull Trace metals 4-7-8-9
bull pH 5-7-9-9 TA 2-4-7-9 DIC 2-4-9-9 pCO2 2-4-6-8
bull Small organics eg PAH PCBs (f-pM) 2-5-6-8
bull Proteins and large organics (copies L) 2-4-6-7
bull Nucleic Acids (copies L) 5-6-7-9
bull Radionuclide 1-3-5-7
LOC Sensor Subsystems
developed
Benchtop
system
Shipboard
measurements
In situ
deployment
Nitrate
pH
Phosphate
Iron -
Silicate 2017 2016
Ammonium Late 2017
Total alkalinity 2017 2017
DIC very close 2017 Late 2017
Organic N and P 2017 2017
OTEG LOC sensors development status
LOC Sensor River
estuary
Coastal At depth Glacial
melt
Year- long
(unattended)
Glider or AUV Argo
float
Nitrate 2017
pH 2017
Phosphate 2017 2018 2017 2017
Iron 2017
Silicate 2016 2017 2017 2018 2017
OTEG LOC sensors ndash in situ deployments projected
2017 Forward look highlights
SenseOCEAN final year deployments demonstrations
bull Demonstration on Apex (PROVOR) (Nitrate Phosphate pH)
Platforms targeted for demonstration
AUV
(AWI)
Bouys
(lLEGOS-
CNRS)
Floats
(LEGOS-CNRS)
Shallow cabled and
deep sea observatory
(AWI)
2017 Forward look highlights
SenseOCEAN final year deployments demonstrations
bull Demonstration on Apex (PROVOR) (Nitrate Phosphate pH)
Integration into SLOCUM glider
2017 Forward look highlights
SenseOCEAN final year deployments demonstrations
bull Demonstration on Apex (PROVOR) (Nitrate Phosphate pH)
Integration into SLOCUM glider
Integration into ALR and trials for ETI
ETI CCSMV - Project
The Concept The Taxi
The sensors
CCS Sensors package commercial
SeapHOx SBE52 CTD SEAFET SBE43F DO
CCS Sensors package NOC
lab on a chip
TRL 7 pH Phosphate Nitrate
TRL 4-7 TA DIC
2017 Forward look highlights
SenseOCEAN final year deployments demonstrations
bull Demonstration on Apex (PROVOR) (Nitrate Phosphate pH)
Integration into SLOCUM glider
Integration into ALR and trials for ETI
Pathogen detection in the field
CTDO product launch
LOC license agreement commercialisation
Acknowledgements Work by current and past members of OTEG
Group head Matt Mowlem
Subgroup heads
Robin Pascal (Multidisciplinary)
Socratis Loucaides (Analytical science)
Chris Cardwell (Electronics amp Software)
Kevin Saw (Mechanical)
Photos from Dave Owsianka
Alex Beaton Martin Arundell
and others
Collaborators at
University of Southampton
NOC
Plymouth Marine Laboratory
Scottish Marine Institute
GEOMAR and others

DELVE Nitrate in glacial meltwater
Nitrate deployment on gliders
Celtic Sea April 2015
Alex Vincent amp Maeve Lohan NOC SOES (U Soton)
Temperature
(degC)
Chlorophyll
(mgm3)
Nitrate
(microM)
FixO3 TNA Year-long unattended in the Arctic
LOC nitrate sensors deployed
in two moorings on Fram
Straight for one year (50 ndash 80 m
deep two measurements per
day) Funded by FixO3
Biosensing
Figure and work by MN Tsaloglou
Image courtesy of our partners Aptamer
solutions
httpwwwaptamersolutionscouk
Contract Research Aptamer Antibody PAH sensor proof
of concept
Naphthalene aptamer sensor
(Kd = 13 plusmn 03 nM)
Phenanthrene aptamer sensor
(Kd = 995 plusmn 208 nM)
Fluorescence Curves for Aptamer Beacons in Seawater
Naphthalene aptamer sensor
(Kd = 13 plusmn 03 nM)
Phenanthrene aptamer sensor
(Kd = 995 plusmn 208 nM)
BBSRC sustainable aquaculture Pathogens in
Shellfisheries Water
Water-borne pathogens are (typically) difficult to measure
bull Very diverse (bacteria viruses parasites virulent and non-virulent strains)
bull Low concentration low infectious dose (eg Norovirus ge18 viral particles)
bull Lack of good bio-analytical methods (many canrsquot be cultured)
bull Diseases of unknown origin
Salmonella spp
Norovirus
Cryptosporidium
Quantitation of Microorganisms in Natural Waters
using the LabCard NASBA
New NASBA Assays for E coli DNA
Challenges
bull High genomic diversity In the environment
bull Genome size is approx 4000-5000 unique genes
bull gt2000 sequenced genomes
bull Approx 300 core genes
bull Target sequences are not always unique
Miriam Land et al (2015) Funct Integr Genomics 15 141-161
Bioinformatics methods were employed to find E coli sequences that werehellip
bull Unique to E coli
bull Ubiquitous in E coli strains
Confirmed experimentally using library of E coli (ECOR) and non-E coli bacteria from different hosts and
geographical locations
Monthly evaluation of the existing and new assays
using ldquorealrdquo water samples
11032016 1214Google Maps
Page 1 of 1ht tps wwwgooglecoukmaps50 8078436 -27419603 259769mdata=3m11e3
Google Maps
Imagery copy2016 TerraMetrics Map data copy2016 Google 20 km
Samples Collected in
Southwest England
Preliminary Results from Month One Sample Plate Assay Mean (n=3)
(CFU 100 mL)
RNA Assay after thermal
induction
(Cell Equivalents 100 mL)
DNA assay
(Genome Copy 100 mL)
Comment
Saline inshore (bathing water) 21 Not Detected Not Detected Possible to detect ge 10 cells in pure
culture Negative result due to
inhibitors
Spiked saline
(E coli type) 6533 3100 8500 RNA underestimation DNA
overestimation
Estuarine 1933 900 3200 RNA underestimation DNA
overestimation
Spiked estuarine (E coli type)
6600 400 8700 RNA underestimation DNA
overestimation
Tertiary sewage treatment works
(post UV) 121500
Not Detected Not Detected Sample inhibition
Tertiary sewage treatment works
(pre-UV)
274667 Not Detected Not Detected Sample inhibition
Secondary sewage treatment works 149000 Not Detected Not Detected Sample inhibition
Positive control
(E coli type) 274667 211500 430200 RNA underestimation DNA
overestimation
Negative control 0 Not Detected Not Detected
Other developments A New One-step NASBA
Development of new reagent
preservation methods
Optimisation of primer annealing
and thermo-tolerant enzymes
0
1000
2000
3000
4000
5000
6000
0 10 20 30
Am
ou
nt
of
Pro
du
ct
(Flu
ore
scen
ce)
Time (minutes)
ConventionalNASBA
Optimised One-Step NASBA
A New LOC for Spacial Multiplexing on Chip
Six chamber chip supporting six replicate
One-step NASBA reactions
Uses centrifugal force to achieve mixing of
sample with dehydrated reagents
Reaction chamber
Reagent reservoir
Air reservoir
BBSRC sustainable aquaculture Cytometer for HAB
detection and quantification Simultaneous measurement of electrical (impedance) and optical properties of individual cells
In-lab prototype
No air required for optics or operation (suitable for deep sea)
Challenges include sample concentration and optical detection limits (power in chip)
CT-DO Sensor Commercialisation
Data Flow
bull Easily discover sensors and their metadata
bull Sensors and sensor observations discoverable accessible and useable via the web
bull Seamlessly integrate sensors from Sense Ocean Network with sensors from other networks
The standards
Sensor passes UUID through to
base station
Platform
Satellite
Base station
Data centre
Data delivery by SOS server and linked ocean
data server
Proposed approach NERC
Linked data
(RDF SPARQL)
server
UUID SensorML
SSN (OWL)
JSON LD
netCDF EGO 11 CF16 LD
Reference for netCDF
Link Data conventions Yu J et al Towards Linked
Data Conventions for
Delivery of Environmental
Data Using netCDF pages
102-112 Springer ISBN
978-3-319-15993-5
Send data + UUID Publish
OampMRDF
ltomOM_Observation
gmlid=ExampleOutOfBandNetCDFldquo xmlnsom=httpwwwopengisnetom20 xmlnsxsi=httpwwww3org2001XMLSchema‐instanceldquo xmlnsxlink=httpwwww3org1999xlink
xmlnsgml=httpwwwopengisnetgml32 xsischemaLocation=httpwwwopengisnetom20 httpschemasopengisnetom20observationxsdgt ltgmldescriptiongtObservation instance with remote resultltgmldescriptiongt ltomtype xlinkhref=httpwwwopengisnetdefobservationTypeOGC‐OM20OM_TimeSeriesObservationgt ltomphenomenonTimegt
ltgmlTimePeriodgmlid=phenomenonTime-JULD-1gt ltgmlbeginPositiongt2015‐01‐11T17222500ltgmlbeginPositiongt ltgmlendPositiongt2015‐01‐11T18222500ltgmlendPositiongt ltgmlTimePeriodgt
ltomphenomenonTimegt ltomresultTimegt ltgmlTimeInstant gmlid=resultTime-DATE_UPDATEgt ltgmltimePositiongt2015‐01‐11T18222500ltgmltimePositiongt ltgmlTimeInstantgt ltomresultTimegt ltomprocedure xlinkhref=rdquohttplinkeddevbodcacuksysteminstanceTOOL0969_1234rdquogt ltomobservedProperty xlinkhref=rdquocompositeTOOL0969xmlrdquogt ltomfeatureOfInterest xlinkhref=httpvocabnercacukcollectionS26currentMAT00640gt ltomresultgt ltsweDataStreamgt ltsweelementType name=Componentsgt ltsweDataRecordgt ltswefield name=timegt ltsweQuantitygt ltswelabelgtTIMEltswelabelgt ltsweuom code=s gt ltsweQuantitygt ltswefieldgt ltswefield name=Temp xlinkhref=httpvocabnercacukcollectionP01currentTEMPPR01gt ltsweQuantitygt ltswelabelgtTemperature of the water bodyltswelabelgt ltsweuom code=Cel xlinkhref=rdquohttpvocabnercacukcollectionP06currentUPAArdquo gt ltsweQuantitygt ltswefieldgt ltswefield name=WC_dissO2_optode xlinkhref=httpvocabnercacukcollectionP01currentDOXYOP01gt ltsweQuantitygt ltswelabelgtConcentration of oxygen O2 per unit volume of the water body [dissolved plus reactive particulate phase] by in-situ oxygen optodeltswelabelgt ltsweuom code=umolL xlinkhref=rdquohttpvocabnercacukcollectionP06currentUPOXrdquogt ltsweQuantitygt ltswefieldgt ltswefield name=WC_dissO2_uncalib_2 xlinkhref=httpvocabnercacukcollectionP01currentDOXYUZ02gt ltsweQuantitygt ltswelabelgtConcentration (second sensor) of oxygen O2 CAS 7782-44-7 per unit volume of the water body [dissolved plus reactive particulate phase] by in-situ sensor and no calibration against sample dataltswelabelgt ltsweuom code= xlinkhref=rdquohttpvocabnercacukcollectionP06currentUPCTrdquo gt ltsweQuantitygt ltswefieldgt ltsweDataRecordgt ltsweelementTypegt ltsweencodinggt ltsweBinaryEncoding byteEncoding=raw byteOrder=bigEndiangt ltswemembergt ltsweComponent ref=applicationx-netcdf dataType=httpwwwunidataucaredusoftwarenetcdfgt ltswemembergt ltsweBinaryEncodinggt ltsweencodinggt ltswevalues xlinkhref=http1921711351578080erddaptabledapC_Users_thogar_Desktop_Gdata_5cbc_92e8_e1d6ncgt ltsweDataStreamgt ltomresultgt ltomOM_Observationgt
Publication amp Discovery
Mainly for machine to machine access
2017 Forward look
Marine Sensors Technologies and TRL
2011201620212026 Microfabricated Solid State Electrochemistry bull Salinity 5-8-9-9
bull Dissolved oxygen 4-7-9-9
Optodes optical sensors bull Gases inc methane 6-6-8-9
bull pH pCO2 4-6-8-9
bull Radionuclide 1-3-5-8
Lab on Chip Cytometer bull Whole cells (label free) 4-5-7-9
bull Labelled cells 3-5-6-8
bull Microplastics 2-4-7-9
bull Bead assays 2-3-6-8
Lab on Chip Chemistry bull Inorganic Nutrients 6-8-9-9
bull Organic Nutrients 2-5-7-9
bull Trace metals 4-7-8-9
bull pH 5-7-9-9 TA 2-4-7-9 DIC 2-4-9-9 pCO2 2-4-6-8
bull Small organics eg PAH PCBs (f-pM) 2-5-6-8
bull Proteins and large organics (copies L) 2-4-6-7
bull Nucleic Acids (copies L) 5-6-7-9
bull Radionuclide 1-3-5-7
LOC Sensor Subsystems
developed
Benchtop
system
Shipboard
measurements
In situ
deployment
Nitrate
pH
Phosphate
Iron -
Silicate 2017 2016
Ammonium Late 2017
Total alkalinity 2017 2017
DIC very close 2017 Late 2017
Organic N and P 2017 2017
OTEG LOC sensors development status
LOC Sensor River
estuary
Coastal At depth Glacial
melt
Year- long
(unattended)
Glider or AUV Argo
float
Nitrate 2017
pH 2017
Phosphate 2017 2018 2017 2017
Iron 2017
Silicate 2016 2017 2017 2018 2017
OTEG LOC sensors ndash in situ deployments projected
2017 Forward look highlights
SenseOCEAN final year deployments demonstrations
bull Demonstration on Apex (PROVOR) (Nitrate Phosphate pH)
Platforms targeted for demonstration
AUV
(AWI)
Bouys
(lLEGOS-
CNRS)
Floats
(LEGOS-CNRS)
Shallow cabled and
deep sea observatory
(AWI)
2017 Forward look highlights
SenseOCEAN final year deployments demonstrations
bull Demonstration on Apex (PROVOR) (Nitrate Phosphate pH)
Integration into SLOCUM glider
2017 Forward look highlights
SenseOCEAN final year deployments demonstrations
bull Demonstration on Apex (PROVOR) (Nitrate Phosphate pH)
Integration into SLOCUM glider
Integration into ALR and trials for ETI
ETI CCSMV - Project
The Concept The Taxi
The sensors
CCS Sensors package commercial
SeapHOx SBE52 CTD SEAFET SBE43F DO
CCS Sensors package NOC
lab on a chip
TRL 7 pH Phosphate Nitrate
TRL 4-7 TA DIC
2017 Forward look highlights
SenseOCEAN final year deployments demonstrations
bull Demonstration on Apex (PROVOR) (Nitrate Phosphate pH)
Integration into SLOCUM glider
Integration into ALR and trials for ETI
Pathogen detection in the field
CTDO product launch
LOC license agreement commercialisation
Acknowledgements Work by current and past members of OTEG
Group head Matt Mowlem
Subgroup heads
Robin Pascal (Multidisciplinary)
Socratis Loucaides (Analytical science)
Chris Cardwell (Electronics amp Software)
Kevin Saw (Mechanical)
Photos from Dave Owsianka
Alex Beaton Martin Arundell
and others
Collaborators at
University of Southampton
NOC
Plymouth Marine Laboratory
Scottish Marine Institute
GEOMAR and others
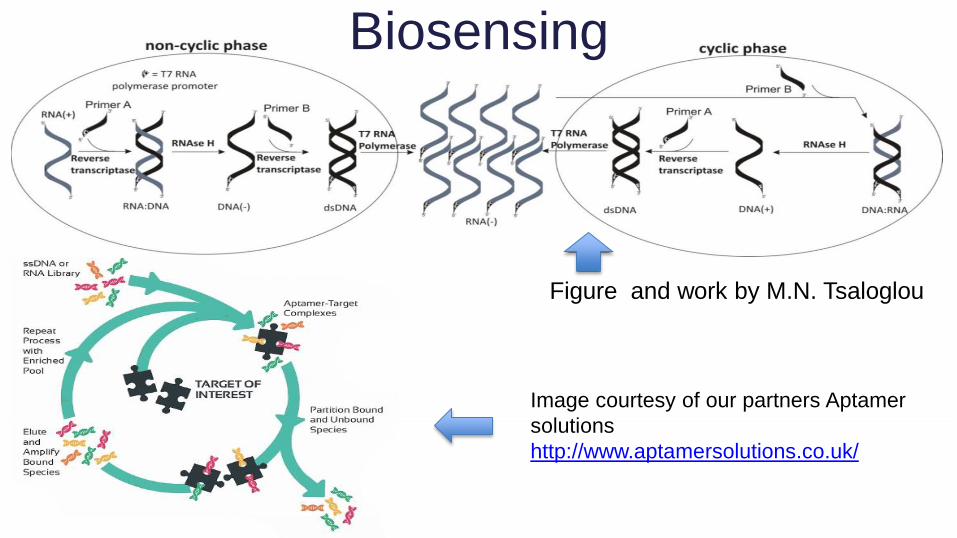
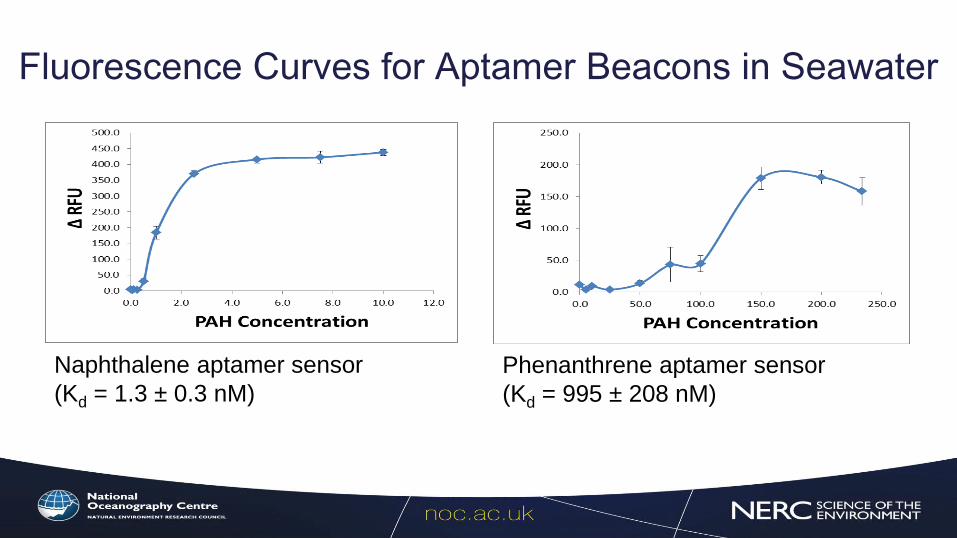
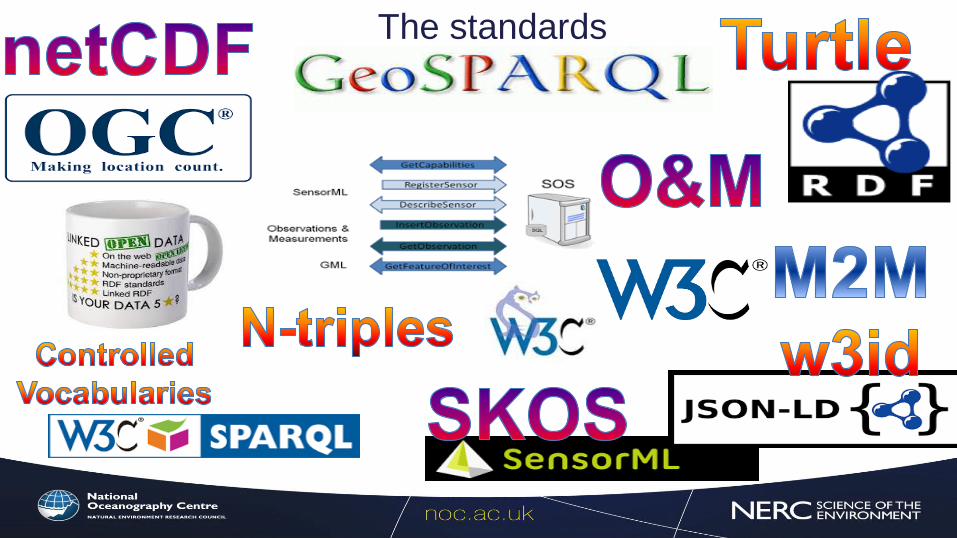

2017 Forward look highlights
SenseOCEAN final year deployments demonstrations
bull Demonstration on Apex (PROVOR) (Nitrate Phosphate pH)
Platforms targeted for demonstration
AUV
(AWI)
Bouys
(lLEGOS-
CNRS)
Floats
(LEGOS-CNRS)
Shallow cabled and
deep sea observatory
(AWI)
2017 Forward look highlights
SenseOCEAN final year deployments demonstrations
bull Demonstration on Apex (PROVOR) (Nitrate Phosphate pH)
Integration into SLOCUM glider
2017 Forward look highlights
SenseOCEAN final year deployments demonstrations
bull Demonstration on Apex (PROVOR) (Nitrate Phosphate pH)
Integration into SLOCUM glider
Integration into ALR and trials for ETI
ETI CCSMV - Project
The Concept The Taxi
The sensors
CCS Sensors package commercial
SeapHOx SBE52 CTD SEAFET SBE43F DO
CCS Sensors package NOC
lab on a chip
TRL 7 pH Phosphate Nitrate
TRL 4-7 TA DIC
2017 Forward look highlights
SenseOCEAN final year deployments demonstrations
bull Demonstration on Apex (PROVOR) (Nitrate Phosphate pH)
Integration into SLOCUM glider
Integration into ALR and trials for ETI
Pathogen detection in the field
CTDO product launch
LOC license agreement commercialisation
Acknowledgements Work by current and past members of OTEG
Group head Matt Mowlem
Subgroup heads
Robin Pascal (Multidisciplinary)
Socratis Loucaides (Analytical science)
Chris Cardwell (Electronics amp Software)
Kevin Saw (Mechanical)
Photos from Dave Owsianka
Alex Beaton Martin Arundell
and others
Collaborators at
University of Southampton
NOC
Plymouth Marine Laboratory
Scottish Marine Institute
GEOMAR and others

2017 Forward look highlights
SenseOCEAN final year deployments demonstrations
bull Demonstration on Apex (PROVOR) (Nitrate Phosphate pH)
Integration into SLOCUM glider
2017 Forward look highlights
SenseOCEAN final year deployments demonstrations
bull Demonstration on Apex (PROVOR) (Nitrate Phosphate pH)
Integration into SLOCUM glider
Integration into ALR and trials for ETI
ETI CCSMV - Project
The Concept The Taxi
The sensors
CCS Sensors package commercial
SeapHOx SBE52 CTD SEAFET SBE43F DO
CCS Sensors package NOC
lab on a chip
TRL 7 pH Phosphate Nitrate
TRL 4-7 TA DIC
2017 Forward look highlights
SenseOCEAN final year deployments demonstrations
bull Demonstration on Apex (PROVOR) (Nitrate Phosphate pH)
Integration into SLOCUM glider
Integration into ALR and trials for ETI
Pathogen detection in the field
CTDO product launch
LOC license agreement commercialisation
Acknowledgements Work by current and past members of OTEG
Group head Matt Mowlem
Subgroup heads
Robin Pascal (Multidisciplinary)
Socratis Loucaides (Analytical science)
Chris Cardwell (Electronics amp Software)
Kevin Saw (Mechanical)
Photos from Dave Owsianka
Alex Beaton Martin Arundell
and others
Collaborators at
University of Southampton
NOC
Plymouth Marine Laboratory
Scottish Marine Institute
GEOMAR and others
2017 Forward look highlights
SenseOCEAN final year deployments demonstrations
bull Demonstration on Apex (PROVOR) (Nitrate Phosphate pH)
Integration into SLOCUM glider
Integration into ALR and trials for ETI
ETI CCSMV - Project
The Concept The Taxi
The sensors
CCS Sensors package commercial
SeapHOx SBE52 CTD SEAFET SBE43F DO
CCS Sensors package NOC
lab on a chip
TRL 7 pH Phosphate Nitrate
TRL 4-7 TA DIC
2017 Forward look highlights
SenseOCEAN final year deployments demonstrations
bull Demonstration on Apex (PROVOR) (Nitrate Phosphate pH)
Integration into SLOCUM glider
Integration into ALR and trials for ETI
Pathogen detection in the field
CTDO product launch
LOC license agreement commercialisation
Acknowledgements Work by current and past members of OTEG
Group head Matt Mowlem
Subgroup heads
Robin Pascal (Multidisciplinary)
Socratis Loucaides (Analytical science)
Chris Cardwell (Electronics amp Software)
Kevin Saw (Mechanical)
Photos from Dave Owsianka
Alex Beaton Martin Arundell
and others
Collaborators at
University of Southampton
NOC
Plymouth Marine Laboratory
Scottish Marine Institute
GEOMAR and others