hcs policy c center for brief health care strategies, inc. health care strategies, inc. center for...
TRANSCRIPT

uch is known about reducing costs for elderly Medicare patients,1 but less information is available for Medicaid-only recipients. In contrast
with Medicare high-utilizing patients who generally have multiple physical chronic conditions, high-utilizing Medicaid-only patients usually have a combination of physical and mental conditions, sometimes complicated by substance abuse and homelessness. Programs for Medicare may not work for the very different Medicaid population. This brief reports on findings from a review of 14 programs for high-utilizing, complex patients, with a primary focus on Medicaid. The information herein should be considered preliminary – an exploration. More work must be done to pinpoint precisely what is needed to improve care and reduce costs for Medicaid beneficiaries. The programs described here were recommended by experts in Medicaid policy or by people knowledgeable about ways to reduce costs for super-utilizing patient subsets. While the majority of the programs chosen for this review involve Medicaid patients, some programs for employed individuals and Medicare offer potential relevance to the Medicaid population and are included. The programs examined constitute only a small segment of the universe of attempts to control the costs of complex, high-utilizing patients. The brief’s first section attempts to categorize the various types of high-utilizer programs and includes a table outlining the core features of the 14 programs reviewed (see the appendix on pages 9-22 for a full description of each). While the programs are distinct from one another, virtually all are a mixture of different models of care. The second section details 10 key factors that emerged as themes for success across the reviewed programs. Although this is a preliminary snapshot, these success factors warrant attention and potential replication. The third section explores the tangible success of the programs reviewed through a look at cost and utilization data.
C
Strategies to Reduce Costs and Improve Care for High-Utilizing Medicaid Patients: Reflections on Pioneering Programs
By Thomas Bodenheimer MD, University of California, San Francisco
PolicyHCS Health Care Strategies, Inc. Center for
Brief
O C T O B E R 2 0 1 3
MForeword Across the country, Medicaid stakeholders are exploring new ways to address the needs of Medicaid’s highest-utilizing patients. Super-utilizers make up only five percent of the Medicaid universe, yet these patients with complex needs account for more than 50 percent of overall program spending. Thomas Bodenheimer, MD, MPH at the University of California San Francisco recently undertook a review of super-utilizer programs nationally to help guide the San Francisco Health Plan in designing better ways to care for high-risk, hard-to-reach patients. His examination of 14 high-utilizer programs uncovered valuable insights for states, health plans, and providers looking to improve care delivery for Medicaid’s sickest, costliest patients. Three of the programs identified for this analysis – the Camden Coalition, CareOregon, and Hennepin Health -- are participants in the Center for Health Care Strategies’ (CHCS) Complex Care Innovation Lab. This national initiative made possible by Kaiser Permanente Community Benefit is working with pioneering programs across the country to design and spread better ways to care for the highest-need, highest-cost populations in publicly financed care. We are pleased to share the findings from this analysis to add to the emerging body of evidence on the need for high-touch, highly tailored approaches for individuals with complex needs. Allison Hamblin, MSPH Center for Health Care Strategies, Inc.
This brief was made possible through support from Kaiser Permanente Community Benefit.
The Models: An Overview
Complex care management programs can be categorized using different criteria. One side of the spectrum consists of medical interventions with registered nurses (RNs) leading the care management team while the opposite pole features case management and navigation rather than medical care, with social workers as leaders. Most programs lie between these extremes, incorporating elements of both. Another dimension is to classify the programs based on the principal site of the program. While this brief uses the latter classification, there are merits for considering the former. The models listed here never exist in pure form; all programs are hybrids of more than one model. 1. Health Plan Model. The health plan employs a care management team that operates from the health
plan; usually the care management is mostly telephonic. 2. Primary Care Model. The care management team is embedded in one or more primary care practices.
The team could be employed by a health plan or a provider organization, but its location is a primary care site.
3. aICU (ambulatory intensive caring unit) Model. High-utilizing, complex patients receive all their
care from a separate high-risk clinic or a high-risk team within a clinic. They no longer receive care from a primary care provider who sees both complex and non-complex patients. The entire attention of the high-risk clinic/team is focused on a small panel of high-utilizing patients.
4. Hospital Discharge Model. This model focuses on intensive care management during the transition
from inpatient to home and to primary care. Ideally, patients in this model continue care management in one of the other models once the transition from inpatient is completed.
5. Emergency Department-Based Model. Patients are recruited in the emergency department (ED) and
an ED-related team provides care management.
6. Home-Based Model. This model is for patients unable to leave the home, or for whom leaving the home is difficult. Care management takes place entirely in the patient’s home. For homeless or precariously housed patients the care goes to wherever the patient is.
7. Housing First Model. High-utilizing patients who are homeless or precariously housed are provided with
stable housing, without a medical care component. In some cases, case managers are available at the housing sites to assist with social services.
8. Commmunity-Based Model. The care management team engages patients wherever the patients are
located.
Strategies to Reduce Costs and Improve Care for High-Utilizing Medicaid Patients: Reflections on Pioneering Programs 2

Strategies to Reduce Costs and Improve Care for High-Utilizing Medicaid Patients: Reflections on Pioneering Programs 3
Table 1: Summary of High-Utilizing Programs PROGRAM POPULATION KEY CARE MANAGEMENT ELEMENTS California Frequent Users Initiative Santa Clara County, Silicon Valley Health Coalition
8+ ED visits in 12 months Case managers with office space at each hospital, not co-located in ED. Access to vouchers for permanent housing through partnerships with housing agency. Incentives to enhance recruitment: phone cards, grocery vouchers, bus tokens, transportation assistance and
home visits. Direct access to a psychiatrist for medication management, disability assessments, and consultation.
Community Care of North Carolina NC Dept of Health and Human Services
Almost all Medicaid patients in North Carolina
Risk-stratifies by severity of illness/past utilization, with higher-risk patients receiving more intense care management.
Care managers are embedded in large-volume hospitals to coordinate discharges. 14 regional networks have care management teams, led by RNs, who visit practices in their region. Teams
include RNs, social workers, a pharmacist, a psychiatrist, and non-licensed staff for outreach and patient education.
Care managers have telephone, home visit, and face-to-face clinic encounters with patients for medication management, reminders, navigation. Care managers refer patients to community agencies such as DSS, mental health, and school nurses.
Geriatric Resources for Assessment and Care of Elders (GRACE) Wishard Health Services
Low-income seniors with medical complexity
Patients retain their PCP, and receive care management from a nurse practitioner (NP)/social worker team that receives consultation from a geriatrics interdisciplinary team.
Initial assessment via home visit, followed by home visit to review care plan; minimum of one phone call per month to each patient; home visit after any ED visit or hospitalization.
Weekly meetings between consult and care management teams; all cases reviewed at 3 and 6 weeks; 6 and 9 months; and after ED or inpatient care.
Hospital to home transitional care program provides home visit, medication reconciliation, and arrangement of post-discharge care.
CareOregon Medicaid enrollees who are deemed clinically complex and/or high utilizers
CareSupport team offers mainly telephonic care management centralized within health plan. Health Resilience Specialists, who are not all medically trained, but who often have master’s degrees in social
work, build trusting relationships with patients and encourage patient self-efficacy. They meet weekly to discuss their patients and have LCSWs providing daily supervision.
Coding systems developed to chart complexity, potential for success, and various medical, behavioral, and social circumstances.
Coordinated Care Clinic Hennepin County Medical Center
3 or more hospital admits in past year
Components of broader Hennepin Health model. aICU model using a special clinic that only serves patients who are complex high-utilizers. The aICU team includes a physician, nurse practitioner, licensed clinical social worker, RN coordinator,
licensed practical nurse (LPN), alcohol/drug counselor, behaviorist, pharmacist, and office specialist who greets the patient. The office specialist may be the most important person on the team, building close relationships with patients.
Most care is in-clinic or telephonic; patients can walk in and get same-day visits. Most home visits are done through a separate home care agency.
Boeing Intensive Outpatient Care Program The Boeing Company, Regence BlueShield, Everett Clinic, Valley Medical Center IPA, and Virginia Mason Medical Center
The predicted highest cost quintile of Boeing’s Puget Sound employees and their adult dependents
RN care manager provides health coaching for chronic conditions. Care plan is implemented through in-person, telephonic, and e-mail contacts. Patients are risk-stratified, intensity of care is based on risk score. Timely notification of ED visits and inpatient admissions and daily team planning sessions.
Chicago Housing First Program
Shelter-homeless, street-homeless and unstably housed; average homelessness 30 months
Transitional housing provided post-discharge, followed by placement in long-term housing. Master’s level social work case management at the housing site. No medical intervention, though the case managers did provide care coordination to medical facilities.

Strategies to Reduce Costs and Improve Care for High-Utilizing Medicaid Patients: Reflections on Pioneering Programs 4
PROGRAM POPULATION KEY CARE MANAGEMENT ELEMENTS Seattle Housing First Seattle Downtown Emergency Services Center
Chronically homeless individuals who incurred the highest costs for alcohol-related emergency services
Patients were offered individual housing units in a new supportive housing facility regardless of sobriety. Facility had a 24-hour staff of social workers and other clinicians. Staff helped residents with medical and social services and worked with them to address behavioral issues.
Camden Coalition of Healthcare Providers
Camden residents with two or more inpatient admissions in six months and at least two chronic conditions
Community-based model, with care management teams: (a) doing home visits; (b) reaching out to homeless patients on the street; and (c) helping patients access primary care.
Patients approached by RN during inpatient visit to join program with PCP visit scheduled within 7 days of discharge.
Team visits newly enrolled patients each week and attends their medical appointments. Nursing team members aim to transition patient to health coach or community health worker, who provide
ongoing support and guidance once patient is medically and socially stable (ideally within 6-8 weeks).
Atlantic City Special Care Center AtlantiCare
Low-income union members working in Atlantic City casinos with chronic diseases and in the top 10% of predicted health spending
aICU model with patients leaving PCPs to receive all care at the Special Care Center (SCC). This program relies heavily on well-trained health coaches, who are mostly medical assistants and LPNs,
culturally and linguistically concordant with the patients. Health coaches participate in the initial assessment and are responsible for implementing the care plan;
meeting independently with patients; attending physician visits; helping patients set goals and manage their own care; monitoring patients’ ability to adhere to their plan; and helping them overcome barriers to meeting their health goals.
Coaches interact with patients through clinic visits, home visits, phone or e-mail.
Homeless Patient-Aligned Care Team (H-PACT) West Los Angeles VA
Homeless veterans coming to the ED with complex medical and social problems
aICU model with HPACT team providing primary care and referrals to housing, social service, substance/alcohol services.
Visits are at least one hour (often 2 hours, including nursing and physician and social worker involvement) so that multiple issues can be handled in one visit.
Team is co-located in one space; team meetings held post-visit to review and update care plan. The clinic works closely with a housing assistance unit located in the same facility.
Stanford Coordinated Care Stanford University
Stanford University employees and their dependents with multiple chronic health conditions
Hybrid model with patients choosing to change their PCP to the aICU team or to remain with their previous PCP and receive care management at their PCP’s office.
Care plan developed according to patient activation measure (PAM) and domain assessment tool scores. Non-professional care coordinators (like health coaches) meet with patients before a physician visit to
generate an agenda, participate in the visit as a scribe, and have a post-visit for action plans and closing the loop.
Daily inpatient visits by RN to help with post-discharge planning. Pharmacist certified diabetes educator (CDE) sees patients with diabetes and asthma and adjusts
hypertension, diabetes and lipid medications via protocol as appropriate. Patient Advisory Council meets bi-monthly, facilitated by licensed clinical social worker (LCSW).
CareMore
CareMore members (mostly Medicare or dual eligible) at highest risk for high costs
Mainly an aICU model with care centers for high-utilizing patients; patients with their own PCP have their care co-managed between the CareMore physicians and PCP.
The care center team includes the CareMore physician (“extensivist”), NP, RN care manager, and medical assistant care extenders.
One physician and one NP are dedicated exclusively to home visits. Home monitoring of blood pressures, weights, and blood sugars are transmitted to RN care managers.
Hospital to Home Program, Chronic Illness Demonstration Project New York City Health and Hospitals Corporation (NYC HHC)
Fee-for-service Medicaid patients at high risk for hospitalization
Care coordinators both conducted outreach to enroll patients and provided case management. Housing Coordinator dedicated to helping homeless patients complete housing applications, conduct housing
interviews, and transition into permanent housing. Cell phones, MetroCards provided to patients, a “patient necessity fund” supported miscellaneous patient
expenses (eg- getting a copy of birth certificate, refilling prescription, etc). Real-time alerts when patients entered into hospital system for emergency room or outpatient visit, or
inpatient admission.

Reflections for High-Utilizer Programs
Following are 10 key reflections gleaned from the exploration of the 14 high-utilizer programs described in this brief. The insights from these existing programs can help other efforts across the country refine their approaches for complex-need populations. 1. High-utilizer programs can make substantial reductions in hospital admissions, hospital days, ED
visits, and total costs of care. Five of the programs reviewed in this brief had relatively robust evaluations, demonstrating that high-utilizer programs can substantially reduce health expenditures. More work is needed to evaluate Medicaid-only programs.
2. For homeless or precariously housed people, providing permanent housing with case management –
with no medical personnel – appears to be the most powerful way to reduce costly health care utilization. It is unclear why so many resources are spent on medical care for homeless people when simply providing housing is effective. Case management at the housing site by social workers adds to the value of stable housing.
3. There is a big difference between the aICU model – referring high-utilizing complex patients to a
specialized team with a small panel size -- and the primary care model. It is not possible to say that one of these models is better. Programs can be a hybrid of these models: (a) patients having good primary care stay with their PCP; and (b) those without primary care or wishing to leave their PCP enter the aICU.
4. There is no standard composition of care management teams. Who is on the team depends on the
characteristics of the patients being served. Most teams include RN and social worker. Having a psychiatrist and a pharmacist to work with the care management team is helpful. Some programs have non-professional personnel such as navigators or health coaches, who can assist the professional team members and allow caseloads to increase.
5. Most programs perform a careful initial assessment, develop a care plan, and incorporate regular
follow-up by the care management team. The intensity of follow-up is generally reduced if patients improve.
6. Programs tend to have a coaching rather than a rescuing philosophy. Rather than doing everything for
their patients, they attempt to teach patients to better self-manage their health, their social problems, and their ability to navigate the health and social services systems.
7. Many programs have a home visit component. Because of the difficulty comparing cost and utilization
outcomes among the programs, it cannot be concluded whether home visits are a necessary feature of high-utilizer programs. Many people working in these programs feel that home visits are very important.
8. Some programs allow patients to access the care management team 24/7; others do not. The Special
Care Center idea to program patients’ phones to speed dial a 24/7 access number rather than 911 may be an effective way to reduce unnecessary ambulance and ED use.
9. Coaching patients to understand their medications and to become more medication adherent is an
essential feature of all programs. Given the morbidity profile of these patients, complicated medication regimens are common. In addition, many of these patients have historically lacked strong communication channels with prescribing providers.
10. Caseloads vary with team size, team composition, and patient complexity. A single RN care manager
can usually care for 40-50 patients; a RN/social worker team can care for 100 patients, and a team that includes health coaches or navigators working under the mentorship of RNs and/or social workers may be able to double caseloads.
Strategies to Reduce Costs and Improve Care for High-Utilizing Medicaid Patients: Reflections on Pioneering Programs 5
Strategies to Reduce Costs and Improve Care for High-Utilizing Medicaid Patients: Reflections on Pioneering Programs 6
Cost and Utilization Findings
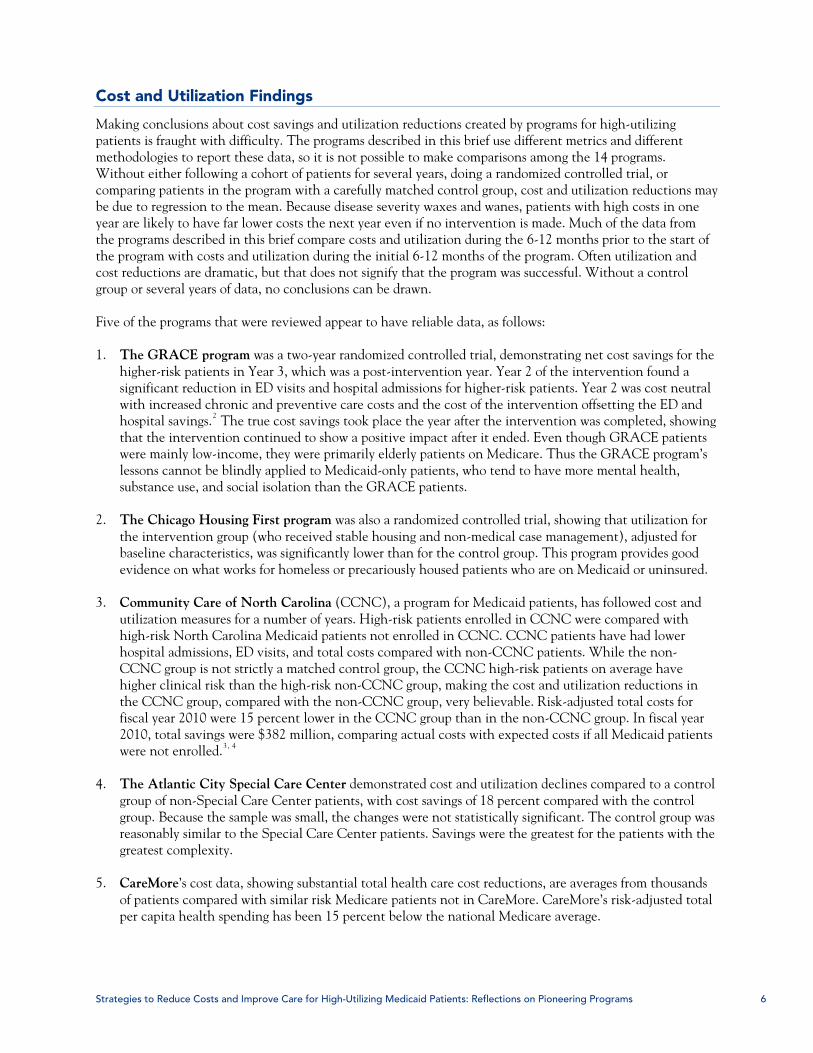
Making conclusions about cost savings and utilization reductions created by programs for high-utilizing patients is fraught with difficulty. The programs described in this brief use different metrics and different methodologies to report these data, so it is not possible to make comparisons among the 14 programs. Without either following a cohort of patients for several years, doing a randomized controlled trial, or comparing patients in the program with a carefully matched control group, cost and utilization reductions may be due to regression to the mean. Because disease severity waxes and wanes, patients with high costs in one year are likely to have far lower costs the next year even if no intervention is made. Much of the data from the programs described in this brief compare costs and utilization during the 6-12 months prior to the start of the program with costs and utilization during the initial 6-12 months of the program. Often utilization and cost reductions are dramatic, but that does not signify that the program was successful. Without a control group or several years of data, no conclusions can be drawn. Five of the programs that were reviewed appear to have reliable data, as follows: 1. The GRACE program was a two-year randomized controlled trial, demonstrating net cost savings for the
higher-risk patients in Year 3, which was a post-intervention year. Year 2 of the intervention found a significant reduction in ED visits and hospital admissions for higher-risk patients. Year 2 was cost neutral with increased chronic and preventive care costs and the cost of the intervention offsetting the ED and hospital savings.2 The true cost savings took place the year after the intervention was completed, showing that the intervention continued to show a positive impact after it ended. Even though GRACE patients were mainly low-income, they were primarily elderly patients on Medicare. Thus the GRACE program’s lessons cannot be blindly applied to Medicaid-only patients, who tend to have more mental health, substance use, and social isolation than the GRACE patients.
2. The Chicago Housing First program was also a randomized controlled trial, showing that utilization for
the intervention group (who received stable housing and non-medical case management), adjusted for baseline characteristics, was significantly lower than for the control group. This program provides good evidence on what works for homeless or precariously housed patients who are on Medicaid or uninsured.
3. Community Care of North Carolina (CCNC), a program for Medicaid patients, has followed cost and
utilization measures for a number of years. High-risk patients enrolled in CCNC were compared with high-risk North Carolina Medicaid patients not enrolled in CCNC. CCNC patients have had lower hospital admissions, ED visits, and total costs compared with non-CCNC patients. While the non-CCNC group is not strictly a matched control group, the CCNC high-risk patients on average have higher clinical risk than the high-risk non-CCNC group, making the cost and utilization reductions in the CCNC group, compared with the non-CCNC group, very believable. Risk-adjusted total costs for fiscal year 2010 were 15 percent lower in the CCNC group than in the non-CCNC group. In fiscal year 2010, total savings were $382 million, comparing actual costs with expected costs if all Medicaid patients were not enrolled.3, 4
4. The Atlantic City Special Care Center demonstrated cost and utilization declines compared to a control
group of non-Special Care Center patients, with cost savings of 18 percent compared with the control group. Because the sample was small, the changes were not statistically significant. The control group was reasonably similar to the Special Care Center patients. Savings were the greatest for the patients with the greatest complexity.
5. CareMore’s cost data, showing substantial total health care cost reductions, are averages from thousands
of patients compared with similar risk Medicare patients not in CareMore. CareMore’s risk-adjusted total per capita health spending has been 15 percent below the national Medicare average.

Table 2: High-Utilizer Programs Cost and Utilization
PROGRAM TIME SPAN HOSPITAL
ADMITS HOSPITAL
DAYS ED VISITS TOTAL COSTS
NET TOTAL COSTS
(SAVINGS – PROGRAM
COSTS) CALIFORNIA
FREQUENT
USERS
1 year pre-post
-14% -5% -22%
COMMUNITY
CARE OF
NORTH
CAROLINA
2010: High-risk patients admitted 37% less than non- high-risk
2010: CCNC high-risk patients 10% fewer ED visits than non-CCNC high-risk patients
2010: total risk-adjusted costs 15% lower in CCNC patients than in non-CCNC patients
$984 million savings 2006-2010; $382 million savings 2010; comparing actual costs with expected costs had the program not existed.
GRACE
By year 2, high-risk patients had 44% fewer admits than controls
By year 2, ED visits were 23% lower for high-risk GRACE patients than for controls
In year 3, for high-risk enrollees, total costs were $5,100 compared with $6,600 for controls (p < .001)
For high-risk patients, in years 1 and 2 program costs = cost savings. Year 3 showed significant net savings.
CAREOREGON Average 11.5 months pre-and 8-months post enrollment in program
For initial 222 patients, reduction of 35% with a minimum of 6 months exposure to program
For initial cohorts of 222 patients, reduction of 34% with a minimum of 6 months exposure to program.
Program is currently developing a propensity-matched comparison group. Also planning to look at impact on total primary care clinical utilization trends.
HENNEPIN
COUNTY
MEDICAL
CENTER
6 months and 1 year pre-post
-59% after 6 months
- 12% after 6 months
- 50% after 6 months
After 1 year, total charges fell 23%, a drop of $25,000 per patient
BOEING IOCP 12 months -28%
20% reduction from baseline, net savings; not statistically significant
CHICAGO
HOUSING FIRST RCT - 200 in each group (18 mths)
-29% - 29% - 24% Not calculated
SEATTLE
HOUSING FIRST
1 year pre-post
Cost drop of 76% for housed individuals. Those on waiting list had cost drop of 42%. 41% lower Medicaid costs after 1 year of supportive housing.
Net savings of $2,450 per person who received housing. Program was very small, so data are not conclusive.
CAMDEN
COALITION No data yet; planning an RCT for 2014.
ATLANTIC CITY
SPECIAL CARE
CENTER
Compared SCC with non-SCC patients for 1 year pre-post
-24%
- 30% pre-post; not compared
with control group
- 22% pre-post; not a comparison with
control group
Net cost savings of 18% compared with comparison group. Not statistically significant due to inadequate sample size (p = .24).
H-PACT No data yet STANFORD No data yet CAREMORE
Compared CareMore with Medicare costs for similar patients
30-day re-admissions 13.6% compared with 20% for Medicare
PMPM total health care costs $2,250 for CareMore compared with $3,500 for Medicare. Risk adjusted total per capita health spending 15% below national average.
NYC HHC No data yet
Strategies to Reduce Costs and Improve Care for High-Utilizing Medicaid Patients: Reflections on Pioneering Programs 7

Conclusion
This is a preliminary exploration of programs for high-utilizing Medicaid beneficiaries. While on the surface, the programs reviewed look very different, all share a common set of high-touch, highly focused care management principles. Much still needs to be done to fully understand how to best structure care approaches for this population. Nonetheless, the programs reviewed offer valuable insights into how to improve care and stem excessive spending for Medicaid’s highest-cost subsets.
Strategies to Reduce Costs and Improve Care for High-Utilizing Medicaid Patients: Reflections on Pioneering Programs 8

Appendix: Characteristics of High-Utilizer Programs
Strategies to Reduce Costs and Improve Care for High-Utilizing Medicaid Patients: Reflections on Pioneering Programs 9
P ROGRAM California Frequent Users Initiative, Santa Clara County
O RGANIZATION 5Silicon Valley Health Coalition, including multiple Santa Clara County stakeholders, 2003-2007.
P OPULATION
53% minority, 63% age 40-59, 60% male, 13% married. 63% mental illness, 62% substance abuse, 96% chronic diseases, 45% homeless. 15% 1 condition, 34% 2 conditions, 28% 3 conditions, 22% 4-5 conditions. Mostly Medi-Cal or uninsured. Patients had 8+ ED visits in 12 months. Patients were recruited to the program from the ED.
M ODEL ED-based model with outreach/home visits, housing services and attempt to link with primary care within the community clinic system.
T EAM 1 Project Director; 1 LCSW Case Manager Supervisor; 4 Case Managers; 1 MSW Intern; 0.125 time Med Director; 0.125 time Psychiatrist.
C ASELOAD 25 clients, but varies with intensity level.
24/7 ? No
CARE
MANAGEMENT
A PPROACH
h program for the homeless.
management, disability assessments, and consultation.
Case managers with office space at each hospital, not co-located in ED. Partnership wit Access to vouchers for permanent housing through partnerships with housing agency. Ongoing case management for housed clients to minimize loss to follow up. Small incentives to enhance recruitment (phone cards, grocery vouchers, bus tokens
uchers, home visits). Program staff attended client appointments.
).
cuss clinical issues. Program staff or partner provided benefits advocacy for clients.
Transportation assistance (bus passes, taxi vo
Multidisciplinary team met regularly in “case conferences” to dis
Direct access to a psychiatrist for medication Teach clients how to navigate health system.
GRADUATION m to balance caseload acuity and transition clients to less intensive services: Average time in program 11 months. Program used “tiered” Level 1: very frequent contact;
syste
Level 2: less frequent contact, initiated by program; Level 3: stable, less frequent contact, initiated by patient; and Level 4: discharge (graduation).
MEASURES
, hospital days, and inpatient charges 1 year pre-post for homeless clients connected to permanent housing vs. 25% increase for clients d to permanent housing.
The costs of impl
voucher.
40% with substance abuse connected to substance abuse services.
Cost/Utilization (among enrollees): 22% decrease in median ED visits per client 1 year pre-post (median visits per client went from 9 to 7). 35% decrease in median ED charges per client ($1,200) 1 year pre-post (went from $3,400 to $2,200). 30% decrease in mean ED visits and ED charges 1 year pre-post for homeless
permanent housing. clients connec ed
14% decrease inpatient admits per client 1 year pre-post (went from 3.61 to 3.11).
t to permanent housing vs. 10% decrease for clients not connected to
25% decrease in mean inpatient days per client per year (went from 13 to 9.7 days per client per year). 25% decrease in mean inpatient admits
15% decrease in mean inpatient charges per client 1 year pre-post (went from $116,000 to $99,000).
not connecte
ementing the program are not available.
Process/Outcome:
47% of homeless clients connected to permanent housing or HUD
25% of clients without SSI received SSI. 30% of uninsured placed on Medi-Cal.
35% of clients assigned a PCP, 81% attended clinic appointments. 47% with mental health connected to mental health services.

Strategies to Reduce Costs and Improve Care for High-Utilizing Medicaid Patients: Reflections on Pioneering Programs 10

Strategies to Reduce Costs and Improve Care for High-Utilizing Medicaid Patients: Reflections on Pioneering Programs 11
PROGRAM Community Care of North Carolina (CCNC)ORGANIZATION and
The program has been in existence since 1998.6, 7 , 8 , 9 , 10 Community Care of North Carolina is a non-profit comprised of 14 community networks, run by physicians and case managers, covering the entire state. It was created by, ontracts with, NC’s Dept of Health and Human Services (Medicaid program). c
POPULATION e care
lation.
al
e who have spent more time in the hospital
CCNC covers 1.3 of 1.5 million Medicaid patients in NC. The only Medicaid recipients not required to be in the program are pregnant women, foster children, and dual eligibles. It is not only a program for high utilizers, but the program risk-stratifies the patients by severity of illness and past utilization, with higher risk patients receiving more intensmanagement. CCNC has a methodology to risk-score its popu About 286,000 CCNC enrollees are from the Aged, Blind and Disabled (ABD) category. About 72% of the CCNC population are children whose risk scores tend to be low compared with ABD patients. Currently the average risk score is increasing, showing that CCNC is enrolling sicker patients. For the adult CCNC population, a majority have significant chronic illness, with 37% having 3 or more chronic conditions. The most common are hypertension (40%) and mentillness (34%), followed by diabetes (20%) and COPD (11%). Priority populations: Inpatients who need transitional care; High-risk/high-cost patients are the priority of CCNC, based on a risk-adjustment methodology that prioritizes peopl
(admit/ED/readmit) than expected given their clinical risk group; Patients referred by providers or ED; and Chronic pain or palliative care patients.
MODEL Mixed primary care/transitional care model. Care managers are embedded in large-volume hospitals to coordinate discharges. 14 regional hubs (networks) house the care management teams, led by RNs, who go from practice to practice in their region to assist those practices with both complex and less complex patients with chronic illness. There is a centralized call center. Primary care practices are incentivized to participate by receiving a PMPM payment of $2.50 - $5 in addition to receiving the assistance of the care managers. The regional networks, which are part of the non-profit Medicaid contractor, include the care management team, local PCPs, a local hospital, the local Department of Social Services (DSS) and the local health department. Some doctors’ offices have their own care managers on staff, but most depend on the network’s care managers. In smaller practices, a network care manager may be shared among several practices, while some larger practices may have full-time on-site care managers.
TEAM nals); A pharmacist in each network;
maste social wo Many ne on-lic c n t du Networks d non-clinical pe provide ad g. g patients fo ents and ensuring t w-up visits to specialists are kept).
Care managers (RNs, MSWs, and paraprofessio A part-time psychiatrist in each network; A rs level behavioral
tworks have hired nrker in each network;
ensed staff to support the are managers iministrative help (e.
heir outreach and e cation efforts; and r appointm have hire rsonnel to , remindin hat follo
CASELOAD 5 r care ny one time. For yo dults and child nel size is 8 - per care manage 2% need care mana nt. For ABD panel size is 3-are manager and 5% need care man ent.
0-75 pe manager at a ung a ren, pa 10,000 r; about geme5,000 per c agem
24/7? ailab /7 as a requirement o icipation, but c nagers ar ble 24/7. PCPs must be av le 24 f part are ma e not availa
CARE
MANAGEMENT
APPROACH
ents of care management:
sive assessment: Identify patients through direct referrals, by mining administrative claims data (risk stratification tools, frequent hospital and emergency room admissions), through screenings and assessments, and through chart reviews that identify gaps in care.
ng an individualized care plan: The health care team — including the care manager, primary care provider, patient and family/caregiver — agree on goals in plan. Care coordination: The care manager ensures the patient’s care plan is implemented, communicating and coordinating across providers and delivery settings.
Reass Hospital-ba in engagement with patients and families preparing them for discharge. They ensure that patients
ave a timely outpatient follow-up to re-link patients with the primary care provider and/or specialist quickly after discharge. Discharged patients are referred to regional network The goal for high-risk discharged patients is that they receive a home visit within 3 days of discharge and care managers also help the patients
y provide medication reconciliation and medication education. Families and patients are taught red flags how to avoid readmission to the hospital.
Medication reconciliation is viewed as one of the most important care management functions for high-risk patients. Preferably this is a face-to-face/home-visit type interaction. RNs are trained in medication management, which includes medication reconciliation between hospital, home, provider(s), and retail pharmacy medication lists for the patient. Medication management is tracked in an automated system and providers receive feedback and communication regarding results and potential medication discrepancies that could result in repeat hospitalization and morbidity.
Compon
Patient identification and comprehen
Developi
essment and monitoring: Monitor the patient’s progress toward goal achievement on an ongoing basis, adjusting care plans as needed.
sed care managers visit patients at the bedside when possible – beghcare managers after discharge.schedule and get transportation to follow-up ambulatory visits. Therelated to worsening of their condition, when to call the PCP, and

Strategies to Reduce Costs and Improve Care for High-Utilizing Medicaid Patients: Reflections on Pioneering Programs 12
PROGRAM Community Care of North Carolina (CCNC) Network care managers are responsible for helping physician practices identify patients with high-risk conditions or needs, assisting providers with disease management education and follow-up, helping patients coordinate their care or access needed services, and collecting performance data. Arrangements are made with hospitals to find out which ABD patients have been in hospital or ED in order to institute intensive care management. Network care managers do home visits to observe patients and use of medications at home. For complex patients, home visits may be done by NPs.
re managers prepare patients for follow-up visits, coaching them to develop a list of questions in
All care managers are trained in motivational interviewing. Patients are given a self-management notebook to facilitate communication with PCP and other community providers. Care managers have telephone, home visit, and face-to-face clinic encounters with patients for med management, reminders, navigation. Care managers refer patients to community agencies: DSS, mental health, school nurses, etc. Care managers provide timely information to the PCP about the hospitalization, social and environmental concerns about the involvement of other services and providers. They communicate with PCP on patient goals, plans, education, adherence. Caadvance, to gather their medications, and to bring their personal health record. Primary care practices are encouraged to integrate behavioral health into their practices
GRADUATION plex chronic medical conditions who receive transitional care support after a hospital discharge, 66%, 49%, and 31% of patients were still
CCNC graduates patients once needs are being met, but duration and intensity of care management varies according to the needs of the patient. For example, in a recent analysis of over 13,000 patients with comreceiving some level of contact with a care manager at 1 month, 3 months, and 6 months post-discharge, respectively.
MEASURES ted a savings of about 11 percent. The Mercer analysis did not use control or
n (10 percent), FY program costs.
For the ABD population (Treo Solutions report June 2012)
Mercer Government Human Services Consulting estimated in February 2009 that the Community Care program saved the state approximately $147 million in fiscal year (FY) 2007, compared to what costs would have been in that year without the program. This represencomparison groups. The Mercer savings estimates for earlier years are: FY 2006: $162 million (11 percent), FY 2005: $81 million (6 percent), FY 2004: $124 millio2003: $60 million (6 percent). For FY 2009, Mercer estimated that the program saved North Carolina Medicaid $190 million; these are net savings after subtracting Milliman, Inc. estimates $984 million in savings over 4 years (2006-2010) when comparing costs for patients enrolled in CCNC vs. patients not enrolled. CCNC risk-adjusted PMPMcosts for FY 2010 are 15% lower than the costs for non CCNC patients (all patients – children and adults), but for the ABD non-dual patients, CCNC risk-adjusted costs are only 3.3% lower than non-CCNC. These are net savings after subtracting program costs. CCNC only began to prioritize high-utilizers in 2010. The CCNC patients are sicker than the non-CCNC patients. The risk scores (complexity) for CCNC patients are increasing each year. For the ABD population with 2 chronic illnesses, CCNC patients had an ED visit rate 19% below the non-CCNC population in 2010. For ABD with one physical chronic illness and one mental health or substance abuse diagnosis, CCNC patients had an ED visit rate 21% below the non-CCNC population in 2010.
CCNC inpatient admits/ 1,000 yr
Non-CCNC inpatient admits/ 1,000 yr
% difference CCNC ED visits/ 1,000 yr
Non-CCNC ED visits/ 1,000 yr
% difference
2007 303 459 -34% 1,090 1,224 -11% 2008 299 460 -35% 1,132 1,259 -10% 2009 302 460 -34% 1,207 1,310 -8% 2010 307 484 -37% 1,202 1,227 -10%
Process and outcome measures, 2012 Diabetes:
A1c below 8: 61% (mean national Medicaid HMO 48%) NOTE: try to line up these 3 lines; the A1c line was too far to the left BP less than 140/90: 66% (mean national Medicaid HMO 61%)
BP less than 140/90: 64% (mean national Medicaid HMO 57%)
LDL less than 100: 47% (mean national Medicaid HMO 35%) Cardiovascular Disease:
LDL less than 100: 47% (mean national Medicaid HMO 42%)
Strategies to Reduce Costs and Improve Care for High-Utilizing Medicaid Patients: Reflections on Pioneering Programs 13
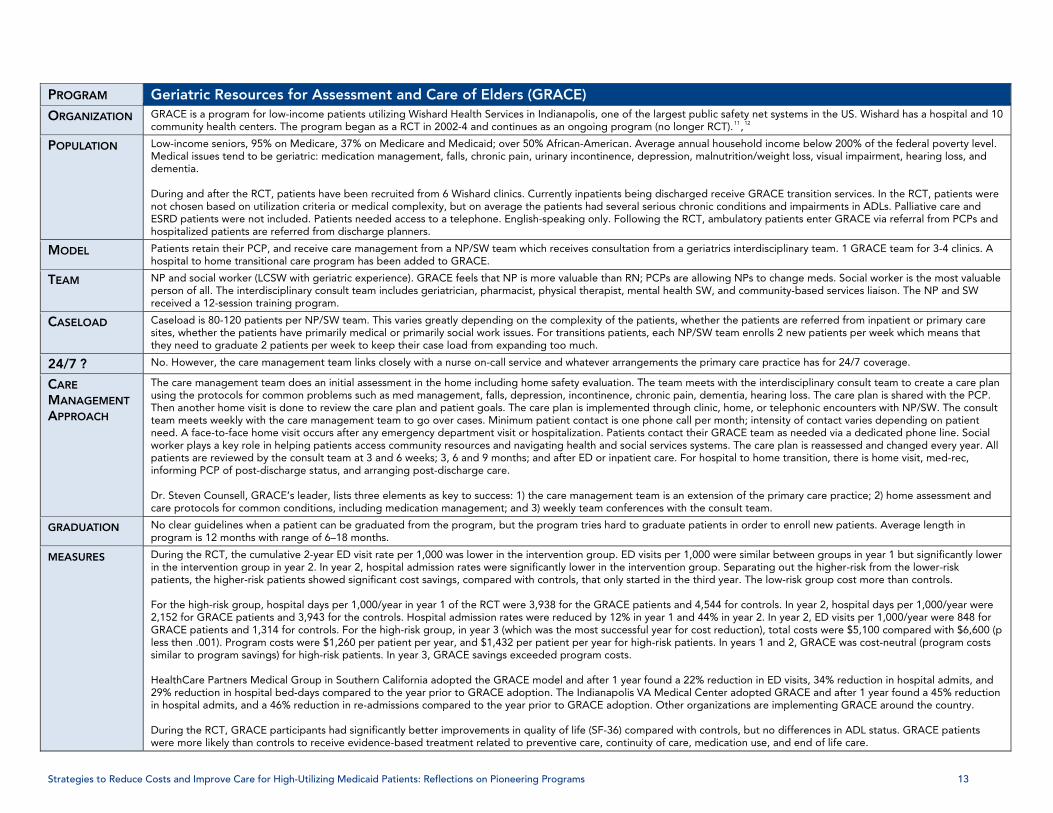
PROGRAM Geriatric Resources for Assessment and Care of Elders (GRACE) ORGANIZATION GRACE is a program for low-income patients utilizing Wishard Health Services in Indianapolis, one of the largest public safety net systems in the US. Wishard has a hospital and 10
community health centers. The program began as a RCT in 2002-4 and continues as an ongoing program (no longer RCT).11,12
POPULATION Low-income seniors, 95% on Medicare, 37% on Medicare and Medicaid; over 50% African-American. Average annual household income below 200% of the federal poverty level. Medical issues tend to be geriatric: medication management, falls, chronic pain, urinary incontinence, depression, malnutrition/weight loss, visual impairment, hearing loss, and dementia. During and after the RCT, patients have been recruited from 6 Wishard clinics. Currnot chosen based on utilization criteria or medical complexity, but on average the patientsESRD patients were not included. Patients needed access to a telephone. English-speaki
ently inpatients being discharged receive GRACE transition services. In the RCT, patients were had several serious chronic conditions and impairments in ADLs. Palliative care and
ng only. Following the RCT, ambulatory patients enter GRACE via referral from PCPs and hospitalized patients are referred from discharge planners.
MODEL atients retain their PCP, and receive care management from a NP/SW team which receives consultation from a geriatrics interdisciplinary team. 1 GRACE team for 3-4 clinics. A Phospital to home transitional care program has been added to GRACE.
TEAM is more valuable than RN; PCPs are allowing NPs to change meds. Social worker is the most valuable NP and social worker (LCSW with geriatric experience). GRACE feels that NPperson of all. The interdisciplinary consult team includes geriatrician, pharmacist, physical therapist, mental health SW, and community-based services liaison. The NP and SW received a 12-session training program.
CASELOAD Caseload is 80-120 patients per NP/SW team. This varies greatly depending on the complexity of the patients, whether the patients are referred from inpatient or primary care sites, whether the patients have primarily medical or primarily social work issues. For transitions patients, each NP/SW team enrolls 2 new patients per week which means that they need to graduate 2 patients per week to keep their case load from expanding too much.
24/7 ? No. However, the care management team links closely with a nurse on-call service and whatever arrangements the primary care practice has for 24/7 coverage.
CARE
MANAGEMENT
APPROACH eam to go over cases. Minimum patient contact is one phone call per month; intensity of contact varies depending on patient need. A face-to-face home visit occurs after any emergency department visit or hospitalization. Patients contact their GRACE team as needed via a dedicated phone line. Social
year. All e transition, there is home visit, med-rec,
forming PCP of post-discharge status, and arranging post-discharge care.
The care management team does an initial assessment in the home including home safety evaluation. The team meets with the interdisciplinary consult team to create a care plan using the protocols for common problems such as med management, falls, depression, incontinence, chronic pain, dementia, hearing loss. The care plan is shared with the PCP. Then another home visit is done to review the care plan and patient goals. The care plan is implemented through clinic, home, or telephonic encounters with NP/SW. The consult team meets weekly with the care management t
worker plays a key role in helping patients access community resources and navigating health and social services systems. The care plan is reassessed and changed every patients are reviewed by the consult team at 3 and 6 weeks; 3, 6 and 9 months; and after ED or inpatient care. For hospital to homin Dr. Steven Counsell, GRACE’s leader, lists three elements as key to success: 1) the care management team is an extension of the primary care practice; 2) home assessment andcare protocols for common conditions, including medication management; and 3) weekly team conferences with the consult team.
GRADUATION No clear guidelines when a patient can be graduated from the program, but the program tries hard to graduate patients in order to enroll new patients. Average length in program is 12 months with range of 6–18 months.
MEASURES During the RCT, the cumulative 2-year ED visit rate per 1,000 was lower in the intervention group. ED visits per 1,000 were similar between groups in year 1 but significantly lower e intervention group in year 2. In year 2, hospital admission rates were significantly lower in the intervention group. Separating out the higher-risk from the lower-risk
patients, the higher-risk patients showed significant cost savings, compared with controls, that only started in the third year. The low-risk group cost more than controls.
patients and 4,544 for controls. In year 2, hospital days per 1,000/year were ,152 for GRACE patients and 3,943 for the controls. Hospital admission rates were reduced by 12% in year 1 and 44% in year 2. In year 2, ED visits per 1,000/year were 848 for
ith $6,600 (p
n untry.
(SF-36) compared with controls, but no differences in ADL status. GRACE patients d treatment related to preventive care, continuity of care, medication use, and end of life care.
in th
For the high-risk group, hospital days per 1,000/year in year 1 of the RCT were 3,938 for the GRACE 2GRACE patients and 1,314 for controls. For the high-risk group, in year 3 (which was the most successful year for cost reduction), total costs were $5,100 compared wless then .001). Program costs were $1,260 per patient per year, and $1,432 per patient per year for high-risk patients. In years 1 and 2, GRACE was cost-neutral (program costs similar to program savings) for high-risk patients. In year 3, GRACE savings exceeded program costs. HealthCare Partners Medical Group in Southern California adopted the GRACE model and after 1 year found a 22% reduction in ED visits, 34% reduction in hospital admits, and 29% reduction in hospital bed-days compared to the year prior to GRACE adoption. The Indianapolis VA Medical Center adopted GRACE and after 1 year found a 45% reductioin hospital admits, and a 46% reduction in re-admissions compared to the year prior to GRACE adoption. Other organizations are implementing GRACE around the co During the RCT, GRACE participants had significantly better improvements in quality of lifewere more likely than controls to receive evidence-base
Strategies to Reduce Costs and Improve Care for High-Utilizing Medicaid Patients: Reflections on Pioneering Programs 14
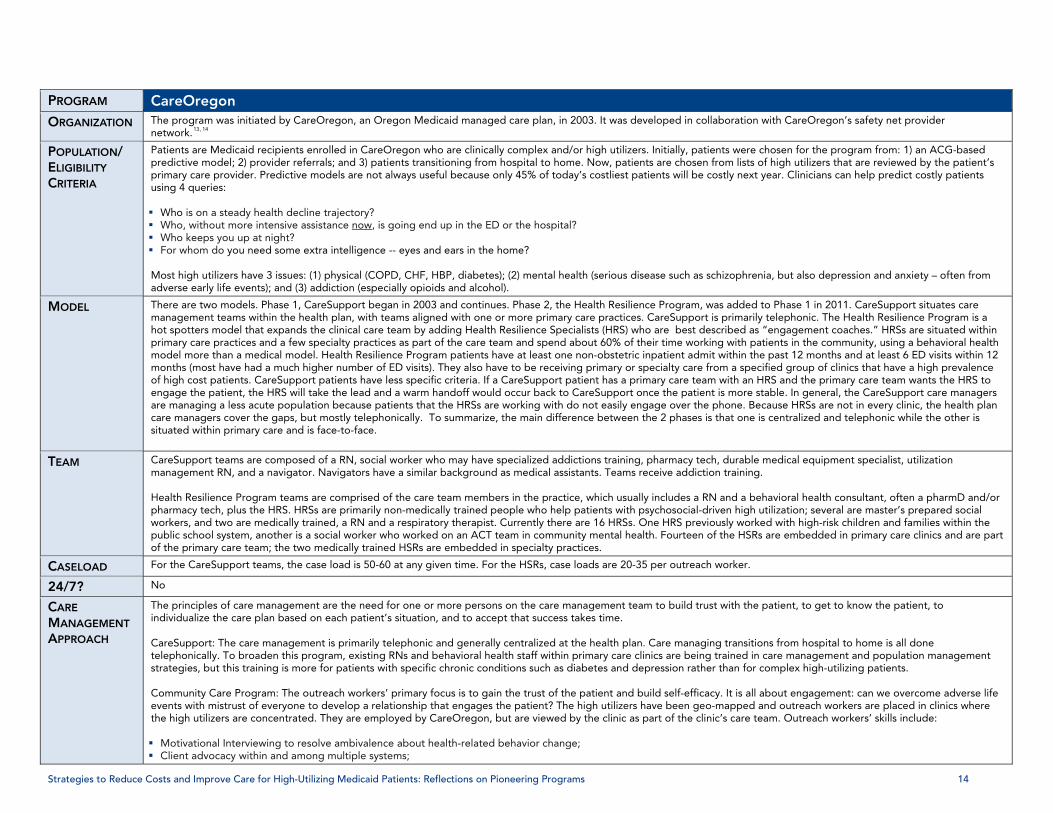
PROGRAM CareOregon ORGANIZATION s developed in collaboration with CareOregon’s safety net provider
The program was initiated by CareOregon, an Oregon Medicaid managed care plan, in 2003. It wanetwork.13, 14
POPULATION/
ELIGIBILITY
CRITERIA
complex and/or high utilizers. Initially, patients were chosen for the program from: 1) an ACG-based hospital to home. Now, patients are chosen from lists of high utilizers that are reviewed by the patient’s
use only 45% of today’s costliest patients will be costly next year. Clinicians can help predict costly patients
Patients are Medicaid recipients enrolled in CareOregon who are clinically predictive model; 2) provider referrals; and 3) patients transitioning from primary care provider. Predictive models are not always useful becausing 4 queries: Who is on a steady health decline trajectory? Who, without more intensive assistance now, is going end up in the ED or the hospital? Who keeps you up at night? For whom do you need some extra intelligence -- eyes and ears in the home? Most high utilizers have 3 issues: (1) physical (COPD, CHF, HBP, diabetes); (2) mental health (serious disease such as schizophrenia, but also depression and anxiety – often from adverse early life events); and (3) addiction (especially opioids and alcohol).
MODEL silience Program, was added to Phase 1 in 2011. CareSupport situates care
health
group of clinics that have a high prevalence
atient is more stable. In general, the CareSupport care managers re managing a less acute population because patients that the HRSs are working with do not easily engage over the phone. Because HRSs are not in every clinic, the health plan
There are two models. Phase 1, CareSupport began in 2003 and continues. Phase 2, the Health Remanagement teams within the health plan, with teams aligned with one or more primary care practices. CareSupport is primarily telephonic. The Health Resilience Program is a hot spotters model that expands the clinical care team by adding Health Resilience Specialists (HRS) who are best described as “engagement coaches.” HRSs are situated within primary care practices and a few specialty practices as part of the care team and spend about 60% of their time working with patients in the community, using a behavioral model more than a medical model. Health Resilience Program patients have at least one non-obstetric inpatient admit within the past 12 months and at least 6 ED visits within 12 months (most have had a much higher number of ED visits). They also have to be receiving primary or specialty care from a specified of high cost patients. CareSupport patients have less specific criteria. If a CareSupport patient has a primary care team with an HRS and the primary care team wants the HRS to engage the patient, the HRS will take the lead and a warm handoff would occur back to CareSupport once the pacare managers cover the gaps, but mostly telephonically. To summarize, the main difference between the 2 phases is that one is centralized and telephonic while the other is situated within primary care and is face-to-face.
TEAM CareSupport teams are composed of a RN, social worker who may have specialized addictions training, pharmacy tech, durable medical equipment specialist, utilization assistants. Teams receive addiction training.
nd/or
rt
management RN, and a navigator. Navigators have a similar background as medical Health Resilience Program teams are comprised of the care team members in the practice, which usually includes a RN and a behavioral health consultant, often a pharmD apharmacy tech, plus the HRS. HRSs are primarily non-medically trained people who help patients with psychosocial-driven high utilization; several are master’s prepared social workers, and two are medically trained, a RN and a respiratory therapist. Currently there are 16 HRSs. One HRS previously worked with high-risk children and families within thepublic school system, another is a social worker who worked on an ACT team in community mental health. Fourteen of the HSRs are embedded in primary care clinics and are paof the primary care team; the two medically trained HSRs are embedded in specialty practices.
CASELOAD For the CareSupport teams, the case load is 50-60 at any given time. For the HSRs, case loads are 20-35 per outreach worker.
24/7? No
CARE
MANAGEMENT
APPROACH
Outreach workers’ skills include:
Motivational Interviewing to resolve ambivalence about health-related behavior change;
The principles of care management are the need for one or more persons on the care management team to build trust with the patient, to get to know the patient, to individualize the care plan based on each patient’s situation, and to accept that success takes time. CareSupport: The care management is primarily telephonic and generally centralized at the health plan. Care managing transitions from hospital to home is all done telephonically. To broaden this program, existing RNs and behavioral health staff within primary care clinics are being trained in care management and population management strategies, but this training is more for patients with specific chronic conditions such as diabetes and depression rather than for complex high-utilizing patients. Community Care Program: The outreach workers’ primary focus is to gain the trust of the patient and build self-efficacy. It is all about engagement: can we overcome adverse life events with mistrust of everyone to develop a relationship that engages the patient? The high utilizers have been geo-mapped and outreach workers are placed in clinics where the high utilizers are concentrated. They are employed by CareOregon, but are viewed by the clinic as part of the clinic’s care team.
Client advocacy within and among multiple systems;

Strategies to Reduce Costs and Improve Care for High-Utilizing Medicaid Patients: Reflections on Pioneering Programs 15
PROGRAM CareOregon Role modeling advocacy and relational skills; Assistance in navigating health care system; Care coordination; Health literacy education; Self management skill development; Assistance with complex problem solving related to living in poverty with multiple health issues; Providing opportunities to identify as something other than a “patient”; Providing opportunities to experience success and feel confident; and Deep listening, acknowledgment and respect for each individual. Both programs have team rounds once each week. In CareSupport, the rounds include health plan staff, mainly the care managers and a medical director and program supervIn the Community Care Program, scheduled multidisciplinary case rounds take place each week with all outreach workers coming together at a centralized location to discuss challenging client cases. These rounds are also attended by CareOregon’s Community Care program director and manager, team supervisors, a data coordinator, psychiatrist and clinical pharmacist. ideally the client’s primary care physician would call in to the ca
isor.
se conference however without a billable payment code this has been challenging to implement. Within the clinic, the outreach workers participate in clinical huddles that often include the PCP; these can happen as often as daily. An addiction specialist also
nts. a
ocial workers are being placed within the emergency edical system to work with frequent 911 callers and in an emergency department.
participates for indicated patients. The rounds allow the care management programs to identify patients with similar issues (client typologies) that can assist with other patiePatients may be classified as green, yellow or red light patients with less or more intensive challenges and more or less potential for success. Patients are evaluated according to 7-point star: physical health; emotional and mental health; motivation and taking responsibility; drug and alcohol use; social networks and relationships; managing housing and tenancy; and self-care/living skills. Patient improvement can be tracked using the 7-point star chart. For patients not linked to primary care, two new pilot expansions of the primary/specialty model are being tested whereby sm
GRADUATION There is an attempt to graduate patients from more intense to less intense care management, and ideally to graduate them from the program entirely. Average time in the program is thought to be about 6-9 months. Some patients are released from care management because they are unable to improve.
MEASURES The early data from the CareSupport program was encouraging for reducing utilization, but without age matched controls it is difficult to say how well the program is doing. most recent pre-post evaluation found an average of $400 PMPM savings per patient enrolled in CareSupport.
The
tients is still a work in progress.
ED, hospital, and PCP utilization are being tracked for all clients enrolled in the Community Care program and trends are very promising, but because the program is so new, findings have not been aggregated across the population over time. The 7-point star is being tried as a health status outcome measure, as is a “self-sufficiency matrix.” An appropriate health status measure for complex pa
PROGRAM Hennepin County Medical Center Coordinated Care ClinicORGANIZATION The Coordinated Care Clinic is part of the Hennepin County Medical Center (HCMC), an academic medical center and public hospital in Minneapolis, Minnesota. The clinic
opened in July 2010.
POPULATION Patients with 3 or more hospital admits in the past year are approached for admission into the program at discharge. Many of the patients admitted into the Coordinated Care Clinic do not have a primary care physician. Hospital physicians and care coordinators regularly refer challenging patients to the Clinic. Eight potent factors that lead to the need or complex caref coordination have been identified: chronic pain, impaired cognition, active chemical dependency, medical non-adherence, disruptive mental health problems,
tients with coverage from other payers on a case by case basis.
unstable housing, medical complexity, and lack of community or family support. About half the patients additionally have multi-system medical problems. At present, about 18% of the patients are enrolled in Hennepin Health, a Hennepin County-run ACO that is focused on addressing the social determinants of health. The remainder of the patients have Medicaid, either directly from the state or from a Medicaid HMO. In addition, 10% are dually eligible for Medicare and Medicaid. At present, the program is focused predominantly on enrolling patients who are in Hennepin Health but accepts pa
MODEL The Coordinated Care Clinic has been certified for reimbursement through the Minnesota Medicaid Health Care Home program. The Coordinated Care Clinic is an aICU, a high-risk clinic solely for high-utilizing, complex patients. These patients receive their primary care at the Coordinated Care Clinic. The Clinic is located on the HCMC downtown
block from the ED. It is geographically separated from general medical clinic (a 3-block walk), which is the source of many of the patients. The concept is that ly complex patients should be in a separate clinic and taken out of general medical clinic where they are difficult to care for and where it is almost impossible to create a high-
functioning service for high utilizers.
campus about onehigh
TEAM Physician, nurse practitioner, licensed clinical social worker, RN coordinator, LPN, alcohol/drug counselor, behaviorist, pharmacist, and office specialist who greets the patient. The office specialist, a very special person, may be the most important person on the team, building close relationships with the patients.
Strategies to Reduce Costs and Improve Care for High-Utilizing Medicaid Patients: Reflections on Pioneering Programs 16
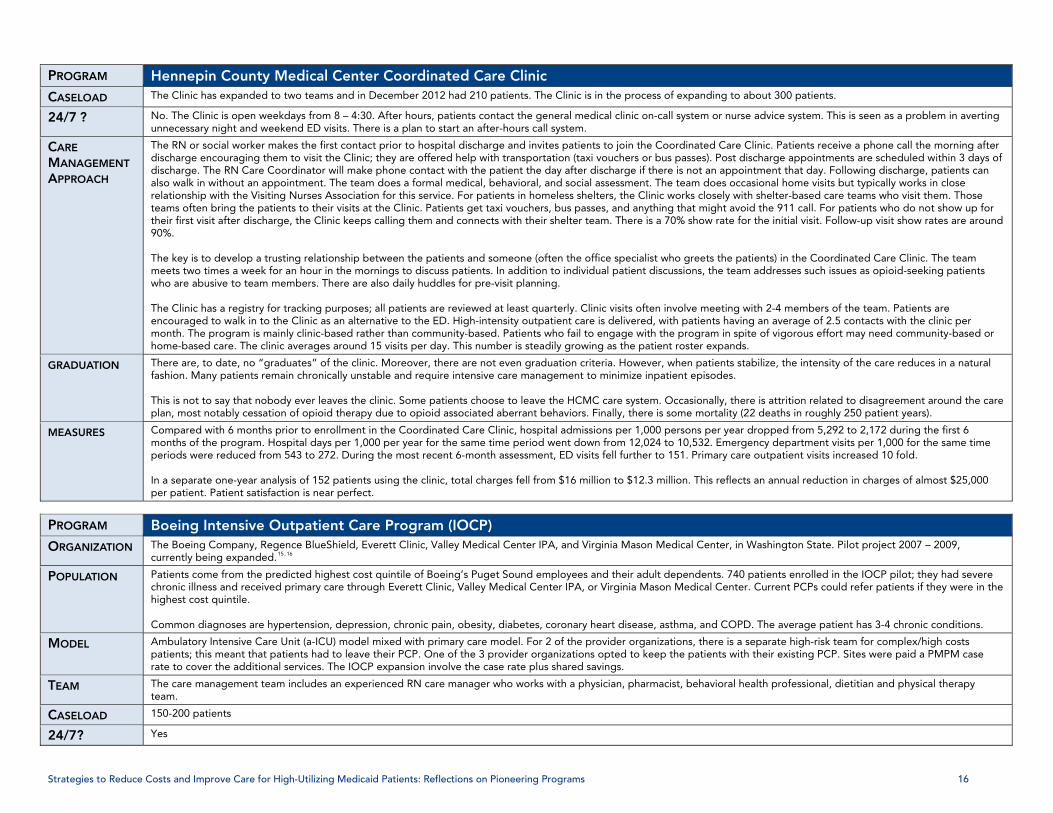
PROGRAM Hennepin County Medical Center Coordinated Care ClinicCASELOAD The Clinic has expanded to two teams and in December 2012 had 210 patients. The Clinic is in the process of expanding to about 300 patients.
24/7 ? No. The Clinic is open weekdays from 8 – 4:30. After hours, patients contact the general medical clinic on-call system or nurse advice system. This is seen as a problem in averting nnecessary night and weekend ED visits. There is a plan to start an after-hours call system. u
CARE
MANAGEMENT
APPROACH
The RN or social worker makes the first contact prior to hospital discharge and invites patients to join the Coordinated Care Clinic. Patients receive a phone call the morning afthin 3 days of tients can close
relationship with the Visiting Nurses Association for this service. For patients in homeless shelters, the Clinic works closely with shelter-based care teams who visit them. Those ams often bring the patients to their visits at the Clinic. Patie
ter ouraging them to visit the Clinic; they are offered help with transportation (taxi vouchers or bus passes). Post discharge appointments are scheduled wi
RN Care Coordinator will make phone contact with the patient the day after discharge if there is not an appointment that day. Following discharge, pa
rs, bus passes, and anything that might avoid the 911 call. For patients who do not show up for There is a 70% show rate for the initial visit. Follow-up visit show rates are around
en the office specialist who greets the patients) in the Coordinated Care Clinic. The team individual patient discussions, the team addresses such issues as opioid-seeking patients
.
all patients are reviewed at least quarterly. Clinic visits often involve meeting with 2-4 members of the team. Patients are e to the ED. High-intensity outpatient care is delivered, with patients having an average of 2.5 contacts with the clinic per
ed community-based or
discharge encdischarge. The also walk in without an appointment. The team does a formal medical, behavioral, and social assessment. The team does occasional home visits but typically works in
tetheir first visit after discharge, the Clinic
nts get tax keeps calling them and con
90%.
i vouchenects with their shelter team.
The key is to develop a trusting relationship between the patients and someone (oft
meets two times a week for an hour in the mornings to discuss patients. In addition to who are abusive to team members. There are also daily huddles for pre-visit planning
The Clinic has a registry for tracking purposes; encouraged to walk in to the Clinic as an alternativmonth. The program is mainly clinic-based rather than community-based. Patients who fail to engage with the program in spite of vigorous effort may nehome-based care. The clinic averages around 15 visits per day. This number is steadily growing as the patient roster expands.
GRADUATION There are, to date, no “graduates” of the clinic. Moreover, there are not even graduation criteria. However, when patients stabilize, the intensity of the care reduces in a natural fashion. Many patients remain chronically unstable and require intensive care management to minimize inpatient episodes. This is not to say that nobodplan, most notably cessation of o
y ever leaves the clinic. Some patients choose to leave the HCMC care system. Occasionally, there is attrition related to disagreement around the care pioid therapy due to opioid associated aberrant behaviors. Finally, there is some mortality (22 deaths in roughly 250 patient years).
MEASURES spital admissions per 1,000 persons per year dropped from 5,292 to 2,172 during the first 6 d went down from 12,024 to 10,532. Emergency department visits per 1,000 for the same time
-month assessment, ED visits fell further to 151. Primary care outpatient visits increased 10 fold.
In a separate one-year analysis of 152 patients using the clinic, total charges fell from $16 million to $12.3 million. This reflects an annual reduction in charges of almost $25,000 ent satisfaction is near perfect.
Compared with 6 months prior to enrollment in the Coordinated Care Clinic, homonths of the program. Hospital days per 1,000 per year for the same time perioperiods were reduced from 543 to 272. During the most recent 6
per patient. Pati
PROGRAM Boeing Intensive Outpatient Care Program (IOCP) ORGANIZATION
The Boeing Company, Regence BlueShield, Everett Clinic, Valley Medical Center IPA, and Virginia Mason Medical Center, in Washington State. Pilot project 2007 – 2009, currently being expanded.15, 16
POPULATION vere the
Patients come from the predicted highest cost quintile of Boeing’s Puget Sound employees and their adult dependents. 740 patients enrolled in the IOCP pilot; they had sechronic illness and received primary care through Everett Clinic, Valley Medical Center IPA, or Virginia Mason Medical Center. Current PCPs could refer patients if they were in highest cost quintile. Common diagnoses are hypertension, depression, chronic pain, obesity, diabetes, coronary heart disease, asthma, and COPD. The average patient has 3-4 chronic conditions.
MODEL PM case
Ambulatory Intensive Care Unit (a-ICU) model mixed with primary care model. For of 2 the provider organizations, there is a separate high-risk team for complex/high costs meant that patients had to leave their PCP. One of the 3 provider organizations opted to keep the patients with their existing PCP. Sites were paid a PM
r the additional services. The IOCP expansion involve the case rate plus shared savings. patients; thisrate to cove
TEAM The care management team includes an experienced RN care manager who works with a physician, pharmacist, behavioral health professional, dietitian and physical therapy team.
CASELOAD 150-200 patients
24/7? Yes

Strategies to Reduce Costs and Improve Care for High-Utilizing Medicaid Patients: Reflections on Pioneering Programs 17
PROGRAM Boeing Intensive Outpatient Care Program (IOCP) CARE
MANAGEMENT
APPROACH
All patients are provided with an RN care manager (health coach). The RN has motivational interviewing skills. At the two aICU sites, a physician working in the aICU is part of the t and the care team to set priorities, goals, and concrete plans. The care plan is implemented,
mainly by the RN care manager, through in-person, telephonic, and e-mail contacts. Patients are risk-stratified and intensity of care is based on risk. They are contacted according team. An assessment is one and a shared care plan is developed between the patien
to need, at least once a month; they receive self-management support (health coaching) for their chronic conditions. Timely notification of ED visits and hospital admissions to the care management team is essential. Daily team planning sessions including direct involvement of specialists.
GRADUATION Do not know
MEASU ES After 12 mont s, the first 276 patients in the pilot were matched with Boeing employees in the predicted high-cost quintile who did not participate in the program. costs of IOCP participants vs. control group: 20% decrease from baseline. This was a net savings: reduced health care costs minus the cost of the program. The e from lower ED visits and hospital admissions. missions: 28% decrease.
ange in SF-12 physical functioning compared with baseline: 15%.
R h• Health care
savings cam• Hospital ad• Ch• Improvement in mental functioning: 16%. • Participants feeling that care was “received as soon as needed”: 17.6% increase. • Average number of patient-reported workdays missed, 6 months -56.5% decrease.
PROGRAM Chicago Housing First Program ORGANIZATION RCT at a public teaching hospital and a private nonprofit hospital in Chicago. Operated from 2003 to 2007 at 2 respite sites and 10 housing agencies.17
POPULATION
d an initial hospital admission that made them eligible for the study. Patients were ineligible if their hospital physician judged them incapable of self- care on hospital discharge.
Patients were randomized to two groups, 200 patients in the intervention group and 200 in the control group. 37% Medicaid, 8% Medicare, 55% uninsured. 36% HIV positive, 60% substance users. 27% of participants lived on the streets, 43% stayed in shelters, and 50% were temporarily staying with family or friends. Median duration of homelessness 30 months. 78% men, 78% African-American. Patients lack stable housing, have been hospitalized at least once, and have 1 or more chronic medical illnesses. Both usual care and intervention patients ha
MODEL Housing first and social work case management at the housing site. It was not a primary care or aICU model. It was not a medical model at all. There was no medical intervention, though the case managers did provide care coordination to medical facilities.
TEAM The case managers had master’s-level training in social work.
CASELOAD 20 or fewer active patients
24/7 ? Do not know
CARE
MANAGEMENT
APPROACH his was not a pure housing intervention; it was housing plus case management. The case management was provided in hospitals, respite care centers and stable and unstable
, with his or her on-site case manager. The intervention case managers had weekly team
Participants randomized to the intervention group received case management services from the on-site intervention social worker, including plans for discharge to a respite care facility for transitional care between hospitalization and stable housing.
Thousing sites. The housing was transitional following hospital discharge followed by placement in long-term housing. Case management was offered at the transitional and longterm housing sites. The initial case management was provided by a hospital-based social worker who referred the intervention patients to transitional housing. Respite and housing case managers facilitated the participant’s housing placement and coordinated appropriate medical care, with substance abuse and mental health treatment referralscoordinated as needed. Each intervention participant had contact, at least biweeklymeetings to coordinate the housing, social service, and medical care needs of participants.The housing intervention was based on the Housing First model, which encourages
arly placement in stable housing following a short transitional stay in respite care after hospitalization. The stable housing options were provided by 10 community agencies eoffering group living arrangements as well as apartments at single and scattered sites.
GRADUATION Not known
MEASURES p (11.44 days/person/year) P = .07.
oup (2.61 visits/person/year) and 1,154 in usual care group (3.77 visits/person/year). P = .06 fter adjusting for baseline covariates, hospital admissions in intervention group were lower by 29% (P = .005), hospital days were lower by 29% (P = .01) and ED visits were
• Over 18 months there were 583 hospital admissions in intervention group, (1.93 per person per year) and 743 in usual care group (2.43 per person per year) P = .16. • Over 18 months, 2,635 hospital days in intervention group (8.74 days/person/year) and 3,500 in usual care grou• Over 18 months, 787 ED visits in intervention gr• A

Strategies to Reduce Costs and Improve Care for High-Utilizing Medicaid Patients: Reflections on Pioneering Programs 18
PROGRAM Chicago Housing First Program lower by 24% (P = .03).
Physical functioning scores and mental health scores were not statistically different between the 2 groups. There was no difference in mortality between the two groups.
PROGRAM Seattle Housing First Program
ORGANIZATION Seattle Downtown Emergency Services Center. A study was done from 2005 – 2007.18,19
POPULATION articipants were drawn from a list of chronically homeless individuals who incurred the highest costs in 2004 for alcohol-related emergency services. In the past, homeless
.
Palcoholic patients were offered housing only if they were sober. In this program, these patients were offered housing whether or not they were sober. Many continued to drink after receiving the housing. 81 were provided with housing and 53 were wait-listed (no more housing units available) and served as a comparison group. 94% were male with mean age of 48 years. 39% white, 28% American Indian/Alaska Native, 10% African-American
MODEL Housing first, and case management at the housing site
TEAM kers Social wor
CASELOAD Do not know
24/7 ? Yes
CARE
MANAGEMENT
APPROACH
nts The patients were offered individual housing units in a new facility at 1811 Eastlake. The facility had a 24-hour staff of social workers and other clinicians. The staff helped residewith medical and social services and worked with them to address behavioral issues.
GRADUATION Do not know
MEASURES Costs were compared between 95 individuals living at 1811 Eastlake and 39 individuals on the wait list for 1811 Eastlake, between November 2005 and 2007. Median costs for the housed individuals decreased from $4,066 per month to $1,492 per month after 6 months at Eastlake, dropping to $958 after 12 months. Wait-listed individuals also had a
h to $1,932 after 6 months. Housed individual costs dropped significantly more than wait-listed individuals’ costs. After factoring er month), there was a savings of $2,449 per month per person in the program. Costs continued to fall with more time in housing.
mber of alcoholic drinks per day. The Seattle Eastlake project reported 41 percent lower Medicaid costs for residents after one
substantial cost reduction, from $3,318 per montin the costs of the program ($1,120 per person pAlso, housed individuals had a 30% reduction in nuyear of supportive housing.
�
PROGRAM Camden Coalition of Health Care Providers
ORGANIZATION ze nts, and the Coalition,
In 2002, a small group of Camden, New Jersey primary care providers formed the Camden Coalition of Healthcare Providers. The Coalition compiled a database to analyhospital utilization and found that in one year, nearly half of the city’s residents utilized an ED or hospital. 80% of the costs were spent on 13% of the patieled by family physician Jeff Brenner, started a program, which is very active today, to improve the care and reduce the costs of high-utilizing patients.20 , 21
POPULATION In 2007, Dr. Brenner held a meeting with a few social workers and emergency-room doctors from hospitals around the city. He showed them the cost statistics and use patterns of
lizations. The primary target population is Camden esidents with two or more inpatient admissions in the last six months. Additional targeting criteria include two or more chronic-disease-related admissions and polypharmacy.
the most expensive one percent. 900 people in two buildings accounted for more than four thousand hospital visits and about two hundred million dollars in health care bills over six years. Patients are identified for the program using a Health Information Exchange that can deliver daily information about hospitarPatients are not accepted if they have a pregnancy-related admission, oncology-related admission, psychiatric primary diagnosis without chronic disease, post-surgical acute condition, and diagnosis of a progressive disease for which there is no treatment.
MODEL nagement teams doing home visits, reaching out to homeless patients on the street, and helping patients access primary care. This is a community-based model, with care ma
TEAM e
y of the care management team members have grown up or currently live in Camden. Their main function is to assist clients to navigate the
Each care management team consists of two licensed practical nurses (LPN), a community health worker (CHW), and two AmeriCorps volunteer health coaches. In addition, theris a registered nurse (RN) who provides clinical support to the teams and social work support provided by a master’s level social worker and an intervention specialist who is solely ocused on housing barriers. Manf

Strategies to Reduce Costs and Improve Care for High-Utilizing Medicaid Patients: Reflections on Pioneering Programs 19
PROGRAM Camden Coalition of Health Care Providers
system on their own. They also accompany patients to visits until such time as the patients can do so on their own.
CASELOAD 20-34 active patients per care management team
24/7 ? No
CARE
MANAGEMENT
APPROACH
e behavior. Half we can build a relationship with. Half we can’t.” In general, care is provided wherever the patients are.
e beginning stage of the program, the goal of the Care
nts, and coordinates care. The goal is to eventually empower the patient to handle his or her own health care needs.
rs social support. The social worker may also help a patient obtain Social Security disability, food support and
team
Dr. Brenner: “High-utilizer work is about building relationships with people who are in crisis. The ones you build a relationship with, you can chang
Once a patient is identified, a member of the team visits him or her in the hospital to enroll him or her in the program. In thManagement Team is to identify the medical and/or social needs of the patient. The team can perform a range of interventions based on the individual needs of each patient. When the patient’s medical needs are determined, the team works to help connect the patient to their primary care doctor and make an initial appointment within seven days of the patient’s discharge from the hospital. The team provides transportation, accompanies the patient to appointme
Home and community-based visits are a central part of the program. Team members assess the home situation, address safety or environmental concerns, conduct medication reconciliation and troubleshoot medication/adherence issues. The flexibility of care management team staffing structure ensures the right mix of people to address a variety of medical and social needs in addition to building trust and rapport with enrolled participants.
In addition to medical support, the Care Management Team offehousing. Care Management Teams meet each day to review every patient’s needs and goals. When a patient is first enrolled, the team visits the patient each week and attends his or her medical appointments. This provides much-needed social support, and gives the team time to completely understand the patient’s medical needs and forge a relationship between the patient and his or her primary care physician. When a patient is medically and socially stable—ideally within six to eight weeks— the nursing members of the transition the patient to a health coach or community health worker, who provides ongoing support and guidance. http://www.camdenhealth.org/what-does-health-coaching-entail/
GRADUATION The attempt is to increase patients’ ability to self-manage. Patients can graduate from the program is they are able to handle their own health care needs.
MEASURES Currently planning an RCT for 2014.
��PROGRAM Atlantic City Special Care Center ORGANIZATION The AtlantiCare hospital system, started in 2007.22, 23
POPULATION atients are low-income union members, working in the Atlantic City casinos, with chronic diseases and in the top 10% of predicted health spending. The chronic conditions The ptended to be diabetes, hypertension, coronary heart disease, COPD, CHF, and depression. As of 2010, the Special Care Center (SCC) served 1,200 patients.
MODEL This is an aICU model with patients leaving their PCPs to receive all their care at the Special Care Center. Payment was changed from fee-for-service to capitation, allowing for a radically different team composition.
TEAM who are mostly medical assistants and licensed and linguistically concordant with the patients. Almost all the coaches speak English plus either Gujarati, Hindi, Spanish, French Creole,
rtuguese. The coaches are hired for their caring attitude and receive virtually all their training after being hired by the SCC.
2 physicians, 2 nurse practitioners, part-time psychiatrist, part-time pharmacist, a RN, a social worker, and 8 health coaches,practical nurses (LPNs), culturally Vietnamese, Cantonese or Po
CASELOAD In 2008 the entire a-ICU was caring for 800 patients. Much of the care is provided by the health coaches, who each managed a panel of 80-150 patients.
24/7 ? Yes. A key concept has been to change the patients’ habit of dialing 911 if they had a problem by having the health coach program patients’ cell phones to speed dial the SCC’s 24-hour hotline.
CARE
MANAGEMENT
APPROACH
New patients take part in a welcome visit where they meet with a physician and a health coach for an initial examination and orientation and to create a shared care plan. The health coach collects the bulk of the patient history including medication list and stays in the entire visit with the physician. Each day starts with a team huddle where the team discusses medical and psycho-social issues. In 45 minutes, the staff does a run-through of everyone’s patients, reviewing the

Strategies to Reduce Costs and Improve Care for High-Utilizing Medicaid Patients: Reflections on Pioneering Programs 20
PROGRAM Atlantic City Special Care Center requests that patients make by e-mail or telephoreviewing lab tests, and addressing problems.
ne, the plans for the ones who have appointments that day, planning follow-up phone calls for patients with acute issues,
done as needed; coaches hone or e-mail patients.
Health coaches are responsible for implementing the care plan, meeting independently with patients, attending physician visits, helping patients to set goals and manage their own care, monitoring patients’ ability to adhere to their plan, and helping them to overcome barriers to meeting their health goals. Home visits arep The aICU team is co-located in a single open space.
GRADUATION Do not know
MEASURES
ys declined by 30%, length of stay by 8%, admissions by 24%, readmissions within 30 days of discharge by 80%, and ED visits by 22% in the year after enrollment
milar control group, SCC patients had 41% lower inpatient admissions, and 48% lower ED visits. Net spending (savings minus
months in the program. The proportion of diabetes patients with A1c > 9 dropped from 20 to 12%; those with A1c less than 7 rose from 41 to 53%. Prescription
For the year prior to enrollment in the SCC, total health care spending for patients enrolled in the SCC rose 31%; this dropped to a 4% annual growth rate in the year after enrollment, which compared with a 12% increase for a similar non-SCC population. Compared to the comparison group, total cost per patient dropped by 25%. This did not factor in the costs of the program which is higher than usual primary care due to the elaborated team. In addition, pharmacy costs were higher. Inpatient dacompared with the year before enrollment. The average cost was 15% less than for the comparison group of non-enrollees. For 447 patients enrolled in 2009, relative to the sicost of the program) was $208 per month per enrollee lower than controls, a 12% reduction in total spending. Patient satisfaction increased from 50-60% before entering the SCC to over 90% after. After 6 months, the % of patients with hypertension control went from 58% to 82% with an average systolic blood pressure drop of 26 points. Patients with LDL cholesterol above 160 saw an average 50 point drop. 63 percent of smokers with heart and lung disease quit smoking after 6 fill rates (medication adherence) averaged 98% compared with the community-wide average of 70-80%.
�PROGRAM West Los Angeles VA Homeless PACT Team ORGANIZATION d Care Teams). On April 30, 2012, the West Los Angeles VA opened its Homeless PACT (HPACT) clinic (PACT is the national VA system’s primary care team model: Patient-Aligne
POPULATION The West Los Angeles HPACT team sees extremely complex patients. Complex chronic care can be viewed as congestive heart failure, diabetes, hypertension, and depression
pain, hepatitis C, depression, alcoholism, and tobacco use.
within one patient. This view of complexity needs to be extended in the case of homeless veterans. Many have several of the above conditions plus the triple whammy of homelessness, serious mental illness, and substance abuse – a combination that requires far more time and effort. The average number of diagnoses addressed per visit is 6.3. Themost common diagnoses for the initial 120 patients are homelessness or precarious housing, hypertension, chronic The HPACT team clinic is right next to the emergency department. Homeless or precariously housed patients coming to the ED who do not have a serious acute problem are walked over to the clinic during the hours when it is open. The main criterion for enrolling is homelessness/precarious housing rather than other diagnoses/high utilization.
MODEL This is an aICU model, with the goal of enrolling patients to leave their primary care team (if they have one) and remain for their total care in this clinic for high-utilizing homeless patients.
TEAM rimary care physician, front desk scheduler/clerk, RN, and LVN. A social worker nearly is available to see patients, but is not full-time on the team. P
CASELOAD The clinic plans to care for 200 patients at any one point in time.
24/7 ? o N
CARE
MANAGEMENT
APPROACH
n and social worker involvement) so that many issues can be handled in one visit. The team is co-located in one space so that y
As an aICU, this HPACT team provides total primary care for its patients, and also provides referral to housing, social service, substance/alcohol services. Visits are at least one our (often 2 hours including nursing and physiciah
there is constant discussion about each patient among the team. The team does not offer services when the clinic is not open, but interacts with other services in the same facilitincluding a housing assistance unit. After the patient visit the entire team meets with the patient to discuss the care plan.
GRADUATION is too early in the program to know.It
MEASURES It is too early for measures.

Strategies to Reduce Costs and Improve Care for High-Utilizing Medicaid Patients: Reflections on Pioneering Programs 21
PROGRAM Stanford Coordinated Care ProgramORGANIZATION Stanford University; program opened May 2012.
POPULATION This is a program for Stanford University employees and their dependents with multiple chronic health conditions. Patients are chosen in one of 4 ways: (1) referral from physicians or practice managers; (2) self-referral; (3) high-utilizing patients based on the predictive model designed by Milliman (most predictive models are only ~30% predictive of future high-utilization); or (4) patients with 5 or more chronic medications, 3 or more specialists, 2 ED visits in a year, or one hospital admission in a year.
re common diagnoses, but many patients have complex, single conditions that are either difficult to diagnose (e.g., connective tissue or neurologic isorders) or present major obstacles to living a healthy life.
By late June 2013, the program had 137 patients of whom 2/3 were self-referred – had heard about the program and requested to join. A few referrals come from physicians or practice managers. So far this is not an inpatient transitions program, although there are plans to begin that approach. Diabetes and chronic pain are among the mod
MODEL This is a hybrid model, part aICU, part practice based care management. The aICU model is called Primary Care Plus and includes 4/5 of the patients so far. The model in which care managers go to other practices to provide care management is the Care Support model; the other practices can be either primary care or specialty practices. For the Care Support model, the care manager is shared between the RN and LCSW, who are stationed at the aICU site. The program receives capitation and shared savings payment, not fee for service.
TEAM Three physicians are part time (1.6 FTE). The team has 3 patient care coordinators (who are like health coaches), drawn from non-professional people like medical assistants. eam are the RN, an LCSW, a physical therapist who is a chronic pain specialist, and a clinical pharmacist who is also a certified diabetes educator. Another RN will e patient load increases.
Supporting the tbe hired when th
CASELOAD The program goal is to have 1000 patients by end of year 3. Case load estimate is 100-150/care coordinator, a physician panel of about 400.
24/7 ? MDs are on call 24/7, which is felt to be important to address patient fears and concerns at night that may result in an unneeded ED visit. The important thing is that the patient knows the person he/she is calling, which is very different from the typical RN advice line in which the patient does not know whom he/she is talking to and the RN does not know the patient.
CARE
MANAGEMENT
APPROACH
ost
e domains assessment tool
on the PAM/domains assessment, patients have a care plan that is based on the patient’s goals. For example, patients with PAM 4 do not need action plans; they do them ve
nt’s issues. They may accompany patients to ay to
protocol.
odel. Home visits are done if indicated. She also
he
The program interviewed patients to find out exactly what they wanted the care management team to do. The program looks for the 20% of issues that account for 80% of cand utilization. Each patient has an initial 2 hour intake/assessment. The patients are given 2 assessment instruments, the Patient Activation Measure (PAM) and thpioneered by CareOregon. Patients are put into PAM category 1 through 4 (1 is unengaged, 4 is totally engaged). The domains include: (1) social isolation; (2) care access/coordination/trust issues; (3) medical trajectory/complexity; and (4) behavioral issues/self management support. Basedall the time. They may need care coordination amongst multiple specialists. Patients with PAM 1 may receive a very simple action plan with the goal being success, but may halittle need of specialists. Different workflows are developed for each patient based on the PAM/domains results. The care coordinators use a pre-visit/visit/post-visit/between-visit model. They meet with patients before a physician visit to generate an agenda, participate in the visit as a scribe,
ave a post-visit for action plans and closing the loop, and touch patients by phone or e-mail as needed by the intensity of the patiehprocedures, help them navigate, and provide emotional support. Care coordinators will do home visits if indicated, though for this non-Senior, non-Medicaid population this mbe less necessary. Expansion into Medicare is anticipated in 2014. Care coordinators spend a lot of time on medication management – understanding and addressing barriers dherence. They are authorized to refill chronic meds per a
The care coordinators spend a lot of time listening. They received motivational interviewing training, closing the loop training, and goal setting training based on the PAM. In the pre-visit they do PAM (re-checked very 6 months), SF 12, PHQ 2/9, domain, pain questions, diet and activity questions, and a presenteeism scale for employers. The RN visits inpatients every day and helps with their care coordination post-discharge, following the Coleman care transitions mdoes the Care Support work in other practices. The pharmacist CDE sees patients with diabetes and asthma, and also “treats to target,” adjusting medication via protocol for hypertension and lipids as well as diabetes. Tpharmacist leads group visits for diabetes in combination with the RN. Chronic pain group visits will follow in fall 2013, led by the physical therapist, who practices “Integrative PT” using the Feldenkrais Method, focusing on enhancing healthy behaviors in breathing, movement, and “mindfulness” rather than working on the painful part alone. PT has been a part of the care plan for 40% of all patients in the program.

Strategies to Reduce Costs and Improve Care for High-Utilizing Medicaid Patients: Reflections on Pioneering Programs 22
PROGRAM Stanford Coordinated Care Program A Licensed Clinical Social Worker does short-term counseling, care facilitation and counseling about end of life care. She also facilitates the Patient Advisory Council that meetsbimonthly. Depending on the domain assessment, the physicians might be more involved (if disease complexity) or the care coordinators more involved (if self management suppoissues). The ph
rt/behavior ysicians also attend high-import specialty visits with their patients, both in person and virtually. They also see acutely ill patients on a same-day basis.
GRADUATION Probably many patients will not graduate, though some will, and be followed via lower level of engagement. The diseases these patients have tend to be progressive, and since most of the patients have switched to the program as their primary care practice, the challenge will be to continue to deliver cost-effective care by maintaining lower spending better outcomes rather than producing “savings” per se.
via
MEASURES program has partnered with IT and Clinical and Business Analytics to develop a “patient-nt e-based registries prevalent in most electronic health records currently). Ambulatory sensitive m onally, a log is kept of “Avoiding Avoidable Care” such as admits and ED visits avoided,
e he red, yellow or green categories with each measure having defined levels for red, yellow or f
There are no year-over-year data to report yet, but many metrics are being followed. The ce ered” dashboard to identify patients at risk (a departure from the typical diseasad its, ED visits, bed days, and most importantly total cost of care are followed. tests and procedures avoided.
Additi
Ov r 50 clinical measures (such as A1c, BP, SF 12, HEDIS measures) are put into tgreen. The key indicator to follow is how many have gone from red to yellow to green. The program looks for improvement rather than absolute numbers. Patients with a lot ored are seen more. This data is also shared with patients, leading to what the program calls the “Visine Moment” – when the patient sees what they have to accomplish to “get the red out”.
PROGRAM CareMore ORGANIZATION CareMore started as an integrated medical group and became an insurer/provider mainly operating in Southern California. CareMore specializes in providing care for complex
elderly patients with high costs. In 2011, CareMore was purchased by the large insurer Wellpoint.24 , 25
POPULATION Patients must be enrolled in one of CareMore’s insurance plans. Using predictive modeling, laboratory data, physician referrals, and patient self-identification, CareMore identithe patients at highest risk for high costs and enrolls them in one of CareMore’s centers. The average age of CareMore patients is 72, 45% are Hispanic and 50% have an annual
c
fies
in ome below $30,000. Most patients are on Medicare, with 20% dual eligibles (Medicare and Medicaid).
MODEL Mainly an aICU model with care centers for high-utilizing patients. The patients with their own PCP have their care co-managed between the CareMore extensivist and PCP.
TEAM Nurse care managers, nurse practitioners, medical assistants, and physicians called extensivists who provide inpatient management for all hospitalized CareMore patients along with post-hospital outpatient management for th sickese t 5% of patients. Each NP is paired with 2.5 medical assistants who perform clinical tasks.
CASELOAD The hospital and CareMore center management of 4000-5000 high-risk patients is done by 2 extensivist physicians, 2-4 NPs, 2-3 RN care managers, 14 MAs, a nutritionist, social worker and pharmacist.
24/7 ? No.
CARE
MANAGEMENT
APPROACH
dicated exclusively to home visits; they are backed up by a social worker, case manager, mental health clinician, and attorney. Many patients cared for by this team have social and family problems. On discharge from the hospital, patients are color coded as red (high needs, with a phone call within 24 hours and a CareMore Center appointment with their extensivist within 48 hours of discharge); yellow (phone call within 48 hours and extensivist appointment within a week); and green (follow-up with primary care physician). Patients seen by the extensivist after discharge may be co-managed by the PCP and extensivist indefinitely. NPs support the extensivist in caring for these patients in the CareMore center.
At the CareMore Centers, the team (mainly sugars are transmitted to nurse care mana
NP plus MAs) work clinically to control the patients’ chronic conditions. Home monitoring of blood pressures, weights, and blood gers, and the patient’s NP calls if weight or blood pressure has gone up; medications are titrated according to protocol. Nurse care
e trusted go-to people whom patients can call rather than calling 911 when a problem arises. Care manager extenders, who may be medical assistants, assist with phone management, durable medical equipment, and home visits. Two care manager extenders assist each nurse care manager.
One physician and one NP are de
managers are th
GRADUATION Patients graduate when their chronic disease measures have reached target goals. They may re-enter if their conditions worsen.
MEASURES Multiple clinical and utilization outcomes are tracked. For patients at highest risk, per member per month total healthcare costs are $2250 compared with Medicare’s expectation for similar risk patients of $3500. For patients in the intermediate risk category, CareMore’s average is $1000 pmpm compared with expected $1500 pmpm. Thirty day re-hospitalization rates are 13.6% compared with 20% for Medicare as a whole. CareMore’s risk-adjusted total per capita health spending is 15% below the national Medicare average.

Strategies to Reduce Costs and Improve Care for High-Utilizing Medicaid Patients: Reflections on Pioneering Programs 23
PROGRAM Stanford Coordinated Care ProgramCle
arss
eMoran
e sth
ene n
iorsati
e d a less than t Ho or e dise re 42% th o
withnal
diabavera
etes ge.
hav an average A1c of 7.08 an the mputation rate is 78% he national average. spitalizations f nd-stage renal ase a
PROGRAM Hos H m e h Corporpital to ome Progra , New York City H alt and Hospitals ationORGAN v C o Men e ospitals, d orati rk City public
i , e ts in g 0 h of 2012, Yor men ron ess o o m ema d n a he progra der ealt ursement h
IZATION BhDm
elleospemec
ue tal snst
anis
Hoysratm.
spteion
italm.26
Pr
en27 Tgra
ter (Bhe prm. A
HC), ogramt that
Wo b ti
dhugane, e
ll Ho enrolxistin
spiling p
tal ang patatien
d ients r
tal H Auine
ealthust 2 in a
Cent09 a exp
r, and end
ndnd
ed
Eledve
mhur in M
rsion
st Harcof t
all a part of Heal as part of the Nm as a part of th
th anew e fe
Hospitals k State Deally financ
Corpparted H
on, the New Yot of Health’s Chh Homes reimb
ic Illn
POPULA b w st Yor at e m YS DO benefici mately 520 en m o osp s P n by the N hig ospital r he following 12 t ic s d se e z r 3 years. ts ( nd Medi uded.
TION Epm
ligiation
le pts
hs b
atwey
ienre a p
ts cured
ere ulattiv
proviively e algo
ded ienrollrithm
n lied ba
forvered
m fro 2.75 on di
m yeag
the Nars atnoses
ew 3 h an
k Stital rvic
e Dites.utili
partatie
ation
ents hist
t owerory
f He i in
ealthdenti the
(Nfiedprio
H). All were fee-for-service YS DOH as bein Dual-eligible pa
Medicaid h risk for hMedicaid a
aries. Approxieadmission in tcare) were excl
g at tien
MODEL b D it st, a h a c Com ination of E -based, commun y-based, housing fir nd ospit l dis harge models.
TEAM b e it f a h s o uelr n t c eles r i
P e o d o led e w o d E d a o p care o d t
•••••
ComMasHou
artme
mtersin-tirg
un’s g
meen
ity-levcoo intcy
ase socdinarnisepa
d carial wtor (vts at rtmen
e manorker;ia su
2 sitet phy
ag
bcos prsici
rs w
tracviden (n
h a
wit ca
dir
mi
h lore fect
nimu
al hr eati
m o
omnrolent
igh
s sepati--pr
cho
vicesnts ject
l ed
provith nirec
cati
der PC
or).
on;
); P;
an
CASELOAD a r l k e from 8 a e n the hos ng r worked to maximize s il o it e w le he street o time nt. The nator had from 0 c iv i t a na
2a4
5 pcce0-6
tiens to pa
ts antie
pey
nts
r caava on
e mablease
anag houload
er. Sosing oat an
ciappy g
worrtunen t
ers ies
me
supfor and
rvis
worked
ed all enrolled
4-pati
closely
carents
with
manho whe c
gerere re c
s dhooo
epmerdi
ndinss itor
g on ts.
pital site. The hr in shelter at the
ousi coordinatoof enrollme
across all siteshousing coordi
24/7 ? e a t s eek “ a s h manager t t a tim red any across all 3 . g d r g l a o ith the pa are ma next wor y any messages ct
Ysio
es.tesr a
Car Caion
e re s t
mamaake
nagnan.
rs pers
articiwere
patedexpe
incte
n af to p
er-hovi
ourde
and wphone tria
end e whi
on-ce aw
ll syake
temnd t
”. o f
Eacoll
caw-u
re p w
ook 1 wk of call atient’s assigned c
e and covenager the
after hours callsk day to conve
CARE
MANAGEMENT
APPROAC
ar gers a en e ho al e r m . Email a care m ones wh nrolled patients t he hos- ntervie i if e nd l -t ped to prima nsportat ocacy during p ents, m e e e atr use treatm d home
• o irst m i not a r e usin d ospital to hou ordinato atients to housi li pply for permane sing d li a g ation proces
• ge, a coo a p nts, o a patient and d with ED ring futu aid cell phones and dited m v
• 1 hr o e a a t ti tacts between patien as 17.6/m ith avera ntact 30 minutes.
H
•
•
CenInap
H
e meredepoin
usindetermine Post-dischar
exAverage of 1
and tth itmg F
pe
a ttepitaws edi
odeng care
medics/m
mptel systcondcationl (sobreligibi
manal apnth
d to fem. ucted
maety ty, agerspointper pati
ind
tonag
pati
dentment, pre
rdinents w
nt c
ts
y ien
equ
tedere re m
eith
mmtitlisit
approan
r in
diatme fornt oinidege
the
e ants ho
houtmed.
men
spit
ongenrollment, im
g), n an acc
me.
syst
erm
o pa facimp
Mean
m o
neeprov
tate anied
in t
d ctients discharge
ny nd
number of con
he
on
exad
co
ds. Care managers helne
istinvo
mu
apcated for
nity
ctions to psychi from h
plic
lerts were sent to
arrange housing,ic and substance street or shelter. The
ses. communicate
ts and team w
anager ph
ry care, traent, an
sing co
staff du
onth w
en eligible or e
ion to and advvisits. r worked with p
re visits. Pre-p
ge length of co
GRADUATI am unless they l dica o g k State Dep alth criter isenrollm ging into Medic rolon are ri ay
ON All patients remaare
ined in the ged lo
progrm c
ost s.
Me id c vera e or met other New Yor artment of He ia for d ent including a, p ng-ter or p son st
MEASURES • u e w questions abou ca a a ci ains using va s (e.g. SF- M) and o stions • encou d a illin at• • naly n t at E n ti we e d mparin e ost enrollme patients e for at le and reductions in
this ere see t 2 r t. R c s ear to h test for patie homeless l enrollm ubsequently pla suppor h i
Baseline and foll
Housing statistic
e w in
ow-nters sis in intive
p intata
dicahe ous
rviend b
es thnd 6ng.
t m
ent ollm
edi
useen
l, beh
re redu
vior
ducetion
l, leg
coapp
al, and so
g prbe t
al d
ane g
om
d prea
lidated survey
nt periods for nts who were
12, PA
nrolled at initia
pen ended que
ast 12 months, ent and were s
Medicaid
Preliminary a usced
g d
D amonths p
a
d inos
pat en
�

Strategies to Reduce Costs and Improve Care for High-Utilizing Medicaid Patients: Reflections on Pioneering Programs
4BAcknowledgements
Rachel Paneth-Pollak, Roz Murray, Diana DeVore, Liz Davis and Danielle Hessler assisted with research for the report. Individuals associated with the various programs provided valuable information: Jen Abraczinskas (Camden Coalition), Ann Lindsay and Alan Glaseroff (Stanford Coordinated Care), Paul Johnson (Hennepin County), Steven Counsell (GRACE), Denise Levis (CCNC), Rebecca Ramsay (CareOregon), and Maria Raven (USC SF, formerly NYC HHC).
Additional Resources This brief is a product of CHCS’ Rethinking Care Program, which is developing and testing new strategies to improve health care quality and control spending for Medicaid’s highest-need, highest-cost populations. It is made possible by Kaiser Permanente Community Benefit. For more information, visit Hwww.chcs.org H.
About the Center for Health Care Strategies The Center for Health Care Strategies (CHCS) is a nonprofit health policy resource center dedicated to improving health care access and quality for low-income Americans. In collaboration with state and federal agencies, health plans, providers, and consumer groups, CHCS pursues innovative and cost-effective strategies to better serve Medicaid beneficiaries. Its program priorities are: enhancing access to coverage and services; advancing quality and delivery system reform; integrating care for people with complex needs; and building Medicaid leadership and capacity.
Endnotes 1 T. Bodenheimer, R. Berry-Millett. Care Management for Patients with Complex Healthcare Needs. Robert Wood Johnson. Foundation, 2009. 2 S. R. Counsell et al. “Cost Analysis of the Geriatric Resources for Assessment and Care of Elders Care Management Intervention.” Journal of the
American Geriatric Society (2009);57:1420-1426. 3 Healthcare Utilization of CCNC (Community Care of North Carolina) Enrolled Population, 2007-2010. Treo Solutions, June 2012. 4 R. Cosway et al. “Analysis of Community Care of North Carolina Cost Savings.” Milliman Client Report, December 2011. 5 K.W. Linkins et al. Frequent Users of Health Services Initiative: Final Evaluation Report. The Lewin Group. August 2008. 6 Treo Solutions, op cit. 7 Community Care of North Carolina: Putting Health Reform Ideas into Practice in Medicaid. Kaiser Commission on Medicaid and the Uninsured, May
2009. 8 Enhanced Primary Care Case Management System Legislative Report. North Carolina Community Care Networks, Inc. Quarterly Report as of January
1, 2011. 9 B.D. Steiner et al. “Community Care of North Carolina: Improving Care through Community Health Networks.” Annals of Family Medicine
(2008):6:361-367. 10 Cosway et al., op cit. 11 S. R. Counsell et al. “Geriatric Care Management for Low-Income Seniors.” Journal of the American Medical Association (2007):298:2623-2633. 12 S. R. Counsell et al. “Cost Analysis of the Geriatric Resources for Assessment and Care of Elders Care Management Intervention. “ Journal of the
American Geriatric Society (2009);57:1420-1426. 13 S. Klein, D. McCarthy. CareOregon: Transforming the Role of a Medicaid Health Plan from Payer to Partner. The Commonwealth Fund, July 2010. 14 E.F. Taylor et al. Evaluation of the Medicaid Value Program: Health Supports for Consumers with Chronic Conditions. CareOregon Case Study.
Mathematica Policy Research, August 14, 2007. 15 B. Schilling. Purchasing High Performance: Boeing’s Nurse Case Managers Cut Per Capita Costs by 20 Percent. The Commonwealth Fund, March
2011. 16 A. Milstein. “Are Higher-Value Care Models Replicable” Health Affairs Blog, October 2009. 17 L.S. Sadowski et al. “Effect of a Housing and Case Management Program on Emergency Department Visits and Hospitalizations among Chronically
Homeless Adults.” Journal of the American Medical Association (2009):301:1771-1778. 18 M.E. Larimer et al. “Health Care and Public Service Use and Costs Before and After Provision of Housing for Chronically Homeless Persons with
Severe Alcohol Problems.” Journal of the American Medical Association (2009):301:1349-1357. 19 B.M. Kuehn. “Supportive Housing Cuts Costs of Caring for the Chronically Homeless.” Journal of the American Medical Association (2012):308:17-
19. 20 A. Gawande “The Hot Spotters.” The New Yorker, January 24, 2011, p. 41-51. 21 T. Goldsmith. “Camden’s Roadmap to Reform.” Health Affairs Blog, March 2011. 22 L. Blash et al. The Special Care Center – a Joint Venture to Address Chronic Disease. Center for the Health Professions. November 2011. 23 Primary Care Physicians and Health Coach Teams Improve Outcomes and Reduce Costs for Complex Patients. AHRQ Health Care Innovations
Exchange. 24 A. Milstein, Gilbertson E. “American Medical Home Runs.” Health Affairs (2009):28:1317-1326. 25 T. Main, A. Slywotzky. “The Quiet Health-Care Revolution.” The Atlantic, November 2011. 26 M.C. Raven et al. “Medicaid Patients at High Risk for Frequent Hospital Admission: Real-Time Identification and Remediable Risks.” Journal of
Urban Health (2008):86:230-241. 27 M.C. Raven et al. “An Intervention to Improve Care and Reduce Costs for High-Risk Patients with Frequent Hospital Admissions: A Pilot Study.”
BMC Health Services Research (2011):11:270.