hcl technologiesglobal infrastructure grew 22% yoy; steady state business grew by 32% on yoy basis....
TRANSCRIPT

WHERE VALUES DRIVE VELOCITY
- 1 -
HCL TECHNOLOGIES INVESTOR PRESENTATION | FIRST QUARTER FY‘16

WHERE VALUES DRIVE VELOCITY
- 2 -

WHERE VALUES DRIVE VELOCITY
- 3 -
SAFE HARBOR STATEMENT
Certain statements in this release are forward-looking statements, which involve a number of risks, uncertainties, assumptions and other factors that could cause actual results to differ materially from those in such forward-looking statements. All statements, other than statements of historical fact are statements that could be deemed forward looking statements, including but not limited to the statements containing the words 'planned', 'expects', 'believes', 'strategy', 'opportunity', 'anticipates', 'hopes' or other similar words. The risks and uncertainties relating to these statements include, but are not limited to, risks and uncertainties regarding impact of pending regulatory proceedings, fluctuations in earnings, our ability to manage growth, intense competition in IT services, Business Process Outsourcing and consulting services including those factors which may affect our cost advantage, wage increases in India, customer acceptances of our services, products and fee structures, our ability to attract and retain highly skilled professionals, our ability to integrate acquired assets in a cost effective and timely manner, time and cost overruns on fixed-price, fixed-time frame contracts, client concentration, restrictions on immigration, our ability to manage our international operations, reduced demand for technology in our key focus areas, disruptions in telecommunication networks, our ability to successfully complete and integrate potential acquisitions, the success of our brand development efforts, liability for damages on our service contracts, the success of the companies / entities in which we have made strategic investments, withdrawal of governmental fiscal incentives, political instability, legal restrictions on raising capital or acquiring companies outside India, and unauthorized use of our intellectual property, other risks, uncertainties and general economic conditions affecting our industry. There can be no assurance that the forward looking statements made herein will prove to be accurate, and issuance of such forward looking statements should not be regarded as a representation by the Company, or any other person, that the objective and plans of the Company will be achieved. All forward looking statements made herein are based on information presently available to the management of the Company and the Company does not undertake to update any forward-looking statement that may be made from time to time by or on behalf of the Company.

WHERE VALUES DRIVE VELOCITY
- 4 -

WHERE VALUES DRIVE VELOCITY
- 5 -
CONTENTS
SLIDE TITLE SLIDE REFERENCE
Perspective and Q1 FY’16 Performance 7 – 10
Perspective on Addressable Market 12 – 15
Financial Snapshot Q1 FY’16 17 – 19
Consolidated Income Statement (in US$ mn) 18
Strong Business & Operating Metrics 19
Corporate Governance 21 – 23
Key Messages 24

WHERE VALUES DRIVE VELOCITY
- 6 -

WHERE VALUES DRIVE VELOCITY
- 7 -
PERSPECTIVE AND Q1 FY’16 PERFORMANCE
WHERE VALUES DRIVE VELOCITY
- 8 -
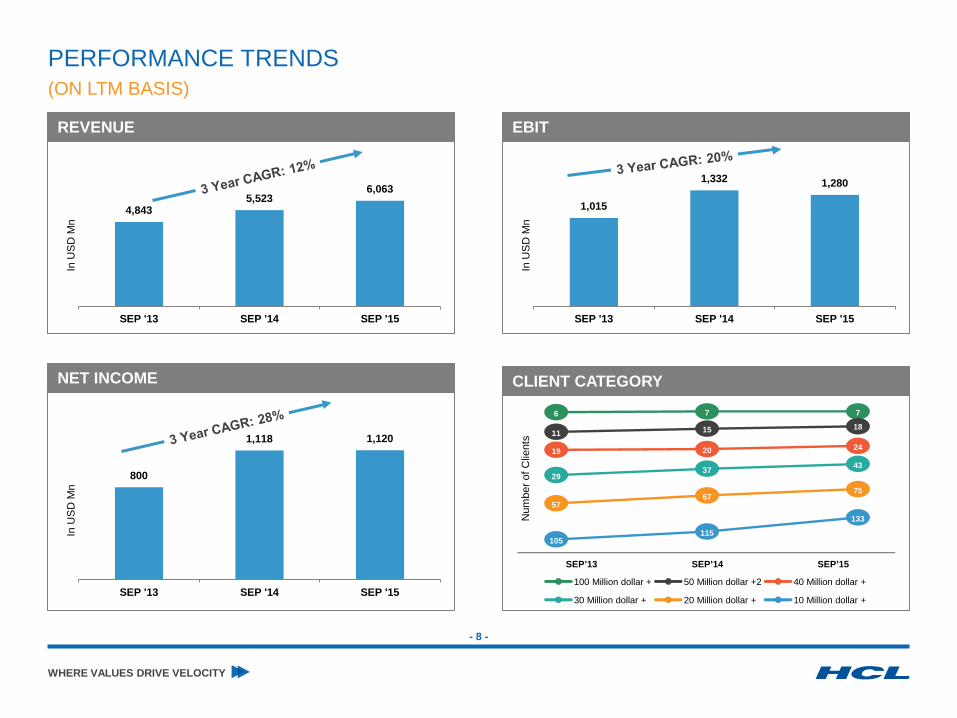
CLIENT CATEGORY
800
1,118 1,120
SEP '13 SEP '14 SEP '15
In U
SD
Mn
1,015
1,332 1,280
SEP '13 SEP '14 SEP '15
In U
SD
Mn
4,843 5,523
6,063
SEP '13 SEP '14 SEP '15
In U
SD
Mn
PERFORMANCE TRENDS (ON LTM BASIS)
REVENUE EBIT
NET INCOME
Num
ber o
f Clie
nts
6 7 7
11 15 18
19 20 24
29 37 43
57 67
75
105 115
133
SEP’13 SEP’14 SEP’15
100 Million dollar + 50 Million dollar +2 40 Million dollar +
30 Million dollar + 20 Million dollar + 10 Million dollar +
WHERE VALUES DRIVE VELOCITY
- 9 -
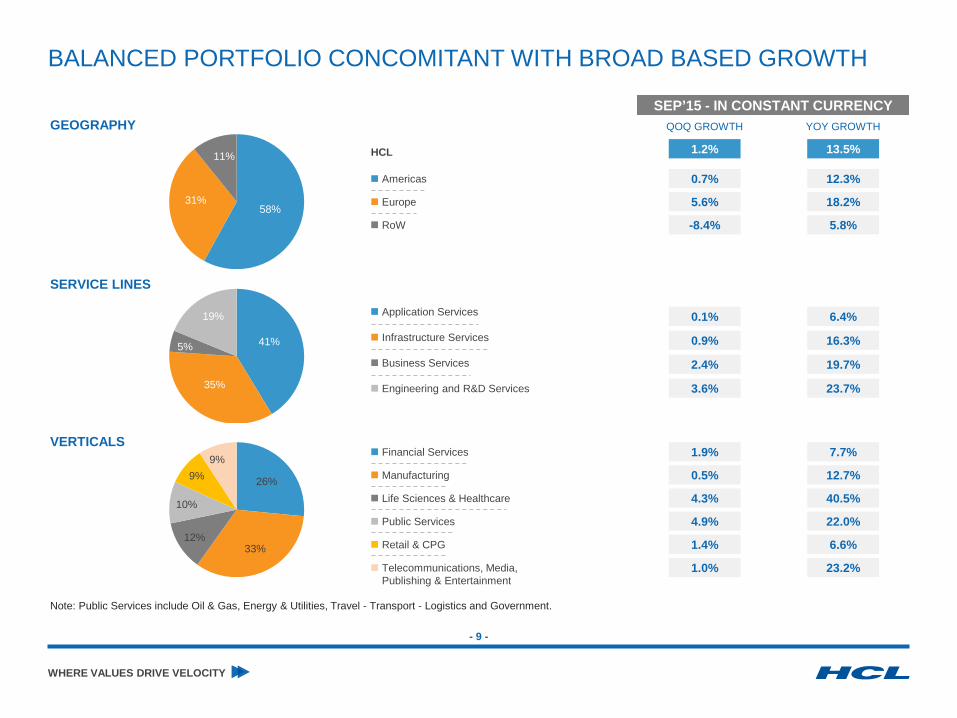
BALANCED PORTFOLIO CONCOMITANT WITH BROAD BASED GROWTH
SERVICE LINES
GEOGRAPHY
VERTICALS
58% 31%
11%
41%
35%
5%
19%
26%
33% 12%
10%
9% 9%
QOQ GROWTH YOY GROWTH
1.4%
1.0%
0.5%
4.9%
1.9%
4.3%
3.6%
2.4%
0.9%
5.6%
0.7%
-8.4%
1.2%
6.6%
23.2%
12.7%
22.0%
7.7%
40.5%
23.7%
19.7%
16.3%
18.2%
12.3%
5.8%
13.5%
Americas
Europe
RoW
Financial Services
Manufacturing
Life Sciences & Healthcare
Public Services
Retail & CPG
Telecommunications, Media, Publishing & Entertainment
Infrastructure Services
Business Services
Engineering and R&D Services
HCL
Application Services 0.1% 6.4%
SEP’15 - IN CONSTANT CURRENCY
Note: Public Services include Oil & Gas, Energy & Utilities, Travel - Transport - Logistics and Government.

WHERE VALUES DRIVE VELOCITY
- 10 -
PERFORMANCE DRIVERS
■ Global Infrastructure grew 22% YoY; steady state business grew by 32% on YoY basis.
■ Transitioning 10 large engagements. Pipeline is healthy and win rates continue to be robust.
■ Increased traction in cloud services (including SAAS) and infrastructure utility as a service being part of the full solutions to the customers.
■ Increased Deal sizes due to the end to end Multi- geography requirements with clients entrusting the entire Infrastructure portfolio with one provider.
INFRASTRUCTURE SERVICES ■ Next Gen ITO: HCL has won a deal with a Fortune 10 Oil & Gas
company to provide Data Center Operations and End User Computing services.
■ HCL has been selected by a leading US based Defense System Integrator for IT Infrastructure Transformation Engagement. HCL will deliver end-to-end IT infrastructure solutions including Data center, Workplace, Network and Security services to the client.
■ HCL has won a deal from a multi-national Communication Technology & Services firm to provide Research & Development Services for its Next-generation IP & Datacenter cloud platforms.
SOME OF DEALS WON IN THE QUARTER
■ Europe at 18.2% YoY on a constant currency basis is leading the growth.
■ Significant momentum gathering in Germany and other neighboring markets in the DACH region as well as the Benelux region including France.
■ 58% of Rebid deals are expected from the EMEA region.
■ Seeing first time outsourcing opportunities in Europe.
■ Volvo engagement likely to propel HCL as a leading player in Nordics. HCL will also get industry leading Mainframe capabilities that allows HCL to tap into a potentially bigger market for mainframe services. Additionally, the deal will significantly strengthen HCL’s Shared Services capabilities.
EUROPE
■ Digital business is embedded in all the service lines.
■ Focusing on digitizing the whole value chain, rather than only on the user experience.
■ Have forged partnerships with SaaS providers for implementation.
■ ‘Beyond Digital’ business has been formally launched in the quarter.
■ HCL has partnered with Manchester United to unveil a number of digital initiatives to transform the experience of the club's 659 million global followers. HCL is creating a state-of-the-art United Xperience Lab to be housed within the iconic Old Trafford stadium.
DIGITALIZATION SERVICES

WHERE VALUES DRIVE VELOCITY
- 11 -

WHERE VALUES DRIVE VELOCITY
- 12 -
PERSPECTIVE ON ADDRESSABLE MARKET

WHERE VALUES DRIVE VELOCITY
- 13 -
STATE OF THE MARKET
Gartner: IT Services Market to Grow 3.7% in 2015 in Constant Currency Rebid Market: Cloud/IUS will be Key Factors in Renewals
Forces impacting Engineering Services business Applications, Consulting and Implementation
USD Appreciation Impacts Reported Currency Growth
$150Bn* Worth of Renewals Over 2016, 2017 and 2018 (*Source ISG: Non Government and BPO)
58% from EMEA 30% Full ITO
Source: ISG/HCL Analysis
Cloud Services
IUS
DCO
30%
12%
–3%
2015–19 CAGR
Source: Gartner Source: Everest
40% Churn Rate From Large Deals to
Best of Breed Providers
$20Bn*+ Worth of Renewals in Applications Services Over 2016, 2017 and 2018 (*Source ISG: Non Government)
Outcome–Based Models By 2018, 25% of Applications Contracts Will be Outcome–Based: Gartner
Consulting Driven Applications Constitutes 56% of Overall Technology Consulting: JP Morgan
Digital Consulting
Operational Excellence GRC Architecture
Source: Gartner report "Predicts 2015: Application Services Continue to Move Toward Business Outcomes and Speed to Results Through Changes in Delivery Models" authored by Twiggy Lo | Patrick J. Sullivan | Frances Karamouzis | Alex Soejarto | Susanne Matson | Gilbert van der Heiden | Susan Tan
Source: Gartner Report "Forecast: IT Services, Worldwide, 2013-2019, 3Q15 Update" authored by Kathryn Hale, Dean Blackmore, Susan Tan, Helen Huntley
IT Services Growth Rates (CY15) 2014 2015 2016
Constant Currency 3.5% 3.7% 4.0%
Reported USD 1.9% -3.5% 3.9%
Source: Gartner Report "Forecast Alert: IT Spending, Worldwide, 3Q15 Update" aothored by JohnDavid Lovelock; Kathryn Hale; Adrian O'Connell; Wm. L. Hahn; | Ranjit Atwal; Colleen Graham; Michael Dornan
Connectivity Connected cars,
flights, medical devices
Internet of Things Engineering analytics
Miniaturisation Miniaturised inverters Wearable medical devices Smaller CNG compression
units
Digital Engineering Design virtualisation Concurrent engineering Simulation-based testing
Localisation Localised automobiles Localised consumer
electronics
Sustainability Fuel efficiency Advanced materials
(Composites) Alternate fuels
Software-led differentiation Intelligent cars Digital oilfields
Smart engines In-flight entertainment
ER&D Themes
Source: 2014 ER&D interviews, Strategy& IC and analysis

WHERE VALUES DRIVE VELOCITY
- 14 -
HCL – BUSINESS AND IT SERVICES STRATEGIC PLAY
Applications Outsourcing
Offshore ADM
Infrastructure Outsourcing
RIM
Business Process Outsourcing
Voice–Based
2005 – 2010
2010 – 2015
Effort – Based SLAs
Output – Based Models
2016 – 2020
Outcome –Based Models
Digitalization
Business Model Transformation
Next–Gen ITO Internet of Things
Front–Office to Back–Office
Customer Experience
Hybrid Cloud
DryIce: Automation with Orchestration
SIAM Consumer IoT
Industrial IoT
HCL Strategic
Play
ITO: Integrated Applications and Infrastructure Business Process Outsourcing
Business Services
Cloud
DevOps Automation

WHERE VALUES DRIVE VELOCITY
- 15 -
REBID MARKET CONTINUES TO BE STRONG ~$146BN OF TCV EXPECTED OVER NEXT THREE YEARS; CHURN RATE HAS INCREASED TO 40% FROM 34% IN LAST 2 YEARS
2016-18 Vertical Split* 2016-18 Geo Split*
Total Renewal Opportunity in $ bn* 2016-18 Horizontal Split*
Source: ISG/HCL Analysis; * Excluding Government vertical & BPO
51
46
50
CY 16 CY 17 CY 18
Consumer Services, 32%
Financial Services, 25%
LSH, 6%
Manufacturing, 13%
Others, 9%
Public Services, 15%
Full ITO, 30%
Americas, 24%
EMEA, 58%
Infrastructure, 55%
Applications, 15%
Asia-Pacific, 18%

WHERE VALUES DRIVE VELOCITY
- 16 -

WHERE VALUES DRIVE VELOCITY
- 17 -
FINANCIAL SNAPSHOT Q1 FY'16

WHERE VALUES DRIVE VELOCITY
- 18 -
Constant currency revenue growth at 1.2% QoQ and 15.3% on LTM YoY Revenue at US$ 1,545 Mn; up 0.5% QoQ in reported currency
Q1, FY’16
Income Statement 30-Sep-14 30-Jun-15
30-Sep-15 Ex Adj (US GAAP – US$ Mn) Ex Adj Reported YoY QoQ Revenue 1,433 1,538 1,545 1,545 7.7% 0.5% Gross Profits 527 525 531 513 SG & A 168 197 193 193
EBITDA 359 328 338 320 Depreciation & Amortization 17 20 21 21
EBIT 342 309 317 299 -7.3% 2.8% Forex & Other Income (Net) 50 33 37 37
Earnings before Tax (EBT) 392 342 354 336 Tax 85 63 76 72
Net Income (Ex Adjustment) * 307 279 279 264 -9.3% -0.1% EPS (Diluted) – Annualized – In INR 53 50 52
* Adjustment refers to one time provision for a project
EBIT (Ex Adj.) at $ 317 Mn; Annualized GAAP EPS (Diluted) – INR 52 (Ex Adj)
CONSOLIDATED INCOME STATEMENT (IN US$ MN)
Margins 30-Sep-14 30-Jun-15 30-Sep-15
(Ex Adj) Reported
Gross Margin 36.8% 34.1% 34.4% 33.2%
EBITDA Margin 25.1% 21.3% 21.9% 20.7%
EBIT Margin 23.9% 20.1% 20.5% 19.4%
Net Margin 21.4% 18.1% 18.0% 17.1%

WHERE VALUES DRIVE VELOCITY
- 19 -
■ Increase in New Clients contribution to revenue aided by pace of business momentum during the year.
■ Net Income to Operating Cash Flow conversion is at an average of 100% for last 3 years. Improvement in cash conversion ratios on YoY basis.
■ Uptick continues in Managed Services reflective of emergence of sophisticated constructs in next-gen ITO and Engineering and R&D services.
55.7%
56.1%
SEP '14 SEP '15
Managed Services & Fixed Price Projects
STRONG BUSINESS & OPERATING METRICS (LTM BASIS)
Healthy Cash Conversion
Key Highlights Managed Services & Fixed Price Projects
SUPERIOR EXECUTION
68%
41%
77%
50%
OCF/ NI FCF/ EBITDA
SEP '14 SEP '15
3.8%
4.3%
SEP '14 SEP '15
New Clients
Client Business Mix
TRACTION IN NEW CLIENTS

WHERE VALUES DRIVE VELOCITY
- 20 -

WHERE VALUES DRIVE VELOCITY
- 21 -
CORPORATE GOVERNANCE

WHERE VALUES DRIVE VELOCITY
- 22 -
CORPORATE GOVERNANCE TENETS & PHILOSOPHY
BOARD COMMITTEES PLAY A CRUCIAL ROLE IN GOVERNANCE STRUCTURE
INDEPENDENT DIRECTORS TOTAL
AWARDS/ RECOGNITIONS
HCL also won the European Outsourcing Association’s ‘IT Outsourcing Project of the Year Award’ for its successful IT Transformation project for a leading multinational pharmaceutical firm in 2015
HCL has been ranked in Forbes Asia's prestigious annual listing of the 50 best publicly traded companies in Asia-Pacific called 'Asia's Fab 50 companies'. HCL has made it to this list for the sixth consecutive year in 2015
FRAMEWORK FOR CODE OF BUSINESS
Insider Trading Code
Whistle Blower Policy
Code of Business Ethics and Conduct
Policy Against Sexual Harassment
Investors Satisfaction Survey
Anti-Bribery & Anti Corruption Policy
1 3
STAKEHOLDERS RELATIONSHIP
4 4
AUDIT
4 4
RISK MANAGEMENT
3 5
FINANCE
2 4
NOMINATION & REMUNERATION
1 3
CSR
1 2
ESOP ALLOTMENT
CORPORATE OFFICERS: 21 EVERY DIVISION/ ENABLING FUNCTION –
SALES/ DELIVERY/ FINANCE/ HR HEADED BY A CORPORATE OFFICER
BOARD OF DIRECTORS GLOBAL & VALUE DRIVEN
10 DIRECTORS: INDEPENDENT: 7; EXECUTIVE: 1; NON EXECUTIVE – NON INDEPENDENT – 2;
WOMEN DIRECTORS - 2
STRONG CORPORATE
GOVERNANCE FRAMEWORK
FAIRNESS & EQUITY
COMPLIANCE & ACCOUNTABILITY
TRUST & TRANSPARENCY
COMMITMENT TO VALUES AND
INTEGRITY
Fair Disclosure Code
Conferred the ‘Best Governed Company Award’ by the Asian Centre for Corporate Governance & Sustainability In 2014

WHERE VALUES DRIVE VELOCITY
- 23 -
BOARD OF DIRECTORS
Mr. Shiv Nadar, Chairman and Chief Strategy Officer: Founder of HCL and recipient of Padma Bhushan award. Through Shiv Nadar Foundation, Mr. Nadar has been actively associated with numerous philanthropic initiatives with prime focus on education. Holds iconic global status in IT Thought Leadership
Ms. Roshni Nadar Malhotra: She is CEO and Executive Director of HCL Corporation. Roshni holds MBA degree from Kellogg Graduate School of Management. She has played an institutional building role in the Shiv Nadar Foundation and the SSN Institutions in Chennai as well as the Shiv Nadar University in NCR and the Vidyagyan Schools.
Mr. Amal Ganguli: A Fellow member of the ICAI and ICA, England & Wales. Previously Chairman and Senior Partner at PWC, India. His range of work includes tax advice, audits, corporate M&A and consulting.
Ms. Robin Abrams: B.A and juris doctor degree from U.S. Previously interim CEO at Zilog and senior VP at 3 Com. Held various senior management positions including Apple computers and Unisys. Served several U.S. public company Boards and several academic advisory committees.
Mr. R. Srinivasan: An electrical engineer and an MBA from IIM-A. Founder and now Vice Chairman of Redington (India) Limited, a leading Tech product supply chain solution company.
Mr. Sudhindar Krishan Khanna: Bachelor In Economics and C.A. Presently, Chairman and MD of IEP Mumbai, a leading PE Fund. Founding member of Accenture worldwide. Serves on the board of United Spirits, Peninsula Holdings and Canara HSBC Insurance.
Mr. S. Madhavan: C.A and MBA IIM-A, Retired as a senior Partner and Executive Director, PWC. Long standing leader of indirect practice at PWC.
Mr. Sosale Shankara Sastry: B.Tech from IIT, Bombay. Dean of Engineering at University of California, Berkeley. Previously, Member, Scientific Advisory Boards for Government of Singapore and Thailand.
Mr. Keki Mistry: Vice Chairman & CEO of HDFC Ltd. He is a CA from the Institute of Chartered Accountants of India (ICAI). Mr. Keki is also on the Board of several HDFC group companies including HDFC Bank and on board of other companies like Sun Pharmaceutical Industries Ltd and Torrent Power.
Mr. Thomas Sieber: He is a senior international leader with more than 20 years of experience in the ICT-sector. Thomas is also Member of Board of Directors at IT-services provider Garaio AG; Sierra Wireless (NASDAQ: SWIR), Global leader in “Internet of Things”, as well as Danish wireless solution company RTX (NASDAQ OMX Copenhagen A/S). Thomas is also Chairman of the Board of Directors at Axpo Holding AG, one of two national Energy providers in Switzerland. He holds masters in business administration from the University of St.Gallen, Switzerland.
WIP

WHERE VALUES DRIVE VELOCITY
- 24 -
KEY MESSAGES
CONSISTENCY IN PERFORMANCE FY’16 commenced on a strong footing. Reported broad based growth across the portfolio.
Quarterly revenue grew by 13.5% YoY and 15.3% on LTM YoY in Constant Currency. HCL continues to gain market share.
Posted best in class growth in Americas (12.3%), Europe (18.2%), Lifesciences & Healthcare (40.5%), Public Services (22.0%), Engineering and R&D services (23.7%) and Infrastructure Services (16.3%).
SUPERIOR SHAREHOLDER RETURNS Announces dividend of INR 5 per share, 51st consecutive quarter of dividend pay-out.
Robust ROE at 31% for LTM Sep’15.
STRONG CORPORATE GOVERNANCE AND MANAGEMENT STRENGTH Robust Corporate Governance framework in place including Board Structure (7 out of 10 being Independent Directors)
7 Board Committees and 21 Corporate Officers.
KEY FOCUS AREAS Next-Gen ITO, Engineering and R&D Services and Modern Apps & Digitalization gaining traction.
STRONGLY POSITIONED IN THE MARKET Rebid market continues to look attractive with churn rate of healthy 40%, up from 34% in last 2 years.
Unexecuted order book is at highest ever level, at 10% higher than previous high seen.
Our investments in BEYONDigital, Next-Gen ITO and IoT offerings is reflected in our healthy bookings and deal pipeline.
Concluded capability driven acquisitions in Engineering space like ‘Trygstad’ and ‘Concept to Silicon Systems’ that will further enhance our positioning in Engineering and R&D Services.
HCL has signed a LOI with Volvo. The deal covers managing end to end IT Infrastructure Management & Application Operations for the Volvo Group. In addition, HCL will also acquire Volvo IT’s external business that delivers IT Services to a large number of customers.

WHERE VALUES DRIVE VELOCITY
- 25 -