hcl, arnar´s data, 1) instruction concerning manipulation of 2d data to derive rempi spectrum: 2)...
Post on 19-Dec-2015
227 views
TRANSCRIPT

HCl, Arnar´s data,
1) INSTRUCTION concerning manipulation of 2D data to derive REMPI spectrum:2) Rough 1st Analysis of Arnars data
See: Agust, heima,....HCl20600-20820massdata-240108vhw.pxpAgust,www, ...HCl-Arnar-250108akvhw.ppt
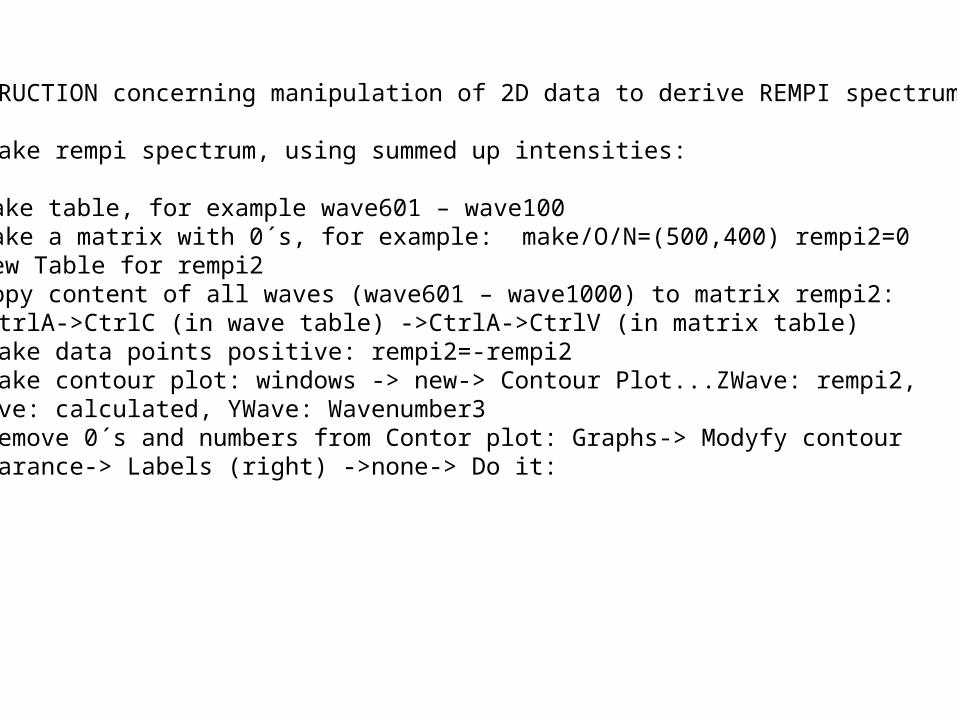
INSTRUCTION concerning manipulation of 2D data to derive REMPI spectrum:
To make rempi spectrum, using summed up intensities:
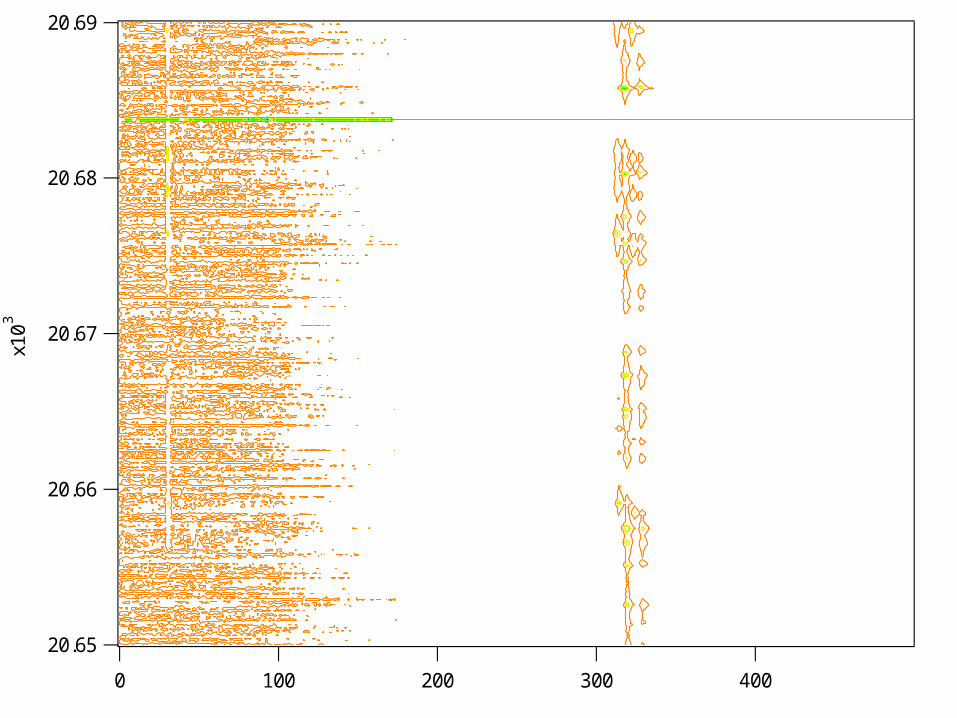
1) Make table, for example wave601 – wave1002) Make a matrix with 0´s, for example: make/O/N=(500,400) rempi2=03) New Table for rempi24) Copy content of all waves (wave601 – wave1000) to matrix rempi2:-> CtrlA->CtrlC (in wave table) ->CtrlA->CtrlV (in matrix table)5) Make data points positive: rempi2=-rempi26) Make contour plot: windows -> new-> Contour Plot...ZWave: rempi2, XWave: calculated, YWave: Wavenumber37) Remove 0´s and numbers from Contor plot: Graphs-> Modyfy contour appearance-> Labels (right) ->none-> Do it:
20.69
20.68
20.67
20.66
20.65
x10
3
4003002001000

20.69
20.68
20.67
20.66
x10
3
340330320310300
ExpandedCl+ and HCl+region:

To obtain H35Cl spectrum: sum over points 316 – 321 (see figure above):•Make matrix for 6 points (i.e 316-321): make/O/N=(6,400) rempi2a=0•Edit rempi2a•Copy lines for pnt = 316- 321 in rempi2 matrix•Paste to rempi2a matrix•Transpose (flip) rempi2a matrix: MatrixTranspose rempi2a•Make wave equally long as the rempi2a (400) to contain the intensity sum:Make/N=400/D rempi2aa•AppendToTable rempi2aa•Summing up:rempi2aa=rempi2a[x][0]+rempi2a[x][1]+ rempi2a[x][2]+ rempi2a[x][3]+rempi2a[x][4]+ rempi2a[x][5]
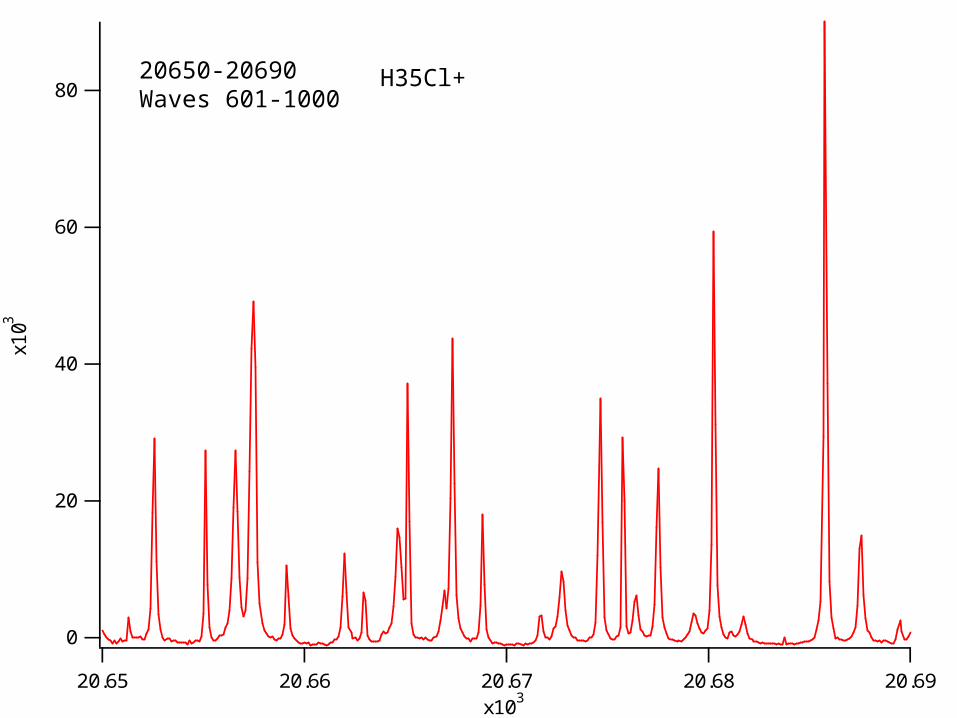
• Display rempi2aa vs Wavenumbers3:
80
60
40
20
0
x103
20.6920.6820.6720.6620.65x10
3
20650-20690Waves 601-1000
H35Cl+
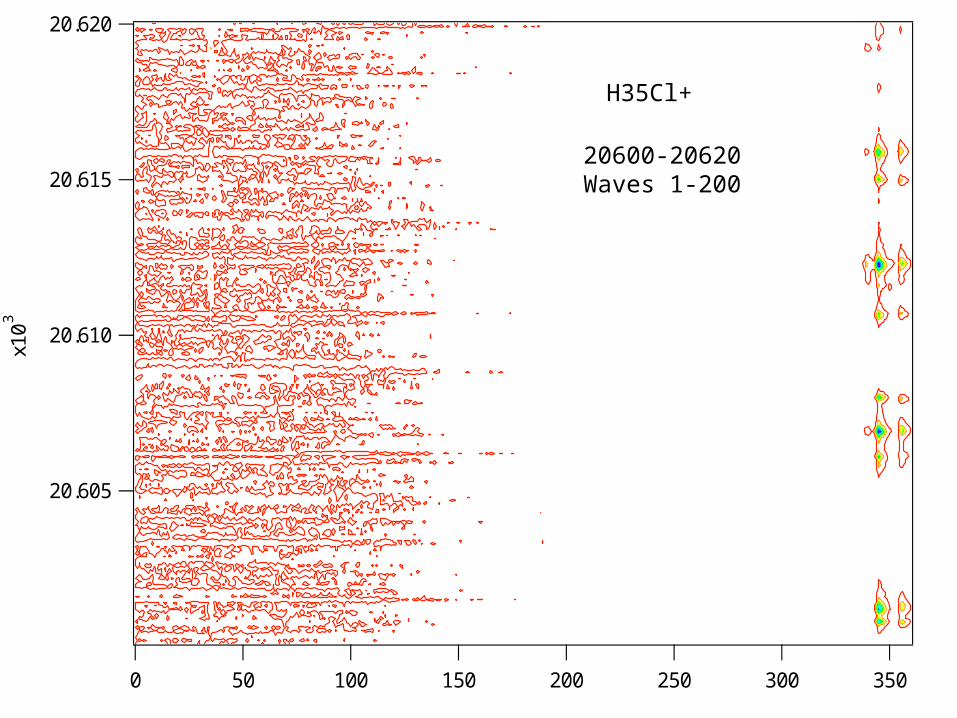
20.620
20.615
20.610
20.605
x10
3
350300250200150100500
20600-20620Waves 1-200
H35Cl+
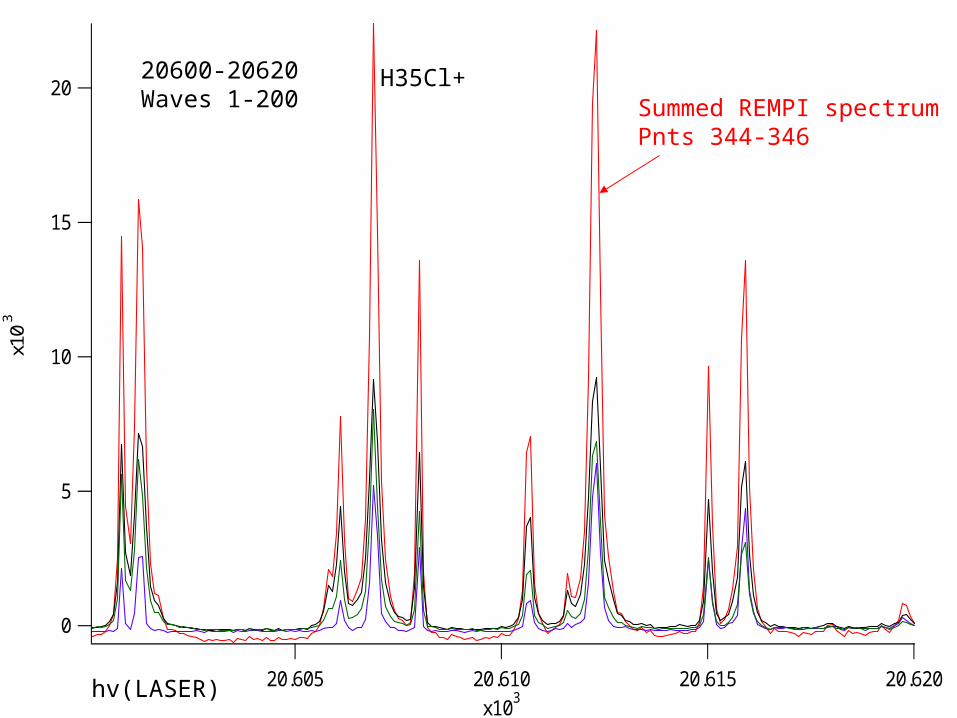
20
15
10
5
0
x10
3
20.62020.61520.61020.605x10
3
hv(LASER)
Summed REMPI spectrumPnts 344-346
20600-20620Waves 1-200
H35Cl+
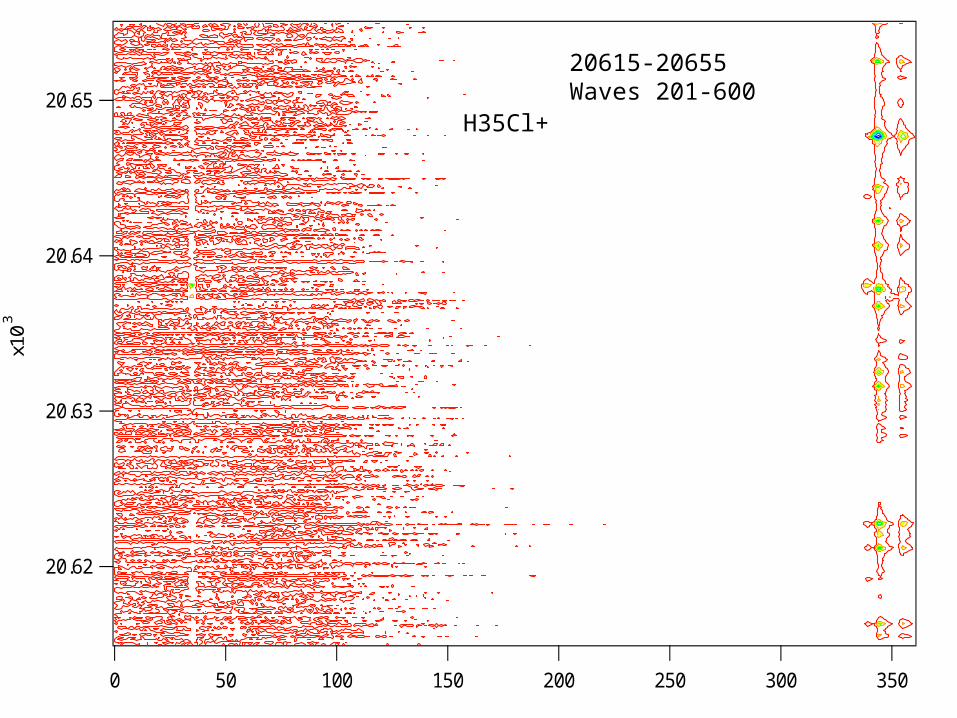
20.65
20.64
20.63
20.62
x10
3
350300250200150100500
H35Cl+
20615-20655Waves 201-600

80
60
40
20
0
x10
3
20.6520.6420.6320.62x10
3
H35Cl+20615-20655Waves 201-600