hci compass - world bank
TRANSCRIPT

HCI CompassHCP Knowledge Exchange Webinar
March, 2020

Why the HCI Compass?
• HCI has been a great tool for advocacy. It was successful in highlighting the human capital crisis and stimulating demand for action.
• But improving HCI takes time. As such, it is not ideal to track progress as policy makers need to show progress within their political cycle and do course corrections.
• Persistent demand for ways to track progress and to identify what policy makers should do to move the needle.
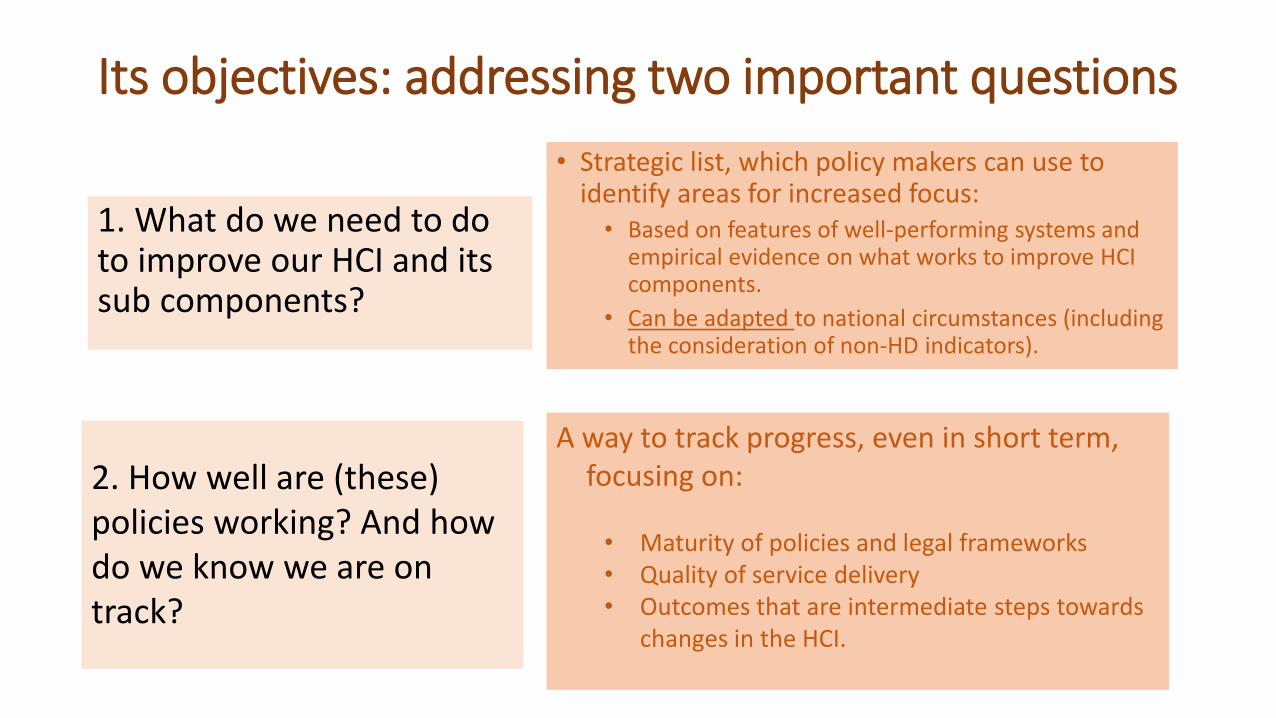
Its objectives: addressing two important questions
1. What do we need to do to improve our HCI and its sub components?
• Strategic list, which policy makers can use to identify areas for increased focus: • Based on features of well-performing systems and
empirical evidence on what works to improve HCI components.
• Can be adapted to national circumstances (including the consideration of non-HD indicators).
2. How well are (these) policies working? And how do we know we are on track?
A way to track progress, even in short term, focusing on:
• Maturity of policies and legal frameworks• Quality of service delivery• Outcomes that are intermediate steps towards
changes in the HCI.

HCI compass structure
• Policies and laws• Financing• Government Capacity
• Inputs/ Standards• Competence of
providers• Practice
• Health, Nutrition and Population
• Education• Social Protection
and Jobs

1. Enabling Environment
• Households are the key drivers of demand while providers shape supply
• The behavior of both households and providers are influenced by policies, systems and legal legislation
• De facto policy implementation will be assessed through quality of service delivery and intermediate outcomes
Policies and Legal Framework
Some examples:
1. How mature are the policies or strategies that establish early childhood development as a priority?
2. How mature are policies to adequately discourage the consumption of goods such as tobacco, alcohol and sugary beverages through fiscal policy and non-price instruments?
3. How adequate are policies to promote women’s labor force participation?
4. How mature are policies to promote road safety?
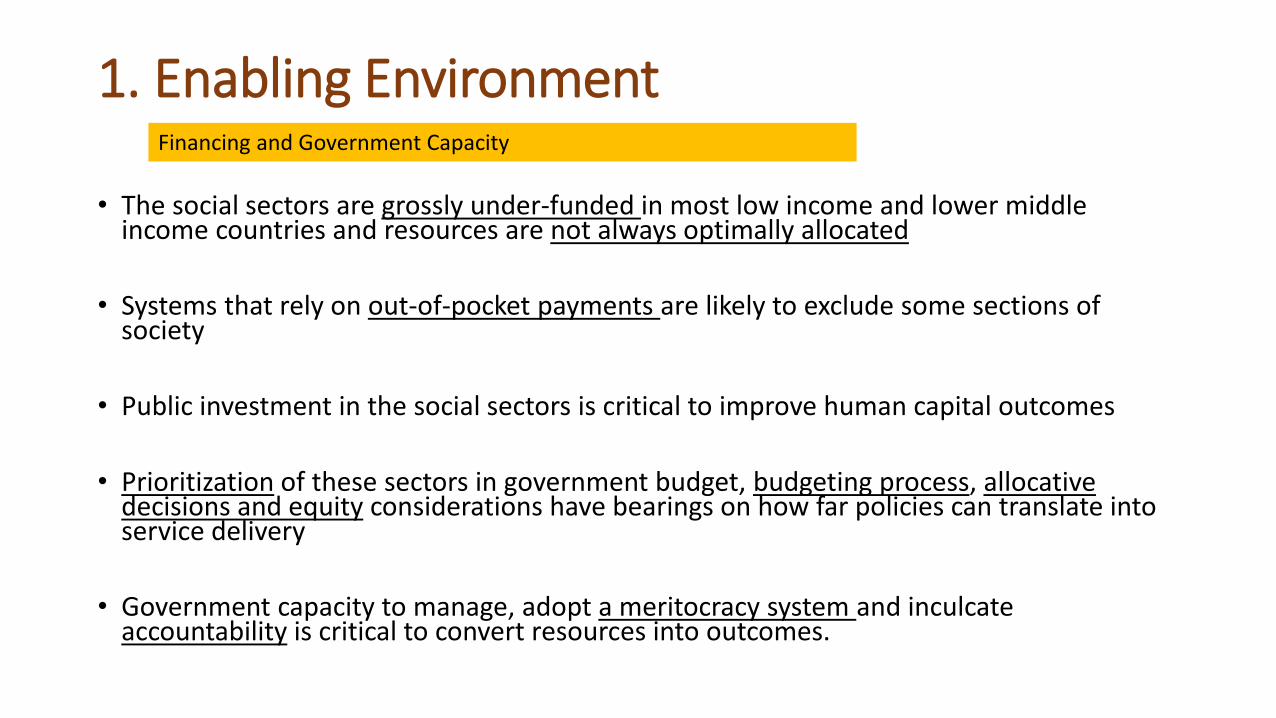
1. Enabling Environment
• The social sectors are grossly under-funded in most low income and lower middle income countries and resources are not always optimally allocated
• Systems that rely on out-of-pocket payments are likely to exclude some sections of society
• Public investment in the social sectors is critical to improve human capital outcomes
• Prioritization of these sectors in government budget, budgeting process, allocative decisions and equity considerations have bearings on how far policies can translate into service delivery
• Government capacity to manage, adopt a meritocracy system and inculcate accountability is critical to convert resources into outcomes.
Financing and Government Capacity
Some examples:
1. Share of government health expenditure spent on primary healthcare
2. Government expenditure per student in primary education as a percentage of GDP per capita.
3. What is the status of the country’s public financial management (using PEFA)
4. Spending on social assistance as % of GDP.
5. Is core decision-making impartial, as measured by extent of politicized personnel management, policy making, procurement and identification and targeting process?
6. What is the quality of bureaucracy, as measured by knowledge and skills, work environment, merit and motivation?

2. Quality of Service Delivery
• Service delivery is where the policies, legal frameworks, financing arrangements and overall government capacity manifest their effectiveness
• This section follows the broad framing of the Service Delivery Indicators:
Availability of protocols, inputs and infrastructure
Competence of service providers
Service provider practice and adherence to protocols
What providers have to work with…
What providers know…
What providers do…
Some examples:
1. UHC Service Coverage Index
2. Proportion of facilities which had stock-outs of essential medicines in a specified period.
3. Proportion of newborns who received all four elements of essential care: i) immediate and thorough drying ii) immediate skin-to-skin contact, iii) delayed cord clamping, iv) initiation of breastfeeding in the first hour.
4. Quality of teaching as measured by percent of teachers with at least minimum content knowledge, b) percent of teachers with a given level of pedagogical skills, c) presence/absence rate [grade-specific as relevant].
5. Quality of targeting of safety net programs (measured by rates of inclusion or exclusion, by program type).

3. Intermediate Outcomes
• Improvements in human capital outcomes are conditional on how the enabling environment and its impact on service delivery translate into some household/individual outcomes.
• The chosen intermediate indicators either directly affect the index components or are indirectly related to the components of the index. They are:
• Leading indicators to the HCI,
• Analytically linked to the policies
• Amenable to change with some government action

Proposed approach in implementing the Compass
Government led, multisectoral activity, where the HCP focal person plays a key role
Qualitative aspects:
• A team of high level government officials brainstorm over a 2-days workshop to judge the presence and maturity of policies/legal framework and the government capacity to manage
• Alternatively, use expert opinion surveys ( of local researchers and government officials) to judge this.
Quantitative aspects• Requires data gathering (administrative
or survey data) and analysis
Implementation started in Guatemala, Panama and Senegal.

#InvestinPeople
www.worldbank.org/humancapital
13

Annex 1.
Correlation between
intermediate outcome indicators and HCI

Correlation Coefficient: -0.939

Correlation Coefficient: 0.859

Correlation Coefficient: 0.86

Correlation Coefficient: 0.723

Correlation Coefficient: -0.623

Correlation Coefficient: -0.787

Correlation Coefficient: 0.593

Correlation Coefficient: -0.718

Correlation Coefficient: 0.515

Correlation Coefficient: 0.433

Correlation Coefficient: 0.122

Annex 2.
Correlation between
enabling environment/service delivery indicators and HCI

Correlation Coefficient: 0.524

Correlation Coefficient: 0.425

Correlation Coefficient: 0.091

Correlation Coefficient: 0.875