hba1c, fasting plasma glucose and the prediction of
TRANSCRIPT

HAL Id: inserm-00659373https://www.hal.inserm.fr/inserm-00659373
Submitted on 12 Jan 2012
HAL is a multi-disciplinary open accessarchive for the deposit and dissemination of sci-entific research documents, whether they are pub-lished or not. The documents may come fromteaching and research institutions in France orabroad, or from public or private research centers.
L’archive ouverte pluridisciplinaire HAL, estdestinée au dépôt et à la diffusion de documentsscientifiques de niveau recherche, publiés ou non,émanant des établissements d’enseignement et derecherche français ou étrangers, des laboratoirespublics ou privés.
HbA1c, fasting plasma glucose and the prediction ofdiabetes: Inter99, AusDiab and D.E.S.I.R.
Soraya Soulimane, Dominique Simon, Jonathan Shaw, Daniel Witte, PaulZimmet, Sylviane Vol, Knut Borch-Johnsen, Dianna Magliano, Dorte Vistisen,
Beverley Balkau
To cite this version:Soraya Soulimane, Dominique Simon, Jonathan Shaw, Daniel Witte, Paul Zimmet, et al.. HbA1c,fasting plasma glucose and the prediction of diabetes: Inter99, AusDiab and D.E.S.I.R.: HbA1c, FPGand prediction of diabetes. Diabetes Research and Clinical Practice, Elsevier, 2012, 96 (3), pp.392-9.�10.1016/j.diabres.2011.06.003�. �inserm-00659373�
Soulimane, HbA1c, FPG predicting diabetes 1/23 12/01/2012
HbA1c, fasting plasma glucose and the prediction of diabetes: Inter99, AusDiab and D.E.S.I.R Soraya Soulimane
a, b
Dominique Simon a, c
Jonathan Shaw
d
Daniel Witte e
Paul Zimmet d
Sylviane Vol f
Knut Borch-Johnsen g
Dianna Magliano d
Dorte Vistisen e
Beverley Balkau a, b, d
a Inserm, CESP Centre for research in Epidemiology and Population Health,
U1018, Epidemiology of diabetes, obesity and chronic kidney diseases over the lifecourse, Villejuif, France
b Université Paris Sud 11, UMRS 1018, Villejuif, France
c Groupe Hospitalier Pitié Salpetrière, Diabetes Department, Paris, France
d Baker IDI Heart and Diabetes Institute, Melbourne, Australia
e Steno Diabetes Center A/S, Gentofte, Denmark
f Institut inter Régional pour la Santé, La Riche, France
g Institute of Public Health, Research Center for Quality in Health Care, Univ.
Southern Denmark, Odense, Denmark Running title: HbA1c, FPG and prediction of diabetes N° words abstract: 188 N° words, text: 3456 3 Tables 2 Figures Data have been presented orally at: IDF congress, Montreal 18-22 October 2009 EDEG meeting, Wageningen 9-12 May 2009 Corresponding author: Soraya Soulimane CESP, INSERM U1018 16 Avenue Paul Vaillant Couturier 94807 Villejuif cedex France Telephone: +33 1 45 59 51 10 FAX: + 33 1 47 26 94 54 E-mail: [email protected]

Soulimane, HbA1c, FPG predicting diabetes 2/23 12/01/2012
ABSTRACT
INTRODUCTION: With diabetes defined by HbA1c≥6.5% &/or FPG≥7.0mmol/l &/or diabetes treatment,
we investigated HbA1c and fasting plasma glucose (FPG) thresholds/change-points above which the
incidence of diabetes increases.
METHODS: Data are Danish (Inter99), Australian (AusDiab) and French (D.E.S.I.R.), with respectively
4930, 6012 and 3784 non-diabetic participants.
RESULTS: Diabetes incidences at 5 years for Inter99 and AusDiab and at 6 years for D.E.S.I.R. were
2.3%, 3.1% and 2.4% respectively and incidences increased with baseline HbA1c and FPG. As HbA1c
distributions differed between cohorts, HbA1c was standardized on D.E.S.I.R. data. Change-points
where diabetes incidence increased were identified for HbA1c (%) after standardisation: 5.1(4.9-5.6)
(Inter99), 5.4(5.1-5.6) (AusDiab), 5.3(5.1-5.7) (D.E.S.I.R.); for FPG change-points (mmol/l) were 5.1(...-
6.1) (Inter99), 5.5(5.2-5.8) (AusDiab), no change-point for D.E.S.I.R.. Using current diabetes risk criteria
HbA1c≥5.7% &/or FPG≥5.6mmol/l to screen for diabetes provided high sensitivity (over 89%) and
positive predictive values: 4.3%, 6.9%.and 5.9% respectively.
CONCLUSIONS: HbA1c and FPG change-points predicting incident diabetes did not always exist,
differed across studies, when available were generally lower than current criteria with wide confidence
intervals. Using jointly HbA1c≥5.7% &/or FPG≥5.6mmol/l as a criterion for the risk of incident diabetes
is appropriate.
Key words: diabetes, epidemiology, fasting plasma glucose, HbA1c.
Abbreviations: FPG, Fasting plasma glucose; IFG, Impaired fasting glucose; PPV, positive predictive
value.
Soulimane, HbA1c, FPG predicting diabetes 3/23 12/01/2012
___________________________________________________________________
1. Introduction
Diabetes is a major public health problem globally and detecting those who have a high probability of
developing type 2 diabetes is a priority, so that prevention programs can be proposed to people at
greatest risk [1]. Indeed, throughout the world the number of people with diabetes is projected to
increase to 439 million in 2030 from 285 million in 2010 [2].
Several studies have tried to characterise those with a high risk of developing diabetes using
HbA1c, fasting plasma glucose (FPG) and 2-h plasma glucose (2hPG) following an oral glucose
tolerance test (OGTT) [3,4]. FPG is the least expensive of these three measures of glycaemia, but it
does require that individuals are fasting. An OGTT is time-consuming and more expensive. An
advantage of HbA1c is that individuals need not be fasting [5]. Although HbA1c can be distorted by
some diseases such as iron deficiency anaemia [6], the assay has several advantages such as a low
intra-individual variability in non-diabetic people,[7] and the International Federation for Clinical
Chemistry (IFCC) now has a method to standardize this assay, in order to overcome some of the
differences between laboratories [8, 9].
Three hyperglycaemic states have been defined to indicate a risk of diabetes: HbA1c between
5.7 and 6.4%, impaired fasting glucose (IFG, FPG between 5.6 and 6.9 mmol/l) and impaired glucose
tolerance (IGT, 2hPG between 7.8 and 11.0 mmol/l) [10]. In 2009, an Expert Committee indicated that
people with an HbA1c between 6.0% and 6.4% were at risk for diabetes [11]; the 6.0% threshold was
later lowered in the American Diabetes Association (ADA) recommendations to 5.7% in 2010 [10]. The
lower limit of IFG was decreased in 2003 from 6.1 to 5.6 mmol/l by an ADA International Expert
Committee [12]. While there are a number of studies that show there is an increased risk of diabetes
for those with IGT and IFG [13], there has not been a search for more precise thresholds for these
categories, nor for HbA1c. Indeed, the 2003 change in the definition of IFG has been disputed [14].
The oral glucose tolerance test is rarely used in clinical practice and we define diabetes in this article
by either FPG ≥ 7.0 mmol/l and/or HbA1c ≥ 6.5%, as this combination is likely to be used in clinical
practice, as proposed in other publications [15, 16]. However, we have also included diabetes defined
additionally by 2hPG ≥ 11.1 mmol/l, to evaluate possible changes in FPG and HbA1c thresholds.
We use epidemiologic studies from three countries: Denmark, Australia and France, the
prospective cohorts: Inter99, AusDiab (Australian Diabetes, Obesity and Lifestyle Study) and
Soulimane, HbA1c, FPG predicting diabetes 4/23 12/01/2012
D.E.S.I.R. (Data from an Epidemiological Study on the Insulin Resistance syndrome) to determine
whether there are thresholds or change-points for HbA1c, FPG and 2hPG, above which the incidence
of diabetes increases at a significantly higher rate than below this change-point. Thresholds are
characterised by their sensitivity, specificity, positive and negative predictive values for incident type 2
diabetes.
_________________________________________________________________________________
2. Materials and methods
Inter99 is a Danish longitudinal study set up to evaluate whether individual intervention on life style
factors (smoking, physical activity and unhealthy diet) can prevent cardiovascular disease and type 2
diabetes [17]. In 1999-2001, 13,016 individuals, 30-60 years, were randomly selected from the civil
register in south western Copenhagen County, after stratification on age and sex [17]. Of the 6,906
who participated at the baseline examination, 122 were excluded: 99 for the language barrier and 23
for abuse of drugs or alcohol [17]. Among the 6784 eligible subjects (53% participation), 5228
attended the follow-up exam at five years. We excluded from our analyses: treated diabetic patients at
baseline (64 were on insulin or oral drugs), those with missing HbA1c at baseline (n=5), missing FPG
at baseline (n=23) or at follow-up respectively (n=30 then n=7). At baseline, 169 participants had
diabetes defined by FPG ≥ 7.0 mmol/l and/or HbA1c after standardisation ≥ 6.5% and they have also
been excluded. We analysed data from the 4930 participants without diabetes at baseline. When
2hPG was additionally studied, 4592 individuals were followed. HbA1c was assayed by ion-exchange
high performance liquid chromatography technique (Bio-Rad variant) and values were DCCT-UKPDS
aligned. Plasma venous glucose were assayed by the hexokinase/G6PD method (Boehringer
Mannheim) [17]. Baseline body mass index (BMI) was evaluated in lightly clad participants.
AusDiab included 11,247 participants in 1999-2000 [18]. The selection of households was made by
cluster sampling, stratified on the six States and the Northern Territory of Australia, and six census
collectors’ districts were randomly selected in each stratum; 17,129 households were eligible but only
11,479 responded to the interview, 11,247 individuals underwent biomedical examinations and 10,916
were eligible [18]. In 2004-2005, five years after inclusion, 6537 of the eligible subjects participated in
the follow-up [19]. For analyses, among the 6378 non-diabetic subjects (159 had diabetes treatment),
we excluded 44 subjects with missing HbA1c at baseline then 77 with missing HbA1c at follow-up;

Soulimane, HbA1c, FPG predicting diabetes 5/23 12/01/2012
There was no missing data for FPG at baseline and among remaining subjects, we deleted 46 with
missing FPG at follow-up. We studied the 6012 non-diabetic participants aged between 25 and 88
years (199 participants were identified as diabetic at baseline by FPG ≥ 7.0 mmol/l and/or HbA1c ≥
6.5% after standardisation). When diabetes was additionally defined by 2hPG, 5704 individuals were
studied. The variables measured were the same as in Inter99, however, the techniques of glucose and
HbA1c assays were different. HbA1c was obtained by determining total glycated hemoglobin with
high-performance liquid chromatography (Bio-Rad VARIANT hemoglobin testing system) then an
algorithm was used to provide standardized HbA1c [19]. FPG was measured by the glucose oxidase
method at baseline and hexokinase method at follow-up [19]. BMI was evaluated at baseline.
D.E.S.I.R. is a prospective study on the insulin resistance syndrome [3]. From the 5212 volunteers
who participated, 4111 subjects were followed six years. We excluded from analyses: treated diabetic
patients at baseline (n=44) and subjects without information on treatment at baseline (n=9) or at
follow-up (n=122). We deleted subjects with missing baseline HbA1c (n=7), missing baseline FPG
(n=5), missing HbA1c then FPG at follow-up (n=56, n=9) and finally 75 participants with baseline
FPG ≥ 7.0 mmol/l and/or baseline HbA1c ≥ 6.5%. We used baseline data from 3784 men and women
aged between 30 and 65 years. In D.E.S.I.R. the 2hPG was not available. HbA1c was measured by
High Performance liquid chromatography with Bio-Rad aligned to DCTT-UKPDS standards and FPG
by an enzymatic method (glucose oxidase/ peroxydase) with a Technicon RA 1000 automated
analyser (Bayer) or a Specific or a Delta (Konelab) [3]. BMI was also evaluated at baseline.
2.1. Definitions
Diabetes was defined at baseline and at follow-up by treatment for diabetes &/or FPG ≥ 7.0 mmol/l
&/or HbA1c ≥ 6.5% (after standardization).
Three other definitions of diabetes were also used to evaluate the stability of the change-points:
1. treatment for diabetes &/or FPG ≥ 7.0 mmol/l;
2. treatment for diabetes &/or HbA1c ≥ 6.5% (after standardization);
3. treatment for diabetes &/or FPG ≥ 7.0 mmol/l &/or HbA1c ≥ 6.5%. (after standardization) &/or
2hPG ≥ 11.1 mmol/l.
Soulimane, HbA1c, FPG predicting diabetes 6/23 12/01/2012
2.2. Statistical Methods
For each study, the characteristics of participants who developed and did not develop diabetes are
described and compared between studies, using a 2 test for categorical variables and mean age, BMI
and glycaemic parameters were compared by ANOVA.
As the HbA1c distributions differed between cohorts (Fig. 1A), we standardized the HbA1c
data from Inter99 and AusDiab according to HbA1c data from the D.E.S.I.R. study. The difference in
mean HbA1c of Inter99 and AusDiab in reference to D.E.S.I.R. was estimated in a linear regression
model adjusted on age, sex and BMI. We thus subtracted 0.36% at baseline and 0.23% at follow-up
from all Inter99 HbA1c values and added 0.38% at baseline and 0.19% at follow-up to all AusDiab
HbA1c values. For FPG and 2hPG the distributions were similar across cohorts (Fig. 1B for FPG, Fig
1C for 2hPG).
The incidences of diabetes, as defined by treatment &/or FPG &/or HbA1c, are presented
graphically according to baseline HbA1c (before standardisation Fig 2A, after standardisation Fig 2B)
and according to baseline FPG (Fig. 2C), and they were modelled by logistic regression. We sought
change-points beyond which the incidence of diabetes increased significantly for FPG and HbA1c, in
separate models, and then in the same model; the likelihoods of the change point-models were
compared with the likelihoods of simple linear models, using the ² distribution [20]. The 95%
confidence intervals for the change-points were constructed by identifying the change-points
corresponding to the 2.5% and 97.5% values of the ² distribution.
The stability of the change-points was studied when diabetes was defined according to the
three other definitions of diabetes given above; for the first two definitions, the baseline population
included those without diabetes based on treatment &/or FPG &/or HbA1c; for the third definition,
those with diabetes at baseline according to 2hPG were also excluded.
Lastly, we estimated the sensitivity, specificity, positive and negative predictive values of
HbA1c and FPG for different thresholds when diabetes was defined by treatment for diabetes &/or
FPG ≥ 7.0 mmol/l &/or HbA1c ≥ 6.5%.(after standardization).
The SAS software version 9.1.3 was used for statistical analyses.
Soulimane, HbA1c, FPG predicting diabetes 7/23 12/01/2012
_________________________________________________________________________________
3. Results
The observed mean HbA1c after standardization (%) (5.4±0.4 for Inter99, 5.5±0.3 for AusDiab, and
5.4±0.4 for D.E.S.I.R.) and FPG (mmol/l) (5.5±0.4, 5.4±0.5 and 5.3±0.5 respectively for the three
cohorts) were both significantly different between cohorts (p < 0.0001). For each cohort, all studied
baseline characteristics of those who developed diabetes and those who did not were significantly
different (p < 0.03) (Table 1).
The incidences of diabetes were: 2.3% for Inter99, 3.1% for AusDiab both over 5 years and
2.4% for D.E.S.I.R. over 6 years with different percentages with diabetes screened by treatment, FPG
alone, HbA1c alone or both HbA1c and FPG (Table 1). Incidences increased with increasing baseline
HbA1c, but the actual incidence at any given value of HbA1c differed between cohorts (Fig. 2A).
However, after HbA1c standardization, the diabetes incidence curves were more similar (Fig. 2B).
Change-points were present at 5.1% (Inter99), 5.4% (AusDiab) and 5.3% (D.E.S.I.R.), with wide
confidence intervals. The incidences of diabetes with respect to baseline FPG were low and constant
up until about 5.5 mmol/l and then increased with increasing FPG (Fig. 2C). The change-points for
FPG were different for each study (5.1, 5.5 mmol/l for Inter99 and AusDiab), again with wide
confidence intervals, with no change-point for D.E.S.I.R..
When FPG and HbA1c (after standardization) were used in the same model, joint change-
points were available in all three cohorts: 5.1% for HbA1c and 5.6 mmol/l for FPG in the Inter99 study,
5.4% for HbA1c and 5.5 mmol/l for FPG in the AusDiab cohort and 5.4% for HbA1c and 5.6 mmol/l for
FPG in D.E.S.I.R..
The HbA1c change-point for predicting diabetes by the four definitions did not change in
D.E.S.I.R. (5.3%) (Table 2); for AusDiab, the definition of diabetes by FPG or by FPG &/or HbA1c
provided the same change-points (5.4%) for HbA1c, but there was a much higher change-point for the
HbA1c definition (6.4%). For Inter99, the change points varied from 5.1 to 5.9%. In AusDiab, the FPG
change-point for predicting incident diabetes was the same whatever the diabetes definition (5.5
mmol/l); there were many cases for the two other cohorts when no change-point was detected. In
particular, when the diabetes definition included 2hPG, the HbA1c changes points increased for both
Inter99 and AusDiab, but for FPG, the change point was higher for Inter99, identical for AusDiab. For
2hPG a threshold of 9.9 mmol/l was found in AusDiab, but no change-point was detected in Inter99.

Soulimane, HbA1c, FPG predicting diabetes 8/23 12/01/2012
Test characteristics are shown for different thresholds of both FPG and HbA1c, when diabetes
was defined by treatment &/or FPG &/or HbA1c (Table 3). For the currently proposed HbA1c threshold
for diabetes risk of 5.7% [10], the positive predictive values were respectively 5.9% for Inter99, 11%
for AusDiab and 7.6% for D.E.S.I.R.; for the FPG threshold of 5.6 mmol/l, the positive predictive values
were respectively 4.8%, for Inter99, 7.6%,.for AusDiab and 7.3% for D.E.S.I.R..
For the combination of these two thresholds currently used individually as indicators for a risk
for diabetes: HbA1c ≥ 5.7% & FPG ≥ 5.6 mmol/l, the sensitivity, specificity, positive and negative
predictive values were: 54%, 87%, 8.6% and 99% for Inter99, 68%, 89%, 16% and 99% for AusDiab
and 52%, 92%, 14% and 99% for D.E.S.I.R.; when we used the condition: HbA1c ≥ 5.7% &/or
FPG ≥ 5.6 mmol/l, these values were respectively: 94%, 50%, 4.3% and 100% for Inter99, 93%, 60%,
6.9% and 100% for AusDiab and 89%, 65%, 5.9% and 100% for D.E.S.I.R.. Positive predictive values
were lower for this second combination of thresholds than for the first combination.
________________________________________________________________________________
4. Discussion
We found change-points above which the incidence of diabetes began to increase significantly in
Inter99 (for HbA1c at 5.5% before and 5.1% after standardization; for FPG at 5.1 mmol/l), in AusDiab
(for HbA1c at 5.9% before and 5.4% after standardisation; for FPG at 5.5 mmol/l) and D.E.S.I.R (for
HbA1c at 5.3%, no change-point detected for FPG). Change-points for FPG and HbA1c in the same
model were 5.1% for HbA1c and 5.6 mmol/l for FPG for Inter99, 5.4% and 5.5 mmol/l respectively for
AusDiab and 5.4% and 5.6 mmol/l respectively for D.E.S.I.R..
Positive predictive values showed a similar increase for all three cohorts, with a three to four
fold increase for an HbA1c of 6.0% in comparison to 5.5% and a two to three fold increase for FPG at
6.0 mmol/l in comparison to 5.5 mmol/l. Positive predictive values for predicting diabetes were higher
when we used both HbA1c & FPG than when we used HbA1c &/or FPG. Thus while the change-point
method identified thresholds where the incidences increased, the absolute increase in positive
predictive values at these points was not large. The negative predictive values were always close to
100%, while sensitivity was always higher than specificity for the currently recommended thresholds
for hyperglycaemia of 5.6 mmol/l for FPG, while specificity was higher than sensitivity for HbA1c at
5.7%.

Soulimane, HbA1c, FPG predicting diabetes 9/23 12/01/2012
We explored separately data from three large studies (Danish, Australian and French) with a
monitoring period of at least five years: the follow-up period was the same for Inter99 and AusDiab (5
years), one year more for D.E.S.I.R. (6 years). Among the limitations of our study, Inter99 is
population-based, with a 53% acceptance to participate at baseline and two thirds were then followed;
in AusDiab, 55% of invited participants underwent a biomedical examination at baseline, and then
58% of these were followed [19]; the D.E.S.I.R. cohort is not population-based, but 70% of the
participants were able to be followed. There were differences in the three cohorts between those
followed and not-followed, for at least one of the characteristics: gender, age, HbA1c, FPG, 2hPG or
BMI, thus the studied population differed from that at inclusion (data not shown), however these
differences while statistically significant, were minor. Another limitation is that the assay techniques
used to measure HbA1c and plasma glucose were not the same in the three studies. All three HbA1c
assays were DCCT-UKPDS aligned but as the distributions of HbA1c differed between the three
cohorts, we standardised HbA1c measures on the D.E.S.I.R. study, after taking into account the age,
sex and BMI differences in the three cohorts. Thus we are assuming that the basic distribution of
HbA1c is identical in all three populations, after taking into account age, sex and BMI, and that the
observed differences between HbA1c distributions were due to differences in the assays.
Other published studies have also analysed HbA1c and incident diabetes. Edelman et al.
found that diabetes incidence was 2.5% per year for HbA1c between 5.6% and 6.0% [21]. The Expert
Committee defined individuals with an HbA1c between 6.0% and 6.5% as being at high risk of
diabetes [11]; subsequently, in January 2010 a new threshold of 5.7% was published in the ADA
recommendations [10]. A recent study of Caucasian Europeans proposed that the most appropriate
cut-point, using receiver operating characteristic (ROC) curves for the identification of IFG or IGT, was
5.8% [22]. The limits found by the change-point method in our analyses were lower (5.1% in Inter99,
5.4% in AusDiab and 5.3% in D.E.S.I.R.). Indeed, a systematic review has also indicated that there
was a relationship between HbA1c and incident diabetes for HbA1c values from 5% [23] and
Nakagami et al. found using a ROC curve that the optimal cut point for HbA1c in the prediction of
incident diabetes over 5 years was at 5.1%, according to the Japan Diabetes Society HbA1c
standardization, that is equivalent to 5.4% when aligned with the National Glycoprotein
Standardization Program standardization [24]. However, the positive predictive values for the
prediction of diabetes in our analyses double when baseline HbA1c increases from 5.0 to 5.5%, and

Soulimane, HbA1c, FPG predicting diabetes 10/23 12/01/2012
treble or quadruple between 5.5 and 6.0%, an exponential increase. For the prediction of diabetic
complications, a different threshold might be recommended.
For FPG, change-points were at 5.1 mmol/l for Inter99 and 5.5 mmol/l for AusDiab with no
change-point in D.E.S.I.R.. The Expert Committee published in the 2003 follow-up report, that the
threshold values to predict diabetes found in Dutch, Pima Indian, Mauritius and San Antonio
populations, were respectively: 5.7 mmol/l, 5.4 mmol/l, 5.4 mmol/l and 5.2 mmol/l using again, the
criteria of maximizing sensitivity and specificity [25]. In our three studies, the 6.0 mmol/l threshold had
a two to three fold higher positive predictive value than 5.5 mmol/l, whereas the positive predictive
values for lower FPG values were similar.
We have not studied the ‘optimum’ thresholds, from sensitivity and specificity analyses; this
maximisation is inappropriate as in screening for diabetes, and identifying those at risk of diabetes, the
sensitivity is more important than the specificity. The change-point method provided different values in
the three populations, and the confidence intervals were very wide. We believe that the positive
predictive value may be the more appropriate metric to identify thresholds. Even though the positive
predictive value is dependent on the basic incidence of diabetes in each population, it increased
similarly for all cohorts, for both parameters: HbA1c and FPG.
Inoe et al. [26] analysed data from 10 042 Japanese men and women with a follow-up period
of 5.5 years and baseline FPG < 7.0 mmol/l; they found that the cumulative incidence of diabetes was
more than 2.0% for HbA1c between 5.5% and 6.4%. The use of HbA1c would have allowed the
identification of people with a higher diabetes risk that would not have been detected by FPG alone.
The 5.5% threshold was close to the change-points that we found (5.4% for AusDiab, 5.3% for
D.E.S.I.R.). Inoue et al. also sought the cumulative incidence of diabetes among subjects with IFG
who had HbA1c between 5.5% and 6.4%; it was 25%, higher than the cumulative incidence in those
with IFG and HbA1c <5.5% (7.6%) [26].
Other studies analysed HbA1c according to ethnicity. The Third National Health and Nutrition
Examination Survey data the U.S. found that the distribution of HbA1c differed between races; the
mean HbA1c for non-treated individuals was higher in black non-Hispanic than in Mexican-Americans
and lower in non-Hispanic whites [27].
We have previously studied incident diabetes, where diabetes was defined by treatment
and/or HbA1c ≥ 6.5% [28]. In strictly non-diabetic subjects, those with HbA1c < 6.5% and

Soulimane, HbA1c, FPG predicting diabetes 11/23 12/01/2012
FPG < 7.0 mmol/l and no treatment for diabetes, HbA1c was able to predict incident diabetes, defined
by HbA1c ≥ 6.5% and/or treatment, with an area under the receiver operating characteristic curve of
0.84, 0.91 and 0.82 for Inter99, AusDiab and D.E.S.I.R. respectively, indicating that HbA1c was able to
discriminate incident diabetes as defined by HbA1c [28].
For HbA1c, while the three studies showed similar incidence curves, the HbA1c distributions
differed considerably. The need for standardization of the HbA1c assay, so that it is more closely
aligned to the DCCT-UKPDS standard, and better to the IFCC standard, is necessary if HbA1c is to be
used as a diagnostic criterion for diabetes. The ADA recommendation states explicitly that the HbA1c
assay should be standardized [8,9].
In conclusion, our results show that both HbA1c and FPG predict diabetes, defined on the
basis of treatment and/or high glucose and/or high HbA1c values, with similar incidence curves. Even
after standardisation of HbA1c, there were differing change-points in the three studies for HbA1c and
equally for FPG, as well as differences according to the definition of diabetes. Change-points were
lower than the thresholds proposed to define hyperglycemic states by the World Health Organisation
and the American Diabetes Association, and they had large confidence intervals. The current
thresholds of 5.7% for HbA1c and 5.6 mmol/L for FPG appear adequate, and if either one or the other
occurs, the positive predictive values for incident diabetes corresponds to approximately twice the
incidence of diabetes in the background population.
________________________________________________________________________________
Conflict of interest
KBJ holds stock shares in Novo Nordisk.
DW and DV are employed by Steno Diabetes Center A/S, a research and teaching hospital working in
the Danish National Health Service and owned by Novo Nordisk A/S. DW and DV hold stock shares in
Novo Nordisk A/S.
The other authors declare no conflict of interest.
____________________________________________________________________

Soulimane, HbA1c, FPG predicting diabetes 12/23 12/01/2012
Acknowledgments AusDiab
The AusDiab study, co-coordinated by the Baker IDI Heart and Diabetes Research Institute, gratefully
acknowledges the generous support given by: National Health and Medical Research Council
(NHMRC grant 233200), and by the Commonwealth Department of Health and Aged Care. In addition,
we are most grateful to the following for their support: Abbott Australasia, Alphapharm, AstraZeneca,
Aventis Pharmaceutical, Bristol–Myers Squibb Pharmaceuticals, Eli Lilly (Australia), GlaxoSmithKline,
Janssen–Cilag (Australia), Merck Lipha, Merck Sharp & Dohme (Australia), Novartis Pharmaceutical
(Australia), Novo Nordis Pharmaceutical, Pharmacia and Upjohn, Pfizer, Roche Diagnostics, Sanofi
Synthelabo (Australia), Servier Laboratories (Australia), Bio-Rad Laboratories, HITECH Pathology, the
Australian Kidney Foundation, Diabetes Australia, Diabetes Australia (Northern Territory), Queensland
Health, South Australian Department of Human Services, Tasmanian Department of Health and
Human Services, Territory Health Services and Victorian Department of Human Services, and Health
Department of Western Australia. For their invaluable contribution to the set-up and field activities of
AusDiab, we are enormously grateful to: A. Allman, B. Atkins, S. Bennett, A. Bonney, S. Chadban, M.
de Courten, M. Dalton, D. Dunstan, T. Dwyer, H. Jahangir, D. Jolley, D. McCarty, A. Meehan, N.
Meinig, S. Murray, K. O’Dea, K. Polkinghorne, P. Phillips, C. Reid, A. Stewart, R. Tapp, H. Taylor, T.
Whalen and F. Wilson. Finally, we thank the AusDiab participants for volunteering their time to
participate in the study.
JES is supported by a National Health and Medical Research Council Senior Research Fellowship
(No. 586623).
INTER99
This study was supported by grants from the Danish Diabetes Association, the Danish Medical
Research Council, the Danish Centre for Evaluation and Health Technology Assessment, Novo
Nordisk, GlaxoSmithKline, Copenhagen County, the Danish Heart Foundation, the Danish
Pharmaceutical Association, the Augustinus Foundation, the Ib Henriksen Foundation and the Becket
Foundation. The Inter99 study was initiated by T. Jørgensen (principal investigator [PI]), K. Borch-
Johnsen (co-PI), H. Ibsen and T. Thomsen. The Inter99 steering committee comprises T. Jørgensen,
K. Borch-Johnsen and C. Pisinger. The authors thank the staff of Inter99 and all the participants.
D.E.S.I.R.
The D.E.S.I.R. study has been supported by INSERM contracts with CNAMTS, Lilly, Novartis Pharma
and Sanofi-Aventis; by INSERM (Réseaux en Santé Publique, Interactions entre les déterminants de
la santé), Cohortes Santé TGIR, the Association Diabète Risque Vasculaire, the Fédération Française
de Cardiologie, La Fondation de France, ALFEDIAM, ONIVINS, Ardix Medical, Bayer Diagnostics,
Becton Dickinson, Cardionics, Merck Santé, Novo Nordisk, Pierre Fabre, Roche, Topcon.
The D.E.S.I.R. Study Group: INSERM CESP U1018: B Balkau, P Ducimetière, E Eschwège; INSERM
U367: F. Alhenc-Gelas; CHU D’Angers: Y Gallois, A Girault; Bichat Hospital: F Fumeron, M Marre;

Soulimane, HbA1c, FPG predicting diabetes 13/23 12/01/2012
CHU de Rennes: F Bonnet; CNRS UMR8090, Lille: P Froguel; Centres d’Examens de Santé: Alençon,
Angers, Blois, Caen, Chateauroux, Cholet, Chartres, Le Mans, Orléans, Tours; Institute de Recherche
Médecine Générale: J Cogneau; General practitioners of the region; Institute inter-Regional pour la
Santé: C Born, E Caces, M Cailleau, JG Moreau, O Lantieri, F Rakotozafy, J Tichet, S Vol.
REFERENCES
___________________________________________________________________
[1] Narayan KM, Boyle JP, Geiss LS, Saaddine JB, Thompson TJ. Impact of recent
increase in incidence on future diabetes burden: U.S., 2005-2050. Diabetes Care,
2006;29:2114-6.
[2] Shaw JE, Sicree RA, Zimmet PZ. Global estimates of the prevalence of diabetes
for 2010 and 2030. Diabetes Res Clin Pract, 2010;87:4-14.
[3] Droumaguet C, Balkau B, Simon D, Caces E, Tichet J, Charles MA et al. Use of
HbA1c in predicting progression to diabetes in French men and women: data
from an Epidemiological Study on the Insulin Resistance Syndrome (DESIR).
Diabetes Care, 2006;29:1619-25.
[4] Abdul-Ghani MA, Lyssenko V, Tuomi T, DeFronzo RA, Groop L. Fasting versus
postload plasma glucose concentration and the risk for future type 2 diabetes:
results from the Botnia Study. Diabetes Care, 2009;32:281-6.
[5] American Diabetes Association. Screening for type 2 diabetes. Diabetes Care,
2004;27 (Suppl. 1):S11-4.
[6] Kim C, Bullard KM, Herman WH, Beckles GL. Association between iron
deficiency and A1C Levels among adults without diabetes in the National Health
and Nutrition Examination Survey, 1999-2006. Diabetes Care, 2010;33:780-5.
[7] Borch-Johnsen K, Colagiuri S. Diagnosing diabetes--time for a change?
Diabetologia, 2009;52:2247-50.
[8] Consensus committee. Consensus statement on the worldwide standardization of
the hemoglobin A1C measurement: the American Diabetes Association,
European Association for the Study of Diabetes, International Federation of
Clinical Chemistry and Laboratory Medicine, and the International Diabetes
Federation. Diabetes Care, 2007;30:2399-400.
[9] Hanas R, John G. 2010 consensus statement on the worldwide standardization of
the hemoglobin A(1c) measurement. Diabetes Res Clin Pract, 2010;90:228-30.
[10] American Diabetes Association. Diagnosis and classification of diabetes mellitus.
Diabetes Care, 2010;33 (Suppl. 1):S62-9.
[11] International Expert Committee. International Expert Committee report on the
role of the A1C assay in the diagnosis of diabetes. Diabetes Care,
2009;32:1327-34.
[12] Expert Committee on the Diagnosis and Classification of Diabetes Mellitus.

Soulimane, HbA1c, FPG predicting diabetes 14/23 12/01/2012
Report of the expert committee on the diagnosis and classification of diabetes
mellitus. Diabetes Care, 2003;26 (Suppl 1):S5-20.
[13] Borch-Johnsen K, Colagiuri S, Balkau B, Glumer C, Carstensen B,
Ramachandran A et al. Creating a pandemic of prediabetes: the proposed new
diagnostic criteria for impaired fasting glycaemia. Diabetologia, 2004;47:1396-
402.
[14] Dekker JM, Balkau B. Counterpoint: impaired fasting glucose: The case against
the new American Diabetes Association guidelines. Diabetes Care,
2006;29:1173-5.
[15] Sato KK, Hayashi T, Harita N, Yoneda T, Nakamura Y, Endo G et al. Combined
measurement of fasting plasma glucose and A1C is effective for the prediction of
type 2 diabetes: the Kansai Healthcare Study. Diabetes Care, 2009;32:644-6.
[16] Cederberg H, Saukkonen T, Laakso M, Jokelainen J, Härkönen P, Timonen M et
al. Postchallenge glucose, A1C, and fasting glucose as predictors of type 2
diabetes and cardiovascular disease: A 10-year prospective cohort study.
Diabetes Care, 2010; 33:2077-83.
[17] Glumer C, Jorgensen T, Borch-Johnsen K. Inter99 study. Prevalences of
diabetes and impaired glucose regulation in a Danish population: the Inter99
study. Diabetes Care, 2003;26:2335-40.
[18] Dunstan DW, Zimmet PZ, Welborn TA, Cameron AJ, Shaw J, de Courten M et
al. The Australian Diabetes, Obesity and Lifestyle Study (AusDiab)--methods and
response rates. Diabetes Res Clin Pract,, 2002;57:119-29.
[19] Magliano DJ, Barr EL, Zimmet PZ, Cameron AJ, Dunstan DW, Colagiuri S et al.
Glucose indices, health behaviors, and incidence of diabetes in Australia: the
Australian Diabetes, Obesity and Lifestyle Study. Diabetes Care,
2008;31:267-72.
[20] Ulm K. A statistical method for assessing a threshold in epidemiological studies.
Stat. Med., 1991;10:341-9.
[21] Edelman D, Olsen MK, Dudley TK, Harris AC, Oddone EZ. Utility of hemoglobin
A1c in predicting diabetes risk. J. Gen. Intern. Med., 2004;19:1175-80.
[22] Mostafa SA, Khunti K, Srinivasan BT, Webb D, Gray LJ, Davies MJ. The
potential impact and optimal cut-points of using glycated haemoglobin, HbA1c, to
detect people with impaired glucose regulation in a UK multi-ethnic cohort.
Diabetes Res. Clin. Pract., 2010;90:100-8.
[23] Zhang X, Gregg EW, Williamson DF, Barker LE, Thomas W, Bullard KM et al.
A1C level and future risk of diabetes: a systematic review. Diabetes Care,
2010;33:1665-73.
[24] Nakagami T, Tajima N, Oizumi T, Karasawa S, Wada K, Kameda W et al.
Hemoglobin A1c in predicting progression to diabetes. Diabetes Res Clin Pract.,
2010;87:126-31.

Soulimane, HbA1c, FPG predicting diabetes 15/23 12/01/2012
[25] Genuth S, Alberti KG, Bennett P, Buse J, Defronzo R, Kahn R et al. Follow-up
report on the diagnosis of diabetes mellitus. Diabetes Care, 2003;26:3160-7.
[26] Inoue K, Matsumoto M, Akimoto K. Fasting plasma glucose and HbA1c as risk
factors for Type 2 diabetes. Diabet. Med., 2008;25:1157-63.
[27] Saaddine JB, Fagot-Campagna A, Rolka D, Narayan KM, Geiss L, Eberhardt M et
al. Distribution of HbA(1c) levels for children and young adults in the U.S.: Third
National Health and Nutrition Examination Survey. Diabetes Care,
2002;25:1326-30.
[28] Soulimane S, Simon D, Shaw JE, Zimmet PZ, Vol S, Vistisen D et al. Comparing
incident diabetes as defined by fasting plasma glucose or by HbA1c. The
AusDiab, Inter99 and D.E.S.I.R. studies. Diabetic Medicine in press

Soulimane, HbA1c, FPG predicting diabetes 16/23 12/01/2012
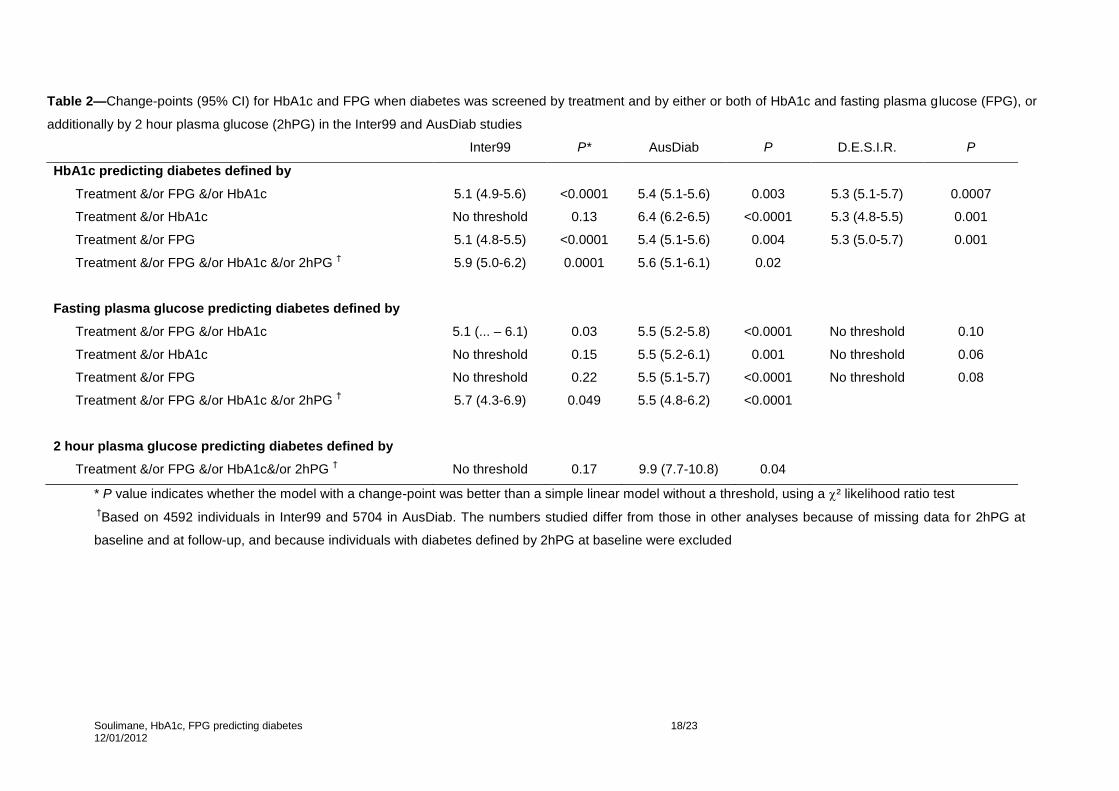
FIGURE LEGENDS Fig. 1— The distribution of A. HbA1c, B. fasting plasma glucose (FPG) and C. 2 hour plasma
glucose (2hPG) at baseline, in the three cohorts, AusDiab, Inter99 and D.E.S.I.R.. The population
studied was those followed-up, not treated for diabetes at baseline and without missing data for
FPG and HbA1c : 4930 individuals for Inter99, 6012 for AusDiab, 3784 for D.E.S.I.R.. For 2hPG
there are 4592 individuals for Inter99 and 5704 for AusDiab.
Fig. 2— Incident diabetes (%), in the three studies: Inter99, AusDiab, D.E.S.I.R.. Diabetes is
defined by treatment &/or fasting plasma glucose (FPG) > 7.0 mmol/l and/or HbA1c > 6.5%. The
curves show the predicted incidence of diabetes at follow up from logistic regression models,
the points show the observed incidences, according to baseline values of HbA1c (A: before
HbA1c standardisation, B: after HbA1c standardisation) and FPG (C). The p values for the
presence of a change-point where the slope of the relation changes and the change-points
(95% CI), are given.

Soulimane, HbA1c, FPG predicting diabetes 17/23 12/01/2012
Table 1—Description of incident diabetes n (%) according to screening method; baseline characteristics (mean ± SD, n (%)), according to incident diabetes status. Inter99
(followed 5 years), AusDiab (followed 5 years), and D.E.S.I.R. (followed 6 years), with diabetes defined by treatment for diabetes and/or fasting plasma glucose ≥ 7.0 mmol/l
&/or HbA1c ≥ 6.5%.
Inter99
N=4930
AusDiab
N=6012
D.E.S.I.R.
N=3784
No incident
diabetes
Incident
diabetes P value
No incident
diabetes
Incident
diabetes P value
No incident
diabetes
Incident
diabetes P value
n=4816 n=114
(2.3%)
n=5826 n=186
(3.1%)
n=3692 n=92
(2.4%)
Treatment for diabetes (%) 16 (0.3) 55 (0.9) 25 (0.7)
FPG ≥ 7mmol/l alone (%) 59 (1.2) 71 (1.2) 27 (0.7)
HbA1c ≥ 6.5% alone (%) 20 (0.4) 15 (0.3) 18 (0.4)
FPG ≥ 7mmol/l & HbA1c ≥ 6.5% (%) 19 (0.4) 45 (0.7) 22 (0.6)
Age (years) 46 ± 8 50 ± 6 <.0001 51 ± 13 56 ± 12 <.0001 47 ± 10 52 ± 9 <.0001
Men (%) 2348(48.7) 77(67.5) <.0001 2566(44.0) 96(51.6) 0.03 1776(48.1) 63(68.5) <.0001
HbA1c before standardisation (%)† 5.7 ± 0.3 6.1 ± 0.3 <.0001 5.1 ± 0.3 5.5 ± 0.3 <.0001 5.4 ± 0.4 5.8 ± 0.4 <.0001
HbA1c after standardisation (%) 5.4 ± 0.4 5.8 ± 0.4 <.0001 5.5 ± 0.3 5.9 ± 0.3 <.0001 5.4 ± 0.4 5.8 ± 0.4 <.0001
Fasting plasma glucose (mmol/l) 5.4 ± 0.5 6.1 ± 0.5 <.0001 5.3 ± 0.5 6.1 ± 0.6 <.0001 5.2 ± 0.5 6.0 ± 0.5 <.0001
2 hour plasma glucose (mmol/l)
BMI (kg/m²) 26.0 ± 4.3 30.1 ± 4.8 <.0001 26.5 ± 4.6 30.6 ± 5.7 <.0001 24.5 ± 3.5 28.7 ±4.8 <.0001
†Based on 4703 participants for Inter99 (with 132 (2.8%) with incident diabetes), 6025 for AusDiab (186 (3.1%) with incident diabetes) and 3784 for D.E.S.I.R.
(92 (2.4%) with incident diabetes). The numbers studied changed after HbA1c standardisation as different individuals were included/excluded by the 6.5%
HbA1c threshold.
Soulimane, HbA1c, FPG predicting diabetes 18/23 12/01/2012
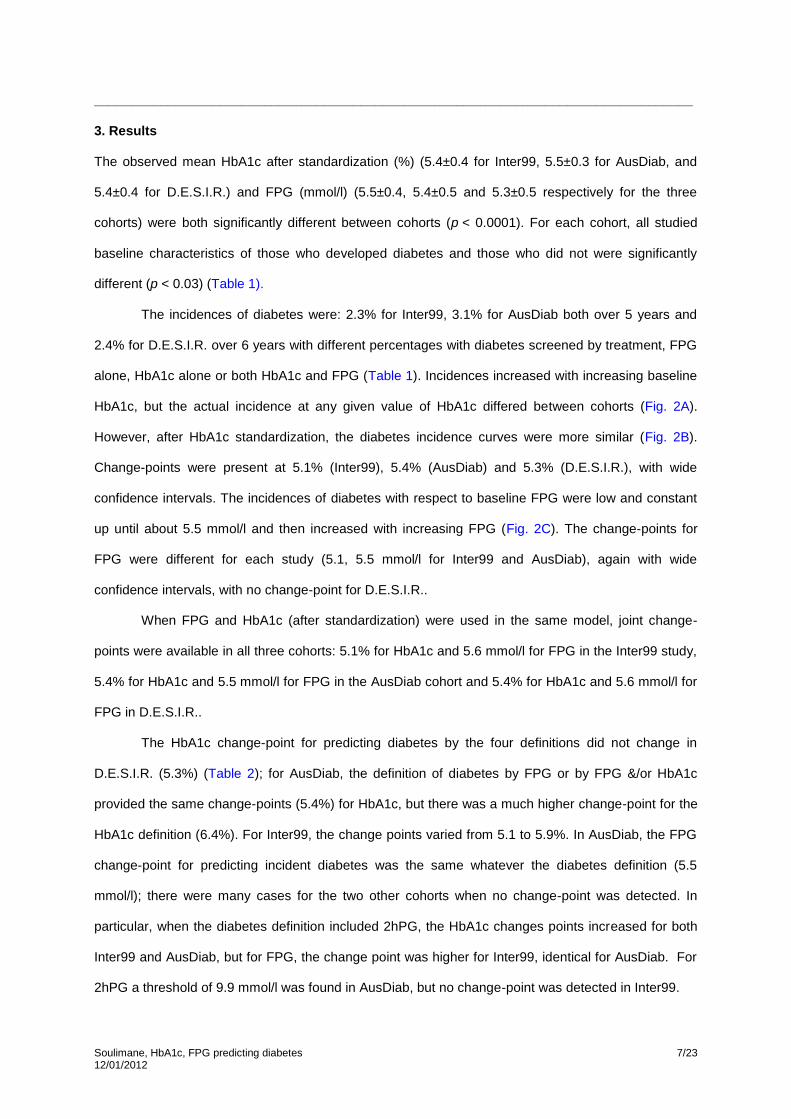
Table 2—Change-points (95% CI) for HbA1c and FPG when diabetes was screened by treatment and by either or both of HbA1c and fasting plasma glucose (FPG), or
additionally by 2 hour plasma glucose (2hPG) in the Inter99 and AusDiab studies
Inter99 P* AusDiab P D.E.S.I.R. P
HbA1c predicting diabetes defined by
Treatment &/or FPG &/or HbA1c 5.1 (4.9-5.6) <0.0001 5.4 (5.1-5.6) 0.003 5.3 (5.1-5.7) 0.0007
Treatment &/or HbA1c No threshold 0.13 6.4 (6.2-6.5) <0.0001 5.3 (4.8-5.5) 0.001
Treatment &/or FPG 5.1 (4.8-5.5) <0.0001 5.4 (5.1-5.6) 0.004 5.3 (5.0-5.7) 0.001
Treatment &/or FPG &/or HbA1c &/or 2hPG † 5.9 (5.0-6.2) 0.0001 5.6 (5.1-6.1) 0.02
Fasting plasma glucose predicting diabetes defined by
Treatment &/or FPG &/or HbA1c 5.1 (... – 6.1) 0.03 5.5 (5.2-5.8) <0.0001 No threshold 0.10
Treatment &/or HbA1c No threshold 0.15 5.5 (5.2-6.1) 0.001 No threshold 0.06
Treatment &/or FPG No threshold 0.22 5.5 (5.1-5.7) <0.0001 No threshold 0.08
Treatment &/or FPG &/or HbA1c &/or 2hPG † 5.7 (4.3-6.9) 0.049 5.5 (4.8-6.2) <0.0001
2 hour plasma glucose predicting diabetes defined by
Treatment &/or FPG &/or HbA1c&/or 2hPG † No threshold 0.17 9.9 (7.7-10.8) 0.04
* P value indicates whether the model with a change-point was better than a simple linear model without a threshold, using a ² likelihood ratio test
†Based on 4592 individuals in Inter99 and 5704 in AusDiab. The numbers studied differ from those in other analyses because of missing data for 2hPG at
baseline and at follow-up, and because individuals with diabetes defined by 2hPG at baseline were excluded

Soulimane, HbA1c, FPG predicting diabetes 19/23 12/01/2012
Table 3—Sensitivity (%), specificity (%), positive predictive values (%), negative predictive values (%) for incident diabetes defined by
treatment &/or FPG &/or HbA1c, for various thresholds of HbA1c (after standardization) and fasting plasma glucose (FPG).
Sensitivity (%) Specificity (%) Positive Predictive Value (%) Negative Predictive Value (%)
HbA1c (%) 5.0 5.5 5.7 6.0 6.4 5.0 5.5 5.7 6.0 6.4 5.0 5.5 5.7 6.0 6.4 5.0 5.5 5.7 6.0 6.4
Inter99 95 80 65 42 6.1 13 57 76 93 100 2.5 4.2 5.9 13 29 99 99 99 99 98
AusDiab 99 88 78 45 2.1 3.1 59 81 96 100 3.2 6.3 11 28 27 99 99 99 98 97
D.E.S.I.R. 96 80 66 38 4.3 13 61 80 95 100 2.7 4.9 7.6 17 44 99 99 99 98 98
FPG (mmol/l)
5.0 5.5 5.6 6.0 6.5 6.8 5.0 5.5 5.6 6.0 6.5 6.8 5.0 5.5 5.6 6.0 6.5 6.8 5.0 5.5 5.6 6.0 6.5 6.8
Inter99 97 87 83 70 32 12 15 54 61 84 97 99 2.6 4.2 4.8 9.6 18 34 99 99 99 99 98 98
AusDiab 95 83 82 65 34 11 19 61 68 89 98 100 3.6 6.4 7.6 15 36 54 99 99 99 99 98 97
D.E.S.I.R. 94 75 75 55 17 7.6 32 70 76 93 99 100 3.3 5.9 7.3 17 28 39 99 99 99 99 98 98

Soulimane, HbA1c, FPG predicting diabetes 20/23 12/01/2012
Soulimane, HbA1c, FPG predicting diabetes 21/23 12/01/2012

Soulimane, HbA1c, FPG predicting diabetes 22/23 12/01/2012

Soulimane, HbA1c, FPG predicting diabetes 23/23 12/01/2012