hazards due to smoke migration through elevator … due to smoke migration through elevator shafts...
TRANSCRIPT

Hazards Due to Smoke Migration Through Elevator Shafts – Volume I:
Analysis and Discussion. Final Report
John H. Klote
John H. Klote, Inc.43262 Meadowood Court
Leesburg, VA 20176
NIST GCR 04-864-I


NIST GCR 04-864-I
Hazards Due to Smoke Migration Through Elevator Shafts – Volume I:
Analysis and Discussion. Final Report
Prepared forU.S. Department of Commerce
Building and Fire Research LaboratoryNational Institute of Standards and Technology
Gaithersburg, MD 20899-8664
ByJohn H. Klote
John H. Klote, Inc.43262 Meadowood Court
Leesburg, VA 20176
June 2004
U.S. Department of CommerceDonald L. Evans, Secretary
Technology Administration
Phillip J. Bond, Under Secretary for Technology
National Institute of Standards and TechnologyArden L. Bement, Jr., Director
Notice
This report was prepared for the Building and Fire Research Laboratory of the National Institute of Standards and Technology under Contract number SB134-03-W-0477. The statement and conclusions contained in this report are those of the authors and do not necessarily reflect the views of the National Institute of Standards and Technology or the Building and Fire Research Laboratory. ii

ii
Table of Contents Abstract ........................................................................................................................................... 1 1. Introduction................................................................................................................................. 1 2. Scenarios ..................................................................................................................................... 2 3. Buildings ..................................................................................................................................... 2
3.1 Fire Type............................................................................................................................... 2 3.2 Fire Floors............................................................................................................................. 3 3.3 Building Flow Paths.............................................................................................................. 3 3.4 Weather ................................................................................................................................. 3 3.5 Building Temperature ........................................................................................................... 3 3.6 Methods for Reduction of Hoistway Smoke Flow ............................................................... 4
3.6.1 Enclosed Elevator Lobbies ............................................................................................ 4 3.6.2 Temporary Barriers........................................................................................................ 4 3.6.3 Positioning Of Elevator Cars ......................................................................................... 4
3.7 Arrangement of Doors .......................................................................................................... 4 3.8 Windows ............................................................................................................................... 4
4. Analysis of Scenarios.................................................................................................................. 4 4.1 Smoke Transport................................................................................................................... 5 4.3 People Movement ................................................................................................................. 5 4.4 Tenability .............................................................................................................................. 5
4.4.1 Visibility ........................................................................................................................ 5 4.4.2 Exposure to Toxic Gases ............................................................................................... 6 4.4.3 Exposure to Heat............................................................................................................ 7
5. Discussion of Results.................................................................................................................. 7 5.1 Fire Types ............................................................................................................................. 7 5.2 Temperature .......................................................................................................................... 7 5.3 Methods of Reducing Smoke Flow through Hoistways ....................................................... 7
5.3.1 Enclosed Elevator Lobbies ............................................................................................ 7 5.3.2 Automatic Roll Down Barriers ...................................................................................... 8 5.3.3 Positioning Of Elevator Cars ......................................................................................... 8
5.4 Outside Temperature............................................................................................................. 8 6. Future Research .......................................................................................................................... 8 7. Summary & Conclusions ............................................................................................................ 9 8. References................................................................................................................................... 9 Appendix A – Fires....................................................................................................................... 22 Appendix B – Fuel Properties....................................................................................................... 28 Appendix C – Wind ...................................................................................................................... 30

iii
List of Figures Figure 1. Typical Floor Plan of Building A.................................................................................. 15 Figure 2. Typical Floor Plan of Buildings B and C ...................................................................... 15 Figure 3. Elevator Layout for Building D..................................................................................... 16 Figure 4. Ground Floor Plan of Building D.................................................................................. 17 Figure 5. Elevator Layout for Building E ..................................................................................... 18 Figure 6. Ground Floor Plan of Building E .................................................................................. 19 Figure 7. HRR Curves of Fires Used in This Project ................................................................... 20 Figure 8. Thermal Tolerance of Naked Humans at Rest With Low Air Movement..................... 21
List of Tables Table 1. List of Scenarios ............................................................................................................ 12 Table 2. List of Buildings ............................................................................................................ 12 Table 3. Building Flow Areas...................................................................................................... 13 Table 4. Calculated Time (minutes) to Reach Tenability Specific Limits .................................. 14
1
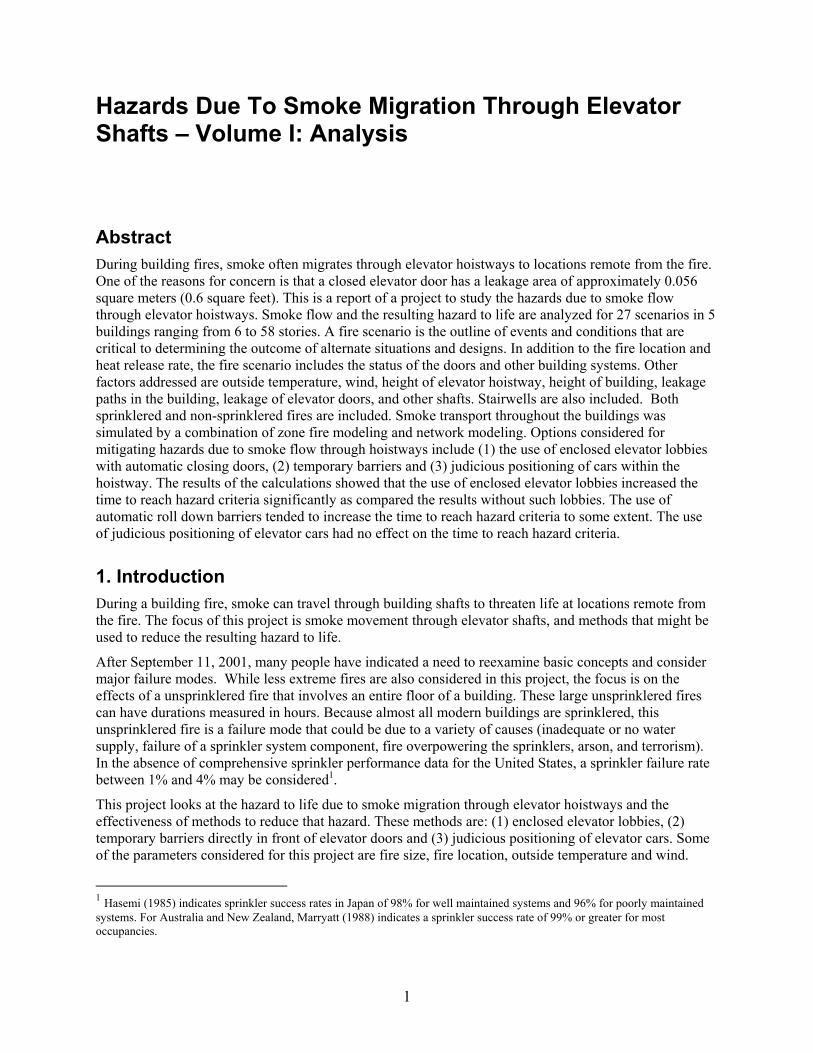
Hazards Due To Smoke Migration Through Elevator Shafts – Volume I: Analysis
Abstract During building fires, smoke often migrates through elevator hoistways to locations remote from the fire. One of the reasons for concern is that a closed elevator door has a leakage area of approximately 0.056 square meters (0.6 square feet). This is a report of a project to study the hazards due to smoke flow through elevator hoistways. Smoke flow and the resulting hazard to life are analyzed for 27 scenarios in 5 buildings ranging from 6 to 58 stories. A fire scenario is the outline of events and conditions that are critical to determining the outcome of alternate situations and designs. In addition to the fire location and heat release rate, the fire scenario includes the status of the doors and other building systems. Other factors addressed are outside temperature, wind, height of elevator hoistway, height of building, leakage paths in the building, leakage of elevator doors, and other shafts. Stairwells are also included. Both sprinklered and non-sprinklered fires are included. Smoke transport throughout the buildings was simulated by a combination of zone fire modeling and network modeling. Options considered for mitigating hazards due to smoke flow through hoistways include (1) the use of enclosed elevator lobbies with automatic closing doors, (2) temporary barriers and (3) judicious positioning of cars within the hoistway. The results of the calculations showed that the use of enclosed elevator lobbies increased the time to reach hazard criteria significantly as compared the results without such lobbies. The use of automatic roll down barriers tended to increase the time to reach hazard criteria to some extent. The use of judicious positioning of elevator cars had no effect on the time to reach hazard criteria.
1. Introduction During a building fire, smoke can travel through building shafts to threaten life at locations remote from the fire. The focus of this project is smoke movement through elevator shafts, and methods that might be used to reduce the resulting hazard to life.
After September 11, 2001, many people have indicated a need to reexamine basic concepts and consider major failure modes. While less extreme fires are also considered in this project, the focus is on the effects of a unsprinklered fire that involves an entire floor of a building. These large unsprinklered fires can have durations measured in hours. Because almost all modern buildings are sprinklered, this unsprinklered fire is a failure mode that could be due to a variety of causes (inadequate or no water supply, failure of a sprinkler system component, fire overpowering the sprinklers, arson, and terrorism). In the absence of comprehensive sprinkler performance data for the United States, a sprinkler failure rate between 1% and 4% may be considered1.
This project looks at the hazard to life due to smoke migration through elevator hoistways and the effectiveness of methods to reduce that hazard. These methods are: (1) enclosed elevator lobbies, (2) temporary barriers directly in front of elevator doors and (3) judicious positioning of elevator cars. Some of the parameters considered for this project are fire size, fire location, outside temperature and wind.
1 Hasemi (1985) indicates sprinkler success rates in Japan of 98% for well maintained systems and 96% for poorly maintained systems. For Australia and New Zealand, Marryatt (1988) indicates a sprinkler success rate of 99% or greater for most occupancies.

2
The time scale for large building fires often consists of a number of hours (Routley, Jennings and Chubb, 1991; Nelson, 1987, 1989; Best and Demers, 1982). Accordingly, the duration of the simulations for this project are two hours.
This report of this project is in two volumes. The first volume presents the analysis and discusses the results of that analysis. The second volume (Klote, 2003) consists of the complete results of the tenability calculations. The calculations of this project are for office buildings, but they may have application to other occupancies.
2. Scenarios It is not possible to analyze all the scenarios of the relevant parameters, and a rational analysis is used for selection of scenarios. This rational approach is based on an understanding of how stack effect, buoyancy and wind effect force smoke flow in buildings.
1. When it is cold outside, stack effect (also called normal stack effect) results in upward airflow in building shafts. When a fire is below the neutral plane, normal stack effect can also drive smoke upward through shafts to floors above the neutral plane.
2. When it is hot outside, reverse stack effect results in downward airflow in shafts. For a fire above the neutral plane, reverse stack effect might result in downward smoke flow in shafts.
3. When hot smoke enters a shaft, the elevated temperature of the smoke increases the intensity of normal stack effect.
4. When hot smoke enters a shaft, the elevated temperature of the smoke decreases the intensity of reverse stack effect.
5. When all the building windows are closed, wind forces have a minimum effect on building smoke flow.
6. When the one or more fire room windows are open and the wind direction is toward the open windows, wind forces have a significant effect on building smoke flow.
The points above were kept in mind in development of the scenario list of Table 1.
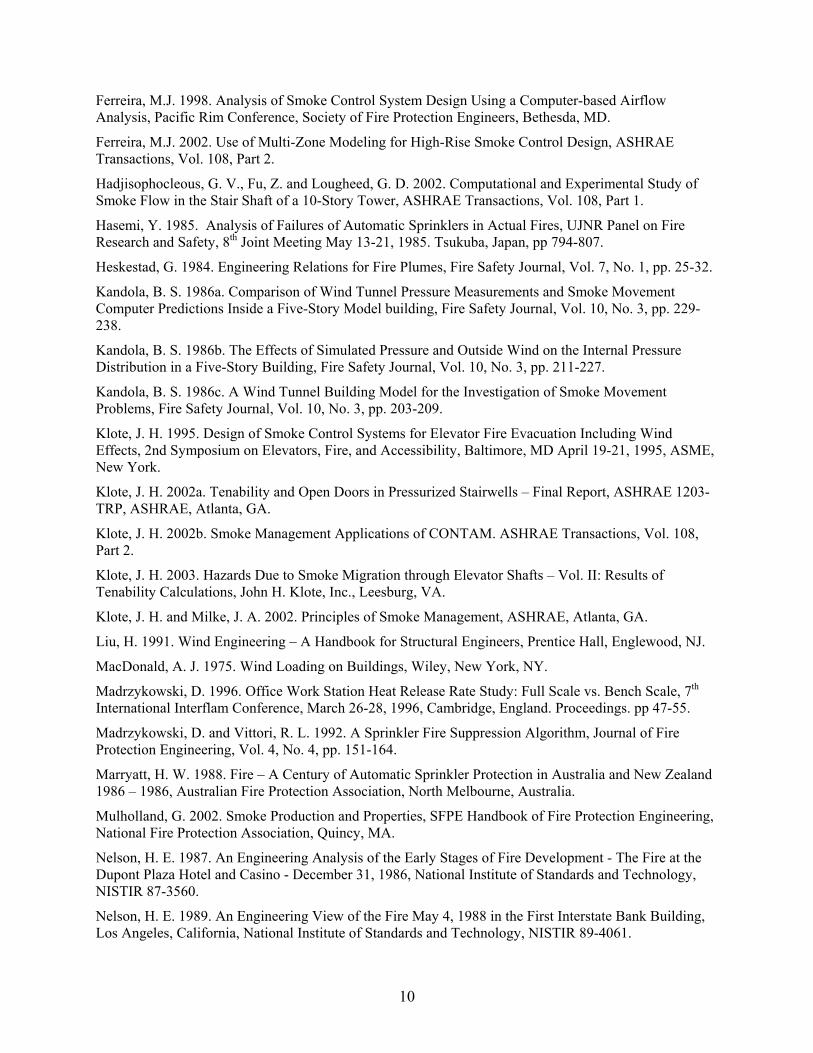
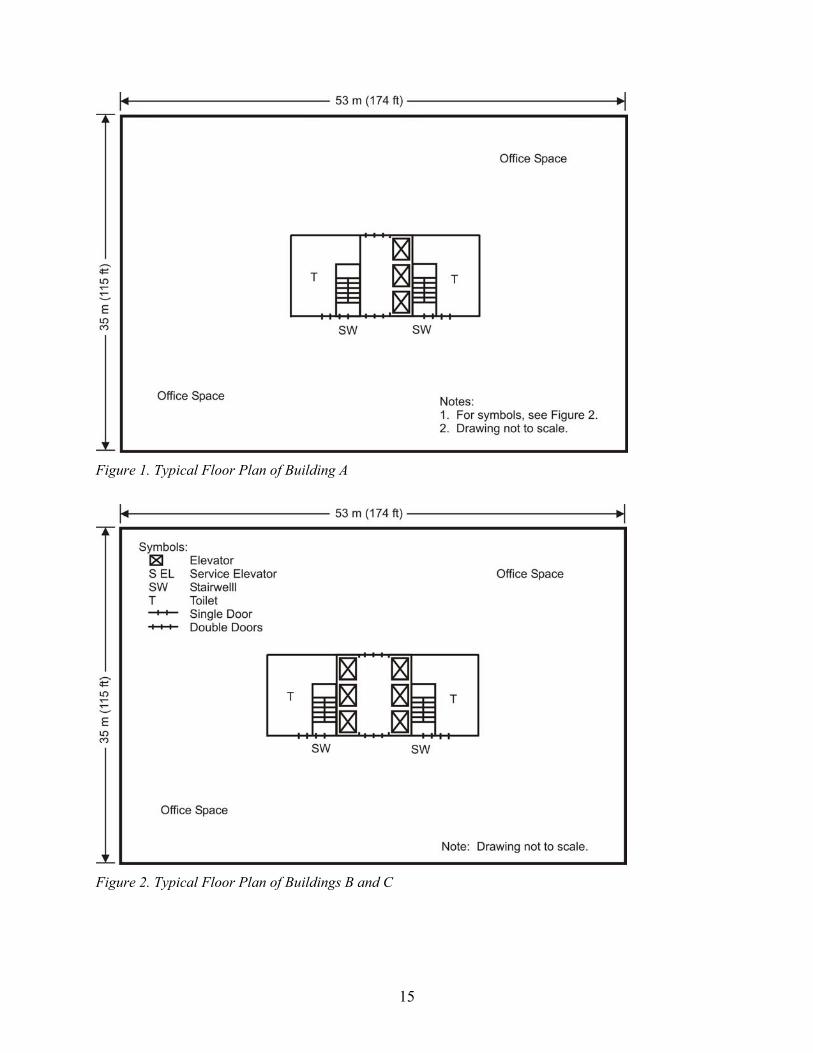
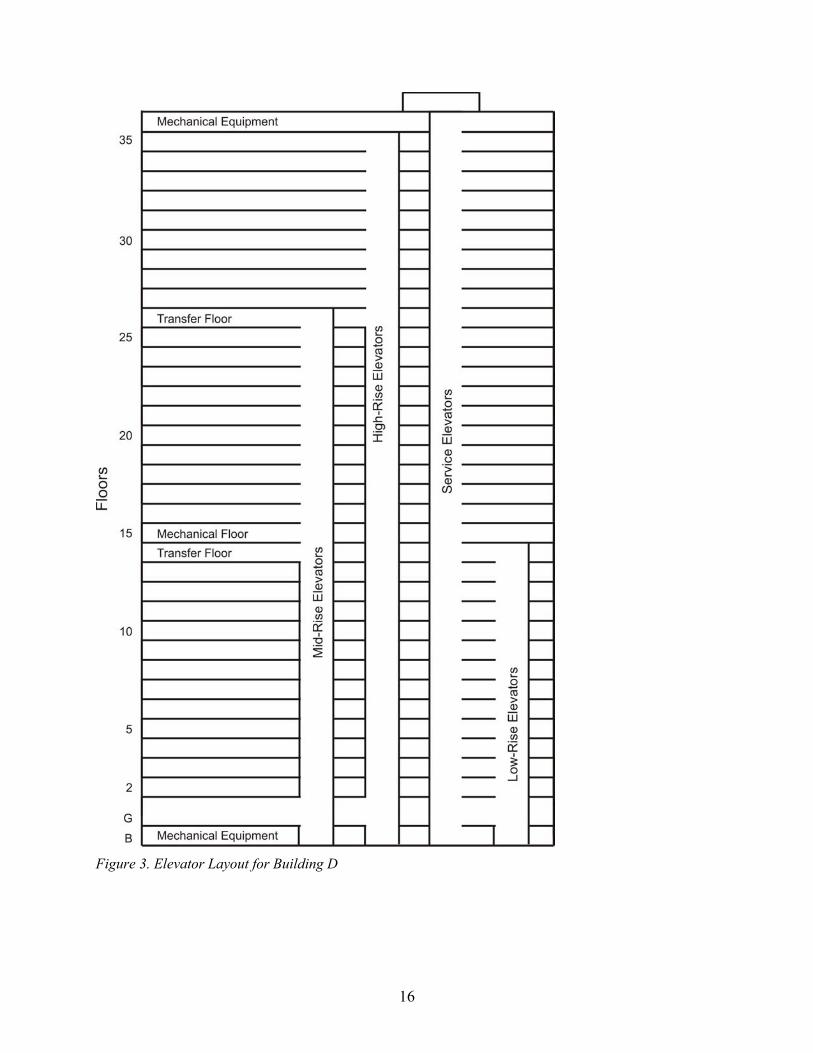
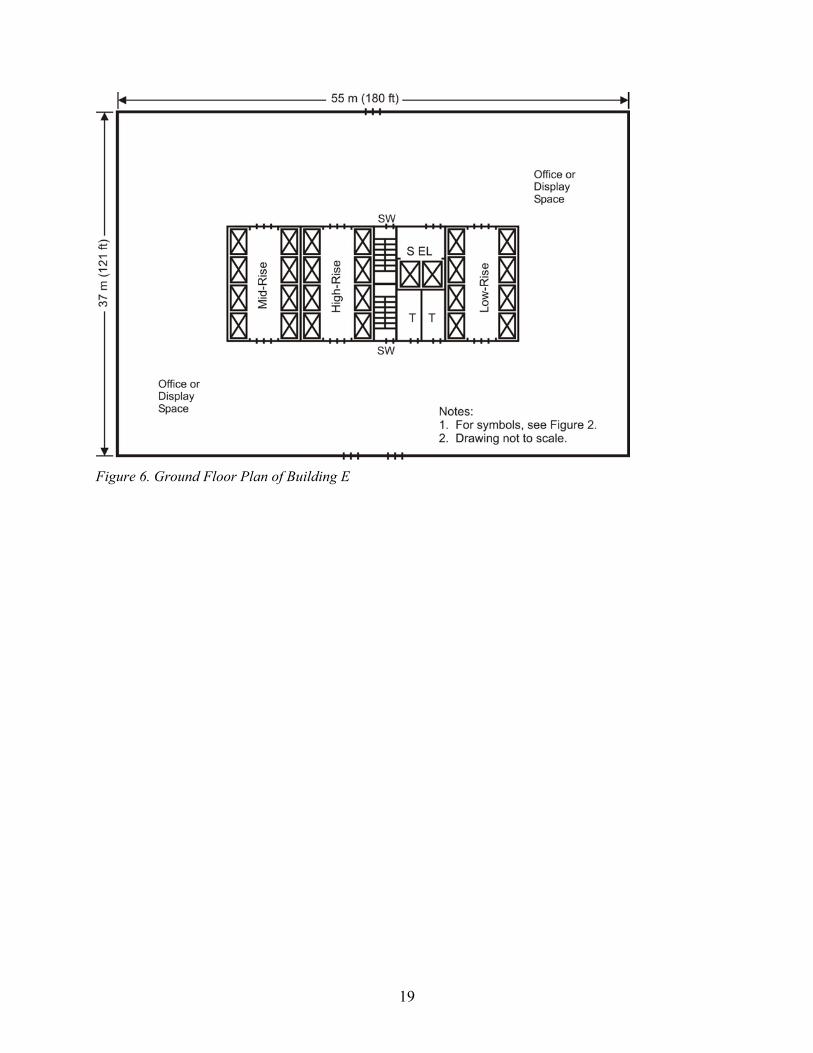
3. Buildings The buildings have a number of things in common. All of the buildings are office buildings. The floor to floor height is 4.0 m (13.1 ft) except for the ground floor which is 6 m (19.7 ft). The buildings have basements that house mechanical equipment. See Table 2 for a list of the buildings with information about the elevators. Figures 1 to 6 are schematics of the buildings.
3.1 Fire Type This project used the following fires: (1) sprinklered fire, (2) room fire, and (3) floor fire. Details of these fires are provided in Appendix A, and the heat release rates (HRR) of these fires are shown in Figure 7. The sprinklered fire is representative of what might be expected of an office workstation fire that was successfully suppressed by a sprinkler system. The room fire can be thought of as a conference room with furniture and some storage materials in cardboard boxes. After ignition, the room fire grows until the room is fully involved in fire.
The floor fire can be thought of as starting in an open floor plan office space. Early in the fire development, windows start breaking. After this, the fire is considered to be controlled by the amount of ventilation air through the broken windows. On an occupied floor, it might be expected that the occupants

3
would take action to prevent the fire from becoming so big. For any number of reasons, a floor might not be occupied during a fire, and development of such a fire becomes more likely.
3.2 Fire Floors The fire locations for this project are on the second floor and the top occupied floor of the building. These fire locations were chosen to be above the neutral plane and below the neutral plane to allow for the effects of normal and reverse stack effect.
3.3 Building Flow Paths Building leakage consists of: (1) construction gaps and cracks in walls, partitions and floors, (2) gaps around closed doors, and (3) large openings such as open doors and windows. The values of flow paths used for this project are listed in Table 3.
The leakage values of walls and floors are representative of values that can be expected for tight building construction as discussed by Klote and Milke (2002) and NFPA 92A (2000). It is generally recognized that the vent at the top of elevator shafts has an impact on airflow and smoke flow in buildings. Traditionally, these elevator vents have been required by codes, and the value of the vents used in this project are listed in Table 3.
The effects of door deflection due to exposure to high temperature gases are not included in the leakage values. While some data on warping of fire doors during furnace tests is provided by VanGeyn (1994), it is believed that there is insufficient information for estimation of the leakage of warped doors in this project.
Failure of compartmentation would require complex and time consuming analysis that is beyond the scope of this project. Such failure would be expected at some locations in buildings subjected to a fully developed fire that involved a large space such as one or more floors. It is anticipated that such compartmentation failure would result in increases in hazard to life. Even without compartmentation failure, the analysis of this project provides limited information about the hazard at locations remote from the fire and provides information about the relative effectiveness of various methods to reduce hazards due to smoke flow through hoistways.
3.4 Weather The temperatures and wind velocities for many locations in the United States and other countries are listed in the ASHRAE Handbook of Fundamentals (ASHRAE 2001). The values of design temperature and wind speed vary over a wide range for these locations. The values of weather data chosen for this project were chosen such that they could occur at many locations in the United States. These values are:
Winter Outdoor Temperature –16°C (3°F)
Summer Outdoor Temperature 35°C (95°F)
Wind Speed 11 m/s (25 mph)
3.5 Building Temperature Generally, an HVAC system maintains the interior of a building in the range of about 21°C to 24°C (70°F to 76°F). For airflow and smoke flow in buildings, an important factor is the difference between the building temperature and that of the outdoors. For this project, the building temperature is the same as that of the shafts, and this building temperature is arbitrarily selected as 23°C (73°F ).

4
3.6 Methods for Reduction of Hoistway Smoke Flow The following potential methods to reduce the smoke flow through hoistways are considered.
3.6.1 Enclosed Elevator Lobbies Enclosed elevator lobbies consist of walls, doors, floors and ceilings that form a continuous barrier on all sides of an elevator lobby. It is the intent that the doors would automatically close in the event of a fire.
3.6.2 Temporary Barriers Two types of temporary barriers can be considered: (1) automatic accordion barriers that form an enclosed elevator lobby and (2) automatic roll down barriers located directly in front of the elevator doors. For this project, it is considered that the accordion barriers have a fire resistance such that they would be expected to remain in place for some time when exposed to a fully developed fire. For this reason, the results of the simulations with conventional enclosed lobbies can be thought of as indicative of what would happen with enclosed lobbies formed with automatic accordion barriers.
The automatic roll down barriers would be installed above each elevator door such that they would roll down in the event of a fire. It is anticipated that such doors would be activated along with elevator recall. For this project, it is considered that the roll down barriers have a fire resistance such that they would be expected to remain in place when exposed to a fully developed fire.
The roll down doors of this project should be thought of as products that could possibly be developed and not as commercially available products. The flow area around the roll down doors (Table 3) used for this project was based on engineering judgment of what the leakage could be for such a door in an existing building.
3.6.3 Positioning Of Elevator Cars The idea of judicious positioning of elevator cars is to locate the elevator cars in the hoistway at a floor above the fire floor to provide added resistance to smoke flow to floors above the elevator cars. This approach has the drawback that cars fixed in this position cannot be used mobilization or rescue by the fire service. However, this project addresses only the smoke restricting potential of the judicious positioning approach. When the judicious positioning approach is used, it is considered that all elevator cars will be at the floor above the fire floor. The leakage areas for judicious positioning of elevator cars (Table 3, Shafts with Cars in Place) are based on hoistway and other dimensions from NEII (1983).
3.7 Arrangement of Doors For this project, it is considered that the stairwell doors and exterior building doors are closed.
3.8 Windows For this project, the windows are considered closed except for fully developed floor fire where the fire breaks widows as discussed in Appendix A.
4. Analysis of Scenarios The method of analysis can be considered a hazard analysis that evaluates the hazard to life for each scenario. Generally hazard analysis consists of (1) smoke transport calculations, (2) people movement (fire evacuation) calculations and (3) tenability calculations. For reasons discussed below, the analyses of this project do not include people movement calculations.
5
4.1 Smoke Transport The method of analysis of this project has been used for a number of applications. Ferreira (1998, 2002) describes use of this method for design applications, and Hadjisophocleous, Fu and Lougheed (2002) use this method as part of a study of smoke flow in a stair shaft. Klote (2002a) used the method to evaluate the hazard due to various combinations of open stairwell doors. Klote (2002b) and Klote and Milke (2002) also provide information about use of this method.
The smoke transport calculations were done by a combination of CONTAMW (Walton 1997; Dols, Denton and Walton 2000) and CFAST (Peacock, et al. 1993). The approach is to use CFAST to simulate the fire and flow of combustion products to adjacent spaces, and to use CONTAMW for unsteady flow of combustion products throughout the building. Numeric realities limit CFAST simulations to a relatively small number of rooms. However, CONTAMW can be used to simulate flows in buildings of hundreds and possibly thousands of rooms and other spaces.
CONTAMW is a network airflow program that can simulate contaminant flow. The model was developed for indoor air quality, but it has been extensively used for smoke management applications. CONTAMW solves the continuity of mass equation for a network that represents a building, and it can solve the concentration equations to calculate the concentration of one or more contaminants that flow through the network. For fire applications, the major shortcoming of CONTAMW is that it has no energy equation so it is unable to calculate the temperature of the spaces in the building. The temperature used in CONTAMW simulations are based on the results of CFAST simulations for spaces near the fire. CONTAMW Version 2 was used to allow the use of unsteady temperatures.
CFAST is a two zone fire model. In such a model, the gases in a room are represented two zones: (1) an upper layer of hot smoke and (2) a lower layer of relatively uncontaminated air. In the fire room, a smoke plume rises above the fire and flows into the upper layer. Also, smoke can flow from one room to another.
4.3 People Movement The hazard of exposure to toxic gases depends on the exposure time. Fire evacuation calculations or simulations of people movement can be used to predict exposure times. A more conservative alternative is to consider the safety of people with mobility limitations who would need to stay in one place for the duration of the fire. For this project, this alternative is used with a 30 minute fire duration.
4.4 Tenability The proprietary computer program, SMOKE4, was used for this project to make the fractional effective dose (FED) and visibility calculations described in this section. The FED is a used to predict the toxic effect of exposure to combustion gases. Tenability calculations consist of evaluating visibility and the effects of exposure to toxic gases and heat. While lack of visibility does not in itself result in fatality, it disorients people, and this interferes with evacuation and prolongs exposure time. Exposure to heat can either be direct exposure to hot gases or exposure to radiant flux, but exposure to hot gases is the primary form of heat exposure for the scenarios of this project.
4.4.1 Visibility For any instant, the visibility can be calculated from
2.303im i
KSCδ
=
where Si = visibility at the end of interval i, m (ft); K = proportionality constant (8 for illuminated signs, and 2 for non-illuminated signs);

6
δm = mass optical density, m2/g (ft2/lb); Ci = concentration of material burned in interval i, g/m3 (lb/ft3).
The mass optical density depends on the material burned and combustion conditions (flaming or pyrolysis). Mulholland (2002) provides optical densities of a number of materials, and these values range from 0.12 m2/g (590 ft2/lb) to 1.4 m2/g (6800 ft2/lb). It is well known that flaming combustion of polyurethane produces a dense black smoke, and this smoke has a mass optical density of 0.33 m2/g (1600 ft2/lb). For this project, the mass optical density was chosen as 0.33 m2/g (1600 ft2/lb).
For this project, the following visibility limits were considered: (1) 8 m (25 ft), (2) 15 m (49 ft), and (3) 30 m (98 ft). A visibility of 15m (49 ft) or of 30 m (98 ft) would not be expected to interfere with people movement in the buildings of this project, but people would probably be aware that there is some smoke. However, it is expected that a visibility of 8 m (25 ft) or less would hinder evacuation. For this paper, smoke with a visibility of 8 m (25 ft) or less is referred to as obscuring smoke or smoke that obscures vision.
4.4.2 Exposure to Toxic Gases The methods that can be used to evaluate the effect of exposure to toxic gases are (1) the fractional incapacitating dose, (2) the N-gas model, and (3) the fractional effective dose (FED). Klote and Milke (2002) provide a detailed discussion of these methods. These methods are typically based on data from exposure times of 20 minutes, and they can be used be used to predict the toxic effects of exposures for somewhat different times. The exposure times of this project are 2 hours. The mathematical formulation of the first two methods is such that the predictions with this exposure time are of questionable value. However, the FED has a simple form that leads the author to believe that predictions using the FED for this exposure time can be applied for this project.
The mass concentration of material burned, Ci, was obtained from CONTAMW. The FED can be used to obtain an approximation of the effects of exposure to toxic gases.
1
50
FED = LC
n
ii
C t
t=
∆∑
where FED = fractional effective dose at the end of interval i (dimensionless); Ci = concentration of material burned at interval i, g/m3 (lb/ft3); ∆t = time interval, min (min); LCt50 = lethal exposure dose from test data, g m-3 min (lb ft-3 min).
This equation is written here for uniform time intervals as were produced by CONTAMW, and it evaluates the FED for the exposure time at the end of interval i (exposure time is n∆t). An FED greater than or equal to one indicates fatality. The concentration is in mass of the material burned per unit volume. A FED of 0.5 can be considered a rough indication of incapacitation. For this project, the following terms are used as follows:
Tenable: FED < 0.5 FED less than 0.5. Incapacitating: 0.5 < FED < 1 FED equal to or greater than 0.5 and less than 1. Untenable: FED > 1 FED equal to or greater than 1.
The LC50 is the concentration of airborne combustion products that is lethal to 50% of the subjects exposed for a specified time. The lethal exposure dose, LCt50, is the product of the LC50 and the exposure time. See Appendix B for the values of lethal exposure dose used in this project.

7
4.4.3 Exposure to Heat
Generally contact with dry air of temperatures greater than 121°C (250°F) can be expected to result in skin burns. Also, contact with dry air at a temperature less than approximately 121°C (250°F) leads to hyperthermia. Figure 8 shows the data of Blockley (1973) for the thermal tolerance of naked humans at rest with low air movement. The thermal tolerance depends on moisture. For humid conditions, it can be seen that for a 15 minute exposure the tolerance is about 88°C (190°F), and for a 30 minute exposure the tolerance is about 60°C (140°F).
5. Discussion of Results The results of the tenability calculations are listed in Volume II of this report, and these results are summarized in Table 4.
5.1 Fire Types As expected, the sprinklered fire (scenario 1) did not result in any significant threat away from region of the fire. The fully developed room fires (scenarios 2, 18–21) were not a very significant threat at locations remote from the fire room.
The fully developed floor fires (scenarios 3–17, 22–27) resulted in significant threats at floors remote from the fire floor. For these fires, the time to reach smoke obscuration on floors remote from the fire ranged from 24 minutes to 100 minutes. While these times are long, they are representative of the times involved with some major multiple death fires.
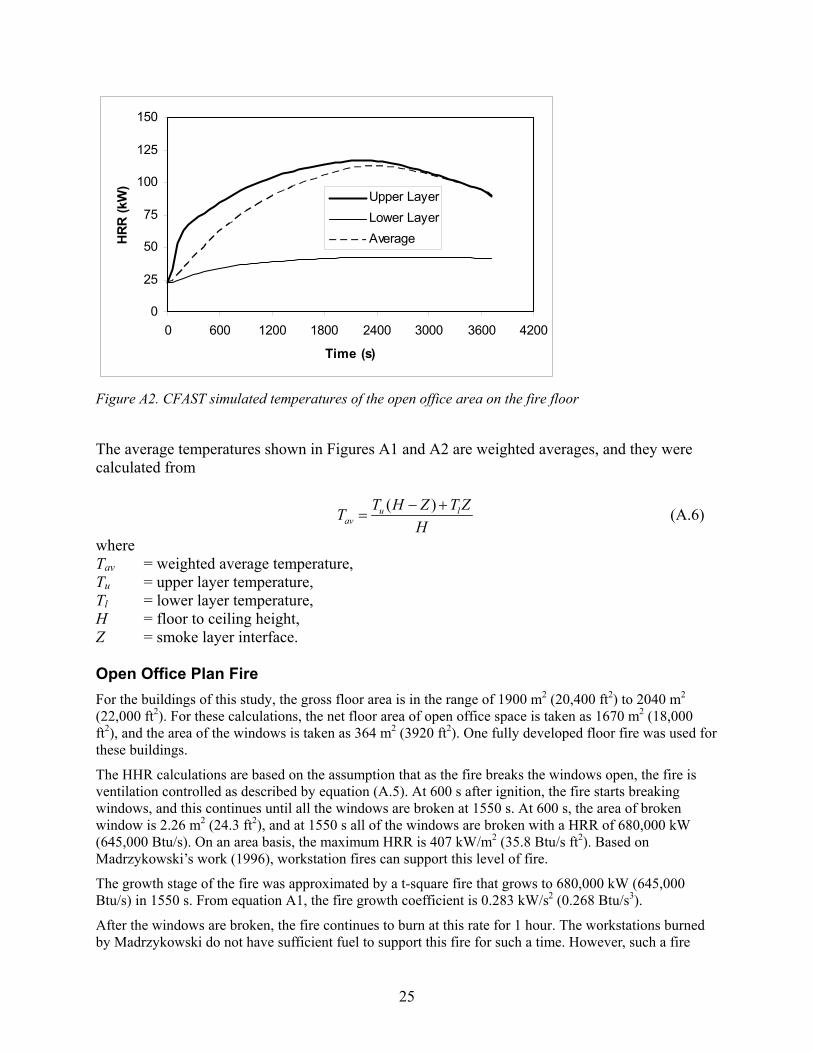
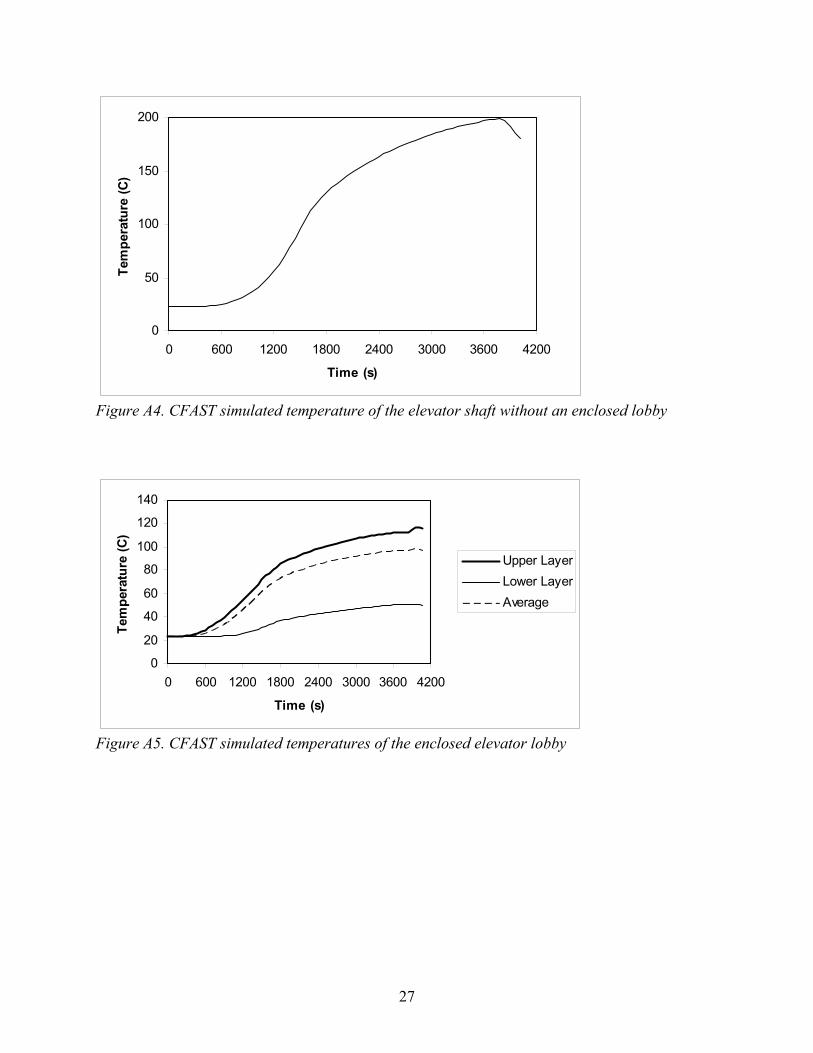
5.2 Temperature The temperatures calculated by CFAST are shown in Appendix A. At some distance from the fire, the smoke temperature drops to such an extent that it is not a concern. Because this project focuses on smoke flow through the hoistways, temperature exposure is only a minor issue. Further, the temperatures resulting from the sprinklered fire are not a concern. For the room fire, the fire room rapidly becomes untenable (Figure A1), and the open plan office space on the fire floor remains tenable for some time (Figure A2). For the floor fire, the temperature rises rapidly so that the floor quickly becomes untenable (Figure A3). However, the temperature in the enclosed elevator lobby remains tenable throughout the fire (Figure A5).
5.3 Methods of Reducing Smoke Flow through Hoistways
5.3.1 Enclosed Elevator Lobbies Many of the scenarios included enclosed elevator lobbies (EEL on Table 1). The use of such lobbies, extends the time to obscuring smoke and untenable conditions on floors away from the fire. This can be shown in a number of scenarios. For example, scenarios 9 and 10 are the same except that scenario 9 has enclosed elevator lobbies, and scenario 10 does not (Table 4). It can be seen that with enclosed elevator lobbies, the time to obscuring smoke on the top floor increases from 31 to 66 minutes. Further, without enclosed elevator lobbies, the top floor becomes untenable in 56 minutes, and with elevator lobbies it does not become untenable during the 120 minute simulation.
For the scenarios with floor fires, the pairs of scenarios listed below are with and without enclosed elevator lobbies. It can be seen that with enclosed elevator lobbies the time to smoke obscuration increases significantly.
Scenarios
Increase in Time to Smoke Obscuration on Top Floor Due to Enclosed Elevator Lobbies

8
3, 4 158% 5, 6 193% 9, 10 113% 14, 15 48% 24, 25 52%
5.3.2 Automatic Roll Down Barriers A number of scenarios included automatic roll down barriers (TB on Table 1). For the scenarios with floor fires, the pairs of scenarios listed below are with and without automatic roll down barriers.
Scenarios
Increase in Time to Smoke Obscuration on Top Floor Due to Automatic Roll Down Barriers
6, 7 0% 10, 12 13% 15, 16 20% 25, 26 19%
It can be seen that with automatic roll down barriers, the time to smoke obscuration increases only slightly. The predicted performance of these roll down barriers is highly dependant on the leakage of such barriers, and roll down barriers with less leakage than used in this project would be expected to perform better.
5.3.3 Positioning Of Elevator Cars A number of scenarios included positioning of elevator cars (JPC on Table 1). For the scenarios with floor fires, the pairs of scenarios listed below are with and without positioning of elevator cars.
Scenarios
Increase in Time to Smoke Obscuration on Top Floor Due to Automatic Roll Down Barriers
6, 8 0% 10, 13 0% 15, 17 0% 25, 27 0%
It can be seen that with positioning of elevator cars, the time to smoke obscuration remains unchanged from that without enclosed elevator lobbies.
5.4 Outside Temperature All the scenarios discussed so far have been with the winter outside temperature. Scenarios 22 and 23 are with the summer outside temperature. As expected for these scenarios, the fire was on the top occupied floor, and there was little smoke flow to floors below.
6. Future Research As already stated, this study did not include compartmentation failure. Future research is needed to evaluate the extent to which compartmentation failure would impact smoke flow through elevator hoistways.
The method of analysis used for this project used two computer models (CFAST and CONTAMW) as described earlier. This approach is cumbersome, time consuming, and yields questionable results for scenarios involving reverse stack effect. Research is needed to develop a fire model capable of simulating smoke flow and temperatures throughout high rise buildings.

9
7. Summary & Conclusions The intent of this project is to study the hazard to life due to smoke migration through elevator hoistways and the effectiveness of various methods to reduce that hazard.
While compartmentation failure is beyond the scope of this project, such failure would be expected at some locations in buildings subjected to a fully developed fire that involved a large space such as one or more floors. It is anticipated that such compartmentation failure would result in increases in hazard to life. Even without compartmentation failure, the analysis of this project provides limited information about the hazard at locations remote from the fire and provides information about of the relative effectiveness of various methods to reduce hazards due to smoke flow through hoistways.
For the buildings and conditions analyzed, the following conclusions are made.
(1) The fully developed floor fires resulted in significant threats at floors remote from the fire floor. For these fires, the time to reach smoke obscuration on floors remote from the fire ranged from 24 minutes to 100 minutes. While these times are long, they are representative of the times involved with some major multiple death fires.
(2) Smoke from successfully sprinklered fires did not result in hazard conditions at floors away from the fire floor.
(3) The use of enclosed elevator lobbies increased the time to reach hazard criteria significantly (from 52% to 193%) in comparison with analysis without such lobbies.
(4) The use of automatic roll down barriers tended to increase the time to reach hazard criteria (from 0% to 20%) in comparison with analysis without such barriers. If tighter roll down barriers had been used for the analysis of this project, it is expected that they would have performed better.
(5) The use of judicious positioning of elevator cars had no effect on the time to reach hazard criteria.
8. References ASHRAE 2001. Handbook of Fundamentals, American Society of Heating, Refrigerating and Air-Conditioning Engineers, Atlanta, GA.
Aynsley, R. M. 1989. The Estimation of Wind Pressures at Ventilation Inlets and Outlets on Buildings, ASHRAE Transactions, Vol. 95, Part 2, pp. 707-721.
Best, R. and Demers, D. P. 1982. Investigation Report on the MGM Grand Hotel Fire - Las Vegas, Nevada, November 21, 1980, National Fire Protection Association, Quincy, MA.
Blockley, W. V. 1973. Biology Data Book, Federation of American Societies for Experimental Biology, Bethesda, MD.
Dols, W. S., Denton, K. R. and Walton, G. N. 2000. CONTAMW User Manual, National Institute of Standards and Technology, Gaithersburg, MD.
Dyrbye, C. and Hansen, S. O. 1997. Wind Loads on Structures, Wiley, New York, NY.
Evans, D. D. and Stroup, D. W. 1986. Methods to Calculate the Response Time of Heat and Smoke Detectors Installed Below Large Unobstructed Ceilings, Fire Technology, Vol. 22, No. 1, pp. 54-65.
Evans, D. D., Stroup, D. W. and Martin, P. 1986. Evaluating Thermal Fire Detection Systems (SI Units), NBSSP 713, National Bureau of Standards, Gaithersburg, MD.
10
Ferreira, M.J. 1998. Analysis of Smoke Control System Design Using a Computer-based Airflow Analysis, Pacific Rim Conference, Society of Fire Protection Engineers, Bethesda, MD.
Ferreira, M.J. 2002. Use of Multi-Zone Modeling for High-Rise Smoke Control Design, ASHRAE Transactions, Vol. 108, Part 2.
Hadjisophocleous, G. V., Fu, Z. and Lougheed, G. D. 2002. Computational and Experimental Study of Smoke Flow in the Stair Shaft of a 10-Story Tower, ASHRAE Transactions, Vol. 108, Part 1.
Hasemi, Y. 1985. Analysis of Failures of Automatic Sprinklers in Actual Fires, UJNR Panel on Fire Research and Safety, 8th Joint Meeting May 13-21, 1985. Tsukuba, Japan, pp 794-807.
Heskestad, G. 1984. Engineering Relations for Fire Plumes, Fire Safety Journal, Vol. 7, No. 1, pp. 25-32.
Kandola, B. S. 1986a. Comparison of Wind Tunnel Pressure Measurements and Smoke Movement Computer Predictions Inside a Five-Story Model building, Fire Safety Journal, Vol. 10, No. 3, pp. 229-238.
Kandola, B. S. 1986b. The Effects of Simulated Pressure and Outside Wind on the Internal Pressure Distribution in a Five-Story Building, Fire Safety Journal, Vol. 10, No. 3, pp. 211-227.
Kandola, B. S. 1986c. A Wind Tunnel Building Model for the Investigation of Smoke Movement Problems, Fire Safety Journal, Vol. 10, No. 3, pp. 203-209.
Klote, J. H. 1995. Design of Smoke Control Systems for Elevator Fire Evacuation Including Wind Effects, 2nd Symposium on Elevators, Fire, and Accessibility, Baltimore, MD April 19-21, 1995, ASME, New York.
Klote, J. H. 2002a. Tenability and Open Doors in Pressurized Stairwells – Final Report, ASHRAE 1203-TRP, ASHRAE, Atlanta, GA.
Klote, J. H. 2002b. Smoke Management Applications of CONTAM. ASHRAE Transactions, Vol. 108, Part 2.
Klote, J. H. 2003. Hazards Due to Smoke Migration through Elevator Shafts – Vol. II: Results of Tenability Calculations, John H. Klote, Inc., Leesburg, VA.
Klote, J. H. and Milke, J. A. 2002. Principles of Smoke Management, ASHRAE, Atlanta, GA.
Liu, H. 1991. Wind Engineering – A Handbook for Structural Engineers, Prentice Hall, Englewood, NJ.
MacDonald, A. J. 1975. Wind Loading on Buildings, Wiley, New York, NY.
Madrzykowski, D. 1996. Office Work Station Heat Release Rate Study: Full Scale vs. Bench Scale, 7th International Interflam Conference, March 26-28, 1996, Cambridge, England. Proceedings. pp 47-55.
Madrzykowski, D. and Vittori, R. L. 1992. A Sprinkler Fire Suppression Algorithm, Journal of Fire Protection Engineering, Vol. 4, No. 4, pp. 151-164.
Marryatt, H. W. 1988. Fire – A Century of Automatic Sprinkler Protection in Australia and New Zealand 1986 – 1986, Australian Fire Protection Association, North Melbourne, Australia.
Mulholland, G. 2002. Smoke Production and Properties, SFPE Handbook of Fire Protection Engineering, National Fire Protection Association, Quincy, MA.
Nelson, H. E. 1987. An Engineering Analysis of the Early Stages of Fire Development - The Fire at the Dupont Plaza Hotel and Casino - December 31, 1986, National Institute of Standards and Technology, NISTIR 87-3560.
Nelson, H. E. 1989. An Engineering View of the Fire May 4, 1988 in the First Interstate Bank Building, Los Angeles, California, National Institute of Standards and Technology, NISTIR 89-4061.

11
NEII, 1983. Vertical Transportation Standards: Standards for Elevators, Escalators and Dumbwaiters, National Elevator Industry, Inc., New York, NY.
NFPA 2000. Recommended Practice for Smoke Control Systems, NFPA 92A, National Fire Protection Association, Quincy, MA.
Peacock, R. D., et al., 1993. CFAST, the Consolidated Model of Fire Growth and Smoke Transport, National Institute of Standards and Technology, NIST Technical Note 1299.
Purser, D. A. 2002. Toxicity Assessment of Combustion Products, SFPE Handbook of Fire Protection Engineering, National Fire Protection Association, Quincy, MA.
Routley, G., Jennings, C. and Chubb, M. 1991. High-rise Office Building Fire - One Meridian Plaza, Technical Report, United States Fire Administration.
Shaw, C. T. and Tamura, G. T. 1977. The Calculation of Air Infiltration Rates Caused by Wind and Stack Action for Tall Buildings, ASHRAE Transactions, Vol. 83, Part 2, pp. 145-158.
Simiu, E. and Scanlan, R. H. 1996. Wind Effects on Structures: Fundamentals and Application to Design, 3rd Ed., Wiley, New York, NY.
Tamanini, F. 1976. The Application of Water Sprays to the Extinguishment of Crib Fires, Combustion Science and Technology, Vol. 14, pp. 17-23.
VanGeyn, M. 1994. National Fire Door Fire Test Project. Positive Pressure Furnace Fire Tests. Technical Report. National Fire Protection Research Foundation, Quincy, MA, Report 6285, 201 p.
Walton, G. N. 1997. CONTAM96 User Manual, NISTIR 6056, National Institute of Standards and Technology, Gaithersburg, MD.

12
Table 1. List of Scenarios
Fire Fire Enclosed Alternative Scenario Building1 Type2 Floor3 Elev. Lobby Weather4 Methods5
1 A SP 2 Y W-NW None 2 A FDR 2 Y W-NW None 3 A FDF 2 Y W-NW None 4 A FDF 2 N W-NW None 5 B FDF 2 Y W-NW None 6 B FDF 2 N W-NW None 7 B FDF 2 N W-NW TB 8 B FDF 2 N W-NW JPC 9 C FDF 2 Y W-NW None
10 C FDF 2 N W-NW None 11 C FDF 2 N W-W None 12 C FDF 2 N W-NW TB 13 C FDF 2 N W-NW JPC 14 D FDF 2 Y W-NW None 15 D FDF 2 N W-NW None 16 D FDF 2 N W-NW TB 17 D FDF 2 N W-NW JPC 18 D FDR 2 Y W-NW None 19 D FDR 2 N W-NW None 20 D FDR 2 N W-NW TB 21 D FDR 2 N W-NW JPC 22 D FDF 36 Y S-NW None 23 D FDF 36 N S-NW None 24 E FDF 2 Y W-NW None 25 E FDF 2 N W-NW None 26 E FDF 2 N W-NW TB 27 E FDF 2 N W-NW JPC
1See Table 2. 2SP is a sprinklered fire. FDR is a fully developed room fire. FDF for fully developed floor fire. 3FDR fires are located in a conference room on the floor indicated, and FDF fires are located in the open floor plan space on that floor. 4W-NW for winter with no wind. S-NW for summer with no wind. W-NW winter with no wind. W-W winter with wind. 5TB for temporary barriers over elevator car doors. JPC for judicious positioning of cars within hoistways.
Table 2. List of Buildings
Building Number of
Stories* Passenger Elevators Service Elevator
A 6 1 Bank of 3 Elevators None B 13 1 Bank of 6 Elevators None C 16 1 Bank of 6 Elevators None D 35 3 Banks of 6 Elevators: Low,
Medium & High Rise 2
E 58 3 Banks of 8 Elevators: Low, Medium & High Rise
2
*Does not include mechanical penthouse.

13
Table 3. Building Flow Areas
Component Path
Type1 Path Identifier2
Flow Coefficient3
Area4 m2/m2 (ft2/ft2)
Exterior Wall O W-EXT 0.65 0.00017 Exterior Wall Below Grade5 O W-UG 0.65 0.000085 Interior Wall O W-INT 0.65 0.00011 Elevator Wall O W-EL 0.65 0.00084 Floor O FLOOR 0.65 0.000052 Roof5 O ROOF 0.65 0.000026 Closed Doors: m2 ft2 Single Door T DR-SI 0.65 0.016 0.17 Double Door T DR-DO 0.65 0.027 0.29 Elevator Doors6 T DR-EL42 0.65 0.047 0.50 Large Elevator Doors7 T DR-EL48 0.65 0.049 0.53 Open Doors: Single Door T DR-SI-O 0.35 1.95 21 Double Door T DR-DO-O 0.35 3.90 42 Shaft Equivalent Area8: Stairwell O STAIR 0.60 2.3 25 3 Car Passenger Elevator O EL-P3 0.60 230 2500 4 Car Passenger Elevator O EL-P4 0.06 360 3900 2 Car Service Elevator O EL-S2 0.60 160 1700 Open Elevator Vent9: 3 Car Passenger Elevator O EL-P3V 0.32 0.70 7.5 4 Car Passenger Elevator O EL-P4V 0.32 1.05 11.3 2 Car Service Elevator O EL-S2V 0.32 0.52 5.6 Roll Down Barriers T ROLL 0.65 0.011 0.12 Shafts with Cars in Place: 3 Car Passenger Elevator O EL-P3C 0.65 6.5 70 4 Car Passenger Elevator O EL-P4C 0.65 9.1 98 1 O indicates an orifice path for which flow is in one direction. T indicates a two-directional flow path. The two-directional flow is used for doors, and the leakage is uniformly distributed over the height of the door. 2The path identifiers are used with CONTAMW for data input. 3The flow coefficient is defined as m A-1/2 (2 ρ ∆p)-1/2 where m is the mass flow through the path, ρ is the density of gas flowing in the path, and ∆p is the pressure difference across the path. 4Areas for walls and floors are listed as area of flow path per unit of area of wall or of floor as appropriate. 5Due to lack of experimental data, the flow areas of the exterior wall below grade and the roof were estimated at half that of the exterior wall and the floor respectively. 6This elevator door is 1.07 m (3.5 ft) wide. It is used for all passenger elevators of this study except for Building E. 7This elevator door is 1.22 m (4.0 ft) wide. It is used for the passenger elevators of Building E and the service elevators. 8Shaft equivalent areas are used to calculate the pressure losses due to friction in shafts. For more information, see chapter 6 of Klote and Milke(2002). 9Vent area was calculated at 3.5% of the shaft area but not less than 0.28 m2 (3 ft2).

14
Table 4. Calculated Time (minutes) to Reach Tenability Specific Limits Top Floor of Top Floor of Top Floor of Fire Floor2 Low Rise2,3 Mid Rise2,4 High Rise2,5 Scenario1 Building Visibility FED Visibility FED Visibility FED Visibility FED
1 A 5 – – – NA NA NA NA 2 A – – – – NA NA NA NA 3 A 1 6 62 – NA NA NA NA 4 A 1 6 24 49 NA NA NA NA 5 B 1 6 88 – NA NA NA NA 6 B 1 6 30 56 NA NA NA NA 7 B 1 6 30 55 NA NA NA NA 8 B 1 6 30 56 NA NA NA NA 9 C 1 6 66 – NA NA NA NA
10 C 1 6 31 56 NA NA NA NA 11 C 1 6 40 79 NA NA NA NA 12 C 1 6 35 63 NA NA NA NA 13 C 1 6 31 56 NA NA NA NA 14 D 1 6 – – 52 86 74 – 15 D 1 6 – – 48 82 50 89 16 D 1 6 – – 49 80 60 100 17 D 1 6 – – 48 82 50 89 18 D – – – – – – – – 19 D – – – – – – 20 40 20 D – – – – – – 28 54 21 D – – – – – – 20 40 22 D 1 6 89 – – – 1 6 23 D 1 6 – – – – 1 6 24 E 1 6 – – 55 92 73 – 25 E 1 6 – – 48 85 48 85 26 E 1 6 – – 51 85 57 98 27 E 1 6 – – 48 85 48 85
1For descriptions of the scenarios and locations of the fire floor, see Table 1. 2The tenability limits used for this project are visibility of 8 m (25 ft) and an FED of 1 in the open plan office space of the floor indicated. 3Buildings A, B and C have only one elevator rise, and data listed for these buildings is for the top occupied floor. For Building D, the top occupied floor of the low rise is for floor 13. For Building E, the top occupied floor of the low rise is for floor 23. 4For Building D, the top occupied floor of the mid rise is for floor 25. For Building E, the top occupied floor of the mid rise is for floor 42. 5For Building D, the top occupied floor of the high rise is for floor 35. For Building E, the top occupied floor of the high rise is for floor 58.
15
Figure 1. Typical Floor Plan of Building A
Figure 2. Typical Floor Plan of Buildings B and C
16
Figure 3. Elevator Layout for Building D

17
Figure 4. Ground Floor Plan of Building D

18
Figure 5. Elevator Layout for Building E
19
Figure 6. Ground Floor Plan of Building E
20
Figure 7. HRR Curves of Fires Used in This Project

21
Figure 8. Thermal Tolerance of Naked Humans at Rest With Low Air Movement

22
Appendix A – Fires The fires considered for this analysis are: (1) sprinklered fire, (2) fully developed room fire, and (3) fully developed floor fire. These fires are discussed below.
Sprinklered Fire Sprinklered fires generally proceed through an incubation period of slow and uneven growth followed by a period of established growth. Established growth is often represented by an idealized parabolic equation (Heskestad 1984).
2Q = tα (A.1)
where Q = heat release rate of fire, kW (Btu/s); " = fire growth coefficient, kW/s2 (Btu/s3); t = time after ignition, s. Fires following this equation are called t-squared fires. It is generally recognized that consideration of the incubation period is not necessary for design of smoke management systems, and where t is considered the time from effective ignition. In the CFAST zone fire model, the following SI version of the above equation is used to aid data input2
2
1000g
tQt
=
(A.2)
where Q = heat release rate of fire, kW; t = time after effective ignition, s; tg = growth time, s.
When t = tg, the above equation gives a value of Q = 1000 kW. The growth times used in CFAST are:
Growth Type tg (s) Slow 600 Medium 300 Fast 150 Ultra Fast 75
Madrzykowski (1996) conducted a series of fire tests of office workstations. The growth type that is closest to that of these workstation fires is medium growth with a growth time, tg, of 300s. For this study, the sprinklered fire will have a growth stage of a medium t-squared fire.
For this study, the HRR is considered to decrease after sprinkler activation. This HRR decay after sprinkler actuation can be expressed as
( ) /actt tactQ Q e τ− −= (A.3)
2 NFPA 92B (2000) and some other sources have a similar equation in English units: 21000( / )gQ t t= which
gives Q = 1000 Btu/s when t = tg.

23
where Q = post sprinkler actuation HRR, kW (Btu/s);
actQ = HRR at sprinkler actuation, kW (Btu/s); t = time from ignition, s (s); tact = time of sprinkler actuation, s (s); t = time constant of fire suppression, s (s).
For a number of fuel packages likely to be found in offices, Madrzykowski and Vettori (1992) conducted sprinklered fire experiments with a spray density of 0.10 gpm/ft2 (0.07 mm/s) of water. They determined that a fire decay curve with a time constant of 435 s had a higher HRR than most of the sprinklered fires. Evans (1993) used this data and data for wood crib fires with sprinkler spray densities of 0.06 gpm/ft2 (0.041 mm/s) and 0.097 gpm/ft2 (0.066 mm/s) from Tamanini (1976) to develop the following correlation
1.85
Cw
ττ = (A.4)
where w = spray density, gpm/ft2 (mm/s); Ct = 6.15 (3.0).
While equation (A.4) has not been experimentally verified, it does allow us to adjust the decay time for sprinkler densities other than those of Madrzykowski and Vettori.
Sprinkler actuation depends on gas temperature and velocity near the sprinkler. In a fire a jet of hot gases flows radially from where the smoke plume intersects the ceiling. The response time index (RTI) was developed as a measure of sprinkler responsiveness that is independent of velocity. The RTI of standard sprinklers range from about 77 to 155 m1/2 s1/2 (140 to 280 ft1/2 s1/2), and the RTI of quick-response sprinklers (QRS) range from about 28 to 55 m1/2 s1/2 (50 to 100 ft1/2 s1/2).
Several computer programs have been developed that use correlations for such a ceiling jet and the RTI to predict actuation time. The program DETACT-QS (Evans and Stroup 1986) assumes that the thermal device is located in a relatively large area, that only the ceiling jet heats the device and there is no heating from the accumulated hot gases in the room. The required program inputs are the height of the ceiling above the fuel, the distance of the thermal device from the axis of the fire, the actuation temperature of the thermal device, the response time index (RTI) for the device, and the rate of heat release of the fire. The program outputs are the ceiling gas temperature and the device temperature both as a function of time and the time required for device actuation. DETACT-T2 (Evans, Stroup and Martin 1986) is similar to DETACT-QS except it is specifically for t-squared fires. Several zone fire models are capable of calculating ceiling jet temperatures and predicting actuation, and the CFAST model was used to calculate activation time for this project.
For estimation of activation time in this study, a sprinkler with an RTI of 155 m1/2 s1/2 (280 ft1/2 s1/2) was in a 10 m (33 ft) square room with a ceiling height of 2.8 m (9.2 ft). The fire growth was the medium t-squared curve mentioned above. The sprinkler was located under the ceiling and 2.1 m (7 ft) horizontally from the center line of the smoke plume. CFAST predicted an activation time of about 252 s at 706 kW (670 Btu/s). For calculation of decay after sprinkler activation, a time constant of 435 s was used.
Conference Room Fire This is an unsprinklered fire that is limited to a conference room that was used for storage. The conference room includes materials in corrugated cardboard boxes and a number of pieces of upholstered furniture. Because some upholstered furniture burns like an ultra fast fire, the ultra fast growth type was used for the early stage of this fire until the room flashed over. Flashover is a transition from a locally isolated fire to a room totally involved in fire. This transition only takes a few seconds.

24
After flashover the airflow through this window controls the HRR, and this HRR can be expressed as a function of the door opening to the room
1/ 2vc w wQ C A H= (A.5)
where Q = heat release rate of fire, kW (Btu/s); Aw = area of ventilation opening, m2 (ft2); Hw = height of ventilation opening, m (ft); Cvc = 1260 (61.2).
The door opening is 0.914 m (3 ft) wide by 2.13 m (7 ft) high. From equation (A.5), the heat release rate of the fully developed fire is 3590 kW (3400 Btu/s).
To get temperatures to use in CONTAMW, a CFAST simulation was made of the fire in the conference room and open office space on the fire floor. The conference room is 3.2 m (10.5 ft) by 4.3 m (14.1 ft). This indicated that flashover occurred at 133 s. The temperatures are shown in Figures A1 and A2.
0
500
1000
1500
0 600 1200 1800 2400 3000 3600 4200
Time (s)
Tem
pera
ture
(C)
Upper LayerLower LayerAverage
Figure A1. CFAST simulated temperatures of the conference room
25
0
25
50
75
100
125
150
0 600 1200 1800 2400 3000 3600 4200
Time (s)
HRR
(kW
)
Upper LayerLower LayerAverage
Figure A2. CFAST simulated temperatures of the open office area on the fire floor
The average temperatures shown in Figures A1 and A2 are weighted averages, and they were calculated from
( )u lav
T H Z T ZTH− +
= (A.6)
where Tav = weighted average temperature, Tu = upper layer temperature, Tl = lower layer temperature, H = floor to ceiling height, Z = smoke layer interface. Open Office Plan Fire For the buildings of this study, the gross floor area is in the range of 1900 m2 (20,400 ft2) to 2040 m2 (22,000 ft2). For these calculations, the net floor area of open office space is taken as 1670 m2 (18,000 ft2), and the area of the windows is taken as 364 m2 (3920 ft2). One fully developed floor fire was used for these buildings.
The HHR calculations are based on the assumption that as the fire breaks the windows open, the fire is ventilation controlled as described by equation (A.5). At 600 s after ignition, the fire starts breaking windows, and this continues until all the windows are broken at 1550 s. At 600 s, the area of broken window is 2.26 m2 (24.3 ft2), and at 1550 s all of the windows are broken with a HRR of 680,000 kW (645,000 Btu/s). On an area basis, the maximum HRR is 407 kW/m2 (35.8 Btu/s ft2). Based on Madrzykowski’s work (1996), workstation fires can support this level of fire.
The growth stage of the fire was approximated by a t-square fire that grows to 680,000 kW (645,000 Btu/s) in 1550 s. From equation A1, the fire growth coefficient is 0.283 kW/s2 (0.268 Btu/s3).
After the windows are broken, the fire continues to burn at this rate for 1 hour. The workstations burned by Madrzykowski do not have sufficient fuel to support this fire for such a time. However, such a fire

26
could be supported by other fuel in the office space such as bookcases with books, boxes filled with paper, file cabinets filled with records and rolls of drawings. The decay phase of the fire is from 3600 s to 7200 s, and a time constant of 435 s was used for decay.
Because of restrictions on data input, CFAST version 3.1.7 could not be used to simulate a fire with such a large HRR. For this reason, a scaled down version of the fire had to be simulated by CFAST to obtain the temperatures for use in the CONTAMW simulations. CFAST simulations were made of the floor fire with (1) an elevator shaft and no enclosed elevator lobby and (2) an enclosed elevator lobby. The temperatures from these CFAST simulations are listed in Figures A.3 to A.5. The average temperatures were calculated as before.
0
500
1000
1500
2000
0 600 1200 1800 2400 3000 3600 4200
Time (s)
Tem
pera
ture
(C)
Upper LayerLower LayerAverage
Figure A3. CFAST simulated temperatures of open office area
27
0
50
100
150
200
0 600 1200 1800 2400 3000 3600 4200
Time (s)
Tem
pera
ture
(C)
Figure A4. CFAST simulated temperature of the elevator shaft without an enclosed lobby
0
20
40
60
80
100
120
140
0 600 1200 1800 2400 3000 3600 4200
Time (s)
Tem
pera
ture
(C)
Upper LayerLower LayerAverage
Figure A5. CFAST simulated temperatures of the enclosed elevator lobby

28
Appendix B – Fuel Properties The chemical heat of combustion of the mixture of two fuels can be calculated as
1 1 2 2ch ch chH f H f H∆ = ∆ + ∆ , (B.1)
and the mass optical density the mixture of two fuels can be calculated as
1 1 2 2m m mf fδ δ δ= + (B.2)
where
∆Hch = chemical heat of combustion of the mixture (kJ/kg),
∆Hch1 = chemical heat of combustion of component 1 (kJ/kg),
∆Hch2 = chemical heat of combustion of component 2 (kJ/kg),
δm, = mass optical density of the mixture (m2/g),
δm1 = mass optical density of component 1 (m2/g),
δm2 = mass optical density of component 2 (m2/g),
f1 = mass fraction of component 1 (dimensionless),
f2 = mass fraction of component 2 (dimensionless).
The lethal exposure dose, LCt50, of the mixture can be expressed as
50 1 50,1 2 50,2LC LC LCt f t f t= + (B.3)
where LCt 50is the lethal exposure dose from test data (Table A1).
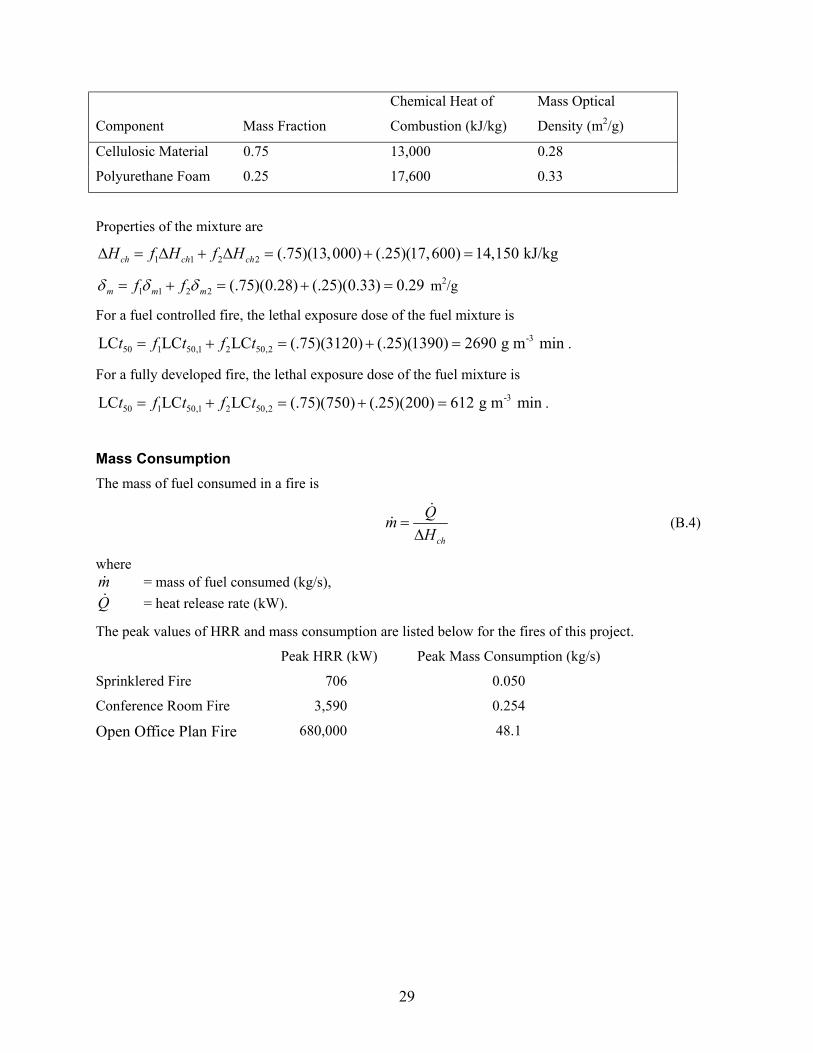
Table A1. Approximate Lethal Exposure Dose, LCt50, for Common Materials (adapted from Purser 2002) Nonflaming Fire Fuel Controlled Fire Fully Developed Fire Material lb ft-3 min g m-3 min lb ft-3 min g m-3 min lb ft-3 min g m-3 min Cellulosics 0.046 730 0.19 3120 0.047 750 C, H, O plastics 0.031 500 0.075 1200 0.033 530 PVC 0.031 500 0.019 300 0.012 200 Wool/Nylon (low N2) 0.031 500 0.057 920 0.0044 70 Flexible Polyurethane 0.042 680 0.087 1390 0.012 200 Rigid Polyurethane 0.0039 63 0.0062 100 0.0034 54 Modacrylic/PAN1 0.010 160 0.0087 140 0.0028 45 1PAN is polyacrylonitrile.
Cellulosic materials (wood, paper, cardboard, etc.) are very common fuels in building fires. They often burn in combination with some amount of polymers. For these calculations the mixture used is 75% cellulosic material and 25% polyurethane foam. The properties are listed below.
29
Chemical Heat of Mass Optical
Component Mass Fraction Combustion (kJ/kg) Density (m2/g)
Cellulosic Material 0.75 13,000 0.28
Polyurethane Foam 0.25 17,600 0.33
Properties of the mixture are
1 1 2 2 (.75)(13,000) (.25)(17,600) 14,150 kJ/kgch ch chH f H f H∆ = ∆ + ∆ = + =
1 1 2 2 (.75)(0.28) (.25)(0.33) 0.29m m mf fδ δ δ= + = + = m2/g
For a fuel controlled fire, the lethal exposure dose of the fuel mixture is -3
50 1 50,1 2 50,2LC LC LC (.75)(3120) (.25)(1390) 2690 g m mint f t f t= + = + = .
For a fully developed fire, the lethal exposure dose of the fuel mixture is -3
50 1 50,1 2 50,2LC LC LC (.75)(750) (.25)(200) 612 g m mint f t f t= + = + = .
Mass Consumption The mass of fuel consumed in a fire is
ch
QmH
=∆
(B.4)
where m = mass of fuel consumed (kg/s), Q = heat release rate (kW).
The peak values of HRR and mass consumption are listed below for the fires of this project.
Peak HRR (kW) Peak Mass Consumption (kg/s)
Sprinklered Fire 706 0.050
Conference Room Fire 3,590 0.254
Open Office Plan Fire 680,000 48.1
30
Appendix C – Wind For information about wind and smoke management, readers are referred to Kandola (1986a, 1986b) and Klote (1995). For additional information about wind pressures on buildings see Aynsley (1989), Shaw and Tamura (1977) and Kandola (1986c). Several civil engineering texts provide useful information about wind engineering, for example Dyrbye and Hansen (1997); Liu (1991), MacDonald (1975) and Simiu and Scanlan (1996).
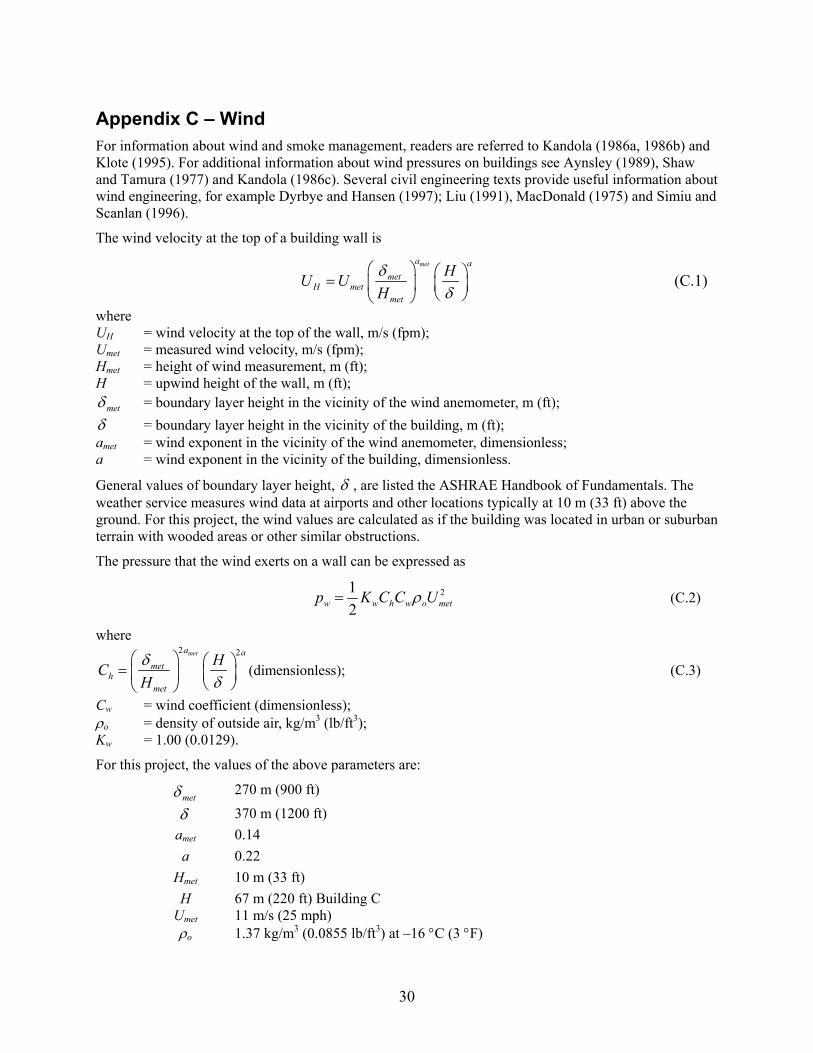
The wind velocity at the top of a building wall is meta a
metH met
met
HU UHδ
δ =
(C.1)
where UH = wind velocity at the top of the wall, m/s (fpm); Umet = measured wind velocity, m/s (fpm); Hmet = height of wind measurement, m (ft); H = upwind height of the wall, m (ft);
metδ = boundary layer height in the vicinity of the wind anemometer, m (ft); δ = boundary layer height in the vicinity of the building, m (ft); amet = wind exponent in the vicinity of the wind anemometer, dimensionless; a = wind exponent in the vicinity of the building, dimensionless.
General values of boundary layer height, δ , are listed the ASHRAE Handbook of Fundamentals. The weather service measures wind data at airports and other locations typically at 10 m (33 ft) above the ground. For this project, the wind values are calculated as if the building was located in urban or suburban terrain with wooded areas or other similar obstructions.
The pressure that the wind exerts on a wall can be expressed as
212w w h w o metp K C C Uρ= (C.2)
where 2 2meta a
meth
met
HCHδ
δ =
(dimensionless); (C.3)
Cw = wind coefficient (dimensionless); ρo = density of outside air, kg/m3 (lb/ft3); Kw = 1.00 (0.0129).
For this project, the values of the above parameters are:
metδ 270 m (900 ft)
δ 370 m (1200 ft) amet 0.14 a 0.22 Hmet 10 m (33 ft) H 67 m (220 ft) Building C Umet 11 m/s (25 mph) ρo 1.37 kg/m3 (0.0855 lb/ft3) at –16 °C (3 °F)

31
From equations (C.1) and (C.3), values of UH and Ch are listed below.
Umet Umet UH UH Building m/s mph m/s mph Ch
C 11 25 12 27 1.19
Average values of Cw can be obtained from Klote and Milke (2002) depending on values of h/w and l/w, where h = height to parapit, l = length, and w = width. h/w is 1.9 and l/w is 1.5 for Building C.
Average Values of Cw for Building C:
Wind Angle, α A B C D 0 0.8 -0.25 -0.8 -0.8
90 -.0.8 -0.8 0.8 -0.25
The wind angle is used in Klote and Milke and is illustrated in Figure C.1.
Figure C.1 Wind Angle.
For a wind angle of zero, the wind pressure is:
A B C D Pa in. H2O Pa in. H2O Pa in. H2O Pa in. H2O 79 0.31 -25 -0.10 -79 -0.31 -79 -0.31