hazard screening report - cpsc.gov · hazard screening report ... measurement tool that allows...
TRANSCRIPT

Hazard Screening Report
Injuries to Persons 65 Years of Age and Older
Part 1 - All Products

2
The Hazard Screening Project As an aid in setting priorities, Consumer Product Safety Commission (CPSC) staff is preparing this series of Hazard Screening Reports. Each report covers a group of related products, such as nursery equipment, house wares, etc. These reports follow a common format that allows readers to compare the risk for different types of products within a given category. Significantly, CPSC staff has also developed a measurement tool that allows comparisons of risks from products in different categories. This feature, called “Maximum Addressable Cost Estimates,” is explained more fully below. CPSC managers plan to use this information to set priorities for efficient use of resources. Each Hazard Screening Report contains information on the estimated number of injuries and deaths associated with the type of products covered in that report. A graph shows the frequency of emergency-room treated injuries over time. This is followed by a pie chart showing the distribution of injuries by the source of the hazard, such as mechanical, fire, electrical, chemical and other. CPSC staff also estimates the total “cost” to society of each type of product. This includes the cost of injuries, deaths and property damage associated with the products. To facilitate comparisons of risk between different types of products, CPSC staff has developed Maximum Addressable Cost Estimates. These build on the concept of “addressable” cost. Simply put, the “addressable” cost is the portion of the total cost that could possibly be reduced by some action that CPSC could take. Many of consumer injuries are not addressable. For example, if a boy trips over a rake in the driveway, any injury he suffers could be associated with the category of Yard and Garden Equipment. But it is very unlikely that such injuries could be prevented by changing the design of rakes. By eliminating these unaddressable costs from consideration, we are able to focus on what’s left -- the costs that we might be able to do something about. The name “Maximum Addressable Cost Estimates” is intended to emphasize that these estimates are upper limits of the cost that might be successfully addressed. It should also be stressed that the term does not necessarily mean that there is any existing method or technology for reducing the costs. For a more detailed explanation of this subject, please refer to the individual Hazard Screening Reports. CPSC staff plans to complete 20 reports in 2005. As each report is completed there will be an active link to it on the CPSC website. All reports are in Portable Document Format (PDF). The 20 reports that will comprise the complete set are: Home Workshop Apparatus, Tools and Attachments Yard and Garden Equipment Toys Nursery Products Children’s Outdoor Activities and Equipment Major Team Sports Injuries to Persons 65 and Older

3
House wares and Kitchen Appliances Recreational Cooking and Camping Products Home Communication, Entertainment and Hobby Products General Household Appliances Home Furnishings and Fixtures & Home Alarm,
Escape and Protection Devices Sports (minus major team sports) Personal Use Items Heating, Cooling and Ventilating Equipment Packaging and Containers for Household Products Miscellaneous Products Home Structures and Construction Materials Home and Family Maintenance Products – Household Chemicals Drugs These reports will be useful to individuals and organizations who are seeking reliable information about estimated deaths, injuries, and costs associated with consumer products and to CPSC’s staff and Commissioners, who need objective data to identify candidates for future activities to reduce deaths and injuries.

CAVEAT! The report addresses the question of addressability of injuries by attempting to identify those injuries which are incidental and not addressable by mandatory or voluntary standards or by other action which the U.S. Consumer Product Safety Commission (CPSC) could take. Those injuries that remain are referred to as maximum addressable. To know the actual addressability of the hazards associated with a product usually requires a detailed study of the problem, and the product. This level of study is not feasible for this type of overview report. What we do instead is try to eliminate those injuries and deaths which involve the product only marginally or incidentally. The remaining injuries are then run through the Injury Cost Model, to produce an estimate of maximum addressable costs. The maximum addressable cost estimate does not necessarily represent the injury and death costs that the CPSC might actually be able to prevent each year through some type of action. It represents only a target population from which any successful prevention will have to come. For example: If a person falls from a ladder, but we have no information about whether the ladder broke, moved, or in some other way contributed to the incident, we would count that injury as in the maximum addressable category. It may not be addressable. We just don’t have enough information to rule it out. Maximum addressable injury estimates include every case that we could not clearly rule out as incidental. They do not represent the number or percent of injuries that could actually be prevented. In addition, addressability definitions are based on review by Epidemiology staff using information available at the time each report is prepared. These determinations should be considered general estimates for agency planning purposes, not definitive staff evaluations of whether a specific type of hazard might be prevented. The fact that a given hazard associated with a product was not considered addressable in one of these reports should not be construed as indicating that that hazard should never be reconsidered or addressed.

1-1
Introduction This report deals with all product groups and a specific population group, persons 65 years of age or older. It differs from other hazard screening reports, each of which deals with a group or class of products across all age groups. Because it covers all product groups, this report is less detailed with regard to individual products within the categories. However, the objective is to identify products or groups of products which have a unique or disproportionate effect on people 65 or older. Products reviewed in this report have been divided into two groups. Group 1 consists of those product categories for which initial review of the data indicated that there was enough information in the CPSC databases to identify issues which might be addressed by the Commission. Group 2 consists of those product categories that met at least one of the following criteria.
1. Little relevance to the population 65 and older (e.g., children’s products). 2. Virtually all of the injuries reported were incidental in nature. 3. Large numbers of injuries, but very little detail about product involvement
(e.g., stairs). Based on this preliminary review and sorting, product categories in Group 1 were examined and discussed in more detail than those in Group 2. Information is provided separately for each of these two groups.

1-2
Product Groups
Group 1
• Home Workshop Tools and Attachments • Yard and Garden Equipment • Housewares • Ladders and Step Stools • Sports • Personal Use Items • Household Chemical Products • General Household Appliances • Kitchen Appliances • Heating, Cooling and Ventilating Equipment • Packaging and Containers for Household Products • Wiring, Lighting and Decorations
Group 2
• Children’s Products • Bathroom Furnishings and Fixtures • Bedroom Furnishings • Home Furniture • Carpets and Rugs • Other Home Furnishings • Home Communication, Entertainment and Hobby • Recreational Cooking and Camping • Smoking Materials • Fuel and Fuel Storage • Miscellaneous Products • Windows and Doors • Escalators and Elevators • General Home Structures • Stairs • Off-Road Vehicles

1-3
Background This report examines product-related injuries and deaths to persons 65 years of age and older. Figure 1 shows the frequency of emergency room-treated injuries to this population, by year, over the six-year period 1997 through 2002.
Figure 1. Estimated Number of Emergency Room-Treated, Product-Related Injuries to Persons 65 Years of Age and
Older, by Year, 1997 - 2002
1,451,1401,465,6401,475,310
1,421,670
1,342,340
1,200,530
0
200000
400000
600000
800000
1000000
1200000
1400000
1600000
1997 1998 1999 2000 2001 2002
The change from 1997 to 2002 was an increase of 250,610 injuries. This is a statistically significant increase (P = .01). In 2000, the most recent year for which death data are complete, the U.S. Consumer Product Safety Commission (CPSC) received reports of over 3,300 product-related deaths to this age group. In 2002, the single year injury costs associated with injuries to persons 65 years or older were $89.5 billion. In 2000, death costs for the over 3,300 product-related deaths among persons in this age group were approximately $16.5 billion. Combining these two figures into a single index results in an estimate of approximately $106.0 billion in injury and death costs associated with this population. Overall, 23% of those persons 65 or older, who were treated in hospital emergency rooms for product-related injuries, were admitted to the hospital, transferred to another hospital, held for observation, or died in the emergency room or on the way to the hospital. Compared with the overall 4% hospitalization rate for the population as a whole

1-4
associated with product-related injuries, this figure illustrates the special vulnerability of this population and at least partially explains why the cost figures are so high for seniors. By way of comparison with the rest of the population, the total number of emergency room-treated injuries for persons less than 65 years of age increased by 15% over the six years 1997 – 2002. The increase among those 65 and older was 21%. Figure 2 illustrates the comparison of the rate of emergency room-treated injuries per 1,000 population for persons 65 and older with the rate for the rest of the adult population, i.e., persons 20 – 64 years of age. The 65 and older group has a higher rate of injury in each year of the six-year period examined. This pattern does not hold in every category of products examined. In the following pages those product categories for which the 65 and older population experienced a higher rate of injury than other adults are identified.
Figure 2. Rate of Emergency Room-Treated Injuries per 1,000 Population, Age Groups 20 - 64 and 65+, by Year 1997 - 2002
32.53
40.73
34.3032.4930.5730.66
28.31
41.4742.0640.8538.77
34.89
0.00
5.00
10.00
15.00
20.00
25.00
30.00
35.00
40.00
45.00
1997 1998 1999 2000 2001 2002
20-64 Rate 65+ Rate

1-5
The population of people 65 and older has grown over the past decade and is predicted to continue to grow in the future. This population represents not just a larger number of persons, but a larger proportion of the population in the United States. Virtually all of this growth in population has taken place in the age group 75 years and older. Figure 3 illustrates the population growth in this group.
Figure 3. Estimated Population 65 Years of Age and Over(in thousands), by Two Age Groups, 1990 - 2003
-
2,000
4,000
6,000
8,000
10,000
12,000
14,000
16,000
18,000
20,000
65-74 75+
65-74 18,100 18,271 18,442 18,629 18,703 18,757 18,690 18,528 18,390 18,218 18,172 18,155 18,129 18,176
75+ 13,141 13,508 13,853 14,184 14,508 14,863 15,266 15,657 15,997 16,321 16,760 16,908 17,174 17,458
1990 1991 1992 1993 1994 1995 1996 1997 1998 1999 2000 2001 2002 2003

1-6
With this increase, one could expect an increase in emergency room treated injuries. As the population in the age group grows larger, the exposure to product-related hazards increases, and as a result injuries could be expected to increase. Product-related emergency room-treated injuries among those 75 and older have increased faster than the increase in the population. As a result, the rate of injury among this population has shown a dramatic increase. Figure 4 shows the increase in the rate of injury per 1,000 population in this age group from 1991 through 2002.
Figure 4. Rate of Emergency Room-Treated Injuries per 1,000 Population, Two Age Groups, by Year, 1991 - 2002
55.64
55.6956.5956.5953.47
48.40
49.28
47.7247.2245.3843.17
40.79
27.34
28.8628.9927.3426.4923.9024.0723.4724.1323.6223.1322.06
0.00
10.00
20.00
30.00
40.00
50.00
60.00
1991 1992 1993 1994 1995 1996 1997 1998 1999 2000 2001 2002
Age 75 - 110 Age 65-74
Among the 75 and older population, there was a 73 % increase in injuries from 1991 through 2002, when there was a 27 % increase in population. This translates into a 36% increase in the rate of injury. Over this same period, the 65-74 year old population did not change, but there was a 23% increase in injuries from 402,990 to 495,600, resulting in a 24% increase in the rate of injury. Deaths For 2000, CPSC received reports of over 3,300 product-related deaths to this age group. There were 672 deaths associated with products in Group 1, and almost 2,700 associated with products in Group 2. A very small portion of the deaths in Group 2 were identified as falling into the category of maximum addressable*. In many cases there was insufficient detail to even identify a product as being involved in the death (e.g., house fires). * The definition of maximum addressable is contained in the Overview Summary section on the next page.

1-7
Overview Summary The change from 1997 to 2002 was an increase of 247,740 injuries. This is a statistically significant increase (P = .01). Table 1 provides a summary of Group 1 products. The table provides information on the number of emergency room-treated injuries, the number of medically-treated injuries, the percentage of the emergency room treatments that resulted in admission to the hospital, the number of deaths reported, the costs associated with medically-treated injuries, the costs associated with deaths, and the total of these two cost estimates.1 Table 1A provides this same information for Group 2 products. Product categories in Group 1 were associated with over $20 billion dollars in injury and death costs. Group 2 categories were associated with over $84 billion dollars in injury and death costs, but as described in the Introduction, these injuries were either incidental injuries or there was not enough detail in the data to identify how the product was involved in the injury or death. Many of the injuries treated in emergency rooms that involved this population may not be addressable. To know actual addressability of the hazards associated with a product usually requires detailed study of the problem and the product. This level of study is not feasible for an overview report. What we do instead is try to identify that portion of the injury and death costs which involve the product only marginally or incidentally. The number that remains after these costs are removed, is the maximum addressable cost associated with that product or product group.
The maximum addressable cost estimate does not necessarily represent the injury and death costs that the CPSC might actually be able to prevent each year through some type of action. It represents only a target population from which any successful prevention will have to come.
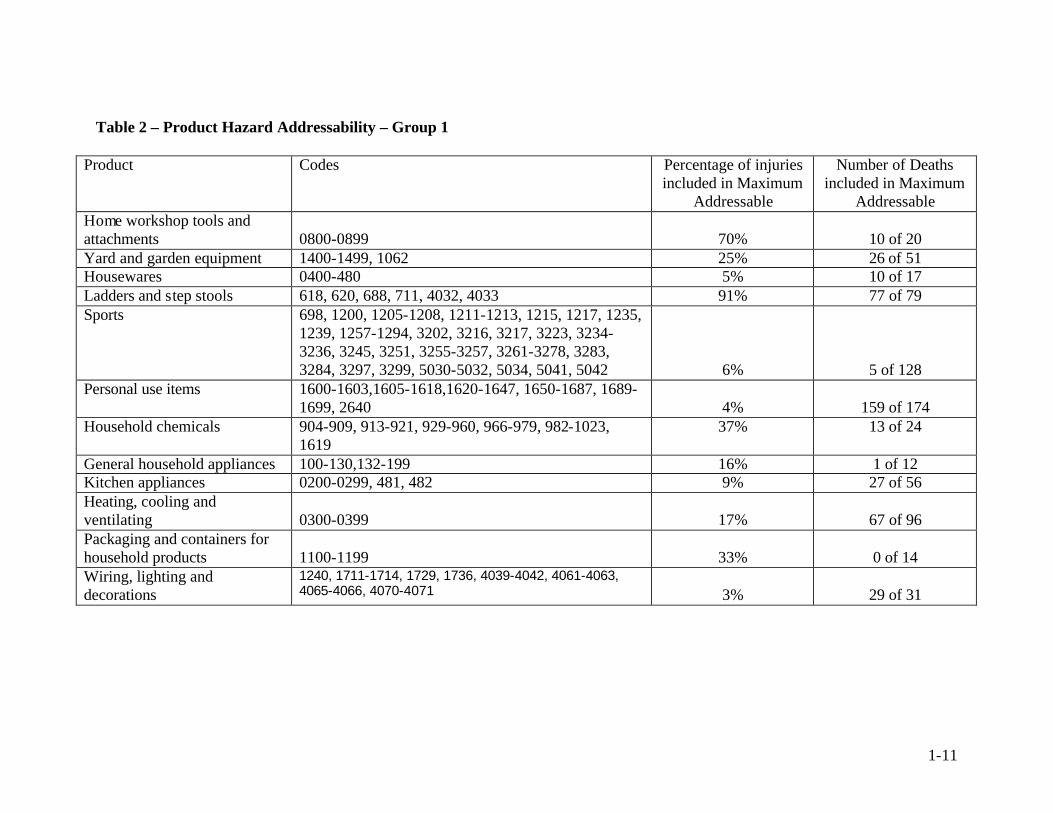
Table 2 shows the percentage of injuries included in the maximum addressable category for each product category in Group 1. It also shows how many of the deaths reported were included in the maximum addressable category. For the reasons described in the Introduction, this table was not prepared for Group 2. Figure 5 shows the index of estimated injury and death costs for each of the product categories in Group 1, and the estimated maximum addressability of those costs. Figure 6 shows the index of estimated injury and death costs for the products in Group 2, however, since addressability for these products was either very small or could not be determined from the available data, only the total costs are shown.
1 This total represents an index rather than an actual single year estimate of costs, because injury costs are based on 2002, and the death costs are based on 2000. These are the most recent years for which each of these cost items was available.

1-8
Table 3 lists all of the product categories in Group 1 and provides estimates of maximum addressable injury and death costs. Product categories in this table are shown ranked by total costs and by maximum addressable costs. Because this report deals with a segment of the population rather than a specific group of products, findings are expressed in terms of their effect on the population 65 or older. Following are the most noteworthy findings from this review of the data. Product Category Findings Yard and garden equipment
Higher population based rate of injury among persons 65 and older than among persons 20 – 64. Riding mower tipover or rollover is a hazard in the 65 and older age group. Tripping over garden hoses results in injuries and deaths and may be an unforeseen hazard.
Ladders and step stools Higher population based rate of injury among persons 65 and older than among persons 20 – 64. Persons 65 and older account for half (79) of all ladder deaths. This population accounts for 16% of emergency-room treated injuries involving ladders, but represent 39% of those hospitalized for ladder-related injuries.
Sports CPSC has reports of 100 drownings to the 65 and older age group in swimming pools or spas in one year. This is disproportionate to the group’s share of the population.
Personal use items (includes items such as grooming devices, jewelry and clothing)
Higher population based rate of injury among persons 65 and older than among persons 20 – 64. Overall injury and death costs are substantial, but most noteworthy hazard is the 159 clothing ignition related deaths to persons 65 or older in a single year.
Packaging and containers for household products
Almost one-third of the 35,000 emergency room-treated injuries were cuts from cans. Almost all of these occurred during the opening process, usually involving a can that did not require a can opener.
Children’s products This category includes bicycles. There were 106 deaths to persons 65 and older reported in this category in 2000. Of these, 104 deaths involved bicycles, 46 of these bicycle-related deaths were potentially addressable head injuries.

1-9
Table 1 – Product Summary Table, Group 1, Injury, Death and Cost Estimates, Persons 65 Years of Age and Older Title
Codes
ER-treated
injuries 2002
Medically-treated
injuries 2002
% Hospitalized
2002
Deaths 2000
Injury Cost (in millions)
Death Cost (in millions)
Total Cost (in millions)
Home workshop tools and attachments
0800-0899
38,210
86,830
6.8%
20
$1,363.0
$100.0
$1,463.0
Yard and garden equipment
1400-1499, 1062
41,780
108,710
12.6%
51
$1,971.6
$255.0
$2,226.6
Housewares
0400-480
52,990
122,410
5.5%
17
$1,588.9
$85.0
$1,673.9
Ladders and step stools
618, 620, 688, 711, 4032, 4033
28,510
76,890
26.0%
79
$2,286.7
$395.0
$2,681.7
Sports
698, 1200, 1205-1208, 1211-1213, 1215, 1217, 1235, 1239, 1257-1294, 3202, 3216, 3217, 3223, 3234-3236, 3245, 3251, 3255-3257, 3261-3278, 3283, 3284, 3297, 3299, 5030-5032, 5034, 5041, 5042
57,120
168,890
11.8%
128
$3,164.2
$640.0
$3,804.2
Personal use items
1600-1603,1605-1618,1620-1647, 1650-1687, 1689-1699, 2640
58,220
149,660
16.5%
174
$3,046.5
$870.0
$3,916.5
Household chemicals
904-909, 913-921, 929-960, 966-979, 982-1023, 1619
7,880
20,100
13.2%
24
$315.9
$120.0
$435.9
General household appliances
100-130,132-199
8,700
22,660
12.8%
12
$448.8
$60.0
$508.8
Kitchen appliances
0200-0299, 481, 482
12,790
32,270
15.3%
56
$747.3
$280.0
$1,027.3
Heating, cooling and ventilating
0300-0399
11,240
28,260
18.1%
96
$760.8
$480.0
$1,240.8
Packaging and containers for household products
1100-1199
35,020
97,850
9.2%
14
$1,399.5
$70.0
$1,469.5
Wiring, lighting and decorations
1240, 1711-1714, 1729, 1736, 4039-4042, 4061-4063, 4065-4066, 4070-4071
5,800
15,340
14.9%
31
$279.3
$155.0
$434.3

1-10
Table 1A. – Product Summary Table, Group 2, Injury, Death and Cost Estimates, Persons 65 Years of Age and Older
Title
Product Codes
ER-treated
injuries 2002
Medically-
treated injuries 2002
%
Hospitalized 2002
Deaths 2000
Injury cost
(in millions)
Death cost
(in millions)
Total cost
(in millions)
Children’s products
1300-1305, 1309-1350, 1392, 5001-5015, 1500-1599, 1233, 1234, 1242-1244, 3219, 3246, 3279,
5033, 5040
18,630
19,000
18.2%
106
$1,321.4
$530
$1,851.4
Bathrooms 609-611, 617, 648, 649, 657, 666, 4030 85,630 220,630 27.5% 194 $6,039.8 $970 $7,009.8 Bedrooms 601, 661, 662, 680, 689, 694, 4002, 4008-4010,
4043, 4050, 4051, 4054, 4069, 4072, 4076 144,170 371,770 27.4% 291 $9,596.1 $1,455 $11,051.1
Furniture 519, 604, 676, 679, 687, 693, 1353, 4003, 4013-4026, 4052, 4053, 4056, 4057, 4074, 5043
188,730 489,730 21.5% 160 $11,110.7 $800 $11,910.7
Rugs & carpets 612, 613, 676 45,640 118,840 23.9% 31 $2,723.2 $155 $2,878.2 Other furnishings 606, 623, 627, 628, 638, 639, 652-654, 663, 672,
684, 685, 692, 699, 701, 702, 707, 709, 712
7,220
17,500
14.6% 7
$325.7
$35
$360.7
Home communication
500-518, 520-599, 1306, 1356, 1376
11,930
31,230
22.5%
4
$610.4
$20
$630.4
Recreational cooking & camping
1232, 1247, 1255, 1688, 3218, 3229, 3230, 3233,
3248-3250, 3252, 4060, 5029, 5037
1,930
4,920
14.8%
14
$98.3
$70
$168.3
Smoking materials 1604, 1728, 1731, 1740, 1909 1,280 2,890 43.5% 72 $170.0 $360 $530.0 Fuel & fuel storage
131, 910, 962-965, 980, 981
1,590
3,920
17.9%
30
$124.1
$150
$274.1
Miscellaneous products
1701, 1711-1715, 1729, 1732-1738, 1741-1799, 4004, 4005, 4039-4042, 4044-4047, 4055, 4058,
4061-4068, 4070, 4071
13,060
33,090
10.6%
20
$728.3
$100
$828.3
Windows & doors 1823-1828, 1849, 1854, 1867-1870, 1873, 1875, 1878-1883, 1888
54,700 136,790 14.9% 28 $2,811.7 $140 $2,951.7
Elevators/ escalators
1889-1891
6,500 19,180 11.5% 0 $346.7 $0 $346.7
General home structures
1803-1821, 1841, 1843, 1855-1866, 1871, 1876, 1884-1887, 1899
464,450
1,122,940
32.7%
1,602
$34,532.8
$8,010
$42,542.8
Stairs 1829, 1840, 1842 160,180 441,860 20.7% 46 $10,244.7 $230 $10,474.7 Off-road vehicles 3215, 3259, 3285-3296, 5035, 5036 2,040 5,570 18% 43 $111.1 $215 $326.1
1-11
Table 2 – Product Hazard Addressability – Group 1
Product Codes Percentage of injuries included in Maximum
Addressable
Number of Deaths included in Maximum
Addressable Home workshop tools and attachments
0800-0899
70%
10 of 20
Yard and garden equipment 1400-1499, 1062 25% 26 of 51 Housewares 0400-480 5% 10 of 17 Ladders and step stools 618, 620, 688, 711, 4032, 4033 91% 77 of 79 Sports
698, 1200, 1205-1208, 1211-1213, 1215, 1217, 1235, 1239, 1257-1294, 3202, 3216, 3217, 3223, 3234-3236, 3245, 3251, 3255-3257, 3261-3278, 3283, 3284, 3297, 3299, 5030-5032, 5034, 5041, 5042
6%
5 of 128 Personal use items 1600-1603,1605-1618,1620-1647, 1650-1687, 1689-
1699, 2640
4%
159 of 174 Household chemicals 904-909, 913-921, 929-960, 966-979, 982-1023,
1619 37% 13 of 24
General household appliances 100-130,132-199 16% 1 of 12 Kitchen appliances 0200-0299, 481, 482 9% 27 of 56 Heating, cooling and ventilating
0300-0399
17%
67 of 96
Packaging and containers for household products
1100-1199
33%
0 of 14
Wiring, lighting and decorations
1240, 1711-1714, 1729, 1736, 4039-4042, 4061-4063, 4065-4066, 4070-4071
3%
29 of 31

1-12
Figure 5. Estimated Cost Index in Millions of Dollars, Injuries and Deaths to Persons 65 Years of Age and Older, Products in Group 1, by Total Costs
$- $500 $1,000 $1,500 $2,000 $2,500 $3,000 $3,500 $4,000 $4,500
Personal use items
Sports
Ladders and step stools
Yard and garden equipment
Housewares
Packaging and containers for household products
Home workshop tools and attachments
Heating, cooling and ventilating
Kitchen appliances
General household appliances
Household chemicals
Wiring, lighting and decorations
Maximum AddressableCost (in millions)
Non addressable cost(in millions)
• This estimate of maximum addressable cost does not necessarily represent the costs that the CPSC might actually be able
to prevent each year through some type of action. It represents only a target population from which any successful prevention will have to come.
• The data presented in this graphic are also contained in Table 3 under the headings “Total injury and death costs” and
“Total maximum addressable cost.”

1-13
Figure 6. Estimated Injury and Death Costs Associated withProducts in Group 2, in Millions of Dollars
$11,910.7
$11,051.1
$10,474.6
$7,009.8
$2,951.7
$2,878.2
$1,851.4
$828.3
$630.4
$530.0
$360.7
$346.7
$326.1
$274.1
$168.3
$42,542.8
$- $5,000.0 $10,000.0 $15,000.0 $20,000.0 $25,000.0 $30,000.0 $35,000.0 $40,000.0 $45,000.0
General home structures
Furniture
Bedroom
Stairs
Bathroom
Windows & doors
Rugs and carpets
Children's products
Miscellaneous products
Home communication
Smoking materials
Other furnishings
Elevators & escalators
Off road vehicles
Fuel & fuel storage
Rec. cooking and camping

1-14
Table 3. Calculation of Indices using cost estimates from Injury Cost Model and Death Certificate File
Title Medically attended
injury cost Death cost Total injury and
death costs Total maximum
addressable costs Maximum
addressable injury cost
Maximum addressable death
cost
Group 1 rank on
total costs
Group 1 rank on maximum
addressable costs
Home workshop tools and attachments
$1,363,037,003
$100,000,000
$1,463,037,003
$1,122,010,403
$1,072,010,403
$50,000,000
7
2
Yard and garden equipment
$1,971,648,782
$255,000,000
$2,226,648,782
$448,715,712
$318,715,712
$130,000,000
4
5
Housewares
$1,588,855,981
$85,000,000
$1,673,855,981
$153,530,922
$103,530,922
$50,000,000
5
10
Ladders and step stools
$2,286,745,016
$395,000,000
$2,681,745,016
$2,476,880,332
$2,091,880,332
$385,000,000
3
1
Sports
$3,164,179,298
$640,000,000
$3,804,179,298
$245,343,929
$220,343,929
$25,000,000
2
6
Personal use items
$3,046,536,048
$870,000,000
$3,916,536,048
$1,061,568,031
$266,568,031
$795,000,000
1
3
Household chemicals
$315,905,052
$120,000,000
$435,905,052
$151,228,116
$86,228,116
$65,000,000
11
11
General household appliances
$448,858,145
$60,000,000
$508,858,145
$55,062,379
$50,062,379
$5,000,000
10
12
Kitchen appliances
$747,317,806
$280,000,000
$1,027,317,806
$207,272,660
$72,272,660
$135,000,000
9
8
Heating, cooling and ventilating
$760,814,589
$480,000,000
$1,240,814,589
$462,942,461
$127,942,461
$335,000,000
8
4
Packaging and containers for household products
$1,399,482,496
$70,000,000
$1,469,482,496
$219,148,572
$219,148,572
$0.0
6
7
Wiring, lighting and decorations
$ 279,268,814
$155,000,000
$ 434,268,814
$153,879,184
$8,879,184
$ 145,000,000
12
9
• The estimates of total costs and total maximum addressable costs are indices, not actual estimates of expected injury cost reduction. This is because injury
cost estimates are based on 2002 emergency room-treated injury estimates, and death cost estimates are based on deaths reported which occurred in 2000. The cost figures in the table do not represent an actual estimate of the costs associated with any of the product groups for a specific year. They were developed, using the data available, to provide indices for the purpose of comparison.

Methodology NEISS The Commission operates the National Electronic Injury Surveillance System (NEISS), a probability sample of 98 U.S. hospitals with 24-hour emergency rooms (ERs) and more than six beds. These hospitals provide CPSC with data on all consumer product-related injury victims seeking treatment in the hospitals’ ERs. Injury and victim characteristics, along with a short description of the incident, are coded at the hospital and sent electronically to CPSC. Because NEISS is a probability sample, each case collected represents a number of cases (the case’s weight) of the total estimate of emergency room-treated injuries in the U.S. The weight that a case from a particular hospital carries is associated with the number of hospitals in the U.S. of a similar size. NEISS hospitals are stratified by size based on the number of annual emergency-room visits. NEISS comprises small, medium, large and very large hospitals, and includes a special stratum for children’s hospitals.2 This analysis uses NEISS data for the period 1/1/1997 through 12/31/2002. CPSC’s Death Certificate Database CPSC purchases death certificates from all 50 states, New York City, the District of Columbia and some territories. Only those certificates in certain E-codes (based on the World Health Organization’s International Classification of Diseases ICD-10 system) are purchased. These are then examined for product involvement before being entered into CPSC’s death certificate database. The result is neither a statistical sample nor a complete count of product-related deaths, nor does it constitute a national estimate. The database provides only counts of product-related deaths from a subset of E-codes. For this reason, these counts tend to be underestimates of the actual numbers of product-related deaths.
Death certificate collection from the states takes time. At the time this report was prepared, data for 2001 and 2002 were not complete.
2 Kessler, Eileen and Schroeder, Tom. The NEISS Sample (Design and Implementation). U.S. Consumer Product Safety Commission. October 1999.

1-16
CPSC’s Injury or Potential Injury Incident File (IPII) IPII is a database containing reports of injuries or potential injuries made to the Commission. These reports come from news clips, consumer complaints received by mail or through CPSC’s telephone hotline or web site, Medical Examiners and Coroners Alert Program (MECAP) reports, letters from lawyers, and similar sources. While the IPII database does not constitute a statistical sample, it can provide CPSC staff with guidance or direction in investigating potential hazards. For this report, MECAP reports for 2000 were included with the death reports. MECAP for 2002 were not reviewed in detail as part of the review of IPII data.
CPSC’s Injury Cost Model The Injury Cost Model (ICM) is a computerized analytical tool designed to measure the direct and indirect costs associated with consumer product-related injuries. In addition to providing a descriptive measure of injury hazards in monetary terms, the ICM is also used to estimate the benefits of regulatory actions designed to reduce consumer product injuries and to assist the Commission in planning, budgeting, and evaluating projects. The ICM is structured to measure the four basic categories of injury costs: medical costs, work losses, pain and suffering, and product liability and legal costs. Medical costs include doctor and hospital-related costs as well as diagnostic procedures, prescription drugs, equipment, supplies, emergency transportation, follow-up care, and administrative costs. Both the initial treatment costs and the costs of long term care are included. Work-related losses represent the value of lost productivity, the time spent away from normal work activities as the result of an injury. Work-related losses include both the short-term losses resulting from being absent from work and the long-term losses resulting from permanent partial or total disability and its impact on lifetime earnings. They also include the value of work lost as a result of caring for injured children, the value of housework lost due to an injury, and the loss to the employer resulting from the disruption of the workplace.
Pain and suffering represents the intangible costs of injury, and is based on jury verdicts for consumer product-related injuries. Product liability and legal costs represent the resources expended in product liability litigation. These costs include the costs of administering the product liability insurance system (including the plaintiff’s legal costs and the costs of defending the insured manufacturer or seller), the costs of claims investigation and payment, and general underwriting and administrative expenses; however, medical, work loss, and pain and suffering compensation paid to injury victims and their families is excluded, thus avoiding double counting.

1-17
The ICM estimates the costs of injuries reported through the National Electronic Injury Surveillance System (NEISS), a national probability sample of hospital emergency departments. The injury cost estimates depend on a number of factors, and vary by the age and sex of the injured person, the type of injury suffered, the body part affected, and whether or not the victim is hospitalized or treated and released. The ICM also uses empirically derived relationships between emergency department injuries and those treated in other settings (e.g., doctor’s offices, clinics) to estimate the number of injuries treated outside hospital emergency departments and the costs of those injuries. A number of databases are used to calculate the four cost categories. National discharge data and discharge data from six states are used to estimate the costs of hospitalized injuries. Data from Department of Defense medical records from almost two million retirees and civilian dependents of military personnel and several National Center for Health Statistics surveys dealing with costs of treatment in different medical settings are used to calculate medical costs for injuries where the victim is treated and released from the emergency department or treated in a clinic or doctor’s office. Other major data sources include the Annual Survey of Occupational Illnesses and Injuries and the Detailed Claims Information (DCI) database for work loss estimates; and the Jury Verdicts Research data for pain and suffering estimates. Product liability and legal costs are derived analytically from insurance industry information and several studies of product liability.
To determine the maximum addressable cost estimate, the injury narratives were read to determine which would not be addressable. The remaining injuries were then run through the Injury Cost Model, producing the estimate of maximum addressable costs.

Analytical Methodology Specific to this Report The Emerging Hazards staff used the following procedures to determine the proportion of injuries and costs associated with a product category, which could be classified as maximum addressable. As an initial step, NEISS narratives and death reports were read by staff to get a general idea about the types of injuries included in each category. Staff knowledge and experience were also used in this review. This review served to sort the product categories into two groups. Group 1 consists of those product categories for which initial review of the data indicated that there was enough information in the CPSC databases to identify issues which might be addressed by the Commission. Group 2 consists of those product categories that met at least one of the following criteria.
4. Little relevance to the population 65 and older (e.g., children’s products). 5. Virtually all of the injuries reported were incidental in nature. 6. Large numbers of injuries, but very little detail about product involvement (e.g.,
stairs). For the product categories in Group 1, which were to be examined in detail, the entire NEISS file was searched using key words (fall, fell, slip, trip) to identify those injuries that were the result of falls. Falls were separated from non-falls, and random samples of 300 cases of the injuries in each category were pulled. These samples were examined and the staff made decisions about which sample (or both) would produce sufficient information to identify cases as maximum addressable or non-addressable. Every product category included in this report was either reviewed in entirety or had at least one random sample retrieved and reviewed. The list below shows which group of narratives was reviewed for each product category in Group 1. For product categories in Group 2, a single sample was drawn and reviewed to determine addressability. Product Category NEISS narratives reviewed Workshop tools and equipment Non falls (1 sample) Yard and garden equipment Both falls and non falls (2 samples) Housewares Non falls (1 sample) Ladders and step stools Falls (1 sample) Non falls (all) Sports Non falls (1 sample) Personal use items Non falls (1 sample) Household chemicals Non falls (reviewed all, no sample needed) General household appliances All narratives reviewed, no sample needed. Kitchen appliances Both falls and non falls (1 sample) Heating, cooling and ventilating Non falls (1 sample) Packaging for household products Non falls (1 sample) Wiring, lighting and decorations All narratives reviewed, no sample needed.

1-19
Narratives were read and hazard patterns identified. A hazard pattern was identified as either in the category of maximum addressable or as not addressable. All cases in a given hazard pattern are in the same addressability category. The weights of these cases were then summed and compared with the total estimate for the sample to determine the percentage of the injuries that were in the maximum addressable category. The entire sample and the addressable subsample were then run through the Injury Cost Model, to determine the percentage of the costs which were associated with the cases identified as addressable. This percentage was then applied to the total medically-treated injury cost for the product category (not the sample), to get the total medically-treated injury costs associated with the maximum addressable cases. This process was used rather than simply applying the percentage of injuries to the total costs, because the staff has found that potentially addressable injuries may often be more costly than those identified as non-addressable or incidental. To identify addressability among the deaths, each death report was read, assigned a pattern and identified as either maximum addressable or non-addressable. A cost of $5 million per life lost was assigned to each of the deaths. This estimate is a mid point of the $3 million to $7 million range that is currently used in most economic literature. To produce overall estimates of maximum addressable injury costs associated with a product category, the totals for injuries and the totals for deaths were summed.