hawaii innovationhawaii innovation indicatorsfiles.hawaii.gov/.../innovation-indicators-2010.pdf ·...
TRANSCRIPT

Hawaii InnovationHawaii Innovation IndicatorsIndicatorsHawaii Innovation Hawaii Innovation IndicatorsIndicators
Update 2010 Update 2010
State of HawaiiState of HawaiiJanuary 2010January 2010

2 | P a g e Innovation Indicators
Department of Business, Economic Development & Tourism January 2010
This report was prepared by the Economic Information Staff Branch of the DBEDT Research and Economic Analysis Division, Dr. Pearl Imada Iboshi, Division Head. Data collection and graphs were assembled and prepared by Dr. Ming Zhang, Economist. Analysis and narrative sections were prepared by Robert Shore, Branch Chief.
Hawaii Department of Business, Economic Development & tourism January 2010

Innovation Indicators P a g e | 3
Department of Business, Economic Development & Tourism January 2010
Table of Contents I. Executive Summary 4
II. Innovation and Hawaii’s Economy 8
III. Innovation Indicators 11
A. Capacity for Innovation 11
B. Innovation Sector & Support Assets 26
C. Economic Transformation 32
IV Conclusions 38
4 | P a g e Innovation Indicators
Department of Business, Economic Development & Tourism January 2010
I. Executive Summary
Hawaii’s Innovation Indicators This is an update report on the performance of Hawaii’s Innovation Indicators. The innovation indicators were developed and first reported in December 2008, in order to track Hawaii’s progress in utilizing innovation and technology to diversify its economy and provide a higher proportion of high-skilled, high-wage jobs. The 2008 report describes in detail the innovation process and how each of the indicators chosen for Hawaii is important in helps monitoring that process. That report can be accessed at http://hawaii.gov/dbedt/innovation/innovation-indicators. This report focuses on the first update of those indicators. It also incorporates revisions in data and any change of specific indicators due to program decisions by data source providers. During preparation of the initial report it was found that data for many important indicators are released late in the year. Consequently, this and subsequent update reports hereafter will be targeted for January of each year. This system of indicators has drawn from many efforts to construct relevant measures of the innovation progress in both Hawaii and across the nation. Through those efforts has emerged a view of how innovation works and how it might be measured. While the innovation process has been explained and broken down in many ways, it can be seen as having three fundamental components that represent phases in a successful innovation process.
• First there must be the capacity for innovation, which then leads to; • A thriving innovation sector and supporting assets, prompting; • Economic transformation and a strong, prosperous and sustainable economy.
The important feature of this innovation process is that the components are sequential. That is, before a prosperous efficient and sustainable economy can emerge, there must be a well-developed and thriving innovation sector to drive that overall prosperity. But to have that thriving innovation sector, there first must be the capacity to develop a highly skilled workforce and generate the ideas, research and development such a sector needs. Summary of Indicators The indicators presented in this report have been structured under these three components of the innovation process. The table below provides a snapshot of the indicators and changes in the measures and trends since the 2008 report. The performance level and trend for each indicator are represented. Performance and trend for both the 2008 report and this update are presented, in order to more easily see changes. Green symbols mean that the performance level exceeds the national benchmark or that the recent trend is positive. Red symbols are used for performance below the national level or if the most recent trend data show deterioration. Amber symbols indicate performance near the national benchmark or a flat recent trend. The introductory sections for each indicator should be consulted for more complete interpretation of current status and trends.

Innovation Indicators P a g e | 5
Department of Business, Economic Development & Tourism January 2010
Summary of Indicators
Performance/Trends
2008 Report (as revised)
Performance/Trends 2010 Report
INDICATOR Hawaii U.S.
Performance1 (compared with
nation)
Latest Trend1 (improving or worsening)
Performance1 (compared with
nation)
Latest Trend1 (improving or worsening)
Capacity for Innovation Education
H.S. grad. rate (2006) 75.5% 73.4% 0 ↑ + ↑
H.S. dropout rate (2006) 4.7% 3.8% − ↑ − ↔
College Readiness (2009, Ave. SAT score) 981 1016 − ↓ − ↓ College going rate of H.S. grads (2006) 59.8% 61.6% − ↑ − ↑
Freshman retention 4 yr colleges (2007) 68.1% 75.5% − ↓ − ↑
Freshman retention 2 yr colleges (2007) 51.4% 53.0% − ↑ − ↔
Percent of High school graduates ultimately earning a:
4 yr college degree (2006) 43.7% 56.4% − ↓ − ↑
2 yr college degree (2006) 19.4% 29.1% + ↓ − ↓
Entrepreneur training* (2008) 0.37% na na ↑ na ↑ Education attainment ‐% coll. degrees (2007) 39.11% 34.93% + ↑ + ↔
Research & Development R&D spending in public sector‐ $ per $1000 GDP (2005) $5.95 $6.63 + ↑ − ↓
R&D spending in private sector‐ $ per $1000 GDP (2005) $2.90 $16.81 − ↓ − ↑
Patents issued per 1,000 workers (2007) 0.13 0.61 − ↑ − ↓
Capital Availability Venture capital investments per $1,000 GDP (2008) $0.11 $2.01 − ↓ − ↑
Innovation Research Grants per $1,000 GDP (2008) $0.12 $0.13 0 ↔ 0 ↔
Tech Transfer Grants per $10,000 GDP (2008) $0.001 $0.017 + ↔ − ↓
Workforce Development% College degrees in Sci & Tech (2007) 18.43% na na ↓ na ↑ Life‐long learning ‐% of 25‐49 yr olds. (2007) 5.2% 5.6% + ↑ − ↓
Worker recruitment H‐1B Visas per 1,000 workers (2008) 1.41 2.68 − ↓ − ↓

6 | P a g e Innovation Indicators
Department of Business, Economic Development & Tourism January 2010
Performance/Trends
2008 Report (as revised)
Performance/Trends 2010 Report
INDICATOR Hawaii U.S.
Performance1 (compared with
nation)
Latest Trend1 (improving or worsening)
Performance1 (compared with
nation)
Latest Trend1 (improving or worsening)
Infrastructure Connectivity – Megabits per second download speed (2009) 2.97 5.07 ‐ ‐ − ↑
Innovation Sector & Support Assets Technology sector
% jobs in tech sector (2008) 3.0% 5.1% − ↔ − ↑
% Growth in tech jobs (2002‐2008) 17.9% 12.4% − ↑ + ↑
% jobs in R&D (2008) 0.45% 0.38% − ↑ + ↑ % growth in R&D jobs (2002‐2008) 22.8% 16.4% + ↑ + ↑
Creative sector % jobs in creative sector 5.55% 6.27% − ↓ − ↑
Highly Trained Technical Workforce % of workforce in STEM occupations (2008) 7.10% 8.57% − ↓ − ↓
Average earnings in STEM occupations (2007) $51,200 $64,389 − ↓ − ↑
Technology Diffusion STEM occupations in non Tech Industry (2008) 5.57% 5.91% − ↑ − ↑
Entrepreneurial Activity
Startup companies per 1,000 workers (2008) 7.66 9.26 − ↑ − ↓
Economic Transformation Growth & Efficiency
Technology Contribution to Growth (2002‐2007) 41.2% 48.5% − ↔ − ↔
Labor productivity ‐ real GDP per worker (2008) $79,214 $79,272 0 ↑ 0 ↑
Diversification Diversification ‐% alignment with U.S. (2007) 87.2% na na ↔ na ↔ Global Integration ‐merch exports per $1,000 GDP (2006) $4.68 $78.60 − ↑ − ↑
High Wage Jobs Jobs above $50K (2007) 16.9% 17.4% 0 ↓ − ↓

Innovation Indicators P a g e | 7
Department of Business, Economic Development & Tourism January 2010
Performance/Trends
2008 Report (as revised)
Performance/Trends 2010 Report
INDICATOR Hawaii U.S.
Performance1 (compared with
nation)
Latest Trend1 (improving or worsening)
Performance1 (compared with
nation)
Latest Trend1 (improving or worsening)
Median Income
Median family Income (2007) $71,784 $60,374 + ↑ + ↑ Median household income (2007) $64,022 $50,233 + ↑ + ↑
Energy Efficiency
Energy efficiency ‐ mil. BTUs used per $1,000 GDP (2007) 6.89 8.87 + ↑ + ↓
1+: above nation. −: below nation. 0: same as nation. ↑: improving. ↓: worsening. ↔: no change.
*Percent of class registrations in entrepreneurial program classes, Kapiolani CC.
Conclusions: Capacity for technology and innovation: Between the base report in 2008 and the most recent update, Hawaii remains behind in meeting national benchmarks for most indicators. The period covered by the new indicators show that the U.S. improved in a number of areas faster than Hawaii resulting in fewer plus signs and more minus signs in the Capacity category. On the other hand, there were slightly more indicators that were showing a positive trend the Capacity category than in the last report. Thus while stronger performance nationally in many indicators affected comparative performance, Hawaii was showing some improvement overall in turning more trends positive.
Innovation Sector and Support Assets: Hawaii is still behind the U.S. in most innovation sector indicators with respect to performance but the situation improved between the two reports. Overall, more innovation sector asset indicators showed improvement in both performance and trends between the original and update reports. Particularly due to stronger performance in technology, the innovation sector showed more indicators positive for comparative performance and for improved trend.
Economic Transformation: The performance and trends in the economic transformation category showed little or no change in either performance comparison or trends between the two reports. Hawaii continues to do comparatively better and trends are positive in family/household income, and labor productivity. Performance and trends are still lagging in jobs above $50,000. In the latest report energy efficiency dropped slightly (BTUs used per GDP rose). However, efficiency had been making slow progress in the preceding four years, so this slight uptick is not troubling. Of more concern is that the rate of improving energy efficiency is slower than the national level, which has been making very consistent progress since the early 1990s.

8 | P a g e Innovation Indicators
Department of Business, Economic Development & Tourism January 2010
II. Innovation and Hawaii’s Economy
Innovation Innovation is the process whereby new ideas and new approaches are conceived and introduced into the economy, resulting in new or substantially improved products and services. The concept of innovation as a driver of economic activity has been rooted in economic growth theory for several decades. Research has shown that most economic growth in the U.S. has been the result of the application of technology and innovation to the economy.
Hawaii faces a number of challenges if it is to compete effectively in the more global and technology-driven economy of the 21st century. The State’s ability to maintain a prosperous economy and to preserve its quality of life depends on transforming the economy through innovation to compete in the new global economy. Innovation promotes economic diversification by creating higher paying jobs in knowledge intensive firms. But it is not just new industries that benefit from innovation. Traditional and even sun-setting industries can increase their productivity and find new markets for their core competencies though innovation. The overall result of effective innovation is an increased standard of living and a more competitive economy. The system of indicators presented in this report draws from many efforts to construct relevant measures of innovation progress in both Hawaii and across the nation. Through those efforts has emerged a view of how innovation works and how it might be measured. While the process has been explained and broken down in many ways, the innovation process can be seen as having three fundamental components that represent phases in a successful innovation process.
• First there must be the capacity for innovation, which then leads to, • A thriving innovation sector and supporting assets, prompting, • Economic transformation and a strong, prosperous and sustainable economy.
The important feature of this innovation process is that the components are sequential. That is, before a prosperous efficient and sustainable economy can emerge, there must be a well-developed and thriving innovation sector to drive that overall prosperity. But to have that thriving innovation sector, there first must be the capacity to develop a highly skilled workforce and generate the ideas, research and development such a sector needs.
Measuring & Tracking Innovation The system of indicators presented in this report draws from many efforts to construct relevant measures of innovation progress in both Hawaii and across the nation. Among the Hawaii efforts have been the Hawaii Pathways to Advancement project in 2005, sponsored by the National Governors Association (NGA), reports by the Hawaii Institute for Public Affairs (HIPA) and work by such groups as Enterprise Honolulu, the economic development boards of Hawaii, Maui and Kauai Counties, the Hawaii 2050 Task Force, Hawaii Science and Technology Council, and the Workforce Development Council. National efforts include the New Economy Index published by the NGA, work by the Milken Institute, a number of state efforts, and work to identify an innovation framework by the U.S. Council on Competitiveness.

Innovation Indicators P a g e | 9
Department of Business, Economic Development & Tourism January 2010
Through this body of work and effort has emerged a view of how innovation works and how it might be measured. While the process has been explained and broken down in many ways, innovation as an economic driver can be seen as having three fundamental components. Those components and their key elements are shown in Figure 1.
Figure 1
The first component is the capacity to innovate. This requires a well performing educational system that brings out the full educational potential of individuals, including the building of strong skills in science, technology, engineering and math, referred to as STEM skills. Basic capacity also includes well-supported research and development efforts, in the university system and in the private sector. Capital availability is a critical input if innovation is to be commercialized, as well as the development of workforce skills that can help translate innovation capacity into leading edge products and services. Finally, innovation capacity must include the infrastructure needed to support a digital economy. The result or output of effective innovation capacity leads to the second component of the process – a thriving innovation sector and key support assets in the economy. This sector and support assets commercialize creativity. They consist of firms developing and applying various forms of creativity and
Research & Development Activity
Creative Sector
Diversification
Productivity Growth
The Innovation Process
Innovation Capacity Innovation Sector &
AssetsEconomic Transformation
Educational Performance Technology Sector Innovation Contribution to
Growth
(Inputs) (Outputs) (Outcomes)
Energy Efficiency
Median Income
High Wage Jobs
Global IntegrationWorkforce Development Technology Diffusion
Entrepreneurial ActivityInfrastructure
Capital Availability Highly Trained Workforce

10 | P a g e Innovation Indicators
Department of Business, Economic Development & Tourism January 2010
technology, highly trained occupations and entrepreneurial activity. This component includes not only core technology development, but also the creative sector of the economy that fuses technology with arts and entertainment to produce such products as digital music, digital entertainment productions, animation and electronic games. Other key measures of this component include the proportion of high-skilled workers in the economy and entrepreneurial startup activity. The third component represents what we would expect to be the outcome of healthy innovation capacity and a thriving innovation sector. That outcome is economic transformation, resulting in a strong, prosperous and sustainable economy. Such an economy derives a high proportion of growth through the application of technology and innovation rather than simply adding more labor, or physical development. It has high productivity growth, increased trade and export activity, and an expanding global reach. It is also increasingly more efficient in the use of energy and most importantly, generates a rising level of household and family income based on a high proportion of jobs that pay a relatively high wages. The indicators that follow have been structured under these three components of the innovation process. Efforts have been made to select pivotal indicators along the continuum. For some of the indicators, data are not available to establish the metric at this time. However, because they relate to important underlying components of the innovation process, they are introduced with the expectation that data will become available in the future. For some components of the innovation process, better or more comprehensive indicators are needed and research is ongoing to locate those. These indicators are not set in stone. As data sources change and new components are identified for measurement, the mix of indicators will also evolve. Likewise, indicators that do not appear to be adequately representing critical real-world elements of innovation will need to be replaced. Most importantly, stakeholder review and input are an essential part of choosing, evaluating and adjusting indicators. DBEDT seeks continuous feedback on the structure and performance of the indicator set so that the best possible measures and data sources are used to track Hawaii’s innovation process.

Innovation Indicators P a g e | 11
Department of Business, Economic Development & Tourism January 2010
III. Innovation Indicators This section presents data and graphics for Hawaii’s Innovation Indicators as updated and revised. Due to the complex nature of compiling data such as graduation rates, R&D spending and others, the latest information is still often several years old. Also many factors can affect year-to-year changes in the data. For these reasons it is best to interpret the indicators on a long term basis (four of five years) which will tend to show the longer term trends. Therefore, where possible a number of years of data are provided so that the trends are more apparent. Generally, new data for this update has been highlighted in yellow for this report. In some cases replacement for indicators have been made as source agencies discontinue or make major revisions in data series. In order to streamline presentation of the information, detailed explanations of the nature and reasoning behind the indicators has not been included. Those discussions are contained in the base report on the innovation indicators, which can be reviewed at http://hawaii.gov/dbedt/innovation/innovation-indicators.
A. CAPACITY FOR INNOVATION
These indicators track the basic ingredients that provide capacity for innovation. The first is a well performing educational system that can generate a strong human resource base for innovation. The second is a robust research and development component focused on marketable innovations. Third is adequate access to capital. Fourth is the workforce development task of delivering skilled workers to the economy through post-secondary education, attracting them from outside the state, or retraining incumbent workers to give them cutting edge skills. Fifth is the infrastructure to support Innovation sector development. Without these key ingredients it is very difficult to develop a sustainable commercial technology-innovation sector in the economy.
12 | P a g e Innovation Indicators
Department of Business, Economic Development & Tourism January 2010
• The public high school graduation rate increased slightly in the latest report and remained ahead of the U.S. The high school dropout rate remained the same in the latest report but somewhat higher than the U.S. level. There has been criticism of the way these two statistics are calculated and an improved method is expected to be implemented over the next several years.
• In terms of college readiness, Hawaii SAT scores continued their slow decline in the latest report while the U.S. held steady. The larger proportion of students taking the SAT in Hawaii compared to nationally may be partially responsible for the U.S. Hawaii difference. College going rates for both Hawaii and the U.S. turned up sharply in the latest period (2006), although Hawaii is still slightly below the U.S. on this indicator.
• For college completion, no significant changes have occurred in the college freshmen retention rates for Hawaii and these remain below national rates. The rates at which high school graduates entered and graduated from college on time inched up slightly for four year institutions in 2006 but the community college associate degree rate declined. However, these two metrics are also problematic because they are not tracking individuals, only comparing numbers of graduates to earlier high school graduation numbers. More or less students attending college out of state or transferring in-state can affect these data. Efforts are being made to establish more reliable longitudinal data bases, that track individuals through education.
• Increasingly more students continue to enroll in Kapiolani Community College’s entrepreneurial program. The University of Hawaii has recently approved a bachelor’s degree for entrepreneurship at the Shidler Business School. Enrollment and eventually graduation data will be picked up from this program as it progresses.
• Finally, Educational attainment of Hawaii’s adult population remained relatively unchanged in the latest report but is still significantly higher than the U.S. as a whole.
1. Education Attainment & Progress through the Educational Pipeline

Innovation Indicators P a g e | 13
Department of Business, Economic Development & Tourism January 2010
Public high school graduation rate:
High School Dropout Rate:
Year Hawaii U.S.1991 75.90 73.701992 77.70 74.201993 74.90 73.801994 75.70 73.101995 74.80 71.801996 74.50 71.001997 69.10 71.301998 68.80 71.301999 67.50 71.102000 70.90 71.702001 68.30 71.702002 72.10 72.602003 71.30 73.902004 72.60 74.302005 75.10 74.702006 75.50 73.40
65
67
69
71
73
75
77
79
1991 1993 1995 1997 1999 2001 2003 2005
Source: U.S. Dept of Education, National Center for Education Statistics, 1998‐2006.
High School Graduation Rates
Hawaii
U.S.
Year Hawaii US1998 5.20 5.001999 5.30 4.802000 5.30 5.002001 4.50 4.042002 5.10 3.602003 4.70 3.902004 4.80 4.102005 4.70 3.902006 4.70 3.80 0.0
1.0
2.0
3.0
4.0
5.0
6.0
Source: U.S. Dept of Education, National Center for Education Statistics
High School Dropout Rates
Hawaii
US

14 | P a g e Innovation Indicators
Department of Business, Economic Development & Tourism January 2010
College Readiness
SAT Scores for College-Bound Seniors
College going of high school graduates:
Year Hawaii U.S.1999 995 10162000 1007 10192001 1001 10202002 1008 10202003 1002 10262004 1001 10262005 1006 10282006 996 10212007 990 10172008 983 10172009 981 1016
960970980990
10001010102010301040
1999 2000 2001 2002 2003 2004 2005 2006 2007 2008 2009
Source: The College Board, New York, NY, College‐Bound Seniors, 1999‐2009.
SAT Scores of College‐Bound Seniors
Hawaii
U.S.
Year Hawaii U.S.1992 56.1 54.31994 61.7 57.11996 62.0 58.51998 59.6 57.22000 59.8 56.72002 49.8 56.62004 51.6 55.72006 59.8 61.6
45
47
49
51
53
55
57
59
61
63
1992 1994 1996 1998 2000 2002 2004 2006
Source: National Center for Higher Education Management Systems, 1992‐2006.
Percent of High School Graduates Going Directly to College
Hawaii
U.S.

Innovation Indicators P a g e | 15
Department of Business, Economic Development & Tourism January 2010
College Completion Freshman retention rate:
Year Hawaii U.S.1995 76.9 74.21999 76.4 74.12001 72.6 74.12002 66.4 73.62004 72.2 76.52005 68.7 75.82006 67.3 75.02007 68.1 75.5 60
626466687072747678
1995 1999 2001 2002 2004 2005 2006 2007Source: National Center for Higher Education
Management Systems.
First‐Time 4‐year College Freshmen Returning for Their Second Year (%)
Hawaii U.S.
Year Hawaii U.S.1995 42.0 55.61999 40.2 55.12001 43.9 54.12002 45.0 54.82004 51.5 53.22005 50.8 53.32006 51.7 53.52007 51.4 53.0
30354045505560
1995 1999 2001 2002 2004 2005 2006 2007
Source: National Center for Higher Education Management Systems, 1992‐2004.
First‐Time 2‐year College Freshmen Returning for Their
Second Year (%)
HawaiiU.S.

16 | P a g e Innovation Indicators
Department of Business, Economic Development & Tourism January 2010
Bachelors & Associate Degrees Awarded:
Year Hawaii U.S.1997 40.0 47.51998 38.9 47.91999 41.5 46.52000 41.3 50.22001 39.6 48.92002 39.4 50.82003 44.1 51.82004 45.4 51.82005 43.1 52.12006 43.7 56.4
30
35
40
45
50
55
60
1997 1998 1999 2000 2001 2002 2003 2004 2005 2006
Source: National Center for Higher Education Management Systems, 1992‐2005.
Bachelor's Degrees Awarded Per 100 HS Graduates 6 Years Earlier (%)
Hawaii
U.S.
Year Hawaii U.S.1996 23.2 21.91997 24.9 22.71998 28.0 22.11999 24.9 21.62000 26.9 21.52001 24.9 21.12002 23.5 21.12003 28.9 22.42004 28.9 23.42005 26.3 24.12006 19.4 29.1
18.0
20.0
22.0
24.0
26.0
28.0
30.0
1996 1998 2000 2002 2004 2006
Source: National Center for Higher Education Management Systems, 1992‐2005.
Associate Degrees Awarded as a Percent of High School Graduates Three Years Earlier (%)
Hawaii
U.S.

Innovation Indicators P a g e | 17
Department of Business, Economic Development & Tourism January 2010
Entrepreneurial Training:
Educational attainment of the Adult Population:
YearTotal Student Registration
Entrepreneurial Course Registration
% of Total
2000 20,300 54 0.27%2001 21,004 54 0.26%2002 20,967 42 0.20%2003 21,783 61 0.28%2004 20,544 58 0.28%2005 20,577 68 0.33%2006 21,000 70 0.33%2007 21,297 75 0.35%2008 23,009 85 0.37%
Data for Fall Semseters
0.00%0.05%0.10%0.15%0.20%0.25%0.30%0.35%0.40%
2000 2002 2004 2006 2008
Source: Course Registration and Average Class Size Summary, Kapiolani Community College (Fall of each
year).
Percent of Student Registrations in Kapiolani Community College, Entrepreneurship
Certificate Courses
Hawaii
Year Hawaii U.S.2001 35.11% 32.12%2002 36.27% 32.69%2003 36.81% 33.52%2004 37.99% 34.12%2005 37.68% 34.57%2006 39.20% 34.38%2007 39.11% 34.93%
25%
30%
35%
40%
2001 2002 2003 2004 2005 2006 2007
Source: U.S. Census Bureau, American Community Survey, 2000‐2007.
Percent of Adults, 25 Years & Older, with Associate Degrees & Above
Hawaii
U.S.

18 | P a g e Innovation Indicators
Department of Business, Economic Development & Tourism January 2010
2. Research & Development Effort
• The rate of R&D spending as a proportion of GDP by universities and government slipped in the most recent year (2005) but the figure tends to be volatile from year to year. From 1999 to 2005 the rate generally has stayed in a relatively narrow range and has been comparable to U.S. rates.
• On the other hand private industry R&D as a proportion of GDP remains much smaller than the U.S. level, although it inched up in the 2005 survey.
• Patents per 1,000 workers remained very low in Hawaii compared to the U.S. level.

Innovation Indicators P a g e | 19
Department of Business, Economic Development & Tourism January 2010
Research and Development Funding University & Government R&D spending per $1,000 of GSP:
Private R&D spending per $1,000 of GSP:
Year Hawaii U.S.1999 6.00 6.562000 5.83 6.552001 6.06 7.472002 8.02 7.042003 6.54 7.262004 7.14 7.062005 5.95 6.63
$0$1$2$3$4$5$6$7$8$9
1999 2000 2001 2002 2003 2004 2005
Source: National Science Foundation, National Patterns of R&D Resources.
.
Government, University & Nonprofit Investment in R&D per $1,000 of GDP
Hawaii
U.S.
Year Hawaii U.S.1999 0.67 19.692000 1.04 20.072001 2.13 19.582002 2.34 17.532003 2.85 18.152004 2.61 17.262005 2.90 16.81
$0
$5
$10
$15
$20
$25
1999 2000 2001 2002 2003 2004 2005
Source: National Science Foundation, National Patterns of R&D Resources.
Private Industry Investment in R&D per $1,000 of GDP
Hawaii
U.S.

20 | P a g e Innovation Indicators
Department of Business, Economic Development & Tourism January 2010
Patents Issued:
3. Capital Availability
• Venture Capital Availability also remained low according to national data, although this may not be capturing the range of private investment into technology.
• The small business innovation research grant program continued to provide funding comparable to national rates, but the technology transfer grant program has remained low for several years.
Year Hawaii U.S.1995 0.14 0.491996 0.17 0.521997 0.15 0.511998 0.15 0.661999 0.16 0.682000 0.15 0.682001 0.17 0.692002 0.15 0.672003 0.16 0.672004 0.14 0.642005 0.09 0.552006 0.16 0.682007 0.13 0.61
0.0
0.1
0.2
0.3
0.4
0.5
0.6
0.7
0.8
1995 1997 1999 2001 2003 2005 2007
Source: U.S. Patent Office, Patent Counts by State and Year, 1977‐2007.
.
Patents Issued per 1,000 Workers
Hawaii
U.S.

Innovation Indicators P a g e | 21
Department of Business, Economic Development & Tourism January 2010
Venture Capital Investments:
Year Hawaii U.S.1996 $0.55 1.471997 $0.04 1.811998 $0.11 2.431999 $0.33 5.882000 $5.05 10.772001 $0.90 4.042002 $0.10 2.122003 $0.28 1.812004 $0.27 1.932005 $0.22 1.862006 $0.55 2.022007 $0.08 2.182008 $0.11 2.01
$0
$2
$4
$6
$8
$10
$12
1996 1998 2000 2002 2004 2006 2008
Source: PriceWaterhouseCoopers, Moneytree Venture Capital Profiles, 1996‐2007.
.
Venture capital invested per $1,000 of GDP
Hawaii
U.S.

22 | P a g e Innovation Indicators
Department of Business, Economic Development & Tourism January 2010
SBIR and STTR grant funds:
Year Hawaii U.S.1997 0.06 0.141998 0.07 0.121999 0.09 0.112000 0.12 0.112001 0.08 0.122002 0.08 0.142003 0.09 0.162004 0.19 0.172005 0.11 0.152006 0.14 0.142007 0.12 0.122008 0.12 0.13
$0.00
$0.05
$0.10
$0.15
$0.20
1997 1999 2001 2003 2005 2007
Source: U.S. Small Business Administration, The Small Business Economy, 1997‐2008.
Small Business Innovation Research (SBIR) grant dollars per $1,000 of GDP
Hawaii
U.S.
Year Hawaii U.S.2000 0.02 0.072001 0.02 0.062002 0.14 0.092003 0.00 0.092004 0.24 0.182005 0.00 0.182006 0.01 0.182007 0.02 0.182008 0.01 0.17
(Series revised back to 2005)
$0.00
$0.05
$0.10
$0.15
$0.20
$0.25
Source: U.S. Small Business Administration, The Small Business Economy, 2000‐2008.
Small Business Technology Transfer Program (STTR) grant dollars per $10,000
of GDP
Hawaii
U.S.

Innovation Indicators P a g e | 23
Department of Business, Economic Development & Tourism January 2010
4. Workforce Development
• The percent of UH Manoa students earning science and technology degrees has remained in a narrow range since at least the beginning of the decade.
• The data series for Lifelong learning has been revised by the source agency and now reflects ages up to 29. The revised data are available for only
certain years and show that most recently the enrollment rate for older residents is slightly lower than earlier in the decade. These rates tend to reflect economic conditions, and may have accelerated more recently with the economic decline.
• Hawaii continues to utilize the H-1B visa program for skilled foreign workers at about half the U.S. rate.
Degrees in Science and Technology
Life-long learning
Year
% of total
degreesNatural Sciences
Sch of Ocean, Earth Science & Tech
College of Enginrg
College of Trop Ag & Human Res
School of Med.
2000 18.44% 347 40 148 69 1232001 18.10% 286 42 132 91 1012002 19.08% 283 41 115 87 1332003 18.46% 307 45 150 59 2012004 19.41% 348 54 130 66 1512005 18.49% 358 64 144 75 1312006 18.27% 360 57 161 82 1442007 18.43% 375 56 133 106 125
0%
5%
10%
15%
20%
25%
2000 2001 2002 2003 2004 2005 2006 2007
Source: Degrees Earned by Level, Gender, Field of Study; University of Hawaii at Manoa.
Percent of Degrees Earned in Science & Technology Majors*, University of Hawaii at
Manoa
Hawaii
*:Including majors in Natural Sciences, School of Ocean, Earth Science & Tech, College of Engineering, School of Medicine, College of Tropical Agriculture and Human Resources (exculding Family and Consumer Science).

24 | P a g e Innovation Indicators
Department of Business, Economic Development & Tourism January 2010
Worker Recruitment
H-1B Visas:
Year Hawaii U.S.1991 6.2% 7.2%2001 7.3% 6.9%2007 5.2% 5.6%
4.55.05.56.06.57.07.5
1991 2001 2007Source: National Center for Higher Education
Management Systems.
Part‐Time Undergraduate Enrollment as a Percent of 25‐49 Year Olds (%), Hawaii & US
Hawaii
U.S.
Year Hawaii U.S.
1998 1.08 1.751999 1.01 2.172000 1.19 2.492001 1.07 2.672002 1.17 2.562003 1.23 2.462004 1.64 2.622005 1.80 2.732006 1.84 2.852007 1.64 3.022008 1.41 2.68
0.0
0.5
1.0
1.5
2.0
2.5
3.0
3.5
Source: U.S. Dept of Homeland Security, Yearbook of Immigration Statistics.
H‐1B Visas per 1,000 Workers
Hawaii
U.S.

Innovation Indicators P a g e | 25
Department of Business, Economic Development & Tourism January 2010
Infrastructure refers to the basic support assets, usually tangible, that allow commerce to be conducted. Roads, power lines, communications, water, waste disposal systems, and transportation systems are just a few examples of the economy’s infrastructure. For the innovation sector more specialized infrastructure such as broadband connectivity, conferencing and teleconferencing centers, technology incubator facilities, and specialized processing and testing facilities usually found in universities are a few examples. No single indicator can represent the scope of infrastructure capacities needed to support the innovation economy.
• A universally essential element in the digital age is broadband connectivity. The measure used has been adjusted by the source agency to reflect average rather than median internet speeds but still shows similar results. Hawaii speeds reported are just a little above half the U.S. speeds although both have been increasing over time.
Broadband Connectivity
2008 2009 increaseHawaii 2.60 2.97 14.24%U.S. 4.23 5.07 20.07%
0.0
2.0
4.0
6.0
2008 2009
Source: Communications Workers of America, Speed Matters, www.speedmatters.org
Average Broadband Internet Download Speed (megabits per second) Hawaii
U.S.
5. Infrastructure

26 | P a g e Innovation Indicators
Department of Business, Economic Development & Tourism January 2010
B. INNOVATION SECTOR AND SUPPORT ASSETS Strong innovation capacity should translate into an innovation sector and support assets that can help transform the economy. This includes competitive enterprises in the technology and creative sectors and such assets as the proportion of high-skilled occupations, diffusion of technology to other sectors of the economy and strong entrepreneurial activity.
1. Size and Growth of the Technology Sector
Hawaii’s technology sector has shown encouraging performance in recent years.
• The overall proportion of technology jobs in Hawaii remains well below the U.S. level, however this primarily reflects the absence of a technology manufacturing component in the state, which in turn reflects the comparative disadvantage Hawaii has in the manufacturing of goods. The proportion of technology jobs has remained relatively consistent in Hawaii and the U.S. in recent years; about 3.0% for Hawaii and 5.0% for the U.S.
• However, Hawaii’s technology sector has grown faster than the U.S. over that period
• The Research and Development component of technology in Hawaii has shown growth in both proportion and absolute numbers. In 2008 the R&D sector exceeded the national R&D industry proportion in the economy.
Technology Sector Growth and Proportion of Jobs
Year Hawaii U.S.2002 2.9% 4.9%2003 2.9% 4.8%2004 2.9% 4.8%2005 3.0% 4.9%2006 2.9% 4.8%2007 2.9% 5.0%2008 3.0% 5.1%
0%
1%
2%
3%
4%
5%
6%
2002 2003 2004 2005 2006 2007 2008
Source: DBEDT based on Hawaii Science & Technology Council, methodology
Percentage of Jobs in Private Technology Innovation Sectors among All Jobs
Hawaii
U.S.

Innovation Indicators P a g e | 27
Department of Business, Economic Development & Tourism January 2010
Research and Development Growth and Proportion of Jobs
Hawaii Pvt. Tech jobs 17.9%U.S. Pvt. Tech jobs 12.4%
2002‐2008
0%
5%
10%
15%
20%
Hawaii Pvt. Tech jobs U.S. Pvt. Tech jobs
Growth of Jobs in Private Technology Innovation Sector 2002‐2008
Year Hawaii U.S.2002 0.38% 0.36%2003 0.41% 0.36%2004 0.41% 0.36%2005 0.42% 0.37%2006 0.42% 0.38%2007 0.41% 0.37%2008 0.45% 0.38%
0.30%0.32%0.34%0.36%0.38%0.40%0.42%0.44%0.46%
2002 2003 2004 2005 2006 2007 2008
Source: DBEDT based on Hawaii Science & Technology Council methodology
Percentage of in R&D among All Jobs
Hawaii
U.S.

28 | P a g e Innovation Indicators
Department of Business, Economic Development & Tourism January 2010
2. Creative Sector The creative sector includes artistic and related technical activity resulting in artistic and entertainment products and services. These include not only live performances, but also digital products such as music, film, computer animation and computer gaming. Preliminary estimates of the creative sector have been developed by DBEDT
• While jobs grew in absolute numbers, the proportion of jobs in the economy accounted for by the creative sector declined slightly between 2005 and 2008. However, in 2008 that proportion rose slightly. At the national level the proportion has continued to increase.
Jobs in the Creative Sector
Hawaii Pvt. R&D jobs 22.8%U.S. Pvt. R&D jobs 16.4%
Source: DBEDT
2002‐2008
0%
5%
10%
15%
20%
25%
Hawaii Pvt. R&D jobs U.S. Pvt. R&D jobs
Growth of Jobs in Research & Development, 2002‐2008
Year Hawaii U.S. 2002 5.73% 5.96%2003 5.71% 5.92%2004 5.79% 5.98%2005 5.80% 6.05%2006 5.66% 6.13%2007 5.53% 6.16%2008 5.55% 6.27%
New Series for Creative Industries 5.00%
5.20%
5.40%
5.60%
5.80%
6.00%
6.20%
6.40%
2002 2003 2004 2005 2006 2007 2008
Source: DBEDT.
Jobs in Creative Industris as a Percentage of All Jobs
Hawaii
U.S.

Innovation Indicators P a g e | 29
Department of Business, Economic Development & Tourism January 2010
• The proportion of science, technology, engineering and math (STEM) occupations has generally been increasing over the years in the U.S. and
Hawaii although the percentage for Hawaii tends to fluctuate from year to year.
• Earnings in STEM occupations have increased steadily for both Hawaii and the U.S. in nominal terms (not corrected for inflation) but are significantly higher for the U.S.
Percentage of Stem Occupations in the Economy:
YEAR Hawaii U.S.2000 5.97% 8.01%2001 6.33% 8.05%2002 6.49% 8.01%2003 6.93% 8.10%2004 6.71% 8.26%2005 6.88% 8.26%2006 7.37% 8.34%2007 7.16% 8.44%2008 7.10% 8.57%
5.5%
6.0%
6.5%
7.0%
7.5%
8.0%
8.5%
9.0%
2000 2001 2002 2003 2004 2005 2006 2007 2008
Source: Bureau of Labor Statistics, May Occupational Employment and Wage Estimates. For occupations included, see Appendix B.
STEM Occupations as a Percentage of All Jobs
HawaiiU.S.
3. Highly Trained Technical Workforce

30 | P a g e Innovation Indicators
Department of Business, Economic Development & Tourism January 2010
Average Earnings in STEM Occupations:
• The proportion of STEM jobs outside the technology sector have increased proportionately in Hawaii while declining slightly nationally.
Proportion of STEM Occupations Outside the Technology Industry:
Year Hawaii U.S.
2000 $42,314 $50,589
2001 $45,305 $53,339
2002 $45,312 $53,990
2003 $42,478 $54,356
2004 $51,726 $57,626
2005 $52,288 $60,045
2006 $49,195 $60,614
2007 $51,200 $64,389
$25,000
$35,000
$45,000
$55,000
$65,000
$75,000
2000 2001 2002 2003 2004 2005 2006 2007
Source: U.S. Census Bureau, American Community Survey, 2000‐2007. For occupations included, see Appendix B.
Average Earnings in STEM Occupations
Hawaii
U.S.
Year Hawaii U.S.2002 5.43% 5.94%2003 5.49% 5.90%2004 5.50% 5.89%2005 5.50% 5.90%2006 5.54% 5.91%2007 5.56% 5.92%2008 5.57% 5.91%
5.1%
5.2%
5.3%
5.4%
5.5%
5.6%
5.7%
5.8%
5.9%
6.0%
2002 2003 2004 2005 2006 2007 2008
Source: Compile from data provided by EMSI, Economic Modeling Specialist, Inc
Proportion of Jobs Outside Technology That Are in STEM Occupations
Hawaii
U.S.
4. Technology Diffusion Beyond the Technology Sector

Innovation Indicators P a g e | 31
Department of Business, Economic Development & Tourism January 2010
5. Entrepreneurial Activity • Data for startup companies as a proportion of the workforce declined recently at both the Hawaii and U.S. levels. Over a longer period of time,
however, the metric has shown little change in Hawaii but has softened nationally.
Year Hawaii US1998 7.99 9.911999 7.86 9.842000 8.35 9.762001 8.39 9.412002 7.85 9.442003 8.08 9.142004 8.31 9.562005 8.43 9.832006 8.38 9.752007 8.67 9.702008 7.66 9.26(Series Revised 2009)
2.03.04.05.06.07.08.09.010.011.0
1998 2000 2002 2004 2006 2008
Source: U.S. Small Business Administration, The Small Business Economy; Bureau of Labor Statistics, Business Employment Dynamics.
Startup Companies per 1,000 Workers
Hawaii
US

32 | P a g e Innovation Indicators
Department of Business, Economic Development & Tourism January 2010
C. ECONOMIC TRANSFORMATION The ultimate purpose of fostering innovation capacity and assets is the overall prosperity and competitiveness it generates in Hawaii’s economy. A strong innovation sector and innovation assets should result in more sustainable growth by ensuring that growth in the economy is driven by technology and productivity rather than just more people and more physical development. As a result, the economy will tend to become naturally more diversified and reach out to global markets. Median incomes should reflect the impact of more knowledge-intensive activity as the number of jobs that pay sustainable wages increase as a share of the total. Importantly to Hawaii, innovation in energy production and use should make the State increasingly more energy efficient.
1. Growth & Efficiency
Proportion of STEM Occupations Outside the Technology Industry:
• The estimated proportion of economic growth in Hawaii due to innovation and the use of technology has tended to be lower than nationally, although recently the proportion nationally has dropped a bit. Hawaii’s proportion remains nearly the same as in the previous report.
Percent of Growth from Tech/InnovationHawaii U.S.
2002-2006 42.6% 56.8%2002-2007 41.2% 48.5%
0.0%
0.5%
1.0%
1.5%
2.0%
2.5%
3.0%
3.5%
4.0%
Hawaii U.S.
0.5% 0.8%
1.6% 0.8%
1.5%1.6%
Sources of GDP Growth, 2002‐2007(average annual growth)
Technology /Innovation
GDP=3.6%GDP=3.2%
Innovation Indicators P a g e | 33
Department of Business, Economic Development & Tourism January 2010
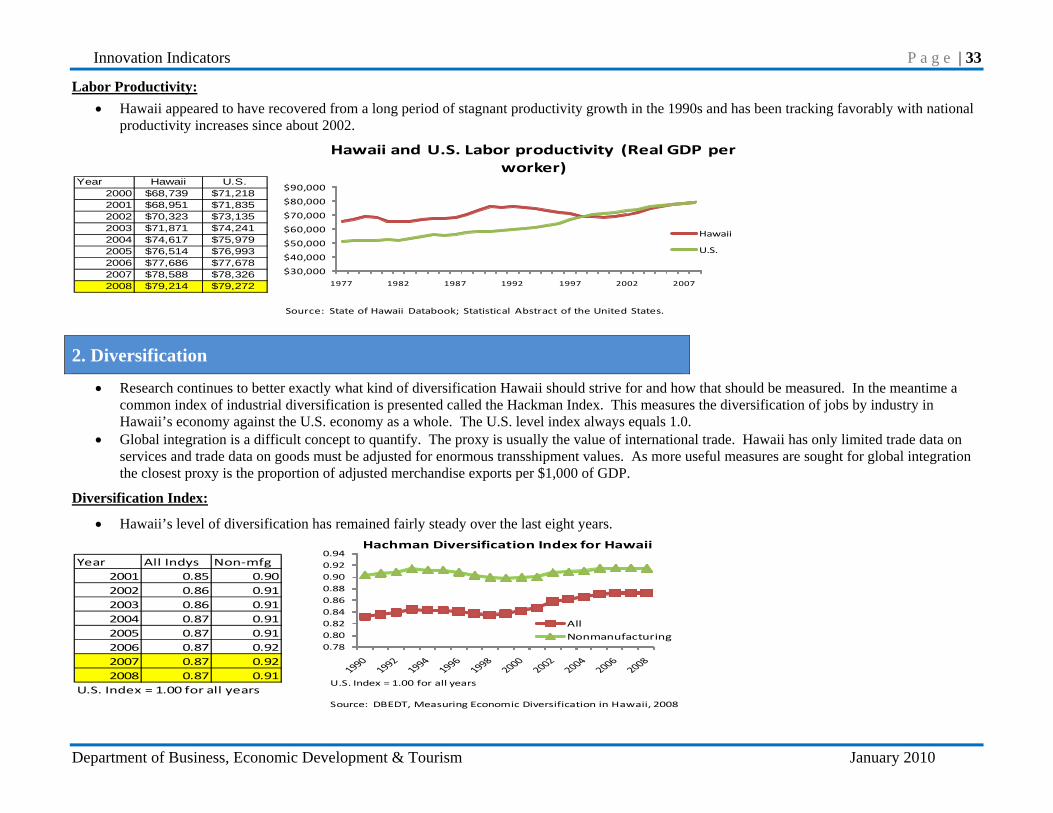
Labor Productivity: • Hawaii appeared to have recovered from a long period of stagnant productivity growth in the 1990s and has been tracking favorably with national
productivity increases since about 2002.
2. Diversification
• Research continues to better exactly what kind of diversification Hawaii should strive for and how that should be measured. In the meantime a common index of industrial diversification is presented called the Hackman Index. This measures the diversification of jobs by industry in Hawaii’s economy against the U.S. economy as a whole. The U.S. level index always equals 1.0.
• Global integration is a difficult concept to quantify. The proxy is usually the value of international trade. Hawaii has only limited trade data on services and trade data on goods must be adjusted for enormous transshipment values. As more useful measures are sought for global integration the closest proxy is the proportion of adjusted merchandise exports per $1,000 of GDP.
Diversification Index:
• Hawaii’s level of diversification has remained fairly steady over the last eight years.
Year Hawaii U.S.2000 $68,739 $71,2182001 $68,951 $71,8352002 $70,323 $73,1352003 $71,871 $74,2412004 $74,617 $75,9792005 $76,514 $76,9932006 $77,686 $77,6782007 $78,588 $78,3262008 $79,214 $79,272
$30,000
$40,000
$50,000
$60,000
$70,000
$80,000
$90,000
1977 1982 1987 1992 1997 2002 2007
Source: State of Hawaii Databook; Statistical Abstract of the United States.
Hawaii and U.S. Labor productivity (Real GDP per worker)
Hawaii
U.S.
Year All Indys Non‐mfg2001 0.85 0.902002 0.86 0.912003 0.86 0.912004 0.87 0.912005 0.87 0.912006 0.87 0.922007 0.87 0.922008 0.87 0.91
U.S. Index = 1.00 for all years
0.780.800.820.840.860.880.900.920.94
Hachman Diversification Index for Hawaii
AllNonmanufacturing
U.S. Index = 1.00 for all years
Source: DBEDT, Measuring Economic Diversification in Hawaii, 2008

34 | P a g e Innovation Indicators
Department of Business, Economic Development & Tourism January 2010
Global Integraion
• Since 2006 Hawaii’s merchandise foreign trade adjusted for transshipments, military and used equipment has increased. However it is about 7% the proportion that international merchandise trade represents nationally.
•
3. High Wage Jobs
• Both Hawaii and the U.S. have expreienced a slight decline in the proportion of workers earning $50, 00 or more (in constant 2006 dollars).
Hawaii U.S.2003 $4.52 $66.48 2004 $4.96 $70.47 2005 $4.41 $73.29 2006 $4.40 $79.23 2007 $5.13 $82.97 2008 $5.94 $90.15
Merchandise Exports per $1000
$0$10$20$30$40$50
$60$70$80$90
$100
2003 2004 2005 2006 2007 2008
Source: U.S. Department of Commerce, DBEDT adjustments..
Adjusted Foreign Merchandise Exports per $1000 of GDP
Hawaii
U.S.
Year Hawaii U.S.2001 15.68% 18.54%2002 17.56% 19.39%2003 18.70% 19.56%2004 18.91% 19.98%2005 18.52% 19.30%2006 18.12% 18.32%2007 16.86% 17.37%
12%
17%
22%
2001 2002 2003 2004 2005 2006 2007
Source: U.S. Census Bureau, American Community Survey, 2000‐2007.
Percentage of Workers Who Earned $50,000 or More
(constant 2006 U.S. dollars) Hawaii
U.S.

Innovation Indicators P a g e | 35
Department of Business, Economic Development & Tourism January 2010
4. Median Income
• Both family and household median income for Hawaii are above the national level. In recent years the increase in income has beenproportionally stronger in Hawaii.
Median Family Income:
Median Household Income:
Year Hawaii U.S.2002 58,703 51,7422003 60,647 52,2732004 63,813 53,6922005 66,472 55,8322006 70,277 58,5262007 71,784 60,374
$35,000
$45,000
$55,000
$65,000
$75,000
2002 2003 2004 2005 2006 2007Source: U.S. Census Bureau, American Community
Survey, 2000‐2007.
Median Family Income(constant 2007 US dollars)
Hawaii
U.S.
Year Hawaii U.S.2002 54,518 48,8782003 58,436 48,8352004 61,736 48,6652005 63,285 49,2022006 62,185 49,5682007 64,022 50,233
$35,000$45,000$55,000$65,000$75,000
2002 2003 2004 2005 2006 2007
Source: U.S. Census Bureau, American Community Survey, 2000‐2007.
Median Household Income(constant 2007 US dollars)
Hawaii
U.S.

36 | P a g e Innovation Indicators
Department of Business, Economic Development & Tourism January 2010
5. Energy Efficiency
• Hawaii has continues to be more efficient in the use of energy to generate economic output. However as pointed out in the last report, the U.S. as a whole is becoming measurably more efficient while Hawaii has not increased significantly in efficiency. These data are pre, Clean Energy Hawaii Initiative and reflect a fairly strong economy. Hawaii’s efficiency may increase as the effects of that initiative and a slower economy are felt.
Energy consumption – Million BTUs per $1,000 of real GDP
Year Hawaii U.S.1993 6.87 11.631994 7.38 11.391995 7.43 11.351996 7.16 11.311997 6.90 11.011998 7.04 10.571999 6.91 10.292000 6.94 10.142001 6.87 9.792002 7.11 9.822003 7.28 9.632004 7.25 9.472005 7.10 9.212006 6.82 8.902007 6.89 8.87
Source: U.S. EIA and BEA.
1.20
3.20
5.20
7.20
9.20
11.20
13.20
1993 1994 1995 1996 1997 1998 1999 2000 2001 2002 2003 2004 2005 2006 2007
Million BTU
1 British Thermal Units, a common measure of energy.Source: U.S. EIA and BEA., 1993‐2007
Energy Consumption Per $1,000 of GDPmIllion BTUs1
Hawaii
U.S.

Innovation Indicators P a g e | 37
Department of Business, Economic Development & Tourism January 2010
IV. Conclusions
Capacity for technology and innovation: Between the base report in 2008 and the most recent update, Hawaii remains behind in meeting national benchmarks for most indicators. The period covered by the new indicators show that the U.S. improved in a number of areas faster than Hawaii, resulting in fewer plus signs and more minus signs in the Capacity category. On the other hand, there were slightly more indicators that were showing a positive trend for the capacity category than in the last report. Thus, while stronger performance nationally in many indicators affected comparative performance, Hawaii was showing some improvement overall in turning more trends positive.
Innovation Sector and Support Assets: Hawaii is still behind the U.S. in most innovation sector indicators with respect to performance but the situation improved between the two reports. Overall, more innovation sector asset indicators showed improvement in both performance and trends between the original and update reports. Particularly due to stronger performance in technology, the innovation sector showed more indicators positive for comparative performance and for improved trend.
Economic Transformation: The performance and trends in the economic transition category showed little or no change in either performance comparison or trends between the two reports. Hawaii continues to do comparatively better and trends are positive in family/household income, and labor productivity. Performance and trends are still lagging in jobs above $50,000. In the latest report energy efficiency dropped slightly (BTU’s used per GDP rose). However, efficiency had been making slow progress in the preceding four years, so this slight uptick is not troubling. Of more concern is that the rate of improving energy efficiency is slower than the national level, which has been making very consistent progress since the early 1990s.