hawaii growth model proposal january 2007 (ms … · web viewgrowth model proposal january 19, 2007...
TRANSCRIPT

HAWAII DEPARTMENT OF EDUCATIONGROWTH MODEL PROPOSAL
JANUARY 19, 2007

TABLE OF CONTENTS
SECTION 1 – INTRODUCTION 1
SECTION 2 – OVERVIEW OF GROWTH MODEL PLAN 8
SECTION 3 – IMPLEMENTATION DETAILS OF THE GROWTH MODEL PLAN 10
SECTION 4 – CORE PRINCIPLES 28
SECTION 5 – FINAL WORDS 35
REFERENCES 36
APPENDIX A – THE JOINT CALIBRATION PROCEDURE A-1
APPENDIX B – POSTERIOR VARIANCE OF LINEAR MIXED MODEL A-7
i

HIGHLIGHTS
The following is a brief summary of the highlights of Hawaii’s growth model proposal.
Hawaii’s growth model includes all students not only those who missed the proficient cutscore.
Hawaii is aggressively and actively completing all requirements for a successful peer review.
Hawaii’s growth model includes all students who participate in the Hawaii State Assessment system, including those who take the Hawaii State Assessment (HSA), the Hawaii State Alternate Assessment (HSAA), and the Hawaiian Aligned Portfolio Assessment (HAPA).
Hawaii’s growth model does not use confidence intervals.
Hawaii’s growth model relies on a piecewise linear regression in order to ensure that schools are not unfairly credited or punished for strong or weak gains that occurred in lower grade level schools.
Hawaii has established growth targets three years from a student’s current grade in 2007 and these targets remain fixed until the student reaches that grade. This avoids “rolling” a student’s target standard which would allow for students to never actually reach proficiency.
Hawaii has created a method for including grade 3 students when making all accountability decisions.
ii

RESPONSES TO US DEPARTMENT OF EDUCATION REQUESTS FOR CLARIFICATION
In December 2006, the United States Department of Education requested the Hawaii Department of Education to provide additional information on Hawaii’s growth model proposal. The requested information is listed below. Answers and / or references to sections of the proposal are provided in boxes below each request item.
Principle 1. Universal proficiency Has the State proposed technically and educationally sound criteria for “growth
targets” for schools and subgroups? (Principle 1.2) What are the State’s growth targets relative to the goal of 100 percent of students
proficient by 2013-14? (Principle 1.2.1.)o Please provide additional detail regarding how students at the proficient level
and above are included in the growth model calculations, including how the growth of proficient and above students will be included in school determinations.
All students—including those above and below the proficient cut points—are included in the growth calculations. This can occur even for students scoring at or above proficient in their current grade because our growth model estimates the probability that a student will reach a future target standard conditional on their prior levels of achievement.
The Hawaii model includes all students in growth calculations irrespective of their starting point. Hence, our model captures all information for all students and not only those scoring below proficient in their current grade. The model includes all students who take part in the Hawaii Assessment system – including those who participate in the Hawaii State Assessment, students with disabilities who take the Hawaii State Alternate Assessment, and students and students in Hawaiian Immersion Programs who take the Hawaiian Aligned Portfolio Assessment. Thus, all students participating in the Hawaii Assessment system are included in the growth model.
Principle 2. Establishing appropriate growth targets at the student level Has the State proposed a technically and educationally sound method of depicting
annual student growth in relation to growth targets? (Principle 2.1) Has the State adequately described a sound method of determining student
growth over time? (Principle 2.1.1.)o Please clarify how the growth model’s use of piecewise linear regression will
account for varying levels of growth in elementary and middle schools, as noted on page 16 of the proposal. Will the model be moderated by individual school characteristics?
iii

It would be unfair to credit middle schools for high levels of growth that occurred at the elementary school level. Therefore, we will estimate a piecewise linear regression allowing us to compare growth rates that occurred under two distinct educational periods: elementary school and middle school. This is done to ensure that we can hold schools accountable for the instruction that occurs within their control and do not receive benefits or punishments from a student who experienced a large or small elementary growth rate. The model is not moderated by other individual school characteristics.
o Please clarify the methodology for the growth model projections, specifically the information that will be taken into account. Does the model create any situations where two students with the same
reading score in year 1 will have different growth expectations in year 2?
All students are held accountable for reaching the same standard, but the rate at which a student must grow may differ between students. Additionally, growth projections are made for all students with at least two test scores.
Please clarify whether the model will be based upon a student’s prior test scores or whether it will be based upon a trajectory of similar students.
The growth model is based on each student’s prior test scores.
Please clarify whether different growth curves will be generated for students from different classrooms or different schools.
Individual growth projections are made for every individual student regardless of that student’s school or classroom.
Please clarify what variables will be used to calculate the regression for the growth model.
The only variables used to calculate the regression are the student’s prior test scores.
Please clarify how instances of missing data will be resolved.
Missing data is easily handled within the framework of mixed linear models as proposed. Growth rates can still be obtained for individual students, even when those students have a fractured time-series. The Hawaii model does not impute missing data, nor is there a need to do so.
Principle 4. Inclusion of all students Does the state’s growth model address the inclusion of all students, subgroups, and
schools appropriately? (Principle 4.1)
iv
Does the state’s growth model address the inclusion of all students appropriately? (Principle 4.1.1.)o Please clarify how the growth model will factor in students who have
missing data or are unmatched.
Missing data is easily handled within the framework of mixed linear models as proposed. Growth rates can still be obtained for individual students, even when those students have a fractured time-series. The Hawaii model does not impute missing data, nor is there a need to do so.
o Please clarify how the growth model will account for students who move from one assessment to another, such as from the HSA to the HAPA.
If students move from one assessment to another, such as from the Hawaii State Assessment to the Hawaiian Alignment, Hawaii will use the model most appropriate for the most recent assessment.
Principle 5. State assessment system and methodology Does the statewide assessment system produce comparable information on each
student as he/she moves from one grade level to the next? (Principle 5.3) How has the state determined that the cut-scores that define the various
achievement levels have been aligned across the grade levels? What procedures were used and what were the results? (Principle 5.3.3.)o Please provide an updated description regarding how the various
achievement levels have been aligned across grade levels that reflects Hawaii’s planned implementation of HCPS III.
The Hawaii Department of Education intends to identify four levels of student achievement: Well-Below Proficiency, Approaches Proficiency, Meets Proficiency and Exceeds Proficiency. Three performance standards (cut scores) are needed to distinguish these four levels of achievement. Moreover, because student progress from grade to grade is a major focus of the testing system, these cut scores and the levels of performance they represent must be meaningful from grade to grade. That is, at the same rate of progress, it should not be expected that students who exceed proficiency in the current year would become well-below proficiency in the next year. It would be difficult to interpret results in which large numbers of students show dramatic changes in performance levels when their progress is consistent with teacher and program expectations.
Specifically, the State will be setting new performance standards in February 2007 using the Bookmark method to establish the four performance levels. With these recommended cut scores, panelists review the impact data and will conduct a vertical articulation procedure using the methods of Ferrara, Johnson, & Chen (2005) to ensure consistency in the achievement levels across the grades. In other words, the goal of the articulation process is to ensure that the performance categories have been aligned across grades.
v

Is the Statewide assessment system stable in its design? (Principle 5.4) What changes in the statewide assessment system’s overall design does the
State anticipate for the next two years with regard to grades assessed, content assessed, assessment instruments, scoring procedures, and achievement level cut-scores? (Principle 5.4.2)
No changes in the statewide assessment system are planned.
o Please clarify how the change from the HCPS II academic content standards in 2005-06 to the HCPS III academic content standards in 2006-07 will be incorporated into the growth calculations.
Our equating process uses common items from prior test administrations. Hence, although there is a change from HCPS II to the HCPS III, we are able to retain the prior scale and equate new forms of the test. Consequently, there is no disruption to the scale and this change to a new test form does not impact the growth estimates.
o Please address how Hawaii’s assessment system may change beyond the next year and any adjustments expected in the growth model.
No changes in the statewide assessment system are planned.
Principle 6. Tracking student progress Has the State designed and implemented a technically and educationally sound
system for accurately matching student data from one year to the next? (Principle 6.1) What quality assurance procedures are used to maintain accuracy of the student
matching system? (Principle 6.1.3)o Provide additional information regarding quality assurance procedures used
to maintain the accuracy of the student matching system.
Four important elements of the student tracking quality assurance system help to ensure accuracy in identifying and matching students over multiple school years.
Student Identifier. Students are issued unique student identification numbers (IDs) on a statewide basis and managed centrally by the SEA/LEA. Schools enrolling a new student are required to check a statewide database to verify whether a student is entirely new to Hawaii’s public school system or has been previously enrolled. If necessary, schools can also contact the Help Desk staffed by information specialists who have access to the statewide student information system.
Matching Procedure. This procedure allows for multi-field checks on student records if the student ID on test booklets have school level input errors or scanning problems encountered by the test vendor. If for example, matches are not successful on the primary field, Student_ID, then follow up checks are made on LastName, FirstName, MI,
vi

and Birthdate. If necessary, the entire record could be checked to determine if in addition to an ID scanning problem, a student has changed his or her surname or used a different variation of the name (e.g., Pat, Patrick, Patricia, Patty, etc.).
Data File Verification. The student assessment data file involves multi-level check points. The Student Assessment Section initially performs routine checks on the original data file received by the testing contractor. This assessment data file is subsequently forwarded to the System Evaluation and Reporting Section to prepare the file for accountability analyses and reporting. Legitimate duplicate student IDs due to transfers between schools are resolved based on a systematic accounting of transfer records and a decision-tree matrix so both reading and math scores are independently attributed to the appropriate school(s). After the System Evaluation and Reporting Section completes extensive quality review checks and filtering to produce an accountability data file, an independent data processing contractor responsible for producing AYP results and sanction statuses performs an independent validation of record keeping corrections prior to processing the accountability data file for AYP.
Continuous Improvement. Ongoing improvement efforts constitute an important ingredient in quality assurance. Several recent initiatives and changes in school record keeping procedures have helped to promote quality data and expand access to end users. A “Data Quality Improvement” project was launched in 2005 in part to address specific quality control needs driven by federal and state mandated accountability reporting. This initiative involved all levels of personnel, including school administrators, registrars, information specialists, program managers, complex area superintendents, and testing and evaluation specialists. The Student Information System is currently undergoing a phased-in migration from Chancery’s MacSchool/WinSchool program to Administrative Assistants, Ltd.’s (ALL) eSIS programto expand functionality and improve record keeping accuracy. Work is underway also to build a statewide data warehouse that will extend the current financial reporting capability to include student and personnel information. Finally, recent innovations and tools developed to allow school officials and program managers access to secure websites such as ARCHdb (Accountability Resource Center Hawaii - database) enable double checking down to the individual student record level before AYP processing as well as after AYP determinations are finalized following the appeal window.
What studies have been conducted to demonstrate the percentage of students who can be “matched” between two academic years? Three years or more? (Principle 6.1.4)o Please provide additional evidence of the match rates, to the extent possible,
by subgroup and across more than two years.
vii

The following provides the match rates from 2004 to 2006 by subgroup and grade.
Three Year Matching Calculations 2004 to 2006
All Students
BaseYearGrowth Year Base Grade
Growth Grade All Students Matching
2006 2004 5 3 86%2006 2004 7 5 87%2006 2004 10 8 81%
85%Disadvantaged
BaseYearGrowth Year Base Grade
Growth Grade
Disadvantaged Matching
2006 2004 5 3 88%2006 2004 7 5 86%2006 2004 10 8 81%
86%Native American
BaseYear GrowthYear Base GradeGrowth Grade
Native American Matching
2006 2004 5 3 69%2006 2004 7 5 69%2006 2004 10 8 70%
69%Asian Pacific Islander
BaseYearGrowth Year Base Grade
Growth Grade API Matching
2006 2004 5 3 91%2006 2004 7 5 90%2006 2004 10 8 84%
88%Black
BaseYearGrowth Year Base Grade
Growth Grade Black Matching
2006 2004 5 3 60%2006 2004 7 5 61%2006 2004 10 8 57%
60%
viii

Hispanic
BaseYearGrowth Year Base Grade
Growth Grade Hispanic Matching
2006 2004 5 3 71%2006 2004 7 5 77%2006 2004 10 8 68%
72%White
BaseYearGrowth Year Base Grade
Growth Grade White Matching
2006 2004 5 3 72%2006 2004 7 5 76%2006 2004 10 8 70%
73%Limited English
Proficient
BaseYearGrowth Year Base Grade
Growth Grade LEP Matching
2006 2004 5 3 68%2006 2004 7 5 62%2006 2004 10 8 52%
61%Special Education
BaseYearGrowth Year Base Grade
Growth Grade SPED Matching
2006 2004 5 3 89%2006 2004 7 5 89%2006 2004 10 8 81%
86%
How does the proposed State growth accountability model adjust for student data that are missing because of the inability to match a student across time or because a student moves out of a school, district, or the State before completing the testing sequence? (Principle 6.1.6)o Please clarify the minimum amount of information needed to make a
proficiency projection.
Growth projections are made for all students with at least two test scores.
ix

Section 1 -- IntroductionIn November 2005, the U.S. Department of Education invited States to participate in a pilot project whereby growth models would determine whether schools made adequate yearly progress (AYP) under ESEA, Title I, Part A. It was announced that up to 10 States may participate in the pilot.
The Hawaii Department of Education is pleased to present this proposal to incorporate a growth model into Hawaii’s current accountability system for public schools beginning with the 2006–07 school year. Hawaii remains committed to universal proficiency by the 2013–14 school year, and the incorporation of our growth model will improve our ability to target resources to achieve that goal.
Five factors converge to place Hawaii in a unique position to effectively implement a growth model and integrate it with our existing accountability system:
Among the 50 states, Hawaii has a long, if not the longest history of statewide, unique student identifiers, and our experience tracking individual students extends back to the 1970s.
We have tested all students with criterion-referenced tests in grades 3–8 and 10 in both reading and mathematics since 2004–05.
We have recently engaged the American Institutes for Research (AIR) to implement our testing system, bringing some of the nation’s leading experts in psychometrics, statistics, and student growth models and ensuring the technical quality of our vertical scales and growth models.
Our superintendent and school board are publicly and ideologically committed to standards-driven reform and have demonstrated this commitment through their allocation of resources.
Hawaii is aggressively completing all aspects necessary for a successful peer review for its entire statewide assessment program. We have developed a strategic plan that details when all studies will be completed during the 2006-2007 school year in order to meet all requirements of the letter sent to Hawaii from the U.S. Department of Education on June 29, 2006.
Background on accountability in HawaiiThis section of the proposal provides background on the current accountability system in Hawaii to provide context. Details of the growth model and its implementation in the accountability system are provided in subsequent sections. The Hawaii public school system is a single, unified, statewide K–12 system of schools headed by the State Superintendent and the State Board of Education. The state accountability system produces AYP decisions for all public schools, including public schools with variant grade configurations (e.g., K–8 and K–12 schools), public schools that serve special populations, and public charter schools. Both Title I and non-Title I schools are subject to the specific sanctions required by Section 1116 of the NCLB law.
1

All public schools and the LEA/SEA are systematically judged on the basis of the same criteria when making AYP determinations, and all schools are expected to attain annual progress resulting in proficiency among 100 percent of students in reading and mathematics by 2013–14.
The State’s AYP decisions are based primarily on the Hawaii Content and Performance Standards (HCPS) III State Assessment in reading and mathematics currently administered in grades 3 to 8 inclusive as well as grade 10. Assessment results are pooled across grade levels within a school. Of the 37 criteria used to determine AYP, all but one — the additional academic indicator (i.e., graduation rate for high schools, retention rate for elementary and intermediate or middle schools) — are based on the state assessment.
There are a total of 18 measures for reading:
Nine measures corresponding to the percentage of students proficient (all students and eight required subgroups: economically disadvantaged, five major ethnic and racial groups, students with disabilities, and limited English proficient students) and
Nine additional measures for the percentage of students participating in the reading assessment, with a minimum of 95 percent required, for all students and each of the eight required subgroups.
Similarly, 18 measures for mathematics are used in determining AYP.
All students enrolled at the time of testing are expected to participate in the Hawaii State Assessment System which includes the Hawaii State Assessment (HSA), the Hawaii State Alternate Assessment (HSAA), and the Hawaii Aligned Portfolio Assessment (HSAA) for students in grades 3 and 4 in Hawaiian Immersion schools and programs. Makeup sessions are given for students absent from school on scheduled testing dates. Assessment results from all three assessments noted above are included in the school and LEA/SEA determination of AYP. Although students with disabilities and limited English proficient students may receive certain testing accommodations, no students are exempted from the assessment or accountability systems.
The State’s timeline for AYP ensures that all students will meet or exceed the State’s proficient level of academic achievement (i.e., Meets Proficiency or Exceeds Proficiency) in reading and mathematics no later than 2013–14.
Starting points, intermediate goals, and annual measurable objectives were set separately for reading and mathematics. Hawaii’s definition of adequate yearly progress results in all students meeting or exceeding the proficient level of academic achievement in reading and mathematics no later than 2013–14. The current AMOs for the State’s status model are provided in Tables 1 and 2.
2

Table 1:Reading, Percent of Students Proficient (grades 3 to 8 inclusive as well as grade 10)
Year2001-
022002-
032003-
042004-
052005-
062006-
072007-
082008-
092009-
102010-
112011-
122012-
132013-
14
Baseline 30
Inter. Goal (30) 44 58 72 86 100
Annual Objective (30) 30 30 44 44 44 58 58 58 72 72 86 100
Table 2:Mathematics, Percent of Students Proficient (grades 3 to 8 inclusive as well as grade 10)
Year2001-
022002-
032003-
042004-
052005-
062006-
072007-
082008-
092009-
102010-
112011-
122012-
132013-
14
Baseline 10
Inter. Goal (10) 28 46 64 82 100
Annual Objective (10) 10 10 28 28 28 46 46 46 64 64 82 100
In determining whether each subgroup and school, as well as the LEA/SEA overall meets the annual measurable objectives under the State’s current model, Hawaii computes participation rates, calculates the percentage of students who achieve the proficient level or higher, implements a uniform averaging procedure, and employs the safe harbor provision.
Participation requirements — Schools in which at least 95 percent of the students enrolled at the time of the test take the state assessments will meet the AYP standard for participation in the state assessment. Schools in which less than 95 percent of students in any subgroup take the state assessment will not meet the AYP standard for assessment participation, provided the size of the subgroup meets the minimum number required for making inferences about participation (40 students). Participation requirements are applied separately for reading and mathematics. If a school or a subgroup, or both, does not meet the 95 percent requirement, then data from the previous year are used to average the participation rate data for the school or the subgroup, or both, as needed. If this two-year average does not meet the 95 percent requirement, then the Department will use data from the previous two years to average the participation rate data for a school or a subgroup, or both, as needed. If this three-year average does not meet the 95 percent requirement, then the school will not be deemed to have met this requirement.
Uniform averaging procedure — Averaging pertains to both grade levels and years.
3

- Grade levelsHawaii pools or combines the percent proficient across grades within a school and the LEA/SEA to determine AYP. The percent proficient is calculated on the basis of the number of tested students who were enrolled for a full academic year. AYP is determined separately for reading and mathematics.
- YearsIn addition, Hawaii averages the most recent two years of test scores (including the current year’s scores) and compares the results with the current year’s test scores. The highest percent proficient will be used to determine the school’s and the LEA’s/SEA’s AYP status. This approach rewards schools for efforts that result in strong single-year achievement gains and minimizes the potential for falsely inferring that a school or the LEA/SEA has failed to make AYP.
Safe harbor provision — If one or more subgroups within a school or the LEA/SEA, or if a school or the LEA/SEA as a whole, fail to meet the AMO proficiency objective, then the subgroup, school, or LEA/SEA still makes adequate yearly progress if both of the following conditions are met:
(a) The percentage of students in the subgroup, the school, or the LEA/SEA who are not proficient decreases (improves) by at least 10 percent over one year (e.g., from spring 2005 to spring 2006), by at least 19 percent over two years (e.g., from spring 2004 to spring 2006), or by at least 27 percent over three years (e.g., from spring 2003 to spring 2006);
AND
(b) The students in that subgroup, that school, or the LEA/SEA meet the AMO for the other academic indicator (i.e., retention rate for elementary and middle/intermediate schools or graduation rate for high schools).
The method used for determining whether each student subgroup, public school, and the LEA/SEA make AYP is summarized below. The method is applied separately to reading and to mathematics. Data are pooled across all grade levels in the school or the LEA/SEA. The sequence of steps used in determining AYP is important.
4
1. Calculate the n-count for the subgroup (or aggregate group, i.e., school or LEA/SEA) and compare the value with the minimum n criterion of 40 for making inferences about student proficiency. If the n-count is smaller than the minimum n criterion for making inferences about student proficiency (40), then the subgroup is not used in determining AYP. Otherwise, continue to Step 2.Note: All subgroups at the school level, whether with an n-count too small to count toward AYP or not, are “rolled up” into the overall, aggregate school proficiency scores.
Note: For those few unique schools for which the total number of students enrolled in all the assessed grade levels is fewer than the minimum n-count, assessment data for the school are aggregated over two consecutive years or more, if necessary, to meet the minimum n-size requirement. If the minimum n-count requirement is not met in a given year even with multiyear aggregation of schoolwide data, then the AYP determination is still made by using the regular AYP model. In such cases, the reported AYP results will include a statement indicating that the results may be unreliable owing to the small number of students enrolled in the school available for analysis.
2. Compute the percentage of proficient students for the subgroup (or aggregate group, i.e., school or LEA/SEA) using the current year’s test scores and the average of the two most recent year’s scores (including the current year). If either or both computed percents proficient are equal to or greater than the established annual measurable objective, then AYP is met. Otherwise, AYP may not have been met, the final determination of which is subject to the “safe harbor provision” implemented in Step 3, and the standard error of the proportion computation outlined below.
3. If the subgroup (or aggregate group, i.e., school or LEA/SEA) did not meet AYP under Step 2, then the specific requirements of the safe harbor provision, as stipulated above, are invoked. If both conditions of the safe harbor provision are satisfied, then AYP for the proficiency of the subgroup is met. Otherwise, AYP is not met.
Note: In determining the percentage decrease in the percentage of students not proficient, data used for the computation from the preceding year(s) may not satisfy the minimum n-count requirements for making inferences about subgroup proficiency. In that situation, the safe harbor computation will still be made, but associated AYP results will include a statement indicating that the results may be unreliable owing to the small number of students available for analysis.
4. Calculate the assessment participation rate for the subgroup (or aggregate group, i.e., school or LEA/SEA) in accordance with the “participation requirements” stipulated above. Compare the participation rate calculated with the minimum n criterion of 40 for making inferences about student participation. If the n-count is smaller than the minimum n criterion for making inferences about
5

student participation (40), then the subgroup is not used in determining AYP for participation rate. Otherwise, continue to Step 5.
5. Compare the calculated assessment participation rate with the 95 percent criterion. If the calculated assessment participation rate is equal to or greater than 95 percent, then AYP is met for the subgroup (or aggregate group, i.e., school or LEA/SEA). Otherwise, AYP is not met.
Note. If the growth model proposal is approved for the State, required computational procedures would be applied here.
6. For the other required AYP indicators (i.e., graduation rate for high schools and retention rate for elementary and middle/intermediate schools), determine at the aggregate level of school or LEA/SEA, as appropriate, whether the measurable annual target has been met. If the computed graduation or retention rate is equal to or greater than the specified annual target value, then the measurable annual target is met. If the annual measurable target is met, then AYP is met. Otherwise, AYP is not met.
Note: Disaggregation by subgroups is not necessary for purposes of determining AYP for the other required indicators. Only aggregate schoolwide (and LEA/SEA level) values are needed. However, disaggregated subgroup data for the other required indicators are necessary for implementing the safe harbor provision in Step 3.
AYP decisions for each public school and the LEA/SEA are made annually. Failure to make AYP for two consecutive years — defined as failure of ANY subgroup (or aggregate group, i.e., school or LEA/SEA, if applicable) to not make AYP on the SAME indicator (i.e., reading, mathematics, graduation or retention rate) — will result in the school (or LEA/SEA) being identified for improvement, corrective action, or restructuring as specified in NCLB. This approach is consistent with No Child Left Behind’s goal of successfully remediating subject performance deficiencies and will mitigate the potential for falsely inferring that a school or LEA/SEA is not meeting AYP standards.
For any school (or the LEA/SEA) to exit from improvement, corrective action, or planning for restructuring, it must meet AYP for two consecutive years.
The adequate yearly progress calculation examines separately the proportion of students proficient in reading and mathematics, as well as the rates of participation in the reading and mathematics assessments. In determining whether each subgroup, each school, and the LEA/SEA as a whole meet the annual measurable objectives, Hawaii calculates — separately for reading and for mathematics — the percentage of the tested students who achieve the proficient level, examines assessment participation rates, implements a uniform averaging procedure by pooling data across grade levels, and employs the safe harbor provision when applicable.
6

Hawaii has established separate, statewide, annual, measurable objectives in reading and mathematics that identify a minimum percentage of students who must meet the proficient level of academic achievement. The reading and mathematics annual measurable objectives are applied to each school and to the LEA/SEA, as well as to each subgroup at the school and LEA/SEA levels, to determine AYP status.
Consecutive years of failing AYP requirements are predicated on ANY subgroup of students failing the SAME subject (reading or mathematics) for multiple years.
Hawaii has included several features that are designed to maximize decision consistency and the validity of inferences drawn from the accountability system:
Pooling (combining or “averaging”) data across grade levels
Using uniform averaging and comparing the average with the most recent year’s results (including the current year), or the current year’s results alone, to the annual proficiency target
Using the safe harbor provision so that schools that miss an annual proficiency target but show a strong gain in the area missed will not be identified as failing
Predicating two consecutive years of failing AYP on students failing the same subject (reading or mathematics)
Beginning in 2005, the Department has used the standard error (SE) of the proportion to determine whether the proportion (p) of students who are proficient in mathematics and reading is significantly lower than the State’s AMO for that year for reading and mathematics. The standard error of the proportion is applied to subgroups at the school and LEA/SEA level if a subgroup at the school or the LEA/SEA level is deemed to have not met the annual measurable objective for reading or mathematics. The formula is SE = (pq/N).5 where p is the percentage of students currently scoring at or above proficient, q = 1-p, and N is the number of “full academic year” students taking the test.
If p + SE ≥ AMO, then the subgroup is deemed to have met the annual measurable objective for reading or mathematics. Otherwise, the subgroup is deemed to have not met the annual measurable objective for reading or mathematics. The standard error of the proportion is not applied to participation rate, graduation rate, retention rate, and safe harbor calculations. The standard error of the proportion is limited to not more than 5 percentage points.
Organization of this proposalThe remainder of this proposal is organized into four sections:
Section 2, Overview of Growth Model Plan, describes how the growth model will be integrated with our existing accountability system and standards.
Section 3, Implementation Details of the Growth Model Plan, describes how specific growth targets will be established and the technical details of the assessments, growth model, and additional analysis. These technical
7

considerations are the foundation that will ensure reliability and the valid use of the growth estimates. The section continues to describe how the estimates will be reported to parents, schools, and policymakers to lead readers to accurate interpretation and valid reactions.
Section 4, Core Principles, shows how this plan aligns with the seven core principles set forth in the guidance document from the U.S. Department of Education.
Section 5 offers a brief summary of the proposal.
Section 2 -- Overview of Growth Model PlanHawaii’s current methods for measuring AYP rely on rigorous annual measurable objectives that expect schools to improve student performance each year in core tested subject areas. These details were provided in previous sections. If our proposal is accepted, the State will implement a growth model that will serve as an additional basis used to judge school effectiveness in an overall conjunctive accountability design. Therefore, our growth model approach will be used to complement, not supplant, our currently rigorous method for evaluating schools under NCLB.
The incorporation of the growth component will be employed as an additional decision step between steps 5 and 6 of the current sequence of steps in determining AYP as detailed in the prior section.
Hawaii will not use a growth model alone to hold schools accountable for 100 percent proficiency by 2013–14. The growth model will be an addition to, rather than a replacement of, the status and safe harbor determinations. The current accountability system will remain in place. The Hawaii Department of Education will run the AYP analyses, which include safe harbor and calculations of the standard error of the proportion, and will look at the growth toward proficiency as a final or last step in making the AYP decisions.
How growth targets will be establishedHawaii’s primary objective for the growth pilot is to ensure that there is complete congruence between the aims and objectives of No Child Left Behind and the implementation of a growth model. In particular, NCLB espouses two fundamental principles with respect to AYP:
1. All students must reach proficiency. 2. They must reach this score level within a finite period of time (i.e., 2014).
Therefore, Hawaii has developed a growth model to support the Secretary’s initiative that aligns with these two core objectives by expecting all students to reach proficiency within the period of time required by the law. Our model includes all students, not only those who missed the proficiency target. Similar to our current method for calculating annual measurable objectives (AMO) as described in the state Accountability
8

Workbook, we have developed AMOs for growth that schools must also reach as intermediate targets to more broadly support the measurement of AYP in our State.
Our proposed plan aligns the same AMO for the status model, but it uses the AMO three years from the current point in time in order to align with the theoretical and practical manner in which the statistical growth model projections are made. In other words, the 2007 AMO for growth is the same as the 2009/2010 AMO for the status model. In many respects, this sets a stringent standard and maintains a rigorous attempt to keep our accountability system focused on moving all students toward proficiency. The year-by-year AMOs for the growth model are provided in the tables below.
Table 3:Reading, Target Percent of Students Proficient (grades 3 to 8 inclusive as well as grade 10) for the Proposed Growth Model
Year2001-
022002-
032003-
042004-
052005-
062006-
072007-
082008-
092009-
102010-
112011-
122012-
132013-
14
Annual Objective 58 65 72 79 86 93 100 100
Table 4:Mathematics, Target Percent of Students Proficient (grades 3 to 8 inclusive as well as grade 10) for the Proposed Growth Model
Year2001-
022002-
032003-
042004-
052005-
062006-
072007-
082008-
092009-
102010-
112011-
122012-
132013-
14
Annual Objective 46 55 64 73 82 91 100 100
With the growth model, we can recognize that some schools begin from further behind, which would result in failing to meet the AYP status target. Among those schools, we may find some in which students learn at remarkable rates, even though they may miss their status AYP targets in early years because their students start from so far behind. It is in these situations that the growth model may yield evidence that their students will catch up within three years. The growth model will recognize effective schools that are dealing with difficult populations without sacrificing rigorous improvement targets. It will also bring more clearly into focus those schools in which student learning is not sufficient.
For the current pilot, the state will include in the growth calculations students in grades 4 through 8 and 10 who meet the definition of full academic year.
Because students are tested beginning in Grade 3, it is not possible to include Grade 3 students in growth calculations. However, we have developed a method that includes these students in accountability decisions. This method is fully described in the section titled, “Forming coherent results for NCLB accountability reporting”.
9

Technical characteristicsThe use of educational data for high-stakes accountability systems warrants significant technical developments to ensure that end users of the data make decisions and classify students and schools appropriately. The State’s highest aim is to provide policymakers with reliable data for decision making that distinguishes measurement and sampling error from true instructional quality. Additionally, the State believes that accountability data should provide educators and parents with useful information that they can apply to make instructional changes that will increase student achievement. This is best accomplished when the results rest on technically adequate methods and are reported to parents and educators in a transparent and meaningful way.
The following section provides the details needed to fully understand the technical aspects of the methods proposed. We devote significant attention to these issues because we firmly believe that the overall validity of the State’s accountability system rests on the technical adequacy of the assessment instrument and any statistical methods used to draw inferences regarding schools and students from the data.
Our proposal to add a growth component strengthens our current accountability system by adding in a new, rigorous test to determine whether students are growing at a sufficient rate each year. The plan presented below requires that schools continue to demonstrate that every subgroup continues to make progress toward the goal of 100 percent proficiency, that the achievement gap closes over time, and that all students achieve the objectives set forth by NCLB. As the details of our plan make clear, the addition of the growth component will more specifically identify schools in the greatest need of additional support. Our plan includes specific actions to improve schools in which students do not show adequate learning and sets forth steps to increase choices for parents of students in these schools
Section 3 -- Implementation Details of the Growth Model PlanThe State’s growth model operates on two foundations:
1. All students must reach the proficient standard; and2. Growth targets are set three years from each student’ current grade level.
However, they are not readjusted each year, a method we fully describe below.
These form the basis for the development of the subsequent statistical approach used. Our proposed method recognizes that projections into the future include significant uncertainty, which will result in fluctuations. From a policy perspective, the growth model must neither reward nor sanction schools on the basis of statistical fluctuations. From an educational perspective, it is neither valid nor helpful to report to parents that a student is “on track” when the statistical model implies that only a percentage of the students with similar performance will achieve proficiency. Our plan addresses this issue head on.
10

Despite common practice, a statistical growth model cannot project student performance as a single, fixed test score. Rather, like all statistical models, a growth model can be used to project a probability distribution over all possible scores for each student. Typical growth models report the mean or the mode of such distributions as though they are actual projections for the student.
Our plan uses the entire probability distribution to estimate aggregate proportions of students who are on track to reach proficiency in three years. For each student, some proportion of the projected distribution will fall above the proficient cut-score, and the remainder will fall below. For students who are generally on track, the cumulative density above the proficient cut-score will be large; for students who are not on track, this cumulative density above the cut-score will be small. Averaging the cumulative density above the cut-score across the students within a school (or the students within a subgroup within a school) yields an estimate of the expected proportion of students who are on track to meet their target standard. The schools for which this projection exceeds their AMO target for the target year are more likely than not to achieve that target for the current cohort of students.
This approach is amenable to very transparent reporting to parents, educators, and policymakers. To parents, we can report for each student that “Approximately x% of students with scores and growth patterns similar to those of your child will reach the proficient mark by grade y,”. Low probabilities of proficiency can accompany a call to action, combined with an analysis of a student’s needs from the test data. For schools, we can provide the projected proficiency rate among the current cohort in the target year and tell them simply that they are more likely than not to make the target — or to miss the target. The former would be granted something akin to safe harbor, and the latter would be advised of the actions taken when AYP goals are missed. In either case, the reports would present readers with descriptions of strengths and weaknesses to help them target their interventions.
Below, we lay out the technical details of our growth-model accountability plan. The remainder of this section proceeds in four parts:
Assessment foundations describes our plans for establishing a vertical scale, standard setting, quantifying the statistical uncertainty in the vertical linkages and the impact of this statistical uncertainty on resulting growth estimates.
Estimating growth presents our proposed growth models, along with the calculation of the projected percent proficient in the target year.
Establishing growth targets presents the details of our plan to establish the growth targets for schools.
Reporting growth projections for individual schools describes how we will present the results to stakeholders clearly so that they are understood and used appropriately.
11

Assessment foundationsIt is possible to implement a growth model when the tests are not linked across grades. Some advocates of growth models use simple transformations of within-grade scales to evaluate growth. For example, one popular method is to rely on normal curve equivalents (NCEs) from within-grade scales. However, our preferred method is to construct a vertical scale for the measurement of student progress and to measure whether students are progressing toward meaningful academic standards each year.
Vertical Scaling
To support the measurement of individual student growth along a specific latent trait (i.e., math and reading/language arts), the State will construct a vertical scale by using the common item nonequivalent groups design (Kolen & Brennan, 2004). The State’s increased capacity is extended through our new contractor, whose extensive experience developing vertical scales for standards-based assessment to be used in accountability systems will be beneficial.
When building this scale, the State will be especially cognizant of psychometric research findings that document how to establish scales that report reasonable patterns of growth over time, minimize the error variance related to linking scales, and document how to estimate this variance component for subsequent use in a linear growth model. These issues will allow the State to remain consistent with Standard 4.11 in the Standards for Educational and Psychological Testing (1999), a standard that requires the standard error of equating to be estimated and reported.
The State’s current testing program has been fully operational across grades 3 through 8 and 10 since 2004–05. Though the various within-grade test forms have all been horizontally equated, a vertical scale has not yet been established across grades. However, constructing a vertical scale and making it retroactive such that prior test scores can be reported on this scale do not present impediments. In fact, this is a virtue in that the construction of the developmental scale will benefit from recent psychometric findings that our testing contractor has undertaken.
The techniques we propose for building this scale (which we describe below) will result in a longitudinal data set that will extend across grades 3 through 10 and will be made retroactive such that all prior test forms can report scores on the same developmental scale. As a result, the State will be fully prepared to implement the growth model with three years of longitudinal data.
Vertical Scaling Methods
In 2007, Hawaii will use an embedded linking design to support the common item nonequivalent group model. That is, many common items will be spiraled across test forms and will overlap grades in order to establish the statistical linkages. Using this design will provide two significant benefits. First, because items are embedded in operational test forms, students will not be aware that they do not count toward their scores. This significantly minimizes biases that may arise from low levels of motivation
12

when linking forms are administered separately from the operational assessment. Hence, more-stable item parameters are estimated and a more-reliable vertical scale is developed, reflecting more precise measures of growth.
Second, this matrix design will allow many common items to be spiraled across test forms, thereby providing a rich set of possible items that can subsequently be used to establish the vertical linkage. When linking scales, it is often necessary to remove items that behave erratically across forms or grades. Hence, increasing the pilot pool through a matrix sampled design will allow the State to pilot many possible common items for subsequent selection.
We plan to implement a joint calibration procedure to establish the vertical scale. Recent research has shown that joint calibration results in more stable estimates (Hanson & Benquin, 2002; Kolen & Brennan 2004; Peterson, Cook & Stocking; 1983) and new estimators are available that provide accurate estimates of the reliability of the linkage (Cohen, Chan, Jiang, & Seburn; 2005), which will allow us to discern real growth from random fluctuations. Our state testing contractor has developed a closed form expression that recovers the sampling distribution of the linking parameters and provides an estimate of the vertical linking error. Because the technical details of this estimator are not yet published, full details of this method are provided in Appendix A.
In implementing this design, the State will establish a growth scale that avoids spurious growth patterns and minimizes linking error. Subsequently, the State can report the standard error of equating as required by the Standards for Educational and Psychological Testing (1999, Standard 4.11). In addition, the State intends to go one step further. It is not sufficient to simply estimate and report the linking variance. Instead, it is critical that this variance component be incorporated into the estimation of individual growth curves in order to derive standard errors that characterize all sources of uncertainty, which we detail in our next section.
Last, our equating process uses common items from prior test administrations. Hence, although there is a change from HCPS II to the HCPS III, we are able to retain the prior scale and equate new forms of the test. Consequently, there is no disruption to the scale and this change to a new test form does not impact the growth estimates.
The Consequences of Vertical Linking Error in Longitudinal Analyses
Most longitudinal models of educational data ignore the linking error that propagates into the analyses, even though it has been demonstrated that this variance component may be the most dominant source of error in the data (Michaelides & Haertel, 2004; Sheehan & Mislevy, 1988). Most growth models currently in use tacitly (and incorrectly) assume that this variance component has no consequence on the estimates and treat the vertically linked scaled scores as if they were precisely estimated. However, when this error is ignored, the year-to-year estimates of school effectiveness may appear to be unstable when, in fact, their fluctuations may reflect linking error, not real fluctuations in achievement growth.
13

From a policy perspective, the practical consequence of ignoring this variance is that schools may experience higher levels of misclassification and policymakers may be resting decisions regarding school sanctions and rewards on statistical error and not true instructional effectiveness. Another practical consequence is that educators and the general public may be confused by fluctuations and come to mistrust growth data. This would only cause the accountability system to be less reliable as a model for identifying high- and low-performing schools.
Even though the State is taking steps to significantly minimize the linking error in our equating methods, this variance component will still exist and its impact on growth data is still relevant. Consequently, it is imperative that the growth model used incorporate this variance into the estimation process to guard against making decisions on the basis of statistical noise.
The analytic methods proposed by Doran, Jiang, Cohen, Gushta, and Phillips (2005) will be used to incorporate linking error into the estimates of growth. This method has been shown to generate unbiased parameter estimates and adequately recover the true sampling distribution of the parameters considering all sources of error in the data. To illustrate the general approach, consider the following linear growth model:
,where t indexes time and i indexes student. Here, the distribution of the error terms is
,
where I is the N-dimensional identity matrix, is the autocorrelation parameter capturing the serial correlation in the individual time-series, and J is an N-dimensional matrix of linking variances. For the Rasch model, J reduces to , where L is the unity matrix and the scalar is the estimated linking variance associated with the grade-specific linkage. In the example above, we assume that observed scores at time 1 represent the base grade and are therefore unaffected by the linking transformation.
If we assume that all the variances are known (though in reality they too are estimated), proceeding with appropriate estimates and correct standard errors for the fixed effects can be resolved via the generalized least squares solution:
This model has been shown to return unbiased estimates of the fixed effects and standard errors that accurately characterize the various sources of error in the data, including linking error.
14

The important point is that the error owing to vertical linking is known, it is known to have an effect in longitudinal analyses, and it should therefore not be discarded. Instead, the purpose of data analysis is not simply to generate estimates of change but also to characterize the degree to which these results are stable.
Standard Setting Procedures
Standard setting is the means for identifying cut scores that indicate whether a student has achieved an established level of proficiency. It involves expert judgment that is typically informed by student performance data. A vast literature describes a wide range of standard-setting techniques. Some of these techniques are normative and identify cut scores that yield a desired percentage of examinees placed in two or more categories. Other techniques focus on what students know and are able to do. These latter techniques are better suited to address the current challenge.
More specifically, the Hawaii Department of Education intends to identify four levels of student achievement: Well-Below Proficiency, Approaches Proficiency, Meets Proficiency and Exceeds Proficiency. Three performance standards (cut scores) are needed to distinguish these four levels of achievement. Moreover, because student progress from grade to grade is a major focus of the testing system, these cut scores and the levels of performance they represent must be meaningful from grade to grade. That is, at the same rate of progress, it should not be expected that students who exceed proficiency in the current year would become well-below proficiency in the next year. It would be difficult to interpret results in which large numbers of students show dramatic changes in performance levels when their progress is consistent with teacher and program expectations.
Specifically, the State will be setting new performance standards in February 2007 using the Bookmark method to establish the four performance levels. With these recommended cut scores, panelists review the impact data and will conduct a vertical articulation procedure using the methods of Ferrara, Johnson, & Chen (2005) to ensure consistency in the achievement levels across the grades. In other words, the goal of the articulation process is to ensure that the performance categories have been aligned across grades.
Estimating growth A necessary first step is to estimate growth rates for individual students. However, growth rates alone are insufficient for aligning with the NCLB framework. Consequently, the Hawaii growth model is premised on the following:
All students must be held accountable for reaching the proficient standard.
A student is expected to reach the standard within a short period of time to ensure instructional responsibility for the student.
The conceptual framework was presented in the earlier section. Hence, we present the technical details of the growth model in this section. First we note that this process will be subject-specific, separate goals for each student will be set for reading/language arts
15

and for mathematics, and reporting will comply with all NCLB requirements at each subgroup level. Second, we note that we have constructed a second growth model that will be used to include students with disabilities, and students taking the HAPA in the growth calculations. Thus, all students participating in the Hawaii Assessment system are included in the growth model. The full details of both models are presented.
The statistical framework for estimating growth is a linear mixed model. These models are well suited to the analysis of longitudinal data and can adequately proceed when faced with missing data points. The full details needed to estimate the model adopted by the State can be found in Doran and Lockwood (2006) and Lockwood, Doran, and McCaffrey (2003).
Estimating growth in our model requires that each student have multiple scores for each subject, reading and mathematics, Yi = (y1i, …, yti,…, yTi)’ where t indexes time and i indexes student. The general form of the linear model is then
, (1)
The model incorporates random student effects for the intercept and slope to account for the serial correlation in the time-series and the heterogeneity in the individual growth curves. Hence, a growth curve is estimated for each student. The only variables used to estimate the growth curves are student achievement scores. No demographic information is used.
Four additional considerations are needed for estimating growth rates. First, it would be unfair to credit middle schools for high levels of growth that occurred at the elementary school level. Therefore, we will estimate a piecewise linear regression allowing us to compare growth rates that occurred under two distinct educational periods: elementary school and middle school. This is done to ensure that we can hold schools accountable for the instruction that occurs within their control and do not receive benefits or punishments from a student who experienced a large or small elementary growth rate.
Second, we center the time variable as t = t-Li where L denotes the point in time that student i entered the school system. Third, the vertical scale will be ready for use in the 2006–07 school year.
Last, no data are available in Grade 9. Consequently, there is a time point missing systematically for all students. However, this does not present estimation difficulties within the framework of random coefficient models and projections to the Grade 10 standard will still be acceptable and will be made in the same manner as the other grades. Additionally, we are able to include students with fractured longitudinal records within the mixed model framework without a need to impute data or remove those cases
16

using methods such as list-wise deletion. This is accomplished because model parameters are identified using maximum likelihood procedures, which are known to generate unbiased parameter estimates when the data are considered missing at random (MAR). For this reason, we are able to include all students, even when those students have only a single time point due to an inability to match student records over time.
It is generally difficult to justify the MAR assumption in educational analyses as it may be perceived that some students are systematically excluded from state tests. However, with the stringent requirement that at least 95% of the enrolled students within a school be tested, schools are highly motivated to avoid AYP consequences by including all students in their testing program. Consequently, any missing data are unlikely to be related to any other characteristics in the observed data, thus making the MAR assumption more realistic. Even if this assumption is believed to be unrealistic, the extent to which the data are missing will be nominal given the 95% requirement, thus only a small fraction of the complete data will be missing. Hence, parameter estimates are based on a very close approximation to the complete data and the degree of bias is likely to be nominal.
Establishing growth targetsSimply estimating growth rates alone will not align with the NCLB framework. That is, it is not enough to know whether the student is growing. Rather, one must know whether or not this growth sufficiently puts a student on a path toward proficiency. Consequently, we have developed a method that examines the adequacy of the estimated growth rates and determines the likelihood that an individual student will reach his or her target proficient standard in three years. In fact, this is the core of the entire growth methodology as it places all growth rates within a standards-based context.
As previously noted, growth targets are set individually for each student based on the proficient standard three years hence. To be clear, all students are held accountable for reaching the same standard, but the rate at which a student must grow may differ between students. Additionally, growth projections are made for all students with at least two test scores.
For example, a Grade 4 student’s growth rate is evaluated in terms of whether she is on track to reach the target proficiency standard in Grade 7. Setting this expectation only three years out is designed to ensure that schools accept instructional responsibility for the student, which would not be accomplished if the end of the timeline was a distal endpoint, such as grade 10 and if they were readjusted annually. Table 5 illustrates how growth targets are set three years out in the initial year and then remains fixed until the student reaches that target grade.
Table 5: Sample Method for Setting Growth TargetsSchool Year
2006-2007
2007-2008
2008-2009
2009-2010
2010-2011
2011-2012
17

Student Grade Level 4 5 6 7 8 9Target Proficient Standard
7 7 7 10 10 10
For example, the target standard for a grade 4 student in 2007 will be grade 7, which is three years from their current grade. Now, the target standard remains fixed until the student reaches this grade, at which point a new target standard is developed three years in the future. That is, when the student moves into grades 5 and 6, the target standard is still grade 7. However, when the student reaches grade 7, we set a new growth target three years hence, which would be grade 10.
In the Hawaii model, all students are held accountable for reaching the proficient standard, and there is no modification made for individuals conditional on background characteristics. However, the rate at which students must grow in order to reach this score level will vary across individuals. This too is consistent with the current AYP calculations.
As previously noted, we conceive of each student’s predicted score as being surrounded by a normal distribution. Consequently, we can rely on the statistical properties of this distribution to assess the probability that student i will reach the target proficiency standard at time T.
To illustrate how the individual predictions will be formed, consider a grade 4 student. This student was observed in grade 3 and in grade 4, and the target is the Grade 7 proficiency. From the parameterization in Equation (1), we can form the following predictions:
Hence, we first estimate the relevant projected score for student i at time T, . Second, we estimate the posterior variance associated with this predicted score, denoted (see Appendix B for a derivation of the posterior variance for the linear mixed model), and we identify the probability that this individual will reach the proficient cut point in subject s.
With the estimates of and in hand, the challenge is to integrate over the portion of the distribution of the student’s projected score above λg (the proficient cutpoint for grade g) to assess the probability that student i will reach the proficient cutpoint at time T. This probability can be found using
,
18

where is the projected posterior mean for student i, is the posterior variance of , and λg is the lower bound cutpoint for the proficient cut score in grade g. By relying on the assumption that f(x) ~ N(μ,σ2), the integral above is evaluated as,
where Φ(.) is the standard normal cumulative distribution function.
Hence, we can make probabilistic statements regarding the extent to which a student’s growth is adequate and places this student on a trajectory where she is likely to reach the proficient cut score at time T. Now, for reporting purposes at the school level, we can estimate
, (2)
where N denotes the total number of tested students in school j. This returns the expected percentage of students on track to reach proficiency in three years. Similarly, we can estimate the percentage of students likely to reach the proficient cut point for each of the NCLB subgroups in the school:
,
where H represents the various NCLB subgroups. To assess whether the achievement gap is closing over time, the State will compare these expectations over time. A school has met its AMO for growth when for the school overall and each of the required NCLB subgroups in Reading and Math.
A particular benefit of this model is that all students—including those above and below the proficient cut points—are included in the growth calculations. This can occur even for students scoring at or above proficient in their current grade because our growth model estimates the probability that a student will reach a future target standard conditional on their prior levels of achievement. Figures 1 and 2 make the concept explicit.
Assume that the proficient cutpoint is 200 in grade 4. In Figure 1, the student has scored below the grade 4 proficient target. However, based on the observed growth rate, we can project where the student is likely to end up in three years. The point estimate suggests that the student will end up in the Approaches Proficiency category in grade 7. However, given the prediction error, there is some probability that the student will score at or above Meets Proficient in grade 7. Based on the normal pdf, the student has about a 16% probability of scoring Meets Proficient in grade 7.
In Figure 2, the student has scored above the grade 4 proficient cut score. But, we can still include this student in growth calculations in the same manner as the student scoring below proficient. Based on the normal pdf, the student has about an 84% probability of scoring Meets Proficient in grade 7.
19

The Hawaii model includes all students in growth calculations irrespective of their starting point. Hence, our model captures all information for all students and not only those scoring below proficient in their current grade.
20

Additionally, each student is included and provides unique information to form a school-wide summary estimator for accountability reporting purposes. However, the prior model rests on the properties of a vertical scale, and this is not available for students with disabilities, or the HAPA. For this reason, we construct a second approach such that all students in the state can be included in growth calculations.
Including Students with Disabilities
Of the 20 state growth models submitted for USED’s consideration in February 2006, only three indicated that students with disabilities would be included in the state growth model calculations (Education Daily, 2006). Of the two proposals that received final approval by USED (North Carolina and Tennessee), neither includes students with disabilities in the growth calculations.
The largest impediment cited by states was the lack of a vertical scale for the alternate assessments (Education Daily, 2006). These scales are often believed to provide a continuous, interval score scale and, purportedly, provide some assurance that a common trait is being measured over time with increasing levels of difficulty. In other words, the vertical scale is designed to operationalize the idea that fourth-grade math is the same “thing” as third-grade math, just more difficult.
21

While vertical scales do provide a basis for implementing certain growth models, it is entirely possible to make use of the ordinal nature of the rating data or performance categories that are often associated with alternate assessments as the basis for modeling student growth patterns even when scores are not on a vertical scale. Consequently, we extend our growth model to include all students taking alternate test forms such that every tested student in the state is included in the growth calculations.
However, given the ordinal nature of the data generated from the alternate assessments, we must construct a second growth model that alleviates the need for a vertical scale. This section presents the growth model that will be utilized for students with disabilities whereas the prior model will be used for student scores obtained from the regular state assessment program.
One approach is to rely on transition probabilities—a fundamental quantity from Markov Chains, which denote the probability of moving from one state into another state (Betebenner, 2005; Wasserman, 2003). A state refers to a possible outcome in the set
where the set is referred to as the state space. For current purposes, the state space can be defined as the full set of performance categories used for reporting student scores (e.g., basic, proficient, advanced). When the probability of moving from one state to the next depends only on the prior outcome, the transitions through the performance categories form a 1st order Markov Chain.
This process can be formally established as follows:,
where pij is the transition probability and the matrix P whose ijth element is pij is the
transition matrix. The matrix P has two important properties. First, pij ≥ 0 and .
Once the matrix P has been estimated, it can be used to project the future performance of individuals as follows (we suppress the subscripts s and g for convenience):
, (3)where r0j is a column vector of the current state of school j. That is, a vector describing the proportion of students in the school scoring above and below the proficient cut score.
One option for estimating the transition probabilities is to use a multilevel model for binary response data (Raudenbush & Bryk, 2002; McCullagh & Nelder, 1989). This particular analysis allows us to respect the hierarchical structure of the data (i.e., students nested in schools) and permits each school to have an estimate of its propensity to move students toward higher levels of performance.
For this particular analysis, the goal is to estimate the propensity of school j to move students into higher levels of proficiency given two years of observed outcomes for each student. Because the state space consists of two conditions (proficient or not), the outcome data are dichotomous and we assume the data at time n + 1 are Bernoulli distributed where
22

Subsequently, using the logit link function, the linear predictor has the following structural form:
.
By allowing the intercept to vary randomly over all schools, it is possible to estimate the log-odds of transitioning from one state to the next for each of the j schools. We also condition on a student’s prior level of achievement, xi, which is also a dichotomous variable denoting whether the student was proficient at time n (xi = 1) or not (xi = 0).
This particular specification permits for us to estimate two useful quantities for each school. The first quantity of interest is the propensity of a school to move students that were proficient at time n to proficiency at time n + 1. We convert the estimated log-odds for school j to a predicted probability as
. (4)
Second, we can estimate the propensity of a school to move students who are not proficient at time n to proficiency at time n+1 as
. (5)
Once both of these quantities are estimated for each of the j schools, it becomes feasible to form the transitional probability matrix, P. Subsequently, these estimates permit for us to carry out the matrix operations derived in Equation (3) to form the proportion of students expected to reach the proficient cutpoint at a future point in time.
Specifically, we form the following:,
,
where NP% and P% represent the proportion of students not proficient and at proficient in school j, respectively, and p1 and p2 are the probabilities expressed in Equations 4 and 5 above, respectively.
Once these matrices are formed, we estimate the future state for school j as noted in Equation (3). This is the same estimate formed from the prior growth model from Equation (2). Hence, the growth models for the regular assessment and for students taking alternate forms estimate the exact same quantity—the proportion of students expected to reach their target proficient standard at time T.
To make this presentation concrete, consider the following sample analysis. Assume the current state of school j is
23

.
Also assume the probability estimates derived from Equations 4 and 5 above were estimated as
.
However, to be consistent with the prior growth model which expects students to be proficient within three years, we carry out the matrix operations from Equation (3), but it is necessary to exponentiate the matrix P as P3. Doing so gives the following result,
.
Or, 51% of the students are expected to be below proficient and 49% are expected to be proficient in the target year.
Forming Coherent Results for NCLB Accountability Reporting
The technical methods posed for the growth models both provide similar estimates and can be used to form quantities that can be useful for judging the effects of a school. An important aspect of these methods is that they express longitudinal patterns of change using probabilities, which form a natural method of communicating results from complex analyses. That is, although the analyses may be somewhat complex for practitioners, the results of the analyses can be directly understood without significant statistical experience.
However, once the analyses are complete from both growth models, it is important to form a single accountability indicator that combines the results of the multiple statistical methods that can be used for the NCLB accountability reporting purposes.
Because both models estimate similar quantities—the proportion of students expected to reach the proficient cutpoint within a specified time interval—one option that can be useful for summarizing overall school performance is to rely on the following weighted average,
, (6)
where wi is the sample size for each group (i.e., the number of students included in the regular assessment and the number of students taking alternate forms) and xi is the proportion of students expected to reach proficiency from the different methods as specified in Equations 2 and 3. Consequently, γj from Equation (6) returns the total proportion of students in school j expected to reach the proficient cutpoint within a
24

specified time interval. Because we form a school-wide summary statistic, this can be compared with the AMO set for accountability purposes as described in the earlier sections.
As previously noted, it is not possible to include 3rd grade students in the growth model calculations. However, it would be unwise to exclude these students in forming accountability results and this would be exactly the case if a school’s AYP decision rested only on the growth model results. For example, assume a K- 5 elementary school failed to make AYP via methods 1 through 5 described on pages 4 and 5. The next rung is to evaluate whether students in the school are meeting their growth targets. However, this would only include students in grades 4 and 5 and grade 3 students would be systematically excluded.
But, if grade 3 was the “problem” grade, then the school would automatically benefit by systematically excluding those students and basing their accountability decision on the results derived from grades 4 and 5.
Consequently, we propose an accountability model that combines the growth model estimates with the grade 3 status scores as follows. An elementary school will be deemed to have made AYP for the growth condition only if both of the following conditions are met:
The school must meet the AMOs set for growth as described in Tables 3 and 4 using the grades for which growth data are available; and
The percentage of students at or above proficient in Grade 3 must meet or exceed the State AMOs for status as described in Tables 1 and 2.
This method is stringent and logical. It results in a school’s AYP decision resting on an evaluation that includes all students, not only those for whom growth data are available.
Exploratory Estimates of Growth Model for 2006For selected grades participating in the Hawaii State Assessment from 2003 through 2005, true longitudinal cohort analyses are possible prior to the institution of the pilot growth model program commissioned by the United States Department of Education. In a recent series of exploratory runs involving several variations of growth model approaches, estimates of the isolated impact on AYP attributable to growth added to the current status-based model ranged roughly between 10 and 20 percent. However, the analysis most similar to the method proposed here for 2007 puts the estimate at about 16 percent (28 additional schools reflected demonstrable growth substantial enough to have met the established growth targets using a three-year growth projection, and therefore meet AYP requirements for 2005.
These analyses differed in two distinct ways from the actual 2005 AYP determinations: only 3 grades (4, 6, and 10), as opposed to the actual four, were available for the exploration, and these grades differed slightly from the actual grades used under the status model (3, 5, 8, and 10). Furthermore, we used related, albeit simpler growth
25

target computations involving transformations of scale scores to Z-scores for each student in each tested grade to standardize scale scores distributions across grade levels and across years to address the problem of differential sample error variances associated with different cohorts, different grades, over different test administrations.
It should be pointed out here that these analyses do tend to reveal some interesting characteristics of the growth model. These early analyses of what is considered a “close approximation” to the actual growth procedures slated for 2007 clearly show that a growth component would benefit elementary schools most. All of the 28 schools in the simulation described above were elementary. In two earlier runs, where Z-transformations were not performed on student scale scores, elementary schools were still predominantly identified with only one or two upper level schools also demonstrating sufficient growth to contribute to the AYP outcome.
Reporting growth rates for individuals and schoolsThe previous section details all technical aspects of the Hawaii growth model. However, an assessment and accountability program becomes most visible to its users through the mechanisms used to report student achievement scores. In many respects, score reports become the entire face of the assessment and accountability program because all of its other technical characteristics, such as the statistical growth model and the psychometrics, are rarely accessible to most end users of the data. As such, reports bear an important task as they link the complexities of the statistical growth model to the needs of parents, educators, and policymakers to support decision making.
Beginning in Summer 2007, the State is implementing a series of score reports for all students, teachers, schools, and districts that present achievement data in a fashion that relies on straightforward language and rich, full-color visual displays. Each score report offers instructional recommendations at the various levels (e.g., student or teacher) conditional on the strengths and weaknesses identified in the data from score response patterns, total scores, and upon comparisons made with other similar classes or schools.
This pilot program presents a unique opportunity to extend our score reports to include the use of growth data not only in our accountability structure, but in the way these data are reported. We have developed a sample growth report, shown below, to illustrate the concept.
26

For parents and educators, the primary function of the report is to share whether the student is meeting growth targets and to offer recommendations for instructional improvements conditional on their growth rate and levels of performance. It is very important that the reports characterize the degree of uncertainty without reporting complex standard errors. In fact, the technical methods described above provide a natural statistic for doing so. For example, the language surrounding the graphics will be something similar to the following:
Kyree had a score of 360 last year and a score of 440 this year. Her score improved by a bit less than the average student’s score. About 70 percent of students at this level who are learning at this rate will be proficient by grade 7. Talk to your child’s teacher about how you can improve Kyree’s odds of being proficient. On the following pages, you will find a detailed analysis of Kyree’s test performance and some specific suggestions about how you can help her catch up.
At the higher levels of aggregation, the reports will present the percentage of students meeting their standards-based growth targets, whether the school is likely to reach its AYP targets in three years, and the degree to which the achievement gaps differ over time. The school-based reports will disaggregate the data by subgroup, and identify any areas of instructional strength and weakness based on growth data and other auxiliary analyses.
27

Section 4 -- Core PrinciplesHawaii’s proposal adheres to and addresses the “Seven Core Principles” the United States Department of Education expects in each proposal. This overview lists each of the seven core principles and indicates how our growth model aligns with each of the core principles.
Core Principle One — The accountability model must ensure that all students are proficient by 2013–14 and set annual goals to ensure that the achievement gap is closing for all groups of studentsAs noted above, the proposed addition of a growth component to Hawaii’s accountability system does not change the State’s ability to ensure that all students are proficiency by 2013–14. In fact, the growth component will help enhance that capability. The addition of the growth component does not replace existing accountability requirements in Hawaii but rather supplements them.
Hawaii currently uses the status and safe harbor components required under NCLB to determine whether schools make AYP or are in need of improvement. The status and safe harbor provisions will continue to be part of that determination.
Hawaii will not use a growth model alone to hold schools accountable for 100 percent proficiency by 2013–14. The growth model will be an addition to, rather than a replacement of, the status and safe harbor determinations. The current accountability system will remain in place. The Hawaii Department of Education will run the AYP analyses, which include safe harbor and calculations of the standard error of the proportion, and will look at the growth toward proficiency as a concluding step in making the AYP decisions. For example, if a subgroup in a school does not meet its target proficiency goals, any student who is on a growth trajectory to be proficient within three years of entering the public school system (starting in grade 3) will be added to the number proficient to compare against the existing proficiency target.
In addition, the growth component, as well as the status and safe harbor determinations, will apply to all applicable tested grades and will be used to determine AYP in both reading and mathematics.
Technically and educationally sound “targets” for schools, subgroups, and individual students
Under this proposal, the annual targets for schools and subgroups align with the AMOs already in place. They are not being replaced or modified by the addition of the growth component to the State’s accountability system. All schools and subgroups will continue to be required to meet the annual proficiency targets up to and through school year 2013–14.
What is being added to the accountability system is a set of growth targets for schools that align with the same AMOs currently used. The growth targets for students are aggregated to provide a summary of the school’s overall performance and the
28

performance of each subgroup. The AMO growth targets provided in the technical section in Tables 3 and 4 are technically and educationally sound. In addition, they are rigorous and challenging and incorporate expectations of proficiency for all students regardless of subgroup. Also, note that students at the proficient level are included in the growth model calculations.
Technically and educationally sound method of making annual judgments about school performance using growth
As noted above, the annual proficiency targets for schools and subgroups will align with the current methods. However, consistent with the manner in which the statistical model operates, the growth AMOs align with the targets three years out from the current year beginning in 2007. Subsequently, the targets increase until 100 percent are proficient in 2014. Retaining the proficiency targets from the current accountability system helps ensure that all schools and all subgroups continue to be held to stringent and accurate targets and that the State is able to make sound judgments about their performance. The annual proficiency targets for all schools and subgroups, taken from Hawaii’s accountability system, are provided in Tables 1 and 2 above.
Moreover, our model is unique in that we utilize the entire probability distribution to estimate aggregate proportions of students on track to reach proficiency three years hence. This technical guard is in place to ensure that certain conclusions regarding school effects are not made beyond what the actual data can support. Hawaii’s growth model does not include confidence intervals.
A review of the proficiency targets for all schools and subgroups clearly demonstrates that schools and subgroups are required to meet substantial increases in those targets across a relatively short time span (SY2006–07 to SY2013-14). These increases are reasonable and challenging and require schools to demonstrate continuous improvement.
The application of the growth component in the State’s accountability system helps ensure unified AYP determinations. The growth component is applied only after other methods of determining whether a school or a subgroup has met AYP. These methods include the status and safe harbor components.
Core Principle Two — The accountability model must not set expectations for annual achievement on the basis of student background and school characteristicsIn Hawaii’s application of the growth component in the accountability system, expectations for student growth and school and subgroup attainment of established proficiency targets are all independent of student demographics or school characteristics. Student and school characteristics are not even remotely used or considered in the growth component. The targets in the component are used equally for all students in all schools and all subgroups. They do not vary by student demographic or school characteristic.
29

Core Principle Three — The accountability model must produce separate accountability decisions about student achievement in reading/language arts and mathematics.The addition of the growth model does not change Hawaii’s accountability system with regard to holding schools accountable for student achievement in both reading and mathematics. Under the existing system, the State produces separate accountability decisions about student achievement in reading and in mathematics. Accountability decisions will continue to be made in both subjects with the inclusion of the growth component.
The technical section of our proposal details the general method that will be applied to the data. This model will be applied to separately for reading/language arts and math. The growth component does not incorporate or include assessments for other content areas.
Core Principle Four — The accountability model must ensure that all students in the tested grades are included in the assessment and accountability system. Schools and districts must be held accountable for the performance of student subgroups. The accountability model includes all schools and districts.The inclusion of all students
With the addition of the growth component, all students in the tested grades will continue to be included in the assessment and accountability system. There will also be no change in the way that schools and the SEA/LEA will be held accountable for the performance of student subgroups. In addition, all schools in the State will be included.
For students who have entered Hawaii’s public schools for the first time, there will be no way of calculating or determining their rate of growth until there has been at least two years of test data available for them.
Students who move from school to school within the state will continue to be included as long as they have a “pre” and a “post” score. Students who cross school boundaries within the Hawaii public school system will be included in the growth component of the accountability system and attributed to the receiving school. This is possible because Hawaii assigns a unique 10-digit identifier for each student.
Students who leave the Hawaii public school system or who enter it for the first time will not be included because for them, there will be only a “pre” score. No “post” score will be possible to compute or calculate.
As previously described, we have devoted considerable time in developing an inclusive growth model proposal that includes all students in the state—including students with disabilities and students taking the HAPA.
Students who are tested in grade 3 or in the initial grade tested will also be considered to have only a “pre” score. They will need to be in the assessment system for two years
30

to be counted in the growth component of the accountability system. Again, it is important to note that such students are “counted” in the status and safe harbor components of the Hawaii assessment and accountability system. Thus, although the rate-of-growth scores of such students are not in the growth component, such students are still in the accountability system because a proficiency score is determined under the status component.
The inclusion of all subgroups
All subgroups are fully and appropriately included in the growth component of the accountability system because the rate of increase can be computed for all students, with the exception of those students noted above. Thus, no subgroup is either minimized or excluded from the growth component of the accountability system.
The minimum n-size for all subgroups in the accountability system is 40 regardless of subgroups. The growth model component will also be based on 40 students; thus, there will be no contradiction or inconsistency.
In addition, students who change subgroup classification over the period of time when growth is calculated will be placed in the subgroup into which they are placed at the time of the most current year (i.e., “post score”).
The table below presents the percent of students by subgroup that is included in the growth model. The figures are based on the proportion of students in the tested grades.
Disadvantaged 44%Disabled 12%Limited English Proficient 7%Asian/Pacific Islander 79%Black 2%Hispanic 3%Native American 1%White 15%
The inclusion of all schools
Information from the growth component will be applied to all schools, regardless of size, type, status, or location. Under Hawaii’s proposed model, there are few, if any, conditions that would preclude the calculation of growth for individual students. Students who change schools will continue to be included as long as those students continue to reside in the state and attend public schools in the state. Schools that close would be affected equally by the status, safe harbor, and growth components of Hawaii’s accountability system. In other words, schools that close before the determination of adequately yearly progress would continue to receive an AYP determination but would no longer be subject to sanction because they would no longer exist.
31

All schools are accountable for achievement in Hawaii. The addition of the growth component does not change that requirement in Hawaii’s accountability system.
Core Principle Five — State Assessment and Accountability SystemHawaii’s statewide assessment system includes annual tests in reading and mathematics for students in grades 3 to 8 inclusive as well as grade 10. Annual assessments for all of these grades have been in place since the 2004–05 school year. For both the 2004–05 and 2005–06 school years, Hawaii’s assessment system measured the State’s adopted content standards in reading and mathematics. Hawaii produced individual student, school, and district reports based on the assessment for both years.
The state also maintains a rigorous data warehousing and management system with unique student identifiers that can be used to create longitudinal records.
Reporting individual student growth to parents
Hawaii will report individual student growth to parents as demonstrated in the technical section of the proposal and accompanying sample graphics. We envision that our reporting methods will bring a significant deal of transparency to our model and will provide relevant information that parents and educators can use to support subsequent instructional improvements.
Achievement scale scores have been equated appropriately
The equating methods used by the state in 2007 will be superior. The techniques used will result in a vertical scale that reports reasonable patterns of growth over time and minimizes error that arises due to the process of linking. These significant efforts undertaken by the state will result in a scale that can adequately support the measurement of student growth.
How the State adjusts scaling to compensate for missing grade levels
Grade 9 is not assessed and there is no scale at that grade. However, the statistical method used easily extends to data collected from unequal time points and this in no way presents an impediment to the growth model proposed. The vertical scale that will be developed will cover grades 3 to 10.
Technical information and statistical information to document the procedures
The technical and statistical information on the establishment of the vertical scales is described in Section 3 above.
Cut scores that define the various achievement levels have been aligned across the grade levels
The cut scores on the 2007 vertical scales will be established using a vertically articulated process (Ferrara, Johnson and Chen, 2005) and Ferrara, Williams, & Phillips (2006). In this procedure the system of performance standards are established in a process where the standards are orderly and incremental across grades. The essence
32

of the process is to bring together standard setting panels in reading and math and set all standards in a collaborative effort that are articulated both across grades (e.g., grades 3-8, and 10) and across subjects (e.g., reading and math). The standard setting panel is guided through a process where they first establish standards based solely on content. Then impact data and cross-grade and cross-subject information is gradually introduced into their deliberations. The existence of a vertical scale helps show how standards set in one grade are interpreted in the other grades. In the end the process results in a set of performance standards that are based on content standards but guided by impact data and contextual information. A similar process was used in the state of Ohio where the standards have been well received by educators and policy makers.
No statistical smoothing of the cuts scores will be used. However, the vertically articulation method described in the previous section results in a system of standards that are gradual and incremental across grades on a vertical scale.
Statewide assessment system is stable in its design
There were no revisions or changes in the overall design of the assessment system between school year 2004–05 and school year 2005–06 with regard to the grades tested, the content assessed, and the scoring procedures.
There will be no changes in the Statewide assessment system in the next two academic years with regard to the grades tested. However, the Board of Education has approved a new set of content and performance standards (known as Hawaii Content and Performance Standards III, or HCPSIII). Hawaii’s statewide assessment for school year 2006–07 and the foreseeable future will be based on HCPSIII. Hawaii will develop comparable scale scores for the new statewide assessment; for example, a score of 300 on the school year 2005–06 Hawaii State Assessment based on HCPSII will be the same as a 300 on the school year 2006–07 Hawaii State Assessment based on HCPSIII. Thus these changes will have no impact on the State’s growth model. The State will still be able to compare scores from school year 2005–06 with those from school year 2006–07. Beyond the new standards and performance categories, the HSA will not experience other changes in the foreseeable future.
Core Principle Six — The accountability model and related State data system must track student progress.For several decades now, Hawaii has used a 10-digit student identification number system which enables the State to track students across schools and across time. With the student identification numbers, the State knows the enrollment status and location of each of the approximately 185,000 students on a daily basis. Schools are required to do daily uploads of critical demographic fields, including enrollment and status on special needs categories required for NCLB such as disabled, Limited English Proficient and economically disadvantaged.
In addition, the State is able to match assessment records of individual students from one year to the next regardless of the public school the student attends. As long as a
33

student stays within the same State educational jurisdiction, Hawaii will be able to match that student over time and across schools. Only if the student moves out of state or transfers to a private Hawaii K-12 institution before the administration of the current Hawaii state assessment will that student not be counted for AYP purposes. In any event, students who leave the state public education system before the administration of the state test are not part of the computation in either the participation or proficiency rates.
The match rate for students followed longitudinally had been is estimated to been somewhere in the ninety percent range. The State recently conducted a two-year comparison of student test records. The results of which are shown below.
Two Year Comparison – SY 2004-2005 and SY 2005-2006
SY 2004- 2005* SY 2005-2006*Grade N Grade N (%)** 03 14,178 04 12,599 (89%) 04 14,103 05 12,865 (91%) 05 14,489 06 12,823 (89%) 06 14,069 07 12,149 (86%) 07 13,624 08 12,234 (90%)
In SY 2004-2005, students in grades 03, 04, 05, 06, 07, 08 and 10 were tested. However, for tracking purposes, only students in grades 03 through 07 were included in the selection process as the comparison was based on contiguous grades across the two years. The percentages in parentheses represent the match rate between 2004/05 and 2005/06. All matches are high, ensuring that growth estimates can be reasonably formed.
Data infrastructure to implement the proposed growth model
The Hawaii Department of Education data infrastructure is posed to support data processing and database management requirements associated with the proposed growth model. This includes both demographic data and assessment data required for all aspects of AYP determinations.
In fact, the State is already providing schools with longitudinal assessment information for a number of years. Each school presently has secure, electronic access to the test scores of its current students regardless the students’ prior location during the 2002, 2003, 2004, and 2005 Hawaii State Assessment. Moreover, each school principal and appointed designees have access to ARCHdb, a secure web-based, multi-year NCLB student level database that functions both as a resource for AYP appeals and as a school improvement planning tool.
Several major initiatives are underway to further improve the supporting data infrastructure’s scope, efficiency, and responsiveness to end users. The new electronic student information system, eSIS, is in its second phase of rollout, incrementally
34

replacing an older student information system in place since the early 1990s. Another major information system initiative will consolidate various special needs student records under a Comprehensive Student Support System database and will receive closer data processing monitoring and quality assurance checks. These efforts would not be entirely possible without strong support from our educational policy makers. There has been long standing support from the legislature and State Board of Education to address information management needs of the Hawaii Department of Education.
Core Principle Seven — Participation Rates and Additional Academic IndicatorHawaii’s existing accountability system already includes information on participation rates for all students as well as for each of the required subgroups. The existing accountability system also has an additional academic indicator that is applicable to all public schools in the State. However, participation rates do not enter into and affect the growth component of Hawaii’s accountability system. The calculation of participation rates for each school year does not change because the growth component neither affects nor is affected by participation rates.
Hawaii’s additional academic indicators are retention rates for elementary and intermediate or middle schools and graduation rates for high schools. These are not incorporated into the growth component because they are calculated independently. In addition, they do not affect the growth component of Hawaii’s accountability system.
Section 5 -- Final WordsThe Hawaii Department of Education appreciates the opportunity to submit this proposal. Hawaii’s proposal offers a clear, sound, and rational approach to determining and reporting student growth and school progress over time that is consistent with and supportive of the No Child Left Behind legislation. Adding the growth component will only help to strengthen the validity and reliability of the accountability decisions the State makes based upon annual statewide test results.
While there is strong support for standards-based education and accountability in our state, there is also a firm recognition of the need to continue refining the State’s ongoing efforts to ensure that these initiatives are established. Stakeholders across the spectrum view the inclusion of the growth component in the State’s accountability system as a means to ensuring fair and accurate AYP decisions without compromising the State’s commitment to challenging expectations for all schools and all students.
35

References
American Educational Research Association. (1999). Standards for educational and psychological testing. Washington, DC: American Psychological Association.
Betebenner, D. (2005). Performance standards in measures of educational effectiveness (Tech.Rep.). Boston College.
Binder, D. A. (1983). On the variances of asymptotically normal estimators from complex surveys. International Statistical Review, 51, 279–292.
Cohen, J., Chan, T., Jiang, T., & Seburn, M. (under review at APM). Consistent estimation of Rasch Item Parameters and their standard errors under complex sample designs.
Doran, H. C., Jiang, T., Cohen, J., Gushta, M., Phillips, G. (2005). The Precision of Gain Scores Obtained from Vertically Linked Scales: Implications for Estimating School and Teacher Effects Through Value-Added Models. Washington, DC: American Institutes for Research, Computer and Statistical Sciences Center.
Doran, H.C., and Lockwood, J (2006). Fitting value-added models in R. Journal of Educational and Behavioral Statistics, Volume 31 (2), 205-230.
Ferrara, S., Johnson, E., & Chen, W. H. (2005). Vertically articulated performance standards: Logic, procedures, and likely classification accuracy. Applied Measurement in Education, 18(1), 35-59.
Ferrara, S., Phillips, G. W., & Williams, P. W. (2006, forthcoming). Defining growth onvertically articulated cross-grade test scales using cognitive demands analysis. InR. Lissitz (Ed.) Assessing and modeling cognitive development in school: Intellectual growth and standard setting. JAM Press.
Godambe, V. P. (1960). An optimum property of regular maximum likelihood estimation. The Annals of Mathematical Statistics, 31(4), 1208–1211.
Godambe, V. P., & Thompson, M. E. (1984) Robust estimation through estimating equations. Biometrika, 71(1), 115–125.
Hanson, B.A. & Béguin, A.A., (2002). Obtaining a Common Scale for Item Response Theory Item Parameters Using Separate Versus Concurrent Estimation in the Common-Item Equating Design. Applied Psychological Measurement,26(1), 3-24.
Kolen, M. J. and Brennan, R. L. (2004). Test equating, scaling and linking: Methods and practices. Springer-Verlag
36

Lockwood, J.R., Doran, H.C., and McCaffrey, D.F. (2003). Using R for estimating longitudinal student achievement models. The Newsletter of the R Project, 3(3), 17-23.
Michaelides, M.P., and Haertel, E.H. (2004, May). Sampling of common items (Tech.Rep.). Palo Alto, CA: CRESST/Stanford University.
Mislevy, R. J. (1984). Estimating latent distributions. Psychometrika, 49, 359–381.
Peterson, N.S., Cook, L. L., Stocking, M. L., (1983). IRT versus conventional equating methods: A comparative study of scale stability. Journal of Educational Statistics, 8(2) 137-156.
Sheehan, K.M., and Mislevy, R.J. (1988, July) Some consequences of the uncertainty in IRT linking procedures (Tech. Rep.). Princeton, NJ: Educational Testing Service.
Wasserman, L. A. (2004). All of statistics. New York, New York: Springer-Verlag.
37

APPENDIX A
The Joint Calibration Procedure
The joint calibration procedure develops the common vertical scale in a single step by calibrating all items from all grades simultaneously, at the same time estimating parameters of the proficiency distribution within each grade level. Given grades up to grade G to link, the log-likelihood has the following form:
,
where is the grade-specific (marginal) log-likelihood given by
, (1)
where is the number of students in grade , is the ability, is its grade-dependent density function, is the collection of item parameters, and
is the row of the full response matrix corresponding to student in grade . Using the independence assumption, we see that the likelihood of row is
.1
Note that Equation 1 contains an explicit model of the population distribution within a grade. This decomposition of the likelihood and the population distribution provide the framework for vertical linking. The connections across grades are made by the sets of common items assigned to students in adjacent grades.
The NPMML proceeds by replacing with an empirical vector of normalized weights on a prespecified collection of population parameters (quadrature
points) , resulting in the following approximation of the grade-specific log-likelihood:
,
with the constraint that
1 Note that , the number of items, may also depend on grade. However, to avoid cumbersome formulae, we suppress any notation indicating this dependence.
A-1

, for all . (2)
In order to identify the model, it is sufficient to fix the mean proficiency within a single grade. For simplicity, let us fix the lowest grade proficiency to 0; that is, let
. (3)
If we assume that the location of the quadrature points are fixed, rather than estimated, the task becomes finding the conditional maximum of
subject to the constraints in Equations (2) and (3). Because we want the conditional maximum place, we use Lagrange multipliers to redefine the likelihood function to include the constraints with the new estimable parameters:
,
where
.
We use an extension of Bock and Aiken’s (1981) EM algorithm to implement the NPMML estimation (see Cohen et al., 2005).
This calibration yields grade-specific population distributions. From these we can readily obtain an estimate of the population moments; for example, the first moment (in the
grades in which it is not fixed) is given by .
Standard error of parametersIn the real world, students are organized into schools, and the average proficiency of students varies across schools and classrooms. In addition, the instruction that students receive also varies by school or classroom. Both of these forces can have an impact on item response. Consider a high-achieving school; the average proficiency will be relatively high, resulting in relatively high probabilities of correct responses on the items.
A-2

More subtly, consider a fourth-grade class in which the teacher enjoys teaching the multiplication of fractions, so she teaches it early and often. Her students will likely perform well on this type of item relative to other mathematics items. Therefore, we should expect to observe different patterns of performance from other teachers and other schools.
This intra-cluster correlation, the similarity of students grouped together in schools or classrooms, reduces the amount of information available in a sample. Here, we apply a Taylor-series expansion to approximate the standard error of estimates from the clustered sample. Note below that the derivation does not require that the error be homogenous across sampling units, nor does it require that the model be correctly specified. The standard error estimate reflects the expected variability if the same model were applied across comparable samples.
When the observations are correlated, as in a clustered sample, the likelihood function is no longer a true likelihood function; the joint likelihood of the observations is no longer the product of the likelihoods of each observation because they neglect the covariance among observations. Psychometricians continue to use estimates based on this “likelihood” function, even though it does not accurately model the real-world process of interest. However, we note that score function constitutes an estimating equation in the sense of Godambe (1960) and Godambe and Thompson (1984), and the parameters of that function continue to hold pragmatic interest in operational testing programs. The inverse of the would-be information matrix, however, no longer provides an acceptable approximation of the variance of those estimates (Binder, 1983; Godambe & Thompson, 1984). For that reason, we use a Taylor-series approximation of the standard error, based upon the work of Binder (1983).
To develop the approximate variance estimator, we begin by re-parameterizing the likelihood function. There are generally two equivalent approaches to estimating constrained maximum likelihood models. The first, which we mention above, is based on the constrained likelihood (by introducing Lagrange multipliers). The second, based on a reduced likelihood function, is obtained by eliminating redundant parameters (Mislevy, 1984). Following Mislevy, we re-parameterize to eliminate redundant parameters, using the information from the constraints to calculate the eliminated parameters in the full model. More precisely, we regard the last two population mass parameters and as functions of the previous (because there are two constraints):
and ,
where
and .
A-3

Of course, only a single constraint is necessary in all but one of the grades.
Let us define the weighted score function as the first derivative of the marginal log-likelihood with respect to the reduced set of parameters of the model
,
,
where is the sampling weight associated with cluster (or PSU, primary sampling unit) , and is the size of cluster (again, for the sake of transparency we ignore stratification).
In our context, the equation
(4)
provides an estimating equation in the sense of Godambe and Thompson (1984) by which we may obtain consistent estimates of the finite population variances using the formulae of Binder (1983). To see this, let us assume that is the solution of the estimating equation (8) in the sample and γ is the solution based on the full finite population or the set of all possible populations of interest. Then in first order we have
.
From this we obtain
and
.
Introducing ( ) as a variance of ( )W across observations and taking the expectation value over , we obtain the covariance matrix of the reduced set of parameters:
.
To estimate of , we use the stratified, between-PSU weighted estimator, which is given by
A-4

,
where and .
Standard error of momentsWhen creating a vertical Rasch scale, we are particularly interested in the estimates of the first moment of the population distribution (fixing this moment in one of the grades to zero). These means reflect the Rasch “linking constant” across grades. The previous section yields the reduced covariance matrix of the population mass parameters as a submatrix of :
.
To obtain the covariance matrix p of the full set of population mass parameters, we
first compute the covariance matrix pab of 1 2( , , , , )Qp p a b via , where
.
In grades in which the mean is estimated rather than fixed, the form of Dab is the same, but without the last row.
Then, with
,
A-5

where, is the dimensional identity matrix. Note that .
Finally, the moment covariance matrix for any grade is calculated. Here,
.
A-6
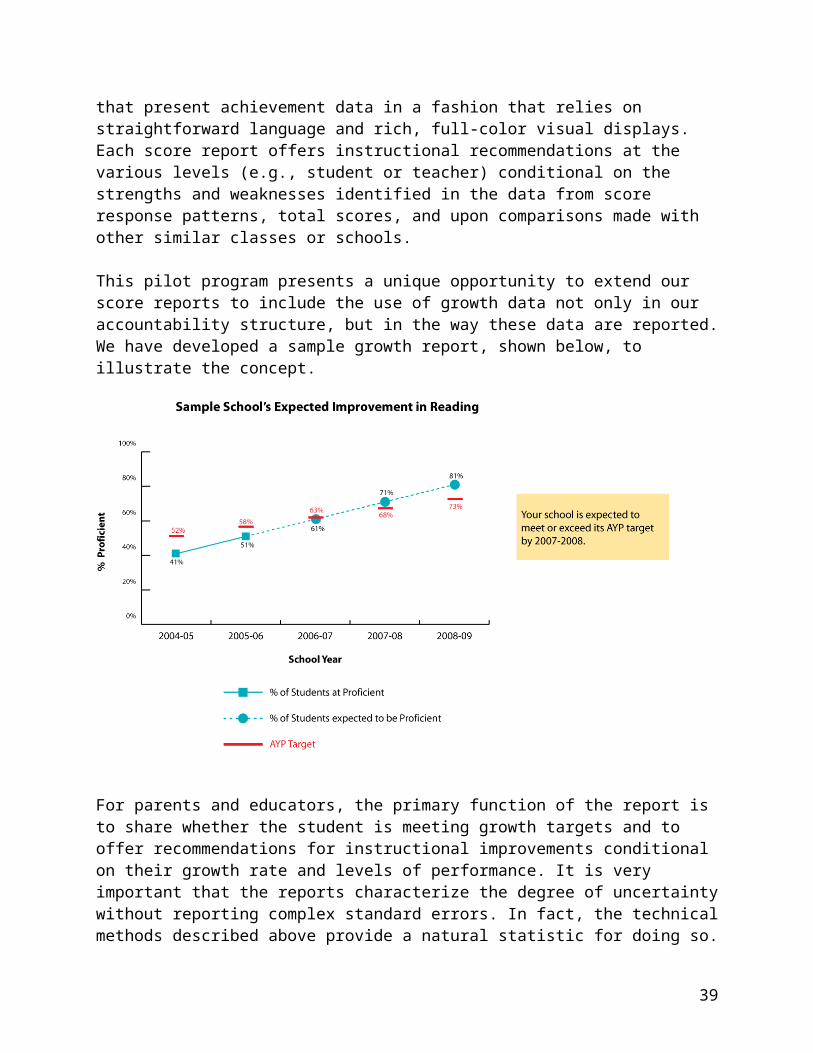
APPENDIX B
Posterior Variance of Linear Mixed Model
Suppose the linear random effect model is:
where is the vector of the fixed effects, is the vector of the random effects, and is independent of , with , . In our case, we have , and I is an identity matrix with dimension defined by the number of observations used to estimate the model. Assuming normality we have:
and the conditional estimate of given y has a mean of , so the estimate of is: .
Some of the parameters are unknown, so replacing them by their maximum likelihood estimates (MLE), we end up with the Best Linear Unbiased Prediction (BLUP) or empirical Bayes estimate as: , where
yRZGZXXRZGZX 111 )ˆ'ˆ('))ˆ'ˆ('(ˆ , and 11 ))ˆ'ˆ('()ˆ( XRZGZXV .
So for a particular case with design matrices and , the fitted value is estimated as
.
The mean squared prediction error (MSPE) is:
Once we obtain and , the probability above cut is .
A-7