has wal-mart buried mom and pop?: the impact of wal … wal-mart buried mom and pop?: the impact of...
TRANSCRIPT

Has Wal-Mart Buried Mom and Pop?: The Impact of Wal-Mart on Self Employment and Small Establishments in the United States*
Russell S. Sobel James Clark Coffman Distinguished Chair
Department of Economics & Entrepreneurship Center West Virginia University
Morgantown, WV 26506-6025 [email protected]
(304) 293-7864 voice / (304) 293-5652 fax
Andrea M. Dean Department of Economics & Entrepreneurship Center
West Virginia University Morgantown, WV 26506-6025 [email protected]
(304) 293-7877 voice / (304) 293-5652 fax
Abstract
Saving traditional small ‘mom and pop’ businesses has been a justification for political and court decisions preventing Wal-Mart from opening new stores virtually everywhere across the United States. We present the first rigorous econometric investigation of how Wal-Mart actually impacts the small business sector. We examine the rate of self-employment and the number of small-employer establishments using both time-series and cross-sectional data. Contrary to popular belief, our results suggest that the process of creative destruction unleashed by Wal-Mart has had no statistically significant long-run impact on the overall size and profitability of the small business sector in the United States.
JEL Classification Codes: L81, D59, C21 *The authors would like to thank David Gay, Randall Childs, and Amy Higginbotham for help in acquiring data, and Jim LeSage and Todd Nesbit for help with the spatial econometric programs we employ. We are indebted also to Peter Leeson, William Trumbull, Edward Lopez, and conference and seminar participants for helpful comments and suggestions.
1
Has Wal-Mart Buried Mom & Pop?: The Impact of Wal-Mart on Self Employment and Small Establishments in the United States “Wal-Mart has indeed set prices low enough to drive mom & pop stores out of business all over the country and kept the prices that low forever.”1 “During the last 20 years, Wal-Mart has moved into communities and destroyed them, wiping out stores, slashing the tax base, and turning downtown areas into ghost-towns.”2 I. Introduction
The argument that Wal-Mart inflicts significant harm on the small ‘mom and pop’
business sector of the U.S. economy is so widely accepted that one of the paper’s opening
quotes is actually from a pro-Wal-Mart article, which goes on to discuss the merits and
efficiency enhancements that result, claiming that “[i]n a free market, large suppliers of
nearly everything will drive most small suppliers out of business.” Wal-MartWatch, one
of the largest Anti-Wal-Mart organizations, features an academic article claiming that in
Iowa, Wal-Mart’s expansion has been responsible for widespread closings of ‘mom and
pop’ stores, including 555 grocery stores, 298 hardware stores, 293 building suppliers,
161 variety shops, 158 women’s stores, and 116 pharmacies.3
Perhaps because of its size and success, unlike most other firms, Wal-Mart’s
ability to open new stores is generally decided within the political process. State and
local economic development authorities, and state courts, in most cases make the final
decisions on whether to allow the entry of a specific new Wal-Mart store. These
decisions are often significantly influenced by arguments about the harm done to small
businesses. For example, in her comments to a local reporter surrounding the city
commission’s vote on allowing a new Wal-Mart store, Aberdeen, South Dakota city
commissioner Pat Klabo stated “If this were a moral decision, we would have voted right
away [in favor of the ‘mom and pop’ stores].”4 Even President Clinton's former
2
Secretary of Labor, Robert B. Reich, writes in the New York Times that Wal-Mart will
turn “main streets into ghost towns by sucking business away from small retailers.”5
However, these previous estimates of the negative impact of Wal-Mart on other
businesses, such as the numbers cited above, are misleading. These estimates come from
a series of applied policy studies that simply compare averages for counties with Wal-
Mart stores to those without.6 While these studies have garnered significant media
publicity and widespread acceptance, they are problematic for several reasons. First, no
econometric methods are employed, making it hard to know if the differences are
statistically significant or caused by the many other economic and demographic factors
that differ between counties with Wal-Mart stores and those without.
In addition, perhaps the biggest problem with these previous studies is that they
analyze data only for directly competing retail business sectors within that specific
county. This is even true for the one published study that does use econometric
techniques to examine the data, Basker (2005a). The idea of creative destruction, first
eloquently stated by Schumpeter (1934) explains how entrepreneurs, like Sam Walton,
are a disruptive force in an economy.7 Schumpeter emphasizes the beneficial aspects of
this process of creative destruction, one in which the introduction of new products results
in the obsolescence or failure of others. Schumpeter points out that while these
inventions do result in job losses in certain areas, they result in overall net gains because
of the positive impacts on economic activity in other areas.8 These impacts are, however,
widespread and often hard to identify.9 Similarly, Wal-Mart’s openings, while resulting
in the failure of some small businesses, create opportunities for new businesses, both
large and small, not only in that local area but in other more distant places as well.
3
Because of their reliance on county level data that considers only directly
competing retail firms, this process of creative destruction is not accounted for in
previous research. If a new Wal-Mart store opens, for example, and it causes a local
hardware store to fail, and subsequently a new art gallery opens in its place, only the
failure of the hardware store is counted by previous studies. The opening of the art
gallery is not reflected in the data because it is not a retail store. In reality, one business
was substituted for another, but this effect would not be reflected in the data because
expansions in sectors that don’t directly compete with Wal-Mart are, by definition,
excluded from their analysis. In addition, because previous studies use county-level data,
virtually all of the general equilibrium impacts that occur at the macroeconomic level—in
other counties, for example—are ignored. And it is likely that these macroeconomic
effects, in the case of Wal-Mart, are enormous.
Finally, previous research is problematic because it generally uses data for all
competing retail businesses, including other large retailers like Kmart, Target, and Home
Depot, who are all clearly negatively impacted by Wal-Mart. Thus, it is unclear to what
extent these previous negative estimates can be used to infer about the impact Wal-Mart
has on the ‘mom and pop’ sector of the economy alone, as Kmart’s store closings would
be counted in the data used in these previous studies.
From an economic standpoint, the real question of interest is how Wal-Mart
impacts the overall size of the small business sector for the entire U.S. economy. To
overcome the problems in previous studies, we use both state and national level data,
restrict our analysis to small firms only, and include all small firms regardless of whether
they are in a directly competing business sector or not.

4
To be clear, there is no question that certain specific small businesses fail because
of the entry of a new Wal-Mart store, and that Wal-Mart has negative impacts on other
major retailers like Kmart. These are the effects other studies have estimated. The
question that remains unanswered, however, is how Wal-Mart has affected the overall
level of small business activity in the U.S. after all long-run readjustments have occurred,
and this is what we estimate.
We proceed by first discussing what economic theory would predict with regard
to Wal-Mart’s impact on small business activity, focusing on Schumpeter’s theory of
creative destruction. We then perform statistical analysis of both aggregate time series
data and state-level cross sectional data using spatial econometric methods to arrive at an
estimate of the impact Wal-Mart has on the small businesses sector in the United States.
II. The Process of Creative Destruction Unleashed by Wal-Mart
Virtually every U.S. citizen has witnessed, first hand, the closing of small downtown
merchants after the arrival of a new Wal-Mart store. Particularly hard hit are small
businesses that used to sell building supplies, toiletries, groceries, clothing, and
electronics. Downtowns with empty storefronts, however, soon see new small businesses
opening in these vacant locations. In Morgantown, West Virginia, for example, a shop
that was once a women’s clothing store has now turned into a high-end restaurant. A
former record and Compact Disc store has been converted into an ice cream parlor.
Other vacated stores have been filled by a coffee shop, an indoor rock climbing facility,
an art gallery, a candle shop, a collectible comic book store, a dinner theatre, an antique
mall, and a new law firm.10

5
This ‘recycling’ of productive resources into new areas is precisely the
mechanism by which the process of creative destruction increases economic efficiency.
Prior to the opening of Wal-Mart stores, downtown retail space was very competitive,
and was generally allocated to those stores providing the type of general merchandise
now sold at Wal-Mart. Only when these valuable store locations were freed up by the
entry of Wal-Mart did they become economically viable locations for many other types
of small businesses. This provided opportunities for new entrepreneurs, opportunities
formerly unviable before these resources were freed from the production of general
merchandise. In the case of the antique mall, what used to be a single retail establishment
is now replaced by approximately 20 to 30 small sole proprietors under this one roof.
Wal-Mart has also eased the traffic flow in highly congested downtown areas.
Businesses whose shoppers need to run in and out quickly are thus more viable in the
downtown area, as their customers no longer have to compete for parking with people
doing their weekly shopping.
Perhaps most importantly, the money consumers save on their general
merchandise purchases because of Wal-Mart’s lower prices is extra money that can be
spent on other goods and services, such as those sold by these new specialty shops.
Basker (2005b) finds that the opening of a new Wal-Mart store results in city-wide price
reductions of approximately two or three percent in the short run and about ten percent in
the long run, giving consumers a significant amount of additional disposable income to
spend on new goods and services. Some of this money will be spent on goods and
services produced by local small businesses, while some will be spent on goods and
6
services produced by small businesses outside the local area expanding small business
activity in other counties and regions.
Thus, while in terms of local business failures the costs of a Wal-Mart store
opening are easy to identify, the benefits are widespread and difficult to identify without
examining more aggregate data.11 In theory, there could be one additional recreation
company (like a whitewater rafting company, for example) in existence solely because of
the time and money Wal-Mart has saved consumers. These new businesses, however, are
not necessarily in the specific county in which Wal-Mart opens, nor in directly competing
business sectors. Other small businesses, like this hypothetical additional whitewater
rafting company, clearly occur in other counties, and in other industries (as with our
examples of new downtown non-retail businesses), and have been completely excluded
from previous studies. This has resulted in a very incomplete picture of how Wal-Mart
actually impacts the overall size of the U.S. small business sector.
Additionally, because Wal-Mart store managers are given some degree of
flexibility in their decisions to carry lines of local merchandise, new markets have opened
for other businesses who now sell products in their local Wal-Mart stores.12 The building
of a Wal-Mart store itself results in significant contracting with small local suppliers. By
increasing the volume of exchange in an area, and through the reallocation of productive
resources, Wal-Mart has a significant, positive impact on the small business sector.
Thus, while it is clear that Wal-Mart does result in some small business failures,
many of which are highly visible, economic theory predicts that there are other impacts
of Wal-Mart that can exert positive and offsetting impacts within the small business
sector. The question is whether, in total, these positive impacts outweigh the small
7
business failures Wal-Mart causes for its direct competitors. In particular, the opening of
a Wal-Mart store causes businesses of various sizes to fail, while at the same time
creating opportunities for new businesses of various sizes. At issue, then, is how the
average size of the businesses that fail compares to the average size of those that open.
As this section has illustrated, based purely on theory alone, it is difficult to
predict whether Wal-Mart exerts a positive or negative impact on the overall size of the
small business sector. There are many effects, working in opposite directions. In the
end, it is an empirical question. We now turn to performing this analysis in the next
several sections of this paper. We begin by exploring the impacts detectable in aggregate
U.S. time series data, and then proceed to a cross-sectional analysis at the state level.
III. The Aggregate U.S. Effects of Wal-Mart in Time Series Small Business Data
Wal-Mart is big enough to have significant macroeconomic effects. Hausman and
Leibtag (2004), for example, find that the Consumer Price Index (CPI) is biased because
of the failure to specifically account for Wal-Mart. These authors find that the CPI-U
‘food at home’ inflation rate is overstated by about 0.32 to 0.42 percentage points, which
they conclude leads to a substantial 15% upward bias in the U.S. inflation rate each
year.13 Thus, because of its sheer size, if Wal-Mart has a negative effect on small
business activity, this effect should be discernable in aggregate U.S. data.
In Iowa, for example, there are roughly 5,000 establishments with one to four
employees, out of a total of 14,000 establishments. Recall that previous estimates
(discussed earlier), so heavily popularized by anti-Wal-Mart groups and the media, cites
Wal-Mart’s expansion as responsible for the failure of 555 grocery stores, 298 hardware
8
stores, 293 building suppliers, 161 variety shops, 158 women’s stores, and 116
pharmacies, for a total of 1,581 business failures. Taken at face value, this would amount
to a failure of 11.3 percent of all business firms in the state of Iowa, or 31.6 percent of all
establishments with one to four employees. Impacts of this magnitude, occurring in all
50 states, would certainly be discernable in aggregate U.S. data. In fact, because Iowa is
a fairly representative state in the sample, an extrapolation would suggest that based on
the estimates from these policy studies, the overall size of the small business sector in the
United States should have fallen by about one-third relative to days prior to Wal-Mart’s
expansion across America. Has this one-third reduction in U.S. small business activity
really happened? If so it should be clearly visible in the raw data on U.S. small business
activity, and this is the first evidence we will examine.
For our analysis we collect data (for the 48 continental U.S. states) on the rate of
self-employment, the number of small establishments, and the number of Wal-Mart
stores (including both Wal-Mart Discount Stores and Wal-Mart Supercenters).14 The rate
of self employment for each state is calculated by taking nonfarm proprietor employment
(i.e., the number of self employed persons) as a percentage of total nonfarm employment
using data from the U.S. Department of Commerce’s Bureau of Economic Analysis.15 As
another measure of the number of small, ‘mom and pop’, businesses we collect data on
the number of retail establishments with one to four employees per 100,000 of state
population from the U.S. Census Bureau. For a check of robustness, we also examine the
number of retail establishments with five to nine employees, also normalized per 100,000
of state population. We arrive at our aggregate measures for the entire U.S. by summing
9
up these state-level data points. Brief data descriptions, with sources and descriptive
statistics for each variable we use, are presented in Appendix 1.
[Figure 1 about here.]
Figure 1 presents data on the expansion and growth of Wal-Mart stores in the
United States alongside data on the rate of self employment. During the period in which
the number of Wal-Mart stores grew from a handful to over 2,500 we see a continuing
and uninterrupted increase in the rate of self employment in the United States. The
overall upward trend in self employment appears just as strong during the 1980s, when
Wal-Mart was expanding the most rapidly, as it did in the 1970s. If Wal-Mart were
having a significant negative impact on self employment in the United States, as is now
generally accepted, we should have seen this measure fall significantly, rather than grow
from 11 percent to 16 percent (almost a 50 percent increase) during the same period when
Wal-Mart grew from a single store in Arkansas into the nation’s largest retailer.
[Figures 2a and 2b about here.]
Figure 2 shows similar comparisons for the number of establishments with 1 to 4
employees (Figure 2a) and 5 to 9 employees (Figure 2b). One problem with this
establishment data series is that in 1998 the U.S. Census Bureau redefined the way they
measure it, causing a discontinuity in the data. The drop in this series in that year is due
to this redefinition, so we present these data as two separate lines in the figures. In both,
we see the same pattern, although different from the pattern seen in Figure 1. While self
employment has been steadily growing in the United States, the number of small
establishments has remained virtually unchanged since the beginning of our data series in
1985. The overall trend is completely flat for both size businesses, both using the old
10
data series, and the new data series. There are just as many small establishments in the
United States today as there were twenty years ago, before the invasion of Wal-Mart.
The aggregate time series data examined in this section would seem to be at
significant odds with the magnitude of the estimates from previous research on this issue.
We see no evidence, in the raw aggregate data on small business activity, that Wal-Mart’s
expansion into the U.S. economy has drastically reduced the rates of self-employment or
the number of small employer establishments. In fact, the raw data seem to pretty clearly
reject the popular hypothesis extrapolated from previous work that Wal-Mart has reduced
the small business sector in the United States by almost one-third. In the raw data this
reduction simply isn’t there. This doesn’t mean that Wal-Mart might not have slowed the
growth of these sectors, or have had a small and/or hard to identify impacts, however, and
that is why in the next section we turn to a more rigorous cross-sectional analysis to see if
this remains true at a less aggregated level.
IV. Cross-Sectional Estimates of the Effect of Wal-Mart on Small Businesses
For our cross-sectional analysis we use data for 2000, maximizing the number of control
variables we can obtain from the 2000 U.S. Census. In addition to examining the level of
small business activity, we also examine the rate of annual growth centered around the
year 2000.16 Thus, our analysis in this section includes both an estimate of how the level
of Wal-Mart stores impacts the level of small business activity, and also how the growth
rate of Wal-Mart impacts the growth rate of small business activity at the U.S. state level.
Prior to beginning our formal empirical analysis, it is worthwhile to examine the
raw data to see whether any relationship can be seen before it is adjusted for other

11
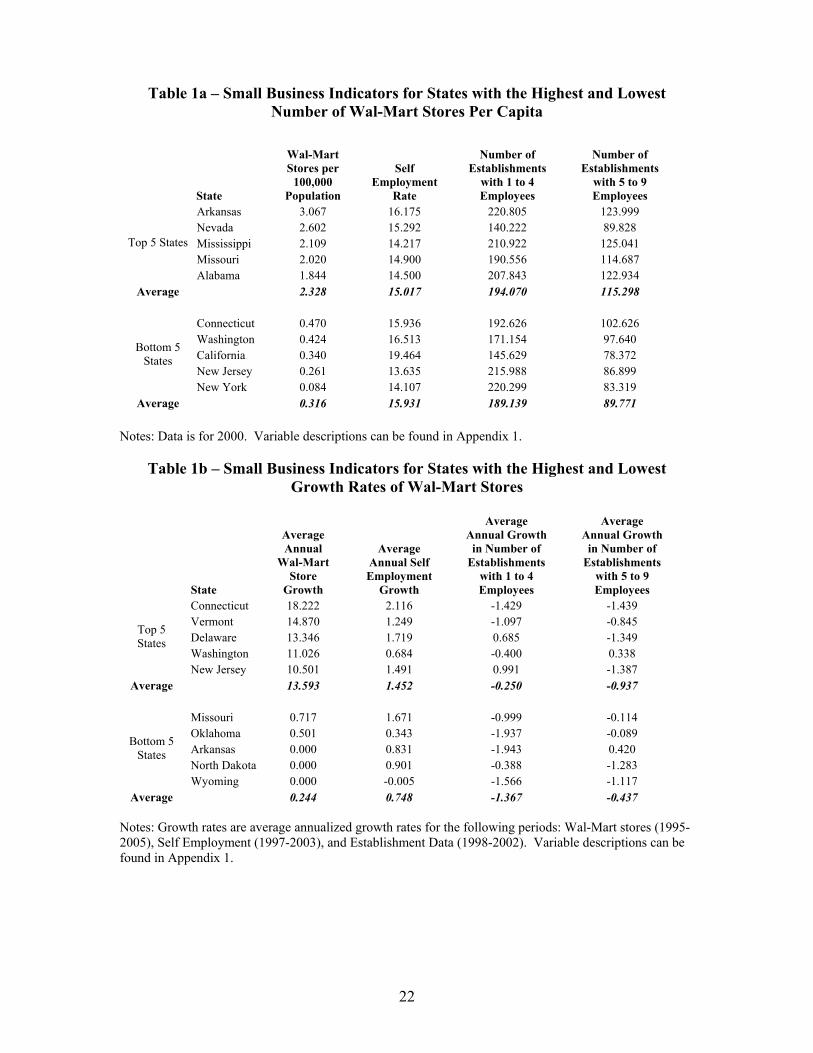
factors. Table 1a presents data on our small business measures for the five states with the
most Wal-Mart stores per capita (per 100,000 population), and the five states with the
fewest Wal-Mart stores per capita. Arkansas, the home state of Wal-Mart, is not
surprisingly the state with the largest number of Wal-Mart stores by this measure. In
Arkansas there are just slightly more than three stores for every 100,000 people. Nevada,
Mississippi, Missouri, and Alabama round out the list of the top five Wal-Mart states.
The states with the fewest Wal-Mart stores per capita are New York, New Jersey,
California, Washington, and Connecticut. The five states with the most Wal-Mart stores
per capita have an average of 2.3 Wal-Mart stores per 100,000 population, while the five
states with the least number of Wal-Mart stores per capita have an average of 0.3 stores
per 100,000 population. Thus, on average, the five states at the top have more than seven
times as many Wal-Mart stores per capita as the five states at the bottom.
[Tables 1a and 1b about here.]
With this large of a difference, if the presence of Wal-Mart stores has a negative
impact on small business activity, then we should see that the states with the most Wal-
Mart stores per capita also have a lower level of small business activity. The final three
columns of data in Table 1a show the values for our small business measures for these
states. While the states with the larger number of Wal-Marts do have a very slightly
lower rate of self employment (15.9 versus 15.0), they actually have more small firm
establishments per capita (194 versus 189 for one to four employees, and 115 versus 90
for five to nine employees).
Table 1b shows this same analysis repeated using the growth rates of these
variables. The five states with the fastest growth of Wal-Mart stores saw an annual

12
increase of 13.6 percent, while the slowest growth states experienced an annual increase
of 0.2 percent in the number of Wal-Mart stores. Do the states with the faster expansion
of Wal-Mart stores have different rates of growth in small business activity? The data
show that exactly the opposite is true for both self employment and one to four employee
firms. Self employment grew at an annualized rate of almost 16 percent in the states with
rapid Wal-Mart expansion, while it grew at an annualized rate of less than one percent in
the states with the lowest Wal-Mart store growth. The growth rate of small-employer
establishments is negative for both categories, but is less negative for the one to four
employee firms in fast Wal-Mart growth states. This pattern is exactly opposite for the
growth rate of five to nine employee establishments, with the faster growth Wal-Mart
states having larger reductions.
[Figures 3, 4a, and 4b about here.]
Tables 1a and 1b rely on comparisons of only the top and bottom five states for
each category. Do these data patterns hold up more generally across all states? Figures 3
and 4 present data for all states on the number of Wal-Mart stores per capita and
measures of small business activity. In Figure 3, the best-fit regression line has a slope
that is positive, but not significantly different from zero, suggesting no negative impact of
Wal-Marts on the rate of self employment. Figure 4 again rejects the hypothesis that
Wal-Mart stores reduce the number of small employer retail establishments (Figure 4a for
1-4 employee establishments, and Figure 4b for 5-9 employee establishments). The slope
of the best-fit regression line is positive in both cases, and in the case of 5-9 employee
establishments, it is actually significantly different from zero, suggesting states with more
Wal-Marts have significantly higher levels of 5-9 employee establishments.

13
Taken as a whole, Tables 1 and 2, and Figures 3 and 4, show that there is clearly
no striking negative impact, at least not one large enough to be seen in the raw data, of
Wal-Mart prevalence, nor of Wal-Mart store growth on state small business activity.
Even for the state of Iowa, cited as having massive reductions in small business activity
caused by Wal-Mart, we find little evidence of this being true in Iowa’s state-level data.
Iowa (not detailed in the tables), falls about in the middle of the pack on all variables, has
a respectable 1.62 percent growth rate of self employment over this period, and has one
of the lower rates of reduction in one to four employee establishments (-0.28 percent)
among the states in the sample. Thus, even for Iowa, a state held as an example of Wal-
Mart’s disastrous impact on small business, we see little evidence in the raw data to
support this claim on a state economy-wide basis. Again, however, while we can reject
the conventional wisdom that Wal-Mart has lowered the small business sector by 30
percent or more, even with the raw data, it is worthwhile to explore whether any smaller
impacts can be found with a more rigorous statistical analysis.
We now turn to regression analysis to control for other factors that might impact
this relationship to see if this conclusion still holds. In addition to the number of Wal-
Mart stores per 100,000 people, we include control variables to help explain the per
capita levels and growth rates of these small businesses measures. These control
variables include median age, percent metropolitan population, percent of population in
poverty, median family income (in thousands), percent of population nonwhite, percent
of population with a college degree, percent of population male, and state land area (in
thousands of square miles). These variables are traditionally used in studies of self
employment to capture the impacts of economic conditions, population density, and

14
demographic variations that help to explain the likelihood of individuals becoming
entrepreneurs and the likelihood of new small business survival.17
We first estimate our models using OLS. However, the OLS estimator can be
shown to be either biased and inconsistent or inefficient when spatial dependence exists
in the data, which is potentially present for both small business activity, and Wal-Mart
location prevalence.18 To the extent that there are unobservable geographic correlations
among either our dependent variable, or the regression error term, spatial econometric
methods must be used to control for these geographic patterns in the data. If the level of
small business activity in a state is impacted by the level of small business activity in
neighboring states, spatial methods must be used to obtain unbiased and efficient
coefficient estimates in the presence of this dependence. Spatial econometric methods
are, in fact, ideally suited to examine this data as they specifically control for regional
trends, spillovers, and geographic correlations that are generally present in retail data.
For readers unfamiliar with spatial econometrics, LeSage and Pace (2004)
provides a nice overview of the advantages of these techniques, however one may simply
think of spatial models as analogous to ARMA time series models, but with the lags
occurring over geographic distances, rather than through time. Thus, for a given state,
one spatial lag refers to all neighboring states, while two spatial lags would refer to the
states who are two states away (or neighbors to its neighbors). We run both a spatial
autoregressive model (SAR) of the form in equation (1), and a generalized spatial model
(SAC) that incorporates both a spatial autoregressive term and a spatially correlated error
structure (analogous to the MA, moving average component, in time series), of the form
in equation (2).

15
Y = ρ⋅W⋅Y + X⋅β + υ (1)
Y = ρ⋅W⋅Y + X⋅β + φ; where φ = (I - λ⋅W)-1 ⋅ υ (2)
where Y is the N x 1 dependent variable, X is the N x K matrix of exogenous variables,
W is the N x N spatial weighting matrix based on first degree contiguity (geographic
neighbors), ρ is the spatial autoregressive coefficient, λ is the spatial error coefficient and
υ is the N x 1 vector of IID random errors. We run these specifications in MATLAB.19
For each model we compute the LM-test statistic, generally used to discern whether the
SAR model is sufficient to remove this spatial dependence, or whether there remains
additional spatial dependence in the residuals of the SAR model that would necessitate
the use of the SAC model. A significant LM-test statistic for an individual SAR model
would imply the need to use the SAC model instead.
In the results that follow, we present both the OLS results and the results from our
spatial estimations that control for any potential geographic dependence in the data.
[Table 2 about here.]
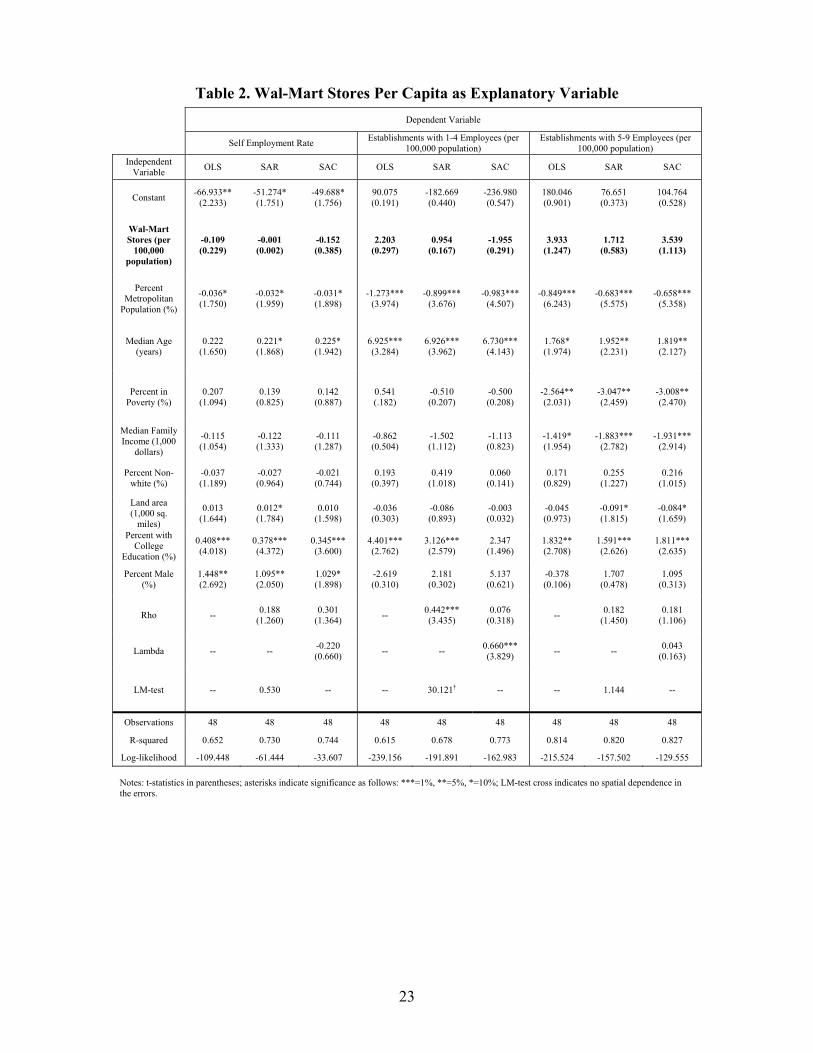
The results of our estimations are presented in Table 2. The first three columns
show the results using the self-employment rate as the dependent variable, while the final
six columns show the results using the measures of small establishments. None of the
coefficient estimates for Wal-Mart prevalence (highlighted near the top of the table) are
statistically significant. A large number of Wal-Mart stores has no significant relation to
small business activity in a state as measured by either self-employment, nor the number
of 1 to 4 and 5 to 9 employee firms. This holds true when looking at the OLS results, as
well as the spatial autoregressive (SAR) and general spatial model (SAC) estimates.
[Table 3 about here.]
16
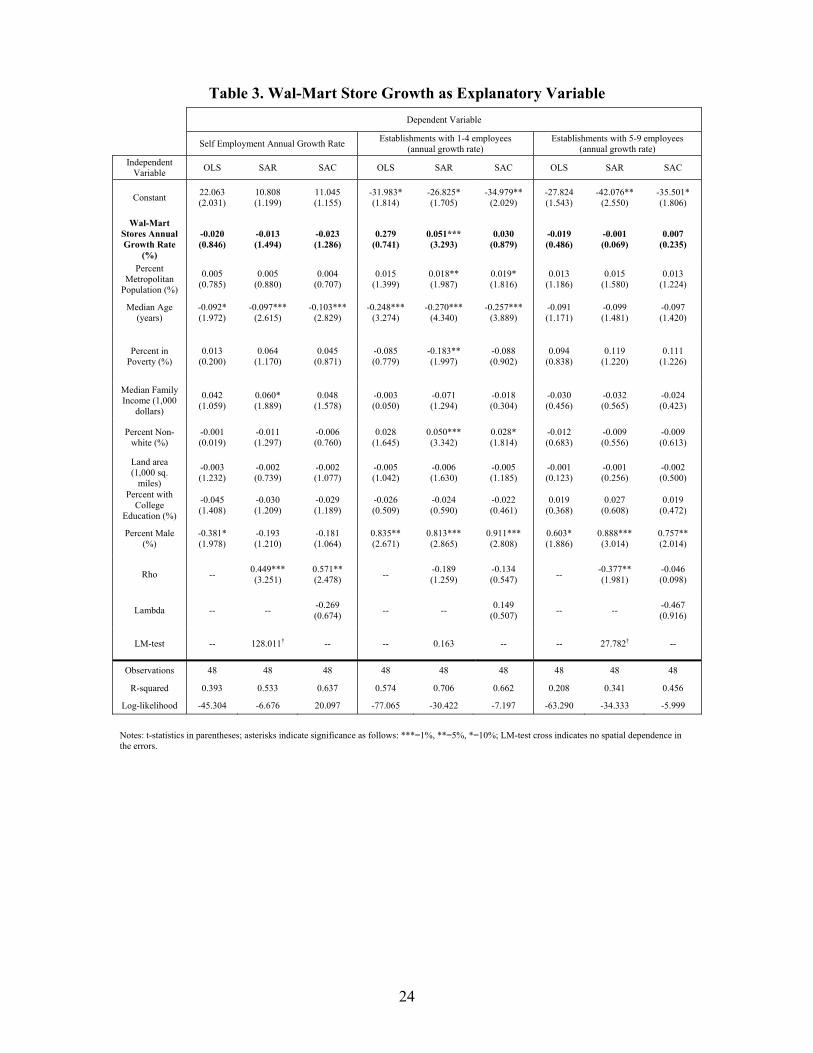
Table 3 shows results similar to those in Table 2, except in these regressions the
annual growth rates are substituted for the levels for both our measures of small business
activity, and the number of Wal-Mart stores. Rather than examining whether the levels
of the variables are correlated, these regressions search for correlations among the growth
rates of these variables. However, even when examining the growth rates, none of the
coefficient estimates for Wal-Mart prevalence (highlighted near the top of the table) are
statistically significant, with one exception. This lone significant result, however, is in
the opposite direction of what might be expected, as it illustrates a positive and
significant relationship between Wal-Mart store growth and the growth rate of the
number of 1-4 employee establishments. This significant result, however, only appears
in the SAR specification, so it is not robust enough to be persuasive. In summary, the
results presented in Table 3 suggest no statistically significant impact of Wal-Mart store
growth on the growth rate of small business activity. Thus, taken as a whole, the
evidence in Tables 2 and 3 strongly rejects the hypothesis that Wal-Mart has a negative
impact on the ‘mom and pop’ sector of the U.S. economy (either in levels or growth).
V. Robustness Checks
In this section we re-estimate our models to check for potential problems with
endogeneity in Wal-Mart store location. Presumably, Wal-Mart could be expanding the
most in areas where unobservable variables are also leading to more rapid growth in
small business activity. Controlling for endogeneity with regard to Wal-Mart store
location is likely to make little difference in the results, however, as prior studies have
rejected endogeneity both through empirical testing and anecdotal evidence directly from
17
Wal-Mart (Hicks and Wilburn 2001, Franklin 2001, Graff 1998, Hicks 2006), although
Basker (2005a) did find some small differences after controlling for it.
We do this in two ways. First, we re-estimate all of the models above using the
five year lagged value of the Wal-Mart store (or growth rate) variable. Not only does this
help to uncover clues suggesting the existence of problems with endogeneity and
simultaneity, but it also addresses any concerns that the true negative impact of Wal-Mart
on small business activity takes time to become visible. Secondly, we employ
instrumental variable methodology to first predict the number of Wal-Mart stores in each
state, and in a second stage, use this predicted value in our regressions. To obtain this
prediction we use the fitted values from a general spatial model (SAC) with Wal-Mart
stores (per capita) as the dependent variable and the explanatory variables used by
previous studies to instrument the number of Wal-Mart stores.20 The results of these two
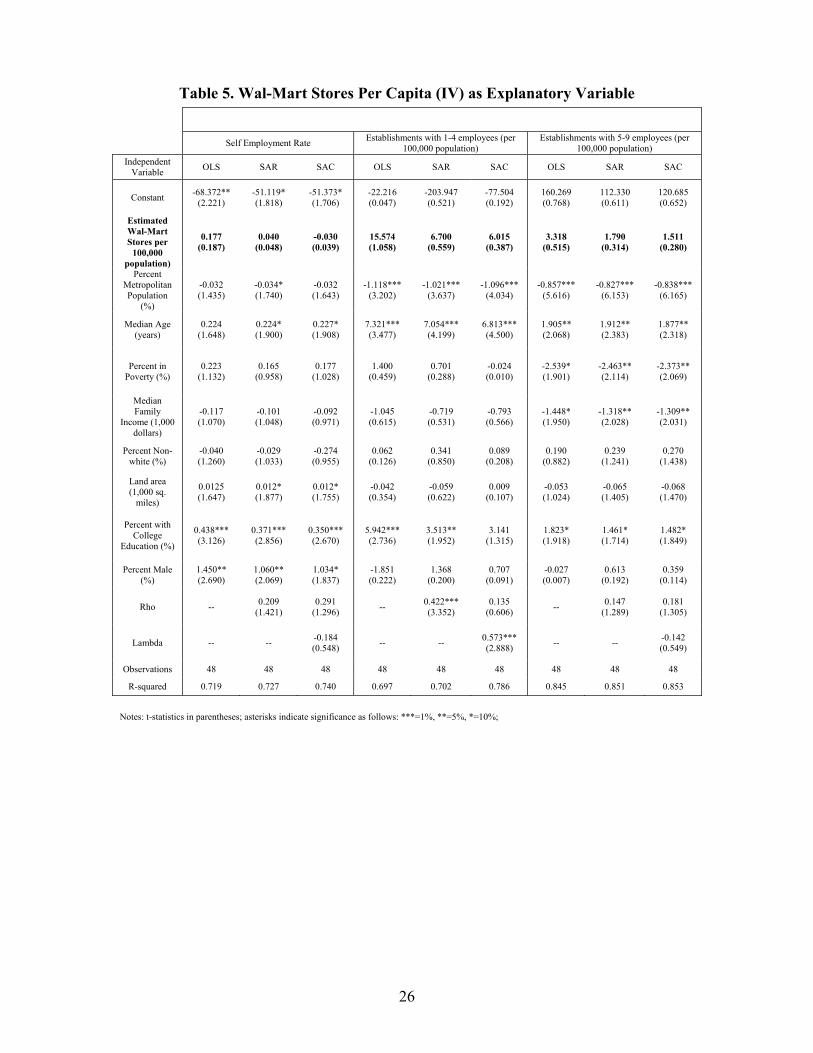
new estimations are presented in Tables 4 and 5.
[Tables 4 and 5 about here.]
Consistent with the findings of previous literature, both of our attempts to control
for endogeneity make little difference. In all 18 specifications, the results are virtually
identical to those presented earlier. In no specification is the number of Wal-Mart stores
per capita significantly related to the level of small business activity.
Thus, the use of spatial methods, growth rates, lagged values, and instrumental
variables does not change our main econometric result: We find no statistically
significant negative impact of Wal-Mart on the overall level and growth of small, ‘mom
and pop’ business activity in the U.S. states. Thus, while Wal-Mart might hurt some
directly competing small retail business in the county in which they open, once the

18
general equilibrium reallocation impacts in other counties and other industries are taken
into account as we do, the size of the small business sector has been unaffected in total.
VI. Are the New Small Businesses ‘Worse’ than the Old Ones?
The evidence clearly suggests that the overall size of the small business sector is
unaffected by Wal-Mart. Some firms fail when a Wal-Mart opens (both large and small)
and new firms arise (both large and small) in their place, taking advantage of the newly
available productive resources. Given we find no significant impact on the overall size of
the small business sector implies that these displaced resources are equally likely to go
back into the small business sector.
One potential criticism, however, is that the new small businesses opening are in
some respects ‘inferior’ to the ones that are closing. For example, a profitable and long-
standing local toy store might go out of business and be replaced by a marginal small
business with very low net income. In this respect, the concern is that while the number
of small businesses is unchanging, the mix is changing unfavorably. Conveniently, this
criticism has a direct empirical prediction, that through time the average sales and/or net
income of small businesses in the U.S. should be falling as Wal-Mart has expanded.
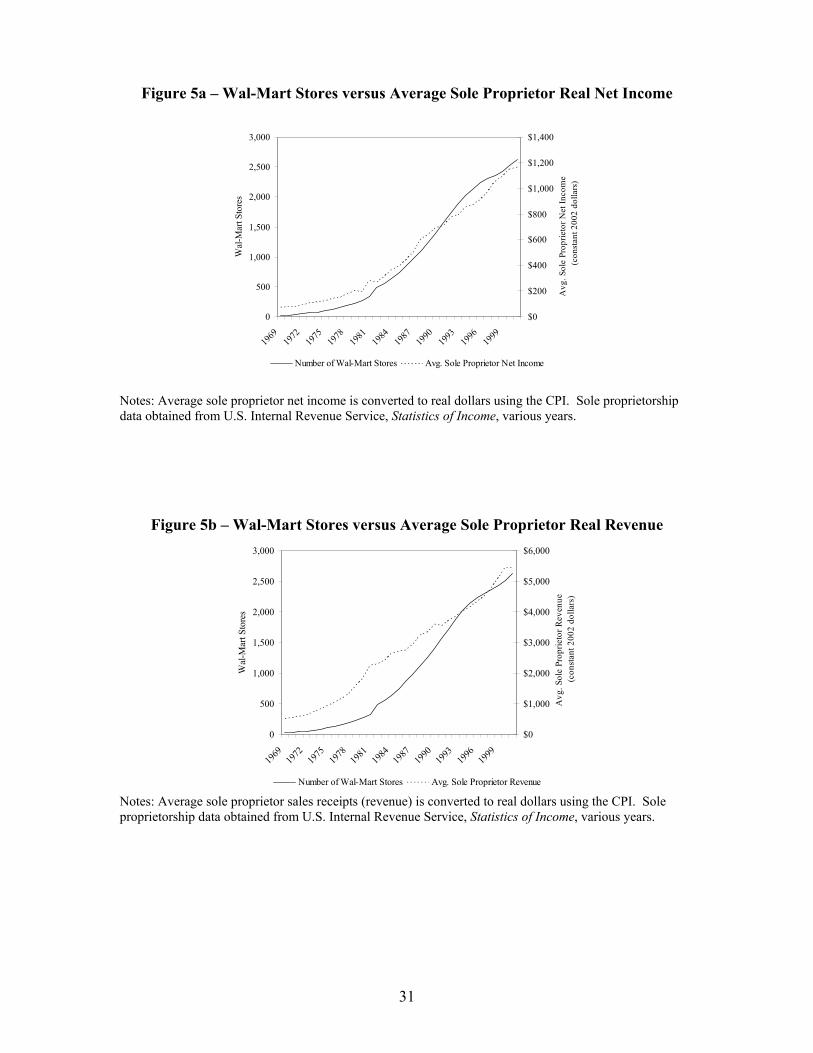
[Figures 5a and 5b about here.]
In Figures 5a and 5b we present evidence on this claim. Figure 5a shows a time
series of the average real net income of sole proprietors in the United States, alongside
the number of Wal-Mart stores. In Figure 5a it is clear that the average real income of
sole proprietors has grown, almost uniformly throughout the period. Small businesses
today are more profitable then ever before, in real terms. Figure 5b shows similar data
19
for the average real sales revenue of sole proprietors. As with net income, there is no
evidence that average revenue has gone down. In fact, like with net income, real sales
revenue among sole proprietors has grown substantially throughout the period as well.
Thus, no only do we find that the total number of small businesses is unaffected,
due to new firms replacing old ones, we can also find no evidence to support the possible
criticism that ‘good’ small businesses are being replaced by ‘worse’ small businesses that
generate less income for their owners. Today, small businesses have larger average sales
revenue and larger average net income (both in real terms), than in the past.
VII. Summary and Conclusion
This paper tests the widely-held belief that Wal-Mart has a large negative impact on the
size of the small business (‘mom and pop’) sector of the U.S. economy. A series of
heavily-popularized applied studies suggests that this negative impact is sizeable, in the
case of Iowa amounting to almost a third of all existing small businesses closing as a
result of Wal-Mart’s entry in the state. If accurate, given the size and growth of Wal-
Mart across the entire United States, this would imply a massive overall impact for the
U.S. economy, and should be reflected in significant overall declines in the level of small
business activity for the economy as a whole.
After examining a battery of different measures of small business activity and
growth, employing different geographic levels of data, examining both time series and
cross section data, and using different econometric techniques, our conclusion is firmly
that there is no evidence for the claim that Wal-Mart has shrunk the size of the small
business sector in the U.S. economy. One reason our results differ from the previous
20
applied literature because we expand our data to include more than simply the directly
competing retail businesses within the specific county in which Wal-Mart opens.
While the entry of a specific Wal-Mart store might cause some individual small,
‘mom and pop’ businesses to fail, our results suggest that these failures are completely
offset by the entry of other new small businesses somewhere else in the economy. This is
consistent with Schumpeter’s theory of creative destruction, explaining how business
failures, by freeing up resources for alternative uses, result in economic progress. The
readjustments caused by Wal-Mart are no different. Anecdotal evidence suggests that
this reallocation allows an opportunity for new entrepreneurial ventures, such as coffee
shops, art galleries, and high-end restaurants, to emerge. Prior to Wal-Mart these types of
firms were at a significant disadvantage in competing for the high-valued downtown
retail space occupied by general merchandisers who fail when Wal-Mart comes to town.
While the total number of small businesses is unaffected, due to new firms
replacing old ones, a possible criticism is that ‘good’ small businesses are replaced by
‘worse’ small businesses that generate less income for their owners. However, we can
find no evidence consistent with this claim either. Average real revenue and net income
for small businesses continued to grow substantially throughout the entire period in
which new small businesses replaced the old ones who failed.
The widespread belief that Wal-Mart hurts the small business sector has been
used repeatedly by politicians and courts as a justification for not allowing the opening of
new Wal-Mart stores. However, the results of our study suggest that claims about harm
to the small business sector are statistically unfounded, and should be given no weight in
future political and court decisions regarding openings of new Wal-Mart stores.
21
Endnotes 1 See DeCoster (2003). 2 See Freeman (2003). 3 See Wal-Mart Watch (2005). 4 See Fennell (2005). 5 See Reich (2005). 6 See Stone (1995), Stone (1997), and Stone, Artz, and Myles (2002). In one of these articles, Stone (1997) concludes that existing retailers in small towns lose up to 47 percent of their sales after 10 years of having a Wal-Mart store nearby. 7 See Darby and Zucker (2003) for a discussion of the process of creative destruction and how incorporating this scientific entrepreneurial process is critical to reformulating endogenous growth models. 8 See Cox and Alm (1992) for a good discussion of the process of creative destruction along with specific examples and data from U.S. history. 9 Failing to account for these ‘unseen’ general-equilibrium effects is, and has long been, a common source of error in many economic arguments, as was noted by 19th century political economist Frederic Bastiat and, more recently, by Henry Hazlitt. The distinction between what is seen and what is unseen was the main argument employed by Bastiat with respect to debunking the popular ‘broken window fallacy,’ [see Bastiat (1995, [ca. 1844])]. This is also a central idea expressed by Henry Hazlitt in his popular book Economics in One Lesson (1979, [1946]). For evidence that free-market institutions do promote investment and growth through these general equilibrium impacts, see Dawson (1998). 10 We are indebted to Donald Boudreaux for his observation that many of these new businesses appear to be what people would consider more ‘culturally enriched’ types of businesses than the ones they replace, like coffee shops where academics meet to discuss ideas, art galleries that increase public awareness of the arts, and ice cream parlors where families share quality family time. 11 Within the political realm, however, allowing the entry of a new Wal-Mart store creates difficult to identify, widespread benefits for consumers and other businesses, while imposing concentrated costs on competing business firms and labor unions. In the public choice / political economy literature this combination is a recipe that favors the organized groups at the expense of the widespread beneficiaries. For a good introduction to the special interest effect created when one side is concentrated and the other widespread, see Chapter 6 in Gwartney, Stroup, Sobel, and Macpherson (2006). For a more rigorous work in a particular case of this phenomenon, see Weingast, Shepsle, and Johnsen (1981). For an interesting analysis of how sometimes opposing groups can form a common interest, see Yandle (1983). 12 Wal-Mart purchases goods and services from more than 61,000 U.S. suppliers, see Wal-Mart, 23 Apr 2005 <http://www.Wal-Martfacts.com/community/nationwide-impact.aspx>. 13 This effect is due to an outlet substitution bias, which in effect ‘links out’ Wal-Mart’s lower prices. 14 Alaska and Hawaii are excluded from our analysis primarily because it is impossible to include them in our spatial econometric models as they have no contiguous neighboring states. 15 For an analysis of the determinants of what makes young individuals more likely to become entrepreneurs (and why success rates may differ) see Schiller and Crewson (1997). 16 Because of changes in the method of data collection and reporting by these agencies, these periods differ slightly for our variables, being the annualized growth rate for 1997 to 2003 for self-employment growth, 1998 to 2002 for small establishment growth, and 1995 to 2005 for the growth of Wal-Mart stores. 17 For example and discussion see Kreft and Sobel (2005). 18 See Anselin (1988), Dubin (1988), Case (1991), Baltagi (2001), and Lacombe (2004) for more on specification and estimation of models with spatial dependence. 19 The spatial econometric toolbox for MATLAB is a public domain set of functions maintained by James LeSage. The toolbox can be downloaded for free at <www.spatial-econometrics.com>. 20 Following the previous literature, the independent variables we include are: distance from Bentonville, Arkansas, (and distance squared), percent metropolitan population, percent of population with a college degree, percent of population in poverty, median family income, state land area, and the top corporate tax rate in the state.
22
Table 1a – Small Business Indicators for States with the Highest and Lowest Number of Wal-Mart Stores Per Capita
State
Wal-Mart Stores per
100,000 Population
Self Employment
Rate
Number of Establishments
with 1 to 4 Employees
Number of Establishments
with 5 to 9 Employees
Arkansas 3.067 16.175 220.805 123.999 Nevada 2.602 15.292 140.222 89.828 Mississippi 2.109 14.217 210.922 125.041 Missouri 2.020 14.900 190.556 114.687
Top 5 States
Alabama 1.844 14.500 207.843 122.934 Average 2.328 15.017 194.070 115.298
Connecticut 0.470 15.936 192.626 102.626 Washington 0.424 16.513 171.154 97.640 California 0.340 19.464 145.629 78.372 New Jersey 0.261 13.635 215.988 86.899
Bottom 5 States
New York 0.084 14.107 220.299 83.319 Average 0.316 15.931 189.139 89.771
Notes: Data is for 2000. Variable descriptions can be found in Appendix 1.
Table 1b – Small Business Indicators for States with the Highest and Lowest Growth Rates of Wal-Mart Stores
State
Average Annual
Wal-Mart Store
Growth
Average Annual Self Employment
Growth
Average Annual Growth
in Number of Establishments
with 1 to 4 Employees
Average Annual Growth
in Number of Establishments
with 5 to 9 Employees
Connecticut 18.222 2.116 -1.429 -1.439 Vermont 14.870 1.249 -1.097 -0.845 Delaware 13.346 1.719 0.685 -1.349 Washington 11.026 0.684 -0.400 0.338
Top 5 States
New Jersey 10.501 1.491 0.991 -1.387 Average 13.593 1.452 -0.250 -0.937
Missouri 0.717 1.671 -0.999 -0.114 Oklahoma 0.501 0.343 -1.937 -0.089 Arkansas 0.000 0.831 -1.943 0.420 North Dakota 0.000 0.901 -0.388 -1.283
Bottom 5 States
Wyoming 0.000 -0.005 -1.566 -1.117 Average 0.244 0.748 -1.367 -0.437
Notes: Growth rates are average annualized growth rates for the following periods: Wal-Mart stores (1995-2005), Self Employment (1997-2003), and Establishment Data (1998-2002). Variable descriptions can be found in Appendix 1.
23
Table 2. Wal-Mart Stores Per Capita as Explanatory Variable
Notes: t-statistics in parentheses; asterisks indicate significance as follows: ***=1%, **=5%, *=10%; LM-test cross indicates no spatial dependence in the errors.
Dependent Variable
Self Employment Rate Establishments with 1-4 Employees (per 100,000 population)
Establishments with 5-9 Employees (per 100,000 population)
Independent Variable OLS SAR SAC OLS SAR SAC OLS SAR SAC
Constant -66.933** (2.233)
-51.274* (1.751)
-49.688* (1.756)
90.075 (0.191)
-182.669 (0.440)
-236.980 (0.547)
180.046 (0.901)
76.651 (0.373)
104.764 (0.528)
Wal-Mart Stores (per
100,000 population)
-0.109 (0.229)
-0.001 (0.002)
-0.152 (0.385)
2.203 (0.297)
0.954 (0.167)
-1.955 (0.291)
3.933 (1.247)
1.712 (0.583)
3.539 (1.113)
Percent Metropolitan
Population (%)
-0.036* (1.750)
-0.032* (1.959)
-0.031* (1.898)
-1.273*** (3.974)
-0.899*** (3.676)
-0.983*** (4.507)
-0.849*** (6.243)
-0.683*** (5.575)
-0.658*** (5.358)
Median Age (years)
0.222 (1.650)
0.221* (1.868)
0.225* (1.942)
6.925*** (3.284)
6.926*** (3.962)
6.730*** (4.143)
1.768* (1.974)
1.952** (2.231)
1.819** (2.127)
Percent in Poverty (%)
0.207 (1.094)
0.139 (0.825)
0.142 (0.887)
0.541 (.182)
-0.510 (0.207)
-0.500 (0.208)
-2.564** (2.031)
-3.047** (2.459)
-3.008** (2.470)
Median Family Income (1,000
dollars)
-0.115 (1.054)
-0.122 (1.333)
-0.111 (1.287)
-0.862 (0.504)
-1.502 (1.112)
-1.113 (0.823)
-1.419* (1.954)
-1.883*** (2.782)
-1.931*** (2.914)
Percent Non-white (%)
-0.037 (1.189)
-0.027 (0.964)
-0.021 (0.744)
0.193 (0.397)
0.419 (1.018)
0.060 (0.141)
0.171 (0.829)
0.255 (1.227)
0.216 (1.015)
Land area (1,000 sq.
miles)
0.013 (1.644)
0.012* (1.784)
0.010 (1.598)
-0.036 (0.303)
-0.086 (0.893)
-0.003 (0.032)
-0.045 (0.973)
-0.091* (1.815)
-0.084* (1.659)
Percent with College
Education (%)
0.408*** (4.018)
0.378*** (4.372)
0.345*** (3.600)
4.401*** (2.762)
3.126*** (2.579)
2.347 (1.496)
1.832** (2.708)
1.591*** (2.626)
1.811*** (2.635)
Percent Male (%)
1.448** (2.692)
1.095** (2.050)
1.029* (1.898)
-2.619 (0.310)
2.181 (0.302)
5.137 (0.621)
-0.378 (0.106)
1.707 (0.478)
1.095 (0.313)
Rho -- 0.188 (1.260)
0.301 (1.364) -- 0.442***
(3.435) 0.076
(0.318) -- 0.182 (1.450)
0.181 (1.106)
Lambda -- -- -0.220 (0.660) -- -- 0.660***
(3.829) -- -- 0.043 (0.163)
LM-test -- 0.530 -- -- 30.121† -- -- 1.144 --
Observations 48 48 48 48 48 48 48 48 48
R-squared 0.652 0.730 0.744 0.615 0.678 0.773 0.814 0.820 0.827
Log-likelihood -109.448 -61.444 -33.607 -239.156 -191.891 -162.983 -215.524 -157.502 -129.555
24
Table 3. Wal-Mart Store Growth as Explanatory Variable
Notes: t-statistics in parentheses; asterisks indicate significance as follows: ***=1%, **=5%, *=10%; LM-test cross indicates no spatial dependence in the errors.
Dependent Variable
Self Employment Annual Growth Rate Establishments with 1-4 employees (annual growth rate)
Establishments with 5-9 employees (annual growth rate)
Independent Variable OLS SAR SAC OLS SAR SAC OLS SAR SAC
Constant 22.063 (2.031)
10.808 (1.199)
11.045 (1.155)
-31.983* (1.814)
-26.825* (1.705)
-34.979** (2.029)
-27.824 (1.543)
-42.076** (2.550)
-35.501* (1.806)
Wal-Mart Stores Annual Growth Rate
(%)
-0.020 (0.846)
-0.013 (1.494)
-0.023 (1.286)
0.279 (0.741)
0.051*** (3.293)
0.030 (0.879)
-0.019 (0.486)
-0.001 (0.069)
0.007 (0.235)
Percent Metropolitan
Population (%)
0.005 (0.785)
0.005 (0.880)
0.004 (0.707)
0.015 (1.399)
0.018** (1.987)
0.019* (1.816)
0.013 (1.186)
0.015 (1.580)
0.013 (1.224)
Median Age (years)
-0.092* (1.972)
-0.097*** (2.615)
-0.103*** (2.829)
-0.248*** (3.274)
-0.270*** (4.340)
-0.257*** (3.889)
-0.091 (1.171)
-0.099 (1.481)
-0.097 (1.420)
Percent in Poverty (%)
0.013 (0.200)
0.064 (1.170)
0.045 (0.871)
-0.085 (0.779)
-0.183** (1.997)
-0.088 (0.902)
0.094 (0.838)
0.119 (1.220)
0.111 (1.226)
Median Family Income (1,000
dollars)
0.042 (1.059)
0.060* (1.889)
0.048 (1.578)
-0.003 (0.050)
-0.071 (1.294)
-0.018 (0.304)
-0.030 (0.456)
-0.032 (0.565)
-0.024 (0.423)
Percent Non-white (%)
-0.001 (0.019)
-0.011 (1.297)
-0.006 (0.760)
0.028 (1.645)
0.050*** (3.342)
0.028* (1.814)
-0.012 (0.683)
-0.009 (0.556)
-0.009 (0.613)
Land area (1,000 sq.
miles)
-0.003 (1.232)
-0.002 (0.739)
-0.002 (1.077)
-0.005 (1.042)
-0.006 (1.630)
-0.005 (1.185)
-0.001 (0.123)
-0.001 (0.256)
-0.002 (0.500)
Percent with College
Education (%)
-0.045 (1.408)
-0.030 (1.209)
-0.029 (1.189)
-0.026 (0.509)
-0.024 (0.590)
-0.022 (0.461)
0.019 (0.368)
0.027 (0.608)
0.019 (0.472)
Percent Male (%)
-0.381* (1.978)
-0.193 (1.210)
-0.181 (1.064)
0.835** (2.671)
0.813*** (2.865)
0.911*** (2.808)
0.603* (1.886)
0.888*** (3.014)
0.757** (2.014)
Rho -- 0.449*** (3.251)
0.571** (2.478) -- -0.189
(1.259) -0.134 (0.547) -- -0.377**
(1.981) -0.046 (0.098)
Lambda -- -- -0.269 (0.674) -- -- 0.149
(0.507) -- -- -0.467 (0.916)
LM-test -- 128.011† -- -- 0.163 -- -- 27.782† --
Observations 48 48 48 48 48 48 48 48 48
R-squared 0.393 0.533 0.637 0.574 0.706 0.662 0.208 0.341 0.456
Log-likelihood -45.304 -6.676 20.097 -77.065 -30.422 -7.197 -63.290 -34.333 -5.999

25
Table 4. Wal-Mart Stores Per Capita (Lagged) as Explanatory Variable
Notes: t-statistics in parentheses; asterisks indicate significance as follows: ***=1%, **=5%, *=10%; LM-test cross indicates no spatial dependence in the errors.
Dependent Variable
Self Employment Rate Establishments with 1-4 employees (per 100,000 population)
Establishments with 5-9 employees (per 100,000 population)
Independent Variable OLS SAR SAC OLS SAR SAC OLS SAR SAC
Constant -68.967** (2.177)
-51.274* (1.751)
-50.110 (1.564)
-8.591 (0.017)
-182.669 (0.440)
-274.594 (0.643)
130.183 (0.609)
76.651 (0.373)
68.145 (0.331)
Wal-Mart Stores (5 yr.
lag per 100,000
population)
0.082 (0.186)
-0.001 (0.003)
-0.045 (0.122)
4.347 (0.633)
0.954 (0.167)
3.624 (0.537)
2.341 (0.791)
1.712 (0.583)
1.937 (0.633)
Percent Metropolitan
Population (%)
-0.033 (1.651)
-0.032* (1.959)
-0.030* (1.813)
-1.249*** (3.942)
-0.899*** (3.676)
-0.932*** (4.389)
-0.869*** (6.358)
-0.683*** (5.575)
-0.681*** (5.555)
Median Age (years)
0.224 (1.648)
0.221* (1.868)
0.223* (1.876)
7.177*** (3.377)
6.926*** (3.962)
6.425*** (4.187)
1.945** (2.121)
1.952** (2.231)
1.972** (2.268)
Percent in Poverty (%)
0.219 (1.142)
0.139 (0.825)
0.152 (0.917)
0.821 (0.274)
-0.510 (0.207)
-0.335 (0.141)
-2.538* (1.959)
-3.047** (2.459)
-3.038** (2.437)
Median Family Income (1,000
dollars)
-0.112 (1.009)
-0.122 (1.333)
-0.110 (1.236)
-0.668 (0.386)
-1.502 (1.112)
-1.274 (0.974)
-1.307* (1.752)
-1.884*** (2.782)
-1.849*** (2.726)
Percent Non-white (%)
-0.039 (1.278)
-0.027 (0.964)
-0.023 (0.805)
0.171 (0.356)
0.419 (1.018)
0.018 (0.043)
0.196 (0.949)
0.255 (1.227)
0.234 (1.093)
Land area (1,000 sq.
miles)
0.012 (1.633)
0.012* (1.784)
0.011 (1.603)
-0.044 (0.368)
-0.088 (0.893)
0.007 (0.078)
-0.055 (1.075)
-0.091* (1.815)
-0.087* (1.714)
Percent with College
Education (%)
0.423*** (4.534)
0.379*** (4.372)
0.355*** (3.923)
4.410*** (3.027)
3.126*** (2.579)
2.879** (2.078)
1.569** (2.497)
1.591*** (2.626)
1.575** (2.497)
Percent Male (%)
1.467*** (0.555)
1.095** (2.049)
1.025* (1.748)
-1.113 (0.128)
2.181 (0.167)
6.010 (0.732)
0.582 (0.155)
1.707 (0.478)
1.888 (0.525)
Rho -- 0.188 (1.260)
0.307 (1.392) -- 0.442***
(3.435) 0.021
(0.090) -- 0.182 (1.450)
0.160 (0.946)
Lambda -- -- -0.258 (0.771) -- -- 0.706***
(4.670) -- -- 0.061 (0.230)
LM-test -- 0.534 -- -- 30.227† -- -- 1.150 --
Observations 48 48 48 48 48 48 48 48 48
R-squared 0.653 0.730 0.745 0.618 0.687 0.779 0.810 0.820 0.823
Log-likelihood -78.969 -61.444 -33.668 -210.950 -191.891 -162.907 -170.594 -157.502 -130.018
26
Table 5. Wal-Mart Stores Per Capita (IV) as Explanatory Variable
Notes: t-statistics in parentheses; asterisks indicate significance as follows: ***=1%, **=5%, *=10%;
Self Employment Rate Establishments with 1-4 employees (per 100,000 population)
Establishments with 5-9 employees (per 100,000 population)
Independent Variable OLS SAR SAC OLS SAR SAC OLS SAR SAC
Constant -68.372** (2.221)
-51.119* (1.818)
-51.373* (1.706)
-22.216 (0.047)
-203.947 (0.521)
-77.504 (0.192)
160.269 (0.768)
112.330 (0.611)
120.685 (0.652)
Estimated Wal-Mart Stores per
100,000 population)
0.177 (0.187)
0.040 (0.048)
-0.030 (0.039)
15.574 (1.058)
6.700 (0.559)
6.015 (0.387)
3.318 (0.515)
1.790 (0.314)
1.511 (0.280)
Percent Metropolitan Population
(%)
-0.032 (1.435)
-0.034* (1.740)
-0.032 (1.643)
-1.118*** (3.202)
-1.021*** (3.637)
-1.096*** (4.034)
-0.857*** (5.616)
-0.827*** (6.153)
-0.838*** (6.165)
Median Age (years)
0.224 (1.648)
0.224* (1.900)
0.227* (1.908)
7.321*** (3.477)
7.054*** (4.199)
6.813*** (4.500)
1.905** (2.068)
1.912** (2.383)
1.877** (2.318)
Percent in Poverty (%)
0.223 (1.132)
0.165 (0.958)
0.177 (1.028)
1.400 (0.459)
0.701 (0.288)
-0.024 (0.010)
-2.539* (1.901)
-2.463** (2.114)
-2.373** (2.069)
Median Family
Income (1,000 dollars)
-0.117 (1.070)
-0.101 (1.048)
-0.092 (0.971)
-1.045 (0.615)
-0.719 (0.531)
-0.793 (0.566)
-1.448* (1.950)
-1.318** (2.028)
-1.309** (2.031)
Percent Non-white (%)
-0.040 (1.260)
-0.029 (1.033)
-0.274 (0.955)
0.062 (0.126)
0.341 (0.850)
0.089 (0.208)
0.190 (0.882)
0.239 (1.241)
0.270 (1.438)
Land area (1,000 sq.
miles)
0.0125 (1.647)
0.012* (1.877)
0.012* (1.755)
-0.042 (0.354)
-0.059 (0.622)
0.009 (0.107)
-0.053 (1.024)
-0.065 (1.405)
-0.068 (1.470)
Percent with College
Education (%)
0.438*** (3.126)
0.371*** (2.856)
0.350*** (2.670)
5.942*** (2.736)
3.513** (1.952)
3.141 (1.315)
1.823* (1.918)
1.461* (1.714)
1.482* (1.849)
Percent Male (%)
1.450** (2.690)
1.060** (2.069)
1.034* (1.837)
-1.851 (0.222)
1.368 (0.200)
0.707 (0.091)
-0.027 (0.007)
0.613 (0.192)
0.359 (0.114)
Rho -- 0.209 (1.421)
0.291 (1.296) -- 0.422***
(3.352) 0.135
(0.606) -- 0.147 (1.289)
0.181 (1.305)
Lambda -- -- -0.184 (0.548) -- -- 0.573***
(2.888) -- -- -0.142 (0.549)
Observations 48 48 48 48 48 48 48 48 48
R-squared 0.719 0.727 0.740 0.697 0.702 0.786 0.845 0.851 0.853

27
Figure 1 – Wal-Mart Stores and Self Employment, U.S. Totals, 1969-2001
0
500
1,000
1,500
2,000
2,500
3,000
1969
1972
1975
1978
1981
1984
1987
1990
1993
1996
1999
Wal
-Mar
t Sto
res
11.0%
12.0%
13.0%
14.0%
15.0%
16.0%
17.0%
Self
Empl
oym
ent R
ate
Number of Wal-Mart Stores Nonfarm Self Employment Rate

28
Figure 2a – Wal-Mart Stores and Retail Establishments with 1 to 4 Employees, U.S. Totals, 1985-2002
0
500
1,000
1,500
2,000
2,500
3,000
1985
1987
1989
1991
1993
1995
1997
1999
2001
Wal
-Mar
t Sto
res
0
100,000
200,000
300,000
400,000
500,000
600,000
700,000
800,000
Num
ber o
f Est
ablis
hmen
ts
Number of Wal-Mart StoresNumber of Establishments with 1 to 4 Employees (1985-1997)Number of Establishments with 1 to 4 Employees (1998-2002)
Notes: In 1998 the U.S. Census Bureau redefined the way they measure the establishment data series, causing a discontinuity in the data from 1997 to 1998. The drop in the level of this series in that year is due to this redefinition, so we present these data as two separate lines in the figure.
Figure 2b – Wal-Mart Stores and Retail Establishments with 5 to 9 Employees, U.S. Totals, 1985-2002
0
500
1,000
1,500
2,000
2,500
3,000
1985
1987
1989
1991
1993
1995
1997
1999
2001
Wal
-Mar
t Sto
res
0
50,000
100,000
150,000
200,000
250,000
300,000
350,000
400,000
450,000
Num
ber o
f Est
ablis
hmen
ts
Number of Wal-Mart StoresNumber of Establishments with 5 to 9 Employees (1985-1997)Number of Establishments with 5 to 9 Employees (1998-2002)
Notes: In 1998 the U.S. Census Bureau redefined the way they measure the establishment data series, causing a discontinuity in the data from 1997 to 1998. The drop in the level of this series in that year is due to this redefinition, so we present these data as two separate lines in the figure.

29
Figure 3 – Wal-Mart Stores versus Self Employment Rates, 2000
0
5
10
15
20
25
0.0 0.5 1.0 1.5 2.0 2.5 3.0 3.5
Wal-Mart Stores Per 100,000 Residents
Non
farm
Sel
f Em
ploy
men
t Rat
e
Notes: See Appendix 1 for variable definitions and sources. Data represent the 48 continental states. Slope of the regression line shown is 0.035 and the t-statistic is 0.062 (which is not statistically significant).

30
Figure 4a – Wal-Mart Stores versus Number of Establishments with 1-4 Employees, 2000
0
50
100
150
200
250
300
350
0.0 0.5 1.0 1.5 2.0 2.5 3.0 3.5
Wal-Mart Stores Per 100,000 Residents
Num
ber o
f Ret
ail E
stab
lishm
ents
with
1-4
Em
ploy
ees
Per 1
00,0
00 R
esid
ents
Notes: See Appendix 1 for variable definitions and sources. Data represent the 48 continental states. The slope of the regression line shown is 8.805 and the t-statistic is 1.052 (which is not statistically significant).
Figure 4b – Wal-Mart Stores versus Number of Establishments with 5-9 Employees, 2000
0
20
40
60
80
100
120
140
160
180
200
0.0 0.5 1.0 1.5 2.0 2.5 3.0 3.5
Wal-Mart Stores Per 100,000 Residents
Num
ber o
f Ret
ail E
stab
lishm
ents
with
5-9
Em
ploy
ees
Per 1
00,0
00 R
esid
ents
Notes: See Appendix 1 for variable definitions and sources. Data represent the 48 continental states. The slope of the regression line shown is 13.027 and the t-statistic is 2.710 (which is statistically significant at the 1% level).
31
Figure 5a – Wal-Mart Stores versus Average Sole Proprietor Real Net Income
0
500
1,000
1,500
2,000
2,500
3,000
1969
1972
1975
1978
1981
1984
1987
1990
1993
1996
1999
Wal
-Mar
t Sto
res
$0
$200
$400
$600
$800
$1,000
$1,200
$1,400
Avg
. Sol
e Pr
oprie
tor N
et In
com
e
(con
stan
t 200
2 do
llars
)
Number of Wal-Mart Stores Avg. Sole Proprietor Net Income
Notes: Average sole proprietor net income is converted to real dollars using the CPI. Sole proprietorship data obtained from U.S. Internal Revenue Service, Statistics of Income, various years.
Figure 5b – Wal-Mart Stores versus Average Sole Proprietor Real Revenue
0
500
1,000
1,500
2,000
2,500
3,000
1969
1972
1975
1978
1981
1984
1987
1990
1993
1996
1999
Wal
-Mar
t Sto
res
$0
$1,000
$2,000
$3,000
$4,000
$5,000
$6,000A
vg. S
ole
Prop
rieto
r Rev
enue
(c
onst
ant 2
002
dolla
rs)
Number of Wal-Mart Stores Avg. Sole Proprietor Revenue Notes: Average sole proprietor sales receipts (revenue) is converted to real dollars using the CPI. Sole proprietorship data obtained from U.S. Internal Revenue Service, Statistics of Income, various years.

32
Appendix 1: Data Description and Sources Variable Name (source) Description Mean (Std. Dev.) Dependent Variables: Self Employment Rate (1)
Annual nonfarm proprietor employment as a percentage of total nonfarm employment (%)
15.95 (2.39)
Self Employment Growth Rate (1)
Average annual growth rate of nonfarm proprietors from 1997 to 2003 (%)
1.27 (0.63)
Establishments with 1-4 Employees (2)
Retail establishments with one to four employees per 100,000 of state population
194.25 (35.66)
Establishments with 5-9 Employees (2)
Retail establishments with five to nine employees per 100,000 of state population
114.90 (21.79)
Establishments with 1-4 Employees (annual growth rate) (2)
Average annual growth rate of retail establishments with one to four employees from 1998 to 2002 (%)
-0.15 (4.90)
Establishments with 5-9 Employees (annual growth rate) (2)
Average annual growth rate of retail establishments with five to nine employees from 1998 to 2002 (%)
-1.82 (3.51)
Independent Variables: Wal-Mart Stores (3) Number of discount stores and supercenters per
100,000 population 1.14 (0.62)
Wal-Mart Store Annual Growth Rate (3)
Average annual growth rate from 1995 to 2005, (%)
4.69 (4.01)
Median Age (4)
Median age of population (years)
35.59 (1.89)
Percent Metropolitan Population (4)
As a percent of state (2000) (%) 68.36 (20.64)
Percent in Poverty (4) Percent of population for whom poverty status is determined (%)
12.02 (3.16)
Median Family Income (4)
Median income per 1000 dollars 48.88 (7.02)
Percent Non-white (4) Percent of total population (%)
22.93 (13.00)
Percent with College Education (4)
Percent of population with a Bachelor’s degree or higher (%)
23.71 (4.35)
Percent Male (4)
Percent of population that is male (%)
49.11 (0.67)
Land Area (5) Land area per 1000 square miles 61.65 (46.81)
1. U.S. Department of Commerce, Bureau of Economic Analysis, State and Local Area Data, Washington, D.C. 2. U.S. Department of Commerce, Census Bureau, 2000 County Business Patterns, Washington, D.C. 3. Wal-Mart, Wal-Mart Annual Report, various years. 4. U.S. Department of Commerce, Census Bureau, Census 2000, Washington, D.C. 5. U.S. Department of Commerce, Census Bureau, Statistical Abstract of the United States, Washington, D.C.

33
References Anselin, Luc. In Spatial Econometrics: Methods and Models. Dordrecht: Kluwer
Academic Publishers, 1988.
Baltagi, B.H. Econometric Analysis of Panel Data. 2nd Ed. Chichester, UK: Wiley, 2001.
Basker, Emek. “Job Creation or Destruction? Labor-Market Effects if Wal-Mart Expansion.” The Review of Economics and Statistics 87 (2005a): 174-183.
Basker, Emek. “Selling a Cheaper Mousetrap: Wal-Mart’s Effect on Retail Prices.” Journal of Urban Economics 58 (2005b): 203-229.
Bastiat, Frederic. “What is Seen and What is Not Seen,” Chapter 1 in Selected Essays on Political Economy, trans. Seymour Cain, ed. George B. de Huszar, with introduction by F.A. Hayek. Irvington-on-Hudson, N.Y.: Foundation for Economic Education, 1995 (ca. 1844).
Case, Anne C. “Spatial Patterns in Household Demand.” Econometrica 59, No. 4 (July 1991): 953-965.
Cox, W. Michael and Richard Alm. “The Churn: The Paradox of Progress.” Federal Reserve Bank of Dallas 1992 Annual Report. Dallas, TX: Federal Reserve Bank of Dallas, 1992.
Darby, Michael R., and Lynne G. Zucker. “Growing by Leaps and Inches: Creative Destruction, Real Cost Reduction, and Inching Up.” Economic Inquiry 41, No. 1 (January 2003): 1-19.
Dawson, John W. “Institutions, Investment, and Growth: New Cross-Country and Panel Data Evidence.” Economic Inquiry 36 (October 1998): 603-619.
DeCoster, Karen. “The Case for Wal-Mart.” Mises Daily Article, Ludwig von Mises Institute 27 Jan 2003. <http://www.mises.org/story/1151>.
Dubin, Robin A. “Estimation of Regression Coefficients in the Presence of Spatially Autocorrelated Error Terms.” The Review of Economics and Statistics 70 (1988): 466-474.
Fennell, Ian H. “Commission Divided on Impact of Possible Supercenter.” Aberdeen American News. 29 Jan 2005.
Franklin, Andrew W. “The Impact of Wal-Mart Supercenters on Supermarket Concentration in U.S. Metropolitan Areas.” Agribusiness 17, No. 1 (Winter 2001): 105-114.
Freeman, Richard. “Wal-Mart Collapses U.S. Cities and Towns.” Executive Intelligence Review 21 Nov. 2003 <http://www.larouchepub.com/other/2003/3045Wal-Mart_iowa.html>.
Graff, Thomas O. “The Locations of Wal-Mart and Kmart Supercenters: Contrasting Corporate Strategy” Professional Geographer 50, No. 1 (1998): 46-57.
Gwartney, James D., Richard L. Stroup, Russell S. Sobel, and David A. Macpherson. Economics: Private and Public Choice, 11th Edition. Mason, OH: Thomson/South-Western, 2006.
34
Hausman, Jerry and Ephraim Leibtag. “CPI Bias from Supercenters: Does the BLS Know That Wal-Mart Exists?” National Bureau of Economic Research, working paper (2004).
Hazlitt, Henry. Economics in One Lesson. Norwalk, CT: Arlington House, 1979 (1946).
Hicks, Michael J. and Kristy Wilburn. “The Regional Impact of Wal-Mart Entrance: A Panel Study of the Retail Trade Sector in West Virginia,” Review of Regional Studies 31, No. 3 (2001): 305-313.
Hicks, Michael J. “Endogeneity Tests and Identification Strategy: The Impact of Wal-Mart on Medicaid, Foodstamps and Labor Markets in Maryland.” Working paper, Air Force Institute of Technology and Marshall University (2006).
Kreft, Steven F. and Russell S. Sobel. “Public Policy, Entrepreneurship, and Economic Freedom.” Cato Journal 25, No. 3 (Fall 2005): 595-616.
Lacombe, Donald J. “Does Econometric Methodology Matter? An Analysis of Public Policy Using Spatial Econometric Techniques.” Geographical Analysis 36, No. 2 (April 2004): 105-118.
LeSage, James P., and R. Kelley Pace (eds.), Introduction to Advances in Econometrics: Volume 18: Spatial and Spatiotemporal Econometrics. Oxford: Elsevier Ltd, (2004): 1-32.
Reich, Robert B. “Don’t Blame Wal-Mart.” New York Times. 28 Feb 2005.
Schiller, Bradley R., and Philip E. Crewson. “Entrepreneurial Origins: A Longitudinal Inquiry.” Economic Inquiry 35 (July 1997): 523-531.
Schumpeter, Joseph A. The Theory of Economic Development. Cambridge, Massachusetts: Harvard University Press, 1934 [1911].
Stone, Kenneth E., "Impact of Wal-Mart Stores and other Mass Merchandisers in Iowa, 1983-1993." Economic Development Review (Spring 1995).
Stone, Kenneth E. “The Status of Retail Trade in Iowa’s Small Towns After 10 Years of Wal-Mart Stores.” Unpublished manuscript, Iowa State University (1997).
Stone, Kenneth E., Georgeanne Artz, and Albert Myles. “The Economic Impact of Wal-Mart Supercenters on Existing Businesses in Mississippi.” Mississippi State University Extension Service (Fall 2002).
Wal-Mart Watch. "Grand Opening: With a New Store Opening Nearly Every Day, What is Wal-Mart’s Impact on America’s Small Businesses?" Wal-Mart Watch: Low Prices at What Cost? Wal-Mart Watch Annual Report, Center for Community and Corporate Ethics, 2005: 10.
Weingast, Barry R., Kenneth A. Shepsle, and Christopher Johnsen. “The Political Economy of Benefits and Costs: A Neoclassical Approach to Distributive Politic.” Journal of Political Economy 89, No. 4 (1981): 642-664.
Yandle, Bruce. “Bootleggers and Baptists: The Education of a Regulatory Economist.” AEI Journal on Government and Society (1983): 12-16.