harrah’s entertainment, inc. annual report...
TRANSCRIPT

Harrah’s Entertainment, Inc. Annual Report 45
2 0 0


The strongest name in gaming is getting even stronger.
Harrah’s Entertainment, Inc. has the strongest balance sheet in the casino industry. For years we’ve leveraged that strength into
earnings growth through prudent capital investments and strategic acquisitions. In 2005, we’re on the verge of completing the
largest acquisition in gaming industry history and opening a new chapter of robust growth as the world’s largest casino operator.

h_9351_narrative 3/21/05 11:08 AM Page 2
In 2004, we owned three of the best brands in gaming.

h_9351_narrative 3/21/05 11:09 AM Page 3
We’re adding another in 2005.
Harrah’s. Horseshoe. The World Series of Poker. Each brand captures the excitement and flavor of casino
entertainment as few others can. Soon Caesars, the world’s best-known luxury gaming name, will be joining
our peerless brand portfolio. And as we learn more about the power of these brands, we’ll be using them to
introduce more customers than ever to our company—across the nation and around the world.

Harrah’s shares returned 37.7 percent in 2004.

In 2005, we’ll continue to invest our capital wisely in
growth opportunities.
In 2004 we paid our shareholders the gaming industry’s largest dividend, which, coupled with stock
appreciation, resulted in a total return to shareholders of 37.7 percent. Even after the Caesars acquisition,
we expect to retain the industry’s only investment-grade credit rating. That means we can continue to
borrow at lower rates than our competitors and invest that capital in high-return growth opportunities.

In 2004, Harrah’s industry-leading network included 28 properties in 12 states.
Current Harrah’s Entertainment Properties
Caesars Entertainment Properties
Harrah’s Entertainment has two properties contracted for sale that are not pictured. In addition, Binion’s Horseshoe in Las Vegas, Nevada, is not pictured because the Harrah’smanagement contract for this property expires in March 2005.
Caesars plans to sell four properties that are not included. Two Caesars-operated casinos in Nova Scotia, Canada, are not pictured either.

By mid-2005, we expectto manage more than
40 properties in North America.
With the Caesars acquisition, the most geographically diverse casino network will grow even broader. We’ll
increase our presence in key markets such as Las Vegas, Atlantic City and Mississippi. And we’ll be able to
offer more customers more places to play and earn recognition and rewards than any other casino operator
in the world.

Operation Bet Smart®:Know When to Stop Before You Start
Project 21®
Unattended Children Policy
We’ve long been recognized as theindustry’s responsible gaming leader.
Employee Task Force
Self RestrictionSelf-Exclusion Program
Development of the U.S. gaming industry’sfirst ever broadcastadvertising campaign
National Helpline
Refusing to cash welfare and unemployment checks
The Code of Commitment and Marketing and Advertising Codes

In 2005, we’re taking ourefforts to the next level.
Seventeen years ago, Harrah’s became the first company in the gaming industry to recognize and take steps
to prevent problem gambling. In 2005, we’re taking that commitment to another level. Responsible Gaming
Ambassadors—specially trained Harrah’s employees—will be available at our casinos to talk with customers
who have expressed concerns about their gambling activities. Responsible gaming is more than a concept at
Harrah’s—it’s a cornerstone of our culture.

In 2004, Harrah’s led the gamingindustry in customer service.

We’re bringing that commitmentto a wider audience in 2005.
In 2004, these and other members of the Harrah’s Laughlin team once again led the company in customer-
service improvements. But each of our 28 properties can be proud of record year: We paid nearly $20 million
in customer-service bonuses to our front-line employees in 2004. In the third and fourth quarters, every Harrah’s
property qualified for customer-service bonuses for the first time in our history. We believe the employees of
Caesars share our commitment to delivering great service, and we look forward to achieving new customer-
service milestones with them in 2005 and beyond.

To Our Shareholders: In the late 1990s, Harrah’s Entertainment implemented
a growth strategy that focused on enhancing player loyalty to increase the
Harrah’s share of our customers’ annual gaming budgets. We developed
sophisticated database marketing techniques to recognize and provide
customized rewards to our guests. We trained the gaming industry’s best
employees to deliver great customer service. And we leveraged the power
of the Harrah’s and Total Rewards brands. Combined, these efforts drove
organic growth and established the capabilities necessary to support
acquisitive growth.
Since then, this strategy has produced same-store sales gains in 23 of 24
quarters—a remarkable feat given challenges that included a post-9/11 travel
slump, slow economic recovery and new competition in several markets.
We believe our share of customer gaming budgets has climbed from
36 percent in 1998 to more than 43 percent. And the profits derived from
our same-store growth have enabled us to upgrade our existing property
portfolio and make strategic acquisitions that have catapulted Harrah’s to
its position as America’s preeminent distributor of casino entertainment.
We are now set for the next, and I believe most exciting, stage in the
evolution of our company. By year-end 2005, we will manage an unparalleled
portfolio of luxury, high-end and mid-level gaming brands that will offer
customers a variety of gaming options provided through an unmatched
distribution system.
I’ll describe our future in more detail shortly. But first, I’d like to review
2004—a rewarding and seminal year in our company’s history.
We posted record annual revenues and earnings, thanks to strong
performances by properties in key markets, prudent capital spending
and the successful integration of three Horseshoe Gaming facilities into
our portfolio. Customer-satisfaction scores—a key indicator of increased
loyalty to our brands—rose to unprecedented levels in 2004, the first
year in Harrah’s history in which employees from every property earned
bonuses for delivering superior customer service. And in our first year as
“We are now set for the next, and I believe mostexciting, stage in the evolution of our company. By year-end 2005, we will manage an unparalleledportfolio of luxury, high-end and mid-level gamingbrands that will offer customers a variety ofgaming options provided through an unmatcheddistribution system.”Gary W. Loveman, Chairman, CEO and President

Harrah’s Entertainment, Inc. 2004 Annual Report 13
host of the World Series of Poker, player participation soared and the
tournament scored a television-ratings triumph.
Most significantly, we agreed to buy Caesars Entertainment, Inc. The largest
transaction in gaming-industry history, this $9.4 billion acquisition will create
the world’s preeminent distributor of casino entertainment and provide our
company with an internationally renowned luxury brand. When the transaction
closes—most likely during the second quarter of 2005—our annual revenues
will roughly double. Our industry-leading distribution network will grow to
about 45 operations in the United States and abroad. We will greatly expand
our presence in Las Vegas, Atlantic City and Mississippi, three major domestic
gaming markets that offer both stable tax and regulatory environments and
excellent growth opportunities. We will offer more players more places to
play than any other company in our industry. Customers from every price
segment will be able to choose from the wide range of entertainment
options offered by the best brands in gaming. And Caesars will provide us
with a powerful, highly recognized premium brand as we pursue exciting
expansion opportunities abroad. In short, the Caesars acquisition will be a
transformational event for our company, one that I expect will position us
for solid growth for many years to come.
Reaching Record Revenue, Earnings, and Same-Store Sales;Benefiting from Horseshoe IntegrationIn 2004, our revenues rose 15.2 percent to a record $4.55 billion, with
diluted earnings per share increasing 23 percent to a record $3.26. Property
EBITDA (earnings before interest, taxes, depreciation and amortization) rose
16 percent to $1.22 billion, also a record. Same-store revenues climbed a
robust 6.5 percent.
Our shareholders benefited, as Harrah’s stock price rose more than
34 percent in 2004 to easily eclipse the performance of the S&P 500 Index.
As a testament to our financial strength, we retained the only investment-
grade credit rating among casino operators even with the announcements
of the Caesars acquisition and a 10 percent increase in what was already
our industry’s largest dividend. Once again, we were the only U.S. gaming
company named to the Dow Jones Sustainability World Index, the fourth
consecutive year we’ve been so honored. The World Index recognizes a
select group of businesses for their ability to create sustainable shareholder
value and for their strengths in corporate governance, corporate citizenship
and environmental policy and management.
The combined strengths of our Total Rewards loyalty program and industry-
leading distribution strategy were clearly demonstrated in 2004. Tracked play,
or play by customers using Total Rewards cards, increased 11.9 percent.
We saw a significant increase in customers moving up from the Total Rewards
Gold level to Platinum, Diamond and Seven Stars status. Membership in the
Seven Stars tier alone soared 63 percent from its introduction in June through
year-end 2004, as customers took advantage of its unprecedented benefits.
Cross-market play—the amount of gaming revenue generated by customers
outside their home markets—rose 18 percent to $1.44 billion. A key
contributor to our strong performance in Southern Nevada, cross-market
play drove combined Property EBITDA for Harrah’s Las Vegas, the Rio
All-Suite Hotel & Casino and Harrah’s Laughlin to a 30.8 percent gain. NET INCOME/(LOSS) in millions
’02’01 ’03 ’04’00
$367.7
$292.6
$235.0$209.0
$(12.1)

14 Harrah’s Entertainment, Inc. 2004 Annual Report
Harrah’s New Orleans performed strongly as well, with Property EBITDA
rising 19.6 percent. With a $150 million, 450-room hotel scheduled to open
in the first quarter of 2006, we believe Harrah’s New Orleans is just starting
to realize its full potential. In Atlantic City, a month-long strike by hotel and
restaurant workers during the fourth quarter impacted results at our
Harrah’s and Showboat properties. With contract negotiations settled, we
expect better results in 2005. We’re particularly excited about the broader
entertainment offerings that will be available at the Showboat starting this
summer when its House of Blues opens.
Our three Horseshoe properties in Indiana, Mississippi and Louisiana
collectively added 13 cents to 2004 adjusted earnings per share since
that acquisition closed on July 1, 2004. We have integrated many of our
systems and capabilities at these three properties and are on track to
meet our synergy savings target of $36 million by July 2006. As a first step
to leveraging the strength of the Horseshoe brand, the Bluffs Run Casino
in Iowa will become Horseshoe Council Bluffs when its expansion and
renovation are completed in the first quarter of 2006.
Taking Our Business to the Next Level with the Caesars AcquisitionWith Horseshoe, Harrah’s and Caesars, we will operate in three distinct
segments of the gaming market. We’ve interviewed nearly 14,000 customers
to understand what these brands mean to them, and we will use
that knowledge to build on the unique identity and appeal of each.
Caesars will give us four additional resorts in Las Vegas, a strong
growth market. When the acquisition is completed, we will
become the second-largest operator on the Las Vegas Strip, operating six
casino resorts around the important intersection of Flamingo Road and Las
Vegas Boulevard.
From a capital-spending perspective, the acquisition couldn’t be timed better.
Thanks to the vision of Caesars Chief Executive Officer Wally Barr and his
team, Caesars has invested $1.75 billion in its properties over the past four
years, and this cycle of expansion and improvements positions these assets
well. Among the most prominent examples is a 949-room hotel tower and
related amenities that will open this summer at flagship property Caesars
Palace in Las Vegas. Eighteen months of construction are nearly complete,
and the property is primed for growth.
We will act swiftly to combine our companies. Veteran Harrah’s executive
John Boushy has assembled a team of Caesars and Harrah’s executives, as
well as outside experts, to plan an integration effort that combines the best
people, practices and policies of both companies. We have learned there are
many more similarities than differences between our two companies.
Particularly gratifying was the discovery that Caesars’ people are as eloquent
and passionate as we are about the importance of customer satisfaction.
They are absolutely convinced they need to provide great experiences for
their customers because that translates into increased loyalty and profits.
We’ve also found they have a customer database that contains a wealth of
information on the service and products their customers expect. The Caesars
people are eager to use the technological capabilities we’ve developed to
analyze that treasure trove of data and enhance the customer experience
Caesars will give us the industry’s premierluxury brand and four additional resorts in
Las Vegas, a strong growth market.
$1,216.9
$1,049.3$1,056.7
$895.2$807.5
PROPERTY EBITDA in millions
’02’01 ’03 ’04’00

Harrah’s Entertainment, Inc. 2004 Annual Report 15
at each of their properties. Among the deal’s greatest opportunities is the
potential of boosting Caesars’ property performances through the use of
the sophisticated marketing tools we’ve developed at the corporate level.
Shareholders of Harrah’s and Caesars are scheduled to vote on the merger
after this report goes to press. We are optimistic they will see the enormous
benefits of this transaction and that we will be able to receive the requisite
regulatory approvals to complete the deal in the 2005 second quarter.
Eyeing Expansion into the U.K. and Asian MarketsWith its broad international appeal, the Caesars brand will prove a powerful
asset as we eye expansion abroad. In the United Kingdom, Parliament is
expected to vote in April 2005 on legislation that would authorize a total of
24 casinos divided among small, medium and large operations. If the legislation
passes, the U.K. government will then move to choose developers and sites.
We are focusing our efforts on the largest projects, and Caesars is pursuing a
$600 million casino at London’s Wembley Stadium.
With the success of gaming in Macao, a trend toward liberalizing casino
entertainment has been gathering steam in Singapore, Thailand and
elsewhere in Asia. We intend to be active in the Asian markets and are
participating in the bidding process in Singapore. Singapore’s accessibility,
high literacy rate, stable government and vibrant economy would make it
the ideal location for our Asian headquarters.
In the United States, we continue to pursue a number of long-term
tribal opportunities in California, Alabama and New York. Caesars and
the St. Regis Mohawk Tribe have already signed agreements to develop and
manage a casino in New York’s Sullivan County pending the receipt of various
regulatory approvals. We’re pleased to inherit this relationship and excited
about this prospect in the Catskills region. If successful, we will be building
on the strong track record established among our existing tribal partners.
Most recently, the Ak-Chin Indian Community and the Eastern Band of
Cherokee Indians extended our management contracts for Harrah’s Ak-Chin
Casino Resort and Harrah’s Cherokee Casino & Hotel, respectively.
Maintaining a Leadership Role in Responsible GamingAs we are poised to become the world’s largest gaming company, main-
taining and strengthening our focus on responsible gaming has never been
more essential. We have long been pioneers in this area. A number of the
responsible-gaming programs we developed have since been adopted by
others in our industry.
In 2004, we enhanced our employee training efforts and launched a
responsible-gaming television campaign. This year, we will introduce new
technology to support our nationwide self-exclusion policy. It will help us to
identify patrons who have voluntarily excluded themselves from play if they
use their Total Rewards card, attempt to get credit or participate in any
activity that requires them to show a driver’s license.
$8,585.6
$6,578.8$6,350.0$6,128.6
$5,166.1
TOTAL ASSETS in millions
’02’01 ’03 ’04’00

16 Harrah’s Entertainment, Inc. 2004 Annual Report
Enhancing the World Series of Poker Brand;
Investing in Successful Property Expansions
I’m also very pleased with the success of the World Series of Poker. We
acquired the rights to this brand in 2004, just in time to host its 35th anniversary.
More than 2,500 players—three times the prior year’s total—participated in the
final event. The World Series of Poker emerged as one of ESPN’s most widely
viewed programs and has proved profitable for us as well. In addition to strong
and growing World Series of Poker merchandise sales, the tournament has
raised awareness of the Harrah’s name among table gamers and introduced a
new audience to gaming entertainment. In 2005, most of the tournament play
will move to the Rio, and we are introducing World Series of Poker Circuit
events at Harrah’s facilities in Atlantic City, San Diego, New Orleans, Las Vegas
and Lake Tahoe to promote the brand.
During 2004 we made great strides in the ongoing process of strengthening
the quality of our physical product in major markets. Capital spending in 2004
totaled $703 million, and we expect to invest $800 million to $900 million in 2005.
Among the major projects in 2004 was an expansion at Harrah’s St. Louis, where
we regained the market lead as the year ended. A $126 million expansion will be
completed at Harrah’s North Kansas City during 2005.
Honoring a Key Contributor to Our SuccessBefore signing off, I would like to offer my sincere congratulations to my
predecessor, colleague and friend Phil Satre. Phil retired as chairman of the
board on January 1 after a remarkable 25-year career with Harrah’s. Over
that time, he helped us evolve from a small casino company to one of the
world’s largest gaming corporations. To recognize his remarkable legacy,
the Harrah’s Foundation pledged $1 million to help endow the Philip G. Satre
Chair in Gaming Studies at the University of Nevada, Reno. Thanks to Phil’s
reputation, many of his peers at other gaming and hospitality companies
have contributed to the endowment as well. I’m delighted his name will be
associated with the ongoing efforts of this world-class gaming studies
program. And while I miss seeing him often in our offices, I still reach out
frequently to Phil for his advice and insight.
In closing, I’d like to thank you for your support of Harrah’s Entertainment.
We will continue to execute on the strategy that has led to our success—
hiring and encouraging the best people to deliver great service to the millions
of guests who visit us across an unparalleled geographic distribution system.
We will continue to innovate in technology and marketing to provide even
higher-value customized reasons for our guests to increase their loyalty to
Harrah’s Entertainment. At the same time, we promise to do our utmost to
maximize the strength of the Harrah’s, Horseshoe and Caesars brands, to
pursue exciting new growth opportunities around the world and to reinforce
our position as the undisputed leader in casino entertainment.
Sincerely,
Gary W. Loveman
Chairman, Chief Executive Officer and President
17.5%16.0%
19.3%
12.9%
(3.2)%
RETURN ON EQUITY based on continuing operations
’02’01 ’03 ’04’00

SECURITIES AND EXCHANGE COMMISSIONWASHINGTON, D.C. 20549
FORM 10-K(Mark One)
� ANNUAL REPORT PURSUANT TO SECTION 13 OR 15(d) OF THESECURITIES EXCHANGE ACT OF 1934
FOR THE FISCAL YEAR ENDED DECEMBER 31, 2004
or
� TRANSITION REPORT PURSUANT TO SECTION 13 OR 15(d) OF THESECURITIES EXCHANGE ACT OF 1934
Commission File No. 1-10410
HARRAH’S ENTERTAINMENT, INC.(Exact name of registrant as specified in its charter)
Delaware 62-1411755(State of incorporation) (I.R.S. Employer Identification No.)
One Harrah’s Court 89119Las Vegas, Nevada (zip code)
(Address of principal executive offices)
Registrant’s telephone number, including area code:(702) 407-6000
SECURITIES REGISTERED PURSUANT TO SECTION 12(b) OF THE ACT:
Title of each class Name of each exchange on which registered
Common Stock, Par Value $0.10 per share NEW YORK STOCK EXCHANGECHICAGO STOCK EXCHANGEPACIFIC EXCHANGEPHILADELPHIA STOCK EXCHANGE
SECURITIES REGISTERED PURSUANT TO SECTION 12(g) OF THE ACT:None
Indicate by check mark whether the registrant (1) has filed all reports required to be filed by Section 13or 15(d) of the Securities Exchange Act of 1934 during the preceding 12 months (or for such shorter periodthat the registrant was required to file such reports), and (2) has been subject to such filing requirements forthe past 90 days. Yes � No �
Indicate by check mark if disclosure of delinquent filers pursuant to Item 405 of Regulation S-K is notcontained herein, and will not be contained, to the best of registrant’s knowledge, in definitive proxy orinformation statements incorporated by reference in Part III of this Form 10-K or any amendment to thisForm 10-K. �
The aggregate market value of the voting and non-voting common equity held by non-affiliates of theregistrant as of June 30, 2004, based upon the closing price of $54.10 for the Common Stock on the NewYork Stock Exchange on that date, was $5,994,497,266.
Indicate by check mark whether the registrant is an accelerated filer (as defined in Rule 12b-2 of theExchange Act). Yes � No �
As of January 31, 2005, the Registrant had 112,985,228 shares of Common Stock outstanding.
DOCUMENTS INCORPORATED BY REFERENCE
Portions of the definitive Proxy Statement for the 2005 Annual Meeting of Stockholders, which will befiled within 120 days after the end of the fiscal year, are incorporated by reference into Part III hereof.

PART I
ITEM 1. Business.
Overview
Harrah’s Entertainment, Inc., a Delaware corporation, is one of the largest casino entertainmentproviders in the world. Our business is conducted through a wholly-owned subsidiary, Harrah’sOperating Company, Inc., which owns or manages through various subsidiaries 28 casinos in the UnitedStates. Our principal asset is the stock of Harrah’s Operating Company, Inc., which together with itsdirect and indirect subsidiaries hold substantially all of the assets of our businesses. Our casinoentertainment facilities operate primarily under the Harrah’s, Rio, Showboat, Horseshoe and Harveysbrand names, and include eleven land-based casinos, eleven riverboat or dockside casinos, four casinoson Indian reservations, a combination greyhound racing facility and casino and a combinationthoroughbred racetrack and casino. Our facilities have an aggregate of approximately 1.7 million squarefeet of gaming space and 17,100 hotel rooms. We were incorporated on November 2, 1989, and prior tosuch date operated under predecessor companies. Our principal executive offices are located at OneHarrah’s Court, Las Vegas, Nevada 89119, telephone (702) 407-6000. Our common stock is traded onthe New York Stock Exchange under the symbol ‘‘HET.’’
2004 Business Development
This is a summary of material business developments in 2004. For more information about businessdevelopments in 2004, including expansion projects at our facilities, see Item 7, ‘‘Management’sDiscussion and Analysis of Financial Condition and Results of Operations,’’ in this report.
On July 1, 2004, we completed the acquisition of Horseshoe Gaming Holding Corp. forapproximately $1.62 billion, including the assumption of debt and acquisition costs. In connection withthis acquisition and a separate acquisition, we also acquired the rights to the Horseshoe brand in theUnited States, including rights to the World Series of Poker brand and tournament. Also in connectionwith this acquisition, we sold Harrah’s Shreveport in the second quarter of 2004 for approximately$190 million.
On July 14, 2004, we signed a definitive agreement to acquire Caesars Entertainment, Inc.(‘‘Caesars’’) in a cash and stock transaction (the ‘‘merger’’). Under terms of the agreement, Caesarsstockholders may elect to receive either 0.3247 of a share of Harrah’s Entertainment common stock or$17.75 in cash for each share of Caesars common stock they own, subject to proration and adjustment.As a result, the Company will issue an aggregate of approximately $1.87 billion in cash and 67.7 millionshares of Harrah’s Entertainment common stock based on the number of shares of Caesars commonstock outstanding on January 18, 2005. On January 24, 2005, a definitive joint proxy statement/prospectus containing more detailed information about the merger was filed with the Securities andExchange Commission. This joint proxy statement/prospectus has been mailed to the stockholders ofCaesars and Harrah’s Entertainment and Special Meetings of their stockholders to approve the mergerare scheduled for March 11, 2005. The merger is expected to be completed in the second quarter of2005, subject to stockholder approval of both companies, receipt of the necessary regulatory andantitrust approvals, and other conditions provided in the merger agreement. For more information onthe Company’s pending merger with Caesars, see the definitive joint proxy statement/prospectus that ispart of the Registration Statement on Form S-4/A filed by the Company with the Securities andExchange Commission on January 24, 2005.
In connection with the merger, on September 27, 2004, we agreed to sell Harrah’s East Chicagoand Harrah’s Tunica for a sales price of approximately $627 million, and Caesars agreed to sell itsAtlantic City Hilton and Bally’s Tunica properties for a sales price of approximately $612 million.Additionally, on October 22, 2004, Caesars agreed to sell interests in Bally’s Casino in New Orleans for
2

$24 million, and on November 19, 2004, its Caesars Tahoe casino for $45 million. The closing of thesetransactions is subject to regulatory approvals and other customary conditions. The transactions are notsubject to the closing of the merger.
In 2004, we received regulatory approval for extension of the following Indian casinos we manageunder management agreements:
Harrah’s Ak-Chin—extended to December 2009Harrah’s Cherokee—extended to November 2011
We suspended the operation of LuckyMe, our online gaming initiative in the United Kingdom, inOctober 2004. We do not expect material adverse charges as a result of this action. Losses related toLuckyMe were approximately $9.3 million in 2004.
Our Fast Cash coinless gaming system or a similar coinless system was installed on approximately85% of games in our casinos by the end of 2004.
Harrah’s Chester Downs Casino & Racetrack (‘‘Harrah’s Chester’’) is a harness racetrack andcasino now under development in Chester, Pennsylvania, approximately six miles south of PhiladelphiaInternational Airport. Harrah’s Chester is being built at the former site of the Sun Ship shipbuildingfacility. Harrah’s Chester will feature a 5⁄8-mile harness racetrack, a 1,500-seat grandstand and simulcastfacilities, a slot casino with approximately 2,000 games, and a variety of food and beverage offerings,including a buffet, a 24-hour restaurant, lounge and 300-seat clubhouse dining area. Racing andsimulcasting is scheduled to begin in April 2006 and the casino is tentatively scheduled to open in thethird quarter of 2006, subject to receipt of a gaming license and all other regulatory approvals. We owna 50% interest in Harrah’s Chester and will guarantee or provide financing for the project.
Description of Business
Our casino business commenced operations in 1937. We own or manage casino entertainmentfacilities in more areas throughout the United States than any other participant in the casino industry.In addition to casinos, our facilities typically include hotel and convention space, restaurants andnon-gaming entertainment facilities. Two of our properties are racetracks at which we have installedslot machines.
In southern Nevada, Harrah’s Las Vegas and Rio All-Suite Hotel & Casino are located in LasVegas, and draw customers from throughout the United States. Harrah’s Laughlin is located near boththe Arizona and California borders and draws customers primarily from the southern California andPhoenix metropolitan areas and, to a lesser extent, from throughout the U.S. via charter aircraft.
In northern Nevada, Harrah’s Lake Tahoe, Harveys Resort & Casino and Bill’s Casino are locatednear Lake Tahoe and draw customers primarily from California. Harrah’s Reno, located in downtownReno, draws customers primarily from Northern California, the Pacific Northwest and Canada.
Our Atlantic City casinos, Harrah’s Atlantic City, located in the Marina area, and the ShowboatAtlantic City, located on the Boardwalk, draw customers primarily from Philadelphia, New York andNew Jersey.
Our Chicagoland dockside casinos, Harrah’s Joliet in Joliet, Illinois, and Horseshoe Hammond inHammond, Indiana, draw customers primarily from the greater Chicago metropolitan area.
In Louisiana, we own Harrah’s New Orleans, a land-based casino located in downtown NewOrleans, which attracts customers from the New Orleans metropolitan area and from throughout theUnited States. In the southwest part of the state, Harrah’s Lake Charles, a dockside casino, servessouthwestern Louisiana and eastern Texas, including the Houston metropolitan area. In the northwestpart of the state, Horseshoe Bossier City, a dockside casino, and Louisiana Downs, a thoroughbred
3

racetrack with slot machines, located in Bossier City, cater to customers in northwestern Louisiana andeast Texas, including the Dallas/Fort Worth metropolitan area.
Harrah’s North Kansas City and Harrah’s St. Louis, both dockside casinos, draw customers fromthe Kansas City and St. Louis metropolitan areas, the largest markets in Missouri. Harrah’s Metropolisis a dockside casino located in Metropolis, Illinois, on the Ohio River, drawing customers fromsouthern Illinois, western Kentucky and central Tennessee. Horseshoe Tunica, a dockside casinocomplex located in Tunica, Mississippi, is approximately 30 miles from Memphis, Tennessee and drawscustomers primarily from the Memphis area.
Harrah’s Council Bluffs Casino Hotel, a dockside casino facility, and Bluffs Run Casino, acombination greyhound racing facility and land-based casino, with approximately 2,880 slot machinescombined, are located in Council Bluffs, Iowa, across the Missouri River from Omaha, Nebraska. AtBluffs Run, we own the assets other than gaming equipment, and lease these assets to the Iowa WestRacing Association, or IWRA, a nonprofit corporation, and we manage the facility for the IWRAunder a management agreement expiring in October 2024. Iowa law requires that a qualified nonprofitcorporation hold Bluffs Run’s gaming and pari-mutuel licenses and its gaming equipment. We arerebranding the casino at Bluffs Run to the Horseshoe brand with a target completion date of firstquarter 2006.
In addition to the casinos that we own, we also earn fees through our management of four casinosfor Indian tribes:
• Harrah’s Phoenix Ak-Chin, located near Phoenix, Arizona, which we manage for the Ak-ChinIndian Community under a management agreement that expires December 2009. Harrah’sPhoenix Ak-Chin draws customers from the Phoenix metropolitan area;
• Harrah’s Rincon Casino and Resort, located near San Diego, California, which we manage forthe Rincon San Luiseno Band of Mission Indians under a management agreement that expiresin November 2011. Harrah’s Rincon draws customers from the San Diego metropolitan area andOrange County, California;
• Harrah’s Cherokee Smoky Mountains Casino, which we manage for the Eastern Band ofCherokee Indians on their reservation in Cherokee, North Carolina under a managementcontract that expires November 2011. Harrah’s Cherokee draws customers from easternTennessee, western North Carolina, northern Georgia and South Carolina; and
• Harrah’s Prairie Band Casino-Topeka, located near Topeka, Kansas, which we manage for thePrairie Band Potawatomi Nation under a management contract expiring in January 2008.Harrah’s Prairie Band draws customers from the Topeka and Wichita, Kansas areas.
We own and operate Bluegrass Downs, a harness racetrack located in Paducah, Kentucky, and owna one-third interest in Turfway Park LLC, which is the owner of the Turfway Park thoroughbredracetrack in Boone County, Kentucky. Turfway Park LLC owns a minority interest in Kentucky DownsLLC, which is the owner of the Kentucky Downs racetrack located in Simpson County, Kentucky.
Additional information about our casino entertainment properties as of December 31, 2004 is setforth below in Item 2, ‘‘Properties,’’ along with information concerning the status of expansions andimprovements at certain properties during 2004.
Sales and Marketing
We believe that our nationwide distribution system of 28 casino entertainment facilities provides usthe ability to generate play by our customers when they travel among markets, which we refer to ascross-market play. We believe our customer loyalty program, Total Rewards, in conjunction with this
4

nationwide distribution system, allows us to capture a growing share of our customers’ gaming budgetand generate increased same-store sales.
Under Total Rewards, our customers may earn reward credits and redeem those credits at most ofour casino entertainment facilities. Total Rewards is currently installed in all of our casinos with theexception of the Horseshoe properties. Integration of the Horseshoe brand casino facilities into TotalRewards is in process and is targeted for completion in mid-2005. Total Rewards is structured in tiers,providing customers an incentive to consolidate their play at our casinos. Depending on their level ofplay with us, customers may be designated as either Gold, Platinum, Diamond, or Seven Starscustomers. Customers who do not participate in Total Rewards are encouraged to join, and those witha Total Rewards card are encouraged to consolidate their play through targeted promotional awards asthey graduate to higher tiers.
Through our Total Rewards program, we developed a database containing information aboutmillions of customers and aspects of their casino gaming play. We use this information for marketingpromotions, including through direct mail campaigns and the use of electronic mail and our website.
Patents and Trademarks
We own the following trademarks used in this document: Harrah’s�; LuckyMesm; Fast Cash�; Rio�;Showboat�; Bill’s�; Harveys�; Total Rewards�; Bluffs Run�; Louisiana Downs�; Reward Credits�;Horseshoe�; Seven Stars�; and World Series of Poker�. Trademark rights are perpetual provided thatthe mark remains in use by the Company. We consider all of these marks, and the associated namerecognition, to be valuable to our business.
We hold five U.S. patents covering the technology associated with our Total Rewards program-U.S.Patent No. 5,613,912 issued March 25, 1997, expiring April 5, 2015 (which is the subject of a licenseagreement with Mikohn Gaming Corporation); U.S. Patent No. 5,761,647 issued June 2, 1998, expiringMay 24, 2016; U.S. Patent No. 5,809,482 issued September 15, 1998, expiring September 15, 2015; U.S.Patent No. 6,003,013 issued December 14, 1999, expiring May 24, 2016; and U.S. Patent No. 6,183,362,issued February 6, 2001, expiring May 24, 2016. In 2001, we sued a competitor casino company inFederal Court seeking to enforce three of these patents. In June 2004, the trial court ruled against uson the competitor’s motion for summary judgment, holding that Patent Nos. 5,761,647 and 6,183,362and portions of Patent No. 6,003,013 were invalid. We have appealed this lower court decision;however, we agreed to the dismissal of our remaining claims under Patent No. 6,003,013. While weexpect to ultimately prevail in the litigation, we do not believe that an unfavorable finding in thelitigation would adversely affect our business or operations.
Competition
We own or manage land-based, dockside, riverboat and Indian casino facilities in most U.S. casinoentertainment jurisdictions. We compete with numerous casinos and casino hotels of varying quality andsize in the market areas where our properties are located. We also compete with other non-gamingresorts and vacation areas, and with various other casino and other entertainment businesses. Thecasino entertainment business is characterized by competitors that vary considerably by their size,quality of facilities, number of operations, brand identities, marketing and growth strategies, financialstrength and capabilities, level of amenities, management talent and geographic diversity. In certainareas, such as Las Vegas, we compete with a wide range of casinos, some of which are significantlylarger and offer substantially more non-gaming activities to attract customers.
In most markets, we compete directly with other casino facilities operating in the immediate andsurrounding market areas. In some markets, we face competition from nearby markets in addition todirect competition within our market areas.
5

In recent years, with fewer new markets opening for development, competition in existing marketshas intensified. Many casino operators, including us, have invested in expanding existing facilities,developing new facilities, and acquiring established facilities in existing markets, such as our acquisitionof the casinos owned by Rio, Showboat, Players, Harveys and Horseshoe, and our planned acquisitionof Caesars. This expansion of existing casino entertainment properties, the increase in the number ofproperties and the aggressive marketing strategies of many of our competitors has increasedcompetition in many markets in which we compete, and this intense competition can be expected tocontinue. These competitive pressures have adversely affected our financial performance in certainmarkets and, we believe, have also adversely affected the financial performance of certain competitorsoperating in these markets.
We believe we are well-positioned to take advantage of any further legalization of casino gaming,the continued positive consumer acceptance of casino gaming as an entertainment activity, andincreased visitation to casino facilities. However, the expansion of casino entertainment into newmarkets, such as the recent expansion of tribal casino opportunities in New York and California andthe authorization of slot machines at horse racing tracks in Louisiana, could also present competitiveissues for us. At this time, the ultimate impact that these events may have on the industry and on ourCompany is uncertain.
Moreover, the casino entertainment industry is subject to political and regulatory uncertainty. Seealso Part II, Item 7, ‘‘Management’s Discussion and Analysis of Financial Condition and Results ofOperations—Effects of Current Economic and Political Conditions’’ and portions of ‘‘Management’sDiscussion and Analysis of Financial Condition and Results of Operations—Overall Operating Results’’and ‘‘—Regional Results and Development Plans.’’
Governmental Regulation
The gaming industry is highly regulated, and we must maintain our licenses and pay gaming taxesto continue our operations. Each of our casinos is subject to extensive regulation under the laws, rulesand regulations of the jurisdiction where it is located. These laws, rules and regulations generallyconcern the responsibility, financial stability and character of the owners, managers, and persons withfinancial interests in the gaming operations. Violations of laws in one jurisdiction could result indisciplinary action in other jurisdictions. A more detailed description of the regulations to which we aresubject is contained in Exhibit 99 to this Annual Report on Form 10-K, which Exhibit is incorporatedherein by reference.
Our businesses are subject to various federal, state and local laws and regulations in addition togaming regulations. These laws and regulations include, but are not limited to, restrictions andconditions concerning alcoholic beverages, environmental matters, employees, currency transactions,taxation, zoning and building codes, and marketing and advertising. Such laws and regulations couldchange or could be interpreted differently in the future, or new laws and regulations could be enacted.Material changes, new laws or regulations, or material differences in interpretations by courts orgovernmental authorities could adversely affect our operating results.
Employee Relations
We have approximately 46,600 employees through our various subsidiaries. Despite a strike inAtlantic City in 2004 that was successfully settled, we consider our labor relations with employees to begood. Approximately 6,850 employees are covered by collective bargaining agreements with certain ofour subsidiaries, relating to certain casino, hotel and restaurant employees at Harrah’s Atlantic City,Harrah’s Las Vegas, Rio, Harrah’s East Chicago, Showboat Atlantic City and Harrah’s New Orleans.
6

Available Information
Our Internet address is www.harrahs.com. We make available free of charge on or through ourwebsite our annual reports on Form 10-K, quarterly reports on Form 10-Q, current reports onForm 8-K, and amendments to those reports filed or furnished pursuant to Section 13(a) or 15(d) ofthe Securities Exchange Act of 1934, as amended, or the Exchange Act, as soon as reasonablypracticable after we electronically file such material with, or furnish it to, the Securities and ExchangeCommission, or SEC. We also make available through our website all filings of our executive officersand directors on Forms 3, 4 and 5 under Section 16 of the Exchange Act. These filings are alsoavailable on the SEC’s website at www.sec.gov. Our Corporate Governance Guidelines, the charters ofour Audit Committee, Human Resources Committee, and Nominating/Corporate GovernanceCommittee, our Code of Conduct and our Code of Business Conduct and Ethics for Principal Officersare available on our website under the ‘‘Investor Relations’’ link. We will provide a copy of thesedocuments to any stockholder upon receipt of a written request addressed to Harrah’sEntertainment, Inc., Attn: Corporate Secretary, One Harrah’s Court, Las Vegas, Nevada 89119.Reference in this document to our website address does not constitute incorporation by reference ofthe information contained on the website.
7

ITEM 2. Properties.
The following table sets forth information about our casino entertainment facilities:
Summary of Property Information*
Casino HotelSpace– Slot Table Rooms &
Property Type of Casino Sq. Ft.(a) Machines(a) Games(a) Suites(a)
Las Vegas, NevadaHarrah’s Las Vegas . . . . . . . . . . . . Land-based 87,700 1,380 90 2,530Rio . . . . . . . . . . . . . . . . . . . . . . . Land-based 107,000 1,190 100 2,550Binion’s Horseshoe(b)*** . . . . . . . Land-based 88,000 650 60 370
Laughlin, NevadaHarrah’s Laughlin . . . . . . . . . . . . Land-based 55,000 950 50 1,560
Reno, NevadaHarrah’s Reno . . . . . . . . . . . . . . . Land-based 57,000 1,050 60 930
Lake Tahoe, NevadaHarrah’s Lake Tahoe . . . . . . . . . . Land-based 57,600 1,010 70 530Harveys Lake Tahoe . . . . . . . . . . . Land-based 63,300 950 80 740Bill’s Lake Tahoe . . . . . . . . . . . . . Land-based 18,000 440 20 –
Atlantic City, New JerseyHarrah’s Atlantic City . . . . . . . . . . Land-based 131,800 3,870 80 1,630Showboat Atlantic City . . . . . . . . . Land-based 115,700 3,970 60 1,300
Chicago, Illinois areaHarrah’s Joliet (Illinois) . . . . . . . . Dockside 39,200 1,210 20 200Harrah’s East Chicago (Indiana)** . Dockside 54,000 1,970 70 290Horseshoe Hammond (Indiana) . . . Dockside 48,300 2,010 50 –
Metropolis, IllinoisHarrah’s Metropolis . . . . . . . . . . . Dockside 29,800 1,200 20 120(c)
Council Bluffs, IowaHarrah’s Council Bluffs . . . . . . . . Dockside 28,000 1,230 40 250Bluffs Run Casino(d) . . . . . . . . . . Greyhound Racing
Facility and land-basedcasino 40,300 1,650 – –
Tunica, MississippiHarrah’s Tunica** . . . . . . . . . . . . Dockside 35,000 1,180 20 200Horseshoe Tunica . . . . . . . . . . . . . Dockside 63,000 2,110 80 510
St. Louis, MissouriHarrah’s St. Louis . . . . . . . . . . . . Dockside 120,000 2,770 80 500
North Kansas City, MissouriHarrah’s North Kansas City . . . . . Dockside 60,100 1,800 60 200(e)
New Orleans, LouisianaHarrah’s New Orleans . . . . . . . . . Land-based 100,000 1,980 130 –(f)
Lake Charles, LouisianaHarrah’s Lake Charles . . . . . . . . . Dockside 60,000 1,250 70 260
8

Casino HotelSpace– Slot Table Rooms &
Property Type of Casino Sq. Ft.(a) Machines(a) Games(a) Suites(a)
Bossier City, LouisianaLouisiana Downs . . . . . . . . . . . . . Thoroughbred Racing
Facility and land-basedcasino 15,000 1,400 – –
Horseshoe Bossier City . . . . . . . . . Dockside 30,000 1,690 50 610Phoenix, Arizona
Harrah’s Ak-Chin(b) . . . . . . . . . . . Indian Reservation 48,000 820 20 150Topeka, Kansas
Harrah’s Prairie Band(b) . . . . . . . . Indian Reservation 34,900 1,060 30 890Cherokee, North Carolina
Harrah’s Cherokee(b) . . . . . . . . . . Indian Reservation 80,000 3,050 30 250(g)San Diego, California
Harrah’s Rincon(b) . . . . . . . . . . . . Indian Reservation 69,900 1,560 90 650
* As of December 31, 2004.
** Subject to sale agreement.
*** We will cease management on March 10, 2005.
(a) Approximate.
(b) Managed.
(c) A hotel, in which the Company owns a 12.5% special limited partnership interest, is adjacent tothe Metropolis facility. A new 258-room hotel to be owned by the Company is under development,subject to receipt of regulatory approvals.
(d) The property is owned by the Company, leased to the operator, and managed by the Company forthe operator for a fee pursuant to an agreement that expires in October 2024.
(e) Construction of a hotel addition with approximately 206 rooms is currently underway at Harrah’sNorth Kansas City and is expected to be completed in the fourth quarter of 2005.
(f) Construction is currently underway on a 450-room hotel tower at Harrah’s New Orleans which isexpected to be completed in first quarter 2006.
(g) Construction of a hotel tower with approximately 320 additional rooms for this property iscurrently underway at Harrah’s Cherokee and is expected to be completed in the second quarter of2005.
ITEM 3. Legal Proceedings.
The Company is party to ordinary and routine litigation incidental to our business. We do notexpect the outcome of any pending litigation to have a material adverse effect on our consolidatedfinancial position or results of operations.
ITEM 4. Submission of Matters to a Vote of Security Holders.
Not applicable.
9

PART II
ITEM 5. Market for the Company’s Common Stock, Related Stockholder Matters and IssuerPurchases of Equity Securities.
Our common stock is listed on the New York Stock Exchange and traded under the ticker symbol‘‘HET.’’ The stock is also listed on the Chicago Stock Exchange, the Pacific Exchange and thePhiladelphia Stock Exchange.
The following table sets forth the high and low prices per share of our common stock, as reportedby the New York Stock Exchange, for the last two years:
High Low
2004First Quarter . . . . . . . . . . . . . . . . . . . . . . . . . . . . . . . . . . . . . . . . $56.40 $48.90Second Quarter . . . . . . . . . . . . . . . . . . . . . . . . . . . . . . . . . . . . . . 57.50 50.86Third Quarter . . . . . . . . . . . . . . . . . . . . . . . . . . . . . . . . . . . . . . . 55.21 43.94Fourth Quarter . . . . . . . . . . . . . . . . . . . . . . . . . . . . . . . . . . . . . . 67.25 52.78
2003First Quarter . . . . . . . . . . . . . . . . . . . . . . . . . . . . . . . . . . . . . . . . $40.75 $30.30Second Quarter . . . . . . . . . . . . . . . . . . . . . . . . . . . . . . . . . . . . . . 44.30 34.20Third Quarter . . . . . . . . . . . . . . . . . . . . . . . . . . . . . . . . . . . . . . . 44.10 38.65Fourth Quarter . . . . . . . . . . . . . . . . . . . . . . . . . . . . . . . . . . . . . . 49.94 40.85
The approximate number of holders of record of our common stock as of February 28, 2005, was8,418.
During 2004, the Company declared the following cash dividends per share:
Amount Record Date Paid On
$0.30 . . . . . . . . . . . . . . . . . . . . . . . . . . . February 11, 2004 February 25, 20040.30 . . . . . . . . . . . . . . . . . . . . . . . . . . . May 12, 2004 May 26, 20040.33 . . . . . . . . . . . . . . . . . . . . . . . . . . . August 11, 2004 August 25, 20040.33 . . . . . . . . . . . . . . . . . . . . . . . . . . . November 10, 2004 November 24, 2004
10

ITEM 6. Selected Financial Data.
The selected financial data set forth below for the five years ended December 31, 2004, should beread in conjunction with the Consolidated Financial Statements and accompanying notes thereto.
Compound(In millions, except common stock data and financial Growthpercentages and ratios) 2004(a) 2003(b) 2002(c) 2001(d) 2000(e) Rate
OPERATING DATARevenues . . . . . . . . . . . . . . . . . . . . . . . . . . . $4,548.3 $3,948.9 $3,747.9 $3,317.4 $2,977.8 11.2%Income from operations . . . . . . . . . . . . . . . . . 791.1 678.8 708.7 521.8 188.2 43.2%Income/(loss) from continuing operations . . . . 329.5 261.1 282.2 173.8 (46.4) N/MNet income/(loss) . . . . . . . . . . . . . . . . . . . . . 367.7 292.6 235.0 209.0 (12.1) N/M
COMMON STOCK DATAEarnings/(loss) per share-diluted
Income from continuing operations . . . . . . . 2.92 2.36 2.48 1.50 (0.40) N/MNet income/(loss) . . . . . . . . . . . . . . . . . . . . 3.26 2.65 2.07 1.81 (0.10) N/M
Cash dividends declared per share . . . . . . . . . 1.26 0.60 – – – N/M
FINANCIAL POSITIONTotal assets . . . . . . . . . . . . . . . . . . . . . . . . . . 8,585.6 6,578.8 6,350.0 6,128.6 5,166.1 13.5%Long-term debt . . . . . . . . . . . . . . . . . . . . . . . 5,151.1 3,671.9 3,763.1 3,719.4 2,835.8 16.1%Stockholders’ equity . . . . . . . . . . . . . . . . . . . . 2,035.2 1,738.4 1,471.0 1,374.1 1,269.7 12.5%
FINANCIAL PERCENTAGES AND RATIOSReturn on revenues-continuing . . . . . . . . . . . . 7.2% 6.6% 7.5% 5.2% (1.6)%Return on average invested capital
Continuing operations . . . . . . . . . . . . . . . . 8.2% 8.0% 8.9% 7.5% 2.4 %Net income/(loss) . . . . . . . . . . . . . . . . . . . . 8.0% 7.6% 6.9% 7.3% 2.9 %
Return on average equityContinuing operations . . . . . . . . . . . . . . . . 17.5% 16.0% 19.3% 12.9% (3.2)%Net income/(loss) . . . . . . . . . . . . . . . . . . . . 19.5% 18.0% 16.1% 15.5% (0.8)%
Ratio of earnings to fixed charges(f) . . . . . . . . 2.7 2.6 2.7 2.0 2.0
N/M=Not Meaningful
Note references are to our Notes to Consolidated Financial Statements. See Item 8.
(a) 2004 includes $9.6 million in pretax charges for write-downs, reserves and recoveries (see Note 9)and $2.3 million in pretax charges related to our pending acquisition of CaesarsEntertainment, Inc. (see Note 2). 2004 also includes the financial results of Horseshoe GamingHolding Corporation from its July 1, 2004, date of acquisition.
(b) 2003 includes $10.5 million in pretax charges for write-downs, reserves and recoveries (see Note 9)and $19.1 million in pretax charges for premiums paid for, and write-offs associated with, debtretired before maturity. 2003 results have been reclassified to reflect Harrah’s East Chicago andHarrah’s Tunica as discontinued operations.
(c) 2002 includes $4.5 million in pretax charges for write-downs, reserves and recoveries (see Note 9),a $6.1 million pretax charge for our exposure under a letter of credit issued on behalf of NationalAirlines, Inc., and a charge of $91.2 million, net of tax benefits of $2.8 million, related to a changein accounting principle (see Note 4). 2002 also includes the financial results of Jazz CasinoCompany LLC from the date of our acquisition of a majority ownership interest on June 7, 2002.2002 results have been reclassified to reflect Harrah’s East Chicago and Harrah’s Tunica asdiscontinued operations.
11

(d) 2001 includes $17.2 million in pretax charges for write-downs, reserves and recoveries and$26.2 million of pretax income from dispositions of nonstrategic assets and the settlement of acontingency related to a former affiliate. 2001 also includes the financial results of Harveys CasinoResorts from its July 31, 2001, date of acquisition. 2001 results have been reclassified to reflectHarrah’s East Chicago and Harrah’s Tunica as discontinued operations.
(e) 2000 includes $220.0 million in pretax reserves for receivables not expected to be recovered fromJCC Holding Company and its subsidiary, Jazz Casino Company LLC, $6.1 million in pretaxcharges for other write-downs, reserves and recoveries and $39.4 million in pretax write-offs andreserves for our investment in, loans to and net estimated exposure under letters of credit issuedon behalf of National Airlines, Inc. 2000 also includes the financial results of PlayersInternational, Inc., from its March 22, 2000, date of acquisition. 2000 results have been reclassifiedto reflect Harrah’s East Chicago and Harrah’s Tunica as discontinued operations.
(f) Ratio computed based on Income/(loss) from continuing operations. For details of the computationof this ratio, see Exhibit 12 to our Form 10-K for the year ended December 31, 2004.
ITEM 7. Management’s Discussion and Analysis of Financial Condition and Results of Operations.
Harrah’s Entertainment, Inc., a Delaware corporation, was incorporated on November 2, 1989, andprior to such date operated under predecessor companies. As of December 31, 2004, we operated28 casinos in 12 states under the Harrah’s, Horseshoe, Rio, Showboat and Harveys brand names. Ourcasinos include land-based casinos and casino hotels, dockside and riverboat casinos, a greyhoundracetrack, a thoroughbred racetrack and managed casinos on Indian lands.
In this discussion, the words ‘‘Harrah’s Entertainment,’’ ‘‘Company,’’ ‘‘we,’’ ‘‘our,’’ and ‘‘us’’ referto Harrah’s Entertainment, Inc., together with its subsidiaries where appropriate.
STRATEGIC ACQUISITIONS
Harrah’s Entertainment’s strategy for sustainable growth draws on the combined strength of ourbroad geographic diversification, customer rewards program, financial strength, innovative technologyand focus on superior customer service. As part of our growth strategy and to further enhance ourgeographic distribution, strengthen our access to valued customers and leverage our technological andcentralized services infrastructure, in the past seven years we have acquired five casino companies, theremaining interest in the New Orleans casino and a thoroughbred racetrack. Our growth strategy willbe taken to the next level in 2005 with the planned acquisition of Caesars Entertainment, Inc.(‘‘Caesars’’), which we announced on July 14, 2004.
Under the terms of the agreement, Caesars’ shareholders will receive either $17.75 in cash or0.3247 shares of Harrah’s Entertainment’s common stock for each outstanding share of Caesars’common stock, subject to limitations on the aggregate amount of cash to be paid and shares of stock tobe issued. Caesars’ shareholders will be able to elect to receive solely shares of Harrah’sEntertainment’s common stock or cash, to the extent available pursuant to the terms of the agreement.The aggregate estimated purchase price, calculated as of July 14, 2004, was approximately $9.4 billion.The purchase price will fluctuate until closing due to changes in the number of outstanding shares ofCaesars’ stock and the balance of Caesars’ outstanding debt. Caesars operates 27 casinos with abouttwo million square feet of gaming space and approximately 26,000 hotel rooms and has significantpresence in Las Vegas, Atlantic City and Mississippi. The transaction is subject to regulatory andshareholders’ approvals and is expected to close during the second quarter of 2005. Separate specialmeetings will be held on March 11, 2005, by stockholders of Harrah’s Entertainment and Caesars tovote on proposals to approve the agreement.
12

In anticipation of the Caesars acquisition, we have engaged consultants and dedicated internalresources to plan for the merger and integration of Caesars into Harrah’s Entertainment. These costsare reflected in Merger and integration costs for Caesars acquisition in our Consolidated Statements ofIncome.
The following table provides an overview of our acquisition activities over the past seven years.Following the table is a brief review of our acquisitions completed during the three years endedDecember 31, 2004. All of our acquisition transactions were accounted for as purchases.
TotalDate Purchase Goodwill Number of Geographic
Company Acquired Price(a) Assigned Casinos Location
(Dollars in millions)Showboat, Inc. . . . . . . . . . . . . . June 1998 $1,045 $322 4(b) Atlantic City, New Jersey
East Chicago, Indiana
Rio Hotel & Casino, Inc. . . . . . . January 1999 987 93(c) 1 Las Vegas, Nevada
Players International, Inc. . . . . . March 2000 439 204 3 Lake Charles, LouisianaMetropolis, IllinoisSt. Louis, Missouri
Harveys Casino Resorts . . . . . . . July 2001 712 265 4 Central City, Colorado(d)Council Bluffs, Iowa(2 properties)Lake Tahoe, Nevada
JCC Holding Company(e) . . . . . June 2002 149 – 1 New Orleans, LouisianaDecember 2002
Louisiana Downs, Inc. . . . . . . . . December 2002 94 36 1(f) Bossier City, Louisiana
Horseshoe Club OperatingCompany(g) . . . . . . . . . . . . . March 2004 37 – 1(h) Las Vegas, Nevada
Horseshoe Gaming HoldingCorp. . . . . . . . . . . . . . . . . . July 2004 1,625 565 3 Bossier City, Louisiana
Hammond, IndianaTunica, Mississippi
(a) Total purchase price includes the market value of debt assumed determined as of the acquisition date and ofassets that were subsequently sold.
(b) Interests in two casinos that were included in the acquisition were subsequently sold, and an agreement wasreached in 2004 to sell another casino that was included in this acquisition.
(c) This goodwill was determined to be impaired and was written off in 2002.
(d) This property was sold in 2003.
(e) Acquired additional 14% interest in June 2002 and remaining 37% interest in December 2002.
(f) Acquired a thoroughbred racetrack that was expanded to include slot machines in 2003.
(g) This acquisition was for certain intellectual property assets, including the rights to the Horseshoe brand inNevada and to the World Series of Poker brand and tournament.
(h) This casino is owned by another gaming company, and we operate it jointly with that company. See thediscussion below regarding Las Vegas Horseshoe Hotel and Casino.
13

Horseshoe Gaming
On July 1, 2004, we acquired 100 percent of the equity interests of Horseshoe Gaming HoldingCorp. (‘‘Horseshoe Gaming’’) for approximately $1.62 billion, including assumption of debt valued atapproximately $558 million and acquisition costs. A $75 million escrow payment made in 2003 wasapplied to the purchase price. We issued a redemption notice on July 1, 2004, for all $558 million ofHorseshoe Gaming’s outstanding 85⁄8% Senior Subordinated Notes due July 2009 and retired that debton August 2, 2004. We financed the acquisition and the debt retirement through working capital andestablished debt programs. The results of the Horseshoe properties are included with our operatingresults subsequent to their acquisition on July 1, 2004.
In anticipation of our acquisition of Horseshoe Gaming, we sold our Harrah’s brand casino inShreveport, Louisiana. After consideration of the sale of Harrah’s Shreveport, the Horseshoe Gamingacquisition added a net 113,300 square feet of casino space and approximately 4,580 slot machines and150 table games to our existing portfolio. Taken together with our acquisition of intellectual propertyrights from Horseshoe Club Operating Company (‘‘Horseshoe Club’’) (see discussion below), thisacquisition gave us rights to the Horseshoe brand in all of the United States. We intend to expand theHorseshoe brand into additional gaming markets, as evidenced by our recent announcement tore-brand our Bluffs Run casino to the Horseshoe brand.
Las Vegas Horseshoe Hotel and Casino
In March 2004, we acquired certain intellectual property assets, including the rights to theHorseshoe brand in Nevada and to the World Series of Poker brand and tournament, from HorseshoeClub. MTR Gaming Group, Inc. (‘‘MTR Gaming’’) acquired the assets of the Binion’s HorseshoeHotel and Casino (‘‘Las Vegas Horseshoe’’) in Las Vegas, Nevada, including the right to use the name‘‘Binion’s’’ at the property, from Horseshoe Club. We operate Las Vegas Horseshoe jointly with asubsidiary of MTR Gaming for a one-year period, with options to extend the agreement for twoadditional years; however, we have notified MTR Gaming that we do not intend to extend theagreement. The property, which had closed in January 2004, reopened April 1, 2004. Since itsreopening, the operating results for Las Vegas Horseshoe have been consolidated with our results andwill continue to be consolidated until the operating agreement is terminated on March 10, 2005. LasVegas Horseshoe’s results have not been material to our operating results.
We paid approximately $37.4 million for the intellectual property assets, including assumption andsubsequent payment of certain liabilities of Las Vegas Horseshoe (which included certain amountspayable to a principal of Horseshoe Gaming) and approximately $5.1 million of acquisition costs. Theintangible assets acquired in this transaction have been deemed to have indefinite lives and, therefore,are not being amortized. We financed the acquisition with funds from various sources, including cashflows from operations and borrowings from established debt programs.
Harrah’s Shreveport and Louisiana Downs—Buyout of Minority Partners
In the first quarter of 2004, we paid approximately $37.5 million to the minority owners of thecompany that owned Louisiana Downs and Harrah’s Shreveport to purchase their ownership interest inthat company. The excess of the cost to purchase the minority ownership above the capital balanceswas assigned to goodwill. As a result of this transaction, Harrah’s Shreveport and Louisiana Downsbecame wholly owned by the Company. Harrah’s Shreveport was subsequently sold to another gamingcompany.
Chester Downs & Marina
In July 2004, after receiving Pennsylvania regulatory and certain local approvals, we acquired a50% interest in Chester Downs & Marina, LLC (‘‘CD&M’’), an entity licensed to develop a harness-racing facility in southeastern Pennsylvania. Harrah’s Entertainment and CD&M have agreed to
14

develop Harrah’s Chester Downs Casino and Racetrack (‘‘Harrah’s Chester’’), a 5⁄8-mile harnessracetrack facility approximately six miles south of Philadelphia International Airport. Plans for thefacility also include a 1,500-seat grandstand and simulcast facility, a slot casino with approximately 2,000games and a variety of food and beverage offerings. We have commenced site work and demolition atthe property and expect racing and simulcasting to begin in the second quarter of 2006 and the casinoto open in the third quarter of 2006, pending receipt of a gaming license and other regulatoryapprovals. This Project is expected to cost $392 million, $3.8 million of which had been spent atDecember 31, 2004. We will guarantee or provide financing for the project and we are consolidatingHarrah’s Chester in our financial statements.
Harrah’s East Chicago—Buyout of Minority Partners
In the second quarter of 2003, we paid approximately $28.8 million to former partners in theHarrah’s East Chicago property to settle outstanding litigation with the partners relating to a buyout in1999 of the partners’ interest in the property and to terminate the contractual rights of the partners torepurchase an 8.55% interest in the property. The two remaining minority partners in our East Chicagoproperty owned, in aggregate, 0.45% of this property. In December 2003 and January 2004, weacquired these ownership interests for aggregate consideration of approximately $0.8 million. As aresult of these transactions, the East Chicago property is now wholly owned.
In September 2004, we entered into an agreement to sell the assets and certain related liabilities ofHarrah’s East Chicago to an unrelated third party. The sale, which is subject to regulatory approvals, isexpected to close in the first quarter of 2005.
Louisiana Downs
On December 20, 2002, we acquired a controlling interest in Louisiana Downs, a thoroughbredracetrack in Bossier City, Louisiana. The agreement gave Harrah’s Entertainment a 95% ownershipinterest in a company that owned both Louisiana Downs and Harrah’s Shreveport. In the first quarterof 2004, we purchased the ownership interest of the minority owners. The excess of the cost topurchase the minority ownership above the capital balances was assigned to goodwill. In May 2003,approximately 900 slot machines were put into service and Louisiana Downs became the onlyland-based gaming facility in northern Louisiana. We opened a new, permanent facility withapproximately 1,400 slot machines during second quarter 2004.
Jazz Casino Company
On June 7, 2002, we acquired additional shares of JCC’s common stock, which increased ourownership from 49% to 63% and required a change in our accounting treatment for our investment inJCC from the equity method to consolidation of JCC in our financial statements. We beganconsolidating JCC in our financial results on June 7, 2002. On December 10, 2002, we acquired all ofthe remaining shares of JCC’s stock to increase our ownership to 100%.
CAPITAL SPENDING AND DEVELOPMENT
Part of our plan for growth and stability includes disciplined capital improvement projects, and2004, 2003 and 2002 were all years of significant capital reinvestment.
In addition to the specific development and expansion projects discussed in REGIONALRESULTS AND DEVELOPMENT PLANS, we perform on-going refurbishment and maintenance atour casino entertainment facilities to maintain our quality standards. We also continue to pursuedevelopment and acquisition opportunities for additional casino entertainment facilities that meet ourstrategic and return on investment criteria. Prior to the receipt of necessary regulatory approvals, thecosts of pursuing development projects are expensed as incurred. Construction-related costs incurredafter the receipt of necessary approvals are capitalized and depreciated over the estimated useful life ofthe resulting asset. Project opening costs are expensed as incurred.
15

Our capital spending for 2004 totaled approximately $702.9 million, excluding the cost of ouracquisition of Horseshoe Gaming, the intangible assets from Horseshoe Club and the purchase ofpartnership interests. 2003 capital spending was approximately $427.0 million and 2002 capital spendingwas $376.0 million, excluding the costs of our acquisitions of Louisiana Downs and the remaininginterest in JCC. Estimated total capital expenditures for 2005 are expected to be between $800 millionand $900 million and do not include estimated expenditures for our announced acquisition of Caesarsor for unidentified development opportunities.
Our planned development projects, if they go forward, will require, individually and in theaggregate, significant capital commitments and, if completed, may result in significant additionalrevenues. The commitment of capital, the timing of completion and the commencement of operationsof casino entertainment development projects are contingent upon, among other things, negotiation offinal agreements and receipt of approvals from the appropriate political and regulatory bodies. Cashneeded to finance the Caesars acquisition and projects currently under development as well asadditional projects being pursued is expected to be made available from operating cash flows,established debt programs (see DEBT AND LIQUIDITY), joint venture partners, specific projectfinancing, guarantees of third-party debt and additional debt and/or equity offerings.
DEBT AND LIQUIDITY
We generate substantial cash flows from operating activities, as reflected on the ConsolidatedStatements of Cash Flows. These cash flows reflect the impact on our consolidated operations of thesuccess of our marketing programs, our strategic acquisitions, on-going cost containment focus andfavorable variable interest rates. For 2004, we reported cash flows from operating activities of$791.0 million, a 18.6% increase over the $666.8 million reported in 2003. The 2003 amount reflected a3.2% increase over the 2002 level.
We use the cash flows generated by the Company to fund reinvestment in existing properties forboth refurbishment and expansion projects, to pursue additional growth opportunities via strategicacquisitions of existing companies and new development opportunities and to return capital to ourshareholders in the form of stock repurchase programs and dividends. When necessary, we supplementthe cash flows generated by our operations with funds provided by financing activities to balance ourcash requirements.
Our cash and cash equivalents totaled approximately $489.0 million at December 31, 2004,compared to $397.9 million at December 31, 2003. The following provides a summary of our cash flowsfor the years ended December 31.
(In millions) 2004 2003 2002
Cash provided by operating activities . . . . . . . . . . . . . . . . . . . . . . . . . . $ 791.0 $ 666.8 $ 646.2Capital investments . . . . . . . . . . . . . . . . . . . . . . . . . . . . . . . . . . . . . . . (618.9) (381.8) (355.5)Payments for business acquisitions . . . . . . . . . . . . . . . . . . . . . . . . . . . . (1,616.9) (75.0) (162.4)Minority interest buyout . . . . . . . . . . . . . . . . . . . . . . . . . . . . . . . . . . . (37.5) – –Investments in affiliates . . . . . . . . . . . . . . . . . . . . . . . . . . . . . . . . . . . . (0.3) (4.2) –Proceeds from asset/investment sales . . . . . . . . . . . . . . . . . . . . . . . . . . 3.8 4.8 34.6Other investing activities . . . . . . . . . . . . . . . . . . . . . . . . . . . . . . . . . . . (26.8) (14.9) (7.2)
(1,505.6) 195.7 155.7Cash provided by/(used in) financing activities . . . . . . . . . . . . . . . . . . . 1,356.5 (248.0) (173.3)Cash provided by assets held for sale . . . . . . . . . . . . . . . . . . . . . . . . . . 240.1 65.9 77.0
Net increase in cash and cash equivalents . . . . . . . . . . . . . . . . . . . . . $ 91.0 $ 13.6 $ 59.4
16

We believe that our cash and cash equivalents balance, our cash flows from operations and thefinancing sources discussed herein, will be sufficient to meet our normal operating requirements duringthe next twelve months and to fund additional acquisitions, including our announced acquisition ofCaesars, or investments. In addition, we may consider issuing additional debt or equity securities in thefuture to fund potential acquisitions or growth or to refinance existing debt. We continue to reviewadditional opportunities to acquire or invest in companies, properties and other investments that meetour strategic and return on investment criteria. If a material acquisition or investment is completed, ouroperating results and financial condition could change significantly in future periods.
The majority of our debt is due in December 2005 and beyond. Payments of short-term debtobligations and other commitments are expected to be made from operating cash flows. Long-termobligations are expected to be paid through operating cash flows, refinancing of debt, joint venturepartners or, if necessary, additional debt and/or equity offerings.
With the planned acquisition of Caesars, we will assume approximately $4.2 billion of Caesars’outstanding debt and incur approximately $1.9 billion in debt to fund the acquisition. We plan to securethe funds for the acquisition by borrowing under our amended credit agreement (see Credit Agreementbelow).
Credit Agreement
At December 31, 2004, we had credit facilities (the ‘‘Credit Agreement’’) that provided for up to$2.5 billion in borrowings, maturing on April 23, 2009. The Credit Agreement contains a provision thatwould allow an increase in the borrowing capacity to $3.0 billion, if mutually acceptable to theCompany and the lenders. Interest on the Credit Agreement is based on our debt ratings and leverageratio and is subject to change. As of December 31, 2004, the Credit Agreement bore interest basedupon 90 basis points over LIBOR and bore a facility fee for borrowed and unborrowed amounts of20 basis points, a combined 110 basis points. At our option, we may borrow at the prime rate under theCredit Agreement. As of December 31, 2004, $1.58 billion in borrowings were outstanding under theCredit Agreement with an additional $59.8 million committed to back letters of credit. Afterconsideration of these borrowings, but before consideration of amounts borrowed under thecommercial paper program, $860.2 million of additional borrowing capacity was available to theCompany as of December 31, 2004.
In January 2005, an agreement was reached to amend the Credit Agreement, which will increaseour borrowing capacity from $2.5 billion to $4.0 billion. The amendment also contains a provision thatwill allow a further increase in the borrowing capacity to $5.0 billion, if mutually acceptable to theCompany and the lenders, and lowers the interest rate from LIBOR plus 110 basis points to LIBORplus 87.5 basis points. The amended agreement becomes effective upon the satisfaction of variousclosing conditions, including the closing of our acquisition of Caesars. Other significant terms andconditions of the Credit Agreement, including the maturity date of April 2009, did not change.
Derivative Instruments
We account for derivative instruments in accordance with Statement of Financial AccountingStandards (‘‘SFAS’’) No. 133, ‘‘Accounting for Derivative Instruments and Hedging Activities,’’ and allamendments thereto. SFAS No. 133 requires that all derivative instruments be recognized in thefinancial statements at fair value. Any changes in fair value are recorded in the income statement or inother comprehensive income, depending on whether the derivative is designated and qualifies for hedgeaccounting, the type of hedge transaction and the effectiveness of the hedge. The estimated fair valuesof our derivative instruments are based on market prices obtained from dealer quotes. Such quotesrepresent the estimated amounts we would receive or pay to terminate the contracts.
17

Our derivative instruments contain a credit risk that the counterparties may be unable to meet theterms of the agreements. We minimize that risk by evaluating the creditworthiness of ourcounterparties, which are limited to major banks and financial institutions, and we do not anticipatenonperformance by the counterparties.
Interest Rate Swaps
We use interest rate swaps to manage the mix of our debt between fixed and variable rateinstruments. As of December 31, 2004, we were a party to four interest rate swaps for a total notionalamount of $500 million. These interest rate swaps serve to manage the mix of our debt between fixedand variable rate instruments by effectively converting fixed rates associated with long-term debtobligations to floating rates. The differences to be paid or received under the terms of interest rateswap agreements are accrued as interest rates change and recognized as an adjustment to interestexpense for the related debt. Changes in the variable interest rates to be paid or received pursuant tothe terms of interest rate swap agreements will have a corresponding effect on future cash flows. Themajor terms of the interest rate swaps are as follows.
Fixed Variable Rate Next SwapNotional Rate Paid as of Reset Expiration
Swap Effective Date Amount Received Dec. 31, 2004 Date Date
(In millions)
Dec. 29, 2003 . . . . . . . . . . . . . . . . $ 50 7.875% 8.433% June 15, 2005 Dec. 15, 2005Dec. 29, 2003 . . . . . . . . . . . . . . . . 150 7.875% 8.437% June 15, 2005 Dec. 15, 2005Jan. 30, 2004 . . . . . . . . . . . . . . . . 200 7.125% 6.853% June 1, 2005 June 1, 2007Feb. 2, 2004 . . . . . . . . . . . . . . . . . 100 7.875% 8.455% June 15, 2005 Dec. 15, 2005
The Company’s interest rate swaps qualify for the ‘‘shortcut’’ method allowed under SFAS No. 133,which allows for an assumption of no ineffectiveness. As such, there is no income statement impactfrom changes in the fair value of the hedging instruments. The net effect of the above swaps reducedour 2004 interest expense by $4.0 million. The effect of the swaps to 2003 interest expense wasimmaterial.
Treasury Rate Lock Agreements
We expect to issue between $750 million and $1 billion of new debt in the first half of 2005. Topartially hedge the risk of future increases to the treasury rate, we have entered into agreements tolock in existing ten-year rates to hedge against such increases. The major terms of the treasury ratelock agreements are as follows.
TreasuryType of Lock Notional
Effective Date Hedge Rate Amount Termination Date
(In millions)
Nov. 22, 2004 . . . . . . . . . . . . . . . . . . . . . . . . . . . . Cash flow 4.373% $200 May 20, 2005Dec. 16, 2004 . . . . . . . . . . . . . . . . . . . . . . . . . . . . Cash flow 4.239% 50 May 20, 2005Dec. 16, 2004 . . . . . . . . . . . . . . . . . . . . . . . . . . . . Cash flow 4.239% 50 May 20, 2005Dec. 16, 2004 . . . . . . . . . . . . . . . . . . . . . . . . . . . . Cash flow 4.239% 100 May 23, 2005
The Company has determined that the treasury rate lock agreements qualify for hedge accountingand are perfectly effective. As such, there is no income statement impact from changes in the fair valueof the hedging instruments. The fair values of our treasury rate lock agreements are carried as assets orliabilities in our Consolidated Balance Sheet, and changes in the fair values are recorded as acomponent of other comprehensive income and will be reclassified to earnings over the life of the debtto be issued.
18

In January 2005, we hedged an additional $100 million notional amount with terms identical to thetreasury locks existing as of December 31, 2004, at a rate of 4.242% and a termination date of May 20,2005.
Commercial Paper
To provide the Company with cost-effective borrowing flexibility, we have a $200 millioncommercial paper program that is used to borrow funds for general corporate purposes. Although thedebt instruments are short-term in tenor, they are classified as long-term debt because the commercialpaper is backed by our Credit Agreement and we have committed to keep available capacity under ourCredit Agreement in an amount equal to or greater than amounts borrowed under this program. AtDecember 31, 2004, $157.8 million was outstanding under this program.
Issuance of New Debt
In addition to our Credit Agreement, we have issued debt and entered into credit agreements toprovide the Company with cost-effective borrowing flexibility and to replace short-term, floating-ratedebt with long-term, fixed-rate debt. The table below summarizes the face value of debt obligationsentered into during the last three years and outstanding at December 31, 2004.
Face ValueOutstanding at
Debt Issued Matures December 31, 2004
(In millions)
Commercial Paper . . . . . . . . . . . . . . . . . . . . . . . . . . . . . 2004 2005 $157.85.5% Senior Notes . . . . . . . . . . . . . . . . . . . . . . . . . . . . . June 2004 2010 750.05.375% Senior Notes . . . . . . . . . . . . . . . . . . . . . . . . . . . December 2003 2013 500.0
Subsequent to the end of 2004, we issued $250 million of Senior Floating Rate Notes due in 2008in a Rule 144A private placement. We agreed to, upon the request by holders of a majority inaggregate principal amount of the Senior Floating Rate Notes then outstanding, to exchange theprivate placement offering with fully registered Senior Floating Rate Notes. If the exchange offer doesnot provide the holders of the Senior Floating Rate Notes freely transferable securities, we may berequired to file a shelf registration statement that would allow them to resell the Senior Floating RateNotes in the open market, subject to certain restrictions.
Extinguishments of Debt
Funds from the new debt discussed above, as well as proceeds from our Credit Agreement, wereused to retire certain of our outstanding debt, in particular those debt obligations assumed in ouracquisition transactions, to reduce our effective interest rate and/or lengthen maturities. The followingtable summarizes the debt obligations, in addition to our previous credit and letter of credit facilitiesthat we have retired over the last three years:
FaceDate Value
Issuer Retired Debt Extinguished Retired
(In millions)Horseshoe Gaming . . . . . . . . . . . . . . August 2004 Senior Subordinated Notes due 2009 $534.1Harrah’s Operating Co . . . . . . . . . . . December 2003 Senior Subordinated Notes due 2005 147.1Harrah’s Operating Co . . . . . . . . . . . August 2003 Senior Subordinated Notes due 2005 12.4JCC . . . . . . . . . . . . . . . . . . . . . . . . December 2002 Senior Notes due 2008 28.2
In July 2003, our Board of Directors authorized the Company to retire, from time to time throughcash purchases, portions of our outstanding debt in open market purchases, privately negotiated
19

transactions or otherwise. These repurchases will be funded through available cash from operations andborrowings from our established debt programs. Such repurchases will depend on prevailing marketconditions, the Company’s liquidity requirements, contractual restrictions and other factors. As ofDecember 31, 2004, $159.5 million of our 77⁄8% Senior Subordinated Notes had been retired under thisauthorization.
Charges of $19.1 million representing premiums paid and write-offs of unamortized deferredfinancing costs associated with the early retirement of portions of our 77⁄8% Senior Subordinated Notesand of our previous credit and letter of credit facilities were recorded in 2003. In compliance withSFAS No. 145, these charges no longer qualify for presentation as extraordinary items and are,therefore, included in Income from continuing operations in our Consolidated Statements of Income.
Subsequent to the end of 2004, we retired an additional $58.3 million of our 77⁄8% SeniorSubordinated Notes due in December 2005. The loss on the early extinguishment of this debt, expectedto be $2.2 million, will be reported in our first quarter 2005 results.
Equity Repurchase Programs
During the past four years, our Board of Directors has authorized plans whereby we havepurchased shares of the Company’s common stock in the open market from time to time as marketconditions and other factors warranted. The table below summarizes the plans in effect during the lastfour years.
Number Number of Shares Averageof Shares Purchased as of Price
Plan Authorized Authorized December 31, 2004 Per Share
July 2001 . . . . . . . . . . . . . . . . . . . . . . . . . 6.0 million 6.0 million $37.15July 2002 . . . . . . . . . . . . . . . . . . . . . . . . . 2.0 million 1.4 million 39.24November 2002 . . . . . . . . . . . . . . . . . . . . . 3.0 million 1.5 million 47.54November 2004 . . . . . . . . . . . . . . . . . . . . . 2.0 million – N/A
In November 2004, our Board of Directors authorized the purchase of 3.5 million shares ofcommon stock in the open market and negotiated purchases through the end of 2005. The 3.5 millionshares includes 1.5 million shares available to be purchased pursuant to the authorization that was toexpire December 31, 2004, plus an additional 2.0 million shares. The repurchases were funded throughavailable operating cash flows and borrowings from our established debt programs.
20

Guarantees of Third-Party Debt and Other Obligations and Commitments
The following tables summarize our contractual obligations and other commitments as ofDecember 31, 2004.
Payments Due by Period
Less than 1-3 4-5 After 5Contractual Obligations Total 1 year years years years
(In millions)
Debt . . . . . . . . . . . . . . . . . . . . . . . . . . . . . . . . . . . . . . . $5,152.4 $ 589.5 $501.5 $2,985.0 $1,076.4Capital lease obligations . . . . . . . . . . . . . . . . . . . . . . . . . 0.5 0.3 0.2 – –Operating lease obligations . . . . . . . . . . . . . . . . . . . . . . . 567.6 43.1 95.6 55.0 373.9Purchase orders obligations . . . . . . . . . . . . . . . . . . . . . . . 18.2 18.2 – – –Guaranteed payments to State of Louisiana . . . . . . . . . . . 134.8 60.0 74.8 – –Community reinvestment . . . . . . . . . . . . . . . . . . . . . . . . 102.9 2.1 15.3 10.4 75.1Construction commitments . . . . . . . . . . . . . . . . . . . . . . . 323.6 323.6 – – –Other contractual obligations . . . . . . . . . . . . . . . . . . . . . 49.8 19.2 19.5 6.9 4.2
$6,349.8 $1,056.0 $706.9 $3,057.3 $1,529.6
Amount of Commitment Expiration Per Period
Totalamounts Less than 1-3 4-5 After 5
Other Commitments committed 1 year years years years
(In millions)
Guarantees of loans . . . . . . . . . . . . . . . . . . . . . . . . . . . . . . . $292.0 $26.4 $104.7 $160.9 $ –Letters of credit . . . . . . . . . . . . . . . . . . . . . . . . . . . . . . . . . . 59.8 59.8 – – –Minimum payments to tribes . . . . . . . . . . . . . . . . . . . . . . . . . 96.1 14.4 42.6 27.0 12.1
The agreements pursuant to which we manage casinos on Indian lands contain provisions requiredby law that provide that a minimum monthly payment be made to the tribe. That obligation has priorityover scheduled repayments of borrowings for development costs and over the management fee earnedand paid to the manager. In the event that insufficient cash flow is generated by the operations to fundthis payment, we must pay the shortfall to the tribe. Subject to certain limitations as to time, suchadvances, if any, would be repaid to us in future periods in which operations generate cash flow inexcess of the required minimum payment. These commitments will terminate upon the occurrence ofcertain defined events, including termination of the management contract. Our aggregate monthlycommitment for the minimum guaranteed payments pursuant to the contracts for the four managedIndian-owned facilities now open, which extend for periods of up to 83 months from December 31,2004, is $1.2 million. Each of these casinos currently generates sufficient cash flows to cover all of theirobligations, including their debt service.
We may guarantee all or part of the debt incurred by Indian tribes with which we have entered amanagement contract to fund development of casinos on the Indian lands. For all existing guaranteesof Indian debt, we have obtained a first lien on certain personal property (tangible and intangible) ofthe casino enterprise. There can be no assurance, however, that the value of such property wouldsatisfy our obligations in the event these guarantees were enforced. Additionally, we have receivedlimited waivers from the Indian tribes of their sovereign immunity to allow us to pursue our rightsunder the contracts between the parties and to enforce collection efforts as to any assets in which asecurity interest is taken. The aggregate outstanding balance of such debt as of December 31, 2004, was$246.7 million.
Some of our guarantees of the debt for casinos on Indian lands were modified during 2003,triggering the requirement under Financial Accounting Standards Board (‘‘FASB’’) Interpretation
21

No. 45, ‘‘Guarantor’s Accounting and Disclosure Requirements for Guarantees, Including IndirectGuarantees of Indebtedness of Others,’’ to recognize a liability for the estimated fair value of thoseguarantees. Liabilities, representing the fair value of our guarantees, and corresponding assets,representing the portion of our management fee receivable attributable to our agreements to providethe related guarantees, were recorded and are being amortized over the lives of the related agreements.We estimate the fair value of the obligation by considering what premium would have been required byus or by an unrelated party. The amounts recognized represent the present value of the premium ininterest rates and fees that would have been charged to the tribes if we had not provided theguarantees. The balance of the liability for the guarantees and of the related assets at December 31,2004 and 2003, was $5.5 million and $7.0 million, respectively.
OVERALL OPERATING RESULTS
On September 27, 2004, we reached an agreement to sell the assets and certain related currentliabilities of Harrah’s East Chicago and Harrah’s Tunica to another gaming company. The sale, which issubject to regulatory approvals, is expected to close in the first quarter of 2005. We present theseproperties in Assets/Liabilities held for sale and as part of our discontinued operations in ourConsolidated Financial Statements. The carrying value of the net assets of these properties atDecember 31, 2004, is $491.9 million, and they contributed $38.2 million, net of taxes of $18.4 million,to our 2004 net income. We ceased depreciation of their assets in September 2004. Had we not ceaseddepreciation of these assets, additional depreciation expense of $6.9 million would have been recorded.We expect to report a gain on the sale of these two properties in the quarter in which the transactioncloses. The discussion that follows is related to our continuing operations.
PercentageIncrease/(Decrease)
(In millions, except earnings per share) 2004 2003 2002 04 vs 03 03 vs 02
Casino revenues . . . . . . . . . . . . . . $4,077.7 $3,458.4 $3,285.9 17.9 % 5.2 %Total revenues . . . . . . . . . . . . . . . 4,548.3 3,948.9 3,747.9 15.2 % 5.4 %Income from operations . . . . . . . . 791.1 678.8 708.7 16.5 % (4.2)%Income from continuing
operations . . . . . . . . . . . . . . . . 329.5 261.1 282.2 26.2 % (7.5)%Net income . . . . . . . . . . . . . . . . . 367.7 292.6 235.0 25.7 % 24.5 %Earnings per share–diluted
From continuing operations . . . . 2.92 2.36 2.48 23.7 % (4.8)%Net income . . . . . . . . . . . . . . . 3.26 2.65 2.07 23.0 % 28.0 %
Operating margin . . . . . . . . . . . . . 17.4% 17.2% 18.9% 0.2 pt (1.7)pts
In 2004, total revenues increased for the seventh consecutive year and were 15.2% higher than in2003, primarily as a result of the acquisition of Horseshoe Gaming on July 1, 2004, strong results fromour properties in Southern Nevada and organic growth at most of our properties. We define organicgrowth as year-over-year increase in gaming revenues for properties that we have owned for bothperiods.
Our 2004 income from operations was 16.5% higher than in 2003, driven by the increased revenuesand lower gaming taxes at our Bluffs Run property as a result of legislation that settled an issue relatedto gaming taxes for casinos at racetracks. Net income increased 25.7% and diluted earnings per shareincreased 23.0% over our 2003 results.
REGIONAL RESULTS AND DEVELOPMENT PLANS
The executive decision makers of our Company review operating results, assess performance andmake decisions related to the allocation of resources on a property-by-property basis. We, therefore,
22

believe that each property is an operating segment and that it is appropriate to aggregate and presentthe operations of our Company as one reportable segment. In order to provide more detail in a moreunderstandable manner than would be possible on a consolidated basis, our properties have beengrouped as follows to facilitate discussion of our operating results:
West East North Central South Central Managed
Harrah’s Reno Harrah’s Atlantic Harrah’s Joliet Harrah’s Lake Harrah’s Ak-ChinHarrah’s/Harveys Lake Tahoe City Harrah’s North Charles Harrah’s CherokeeBill’s Showboat Atlantic Kansas City Harrah’s New Harrah’s PrairieHarrah’s Las Vegas City Harrah’s Council Orleans (after BandRio Bluffs June 7, 2002) Harrah’s RinconHarrah’s Laughlin Bluffs Run Harrah’s Louisiana Harrah’s NewLas Vegas Horseshoe Harrah’s St. Louis Downs Orleans (prior
Harrah’s Horseshoe Bossier to June 7, 2002)Metropolis City
Horseshoe Horseshoe TunicaHammond
In addition to the properties listed above, our discontinued operations reflect the results ofHarrah’s East Chicago and Harrah’s Tunica for all periods presented. For 2003 and 2002, discontinuedoperations also included the results of properties in Vicksburg, Mississippi and Central City, Colorado,both of which were sold in 2003.
West ResultsPercentage
Increase/(Decrease)
(In millions) 2004 2003 2002 04 vs 03 03 vs 02
Casino revenues . . . . . . . . . . . . . . $1,040.8 $ 904.7 $ 847.7 15.0% 6.7%Total revenues . . . . . . . . . . . . . . . 1,514.9 1,346.7 1,265.5 12.5% 6.4%Income from operations . . . . . . . . 306.0 220.8 193.9 38.6% 13.9%Operating margin . . . . . . . . . . . . . 20.2% 16.4% 15.3% 3.8 pts 1.1 pts
Southern Nevada
Our West properties posted record revenues and income from operations in 2004, driven by resultsfrom our Southern Nevada properties where strong cross-market play at, and cross-property playbetween, Harrah’s Las Vegas and the Rio, room pricing trends in Las Vegas, record revenues atHarrah’s Laughlin and revenues from Las Vegas Horseshoe, which opened on April 1, 2004, helpedSouthern Nevada revenues increase by 18.1% over 2003 levels. We define cross-market play as gamingby customers at Harrah’s Entertainment properties other than their ‘‘home’’ casino. 2004 income fromoperations for our Southern Nevada properties was 48.7% higher than in 2003 as a result of the higherrevenues and improved operating margins.
Construction began in second quarter 2004 on a 60,000-square-foot expansion of the Rio Pavilionand Convention Center in Las Vegas. The approximate $39 million expansion will increase the overallsize of the Rio’s convention center to 160,000 square feet and is scheduled for completion in mid-2005.As of December 31, 2004, $22.5 million had been spent on this project.
In 2003, strong cross-market and retail play, effective marketing and air charter programs andeffective cost control measures drove record revenues and income from operations in Southern Nevada.We define retail play as Total Rewards customers who typically spend up to $50 per visit. 2003 revenuesat our Southern Nevada properties were 9.1% higher than in 2002, and income from operations was up24.5% over 2002.
23

Northern Nevada
Revenues from our Northern Nevada properties were 1.2% higher than in 2003, and income fromoperations was 8.3% higher than last year. With the expectation of continued expansion of Indiangaming in California, we believe that achieving growth at our Northern Nevada properties, particularlyin Reno, will be a challenge.
In 2003, Northern Nevada revenues were 1.4% higher than in 2002, but income from operationswas down 9.3%. Our Northern Nevada properties faced the challenge of increased competition fromIndian casinos in California and weak retail and unrated play (play by customers without a TotalRewards card). Increased utilization of air charter programs and targeted marketing programs helpedmaintain revenues, but the costs of these programs resulted in some margin erosion.
In our 2003 annual assessment of goodwill and other nonamortizing intangible assets, wedetermined that the remaining goodwill associated with our Reno property was impaired. A charge ofapproximately $6.3 million, representing the remaining unamortized goodwill at Reno, was taken in thefourth quarter of 2003 for this impairment.
East Results
PercentageIncrease/(Decrease)
(In millions) 2004 2003 2002 04 vs 03 03 vs 02
Casino revenues . . . . . . . . . . . . . . . . . $832.6 $817.1 $808.7 1.9 % 1.0 %Total revenues . . . . . . . . . . . . . . . . . . . 780.9 781.3 777.6 (0.1)% 0.5 %Income from operations . . . . . . . . . . . . 199.8 217.3 216.9 (8.1)% 0.2 %Operating margin . . . . . . . . . . . . . . . . 25.6% 27.8% 27.9% (2.2)pts (0.1)pt
2004 revenues at our East properties were level with 2003 and income from operations was downby 8.1% from last year. Showboat’s revenues and income from operations, which were 2.8% and 7.7%,respectively, higher than in 2003, were aided by a new hotel tower that opened in second quarter 2003and 450 slot machines that were added in third quarter 2003. Harrah’s Atlantic City’s revenues andincome from operations were 2.4% and 18.0%, respectively, lower than in 2003. Harrah’s Atlantic Cityhas been more directly affected than Showboat by the new competitor in the Atlantic City market, butmarketing programs to address the aggressive customer acquisition campaign of the new competitor arehaving some success. In addition, results at both of our Atlantic City properties were impacted by amonth-long union strike during fourth quarter 2004.
Construction began in fourth quarter 2004 on a House of Blues Club at our Showboat property inAtlantic City. This approximate $61 million project will add a range of amenities to the property,including a concert hall, nightclub and restaurant, and a private member ‘‘Foundation Room.’’ Theproject is scheduled for completion in late June 2005. As of December 31, 2004, $6.6 million had beenspent on this project.
In 2003, contributions from recent investments at our Atlantic City properties and execution of ahighly targeted marketing program helped offset the impact of a new competitor in the Atlantic Citymarket. At Showboat Atlantic City, where a new hotel tower opened in second quarter 2003 and 450slot machines were added in third quarter 2003, revenues were up 2.2% and income from operationswas 10.1% higher than in 2002. Harrah’s Atlantic City’s revenues and income from operations declined0.9% and 5.2%, respectively, from 2002 levels, as that property was more affected by the opening ofthe first new competitor in Atlantic City in more than a decade. An additional 500 slot machines wereadded at this property in December 2002.
24

North Central Results
PercentageIncrease/(Decrease)
(In millions) 2004 2003 2002 04 vs 03 03 vs 02
Casino revenues . . . . . . . . . . . . . . $1,323.0 $1,089.2 $1,150.6 21.5% (5.3)%Total revenues . . . . . . . . . . . . . . . 1,299.9 1,070.4 1,140.8 21.4% (6.2)%Income from operations . . . . . . . . 249.3 189.6 254.1 31.5% (25.4)%Operating margin . . . . . . . . . . . . . 19.2% 17.7% 22.3% 1.5pts (4.6)pts
An agreement has been reached to sell Harrah’s East Chicago; therefore, this property is nolonger included in our North Central grouping. Results of Harrah’s East Chicago have been classifiedas discontinued operations for all periods presented.
In 2004, the increases in revenues and income from operations at our North Central propertieswere driven by the acquisition of Horseshoe Hammond on July 1, 2004, and lower gaming taxes at ourBluffs Run property as a result of legislation that settled an issue related to gaming taxes for casinos atracetracks.
In 2003, higher gaming taxes and competitive pressures led to declines from 2002 revenues andincome from operations at our North Central properties.
Chicagoland/Illinois
Combined revenues for 2004 were 50.4% higher than combined revenues for 2003, and combinedincome from operations was 38.3% higher than last year due to results from Horseshoe Hammondsubsequent to its acquisition. Excluding results of Horseshoe Hammond, combined revenues were up3.1% and income from operations was down 11.1% from last year as a result of increases in stategaming taxes, admission taxes and increased marketing costs.
Combined 2003 revenues and income from operations at our Chicagoland/Illinois properties were12.1% and 34.3%, respectively, below 2002. Higher gaming and admission taxes, heightenedcompetition and winter storms during the first quarter of 2003 were responsible for the declines. Newtax legislation in Illinois in 2003 raised the maximum gaming tax rate to 70% and impacted our incomefrom operations by $16.2 million in 2003. In order to sustain profitability under the higher tax scheme,operational changes were implemented at Joliet in the third quarter, and revenues declined as a resultof these changes.
Missouri
2004 revenues at our Missouri properties were 3.9% higher than in 2003, due to higher revenues atour St. Louis property, but income from operations was 5.8% below last year. Gains at our St. Louisproperty, driven by recent capital investments including a new hotel tower, our Total Rewards programand improvements made to the slot floor, were more than offset by declines at our North Kansas Cityproperty where recent capital improvements by two competitors impacted results.
Construction was completed in third quarter 2004 on an $80 million expansion of Harrah’sSt. Louis, which included a second hotel tower, redesign of the hotel lobby, new valet parking areas,the addition of parking garage express ramps and the expansion of two restaurants and other amenities.
A $126 million expansion and property enhancement project at Harrah’s North Kansas City brokeground in second quarter 2004. This project, which will add a 206-room hotel addition, new restaurantsand other amenities, is scheduled for completion in the third quarter of 2005. As of December 31,2004, $33.8 million had been spent on this project.
25

In 2003, combined revenues for our Missouri properties declined 4.1% from 2002 and income fromoperations was down 20.9% due primarily to heightened competition in both the St. Louis and NorthKansas City markets. Harrah’s St. Louis’ rebound from the increased competition began in fourthquarter 2003, driven by our Total Rewards program and improvements made to the slot floor. In theKansas City market, a competitor opened its expanded facility in third quarter 2003 and anothercompetitor opened its new barge facility in fourth quarter 2003.
Iowa
2004 revenues for our Iowa properties were 6.4% higher than in 2003, and income from operationsmore than doubled 2003 due to lower gaming taxes in 2004 following the resolution of the gaming taxrate issues discussed below.
Casinos at racetracks in Iowa historically had been taxed at a higher rate (36% in 2004) than thecasinos on riverboats operating in Iowa (20%). The Iowa Supreme Court issued an opinion inJune 2002 that this disparity was unconstitutional. The State appealed the Iowa Supreme Court’sdecision to the United States Supreme Court and in June 2003, the United States Supreme Courtoverturned the ruling and remanded the case back to the Iowa Supreme Court for furtherconsideration. In February 2004, the Iowa Supreme Court ruled that the disparity violates the IowaConstitution, a ruling the State appealed to the United States Supreme Court in April 2004. TheUnited States Supreme Court has declined to hear this case.
In April 2004, the Iowa legislature passed legislation to effectively settle the issues regarding thegaming tax rates. The new legislation provides for a tax rate of 22% for both riverboats and racetrackseffective July 1, 2004. However, racetracks have the option to conduct table games and video gamesthat simulate table games by paying a $10 million fee to the State and a gaming tax rate of 24%. 20%of the $10 million fee could be used to offset wagering taxes for each of the five fiscal years beginningJuly 1, 2008. We plan to add table games to the Bluffs Run facility in conjunction with the rebranding,renovation and expansion of that facility (see discussion below). Also, for the period July 1, 2002, toJune 30, 2004, racetracks had to make a lump sum non-refundable payment to the State to enable theState to receive a total amount of taxes for that period based on a 24% tax rate. Bluffs Run paidapproximately $8.9 million for this lump sum payment. During that period we had paid taxes at the20% rate for Bluffs Run, following the State’s instructions. However, given the uncertainty of thissituation, we continued to accrue gaming taxes at the higher rate (between 32% and 36%) and accruedapproximately $20.3 million, after consideration of the lump sum payment, in state gaming taxes thatwe did not have to pay. Accruals related to Iowa gaming taxes were adjusted in second quarter 2004,with $3.7 million, representing the adjustment for first quarter 2004, credited to the property’s incomefrom operations and $16.6 million, representing the adjustment for prior periods, credited to write-downs, reserves and recoveries.
In accordance with previous agreements and as additional purchase price consideration, a paymentof approximately $73 million was made to Iowa West Racing Association (‘‘Iowa West’’), the entityholding the pari-mutuel and gaming license for the Bluffs Run Casino and with whom we have amanagement agreement to operate that property. The additional payment to Iowa West increasedgoodwill attributed to the Bluffs Run property. The payment to Iowa West assumed we will operatetable games at Bluffs Run and pay a 24% tax rate; however, Iowa West has taken the position that thepurchase price adjustment should be based on a tax rate of 22%, which would result in an additional$12 million payment to Iowa West. If an additional payment is required, it will increase goodwillattributed to this property. We anticipate that the issue will be resolved by arbitration during 2005.
In fourth quarter 2004, we announced plans to rebrand the Bluffs Run Casino under theHorseshoe brand as part of an $85 million renovation and expansion of that property. The property’s
26

greyhound racetrack will remain in operation and retain the Bluffs Run brand. Construction began inFebruary 2005 with completion scheduled for the first quarter of 2006.
Combined 2003 revenues from our Iowa properties were 0.9% above 2002 revenues, but incomefrom operations was 10.5% below 2002 due, in part, to higher gaming taxes at our Bluffs Run property,where gaming taxes increased in accordance with a predetermined rate increase.
South Central Results
PercentageIncrease/(Decrease)
(In millions) 2004 2003 2002 04 vs 03 03 vs 02
Casino revenues . . . . . . . . . . . . . . . . . $880.7 $647.0 $478.4 36.1% 35.2%Total revenues . . . . . . . . . . . . . . . . . . . 875.9 659.9 488.2 32.7% 35.2%Income from operations . . . . . . . . . . . . 123.1 92.3 78.7 33.4% 17.3%Operating margin . . . . . . . . . . . . . . . . 14.1% 14.0% 16.1% 0.1pt (2.1)pts
An agreement has been reached to sell Harrah’s Tunica; therefore, this property is no longerincluded in our South Central grouping. Results of Harrah’s Tunica have been classified as discontinuedoperations for all periods presented.
Combined 2004 revenues and income from operations were higher by 32.7% and 33.4%,respectively, than in 2003 due to results from Horseshoe Bossier City and Horseshoe Tunica subsequentto their July 1, 2004, acquisition and increased revenues from Louisiana Downs, Harrah’s New Orleansand Harrah’s Lake Charles and partially offset by the loss of revenues in 2004 due to the sale ofHarrah’s Shreveport. The permanent facility at Louisiana Downs opened in second quarter 2004 with1,400 slot machines. 900 slot machines had been in service since second quarter 2003 at LouisianaDowns.
Combined 2003 revenues at our South Central properties were up 35.2% and combined incomefrom operations was up 17.3%, driven by a full year of consolidation of New Orleans’ resultssubsequent to the acquisition of a controlling interest in that property in early June 2002 and resultsfrom Louisiana Downs, which was acquired in December 2002. Harrah’s New Orleans contributed$285.4 million in revenues and $46.8 million in income from operations in 2003 compared to$154.5 million in revenues and $16.0 million in income from operations subsequent to its consolidationin 2002. The opening of an expanded buffet and new steakhouse at Harrah’s New Orleans in 2003attracted new business to that property. Prior to our acquisition of a controlling interest in thatproperty, we had limited ability to invest in amenities, and we are now actively pursuing suchopportunities. Construction began in second quarter 2004 on a 26-story, 450-room, $150 million hoteltower at Harrah’s New Orleans. The property does not currently operate a hotel, although it doesutilize rooms at third-party hotels. The hotel is expected to open in the first quarter of 2006.$23.8 million had been spent on this project as of December 31, 2004.
On December 20, 2002, we completed our acquisition of a controlling interest in Louisiana Downs,a thoroughbred racetrack in Bossier City, Louisiana, and in May 2003, 900 slot machines were placedin service there. Construction was completed during second quarter 2004 on Phase II of the expansionof Louisiana Downs, which included a new, permanent facility with approximately 1,400 slot machines.Our renovation and expansion of Louisiana Downs cost approximately $110 million. Louisiana Downscontributed $56.9 million in revenues in 2003, but preopening costs related to the introduction of slotmachines at the facility drove a loss from operations of $1.4 million.
Our Lake Charles property has faced increasing competition over the last several years, includingthe addition of slot machines at a racetrack located closer than our property to one of our Texas feedermarkets and additional Indian casino offerings. Approximately $56.1 million of goodwill is allocated to
27

the Lake Charles property. The operating results for the property did improve in 2004 over the prioryear; however, a new competitor is expected to open in the Lake Charles market in mid-2005. Shouldthe opening of the new competitor negatively impact operating results at our Lake Charles property, itcould impact the analysis for the impairment of goodwill for that operating unit.
Due to a decision to sell Harrah’s Shreveport, which was completed in second quarter 2004, weclassified that property in Assets held for sale on our Consolidated Balance Sheets and ceaseddepreciating its assets. Since the Horseshoe Gaming acquisition gave us a continued presence in theShreveport-Bossier City market, Harrah’s Shreveport’s operating results were not classified asdiscontinued operations. No gain or loss was recorded on this sale.
On June 30, 2003, we announced an agreement to sell Harrah’s Vicksburg and that sale wascompleted on October 27, 2003. 2003 results for Harrah’s Vicksburg were presented as discontinuedoperations and results for 2002 were reclassified to conform to the 2003 presentation. A loss of$0.5 million, net of tax, resulted from this sale.
Managed Casinos and Other
PercentageIncrease/(Decrease)
(In millions) 2004 2003 2002 04 vs 03 03 vs 02
Revenues . . . . . . . . . . . . . . . . . . . . . . . . . $76.7 $90.6 $75.7 (15.3)% 19.7%Income/(loss) from operations . . . . . . . . . . (16.7) 11.4 21.6 N/M (47.2)%
N/M = Not meaningful
With the acquisition of the remaining interest in the New Orleans casino in 2002, our managedcasinos now consist of four tribal casinos. The table below gives the location and expiration date of thecurrent management contracts for our Indian properties as of December 31, 2004.
Expiration ofCasino Location Management Agreement
Harrah’s Cherokee . . . . . . . . . . . Cherokee, North Carolina November 2011Harrah’s Ak-Chin . . . . . . . . . . . . near Phoenix, Arizona December 2009Harrah’s Rincon . . . . . . . . . . . . . near San Diego, California November 2011Harrah’s Prairie Band . . . . . . . . . near Topeka, Kansas January 2008
Our 2004 managed casinos and other results were lower than in 2003 due to lower fee structuresat some of our managed casinos where management agreements have been extended. New contractsmay provide for reductions in management fees; however, expansions at the properties are expected toincrease the fee base and keep the overall income stream stable.
Also included in managed casinos and other are our development expenses, brand marketing costs,losses from nonconsolidating subsidiaries and other costs that are directly related to our casinooperations and development but are not property specific.
We recently suspended operation of LuckyMe, our on-line gaming initiative in the UnitedKingdom. No material charges were recorded as a result of this action. Losses related to LuckyMewere approximately $9.3 million for 2004.
Revenues from our managed properties were higher in 2003 than in the previous year due to a fullyear of management fees from Harrah’s Rincon Casino and Resort, owned by the Rincon San LuisenoBand of Mission Indians (‘‘Rincon’’) in Southern California, which opened in August 2002. Theincreased fees from Rincon were partially offset by changes in fee structures provided by extended
28

management agreements and by the elimination of management fees from Harrah’s New Orleanssubsequent to its consolidation with our financial results in June 2002.
Construction began in January 2004 on a $60 million expansion of Harrah’s Cherokee SmokyMountains Casino in Cherokee, North Carolina, that will add a 15-story hotel tower with approximately320 rooms, which is scheduled for completion in second quarter 2005. A 252-room hotel and30,000-square-foot conference center opened at that property in second quarter 2002, and in fourthquarter 2002, an expansion project was completed that added approximately 22,000 square feet ofcasino space.
A $165 million expansion of the Harrah’s Rincon property was completed in December 2004. Theexpansion added a 21-story hotel tower with approximately 460 rooms, a spa, a new hotel lobby,additional meeting space, additional casino space and a 1,200-space parking structure.
Construction was completed in August 2004 on a $55 million expansion project at Harrah’s PrairieBand. The expansion includes the addition of approximately 200 hotel rooms, a 12,000-square-footconvention center and a new restaurant.
Construction costs of Indian casinos and hotels have been funded by the tribes or by the tribes’debt, some of which we guarantee. See DEBT AND LIQUIDITY for further discussion of ourguarantees of debt related to Indian projects.
Other Factors Affecting Net Income
PercentageIncrease/(Decrease)
(Income)/Expense 2004 2003 2002 04 vs 03 03 vs 02
(In millions)
Development costs . . . . . . . . . . . . . . . $ 18.5 $ 19.6 $ 9.5 (5.6)% N/MWrite-downs, reserves and recoveries . . 9.6 10.5 4.5 (8.6)% N/MProject opening costs . . . . . . . . . . . . . . 9.5 7.4 1.7 28.4% N/MCorporate expense . . . . . . . . . . . . . . . . 66.8 52.6 56.6 27.0% (7.1)%Merger and integration costs for
Caesars acquisition . . . . . . . . . . . . . . 2.3 – – N/M N/MAmortization of intangible assets . . . . . 9.4 4.8 4.5 95.8% 6.7%Interest expense, net . . . . . . . . . . . . . . 271.8 234.4 240.2 16.0% (2.4)%Losses on early extinguishments of debt – 19.1 – N/M N/MOther income . . . . . . . . . . . . . . . . . . . (9.5) (2.9) (2.1) N/M 38.1%Effective tax rate . . . . . . . . . . . . . . . . . 36.1% 36.3% 37.1% (0.2)pt (0.8)ptMinority interests . . . . . . . . . . . . . . . . $ 8.6 $ 11.6 $ 14.0 (25.9)% (17.1)%Discontinued operations, net of income
taxes . . . . . . . . . . . . . . . . . . . . . . . . (38.2) (31.6) (44.0) 20.9% (28.2)%Change in accounting principle, net of
income taxes . . . . . . . . . . . . . . . . . . – – 91.2 N/M N/M
N/M = Not meaningful
Development costs for 2004 were lower than in 2003 due to changes in or timing of developmentactivities in jurisdictions, including Rhode Island, Pennsylvania and the United Kingdom, that areconsidering allowing development and operation of casinos or casino-like operations. Subsequent to theend of 2004, we dissolved the joint venture formed in 2003 with Gala Group, a United Kingdom(‘‘UK’’) based gaming operator, to develop regional casinos in the UK in response to the UKgovernment’s proposal to restrict development of regional casinos. We will focus on opportunities to
29

develop large-scale destination casino resorts with more than 50,000 square feet of gaming space, aswell as hotel rooms, restaurants and entertainment venues.
Write-downs, reserves and recoveries include various pretax charges to record asset impairments,contingent liabilities reserves, project write-offs, demolition costs and recoveries at time of sale and ofpreviously recorded reserves and other nonroutine transactions. In 2004, we began tracking demolitioncosts separate from project opening costs. The components of Write-downs, reserves and recoverieswere as follows:
(In millions) 2004 2003 2002
Contribution to The Harrah’s Foundation . . . . . . . . . . . . . . $ 10.0 $ – $ –Demolition costs . . . . . . . . . . . . . . . . . . . . . . . . . . . . . . . . . 5.8 – –Write-off of abandoned assets and other costs . . . . . . . . . . . 4.9 2.6 6.3Settlement of litigation . . . . . . . . . . . . . . . . . . . . . . . . . . . . 3.5 – –Termination of contracts . . . . . . . . . . . . . . . . . . . . . . . . . . . 2.0 – 0.2Reversal of prior year Iowa gaming tax accrual . . . . . . . . . . . (16.6) – –Impairment of goodwill . . . . . . . . . . . . . . . . . . . . . . . . . . . . – 6.3 –Impairment of long-lived assets . . . . . . . . . . . . . . . . . . . . . . – 2.5 1.5Settlement of sales tax contingency . . . . . . . . . . . . . . . . . . . – (0.9) (6.5)Charge for structural repairs at Reno . . . . . . . . . . . . . . . . . . – – 5.0Recoveries from previously impaired assets and reserved
amounts . . . . . . . . . . . . . . . . . . . . . . . . . . . . . . . . . . . . . – – (2.0)
$ 9.6 $10.5 $ 4.5
Project opening costs for each of the three years presented include costs incurred in connectionwith the integration of acquired properties into Harrah’s Entertainment’s systems and technology andcosts incurred in connection with expansion and renovation projects at various properties.
Corporate expense increased 27.0% in 2004 from 2003, primarily due to higher incentivecompensation plan expenses, on-going costs related to Sarbanes-Oxley compliance and increaseddepreciation expense.
Merger and integration costs for the Caesars acquisition include costs for consultants anddedicated internal resources to plan for the merger and integration of Caesars into Harrah’sEntertainment.
Amortization of intangible assets increased in 2004 due to amortization of intangible assetsacquired from Horseshoe Gaming on July 1, 2004, based on the preliminary purchase price allocationfor that acquisition.
Interest expense was higher in 2004 than in 2003 due to additional debt related to our acquisitionof Horseshoe Gaming on July 1, 2004. For our fixed-rate debt subject to interest rate swap agreements,the average interest rate received was 7.6%. The average interest rate on our variable-rate debt,excluding the impact of our swap agreements, was 3.2% at December 31, 2004, compared to 2.3% atDecember 31, 2003. A change in interest rates will impact our financial results. For example, assuminga constant outstanding balance for our variable-rate debt for the next twelve months, a hypothetical 1%change in corresponding interest rates would change interest expense for the next twelve months byapproximately $22.4 million. Our variable-rate debt, including $500 million of fixed-rate debt for whichwe have entered into interest rate swap agreements, represents approximately 43% of our total debt,while our fixed-rate debt is approximately 57% of our total debt. (For discussion of our interest rateswap agreements, see DEBT AND LIQUIDITY, Derivative Instruments, Interest Rate Swaps.)
Losses on early extinguishments of debt in 2003 represent premiums paid and write-offs ofunamortized deferred financing costs associated with debt retired before maturity. In compliance with
30

SFAS No. 145 these losses on early extinguishments of debt no longer qualify for presentation asextraordinary items. (See DEBT AND LIQUIDITY, Extinguishments of Debt.)
2004 Other income includes interest income on the cash surrender value of life insurance policies,benefits from a life insurance policy, interest income related to the sale of land and othermiscellaneous non-operating items. 2003 Other income included interest income on the cash surrendervalue of life insurance policies and settlement of a litigation claim, partially offset by benefits from alife insurance policy. 2002 Other income included interest income on the cash surrender value of lifeinsurance policies, net proceeds from litigation settlements and other miscellaneous items.
The effective tax rate for 2004, as well as for 2003 and 2002, is higher than the federal statutoryrate primarily due to state income taxes. Our effective tax rate is affected by the mix of taxable incomeamong the various states.
Minority interests reflect minority owners’ shares of income from our majority owned subsidiaries.
Discontinued operations reflect the results of Harveys Wagon Wheel Hotel/Casino in Central City,Colorado, Harrah’s Vicksburg, Harrah’s East Chicago and Harrah’s Tunica. Harveys Colorado andHarrah’s Vicksburg were sold in 2003. 2003 and 2002 results for these properties have been reclassifiedto conform to the 2004 presentation. (See Note 3 to our Consolidated Financial Statements.)
The change in accounting principle represents the first quarter 2002 charge for the impairment ofRio’s goodwill and trademark recorded in connection with the implementation of SFAS No. 142. (SeeNote 4 to our Consolidated Financial Statements.)
EFFECTS OF CURRENT ECONOMIC AND POLITICAL CONDITIONS
Competitive Pressures
Due to the limited number of new markets opening for development in recent years, many casinooperators are reinvesting in existing markets to attract new customers, thereby increasing competitionin those markets. As companies have completed expansion projects, supply has typically grown at afaster pace than demand in some markets and competition has increased significantly. Furthermore,several operators, including Harrah’s Entertainment, have announced plans for additional developmentsor expansions in some markets.
The Louisiana legislature has authorized the use of slot machines at horse racing tracks in fourparishes in Louisiana. We operate casinos in three of these markets. In first quarter 2002, a horseracing facility, located in one of those parishes where the use of slot machines has been authorized andnear our property in Lake Charles, Louisiana, opened with approximately 1,500 machines. The horseracing facility is approximately 25 miles closer to one of our major feeder markets than our property.Revenues and income from operations at our Lake Charles property have been negatively impacted bythe addition of this new competitor. In fourth quarter 2002, we acquired a controlling interest inLouisiana Downs, a thoroughbred racetrack in Bossier City, Louisiana, which is in another of theparishes where the use of slot machines has been authorized. In Orleans Parish, where Harrah’s NewOrleans is located, voters approved the use of slot machines at a racetrack in October 2003.
In the third quarter of 2001, the State of Louisiana selected a competitor to receive the fifteenthand final riverboat gaming license to be issued by the State, under the legislation legalizing riverboatgaming in that State. The competitor’s project is for a riverboat casino in Lake Charles. Constructionof that facility began in September 2003, and it is anticipated to open by mid-2005. We believe that thenew riverboat competition in the Lake Charles area will have a negative impact on our operationsthere.
In Atlantic City, a competitor opened a 2,000-room hotel and casino in July 2003 and in 2004,announced plans to expand gaming and nongaming amenities, including a new hotel tower, at that
31

property. A competitor in Missouri completed a large casino expansion in third quarter 2002 that islocated near our St. Louis property, a competitor in the Joliet market completed a new barge facility insecond quarter 2002 and another competitor in the Chicagoland market replaced its boats with bargesin second quarter 2003. In the Kansas City market, a competitor opened its expanded facility in thirdquarter 2003 and another competitor opened its new barge facility in fourth quarter 2003. Theshort-term impact of increased competition in these markets has been negative.
A competitor is scheduled to open a new property in Las Vegas in the second quarter of 2005,which could impact our properties there.
In October 2001, the legislature of the State of New York approved a bill authorizing six new tribalcasinos in that state and video lottery terminals at tracks. The measure allows the governor of NewYork to negotiate gaming compacts with American Indian tribes to operate three casinos in theCatskills and three casinos in western New York.
In September 1999, the State of California and approximately 60 Indian tribes executed Class IIIGaming Compacts, which other California tribes can join. The Compacts will allow each tribe tooperate, on tribal trust lands, two casinos with up to 2,000 slot machines per tribe and unlimited house-banked card games. Our own agreements with Rincon are a result of these events (see REGIONALRESULTS AND DEVELOPMENT PLANS, Managed Casinos and Other).
Other states are also considering legislation enabling the development and operation of casinos orcasino-like operations.
Although the short-term effect of such competitive developments on our Company generally hasbeen negative, we are not able to determine the long-term impact, whether favorable or unfavorable,that these trends and events will have on current or future markets. We believe that the geographicdiversity of our operations; our focus on multi-market customer relationships; our service training, ourrewards and customer loyalty programs; and our continuing efforts to establish our brands as premierbrands upon which we have built strong customer loyalty have well-positioned us to face the challengespresent within our industry. We utilize the capabilities of WINet, a sophisticated nationwide customerdatabase, and Total Rewards, a nationwide loyalty program that allows our customers to earn cash,comps and other benefits for playing at Harrah’s Entertainment casinos. We believe these sophisticatedmarketing tools provide us with competitive advantages, particularly with players who visit more thanone market.
Political Uncertainties
The casino entertainment industry is subject to political and regulatory uncertainty. From time totime, individual jurisdictions have also considered legislation or referendums, which could adverselyimpact our operations. The likelihood or outcome of similar legislation and referendums in the futurecannot be predicted.
The casino entertainment industry represents a significant source of tax revenues to the variousjurisdictions in which casinos operate. From time to time, various state and federal legislators andofficials have proposed changes in tax laws, or in the administration of such laws, which would affectthe industry. It is not possible to determine the scope or likelihood of possible future changes in taxlaws or in the administration of such laws. If adopted, such changes could have a material adverseeffect on our financial results.
Addition of International Operations
The planned acquisition of Caesars will include certain properties located in countries outside theUnited States. International operations are subject to inherent risks including variation in localeconomies, currency fluctuation, greater difficulty in accounts receivable collection, trade barriers,burden of complying with a variety of international laws and political and economic instability.
32

In addition, Caesars has announced plans to develop and operate a casino in the United Kingdom,partnering with Quintain Estates and Development Group. Development in the United Kingdom isdependent on passage of proposed legislative reform in the United Kingdom gaming laws andregulations and on receipt of a gaming license.
Economic Conditions
Historically, economic conditions have had little effect on our operations, but we believe thatadverse economic conditions could affect future results. We feel that our marketing programs, use ofour technology to change the mix of slot machines and table games and our cost managementprograms have helped, in the past, to offset the impact of a sluggish economy.
National Defense and Homeland Security Matters
The September 11, 2001, terrorist attacks, the potential for future terrorist attacks, the nationaland international responses to terrorist attacks and other acts of war or hostility have created manyeconomic and political uncertainties, which could adversely affect our business and results of operationsin ways that cannot presently be predicted. For example, the United States Coast Guard is consideringregulations designed to increase homeland security, which, if passed, could affect some of ourproperties and require significant expenditures to bring such properties into compliance. Furthermore,given current conditions in the global insurance markets, we are predominantly uninsured for lossesand interruptions caused by terrorist acts and acts of war.
SIGNIFICANT ACCOUNTING POLICIES AND ESTIMATES
We prepare our Consolidated Financial Statements in conformity with accounting principlesgenerally accepted in the United States. Certain of our accounting policies, including the estimatedlives assigned to our assets, the determination of bad debt, asset impairment, fair value ofself-insurance reserves and the calculation of our income tax liabilities, require that we apply significantjudgment in defining the appropriate assumptions for calculating financial estimates. By their nature,these judgments are subject to an inherent degree of uncertainty. Our judgments are based on ourhistorical experience, terms of existing contracts, our observance of trends in the industry, informationprovided by our customers and information available from other outside sources, as appropriate. Therecan be no assurance that actual results will not differ from our estimates. The policies and estimatesdiscussed below are considered by management to be those in which our policies, estimates andjudgments have a significant impact on issues that are inherently uncertain.
Property and Equipment
We have significant capital invested in our property and equipment, which representsapproximately 55% of our total assets. Judgments are made in determining the estimated useful lives ofassets, salvage values to be assigned to assets and if or when an asset has been impaired. The accuracyof these estimates affects the amount of depreciation expense recognized in our financial results andwhether we have a gain or loss on the disposal of the asset. We assign lives to our assets based on ourstandard policy, which is established by management as representative of the useful life of eachcategory of asset. We review the carrying value of our property and equipment whenever events andcircumstances indicate that the carrying value of an asset may not be recoverable from the estimatedfuture cash flows expected to result from its use and eventual disposition. The factors considered bymanagement in performing this assessment include current operating results, trends and prospects, aswell as the effect of obsolescence, demand, competition and other economic factors. In estimatingexpected future cash flows for determining whether an asset is impaired, assets are grouped at theoperating unit level, which for most of our assets is the individual casino.
33

Goodwill and Other Intangible Assets
We have approximately $2.2 billion in goodwill and other intangible assets in our ConsolidatedBalance Sheets resulting from our acquisition of other businesses. The purchase price of an acquisitionis allocated to the underlying assets acquired and liabilities assumed based upon their estimated fairvalues at the date of acquisition. We determine the estimated fair values based on independentappraisals, discounted cash flows, quoted market prices and estimates made by management. To theextent that the purchase price exceeds the fair value of the net identifiable tangible and intangibleassets aquired, such excess is allocated to goodwill.
An accounting standard adopted in 2002 requires a review at least annually of goodwill and othernonamortizing intangible assets for impairment. We completed our initial assessment for impairment ofgoodwill and other nonamortizing intangible assets and recorded an impairment charge in first quarter2002. We complete our annual assessment for impairment in fourth quarter each year, and in fourthquarter 2003, we determined that, except for the goodwill associated with Harrah’s Reno, goodwill andintangible assets with indefinite lives have not been impaired. A charge was recorded in fourth quarterfor the impairment of Reno’s remaining goodwill. The annual evaluation of goodwill and othernonamortizing intangible assets requires the use of estimates about future operating results of eachreporting unit to determine their estimated fair value. Changes in forecasted operations can materiallyaffect these estimates. Once an impairment of goodwill or other intangible assets has been recorded, itcannot be reversed.
Total Rewards Point Liability Program
Our customer rewards program, Total Rewards, offers incentives to customers who gamble at ourcasinos throughout the United States. Prior to 2003, customers received cash-back and other offersmade in the form of coupons that were mailed to the customer and were redeemable on a subsequentvisit to one of our properties. The coupons generally expired 30 days after they were issued. Given therequirement of a return visit to redeem the offer and the short-term expiration date, with no ability torenew or extend the offer, we recognized the expense of these offers when the coupons were redeemed.
In fourth quarter 2002, a decision was made to change our Total Rewards program in 2003 to giveour customers greater flexibility and control over the rewards they receive for playing at our casinos.Under the new program, customers are able to accumulate, or bank, Reward Credits over time thatthey may redeem at their discretion under the terms of the program. The Reward Credit balance willbe forfeited if the customer does not earn a Reward Credit over the prior six-month period. As a resultof the ability of the customer to bank the Reward Credits under the revised program, our accountingfor the Total Rewards program changed and we accrue the expense of Reward Credits, afterconsideration of estimated breakage, as they are earned. To implement this change in the program, aninitial bank of Reward Credits was offered to our existing customers. The amount of credits offered forthis initial bank was calculated based upon 2002 tracked play at our casinos. As a result of the decisionto extend this initial offer, an accrual of $6.9 million was recorded in 2002 to recognize our estimate ofthe expense of this implementation offer. Under the current program, the value of the cost to provideReward Credits is expensed as the Reward Credits are earned. To arrive at the estimated costassociated with Reward Credits, estimates and assumptions are made regarding incremental marginalcosts of the benefits, breakage rates and the mix of goods and services for which Reward Credits willbe redeemed. We use historical data to assist in the determination of estimated accruals. AtDecember 31, 2004 and 2003, $36.2 million and $25.7 million, respectively, was accrued for the cost ofanticipated Total Rewards credit redemptions. The Company is planning to integrate the propertiesacquired from Horseshoe Gaming in 2004 into our Total Rewards Program during 2005.
Our Horseshoe properties have a customer rewards program in which customers earn points basedon their play. These points are primarily redeemable for cash and expire after one year. The liability
34

related to the outstanding points, which is based on historical redemption activity, was $3.0 million atDecember 31, 2004.
Bad Debt Reserves
We reserve an estimated amount for receivables that may not be collected. Methodologies forestimating bad debt reserves range from specific reserves to various percentages applied to agedreceivables. Historical collection rates are considered, as are customer relationships, in determiningspecific reserves. At December 31, 2004 and 2003, we had $48.6 million and $51.5 million, respectively,in our bad debt reserve. As with many estimates, management must make judgments about potentialactions by third parties in establishing and evaluating our reserves for bad debts.
Self-Insurance Accruals
We are self-insured up to certain limits for costs associated with general liability, workers’compensation and employee health coverage. Insurance claims and reserves include accruals ofestimated settlements for known claims, as well as accruals of actuarial estimates of incurred but notreported claims. At December 31, 2004 and 2003, we had total self-insurance accruals reflected in ourConsolidated Balance Sheets of $97.6 million and $89.3 million, respectively. In estimating these costs,we consider historical loss experience and make judgments about the expected levels of costs per claim.We also rely on independent consultants to assist in the determination of estimated accruals. Theseclaims are accounted for based on actuarial estimates of the undiscounted claims, including thoseclaims incurred but not reported. We believe the use of actuarial methods to account for theseliabilities provides a consistent and effective way to measure these highly judgmental accruals; however,changes in health care costs, accident frequency and severity and other factors can materially affect theestimate for these liabilities. We continually monitor the potential for changes in estimates, evaluateour insurance accruals and adjust our recorded provisions.
Income Taxes
We account for income taxes under SFAS No. 109, ‘‘Accounting for Income Taxes,’’ wherebydeferred tax assets and liabilities are recognized for the expected future tax consequences of events thathave been included in the financial statements or income tax returns. The effect on the income taxprovision and deferred tax assets and liabilities of a change in tax rates is recognized in income in theperiod that includes the enactment date. Deferred tax assets and liabilities are determined based ondifferences between financial statement carrying amounts of existing assets and their respective taxbases using enacted tax rates expected to apply to taxable income in the years in which those temporarydifferences are expected to be recovered or settled. We are unaware of any circumstances that wouldcause the deferred tax assets to not be realizable, except as indicated in Note 10 to our ConsolidatedFinancial Statements where the Company has provided a valuation allowance on certain state netoperating losses and other deferred state tax assets. Although the Company consistently generatestaxable income on a consolidated basis, these assets were not deemed realizable because they areattributable to subsidiaries that are not expected to produce future taxable earnings. Additionally,certain of the Company’s prior year returns are under exam by the Internal Revenue Service as well asother taxing authorities. In the event that the taxing authorities ultimately sustain adjustments to theCompany’s previously reported taxable income, the Company will remit payments accordingly. Althoughthe additional tax payments coupled with the expiration of bonus depreciation provisions in 2005 couldcause total payments to exceed the reported amount of income tax expense, we do not expect theseitems to have a material impact on the Company’s liquidity.
35

RECENTLY ISSUED AND PROPOSED ACCOUNTING STANDARDS
The following are accounting standards adopted or issued in 2004 that could have an impact to ourCompany.
In January 2003, the FASB issued FASB Interpretation No. 46, ‘‘Consolidation of Variable InterestEntities’’ (‘‘FIN 46’’), which addresses consolidation by business enterprises where equity investors donot bear the residual economic risks and rewards. These entities have been commonly referred to as‘‘special-purpose entities.’’ Companies were required to apply the provisions of FIN 46 prospectively forall variable interest entities created after January 31, 2003. In December 2003, the FASB issued arevision to FIN 46 to clarify some of the provisions of the original interpretation and to exempt certainentities from its requirements. The additional guidance explains how to identify variable interest entitiesand how an enterprise should assess its interest in an entity to decide whether to consolidate thatentity. Application of revised FIN 46 was required for public companies with interests in ‘‘special-purpose entities’’ for periods ending after December 15, 2003. Application for public entities for allother types of entities was required in financial statements for periods ending after March 15, 2004.The adoption of FIN 46 did not have a significant impact on our results of operations or financialposition.
In December 2004, the FASB issued SFAS No. 123 (revised 2004), ‘‘Share-Based Payment.’’ Publiccompanies (other than those filing as small business issuers) will be required to apply SFAS No. 123(R)as of the first interim or annual reporting period that begins after June 15, 2005. SFAS No. 123(R)requires that we recognize an expense for our equity-based compensation programs, including stockoptions. We are currently evaluating the provisions of SFAS No. 123(R) to determine its impact on ourfuture financial statements.
RISK FACTORS RELATING TO OUR BUSINESS
The Company is subject to extensive governmental regulation and taxation policies, the enforcement ofwhich could adversely impact our business, financial condition and results of operations.
We are subject to extensive gaming regulations and political and regulatory uncertainty. Regulatoryauthorities at the U.S. federal, state and local levels have broad powers with respect to the licensing ofcasino operations and may revoke, suspend, condition or limit our gaming or other licenses, imposesubstantial fines and take other actions, any one of which could adversely impact our business, financialcondition and results of operations. From time to time, individual jurisdictions have also consideredlegislation or referendums, which could adversely impact our operations. The likelihood or outcome ofsimilar legislation and referendums in the future cannot be predicted.
The casino entertainment industry represents a significant source of tax revenues to the variousjurisdictions in which casinos operate. From time to time, various state and federal legislators andofficials have proposed changes in tax laws, or in the administration of such laws, including increases intax rates, which would affect the industry. If adopted, such changes could adversely impact Harrah’sbusiness, financial condition and results of operations.
The development and construction of new hotels, casinos and gaming venues and the expansion of existingones are susceptible to delays, cost overruns and other uncertainties, which could have an adverse effect onthe Company’s business, financial condition and results of operations.
We may decide to develop, construct and open new hotels, casinos and other gaming venues inresponse to opportunities that may arise. If the Caesars merger is consummated, we will also continueto develop the projects that are currently being undertaken by Caesars. Future development projectsand acquisitions may require significant capital commitments and could result in potentially dilutiveissuances of equity securities, the incurrence of additional debt, guarantees of third party-debt, the
36

incurrence of contingent liabilities and an increase in amortization expense related to intangible assets,which could have an adverse effect upon our business, financial condition and results of operations.The development and construction of new hotels, casinos and gaming venues and the expansion ofexisting ones are susceptible to various risks and uncertainties, such as:
• the existence of acceptable market conditions and demand for the completed project;
• general construction risks, including cost overruns, change orders and plan or specificationmodification, shortages of equipment, materials or skilled labor, labor disputes, unforeseenenvironmental, engineering or geological problems, work stoppages, fire and other naturaldisasters, construction scheduling problems and weather interferences;
• changes and concessions required by governmental or regulatory authorities;
• delays in obtaining, or inability to obtain, all licenses, permits and authorizations required tocomplete the project; and
• disruption of our existing operations and facilities.
Our failure to complete any new development or expansion project as planned, on schedule, withinbudget or in a manner that generates anticipated profits, could have an adverse effect on our business,financial condition and results of operations.
Servicing our indebtedness will require a significant amount of cash, and our ability to generate cashdepends on many factors beyond its control.
Our ability to make payments on our indebtedness and to fund planned capital expenditures willdepend on our ability to generate cash in the future. Harrah’s Entertainment, Inc. is a holding companyand Harrah’s Operating Company conducts substantially all of its operations through its subsidiaries. Asa result, our ability to meet our debt service obligations substantially depends upon our subsidiaries’cash flow and payments of funds to us by our subsidiaries. This ability, to some extent, is subject togeneral economic, financial, competitive, legislative, regulatory and other factors that are beyond ourcontrol. An economic downturn in a region in which we operate, or will operate after the merger, mayadversely impact our business, results of operations and financial condition.
Based on Harrah’s Entertainment’s current level of operations and recent acquisitions, includingthe pending acquisition of Caesars, we believe our cash flow from operations, available cash andavailable borrowings under our credit facility will be adequate to meet our liquidity needs for theforeseeable future. There can be no assurances, however, that our business will generate sufficient cashflow from operations or that future borrowings will be available to us under our credit facility in anamount sufficient to enable us to pay our indebtedness or to fund our other liquidity needs. We mayneed to refinance all or a portion of our indebtedness on or before maturity. There can be noassurance that we will be able to refinance any of our indebtedness on commercially reasonable termsor at all.
Acts of terrorism and war may negatively impact the Company’s future profits.
Terrorist attacks and other acts of war or hostility have created many economic and politicaluncertainties. We cannot predict the extent to which terrorism, security alerts or war, or hostilities inIraq will continue to directly or indirectly impact our business and operating results. For example, theUnited States Coast Guard is considering regulations designed to increase homeland security, which, ifpassed, could affect some of our properties and require significant expenditures to bring suchproperties into compliance. In addition, as a consequence of the threat of terrorist attacks and otheracts of war or hostility in the future, premiums for a variety of insurance products have increased, andsome types of insurance are no longer available. Given current conditions in the global insurance
37

markets, we are predominately uninsured for losses and interruptions caused by terrorist acts and actsof war. If any such event were to affect our properties, we would likely be adversely impacted.
Work stoppages and other labor problems could negatively impact the Company’s future profits.
Some of our employees are represented by labor unions. A lengthy strike or other work stoppageat one of our casino properties or construction projects could have an adverse effect on our businessand results of operations. From time to time we have also experienced attempts to unionize certain ofour non-union employees. While these efforts have achieved only limited success to date, we cannotprovide any assurance that we will not experience additional and more successful union activity in thefuture.
The Company may not realize all of the anticipated benefits of the merger with Caesars.
Our ability to realize the anticipated benefits of the merger will depend, in part, on our ability tointegrate the businesses of Caesars with our businesses. The combination of two independentcompanies is a complex, costly and time-consuming process. This process may disrupt the business ofeither or both of the companies, and may not result in the full benefits expected by us and Caesars.The difficulties of combining the operations of the companies include, among others:
• coordinating marketing functions;
• unanticipated issues in integrating information, communications and other systems;
• unanticipated incompatibility of purchasing, logistics, marketing and administration methods;
• retaining key employees;
• consolidating corporate and administrative infrastructures;
• the diversion of management’s attention from ongoing business concerns; and
• coordinating geographically separate organizations.
There is no assurance that the combination of Caesars with the Company will result in therealization of the full benefits anticipated from the merger.
PRIVATE SECURITIES LITIGATION REFORM ACT
This Annual Report on Form 10-K contains or may contain ‘‘forward-looking statements’’ intendedto qualify for the safe harbor from liability established by the Private Securities Litigation Reform Actof 1995. These statements can be identified by the fact that they do not relate strictly to historical orcurrent facts. We have based these forward-looking statements on our current expectations about futureevents. Further, statements that include words such as ‘‘may,’’ ‘‘will,’’ ‘‘project,’’ ‘‘might,’’ ‘‘expect,’’‘‘believe,’’ ‘‘anticipate,’’ ‘‘intend,’’ ‘‘could,’’ ‘‘would,’’ ‘‘estimate,’’ ‘‘continue’’ or ‘‘pursue,’’ or the negativeof these words or other words or expressions of similar meaning may identify forward-lookingstatements. These forward-looking statements are found at various places throughout the report. Theseforward-looking statements, including, without limitation, those relating to future actions, new projects,strategies, future performance, the outcome of contingencies such as legal proceedings and futurefinancial results, wherever they occur in this report, are necessarily estimates reflecting the bestjudgment of the management of the Company and involve a number of risks and uncertainties thatcould cause actual results to differ materially from those suggested by the forward-looking statements.These forward-looking statements should, therefore, be considered in light of various important factorsset forth from time to time in the Company’s reports filed with the Securities and ExchangeCommission.
38

In addition to the risk factors identified elsewhere, important factors that could cause actual resultsto differ materially from estimates or projections contained in the forward-looking statements includewithout limitation:
• the effects of local and national economic, credit and capital market conditions on the economyin general, and on the gaming and hotel industry in particular;
• construction factors, including delays, increased costs for labor and materials, zoning issues,environmental restrictions, soil and water conditions, weather and other hazards, site accessmatters and building permit issues;
• the effects of environmental and structural building conditions relating to our properties;
• the ability of the Company to complete the merger with Caesars and to timely andcost-effectively integrate Caesars and Horseshoe into the Company’s operations;
• access to available and feasible financing, including financing for the merger of Caesars into theCompany, on a timely basis;
• the ability of purchasers of any of our assets subject to sale agreements to close the purchaseson a timely basis;
• changes in laws, including increased tax rates, regulations or accounting standards, third-partyrelations and approvals, and decisions of courts, regulators and governmental bodies;
• litigation outcomes and judicial actions, including gaming legislative action, referenda andtaxation;
• the ability of our customer-tracking, customer loyalty and yield-management programs tocontinue to increase customer loyalty and same store or hotel sales;
• the ability to recoup costs of capital investments through higher revenues;
• acts of war or terrorist incidents;
• abnormal gaming holds; and
• the effects of competition, including locations of competitors and operating and marketcompetition.
You are cautioned not to place undue reliance on these forward-looking statements, which speakonly as of the date of this annual report. The Company undertakes no obligation to publicly update orrelease any revisions to these forward-looking statements to reflect events or circumstances after thedate of this annual report or to reflect the occurrence of unanticipated events, except as required bylaw.
ITEM 7A. Quantitative and Qualitative Disclosure About Market Risk.
We are exposed to market risk, primarily changes in interest rates. We attempt to limit ourexposure to interest rate risk by managing the mix of our debt between fixed rate and variable rateobligations. Of our approximate $5.2 billion total debt at December 31, 2004, $2.2 billion, including thefixed-rate debt for which we have entered into interest rate swap agreements, is subject to variableinterest rates. The average interest rate on our variable-rate debt, excluding the impact of our swapagreements, was 3.2% at December 31, 2004. Assuming a constant outstanding balance for our variablerate debt for the next twelve months, a hypothetical 1% change in interest rates would change interestexpense for the next twelve months by approximately $22.4 million. We utilize interest rate swaps tomanage the mix of our debt between fixed and variable rate instruments. We also utilize treasury rate
39

locks to hedge the risk of future treasury rate increases for certain forecasted debt issuances. We donot purchase or hold any derivative financial instruments for trading purposes.
The table below provides information as of December 31, 2004, about our financial instrumentsthat are sensitive to changes in interest rates, including debt obligations, interest rate swaps andtreasury rate locks. For debt obligations, the table presents notional amounts and weighted averageinterest rates by contractual maturity dates. For interest rate swaps, the table presents notional amountsand weighted average interest rates by contractual maturity dates. Notional amounts are used tocalculate the contractual payments to be exchanged under the contract and weighted average variablerates are based on implied forward rates in the yield curve as of December 31, 2004. For treasury ratelocks, notional amounts are presented by contractual maturity dates, and average lock rates are basedon contractual terms.
(In millions) 2005 2006 2007 2008 2009 Thereafter Total Fair Value
Liabilities:Long-term debt
Fixed rate . . . . . . . . . . . . . . $589.8 $1.7 $498.2 $ 1.8 $ 501.0 $1,822.6 $3,415.1 $3,676.9(1)Average interest rate . . . . 7.9% 7.3% 7.1% 7.1% 7.5% 6.2% 6.8%
Variable rate . . . . . . . . . . . . $ – $ – $ – $ – $1,737.8 $ – $1,737.8 $1,737.8(1)Average interest rate . . . . –% –% –% –% 3.2% –% 3.2%
Interest Rate Derivatives:Interest rate swaps
Fixed to variable . . . . . . . . . $300.0 $ – $200.0 $ – $ – $ – $ 500.0 $ (5.1)(2)Average pay rate . . . . . . . 8.1% 7.9% 8.2% –% –% –% 8.1%
Average receive rate . . . . 7.6% 7.1% 7.1% –% –% –% 7.6%
Treasury rate locksNotional amount . . . . . . . . . $400.0 $ – $ – $ – $ – $ – $ 400.0 $ 1.9(2)Average lock rate . . . . . . . . 4.3% –% –% –% –% –% 4.3%
(1) The fair values are based on the borrowing rates currently available for debt instruments withsimilar terms and maturities and market quotes of the Company’s publicly traded debt.
(2) The fair values are based on market prices obtained from dealer quotes.
Our long-term variable rate debt reflects borrowings under revolving credit and letter of creditfacilities provided to us by a consortium of banks with a total capacity of $2.5 billion. The interest ratescharged on borrowings under these facilities are a function of the London Inter-Bank Offered Rate, orLIBOR and prime rate and are based on the rates as of December 31, 2004. As such, the interest ratescharged to us for borrowings under the facilities are subject to change as LIBOR changes.
Foreign currency translation gains and losses were not material to our results of operations for theyear ended December 31, 2004. Although we are pursuing development opportunities in the UnitedKingdom, we currently have no material ownership interests in businesses in foreign countries.Accordingly, we are not currently subject to material foreign currency exchange rate risk from theeffects that exchange rate movements of foreign currencies would have on our future operating resultsor cash flows.
40

ITEM 8. Financial Statements and Supplementary Data.
REPORT OF INDEPENDENT REGISTERED PUBLIC ACCOUNTING FIRM
To the Board of Directors and Stockholders ofHarrah’s Entertainment, Inc.Las Vegas, Nevada
We have audited the accompanying consolidated balance sheets of Harrah’s Entertainment, Inc.and subsidiaries (the ‘‘Company’’) as of December 31, 2004 and 2003, and the related consolidatedstatements of income, stockholders’ equity and comprehensive income, and cash flows for each of thethree years in the period ended December 31, 2004. Our audits also included the financial statementschedule listed in the Index at Item 15(a)(2). These financial statements and financial statementschedule are the responsibility of the Company’s management. Our responsibility is to express anopinion on the financial statements and financial statement schedule based on our audits.
We conducted our audits in accordance with the standards of the Public Company AccountingOversight Board (United States). Those standards require that we plan and perform the audit to obtainreasonable assurance about whether the financial statements are free of material misstatement. Anaudit includes examining, on a test basis, evidence supporting the amounts and disclosures in thefinancial statements. An audit also includes assessing the accounting principles used and significantestimates made by management, as well as evaluating the overall financial statement presentation. Webelieve that our audits provide a reasonable basis for our opinion.
In our opinion, such consolidated financial statements present fairly, in all material respects, thefinancial position of Harrah’s Entertainment, Inc. and subsidiaries as of December 31, 2004 and 2003,and the results of their operations and their cash flows for each of the three years in the period endedDecember 31, 2004, in conformity with accounting principles generally accepted in the United States ofAmerica. Also, in our opinion, such financial statement schedule, when considered in relation to thebasic consolidated financial statements taken as a whole, presents fairly, in all material respects, theinformation set forth therein.
As discussed in Note 4 to the Consolidated Financial Statements, the Company changed itsmethod of accounting for goodwill and other intangible assets to conform to Statement of FinancialAccounting Standards No. 142, Goodwill and Other Intangible Assets, in 2002 and recorded a cumulativeeffect of a change in accounting principle in the first quarter of 2002.
We have also audited, in accordance with the standards of the Public Company AccountingOversight Board (United States), the effectiveness of the Company’s internal control over financialreporting as of December 31, 2004, based on the criteria established in Internal Control—IntegratedFramework issued by the Committee of Sponsoring Organizations of the Treadway Commission and ourreport dated February 28, 2005 expressed an unqualified opinion on management’s assessment of theeffectiveness of the Company’s internal control over financial reporting and an unqualified opinion onthe effectiveness of the Company’s internal control over financial reporting.
/s/ Deloitte & Touche LLP
Las Vegas, NevadaFebruary 28, 2005
41

HARRAH’S ENTERTAINMENT, INC.
CONSOLIDATED BALANCE SHEETS(In thousands, except share amounts)
December 31,
2004 2003
AssetsCurrent assets
Cash and cash equivalents . . . . . . . . . . . . . . . . . . . . . . . . . . . . . . . . . . . . . . . . . . . $ 488,960 $ 397,942Receivables, less allowance for doubtful accounts of $48,589 and $51,466 . . . . . . . . . . . . 130,520 90,991Deferred income taxes (Note 10) . . . . . . . . . . . . . . . . . . . . . . . . . . . . . . . . . . . . . . 30,073 68,323Income tax receivable . . . . . . . . . . . . . . . . . . . . . . . . . . . . . . . . . . . . . . . . . . . . . . 46,032 36,166Prepayments and other . . . . . . . . . . . . . . . . . . . . . . . . . . . . . . . . . . . . . . . . . . . . . 66,000 55,929Inventories . . . . . . . . . . . . . . . . . . . . . . . . . . . . . . . . . . . . . . . . . . . . . . . . . . . . . 25,573 22,546
Total current assets . . . . . . . . . . . . . . . . . . . . . . . . . . . . . . . . . . . . . . . . . . . . . . 787,158 671,897
Land, buildings, riverboats and equipmentLand and land improvements . . . . . . . . . . . . . . . . . . . . . . . . . . . . . . . . . . . . . . . . . 881,031 729,441Buildings, riverboats and improvements . . . . . . . . . . . . . . . . . . . . . . . . . . . . . . . . . . 3,788,375 3,217,386Furniture, fixtures and equipment . . . . . . . . . . . . . . . . . . . . . . . . . . . . . . . . . . . . . . 1,648,961 1,361,963Construction in progress . . . . . . . . . . . . . . . . . . . . . . . . . . . . . . . . . . . . . . . . . . . . 202,271 111,219
6,520,638 5,420,009Less: accumulated depreciation . . . . . . . . . . . . . . . . . . . . . . . . . . . . . . . . . . . . . . . . (1,775,661) (1,581,134)
4,744,977 3,838,875Assets held for sale (Note 3) . . . . . . . . . . . . . . . . . . . . . . . . . . . . . . . . . . . . . . . . . . . 502,602 688,106Goodwill (Notes 2 and 4) . . . . . . . . . . . . . . . . . . . . . . . . . . . . . . . . . . . . . . . . . . . . . 1,354,738 701,133Intangible assets (Notes 2 and 4) . . . . . . . . . . . . . . . . . . . . . . . . . . . . . . . . . . . . . . . . 861,355 315,019Investments in and advances to nonconsolidated affiliates (Note 15) . . . . . . . . . . . . . . . . . 6,150 6,537Escrow deposit for Horseshoe acquisition (Note 2) . . . . . . . . . . . . . . . . . . . . . . . . . . . . – 75,000Deferred costs and other . . . . . . . . . . . . . . . . . . . . . . . . . . . . . . . . . . . . . . . . . . . . . 328,634 282,277
$ 8,585,614 $ 6,578,844
Liabilities and Stockholders’ EquityCurrent liabilities
Accounts payable . . . . . . . . . . . . . . . . . . . . . . . . . . . . . . . . . . . . . . . . . . . . . . . . . $ 174,532 $ 117,941Accrued expenses (Note 6) . . . . . . . . . . . . . . . . . . . . . . . . . . . . . . . . . . . . . . . . . . 577,706 463,466Current portion of long-term debt (Note 7) . . . . . . . . . . . . . . . . . . . . . . . . . . . . . . . . 1,788 1,632
Total current liabilities . . . . . . . . . . . . . . . . . . . . . . . . . . . . . . . . . . . . . . . . . . . . 754,026 583,039
Liabilities held for sale (Note 3) . . . . . . . . . . . . . . . . . . . . . . . . . . . . . . . . . . . . . . . . 809 10,796Long-term debt (Note 7) . . . . . . . . . . . . . . . . . . . . . . . . . . . . . . . . . . . . . . . . . . . . . 5,151,121 3,671,889Deferred credits and other . . . . . . . . . . . . . . . . . . . . . . . . . . . . . . . . . . . . . . . . . . . . 198,485 194,017Deferred income taxes (Note 10) . . . . . . . . . . . . . . . . . . . . . . . . . . . . . . . . . . . . . . . . 413,461 330,674
6,517,902 4,790,415
Minority interests . . . . . . . . . . . . . . . . . . . . . . . . . . . . . . . . . . . . . . . . . . . . . . . . . . 32,515 49,989
Commitments and contingencies (Notes 2, 3, 8, 10 and 12 through 15)
Stockholders’ equity (Notes 5, 7, 14 and 15)Common stock, $0.10 par value, authorized—360,000,000 shares, outstanding—112,732,285
and 110,889,294 shares (net of 36,130,542 and 35,078,478 shares held in treasury) . . . . . 11,273 11,089Capital surplus . . . . . . . . . . . . . . . . . . . . . . . . . . . . . . . . . . . . . . . . . . . . . . . . . . 1,394,519 1,277,903Retained earnings . . . . . . . . . . . . . . . . . . . . . . . . . . . . . . . . . . . . . . . . . . . . . . . . 638,437 466,662Accumulated other comprehensive income . . . . . . . . . . . . . . . . . . . . . . . . . . . . . . . . 963 151Deferred compensation related to restricted stock . . . . . . . . . . . . . . . . . . . . . . . . . . . (9,995) (17,365)
2,035,197 1,738,440
$ 8,585,614 $ 6,578,844
The accompanying Notes to Consolidated Financial Statementsare an integral part of these consolidated balance sheets.
42

HARRAH’S ENTERTAINMENT, INC.
CONSOLIDATED STATEMENTS OF INCOME
(In thousands, except per share amounts)
Year Ended December 31,
2004 2003 2002
RevenuesCasino . . . . . . . . . . . . . . . . . . . . . . . . . . . . . . . . . . . . . . . . . . . . . . . . . . . . . . . . . . $4,077,694 $3,458,396 $3,285,877Food and beverage . . . . . . . . . . . . . . . . . . . . . . . . . . . . . . . . . . . . . . . . . . . . . . . . . . . 665,515 596,772 572,775Rooms . . . . . . . . . . . . . . . . . . . . . . . . . . . . . . . . . . . . . . . . . . . . . . . . . . . . . . . . . . 390,077 339,037 317,914Management fees . . . . . . . . . . . . . . . . . . . . . . . . . . . . . . . . . . . . . . . . . . . . . . . . . . . . 60,651 72,149 66,888Other . . . . . . . . . . . . . . . . . . . . . . . . . . . . . . . . . . . . . . . . . . . . . . . . . . . . . . . . . . . 217,195 190,092 148,635Less: casino promotional allowances . . . . . . . . . . . . . . . . . . . . . . . . . . . . . . . . . . . . . . . . (862,806) (707,581) (644,223)
Net revenues . . . . . . . . . . . . . . . . . . . . . . . . . . . . . . . . . . . . . . . . . . . . . . . . . . . . . 4,548,326 3,948,865 3,747,866
Operating expensesDirect
Casino . . . . . . . . . . . . . . . . . . . . . . . . . . . . . . . . . . . . . . . . . . . . . . . . . . . . . . . . . 2,061,642 1,748,698 1,602,544Food and beverage . . . . . . . . . . . . . . . . . . . . . . . . . . . . . . . . . . . . . . . . . . . . . . . . . 278,107 255,193 240,622Rooms . . . . . . . . . . . . . . . . . . . . . . . . . . . . . . . . . . . . . . . . . . . . . . . . . . . . . . . . . 66,965 65,340 67,243
Property general, administrative and other . . . . . . . . . . . . . . . . . . . . . . . . . . . . . . . . . . . . 924,756 830,296 780,788Depreciation and amortization . . . . . . . . . . . . . . . . . . . . . . . . . . . . . . . . . . . . . . . . . . . 327,188 294,336 278,935Write-downs, reserves and recoveries (Note 9) . . . . . . . . . . . . . . . . . . . . . . . . . . . . . . . . . 9,567 10,476 4,537Project opening costs . . . . . . . . . . . . . . . . . . . . . . . . . . . . . . . . . . . . . . . . . . . . . . . . . 9,526 7,352 1,703Corporate expense . . . . . . . . . . . . . . . . . . . . . . . . . . . . . . . . . . . . . . . . . . . . . . . . . . . 66,818 52,602 56,626Merger and integration costs for Caesars acquisition . . . . . . . . . . . . . . . . . . . . . . . . . . . . . 2,331 – –Losses on interests in nonconsolidated affiliates (Note 15) . . . . . . . . . . . . . . . . . . . . . . . . . . 879 999 1,670Amortization of intangible assets (Note 4) . . . . . . . . . . . . . . . . . . . . . . . . . . . . . . . . . . . . 9,439 4,798 4,493
Total operating expenses . . . . . . . . . . . . . . . . . . . . . . . . . . . . . . . . . . . . . . . . . . . . . . 3,757,218 3,270,090 3,039,161
Income from operations . . . . . . . . . . . . . . . . . . . . . . . . . . . . . . . . . . . . . . . . . . . . . . . . . 791,108 678,775 708,705Interest expense, net of interest capitalized (Note 11) . . . . . . . . . . . . . . . . . . . . . . . . . . . . . . (271,802) (234,419) (240,220)Losses on early extinguishments of debt (Note 7) . . . . . . . . . . . . . . . . . . . . . . . . . . . . . . . . . – (19,074) –Other income, including interest income . . . . . . . . . . . . . . . . . . . . . . . . . . . . . . . . . . . . . . . 9,483 2,913 2,137
Income from continuing operations before income taxes and minority interests . . . . . . . . . . . . . . 528,789 428,195 470,622Provision for income taxes (Note 10) . . . . . . . . . . . . . . . . . . . . . . . . . . . . . . . . . . . . . . . . . (190,641) (155,568) (174,445)Minority interests . . . . . . . . . . . . . . . . . . . . . . . . . . . . . . . . . . . . . . . . . . . . . . . . . . . . . (8,623) (11,563) (13,965)
Income from continuing operations . . . . . . . . . . . . . . . . . . . . . . . . . . . . . . . . . . . . . . . . . . 329,525 261,064 282,212Discontinued operations (Note 3)
Income from discontinued operations (including loss on disposal of $1,766 in 2003) . . . . . . . . . . 56,644 48,552 67,670Provision for income taxes . . . . . . . . . . . . . . . . . . . . . . . . . . . . . . . . . . . . . . . . . . . . . . (18,460) (16,993) (23,684)
Income from discontinued operations . . . . . . . . . . . . . . . . . . . . . . . . . . . . . . . . . . . . . 38,184 31,559 43,986
Income before cumulative effect of change in accounting principle . . . . . . . . . . . . . . . . . . . . . . 367,709 292,623 326,198Cumulative effect of change in accounting principle, net of income tax benefits of $2,831 (Note 4) . . – – (91,169)
Net income . . . . . . . . . . . . . . . . . . . . . . . . . . . . . . . . . . . . . . . . . . . . . . . . . . . . . . . . . $ 367,709 $ 292,623 $ 235,029
Earnings per share—basicIncome from continuing operations . . . . . . . . . . . . . . . . . . . . . . . . . . . . . . . . . . . . . . . . $ 2.97 $ 2.40 $ 2.54Discontinued operations, net . . . . . . . . . . . . . . . . . . . . . . . . . . . . . . . . . . . . . . . . . . . . 0.34 0.29 0.39Cumulative effect of change in accounting principle, net . . . . . . . . . . . . . . . . . . . . . . . . . . . – – (0.82)
Net income . . . . . . . . . . . . . . . . . . . . . . . . . . . . . . . . . . . . . . . . . . . . . . . . . . . . . . $ 3.31 $ 2.69 $ 2.11
Earnings per share—dilutedIncome from continuing operations . . . . . . . . . . . . . . . . . . . . . . . . . . . . . . . . . . . . . . . . $ 2.92 $ 2.36 $ 2.48Discontinued operations, net . . . . . . . . . . . . . . . . . . . . . . . . . . . . . . . . . . . . . . . . . . . . 0.34 0.29 0.39Cumulative effect of change in accounting principle, net . . . . . . . . . . . . . . . . . . . . . . . . . . . – – (0.80)
Net income . . . . . . . . . . . . . . . . . . . . . . . . . . . . . . . . . . . . . . . . . . . . . . . . . . . . . . $ 3.26 $ 2.65 $ 2.07
Dividends declared per share . . . . . . . . . . . . . . . . . . . . . . . . . . . . . . . . . . . . . . . . . . . . . . $ 1.26 $ 0.60 $ –
Weighted average common shares outstanding . . . . . . . . . . . . . . . . . . . . . . . . . . . . . . . . . . . 111,162 108,972 111,212Additional shares based on average market price for period applicable to:
Restricted stock . . . . . . . . . . . . . . . . . . . . . . . . . . . . . . . . . . . . . . . . . . . . . . . . . . . 490 454 631Stock options . . . . . . . . . . . . . . . . . . . . . . . . . . . . . . . . . . . . . . . . . . . . . . . . . . . . . 1,215 977 1,691
Weighted average common and common equivalent shares outstanding . . . . . . . . . . . . . . . . . . . 112,867 110,403 113,534
The accompanying Notes to Consolidated Financial Statementsare an integral part of these consolidated statements.
43

HARRAH’S ENTERTAINMENT, INC.CONSOLIDATED STATEMENTS OF STOCKHOLDERS’ EQUITY AND COMPREHENSIVE INCOME
(In thousands)(Notes 5, 7, 14 and 15)
DeferredAccumulated CompensationCommon Stock Other Related to
Shares Capital Retained Comprehensive Restricted ComprehensiveOutstanding Amount Surplus Earnings Income/(Loss) Stock Total Income
Balance—December 31, 2001 . . . . 112,322 $11,232 $1,143,125 $ 248,098 $(1,449) $(26,893) $1,374,113Net income . . . . . . . . . . . . 235,029 235,029 $235,029Unrealized loss on available-
for-sale securities, lessdeferred tax benefit of $239 . (442) (442) (442)
Other . . . . . . . . . . . . . . . . 1,476 1,476 1,476Treasury stock purchases . . . . (5,275) (527) (222,830) (223,357)Net shares issued under
incentive compensationplans, including income taxbenefit of $23,970 . . . . . . . 2,662 266 81,683 2,240 84,189
2002 Comprehensive Income . . . $236,063
Balance—December 31, 2002 . . . . 109,709 10,971 1,224,808 260,297 (415) (24,653) 1,471,008Net income . . . . . . . . . . . . 292,623 292,623 $292,623Unrealized gain on available-
for-sale securities, lessdeferred tax provision of$215 . . . . . . . . . . . . . . . 397 397 397
Realization of loss onavailable-for-sale securities,net of tax benefit of $10 . . . 18 18 18
Foreign currency translationadjustments, net of taxprovision of $81 . . . . . . . . 151 151 151
Treasury stock purchases . . . . (500) (50) (17,887) (17,937)Cash dividends . . . . . . . . . . (66,219) (66,219)Net shares issued under
incentive compensationplans, including income taxbenefit of $15,537 . . . . . . . 1,680 168 53,095 (2,152) 7,288 58,399
2003 Comprehensive Income . . . $293,189
Balance—December 31, 2003 . . . . 110,889 11,089 1,277,903 466,662 151 (17,365) 1,738,440Net income . . . . . . . . . . . . 367,709 367,709 $367,709Net gain on derivatives
qualifying as cash flowhedges, net of tax provisionof $392 . . . . . . . . . . . . . . 717 717 717
Reclassification of loss onderivative instrument fromother comprehensive incometo net income, net of taxbenefit of $23 . . . . . . . . . . 42 42 42
Foreign currency translationadjustments, net of taxprovision of $28 . . . . . . . . 53 53 53
Treasury stock purchases . . . . (1,000) (100) (53,275) (53,375)Cash dividends . . . . . . . . . . (141,319) (141,319)Net shares issued under
incentive compensationplans, including income taxbenefit of $26,838 . . . . . . . 2,843 284 116,616 (1,340) 7,370 122,930
2004 Comprehensive Income . . . $368,521
Balance—December 31, 2004 . . . . 112,732 $11,273 $1,394,519 $ 638,437 $ 963 $ (9,995) $2,035,197
The accompanying Notes to Consolidated Financial Statementsare an integral part of these consolidated statements.
44

HARRAH’S ENTERTAINMENT, INC.CONSOLIDATED STATEMENTS OF CASH FLOWS
(In thousands)(Note 11)
Year Ended December 31,
2004 2003 2002
Cash flows from operating activitiesNet income . . . . . . . . . . . . . . . . . . . . . . . . . . . . . . . . . . . . . . . . . . . . . . $ 367,709 $ 292,623 $ 235,029Adjustments to reconcile net income to cash flows from operating activities
Earnings from discontinued operations, before income taxes . . . . . . . . . . . . . . (56,644) (48,552) (67,670)Cumulative effect of change in accounting principle, before income taxes . . . . . . – – 94,000Losses on early extinguishments of debt . . . . . . . . . . . . . . . . . . . . . . . . . . . – 19,074 –Depreciation and amortization . . . . . . . . . . . . . . . . . . . . . . . . . . . . . . . . . 361,564 319,694 304,620Write-downs, reserves and recoveries . . . . . . . . . . . . . . . . . . . . . . . . . . . . . 195 10,476 4,537Deferred income taxes . . . . . . . . . . . . . . . . . . . . . . . . . . . . . . . . . . . . . . 82,428 104,287 89,886Tax benefit from stock equity plans . . . . . . . . . . . . . . . . . . . . . . . . . . . . . . 26,838 15,537 23,970Other noncash items . . . . . . . . . . . . . . . . . . . . . . . . . . . . . . . . . . . . . . . 16,044 18,825 26,213Minority interests’ share of net income . . . . . . . . . . . . . . . . . . . . . . . . . . . 8,623 11,563 13,965Losses on interests in nonconsolidated affiliates . . . . . . . . . . . . . . . . . . . . . . 879 999 1,670Net losses from asset sales . . . . . . . . . . . . . . . . . . . . . . . . . . . . . . . . . . . 2,305 125 1,695Net change in long-term accounts . . . . . . . . . . . . . . . . . . . . . . . . . . . . . . . (51,262) (32,173) (27,871)Net change in working capital accounts . . . . . . . . . . . . . . . . . . . . . . . . . . . 32,319 (45,696) (53,862)
Cash flows provided by operating activities . . . . . . . . . . . . . . . . . . . . . . . 790,998 666,782 646,182
Cash flows from investing activitiesPayments for businesses acquired, net of cash acquired . . . . . . . . . . . . . . . . . . . (1,616,874) – (162,431)Escrow payment for Horseshoe acquisition . . . . . . . . . . . . . . . . . . . . . . . . . . – (75,000) –Purchase of minority interest in subsidiary . . . . . . . . . . . . . . . . . . . . . . . . . . . (37,500) – –Land, buildings, riverboats and equipment additions . . . . . . . . . . . . . . . . . . . . (654,197) (383,600) (349,102)Investments in and advances to nonconsolidated affiliates . . . . . . . . . . . . . . . . . (333) (4,228) –Increase/(decrease) in construction payables . . . . . . . . . . . . . . . . . . . . . . . . . 35,202 1,764 (6,396)Proceeds from other asset sales . . . . . . . . . . . . . . . . . . . . . . . . . . . . . . . . . 3,820 3,960 34,601Proceeds from sale of interests in nonconsolidated affiliates . . . . . . . . . . . . . . . . – 897 –Other . . . . . . . . . . . . . . . . . . . . . . . . . . . . . . . . . . . . . . . . . . . . . . . . . . (26,773) (14,948) (7,162)
Cash flows used in investing activities . . . . . . . . . . . . . . . . . . . . . . . . . . . (2,296,655) (471,155) (490,490)
Cash flows from financing activitiesProceeds from issuance of senior notes, net of discount and issue costs of $12,001
and $6,919 . . . . . . . . . . . . . . . . . . . . . . . . . . . . . . . . . . . . . . . . . . . . . 737,999 493,081 –Borrowings under lending agreements, net of financing costs of $6,211, $15,342 and
$655 . . . . . . . . . . . . . . . . . . . . . . . . . . . . . . . . . . . . . . . . . . . . . . . . . 4,157,929 3,368,947 2,772,671Repayments under lending agreements . . . . . . . . . . . . . . . . . . . . . . . . . . . . . (3,424,140) (2,526,189) (2,728,126)Loss on derivative instrument . . . . . . . . . . . . . . . . . . . . . . . . . . . . . . . . . . . (775) – –Borrowings under retired bank facility . . . . . . . . . . . . . . . . . . . . . . . . . . . . . – 161,125 –Repayments under retired bank facility . . . . . . . . . . . . . . . . . . . . . . . . . . . . . – (1,446,625) –Other short-term repayments . . . . . . . . . . . . . . . . . . . . . . . . . . . . . . . . . . . – (60,250) –Early extinguishments of debt . . . . . . . . . . . . . . . . . . . . . . . . . . . . . . . . . . . – (159,476) (28,210)Premiums paid on early extinguishments of debt . . . . . . . . . . . . . . . . . . . . . . . – (16,125) –Scheduled debt retirements . . . . . . . . . . . . . . . . . . . . . . . . . . . . . . . . . . . . (1,577) (1,583) (1,659)Dividends paid . . . . . . . . . . . . . . . . . . . . . . . . . . . . . . . . . . . . . . . . . . . . (141,319) (66,219) –Proceeds from exercises of stock options . . . . . . . . . . . . . . . . . . . . . . . . . . . . 89,970 34,085 48,695Purchases of treasury stock . . . . . . . . . . . . . . . . . . . . . . . . . . . . . . . . . . . . (53,375) (17,937) (223,357)Minority interests’ distributions, net of contributions . . . . . . . . . . . . . . . . . . . . (8,890) (10,639) (12,153)Other . . . . . . . . . . . . . . . . . . . . . . . . . . . . . . . . . . . . . . . . . . . . . . . . . . 715 (178) (1,135)
Cash flows provided by/(used in) financing activities . . . . . . . . . . . . . . . . . 1,356,537 (247,983) (173,274)
Cash flows from assets held for saleProceeds from sales of assets held for sale . . . . . . . . . . . . . . . . . . . . . . . . . . . 197,561 48,640 –Net transfers from assets held for sale . . . . . . . . . . . . . . . . . . . . . . . . . . . . . 42,577 17,293 77,018
Cash flows provided by assets held for sale . . . . . . . . . . . . . . . . . . . . . . . 240,138 65,933 77,018
Net increase in cash and cash equivalents . . . . . . . . . . . . . . . . . . . . . . . . . . . . 91,018 13,577 59,436Cash and cash equivalents, beginning of year . . . . . . . . . . . . . . . . . . . . . . . . . . 397,942 384,365 324,929
Cash and cash equivalents, end of year . . . . . . . . . . . . . . . . . . . . . . . . . . . . . . $ 488,960 $ 397,942 $ 384,365
The accompanying Notes to Consolidated Financial Statementsare an integral part of these consolidated statements.
45

HARRAH’S ENTERTAINMENT, INC.
NOTES TO CONSOLIDATED FINANCIAL STATEMENTS
(Dollars in thousands, unless otherwise stated)
In these footnotes, the words ‘‘Company,’’ ‘‘Harrah’s Entertainment,’’ ‘‘we,’’ ‘‘our’’ and ‘‘us’’ refer toHarrah’s Entertainment, Inc., a Delaware corporation, and its wholly-owned subsidiaries, unlessotherwise stated or the context requires otherwise.
Note 1—Summary of Significant Accounting Policies
BASIS OF PRESENTATION AND ORGANIZATION. As of December 31, 2004, we operated 28casinos in 12 states. Our operations include 11 land-based casinos, 11 riverboat or dockside casinos, acombination greyhound racetrack and casino, a combination thoroughbred racetrack and casino andfour managed casinos on Indian lands. We view each property as an operating segment and aggregateall operating segments into one reporting segment.
On July 14, 2004, we signed a definitive agreement to acquire Caesars Entertainment, Inc.(‘‘Caesars’’) in a cash and stock transaction. Under the terms of the agreement, Caesars shareholderswill receive either $17.75 in cash or 0.3247 shares of Harrah’s Entertainment’s common stock for eachoutstanding share of Caesars’ common stock, subject to limitations on the aggregate amount of cash tobe paid and shares of stock to be issued. Caesars operates 27 casinos with about two million squarefeet of gaming space and approximately 26,000 hotel rooms and has significant presence in Las Vegas,Atlantic City and Mississippi. The transaction is subject to regulatory and shareholders’ approvals andis expected to close in the second quarter of 2005.
On September 27, 2004, we reached an agreement to sell the assets and certain related currentliabilities of Harrah’s East Chicago and Harrah’s Tunica to another gaming company. The sale, which issubject to regulatory approvals, is expected to close in the first quarter of 2005. These properties areclassified in Assets/Liabilities held for sale on our Consolidated Balance Sheets, and we ceaseddepreciating their assets in September 2004. Results for Harrah’s East Chicago and Harrah’s Tunica arepresented as Discontinued operations for all periods presented. During 2003, we sold properties inCentral City, Colorado, and Vicksburg, Mississippi. For periods prior to their sales, the operatingresults of those properties, including the losses recorded on the sales, are presented in ourConsolidated Statements of Income as Discontinued operations. (See Note 3.)
In conjunction with our plans to acquire Horseshoe Gaming Holding Corp. (‘‘Horseshoe Gaming’’)(see Note 2), in May 2004, we sold Harrah’s Shreveport to avoid overexposure in that market. Prior tothe sale, we classified this property in Assets/Liabilities held for sale on our Consolidated BalanceSheets and we ceased depreciating its assets in September 2003. Since we had a continued presence inthe Shreveport-Bossier City market, Harrah’s Shreveport’s operating results were not classified asDiscontinued operations. (See Note 3.)
PRINCIPLES OF CONSOLIDATION. Our Consolidated Financial Statements include theaccounts of Harrah’s Entertainment and its subsidiaries after elimination of all significant intercompanyaccounts and transactions.
CASH AND CASH EQUIVALENTS. Cash includes the minimum cash balances required to bemaintained by state gaming commissions or local and state governments, which totaled approximately$22.0 million and $24.2 million at December 31, 2004 and 2003, respectively. Cash equivalents arehighly liquid investments with an original maturity of less than three months and are stated at thelower of cost or market value.
46

ALLOWANCE FOR DOUBTFUL ACCOUNTS. We reserve an estimated amount for receivablesthat may not be collected. Methodologies for estimating the allowance for doubtful accounts rangefrom specific reserves to various percentages applied to aged receivables. Historical collection rates areconsidered, as are customer relationships, in determining specific reserves.
INVENTORIES. Inventories, which consist primarily of food, beverage, retail merchandise andoperating supplies, are stated at average cost.
LAND, BUILDINGS, RIVERBOATS AND EQUIPMENT. Land, buildings, riverboats andequipment are stated at cost. Land includes land held for future development or disposition, whichtotaled $119.5 million at December 31, 2004 and 2003. We capitalize the costs of improvements andrepairs that extend the life of the asset. We expense maintenance and repairs cost as incurred. Gains orlosses on the dispositions of land, buildings, riverboats or equipment are included in the determinationof income. Interest expense is capitalized on internally constructed assets at our overall weightedaverage borrowing rate of interest. Capitalized interest amounted to $4.1 million, $2.3 million and$3.5 million in 2004, 2003 and 2002, respectively.
We depreciate our buildings, riverboats and equipment using the straight-line method over theshorter of the estimated useful life of the asset or the related lease term, as follows:
Buildings and improvements . . . . . . . . . . . . . . . . . . . . . . . . . . . . . . 10 to 40 yearsRiverboats and barges . . . . . . . . . . . . . . . . . . . . . . . . . . . . . . . . . . 30 yearsFurniture, fixtures and equipment . . . . . . . . . . . . . . . . . . . . . . . . . . 2 to 15 years
We review the carrying value of land, buildings, riverboats and equipment for impairmentwhenever events and circumstances indicate that the carrying value of an asset may not be recoverablefrom the estimated future cash flows expected to result from its use and eventual disposition. In caseswhere undiscounted expected future cash flows are less than the carrying value, an impairment loss isrecognized equal to an amount by which the carrying value exceeds the fair value of the asset. Thefactors considered by management in performing this assessment include current operating results,trends and prospects, as well as the effect of obsolescence, demand, competition and other economicfactors. In estimating expected future cash flows for determining whether an asset is impaired, assetsare grouped at the operating unit level, which for most of our assets is the individual casino.
GOODWILL AND OTHER INTANGIBLE ASSETS. We have approximately $2.2 billion ingoodwill and other intangible assets on our balance sheet resulting from our acquisitions of otherbusinesses. Statement of Financial Accounting Standards (‘‘SFAS’’) No. 142, ‘‘Goodwill and OtherIntangible Assets,’’ adopted on January 1, 2002, requires a review, at least annually, of goodwill andother nonamortizing intangible assets for impairment. Once an impairment of goodwill or othernonamortizing intangible asset has been recorded, it cannot be reversed. We completed our initialassessment for impairment of goodwill and other nonamortizing intangibles and recorded animpairment charge in first quarter 2002. We perform our annual assessment of goodwill and intangibleassets with indefinite lives for impairment during the fourth quarter of each year. (See Note 4.)
The purchase price of an acquisition is allocated to the underlying assets acquired and liabilitiesassumed based upon their estimated fair values at the date of acquisition. We determine the estimatedfair values based on independent appraisals, discounted cash flows, quoted market prices and estimatesmade by management. To the extent that the purchase price exceeds the fair value of the netidentifiable tangible and intangible assets acquired, such excess is allocated to goodwill. With the
47

HARRAH’S ENTERTAINMENT, INC.
NOTES TO CONSOLIDATED FINANCIAL STATEMENTS (Continued)
(Dollars in thousands, unless otherwise stated)
adoption of SFAS No. 142 in 2002, we no longer amortize goodwill or intangible assets that aredetermined to have an indefinite life. Prior to 2002, we amortized goodwill and other intangibles,including trademarks, on a straight-line basis over periods up to 40 years. Intangible assets determinedto have a finite life are amortized on a straight-line basis over the determined useful life of the asset(see Note 4).
We use the interest method to amortize deferred financing charges over the term of the relateddebt agreements.
TOTAL REWARDS POINT LIABILITY PROGRAM. Our customer rewards program, TotalRewards, offers incentives to customers who gamble at our casinos throughout the United States. Priorto 2003, customers received cash-back and other offers made in the form of coupons that were mailedto the customer and were redeemable on a subsequent visit to one of our properties. The couponsgenerally expired 30 days after they were issued. Given the requirement of a return visit to redeem theoffer and the short-term expiration date, with no ability to renew or extend the offer, we recognizedthe expense of these offers when the coupons were redeemed.
In fourth quarter 2002, a decision was made to change our Total Rewards program in 2003 to giveour customers greater flexibility and control over the rewards they receive for playing at our casinos.Under the new program, customers are able to accumulate, or bank, Reward Credits over time thatthey may redeem at their discretion under the terms of the program. The Reward Credit balance willbe forfeited if the customer does not earn a Reward Credit over the prior six-month period. As a resultof the ability of the customer to bank the Reward Credits under the revised program, our accountingfor the Total Rewards program changed, and we accrue the expense of Reward Credits, afterconsideration of estimated breakage, as they are earned. To implement this change in the program, aninitial bank of Reward Credits was offered to our existing customers. The amount of credits offered forthis initial bank was calculated based upon 2002 tracked play at our casinos. As a result of the decisionto extend this initial offer, an accrual of $6.9 million was recorded in 2002 to recognize our estimate ofthe expense of this implementation offer. Under the current program, the value of the cost to provideReward Credits is expensed as the Reward Credits are earned. To arrive at the estimated costassociated with Reward Credits, estimates and assumptions are made regarding incremental marginalcosts of the benefits, breakage rates and the mix of goods and services for which Reward Credits willbe redeemed. We use historical data to assist in the determination of estimated accruals. AtDecember 31, 2004 and 2003, $36.2 million and $25.7 million, respectively, was accrued for the cost ofanticipated Total Rewards credit redemptions. The Company is planning to integrate the propertiesacquired from Horseshoe Gaming in 2004 into our Total Rewards program during 2005.
Our Horseshoe properties have a customer rewards program in which customers earn points basedon their play. These points are primarily redeemable for cash and expire after one year. The liabilityrelated to the outstanding points, which is based on historical redemption activity, was $3.0 million atDecember 31, 2004.
SELF-INSURANCE ACCRUALS. We are self-insured up to certain limits for costs associated withgeneral liability, workers’ compensation and employee health coverage. Insurance claims and reservesinclude accruals of estimated settlements for known claims, as well as accruals of actuarial estimates ofincurred but not reported claims. At December 31, 2004 and 2003, we had total self-insurance accrualsreflected on our Consolidated Balance Sheets of $97.6 million and $89.3 million, respectively. Inestimating those costs, we consider historical loss experience and make judgments about the expected
48

levels of costs per claim. We also rely on independent consultants to assist in the determination ofestimated accruals. These claims are accounted for based on actuarial estimates of the undiscountedclaims, including those claims incurred but not reported. We believe the use of actuarial methods toaccount for these liabilities provides a consistent and effective way to measure these highly judgmentalaccruals; however, changes in health care costs, accident frequency and severity and other factors canmaterially affect the estimate for these liabilities. We continually monitor the potential for changes inestimates, evaluate our insurance accruals and adjust our recorded provisions.
TREASURY STOCK. The shares of Harrah’s Entertainment common stock we hold in treasuryare reflected in our Consolidated Balance Sheets and our Consolidated Statements of Stockholders’Equity and Comprehensive Income as if those shares were retired.
REVENUE RECOGNITION. Casino revenues consist of net gaming wins. Food and beverage androoms revenues include the aggregate amounts generated by those departments at all consolidatedcasinos and casino hotels.
Casino promotional allowances consist principally of the retail value of complimentary food andbeverages, accommodations, admissions and entertainment provided to casino patrons. Also included isthe value of coupons redeemed for cash at our properties. The estimated costs of providing suchcomplimentary services, which we classify as casino expenses for continuing operations throughinterdepartmental allocations, were as follows:
2004 2003 2002
Food and beverage . . . . . . . . . . . . . . . . . . . . . . . . $240,752 $204,820 $199,972Rooms . . . . . . . . . . . . . . . . . . . . . . . . . . . . . . . . . 82,932 77,436 71,364Other . . . . . . . . . . . . . . . . . . . . . . . . . . . . . . . . . 50,168 25,663 20,556
$373,852 $307,919 $291,892
EARNINGS PER SHARE. In accordance with the provisions of SFAS No. 128, ‘‘Earnings PerShare,’’ we compute our Basic earnings per share by dividing Net income by the number of Weightedaverage common shares outstanding during the year. Our Diluted earnings per share is computed bydividing Net income by the number of Weighted average common and common equivalent sharesoutstanding during the year. For each of the three years ended December 31, 2004, common stockequivalents consisted solely of net restricted shares of 489,958, 453,592 and 631,532, respectively, andstock options outstanding of 1,215,060, 977,263 and 1,691,000, respectively, under our employee stockbenefit plans. (See Note 14.)
STOCK-BASED EMPLOYEE COMPENSATION. As allowed under the provisions of SFASNo. 123, ‘‘Accounting for Stock-Based Compensation,’’ we apply the provisions of Accounting PrinciplesBoard Opinion No. 25, ‘‘Accounting for Stock Issued to Employees,’’ and related interpretations toaccount for our stock option plans and, accordingly, do not recognize compensation expense.Furthermore, no stock option-based employee compensation cost is reflected in net income, as alloptions granted under those plans had an exercise price equal to the market value of the underlyingcommon stock on the date of grant. Had compensation expense for the stock option plans beendetermined in accordance with SFAS No. 123, total stock-based employee compensation expense, net oftax effects, would have been $29.9 million, $23.5 million, and $20.2 million for the years ended
49

HARRAH’S ENTERTAINMENT, INC.
NOTES TO CONSOLIDATED FINANCIAL STATEMENTS (Continued)
(Dollars in thousands, unless otherwise stated)
December 31, 2004, 2003, and 2002, respectively, and our pro forma Net income and Earnings pershare for the indicated periods would have been:
2004 2003 2002
As Pro As Pro As ProReported Forma Reported Forma Reported Forma
Net income . . . . . . . . . . . $367,709 $337,768 $292,623 $269,086 $235,029 $214,828Earnings per share
Basic . . . . . . . . . . . . . . 3.31 3.04 2.69 2.47 2.11 1.93Diluted . . . . . . . . . . . . 3.26 2.99 2.65 2.44 2.07 1.89
The fair value of each option grant is estimated on the date of grant using the Black-Scholesoption-pricing model with the following weighted average assumptions:
2004 2003 2002
Expected dividend yield . . . . . . . . . . . . . . . . . . . . . . . . . . . . 2.5% 2.8% 0.0%Expected stock price volatility . . . . . . . . . . . . . . . . . . . . . . . . 37.9% 37.0% 32.0%Risk-free interest rate . . . . . . . . . . . . . . . . . . . . . . . . . . . . . . 3.7% 2.5% 3.7%Expected average life of options (years) . . . . . . . . . . . . . . . . . 5 6 6
In December 2004, the Financial Accounting Standards Board (‘‘FASB’’) issued SFAS No. 123(revised 2004), ‘‘Share-Based Payment,’’ which we are required to apply as of the first interim orannual reporting period that begins after June 15, 2005. SFAS No. 123(R) requires that we recognizean expense for our equity-based compensation programs, including stock options. We are currentlyevaluating the provisions of SFAS No. 123(R) to determine its impact on our future financialstatements.
ADVERTISING. The Company expenses the production costs of advertising the first time theadvertising takes place. Advertising expense for continuing operations was $129.7 million, $116.0 millionand $106.0 million for the years 2004, 2003 and 2002, respectively.
INCOME TAXES. We are subject to income taxes in the United States as well as various statesand foreign jurisdictions in which we operate. We account for income taxes under SFAS 109,‘‘Accounting for Income Taxes,’’ whereby deferred tax assets and liabilities are recognized for theexpected future tax consequences of events that have been included in the financial statements orincome tax returns. Deferred tax assets and liabilities are determined based on differences betweenfinancial statement carrying amounts of existing assets and their respective tax bases using enacted taxrates expected to apply to taxable income in the years in which those temporary differences areexpected to be recovered or settled.
The effect on the income tax provision and deferred tax assets and liabilities of a change in taxrates is recognized in income in the period that includes the enactment date. As indicated in Note 10to our Consolidated Financial Statements, the Company has provided a valuation allowance on certainstate net operating losses (‘‘NOLs’’) and other deferred state tax assets. Although the Companyconsistently generates taxable income on a consolidated basis, these assets were not deemed realizablebecause they are attributable to subsidiaries that are not expected to produce future taxable earnings.Other than this exception, we are unaware of any circumstances that would cause the remainingdeferred tax assets to not be realizable.
50

Our income tax returns are subject to examination by the Internal Revenue Service (‘‘IRS’’) andother tax authorities. While positions taken in tax returns are sometimes subject to uncertainty in thetax laws, we do not take such positions unless we have ‘‘substantial authority’’ to do so under theInternal Revenue Code and applicable regulations. We may take positions on our tax returns based onsubstantial authority that are not ultimately accepted by the IRS.
We assess such potential unfavorable outcomes based on the criteria of SFAS No. 5, ‘‘Accountingfor Contingencies.’’ We establish a tax reserve if an unfavorable outcome is probable and the amountof the unfavorable outcome can be reasonably estimated. In determining whether the probable criterionof SFAS No. 5 is met, we presume that the taxing authority will focus on the exposure and we assessthe probable outcome of a particular issue based upon the relevant legal and technical merits. We alsoapply our judgment regarding the potential actions by the tax authorities and resolution through thesettlement process.
We maintain required tax reserves until such time as the underlying issue is resolved. When actualresults differ from reserve estimates, we adjust the income tax provision and our tax reserves in theperiod resolved. For tax years that are examined by taxing authorities, we adjust tax reserves in the yearthe tax examinations are settled. For tax years that are not examined by taxing authorities, we adjusttax reserves in the year that the statute of limitations expires. Our estimate of the potential outcomefor any uncertain tax issue is highly judgmental, and we believe we have adequately provided for anyreasonable and foreseeable outcomes related to uncertain tax matters. In the event that the taxingauthorities ultimately sustain adjustments to the Company’s previously reported taxable income, theCompany will remit payments accordingly.
We classify reserves for tax uncertainties within ‘‘accrued expenses’’ and ‘‘deferred credits andother’’ in the accompanying Consolidated Balance Sheets, separate from any related income taxpayable or deferred income taxes. Reserve amounts may relate to the deductibility of an item, as wellas potential interest associated with those items.
USE OF ESTIMATES. The preparation of financial statements in conformity with accountingprinciples generally accepted in the United States requires that we make estimates and assumptionsthat affect the reported amounts of assets and liabilities and disclosure of contingent assets andliabilities at the date of the financial statements and the amounts of revenues and expenses during thereporting period. Our actual results could differ from those estimates.
Note 2—Acquisitions
In the three-year period ended December 31, 2004, we acquired one casino company, certainintellectual property rights, a thoroughbred racetrack facility and the remaining interest in anonconsolidated subsidiary. For each of these acquisitions, the purchase price is allocated to theunderlying assets acquired and liabilities assumed based upon their estimated fair values at the date ofacquisition. We determine the estimated fair values based on independent appraisals, discounted cashflows, quoted market prices and estimates made by management. For each transaction, the allocation ofthe purchase price was, or will be, completed within one year from the date of the acquisition. To theextent that the purchase price exceeded the fair value of the net identifiable tangible and intangibleassets acquired, such excess was allocated to goodwill. With the adoption of SFAS No. 142 in 2002, weno longer amortize goodwill or intangible assets that are determined to have an indefinite life.
51

HARRAH’S ENTERTAINMENT, INC.
NOTES TO CONSOLIDATED FINANCIAL STATEMENTS (Continued)
(Dollars in thousands, unless otherwise stated)
The table below summarizes our acquisition transactions completed in the three-year period endingDecember 31, 2004.
Total NumberDate Purchase Goodwill of Geographic
Company Acquired Price(a) Assigned Casinos Location
Horseshoe Gaming . . . . . . . July 2004 $1.62 billion $565 million 3 Bossier City, LouisianaHammond, IndianaTunica Mississippi
Horseshoe Club Operating March 2004 $37 million – 1(c) Las Vegas, NevadaCompany(b) . . . . . . . . . .
JCC Holding Company(d) . . June 2002 and $149 million – 1 New Orleans, LouisianaDecember 2002
Louisiana Downs, Inc. . . . . . December 2002 $94 million $36 million 1(e) Bossier City, Louisiana
(a) Total purchase price includes the market value of debt assumed determined as of the acquisition date.
(b) This acquisition was for certain intellectual property assets, including the rights to the Horseshoe brand inNevada and to the World Series of Poker brand and tournament.
(c) This casino is owned by another gaming company, and we operate it jointly with that company.
(d) Acquired additional 14% interest in June 2002 and the remaining 37% interest in December 2002.
(e) Acquired a thoroughbred racetrack that was expanded to include slot machines in 2003.
HORSESHOE GAMING. On July 1, 2004, we acquired 100 percent of the equity interests ofHorseshoe Gaming for approximately $1.62 billion, including assumption of debt valued atapproximately $558 million and acquisition costs. A $75 million escrow payment made in 2003 wasapplied to the purchase price. We issued a redemption notice on July 1, 2004, for all $558 million ofHorseshoe Gaming’s outstanding 85⁄8% Senior Subordinated Notes due July 2009 and retired that debtAugust 2, 2004. We financed the acquisition and the debt retirement through working capital andestablished debt programs. We purchased Horseshoe Gaming to acquire casinos in Hammond, Indiana;Tunica, Mississippi; and Bossier City, Louisiana and with the intention of growing and developing theHorseshoe brand.
In anticipation of our acquisition of Horseshoe Gaming, we sold our Harrah’s brand casino inShreveport, Louisiana. (See Note 3.) After consideration of the sale of Harrah’s Shreveport, theHorseshoe Gaming acquisition added a net 113,300 square feet of casino space and approximately4,580 slot machines and 150 table games to our existing portfolio. Taken together with our acquisitionof intellectual property rights from Horseshoe Club Operating Company (‘‘Horseshoe Club’’) (seediscussion below), this acquisition gave us rights to the Horseshoe brand in all of the United States.The results of the Horseshoe properties are included with our operating results subsequent to theiracquisition on July 1, 2004.
52

The following table summarizes the estimated fair values of the assets acquired and liabilitiesassumed at the date of acquisition. The purchase price allocation is in process and will be completedwithin one year of the acquisition; thus, the allocation of the purchase price is subject to refinement.
At July 1,(In millions) 2004
Current assets . . . . . . . . . . . . . . . . . . . . . . . . . . . . . . . . . . . . . . . . . . . . . . . . . . . . . . . . . . $ 109.1Land, buildings, riverboats and equipment . . . . . . . . . . . . . . . . . . . . . . . . . . . . . . . . . . . . . 579.8Long-term assets . . . . . . . . . . . . . . . . . . . . . . . . . . . . . . . . . . . . . . . . . . . . . . . . . . . . . . . . 17.7Intangible assets . . . . . . . . . . . . . . . . . . . . . . . . . . . . . . . . . . . . . . . . . . . . . . . . . . . . . . . . 494.0Goodwill . . . . . . . . . . . . . . . . . . . . . . . . . . . . . . . . . . . . . . . . . . . . . . . . . . . . . . . . . . . . . 565.2
Total assets acquired . . . . . . . . . . . . . . . . . . . . . . . . . . . . . . . . . . . . . . . . . . . . . . . . . . . 1,765.8
Current liabilities . . . . . . . . . . . . . . . . . . . . . . . . . . . . . . . . . . . . . . . . . . . . . . . . . . . . . . . (83.0)Deferred income taxes . . . . . . . . . . . . . . . . . . . . . . . . . . . . . . . . . . . . . . . . . . . . . . . . . . . (57.9)Long-term debt . . . . . . . . . . . . . . . . . . . . . . . . . . . . . . . . . . . . . . . . . . . . . . . . . . . . . . . . . (558.1)
Total liabilities assumed . . . . . . . . . . . . . . . . . . . . . . . . . . . . . . . . . . . . . . . . . . . . . . . . . (699.0)
Net assets acquired . . . . . . . . . . . . . . . . . . . . . . . . . . . . . . . . . . . . . . . . . . . . . . . . . . . $1,066.8
Of the estimated $494.0 million of acquired intangible assets, $295.0 million has been assigned togaming rights and $89.0 million has been assigned to trademarks, both of which are not subject toamortization. The remaining intangible assets include customer relationships estimated at $100.0 million(15-year weighted-average useful life) and contract rights estimated at $10.0 million (four-yearestimated life). The weighted average useful life of all amortizing intangible assets is approximately14 years.
We anticipate that all of the goodwill related to the Horseshoe Gaming acquisition will bedeductible for tax purposes.
The following pro forma consolidated financial information has been prepared assuming that theacquisition of Horseshoe Gaming and the extinguishment of Horseshoe Gaming’s debt had occurred onthe first day of the respective periods.
Year ended December 31,
(In millions, except per share amounts) 2004 2003
Net revenues . . . . . . . . . . . . . . . . . . . . . . . . . . . . . . . . . . . . . . . . . . . . . . . . . $4,905.9 $4,598.0
Income from operations . . . . . . . . . . . . . . . . . . . . . . . . . . . . . . . . . . . . . . . . . $ 857.2 $ 801.1
Income from continuing operations . . . . . . . . . . . . . . . . . . . . . . . . . . . . . . . . . $ 348.6 $ 293.7
Net income . . . . . . . . . . . . . . . . . . . . . . . . . . . . . . . . . . . . . . . . . . . . . . . . . . $ 386.8 $ 325.3
Earnings per share—dilutedIncome from continuing operations . . . . . . . . . . . . . . . . . . . . . . . . . . . . . . . $ 3.09 $ 2.66
Net income . . . . . . . . . . . . . . . . . . . . . . . . . . . . . . . . . . . . . . . . . . . . . . . . . $ 3.43 $ 2.95
53

HARRAH’S ENTERTAINMENT, INC.
NOTES TO CONSOLIDATED FINANCIAL STATEMENTS (Continued)
(Dollars in thousands, unless otherwise stated)
These unaudited pro forma results are presented for comparative purposes only. The pro formaresults are not necessarily indicative of what our actual results would have been had the acquisitionbeen completed as of the beginning of these periods, or of future results.
LAS VEGAS HORSESHOE HOTEL AND CASINO. In March 2004, we acquired certainintellectual property assets, including the rights to the Horseshoe brand in Nevada and to the WorldSeries of Poker brand and tournament, from Horseshoe Club. MTR Gaming Group, Inc. (‘‘MTRGaming’’) acquired the assets of the Binion’s Horseshoe Hotel and Casino (‘‘Las Vegas Horseshoe’’) inLas Vegas, Nevada, including the right to use the name ‘‘Binion’s’’ at the property, from HorseshoeClub. We will operate Las Vegas Horseshoe jointly with a subsidiary of MTR Gaming for one year,with options to extend the agreement for two additional years; however, we have notified MTRGaming that we do not intend to extend the agreement. The property, which had been closed sinceJanuary 2004, reopened April 1, 2004. Since its reopening, the operating results for Las VegasHorseshoe have been consolidated with our results and will continue to be consolidated until theoperating agreement is terminated on March 10, 2005. Las Vegas Horseshoe’s results have not beenmaterial to our operating results.
We paid approximately $37.4 million for the intellectual property assets, including assumption andsubsequent payment of certain liabilities of Las Vegas Horseshoe (which included certain amountspayable to a principal of Horseshoe Gaming) and approximately $5.1 million of acquisition costs. Theintangible assets acquired in this transaction have been deemed to have indefinite lives and, therefore,are not being amortized. We financed the acquisition with funds from various sources, including cashflows from operations and borrowings from established debt programs.
JAZZ CASINO COMPANY. On June 7, 2002, we acquired additional shares of the common stockof JCC Holding Company, which, together with its subsidiary, Jazz Casino Company LLC (collectively,‘‘JCC’’), owns and operates the Harrah’s casino in New Orleans, Louisiana. The acquisition of theseshares increased our ownership in JCC from 49% to 63% and required a change of our accountingtreatment for our investment in JCC from the equity method to consolidation of JCC in our financialstatements. We began consolidating JCC in our financial results on June 7, 2002. On December 10,2002, we acquired all remaining shares of JCC’s stock to increase our ownership to 100%.
LOUISIANA DOWNS. On December 20, 2002, we acquired a controlling interest in LouisianaDowns, Inc. (‘‘Louisiana Downs’’) a thoroughbred racetrack in Bossier City, Louisiana. The agreementgave Harrah’s Entertainment a 95% ownership interest in a company that owned both LouisianaDowns and Harrah’s Shreveport. In May 2003, approximately 900 slot machines were put into serviceand Louisiana Downs became the only land-based gaming facility in northern Louisiana. In the secondquarter of 2004, we opened a new, permanent facility with approximately 1,400 slot machines. Theresults of Louisiana Downs’ operations have been included in our Consolidated Financial Statementssince the date of acquisition.
HARRAH’S SHREVEPORT AND LOUISIANA DOWNS—BUYOUT OF MINORITY PARTNERS.In the first quarter of 2004, we paid approximately $37.5 million to the minority owners of the companythat owned Louisiana Downs and Harrah’s Shreveport to purchase their ownership interest in thatcompany. The excess of the cost to purchase the minority ownership above the capital balances wasassigned to goodwill. As a result of this transaction, Harrah’s Shreveport and Louisiana Downs becamewholly-owned by the Company. Harrah’s Shreveport was subsequently sold to another gaming company.
54
CHESTER DOWNS & MARINA. In July 2004, after receiving Pennsylvania regulatory andcertain local approvals, we acquired a 50% interest in Chester Downs & Marina, LLC (‘‘CD&M’’), anentity licensed to develop a harness-racing facility in southeastern Pennsylvania. Harrah’s Entertainmentand CD&M have agreed to develop Harrah’s Chester Downs Casino and Racetrack (‘‘Harrah’sChester’’), a 5/8-mile harness racetrack facility approximately six miles south of PhiladelphiaInternational Airport. Plans for the facility also include a 1,500-seat grandstand and simulcast facilities,a slot casino with approximately 2,000 games and a variety of food and beverage offerings. We havecommenced site work and demolition at the property and expect racing and simulcasting to begin inthe second quarter of 2006 and the casino to open in the third quarter of 2006. We will guarantee orprovide financing for the project and we are consolidating Harrah’s Chester in our financial statements.
HARRAH’S EAST CHICAGO—BUYOUT OF MINORITY PARTNERS. In the second quarter of2003, we paid approximately $28.8 million to former partners in the Harrah’s East Chicago property tosettle outstanding litigation with the partners relating to a buyout in 1999 of the partners’ interest inthe property and to terminate the contractual rights of the partners to repurchase an 8.55% interest inthe property. The two remaining minority partners in our East Chicago property owned, in aggregate,0.45% of this property. In December 2003 and January 2004, we acquired these ownership interests foraggregate consideration of approximately $0.8 million. As a result of these transactions, the EastChicago property became wholly-owned by the Company. (See Note 3.)
In addition to these completed transactions, we have announced the following planned acquisition.
CAESARS ENTERTAINMENT. On July 14, 2004, we signed a definitive agreement to acquireCaesars Entertainment, Inc. (‘‘Caesars’’) in a cash and stock transaction. Under the terms of theagreement, Caesars shareholders will receive either $17.75 in cash or 0.3247 shares of Harrah’sEntertainment’s common stock for each outstanding share of Caesars’ common stock, subject tolimitations on the aggregate amount of cash to be paid and shares of stock to be issued. Caesarsshareholders will be able to elect to receive solely shares of Harrah’s Entertainment’s common stock orcash, to the extent available pursuant to the terms of the agreement. The aggregate estimated purchaseprice, calculated as of July 14, 2004, was approximately $9.4 billion. The purchase price will fluctuateuntil closing due to changes in the number of outstanding shares of Caesars’ stock and the balance ofCaesars’ outstanding debt. Caesars operates 27 casinos with about two million square feet of gamingspace and approximately 26,000 hotel rooms and has significant presence in Las Vegas, Atlantic Cityand Mississippi. The transaction is subject to regulatory and shareholders’ approvals and is expected toclose in the second quarter of 2005.
In anticipation of the Caesars merger, we have engaged consultants and dedicated internalresources to plan for the merger and integration of Caesars into Harrah’s Entertainment. These costsare reflected in Merger and integration costs for Caesars acquisition in our Consolidated Statements ofIncome.
Note 3—Dispositions
HARRAH’S SHREVEPORT. In May 2004, we sold Harrah’s Shreveport to another gamingcompany. Prior to the sale, we classified this property in Assets/Liabilities held for sale on ourConsolidated Balance Sheets and we ceased depreciating its assets in September 2003. The assets soldconsisted primarily of inventories, property and equipment. We received cash proceeds of $190 millionand recorded no gain or loss on this sale. Since we had a continued presence in the Shreveport-BossierCity market, Harrah’s Shreveport’s operating results were not classified as Discontinued operations.
55

HARRAH’S ENTERTAINMENT, INC.
NOTES TO CONSOLIDATED FINANCIAL STATEMENTS (Continued)
(Dollars in thousands, unless otherwise stated)
The following properties were sold during 2003. The operating results of these properties and thelosses recorded on these sales are presented in our Consolidated Statements of Income as Discontinuedoperations and prior year results have been reclassified to conform to the 2003 presentation.
HARVEYS COLORADO. In May 2003, we sold Harveys Colorado, which we had concluded was anonstrategic asset for us. The assets sold consisted primarily of inventories, property and equipment.The buyer also assumed certain accrued liabilities. We received cash proceeds of $17.6 million andrecorded a pretax loss of $1.0 million on this sale.
Revenues at Harveys Colorado, reported in discontinued operations for December 31, 2003 and2002 were $12.2 million and $35.7 million, respectively. Harveys Colorado’s pretax loss, including theloss on the sale, for the year ended December 31, 2003, was $1.4 million and its pretax income for theyear ended December 31, 2002, was $2.4 million.
HARRAH’S VICKSBURG. In June 2003, we announced an agreement to sell Harrah’s Vicksburg,and that sale was completed on October 27, 2003. The assets sold consisted primarily of land, buildings,equipment and inventories. We received cash proceeds of $28.6 million and recorded a pretax loss of$0.7 million on this sale.
Revenues at Harrah’s Vicksburg, which were reported in discontinued operations, were$29.0 million for the year ended December 31, 2003, and $37.9 million for the year endedDecember 31, 2002. Harrah’s Vicksburg’s pretax income, after consideration of the loss on the sale, was$2.4 million for the year ended December 31, 2003, and $2.2 million for the year ended December 31,2002.
In addition to these completed sales, we also have announced the following planned sale.
HARRAH’S EAST CHICAGO AND HARRAH’S TUNICA. In September 2004, we entered into anagreement to sell the assets and certain related current liabilities of Harrah’s East Chicago andHarrah’s Tunica to an unrelated third party. The sale, which is subject to regulatory approvals, isexpected to close in the first quarter of 2005. We believe that the sale of these two properties may helpfacilitate the closing of the Caesars transaction.
Harrah’s East Chicago and Harrah’s Tunica are classified in Assets/Liabilities held for sale on ourConsolidated Balance Sheets, and we ceased depreciating their assets in September 2004. Had we notceased depreciation of these assets, additional depreciation expense of $6.9 million would have beenrecorded. Results for Harrah’s East Chicago and Harrah’s Tunica are classified as discontinuedoperations for all periods presented. We expect to report a gain on the sale of these two properties inthe quarter in which the transaction closes.
Summary operating results for the discontinued operations are as follows:
2004 2003 2002
Net revenues . . . . . . . . . . . . . . . . . . . . . . . . . . . . . . . . . . . $379,700 $373,857 $350,661
Pretax income from discontinued operations . . . . . . . . . . . . $ 56,644 $ 47,523 $ 63,112
Discontinued operations, net of tax . . . . . . . . . . . . . . . . . . . $ 38,184 $ 30,890 $ 41,023
56

Assets held for sale and liabilities related to assets held for sale for Harrah’s East Chicago andHarrah’s Tunica as of December 31 are as follows:
2004 2003
Cash and cash equivalents . . . . . . . . . . . . . . . . . . . . . . . . . . . $ 12,000 $ 12,000Inventories . . . . . . . . . . . . . . . . . . . . . . . . . . . . . . . . . . . . . . 861 741Property and equipment, net . . . . . . . . . . . . . . . . . . . . . . . . . 271,396 257,020Goodwill . . . . . . . . . . . . . . . . . . . . . . . . . . . . . . . . . . . . . . . 206,536 206,372Investments in and advances to nonconsolidated affiliates . . . . 1,219 1,464Deferred costs and other . . . . . . . . . . . . . . . . . . . . . . . . . . . . 183 198
Total assets held for sale . . . . . . . . . . . . . . . . . . . . . . . . . . $492,195 $477,795
Accrued expenses . . . . . . . . . . . . . . . . . . . . . . . . . . . . . . . . . $ 313 $ (76)
Total liabilities related to assets held for sale . . . . . . . . . . . . $ 313 $ (76)
Note 4—Goodwill and Other Intangible Assets
We adopted SFAS No. 142, ‘‘Goodwill and Other Intangible Assets,’’ effective January 1, 2002.SFAS No. 142 provides guidance regarding the recognition and measurement of intangible assets,eliminates the amortization of certain intangibles and requires assessments for impairment of intangibleassets that are not subject to amortization at least annually.
As a result of our implementation review of the goodwill and other intangible assets arising fromour prior acquisitions, we determined that impairment charges of $91.2 million, net of tax benefits of$2.8 million, were required. These charges, which were recorded in first quarter 2002 and are reportedin our Consolidated Statements of Income as a change in accounting principle, relate to goodwill andthe trademark acquired in our 1999 acquisition of Rio Hotel and Casino, Inc. (‘‘Rio’’). Since theacquisition of Rio, competition had intensified in the market and Rio had greatly reduced its emphasison international high-end table games play, a significant component of its business at the time of theacquisition. We determine the fair value of an operating unit as a function, or multiple, of earningsbefore interest, taxes, depreciation and amortization (‘‘EBITDA’’), a common measure used to valueand buy or sell cash intensive businesses such as casinos. Our analysis for Rio indicated that the fairvalue of the property fell short of the carrying value, and recognition of an impairment of $86.0 millionof goodwill was appropriate. The fair value of the Rio trademark was assessed by applying a ‘‘relieffrom royalty’’ methodology, which ascribed a value to the trademark derived as the present value of apercentage of forecasted future revenues. Because the Rio had not sustained the level of revenuesassumed in the original computation to assign a value to the trademark, future revenue assumptionswere reassessed and it was determined that the fair value of the trademark was $5.2 million, net of taxbenefits of $2.8 million, less than the carrying value. Rio’s tangible assets were assessed for impairmentapplying the provisions of SFAS No. 144, ‘‘Accounting for the Impairment or Disposal of Long-LivedAssets,’’ and our analysis indicated that the carrying value of the tangible assets was not impaired.
Based on our annual assessment for impairment as of September 30, 2004, we determined thatgoodwill and intangible assets with indefinite lives had not been further impaired. Based on our annualassessment for impairment of as September 30, 2003, it was determined that the remaining goodwillassociated with Harrah’s Reno was impaired, and a fourth quarter 2003 charge of $6.3 million wasrecorded. Operating trends reflected the weak market conditions in the Reno area and increased levelsof competition from Indian casinos in the Northern California area. We determined the fair value of
57

HARRAH’S ENTERTAINMENT, INC.
NOTES TO CONSOLIDATED FINANCIAL STATEMENTS (Continued)
(Dollars in thousands, unless otherwise stated)
Reno as a multiple of EBITDA, and our analysis for Reno indicated that the fair value of thatoperating unit was less than the carrying value. Reno has no remaining intangible assets that will besubject to the annual impairment assessment. Reno’s tangible assets were assessed for impairmentapplying the provisions of SFAS No. 144, and our analysis indicated that the carrying value of thetangible assets was not impaired. Based on our annual assessment as of September 30, 2002, wedetermined that goodwill and intangible assets with indefinite lives were not impaired.
The following table sets forth changes in goodwill for the years ended December 31, 2003 andDecember 31, 2004.
Balance at December 31, 2002 . . . . . . . . . . . . . . . . . . . . . . . . . . . . . . . $ 735,615Additions or adjustments:
Finalization of purchase price allocation for Louisiana Downs . . . . . (27,349)Adjustments for taxes related to acquisitions . . . . . . . . . . . . . . . . . (818)Impairment losses . . . . . . . . . . . . . . . . . . . . . . . . . . . . . . . . . . . . (6,315)
Balance at December 31, 2003 . . . . . . . . . . . . . . . . . . . . . . . . . . . . . . . 701,133Additions or adjustments:
Acquisition of Horseshoe Gaming . . . . . . . . . . . . . . . . . . . . . . . . . 565,245Additional payment related to Bluffs Run . . . . . . . . . . . . . . . . . . . 72,820Buyout of minority partners at Louisiana Downs . . . . . . . . . . . . . . 13,532Adjustments for taxes related to acquisitions . . . . . . . . . . . . . . . . . 2,008
Balance at December 31, 2004 . . . . . . . . . . . . . . . . . . . . . . . . . . . . . . . $1,354,738
The following table provides the gross carrying value and accumulated amortization for each majorclass of intangible assets.
December 31, 2004 December 31, 2003
Gross Net Gross NetCarrying Accumulated Carrying Carrying Accumulated CarryingAmount Amortization Amount Amount Amortization Amount
Amoritizing intangible assets:Contract rights . . . . . . . . . . . $ 73,590 $10,600 $ 62,990 $63,590 $ 6,572 $ 57,018Customer relationships . . . . . 113,100 10,434 102,666 13,100 5,023 8,077
$186,690 $21,034 165,656 $76,690 $11,595 65,095
Nonamortizing intangible assets:Trademarks . . . . . . . . . . . . . . 273,065 146,624Gaming rights . . . . . . . . . . . . 422,634 103,300
695,699 249,924
Total . . . . . . . . . . . . . . . . . . . . $861,355 $315,019
The increase in the gross carrying value of intangible assets is due to the acquisition of HorseshoeGaming (see Note 2). The aggregate amortization expense for the years ended December 31, 2004,2003 and 2002 for those assets that continue to be amortized under provisions of SFAS No. 142 was$9.4 million, $4.8 million and $4.5 million, respectively. Estimated annual amortization expense for
58

those assets for the years ending December 31, 2005, 2006, 2007, 2008 and 2009 is $14.0 million,$13.7 million, $13.0 million, $11.4 million and $9.8 million, respectively.
Note 5—Stockholders’ Equity
In addition to its common stock, Harrah’s Entertainment has the following classes of stockauthorized but unissued:
Preferred stock, $100 par value, 150,000 shares authorizedSpecial stock, $1.125 par value, 5,000,000 shares authorized–
Series A Special Stock, 2,000,000 shares designated
Harrah’s Entertainment’s Board of Directors has authorized that one special stock purchase right(a ‘‘Right’’) be attached to each outstanding share of common stock. The Rights are not separablefrom the shares. These Rights are exercisable only if a person or group acquires 15% or more ofHarrah’s Entertainment common stock or announces a tender offer for 15% or more of the commonstock. Each Right entitles stockholders to buy one two-hundredth of a share of Series A Special Stockof the Company at an initial price of $130 per Right. If a person acquires 15% or more of theCompany’s outstanding common stock, each Right entitles its holder to purchase common stock of theCompany having a market value at that time of twice the Right’s exercise price. Under certainconditions, each Right entitles its holder to purchase stock of an acquiring company at a discount.Rights held by the 15% holder will become void. The Rights will expire on October 5, 2006, unlessearlier redeemed by the Board at one cent per Right.
During the past four years, our Board of Directors has authorized plans whereby we havepurchased shares of the Company’s common stock in the open market from time to time as marketconditions and other factors warranted. The table below summarizes the plans in effect during the lastfour years.
Number Number of Shares Averageof Shares Purchased as of Price
Plan Authorized Authorized December 31, 2004 Per Share
July 2001 . . . . . . . . . . . . . . . . . . . . . . . . . . . . . . . . 6.0 million 6.0 million $37.15July 2002 . . . . . . . . . . . . . . . . . . . . . . . . . . . . . . . . 2.0 million 1.4 million 39.24November 2002 . . . . . . . . . . . . . . . . . . . . . . . . . . . 3.0 million 1.5 million 47.54November 2004 . . . . . . . . . . . . . . . . . . . . . . . . . . . 2.0 million – –
In November 2004, our Board of Directors authorized the purchase of 3.5 million shares ofcommon stock in the open market and negotiated purchases through the end of 2005. The 3.5 millionshares includes 1.5 million shares available to be purchased pursuant to the authorization that was toexpire December 31, 2004, plus an additional 2.0 million shares. The repurchases were funded throughavailable operating cash flows and borrowings from our established debt programs.
Under the terms of our equity incentive award programs, we have reserved shares of Harrah’sEntertainment common stock for issuance under the 2004 Executive Incentive Award Plan, the 2001Broad-based Incentive Plan and the 1996 Non-Management Directors Stock Incentive Plan. (SeeNote 14 for a description of the plans.) The 2004 Executive Incentive Award Plan and the 1996Non-Management Directors Stock Incentive Plan are equity compensation plans approved by ourstockholders and the 2001 Broad-based Incentive Plan is an equity compensation plan not approved byour stockholders. The shares held in reserve for issuance or grant under the Harrah’s
59

HARRAH’S ENTERTAINMENT, INC.
NOTES TO CONSOLIDATED FINANCIAL STATEMENTS (Continued)
(Dollars in thousands, unless otherwise stated)
Entertainment, Inc. 2001 Executive Stock Incentive Plan and the 1996 Non-Management DirectorsStock Incentive Plan are now available under the 2004 Executive Incentive Award Plan in 2004. As ofDecember 31, 2004, 4,276,342 shares were authorized and unissued under the 2004 Executive IncentiveAward Plan and 30,216 shares were authorized and unissued under the 2001 Broad-based IncentivePlan. No additional shares will be authorized under the 2001 Broad-based Incentive Plan.
Quarterly cash dividends of 30 cents per share were declared and paid in the first and secondquarters of 2004 and in the third and fourth quarters of 2003. In the third and fourth quarters of 2004,the Company declared and paid quarterly cash dividends of 33 cents per share.
In connection with the Caesars acquisition, at a special meeting to be held in March 2005, ourstockholders will be asked to vote upon a proposal to approve an amendment to Harrah’sEntertainment’s certificate of incorporation to increase the number of authorized shares of Harrah’sEntertainment common stock from 360 million to 720 million.
Note 6—Detail of Certain Balance Sheet Accounts
Accrued expenses consisted of the following as of December 31:
2004 2003
Payroll and other compensation . . . . . . . . . . . . . . . . . . . . . . . . . . . . . . $150,125 $106,421Insurance claims and reserves . . . . . . . . . . . . . . . . . . . . . . . . . . . . . . . 97,582 89,349Accrued interest payable . . . . . . . . . . . . . . . . . . . . . . . . . . . . . . . . . . . 65,576 45,084Accrued taxes . . . . . . . . . . . . . . . . . . . . . . . . . . . . . . . . . . . . . . . . . . 78,769 67,180Other accruals . . . . . . . . . . . . . . . . . . . . . . . . . . . . . . . . . . . . . . . . . . 185,654 155,432
$577,706 $463,466
60

Note 7—Debt
Long-term debt consisted of the following as of December 31:
2004 2003
Credit facilities3.07%-4.25% at December 31, 2004, maturities to 2009 . . . . . . . . . . . . . . . $1,580,000 $ 947,800
Secured Debt7.1%, maturity 2028 . . . . . . . . . . . . . . . . . . . . . . . . . . . . . . . . . . . . . . . . . 92,377 93,6223.71%-6.95%, maturities to 2033 . . . . . . . . . . . . . . . . . . . . . . . . . . . . . . . 1,348 607
Unsecured Senior Notes5.5%, maturity 2010 . . . . . . . . . . . . . . . . . . . . . . . . . . . . . . . . . . . . . . . . . 744,034 –5.375%, maturity 2013 . . . . . . . . . . . . . . . . . . . . . . . . . . . . . . . . . . . . . . . 496,773 496,5047.125%, maturity 2007 . . . . . . . . . . . . . . . . . . . . . . . . . . . . . . . . . . . . . . . 496,504 498,7807.5%, maturity 2009 . . . . . . . . . . . . . . . . . . . . . . . . . . . . . . . . . . . . . . . . . 499,109 498,9268.0%, maturity 2011 . . . . . . . . . . . . . . . . . . . . . . . . . . . . . . . . . . . . . . . . . 496,506 496,079
Unsecured Senior Subordinated Notes7.875%, maturity 2005 . . . . . . . . . . . . . . . . . . . . . . . . . . . . . . . . . . . . . . . 587,988 590,524
Other Unsecured BorrowingsCommercial Paper, maturities to 2005 . . . . . . . . . . . . . . . . . . . . . . . . . . . . 157,800 50,000
Capitalized Lease Obligations7.6%-10.0%, maturities to 2006 . . . . . . . . . . . . . . . . . . . . . . . . . . . . . . . . 470 679
5,152,909 3,673,521Current portion of long-term debt . . . . . . . . . . . . . . . . . . . . . . . . . . . . . . . . (1,788) (1,632)
$5,151,121 $3,671,889
$590.5 million, face amount, of our 7.875% Senior Subordinated Notes due December 2005, areclassified as long-term in our Consolidated Balance Sheet as of December 31, 2004, because theCompany has both the intent and the ability to refinance these notes.
As of December 31, 2004, aggregate annual principal maturities for the four years subsequent to2005 were: 2006, $1.7 million; 2007, $498.2 million; 2008, $60.1 million; and 2009, $2.8 billion.
CREDIT AGREEMENT. At December 31, 2004, we had credit facilities (the ‘‘CreditAgreement’’) that provided for up to $2.5 billion in borrowings, maturing on April 23, 2009. The CreditAgreement contains a provision that would allow an increase in the borrowing capacity to $3.0 billion,if mutually acceptable to the Company and the lenders. Interest on the Credit Agreement is based onour debt ratings and leverage ratio and is subject to change. As of December 31, 2004, the CreditAgreement bore interest based upon 90 basis points over LIBOR and bore a facility fee for borrowedand unborrowed amounts of 20 basis points, a combined 110 basis points. At our option, we mayborrow at the prime rate under the new Credit Agreement. As of December 31, 2004, $1.58 billion inborrowings were outstanding under the Credit Agreement with an additional $59.8 million committedto back letters of credit. After consideration of these borrowings, but before consideration of amountsborrowed under the commercial paper program, $860.2 million of additional borrowing capacity wasavailable to the Company as of December 31, 2004.
61
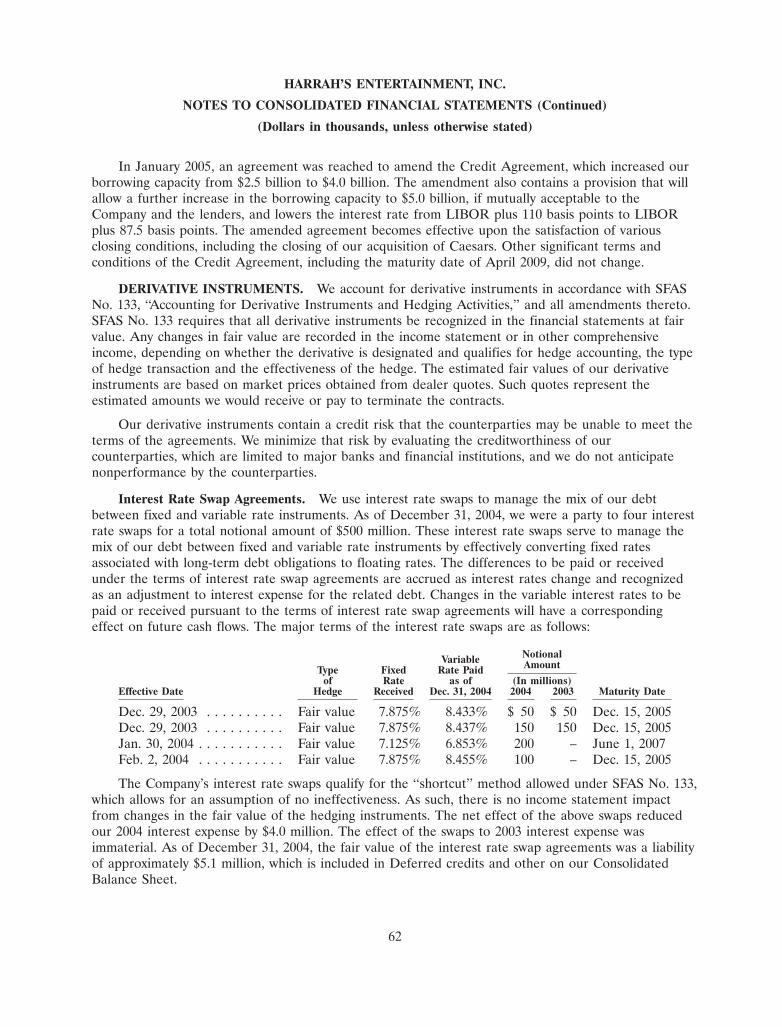
HARRAH’S ENTERTAINMENT, INC.
NOTES TO CONSOLIDATED FINANCIAL STATEMENTS (Continued)
(Dollars in thousands, unless otherwise stated)
In January 2005, an agreement was reached to amend the Credit Agreement, which increased ourborrowing capacity from $2.5 billion to $4.0 billion. The amendment also contains a provision that willallow a further increase in the borrowing capacity to $5.0 billion, if mutually acceptable to theCompany and the lenders, and lowers the interest rate from LIBOR plus 110 basis points to LIBORplus 87.5 basis points. The amended agreement becomes effective upon the satisfaction of variousclosing conditions, including the closing of our acquisition of Caesars. Other significant terms andconditions of the Credit Agreement, including the maturity date of April 2009, did not change.
DERIVATIVE INSTRUMENTS. We account for derivative instruments in accordance with SFASNo. 133, ‘‘Accounting for Derivative Instruments and Hedging Activities,’’ and all amendments thereto.SFAS No. 133 requires that all derivative instruments be recognized in the financial statements at fairvalue. Any changes in fair value are recorded in the income statement or in other comprehensiveincome, depending on whether the derivative is designated and qualifies for hedge accounting, the typeof hedge transaction and the effectiveness of the hedge. The estimated fair values of our derivativeinstruments are based on market prices obtained from dealer quotes. Such quotes represent theestimated amounts we would receive or pay to terminate the contracts.
Our derivative instruments contain a credit risk that the counterparties may be unable to meet theterms of the agreements. We minimize that risk by evaluating the creditworthiness of ourcounterparties, which are limited to major banks and financial institutions, and we do not anticipatenonperformance by the counterparties.
Interest Rate Swap Agreements. We use interest rate swaps to manage the mix of our debtbetween fixed and variable rate instruments. As of December 31, 2004, we were a party to four interestrate swaps for a total notional amount of $500 million. These interest rate swaps serve to manage themix of our debt between fixed and variable rate instruments by effectively converting fixed ratesassociated with long-term debt obligations to floating rates. The differences to be paid or receivedunder the terms of interest rate swap agreements are accrued as interest rates change and recognizedas an adjustment to interest expense for the related debt. Changes in the variable interest rates to bepaid or received pursuant to the terms of interest rate swap agreements will have a correspondingeffect on future cash flows. The major terms of the interest rate swaps are as follows:
NotionalVariable AmountType Fixed Rate Paidof Rate as of (In millions)
Effective Date Hedge Received Dec. 31, 2004 2004 2003 Maturity Date
Dec. 29, 2003 . . . . . . . . . . Fair value 7.875% 8.433% $ 50 $ 50 Dec. 15, 2005Dec. 29, 2003 . . . . . . . . . . Fair value 7.875% 8.437% 150 150 Dec. 15, 2005Jan. 30, 2004 . . . . . . . . . . . Fair value 7.125% 6.853% 200 – June 1, 2007Feb. 2, 2004 . . . . . . . . . . . Fair value 7.875% 8.455% 100 – Dec. 15, 2005
The Company’s interest rate swaps qualify for the ‘‘shortcut’’ method allowed under SFAS No. 133,which allows for an assumption of no ineffectiveness. As such, there is no income statement impactfrom changes in the fair value of the hedging instruments. The net effect of the above swaps reducedour 2004 interest expense by $4.0 million. The effect of the swaps to 2003 interest expense wasimmaterial. As of December 31, 2004, the fair value of the interest rate swap agreements was a liabilityof approximately $5.1 million, which is included in Deferred credits and other on our ConsolidatedBalance Sheet.
62

Treasury Rate Lock Agreements. We expect to issue between $750 million and $1 billion of newdebt in the first half of 2005. To partially hedge the risk of future increases to the treasury rate, wehave entered into agreements to lock in existing ten-year rates to hedge against such increases. Themajor terms of the treasury rate lock agreements are as follows:
Type Treasuryof Lock Notional
Effective Date Hedge Rate Amount Termination Date
(In millions)
Nov. 22, 2004 . . . . . . . . . . . . . . Cash flow 4.373% $200 May 20, 2005Dec. 16, 2004 . . . . . . . . . . . . . . Cash flow 4.239% 50 May 20, 2005Dec. 16, 2004 . . . . . . . . . . . . . . Cash flow 4.239% 50 May 20, 2005Dec. 16, 2004 . . . . . . . . . . . . . . Cash flow 4.239% 100 May 23, 2005
We have determined that the treasury rate lock agreements qualify for hedge accounting and areperfectly effective. As such, there is no income statement impact from changes in the fair value of thehedging instruments. The fair values of our treasury rate lock agreements are carried as assets orliabilities in our Consolidated Balance Sheet, and changes in the fair values are recorded as acomponent of other comprehensive income and will be reclassified to earnings over the life of the debtto be issued. The amount that is expected to be reclassified to earnings within the next 12 months isnot material. The fair value of the treasury rate lock agreements as of December 31, 2004, was areceivable of approximately $1.9 million. This amount is included in Prepayments and other on ourConsolidated Balance Sheet. The net amount of deferred gains included in other comprehensiveincome at December 31, 2004, is $1.2 million.
In January 2005, we hedged an additional $100 million notional amount with terms identical to thetreasury locks existing as of December 31, 2004, at a rate of 4.242% and a termination date of May 20,2005.
COMMERCIAL PAPER. To provide the Company with cost-effective borrowing flexibility, wehave a $200 million commercial paper program that is used to borrow funds for general corporatepurposes. Although the debt instruments are short-term in tenor, they are classified as long-term debtbecause the commercial paper is backed by our Credit Agreement and we have committed to keepavailable capacity under our Credit Agreement in an amount equal to or greater than amountsborrowed under this program. At December 31, 2004, $157.8 million was outstanding under thisprogram.
ISSUANCE OF NEW DEBT. In addition to our Credit Agreement, we have issued debt and enteredinto credit agreements to provide the Company with cost-effective borrowing flexibility and to replaceshort-term, floating-rate debt with long-term, fixed-rate debt. The table below summarizes the face value ofdebt obligations entered into during the last three years and outstanding at December 31, 2004.
Face ValueOutstanding atDecember 31,
Debt Issued Matures 2004
(In millions)
Commercial Paper . . . . . . . . . . . . . . . . . . . . . . . . . 2004 2005 $157.85.5% Senior Notes . . . . . . . . . . . . . . . . . . . . . . . . June 2004 2010 750.05.375% Senior Notes . . . . . . . . . . . . . . . . . . . . . . . December 2003 2013 500.0
63

HARRAH’S ENTERTAINMENT, INC.
NOTES TO CONSOLIDATED FINANCIAL STATEMENTS (Continued)
(Dollars in thousands, unless otherwise stated)
Subsequent to the end of 2004, we issued $250 million of Senior Floating Rate Notes due in 2008in a Rule 144A private placement. We agreed to, upon the request by holders of a majority inaggregate principal amount of the Senior Floating Rate Notes then outstanding, to exchange theprivate placement offering with fully registered Senior Floating Rate Notes. If the exchange offer doesnot provide the holders of the Senior Floating Rate Notes freely transferable securities, we may berequired to file a shelf registration statement that would allow them to resell the Senior Floating RateNotes in the open market, subject to certain restrictions.
EXTINGUISHMENTS OF DEBT. Funds from the new debt discussed above, as well as proceedsfrom our Credit Agreement, were used to retire certain of our outstanding debt, in particular thosedebt obligations assumed in our acquisition transactions, to reduce our effective interest rate and/orlengthen maturities. The following table summarizes the debt obligations, in addition to our previouscredit and letter of credit facilities that we have retired over the last three years:
FaceDate Value
Issuer Retired Debt Extinguished Retired
(In millions)
Horseshoe Gaming . . . . . . . . . . August 2004 Senior Subordinated Notes due 2009 $534.1Harrah’s Operating Co . . . . . . . December 2003 Senior Subordinated Notes due 2005 147.1Harrah’s Operating Co . . . . . . . August 2003 Senior Subordinated Notes due 2005 12.4JCC . . . . . . . . . . . . . . . . . . . . . December 2002 Senior Notes due 2008 28.2
In July 2003, our Board of Directors authorized the Company to retire, from time to time throughcash purchases, portions of our outstanding debt in open market purchases, privately negotiatedtransactions or otherwise. These repurchases will be funded through available cash from operations andborrowings from our established debt programs. Such repurchases will depend on prevailing marketconditions, the Company’s liquidity requirements, contractual restrictions and other factors. As ofDecember 31, 2004, $159.5 million of our 77⁄8% Senior Subordinated Notes had been retired under thisauthorization.
Charges of $19.1 million representing premiums paid and write-offs of unamortized deferredfinancing costs associated with the early retirement of portions of our 77⁄8% Senior Subordinated Notesand of our previous credit and letter of credit facilities were recorded in 2003. In compliance withSFAS No. 145, these charges no longer qualify for presentation as extraordinary items and are,therefore, included in Income from continuing operations in our Consolidated Statements of Income.
Subsequent to the end of 2004, we retired an additional $58.3 million of our 77⁄8% SeniorSubordinated Notes due in December 2005. The loss on the early extinguishment of this debt, expectedto be $2.2 million, will be reported in our first quarter 2005 results.
PARENT COMPANY GUARANTEE OF SUBSIDIARY DEBT. Harrah’s Operating Company, Inc.(‘‘HOC’’), a 100% owned subsidiary and the principal asset of Harrah’s Entertainment, is the issuer ofcertain debt securities that have been guaranteed by Harrah’s Entertainment. Due to the comparabilityof HOC’s consolidated financial information with that of Harrah’s Entertainment, separate financialstatements and other disclosures regarding HOC have not been presented. Management hasdetermined that such information is not material to holders of HOC’s debt securities. Harrah’sEntertainment has no independent assets or operations, its guarantee of HOC’s debt securities is fulland unconditional and its only other subsidiary is minor. There are no significant restrictions on
64

Harrah’s Entertainment’s ability to obtain funds from its subsidiaries by dividends or loans. In addition,the amount of consolidated retained earnings representing undistributed earnings of 50-percent-or-lessowned persons accounted for under the equity method is less than 0.5 percent and there are nosignificant restrictions on the payment of dividends by the Company.
FAIR MARKET VALUE. Based on the borrowing rates available as of December 31, 2004, fordebt with similar terms and maturities and market quotes of our publicly traded debt, the fair value ofour long-term debt at December 31 was as follows:
December 31,
2004 2003
Carrying Market Carrying MarketValue Value Value Value
(In millions)
Outstanding debt . . . . . . . . . . . . . . . . . . . . . . . . . . . . . $(5,152.9) $(5,414.7) $(3,673.5) $(3,977.8)Interest rate swaps (used for hedging purposes) . . . . . . . (5.1) (5.1) 0.2 0.2
CAESARS ACQUISITION. In connection with the pending acquisition of Caesars, we will assumeapproximately $4.2 billion of Caesars’ outstanding debt. (See Note 2.)
Note 8—Leases
We lease both real estate and equipment used in our operations and classify those leases as eitheroperating or capital leases following the provisions of SFAS No. 13, ‘‘Accounting for Leases.’’ AtDecember 31, 2004, the remaining lives of our operating leases ranged from one to 40 years, withvarious automatic extensions totaling up to 60 years.
Rental expense associated with operating leases for continuing operations is charged to expense inthe year incurred and was included in the Consolidated Statements of Income as follows:
2004 2003 2002
NoncancelableMinimum . . . . . . . . . . . . . . . . . . . . . . . . . . . . . . . . . . . . . . . . . . . . . $39,008 $40,252 $32,866Contingent . . . . . . . . . . . . . . . . . . . . . . . . . . . . . . . . . . . . . . . . . . . . 2,895 3,898 4,726Sublease . . . . . . . . . . . . . . . . . . . . . . . . . . . . . . . . . . . . . . . . . . . . . . (99) (201) (287)
Other . . . . . . . . . . . . . . . . . . . . . . . . . . . . . . . . . . . . . . . . . . . . . . . . . 26,922 15,643 37,058
$68,726 $59,592 $74,363
65

HARRAH’S ENTERTAINMENT, INC.
NOTES TO CONSOLIDATED FINANCIAL STATEMENTS (Continued)
(Dollars in thousands, unless otherwise stated)
Our future minimum rental commitments as of December 31, 2004, were as follows:
NoncancelableOperating
Leases
2005 . . . . . . . . . . . . . . . . . . . . . . . . . . . . . . . . . . . . . . . . . . . . . . . . . $ 43,1502006 . . . . . . . . . . . . . . . . . . . . . . . . . . . . . . . . . . . . . . . . . . . . . . . . . 33,6832007 . . . . . . . . . . . . . . . . . . . . . . . . . . . . . . . . . . . . . . . . . . . . . . . . . 31,3602008 . . . . . . . . . . . . . . . . . . . . . . . . . . . . . . . . . . . . . . . . . . . . . . . . . 30,5522009 . . . . . . . . . . . . . . . . . . . . . . . . . . . . . . . . . . . . . . . . . . . . . . . . . 28,291Thereafter . . . . . . . . . . . . . . . . . . . . . . . . . . . . . . . . . . . . . . . . . . . . 400,607
Total minimum lease payments . . . . . . . . . . . . . . . . . . . . . . . . . . . . $567,643
In addition to these minimum rental commitments, certain of these operating leases provide forcontingent rentals based on a percentage of revenues in excess of specified amounts.
Note 9—Write-downs, Reserves and Recoveries
Our operating results include various pretax charges to record asset impairments, contingentliability reserves, project write-offs, demolition costs and recoveries of previously recorded reserves andother non-routine transactions. In 2004, we began tracking demolition costs separate from projectopening costs. The components of Write-downs, reserves and recoveries for continuing operations wereas follows:
2004 2003 2002
Contribution to The Harrah’s Foundation . . . . . . . . . . . . . . . . . . . . . . . $ 10,000 $ – $ –Demolition costs . . . . . . . . . . . . . . . . . . . . . . . . . . . . . . . . . . . . . . . . . 5,785 – –Write-off of abandoned assets and other costs . . . . . . . . . . . . . . . . . . . . 4,815 2,615 6,300Settlement of litigation . . . . . . . . . . . . . . . . . . . . . . . . . . . . . . . . . . . . 3,525 – –Termination of contracts . . . . . . . . . . . . . . . . . . . . . . . . . . . . . . . . . . . 2,000 – 168Reversal of prior year Iowa gaming tax accrual . . . . . . . . . . . . . . . . . . . (16,558) – –Impairment of goodwill . . . . . . . . . . . . . . . . . . . . . . . . . . . . . . . . . . . . – 6,315 –Impairment of long-lived assets . . . . . . . . . . . . . . . . . . . . . . . . . . . . . . – 2,469 1,501Settlement of sales tax contingency . . . . . . . . . . . . . . . . . . . . . . . . . . . . – (923) (6,464)Charge for structural repairs at Reno . . . . . . . . . . . . . . . . . . . . . . . . . . – – 5,000Recoveries from previously impaired assets and reserved amounts . . . . . – – (1,968)
$ 9,567 $10,476 $ 4,537
We account for the impairment of long-lived assets to be held and used by evaluating the carryingvalue of the long-lived assets in relation to the operating performance and future undiscounted cashflows of the underlying operating unit when indications of impairment are present. Long-lived assets tobe disposed of are evaluated in relation to the estimated fair value of such assets less costs to sell.
66

Note 10—Income Taxes
Our federal and state income tax provision/(benefit) allocable to our Consolidated Statements ofIncome and our Consolidated Balance Sheets line items was as follows:
2004 2003 2002
Income from continuing operations before income taxes and minorityinterests . . . . . . . . . . . . . . . . . . . . . . . . . . . . . . . . . . . . . . . . . . . $190,641 $155,568 $174,445
Discontinued operations . . . . . . . . . . . . . . . . . . . . . . . . . . . . . . . . . 18,460 16,993 23,684Cumulative effect of change in accounting principle . . . . . . . . . . . . . – – (2,831)Stockholders’ equity
Unrealized gain/(loss) on available-for-sale securities . . . . . . . . . . . – 215 (239)Unrealized gain/(loss) on derivatives qualifying as cash flow hedges 415 – –Compensation expense for tax purposes in excess of amounts
recognized for financial reporting purposes . . . . . . . . . . . . . . . . (26,838) (15,537) (23,970)Other . . . . . . . . . . . . . . . . . . . . . . . . . . . . . . . . . . . . . . . . . . . . . – – 800
$182,678 $157,239 $171,889
Income tax expense attributable to Income from continuing operations before income taxes andminority interests consisted of the following:
2004 2003 2002
United StatesCurrent
Federal . . . . . . . . . . . . . . . . . . . . . . . . . . . . . . . . . . . . . . . . . . $100,723 $112,325 $122,923State . . . . . . . . . . . . . . . . . . . . . . . . . . . . . . . . . . . . . . . . . . . . 12,345 15,221 23,369
Deferred . . . . . . . . . . . . . . . . . . . . . . . . . . . . . . . . . . . . . . . . . . . 75,880 29,715 28,153Other countries
Current . . . . . . . . . . . . . . . . . . . . . . . . . . . . . . . . . . . . . . . . . . . . – – –Deferred . . . . . . . . . . . . . . . . . . . . . . . . . . . . . . . . . . . . . . . . . . . 1,693 (1,693) –
$190,641 $155,568 $174,445
67

HARRAH’S ENTERTAINMENT, INC.
NOTES TO CONSOLIDATED FINANCIAL STATEMENTS (Continued)
(Dollars in thousands, unless otherwise stated)
The differences between the statutory federal income tax rate and the effective tax rate expressedas a percentage of Income from continuing operations before income taxes and minority interests wereas follows:
2004 2003 2002
Statutory tax rate . . . . . . . . . . . . . . . . . . . . . . . . . . . . . . . . . . . . . . . . . . . . . 35.0% 35.0% 35.0%Increases/(decreases) in tax resulting from:
State taxes, net of federal tax benefit . . . . . . . . . . . . . . . . . . . . . . . . . . . . . 1.9 2.7 3.0Goodwill amortization . . . . . . . . . . . . . . . . . . . . . . . . . . . . . . . . . . . . . . . . – 0.5 –Tax credits . . . . . . . . . . . . . . . . . . . . . . . . . . . . . . . . . . . . . . . . . . . . . . . . . (0.4) (0.5) (0.4)Political contributions/lobbying expenses . . . . . . . . . . . . . . . . . . . . . . . . . . . 0.3 0.1 0.1Officers’ life insurance/insurance proceeds . . . . . . . . . . . . . . . . . . . . . . . . . . (0.9) (1.1) 0.2Meals and entertainment . . . . . . . . . . . . . . . . . . . . . . . . . . . . . . . . . . . . . . 0.1 0.1 0.3Minority interests in partnership earnings . . . . . . . . . . . . . . . . . . . . . . . . . . (0.6) (1.0) (1.0)Other . . . . . . . . . . . . . . . . . . . . . . . . . . . . . . . . . . . . . . . . . . . . . . . . . . . . 0.7 0.5 (0.1)
Effective tax rate . . . . . . . . . . . . . . . . . . . . . . . . . . . . . . . . . . . . . . . . . . 36.1% 36.3% 37.1%
The components of our net deferred tax balance included in our Consolidated Balance Sheetswere as follows:
2004 2003
Deferred tax assetsCompensation programs . . . . . . . . . . . . . . . . . . . . . . . . . $ 72,829 $ 64,343Bad debt reserve . . . . . . . . . . . . . . . . . . . . . . . . . . . . . . . 18,134 19,225Self-insurance reserves . . . . . . . . . . . . . . . . . . . . . . . . . . . 16,072 7,960Deferred income . . . . . . . . . . . . . . . . . . . . . . . . . . . . . . . 757 512Project opening costs and prepaid expenses . . . . . . . . . . . – 9,746Net operating losses . . . . . . . . . . . . . . . . . . . . . . . . . . . . 54,232 58,377Other . . . . . . . . . . . . . . . . . . . . . . . . . . . . . . . . . . . . . . . 41,661 44,962Valuation allowance . . . . . . . . . . . . . . . . . . . . . . . . . . . . (52,886) (55,688)
150,799 149,437
Deferred tax liabilitiesProperty . . . . . . . . . . . . . . . . . . . . . . . . . . . . . . . . . . . . . (397,750) (286,201)Management and other contracts . . . . . . . . . . . . . . . . . . . (20,214) (20,782)Intangibles . . . . . . . . . . . . . . . . . . . . . . . . . . . . . . . . . . . (91,103) (92,822)Investments in nonconsolidated affiliates . . . . . . . . . . . . . (3,060) (11,983)Project opening costs and prepaid expenses . . . . . . . . . . . (22,060) –
(534,187) (411,788)
Net deferred tax liability . . . . . . . . . . . . . . . . . . . . . . . $(383,388) $(262,351)
The Company anticipates that state NOLs valued at $1,172 (subject to a full valuation allowance)will expire in 2005. The remaining state NOLs and other deferred tax assets subject to a valuationallowance will expire between 2006 and 2023. In the event the valuation allowance of $52,886 for 2004is ultimately unnecessary, $18,432 of this total would reduce goodwill, and the remaining $34,454 would
68

reduce tax expense. The Company has adjusted the individual deferred tax asset and liability amountspreviously reported for 2003 to the amounts stated above to conform to the presentation for 2004. Thepreviously reported amounts did not included those NOLs as well as additional deferred state tax assetsand liabilities that were unlikely to ever be realized. As the net increase to these deferred tax assetswas offset by a corresponding increase to the valuation allowance, there was no change to the overallnet deferred tax liability.
Note 11—Supplemental Cash Flow Information
The increase in Cash and cash equivalents due to the changes in long-term and working capitalaccounts was as follows:
2004 2003 2002
Long term accountsDeferred costs and other . . . . . . . . . . . . . . . . . . . . . . . . . . . . . $ (43,763) $(71,068) $ (36,737)Deferred credits and other . . . . . . . . . . . . . . . . . . . . . . . . . . . . (7,499) 38,895 8,867
Net change in long-term accounts . . . . . . . . . . . . . . . . . . . . . $ (51,262) $(32,173) $ (27,870)
Working capital accountsReceivables . . . . . . . . . . . . . . . . . . . . . . . . . . . . . . . . . . . . . . . $ (14,844) $ (8,005) $ 14,295Inventories . . . . . . . . . . . . . . . . . . . . . . . . . . . . . . . . . . . . . . . . 379 (1,311) 869Prepayments and other . . . . . . . . . . . . . . . . . . . . . . . . . . . . . . . 6,255 50,355 82,415Accounts payable . . . . . . . . . . . . . . . . . . . . . . . . . . . . . . . . . . . 11,030 5,910 (2,308)Accrued expenses . . . . . . . . . . . . . . . . . . . . . . . . . . . . . . . . . . . 29,499 (92,645) (149,133)
Net change in working capital accounts . . . . . . . . . . . . . . . . . $ 32,319 $(45,696) $ (53,862)
SUPPLEMENTAL DISCLOSURE OF CASH PAID FOR INTEREST AND TAXES. The followingtable reconciles our Interest expense, net of interest capitalized, as reported in the ConsolidatedStatements of Income, to cash paid for interest.
2004 2003 2002
Interest expense, net of interest capitalized . . . . . . . . . . . . . . . . . . . . $271,802 $234,419 $240,220Adjustments to reconcile to cash paid for interest
Net change in accruals . . . . . . . . . . . . . . . . . . . . . . . . . . . . . . . . . (28,329) (9,201) (6,825)Amortization of deferred finance charges . . . . . . . . . . . . . . . . . . . (7,397) (6,185) (5,573)Net amortization of discounts and premiums . . . . . . . . . . . . . . . . . (1,671) (1,141) (1,596)
Cash paid for interest, net of amount capitalized . . . . . . . . . . . . . . . . $234,405 $217,892 $226,226
Cash payments for income taxes, net of refunds . . . . . . . . . . . . . . . . $116,562 $114,289 $145,873
69

HARRAH’S ENTERTAINMENT, INC.
NOTES TO CONSOLIDATED FINANCIAL STATEMENTS (Continued)
(Dollars in thousands, unless otherwise stated)
Note 12—Commitments and Contingencies
CONTRACTUAL COMMITMENTS. We continue to pursue additional casino developmentopportunities that may require, individually and in the aggregate, significant commitments of capital,up-front payments to third parties, guarantees by Harrah’s Entertainment of third-party debt anddevelopment completion guarantees.
We may guarantee all or part of the debt incurred by Indian tribes, with which we have enteredinto a management contract, to fund development of casinos on the Indian lands. For all existingguarantees of Indian debt, we have obtained a first lien on certain personal property (tangible andintangible) of the casino enterprise. There can be no assurance, however, that the value of suchproperty would satisfy our obligations in the event these guarantees were enforced. Additionally, wehave received limited waivers from the Indian tribes of their sovereign immunity to allow us to pursueour rights under the contracts between the parties and to enforce collection efforts as to any assets inwhich a security interest is taken. The aggregate outstanding balance as of December 31, 2004, ofIndian debt that we have guaranteed was $246.7 million. The outstanding balance of all of our debtguarantees at December 31, 2004 is $251.2 million. Our maximum obligation under all of our debtguarantees is $292.0 million. Our obligations under these debt guarantees extend through April 2009.
Some of our guarantees of the debt for casinos on Indian lands have been modified sinceJanuary 1, 2003, triggering the requirements under Financial Accounting Standards BoardInterpretation No. 45, ‘‘Guarantor’s Accounting and Disclosure Requirements for Guarantees,Including Indirect Guarantees of Indebtedness of Others,’’ to recognize a liability for the estimated fairvalue of those guarantees. Liabilities, representing the fair value of our guarantees, and correspondingassets, representing the portion of our management fee receivable attributable to our agreements toprovide the related guarantees, were recorded and are being amortized over the lives of the relatedagreements. We estimate the fair value of the obligation by considering what premium would have beenrequired by us or by an unrelated party. The amounts recognized represent the present value of thepremium in interest rates and fees that would have been charged to the tribes if we had not providedthe guarantees. The balance of the liability for the guarantees and of the related assets atDecember 31, 2004 and 2003, was $5.5 million and $7.0 million, respectively.
In February 2005, we entered into an agreement with the State of Louisiana whereby we extendedour guarantee of an annual payment obligation of JCC, our wholly-owned subsidiary, of $60 millionowed to the State of Louisiana. The guarantee was extended for one year to March 31, 2008.
Excluding the guarantees discussed above, as of December 31, 2004, we had commitments andcontingencies of $536.0 million, including construction-related commitments.
The agreements under which we manage casinos on Indian lands contain provisions required bylaw which provide that a minimum monthly payment be made to the tribe. That obligation has priorityover scheduled payments of borrowings for development costs and over the management fee earnedand paid to the manager. In the event that insufficient cash flow is generated by the operations of theIndian-owned properties to fund this payment, we must pay the shortfall to the tribe. Subject to certainlimitations as to time, such advances, if any, would be repaid to us in future periods in whichoperations generate cash flow in excess of the required minimum payment. These commitments willterminate upon the occurrence of certain defined events, including termination of the managementcontract. As of December 31, 2004, the aggregate monthly commitment for the minimum guaranteed
70
payments pursuant to these contracts, which extend for periods of up to 83 months from December 31,2004, is $1.2 million. The maximum exposure for the minimum guaranteed payments to the tribes isunlikely to exceed $96.1 million as of December 31, 2004.
SEVERANCE AGREEMENTS. As of December 31, 2004, the Company has severanceagreements with 28 of its senior executives, which provide for payments to the executives in the eventof their termination after a change in control, as defined. These agreements provide, among otherthings, for a compensation payment of 1.5 to 3.0 times the executive’s average annual compensation, asdefined, as well as for accelerated payment or accelerated vesting of any compensation or awardspayable to the executive under any of Harrah’s Entertainment’s incentive plans. The estimated amount,computed as of December 31, 2004, that would be payable under the agreements to these executivesbased on the compensation payments and stock awards aggregated approximately $166.8 million. Theestimated amount that would be payable to these executives does not include an estimate for the taxgross-up payment, provided for in the agreements, that would be payable to the executive if theexecutive becomes entitled to severance payments which are subject to a federal excise tax imposed onthe executive.
SELF-INSURANCE. We are self-insured for various levels of general liability, workers’compensation and employee medical coverage. Insurance claims and reserves include accruals ofestimated settlements for known claims, as well as accruals of actuarial estimates of incurred but notreported claims.
Note 13—Litigation
We are involved in various inquiries, administrative proceedings and litigation relating to contracts,acquisitions and sales of property and other matters arising in the normal course of business. While anyproceeding or litigation has an element of uncertainty, management believes that the final outcome ofthese matters will not have a material adverse effect on our consolidated financial position or ourresults of operations.
Note 14—Employee Benefit Plans
We have established a number of employee benefit programs for purposes of attracting, retainingand motivating our employees. The following is a description of the basic components of theseprograms.
EQUITY INCENTIVE AWARDS. Under the Harrah’s Entertainment, Inc. 2004 Equity IncentiveAward Plan (the ‘‘2004 Plan’’), non-qualified stock options, restricted stock, stock appreciation rights,performance shares, performance stock units, dividend equivalents, stock payments, deferred stock,restricted stock units, other stock based awards and performance-based awards may be granted toemployees, consultants of the Company and members of our Board of Directors. Shares availableunder the 2001 Executive Stock Incentive Plan were deregistered and are now available under the 2004Plan. Non-management members of the Company’s Board of Directors may be granted shares underthe 1996 Non-Management Directors Stock Incentive Plan, which has been amended to provide thatgrants of shares after May 1, 2005, shall be made under the 2004 Plan. Unissued shares under the 1996Non-Management Directors Stock Incentive Plan are now available under the 2004 Plan. Ouremployees may also be granted options to purchase shares of common stock under the Harrah’sEntertainment 2001 Broad-based Incentive Plan (the ‘‘2001 Plan’’).
71

HARRAH’S ENTERTAINMENT, INC.
NOTES TO CONSOLIDATED FINANCIAL STATEMENTS (Continued)
(Dollars in thousands, unless otherwise stated)
A summary of activity of the 2004 Plan and the Company’s former plans, which are equitycompensation plans approved by our stockholders, for 2002, 2003 and 2004 is as follows:
Number of Common SharesWeighted Avg.Exercise Price Options Available
(Per Share) Outstanding For Grant
Balance—December 31, 2001 . . . . . . . . . . . . $22.65 8,683,778 7,219,214Restricted shares issued . . . . . . . . . . . . . . . N/A – (221,931)Restricted shares canceled . . . . . . . . . . . . . N/A – 78,091Granted . . . . . . . . . . . . . . . . . . . . . . . . . . 46.80 2,910,560 (2,910,560)Exercised . . . . . . . . . . . . . . . . . . . . . . . . . 19.40 (2,510,678) –Canceled . . . . . . . . . . . . . . . . . . . . . . . . . 30.96 (267,063) 267,063Rio plans cancellations . . . . . . . . . . . . . . . 18.88 (2,000) –
Balance—December 31, 2002 . . . . . . . . . . . . 31.30 8,814,597 4,431,877Restricted shares issued . . . . . . . . . . . . . . . N/A – (60,061)Restricted shares canceled . . . . . . . . . . . . . N/A – 101,934Granted . . . . . . . . . . . . . . . . . . . . . . . . . . 43.18 2,968,175 (2,968,175)Exercised . . . . . . . . . . . . . . . . . . . . . . . . . 20.65 (1,754,901) –Canceled . . . . . . . . . . . . . . . . . . . . . . . . . 40.06 (409,309) 409,309Rio plans cancellations . . . . . . . . . . . . . . . 12.44 (3,400) –
Balance—December 31, 2003 . . . . . . . . . . . . 36.54 9,615,162 1,914,884Additional shares authorized . . . . . . . . . . . N/A – 5,000,000Shares transferred from Directors plan . . . . N/A – 10,065Restricted shares issued . . . . . . . . . . . . . . . N/A – (22,000)Restricted shares canceled . . . . . . . . . . . . . N/A – 17,761Granted . . . . . . . . . . . . . . . . . . . . . . . . . . 52.33 3,197,832 (3,197,832)Exercised . . . . . . . . . . . . . . . . . . . . . . . . . 31.44 (2,817,965) –Canceled . . . . . . . . . . . . . . . . . . . . . . . . . 45.45 (553,464) 553,464
Balance—December 31, 2004 . . . . . . . . . . . . 42.89 9,441,565 4,276,342
72

200,000 shares were authorized for issuance under the 2001 Plan, which is an equity compensationplan not approved by stockholders. No additional shares will be authorized under the 2001 Plan. Asummary of activity of this plan is as follows:
Number ofWeighted Common SharesAverageExercise Price Options Available
(Per Share) Outstanding For Grant
Balance—December 31, 2002 . . . . . . . . . . . . . . $47.03 189,675 10,325Granted . . . . . . . . . . . . . . . . . . . . . . . . . . . 43.50 22,367 (22,367)Canceled . . . . . . . . . . . . . . . . . . . . . . . . . . . 46.73 (35,814) 35,814
Balance—December 31, 2003 . . . . . . . . . . . . . . 46.64 176,228 23,772Restricted shares issued . . . . . . . . . . . . . . . . N/A – (495)Granted . . . . . . . . . . . . . . . . . . . . . . . . . . . 58.74 6,000 (6,000)Exercised . . . . . . . . . . . . . . . . . . . . . . . . . . 46.87 (57,888) –Canceled . . . . . . . . . . . . . . . . . . . . . . . . . . . 46.33 (12,939) 12,939
Balance—December 31, 2004 . . . . . . . . . . . . . . 47.20 111,401 30,216
STOCK OPTIONS. Stock options grants typically vest in equal installments over a three-yearperiod and allow the option holder to purchase stock over specified periods of time, generally seven toten years from the date of grant, at a fixed price equal to the market value at the date of grant.
The following tables summarize additional information regarding the options, which were grantedunder the 2004 Plan and Harrah’s Entertainment’s former plans and were outstanding at December 31:
2004 2003 2002
Options exercisable at December 31 . . . . . . . . . . 2,585,747 2,910,617 2,344,106Weighted average fair value per share of options
granted per year . . . . . . . . . . . . . . . . . . . . . . . $34.99 $28.63 $17.34
Options OutstandingOptions ExercisableWeighted
Average Weighted WeightedRange of Remaining Average AverageExercise Number Contract Exercise Number ExercisePrices Outstanding Life Price Exercisable Price
$13.84–$32.65 2,350,134 4.6 years $26.81 1,396,217 $25.8540.33– 46.14 2,740,991 5.2 years 44.24 451,032 43.5647.03– 59.16 4,350,440 5.8 years 50.73 738,498 47.03
9,441,565 2,585,747
73

HARRAH’S ENTERTAINMENT, INC.
NOTES TO CONSOLIDATED FINANCIAL STATEMENTS (Continued)
(Dollars in thousands, unless otherwise stated)
The following tables summarize additional information regarding the options, which were grantedunder the 2001 Plan and were outstanding at December 31:
2004 2003 2002
Options exercisable at December 31 . . . . . . . . . . . . . . . . . . 50,242 54,918 –Weighted average fair value per share of options granted
per year . . . . . . . . . . . . . . . . . . . . . . . . . . . . . . . . . . . . . $46.77 $47.03 N/A
Options OutstandingOptions ExercisableWeighted
Average Weighted WeightedRange of Remaining Average AverageExercise Number Contract Exercise Number ExercisePrices Outstanding Life Price Exercisable Price
$43.50–$44.89 14,254 5.5 years $43.50 3,687 $43.5044.90– 58.74 97,147 4.6 years 47.75 46,555 47.03
111,401 50,242
RESTRICTED STOCK. Employees may also be granted restricted stock under the 2004 Plan.Restricted shares granted have restrictions that may include, but not be limited to, the right to vote,receive dividends on or transfer the restricted stock. Restricted shares may be subject to forfeitureduring a specified period or periods prior to vesting. The shares generally vest in equal installmentsover a period of three years. The compensation arising from a restricted stock grant is based upon themarket price at the grant date. Such expense is deferred and amortized to expense over the vestingperiod.
Members of the Board of Directors can receive either 50% or 100% of his or her director fees inrestricted shares. Shares issued to Board members as director fees cannot be disposed of until therecipient is no longer a member of the Board of Directors.
The Company has issued Time Accelerated Restricted Stock Award Plan (‘‘TARSAP’’) awards tocertain key executives. The initial TARSAP program was completed in January 2002. During 2002, 2003and 2004, additional TARSAP awards were issued to certain key executives, which will vest onJanuary 1, 2007, if the executive continues in active employment until that date. These shares areeligible for earlier annual vesting beginning in 2003 over two years (three years for shares awarded in2002) based on the Company’s financial performance in each of the years 2002 through 2005, and theremaining unvested shares will vest on January 1, 2007. The expense arising from TARSAP awards isbeing amortized to expense over the periods in which the restrictions lapse.
The number and weighted average grant-date fair value of restricted shares granted, and theamortization expense recognized, during 2004, 2003 and 2002, including the TARSAP awards butexcluding issues to our Board of Directors, were as follows:
2004 2003 2002
Number of shares granted . . . . . . . . . . . . . . . . . . . 22,495 60,061 221,931Weighted average grant price per share . . . . . . . . . $ 54.00 $ 45.29 $ 43.77Amortization expense (in millions) . . . . . . . . . . . . $ 6.7 $ 8.0 $ 7.8Unvested shares as of December 31 . . . . . . . . . . . . 923,389 1,021,720 1,458,617
74

SAVINGS AND RETIREMENT PLAN. We maintain a defined contribution savings andretirement plan, which, among other things, allows pretax and after-tax contributions to be made byemployees to the plan. Under the plan, participating employees may elect to contribute up to 20% oftheir eligible earnings. Through 2003, the Company fully matched the first six percent of employees’contributions; however, effective January 1, 2004, the Company match is 50% for the first six percent ofemployees’ contributions. Amounts contributed to the plan are invested, at the participant’s direction,in up to 14 separate funds, including a Harrah’s company stock fund. Participants become vested in thematching contribution over five years of credited service. Our contribution expense for this plan was$14.8 million, $30.1 million and $29.2 million in 2004, 2003 and 2002, respectively.
Employees of Horseshoe Gaming continue to participate in Horseshoe Gaming Holding Corp.401(k) Plan until January 1, 2006, when they will be eligible to participate in Harrah’s Entertainment’splan. Under the Horseshoe Gaming plan, employees may elect to make pretax contributions of up to50% of their eligible earnings (five percent for certain executives). The Company fully matches the firsttwo percent of employees’ contributions and 50% of the next four percent of the employees’contributions. Amounts contributed to the plan are invested, at the participant’s direction, in up to 12separate funds plus, effective January 2005, a Harrah’s company stock fund. Participants become vestedin the matching contributions over four years of credited service. Harrah’s Entertainment’s contributionexpense for the six months of 2004 that we owned Horseshoe Gaming was $1.8 million.
DEFERRED COMPENSATION PLANS. Harrah’s maintains deferred compensation plans,(collectively, ‘‘DCP’’) and an Executive Supplemental Savings Plan (‘‘ESSP’’) under which certainemployees may defer a portion of their compensation. Amounts deposited into these plans areunsecured liabilities of the Company. Amounts deposited into DCP earn interest at rates approved bythe Human Resources Committee of the Board of Directors. The ESSP is a variable investment plan,which allows employees to direct their investments by choosing from several investment alternatives.The total liability included in Deferred credits and other for these plans at December 31, 2004 and2003 was $113.0 million and $104.3 million, respectively. In connection with the administration of oneof these plans, we have purchased company-owned life insurance policies insuring the lives of certaindirectors, officers and key employees.
An additional deferred compensation plan, Executive Supplemental Savings Plan II (‘‘ESSPII’’) willbe available, beginning in 2005, to certain executive officers, directors and other key employees of theCompany. Eligible employees may elect to defer a percentage of their salary and/or bonus underESSPII, and the Company may make matching contributions with respect to deferrals of salary to thoseparticipants who are eligible to receive matching contributions under the Company’s 40l(k) plan anddiscretionary contributions. Employees vest in matching and discretionary contributions over five yearsor, under certain conditions, employees may immediately vest.
MULTI-EMPLOYER PENSION PLAN. We have approximately 6,850 employees covered undercollective bargaining agreements, and the majority of those employees are covered by union sponsored,collectively bargained multi-employer pension plans. We contributed and charged to expense$8.2 million, $7.2 million and $4.7 million in 2004, 2003 and 2002, respectively, for such plans. Theplans’ administrators do not provide sufficient information to enable us to determine our share, if any,of unfunded vested benefits.
75

HARRAH’S ENTERTAINMENT, INC.
NOTES TO CONSOLIDATED FINANCIAL STATEMENTS (Continued)
(Dollars in thousands, unless otherwise stated)
Note 15—Nonconsolidated Affiliates
As of December 31, 2004, our investments in nonconsolidated affiliates consisted primarily ofinterests in a horse-racing facility and in a joint venture that was pursuing development of casinos inthe United Kingdom. We also own an interest in a golf course near Harrah’s Tunica. Harrah’s Tunica,including our investment in the golf course, is currently held for sale (see Note 3).
Our Investments in and advances to nonconsolidated affiliates are reflected in our accompanyingConsolidated Balance Sheets as follows:
2004 2003
Investments in and advances to nonconsolidated affiliatesAccounted for under the equity method . . . . . . . . . . . . . . . . . . . $5,973 $6,360Accounted for at historical cost . . . . . . . . . . . . . . . . . . . . . . . . . 177 177
$6,150 $6,537
Note 16—Quarterly Results of Operations (Unaudited)First Second Third Fourth
Quarter Quarter Quarter Quarter Year
(In thousands, except per share amounts)
2004(1)Revenues . . . . . . . . . . . . . . . . . . . . . $1,012,394 $1,037,210 $1,309,657 $1,189,065 $4,548,326Income from operations . . . . . . . . . . . 176,273 192,060 257,816 164,959 791,108Income from continuing operations . . . 74,838 84,136 110,679 59,872 329,525Net income . . . . . . . . . . . . . . . . . . . . 81,731 90,237 118,785 76,956 367,709Earnings per share—basic(3)
From continuing operations . . . . . . 0.68 0.75 1.00 0.54 2.97Net income . . . . . . . . . . . . . . . . . . 0.74 0.81 1.07 0.69 3.31
Earnings per share—diluted(3)From continuing operations . . . . . . 0.67 0.74 0.99 0.53 2.92Net income . . . . . . . . . . . . . . . . . . 0.73 0.79 1.06 0.68 3.26
2003(2)Revenues . . . . . . . . . . . . . . . . . . . . . $ 964,976 $ 990,256 $1,043,412 $ 950,221 $3,948,865Income from operations . . . . . . . . . . . 175,134 176,674 203,228 123,739 678,775Income from continuing operations . . . 70,323 73,619 89,029 28,093 261,064Net income . . . . . . . . . . . . . . . . . . . . 81,080 76,684 99,483 35,376 292,623Earnings per share—basic(3)
From continuing operations . . . . . . 0.65 0.68 0.82 0.25 2.40Net income . . . . . . . . . . . . . . . . . . 0.75 0.71 0.91 0.32 2.69
Earnings per share—diluted(3)From continuing operations . . . . . . 0.64 0.66 0.80 0.25 2.36Net income . . . . . . . . . . . . . . . . . . 0.74 0.69 0.90 0.32 2.65
(1) 2004 First Quarter includes $2.0 million in pretax charges for project opening costs and$3.3 million in pretax charges for write-downs, reserves and recoveries; Second Quarter includes$3.9 million in pretax charges for project opening costs and $5.0 million in pretax credits for write-
76

downs, reserves and recoveries, including $16.6 million in credits for an adjustment of prior year’sgaming tax accrual and charges of $10.0 million for contribution to The Harrah’s Foundation;Third Quarter reflects the acquisition of Horseshoe Gaming and includes $2.0 million in pretaxcharges for project opening costs and $3.8 million in pretax charges for write-downs, reserves andrecoveries; and Fourth Quarter includes $1.7 million in pretax charges for project opening costsand $7.5 million in pre-tax charges for write-downs, reserves and recoveries, including pretaxcharges of $3.5 million for a litigation settlement accrual; and $2.3 million in pretax charges forexpense related to the Caesars acquisition and merger. 2004 results reflect Harrah’s Tunica andHarrah’s East Chicago as discontinued operations.
(2) 2003 Second Quarter includes $4.1 million in pretax charges for project opening costs and$2.1 million in pretax charges for early retirement of debt; Third Quarter reflects a reclass of a$0.1 million charge for loss on sale of ownership interests in a nonconsolidated affiliate to Incomefrom operations; and Fourth Quarter includes $15.9 million pretax charges for early retirement ofa portion of the 77⁄8% Senior Subordinated Notes and a $6.3 million pretax charge for goodwillimpairment at our Reno property. 2003 results reflect Harrah’s Vicksburg, Harveys Colorado,Harrah’s Tunica and Harrah’s East Chicago as discontinued operations.
(3) The sum of the quarterly per share amounts may not equal the annual amount reported, as pershare amounts are computed independently for each quarter and for the full year.
ITEM 9. Changes in and Disagreements with Accountants on Accounting and Financial Disclosure.
Not applicable.
ITEM 9A. Controls and Procedures.
Disclosure Controls and Procedures
Our principal executive officer and principal financial officer have evaluated the effectiveness ofour disclosure controls and procedures (as defined in Rules 13a-15(e) and 15d-15(e) under theSecurities Exchange Act of 1934, as amended (the ‘‘Exchange Act’’)), as of December 31, 2004. Basedon such evaluation, they have concluded that, as of such date, our disclosure controls and procedureswere effective to ensure that information required to be disclosed by us in our Exchange Act reports isrecorded, processed, summarized and reported within the time periods specified in applicable SECrules and forms.
Internal Control over Financial Reporting
(a) Management’s Annual Report on Internal Control Over Financial Reporting
Internal control over financial reporting (as defined in Rules 13a-15(f) and 15d-15(f) under theExchange Act) refers to the process designed by, or under the supervision of, our Chief ExecutiveOfficer and Chief Financial Officer, and effected by our board of directors, management and otherpersonnel, to provide reasonable assurance regarding the reliability of financial reporting and thepreparation of financial statements for external purposes in accordance with generally acceptedaccounting principles. Management is responsible for establishing and maintaining adequate internalcontrol over our financial reporting.
We have evaluated the effectiveness of our internal control over financial reporting as ofDecember 31, 2004. This evaluation was performed using the internal control evaluation framework
77

developed by the Committee of Sponsoring Organizations of the Treadway Commission. Based on suchevaluation, management has concluded that, as of such date, our internal control over financialreporting was effective.
Deloitte and Touche LLP has issued an attestation report on management’s assessment of ourinternal control over financial reporting. This report follows this Item 9A.
(b) Changes in Internal Control Over Financial Reporting
There has been no change in our internal control over financial reporting during our most recentfiscal quarter that has materially affected, or is reasonably likely to materially affect, our internalcontrol over financial reporting.
78

REPORT OF INDEPENDENT REGISTERED PUBLIC ACCOUNTING FIRM
To the Board of Directors and Stockholders ofHarrah’s Entertainment, Inc.Las Vegas, Nevada
We have audited management’s assessment, included in the accompanying Management’s AnnualReport on Internal Control Over Financial Reporting, that Harrah’s Entertainment, Inc. andsubsidiaries (the ‘‘Company’’) maintained effective internal control over financial reporting as ofDecember 31, 2004, based on criteria established in Internal Control—Integrated Framework issued bythe Committee of Sponsoring Organizations of the Treadway Commission. The Company’s managementis responsible for maintaining effective internal control over financial reporting and for its assessmentof the effectiveness of internal control over financial reporting. Our responsibility is to express anopinion on management’s assessment and an opinion on the effectiveness of the Company’s internalcontrol over financial reporting based on our audit.
We conducted our audit in accordance with the standards of the Public Company AccountingOversight Board (United States). Those standards require that we plan and perform the audit to obtainreasonable assurance about whether effective internal control over financial reporting was maintainedin all material respects. Our audit included obtaining an understanding of internal control overfinancial reporting, evaluating management’s assessment, testing and evaluating the design andoperating effectiveness of internal control, and performing such other procedures as we considerednecessary in the circumstances. We believe that our audit provides a reasonable basis for our opinions.
A company’s internal control over financial reporting is a process designed by, or under thesupervision of, the company’s principal executive and principal financial officers, or persons performingsimilar functions, and effected by the company’s board of directors, management, and other personnelto provide reasonable assurance regarding the reliability of financial reporting and the preparation offinancial statements for external purposes in accordance with generally accepted accounting principles.A company’s internal control over financial reporting includes those policies and procedures that(1) pertain to the maintenance of records that, in reasonable detail, accurately and fairly reflect thetransactions and dispositions of the assets of the company; (2) provide reasonable assurance thattransactions are recorded as necessary to permit preparation of financial statements in accordance withgenerally accepted accounting principles, and that receipts and expenditures of the company are beingmade only in accordance with authorizations of management and directors of the company; and(3) provide reasonable assurance regarding prevention or timely detection of unauthorized acquisition,use, or disposition of the company’s assets that could have a material effect on the financial statements.
Because of the inherent limitations of internal control over financial reporting, including thepossibility of collusion or improper management override of controls, material misstatements due toerror or fraud may not be prevented or detected on a timely basis. Also, projections of any evaluationof the effectiveness of the internal control over financial reporting to future periods are subject to therisk that the controls may become inadequate because of changes in conditions, or that the degree ofcompliance with the policies or procedures may deteriorate.
In our opinion, management’s assessment that the Company maintained effective internal controlover financial reporting as of December 31, 2004, is fairly stated, in all material respects, based on thecriteria established in Internal Control—Integrated Framework issued by the Committee of SponsoringOrganizations of the Treadway Commission. Also in our opinion, the Company maintained, in allmaterial respects, effective internal control over financial reporting as of December 31, 2004, based onthe criteria established in Internal Control—Integrated Framework issued by the Committee ofSponsoring Organizations of the Treadway Commission.
79

We have also audited, in accordance with the standards of the Public Company AccountingOversight Board (United States), the consolidated financial statements and financial statement scheduleas of and for the year ended December 31, 2004 of the Company and our report dated February 28,2005 expressed an unqualified opinion on those financial statements and financial statement schedule.
/s/ Deloitte & Touche LLP
Las Vegas, NevadaFebruary 28, 2005
ITEM 9B. Other Information.
Not applicable.
80

PART III
ITEM 10. Directors and Executive Officers.
Executive Officers
Positions and Offices Held and PrincipalName and Age Occupations or Employment During Past 5 Years
Gary W. Loveman (44) . . . . . . . Director since 2000; Chairman of the Board since January 1, 2005;Chief Executive Officer since January 2003; President since April2001; Chief Operating Officer from May 1998 to January 2003;member of the three-executive Office of the President from May1999 to April 2001; Executive Vice President from May 1998 toMay 1999; Associate Professor of Business Administration, HarvardUniversity Graduate School of Business Administration from 1994to 1998; Director of Coach, Inc., a designer and marketer of high-quality handbags and women’s and men’s accessories traded on theNew York Stock Exchange.
Charles L. Atwood (56) . . . . . . Senior Vice President and Chief Financial Officer since April 2001;Treasurer from October 1996 to November 2003; Vice Presidentfrom October 1996 to April 2001; Director, Equity Residential, anowner and operator of multi-family properties traded on the NewYork Stock Exchange, since July 2003.
Jerry L. Boone (50) . . . . . . . . . Senior Vice President, Human Resources since February 2004; VicePresident, Human Resources, Harrah’s New Orleans from April2000 to February 2004; Vice President, Gaming Operations,Harrah’s New Orleans from September 1998 to April 2000.
John M. Boushy (50) . . . . . . . . Senior Vice President and Chief Integration Officer since July 2004;Senior Vice President, Operations Products & Services fromFebruary 2001 to July 2004; Senior Vice President, InformationTechnology from February 2001 to February 2004; ChiefInformation Officer from February 2001 to January 2003; SeniorVice President Brand Operations and Information Technology from1999 to 2001; Senior Vice President Information Technology andMarketing Services from 1993 to 1999.
Stephen H. Brammell (47) . . . . Senior Vice President and General Counsel since July 1999;Secretary since June 2004, from November 2002 to July 2003 andfrom May 2000 to February 2001; Vice President and AssociateGeneral Counsel from 1997 to 1999; Associate General Counselfrom 1993 to 1997.
Janis L. Jones (55) . . . . . . . . . . Senior Vice President, Communications/Government Relations sinceNovember 1999; Mayor of Las Vegas, Nevada, from 1991 to 1999.
Anthony D. McDuffie (44) . . . . Vice President since November 1999; Controller and ChiefAccounting Officer since November 2001; Assistant Controller from1994 to 2001.
81

Positions and Offices Held and PrincipalName and Age Occupations or Employment During Past 5 Years
Richard E. Mirman (38) . . . . . . Senior Vice President, Business Development since April 2003;Senior Vice President, New Business Development and ChiefMarketing Officer from January 2003 to April 2003; Senior VicePresident, Marketing from April 2000 to January 2003; VicePresident, Relationship Marketing from 1998 to 2000.
David W. Norton (36) . . . . . . . . Senior Vice President, Retention Marketing since November 2003;Senior Vice President, Relationship Marketing from January 2003to November 2003; Vice President, Loyalty Marketing from October1998 to January 2003.
Virginia E. Shanks (44) . . . . . . . Senior Vice President, Acquisition Marketing since November 2003;Western Division Senior Vice President—Marketing from January2003 to November 2003; Western Division Vice President—Marketing from July 1998 to January 2003.
Timothy S. Stanley (39) . . . . . . . Senior Vice President, Information Technology and ChiefInformation Officer since February 2004; Vice President—Information Technology and Chief Information Officer fromJanuary 2003 to February 2004; Vice President—InformationTechnology from February 2001 to January 2003; Managing Partner,Las Vegas, for USWeb Corporation, an e-Business consulting firmsince acquired by marchFIRST, Inc., from December 1999 toFebruary 2001; Vice President—Information Technology, NationalAirlines, Inc., from August 1998 to January 2000. National Airlines,Inc. filed a voluntary petition under Chapter 11 of the U.S.Bankruptcy Code in December 2000 and ceased operations inNovember 2002.
Kenneth M. Weil (44) . . . . . . . . Senior Vice President, Slots since November 2004; Executive VicePresident, Victoria’s Secret Direct, from October 1998 to October2004.
Timothy J. Wilmott (46) . . . . . . Chief Operating Officer since January 2003; Eastern DivisionPresident from 1997 to January 2003.
Code of Ethics
In February 2003, our Board adopted a Code of Business Conduct and Ethics that applies to ourChairman, Chief Executive Officer and President, Chief Operating Officer, Chief Financial Officer andChief Accounting Officer and is intended to qualify as a ‘‘code of ethics’’ as defined by rules recentlyadopted by the Securities and Exchange Commission. This Code, filed as Exhibit 14 to this Report, isdesigned to deter wrongdoing and to promote:
• honest and ethical conduct, including the ethical handling of actual or apparent conflicts ofinterest between personal and professional relationships;
• full, fair, accurate, timely, and understandable disclosure in reports and documents that we filewith, or submit to, the SEC and in other public communications made by us;
• compliance with applicable governmental laws, rules and regulations;
• prompt internal reporting to an appropriate person or persons identified in the Code ofviolations of the Code; and
82

• accountability for adherence to the Code.
The remaining information required by this Item is incorporated by reference to our definitiveproxy statement for our 2005 Annual Meeting to be filed with the Securities and Exchange Commissionpursuant to regulation 14A within 120 days after the end of the fiscal year covered by this report.
ITEM 11. Executive Compensation.
The information required by this Item is incorporated by reference to our definitive proxystatement for our 2005 Annual Meeting to be filed with the Securities and Exchange Commissionpursuant to regulation 14A within 120 days after the end of the fiscal year covered by this report.
ITEM 12. Security Ownership of Certain Beneficial Owners and Management.
Equity Compensation Plan Information
(a) (b) (c)Number of Number of
securities to be securities remainingissued Weighted-average available for future
upon exercise of exercise price of issuance under equityoutstanding options, outstanding options, compensation
Plan Category warrants and rights warrants and rights plans(1)
Equity compensation plans approved bystockholders(2) . . . . . . . . . . . . . . . . . . . . 9,441,565 $42.89 4,276,342
Equity compensation plans not approved bystockholders(3) . . . . . . . . . . . . . . . . . . . . 111,401 47.20 30,216
Total . . . . . . . . . . . . . . . . . . . . . . . . . . . . . . 9,552,966 42.94 4,306,558
(1) Excluding securities reflected in column (a).
(2) Includes the Company’s 2004 Equity Incentive Award Plan, 2001 Executive Stock Incentive Plan,1996 Non-Management Directors Stock Incentive Plan, 1990 Restricted Stock Plan, and the 1990Stock Option Plan.
(3) Includes the Harrah’s Entertainment, Inc. 2001 Broad-Based Stock Incentive Plan, a description ofwhich is set forth in Note 14 to the consolidated financial statements set forth elsewhere in thisAnnual Report on Form 10-K in Part II, Item 8, Financial Statements and Supplementary Data.The 2001 Broad-Based Stock Incentive Plan is intended to qualify as a ‘‘broadly-based’’ plan underSection 312.03 of the New York Stock Exchange Listed Company Manual.
The remaining information required by this Item is incorporated by reference to our definitiveproxy statement for our 2005 Annual Meeting to be filed with the Securities and Exchange Commissionpursuant to regulation 14A within 120 days after the end of the fiscal year covered by this report.
ITEM 13. Certain Relationships and Related Transactions.
The information required by this Item is incorporated by reference to our definitive proxystatement for our 2005 Annual Meeting to be filed with the Securities and Exchange Commissionpursuant to regulation 14A within 120 days after the end of the fiscal year covered by this report.
ITEM 14. Principal Accountant Fees and Services.
The information required by this Item is incorporated by reference to our definitive proxystatement for our 2005 Annual Meeting to be filed with the Securities and Exchange Commissionpursuant to regulation 14A within 120 days after the end of the fiscal year covered by this report.
83

PART IV
ITEM 15. Exhibits, Financial Statement Schedules.
(a) 1. Financial statements of the Company (including related notes to consolidated financialstatements) filed as part of this report are listed below:
Report of Independent Registered Public Accounting Firm.
Consolidated Balance Sheets as of December 31, 2004 and 2003.
Consolidated Statements of Income for the Years Ended December 31, 2004, 2003 and 2002.
Consolidated Statements of Stockholders’ Equity and Comprehensive Income for the YearsEnded December 31, 2004, 2003 and 2002.
Consolidated Statements of Cash Flows for the Years Ended December 31, 2004, 2003 and2002.
2. Schedules for the years ended December 31, 2004, 2003 and 2002, are as follows:
Schedule II—Consolidated valuation and qualifying accounts.
Schedules I, III, IV, and V are not applicable and have therefore been omitted.
3. ExhibitsNo.
2(1) Stock Purchase Agreement, dated as of September 10, 2003, by and among Harrah’sEntertainment, Inc., Horseshoe Gaming Holding Corp., and each of the stockholders ofHorseshoe Gaming Holding Corp. (Incorporated by reference from the Company’s CurrentReport on Form 8-K, filed September 17, 2003, File No. 1-10410.)
2(2) Amendment No. 1 to Stock Purchase Agreement, dated June 25, 2004, by and betweenHarrah’s Operating Company, Inc., Horseshoe Gaming Holding Corp. and Jack B. Binion(as Sellers’ Representative). (Incorporated by reference from Company’s Current Reporton Form 8-K, filed July 16, 2004, File No. 1-10410.)
2(3) Partnership Interest Purchase Agreement dated as of January 20, 2004 by and amongHarrah’s Shreveport/Bossier City Investment Company, LLC, Harrah’s Bossier CityInvestment Company, LLC Red River Entertainment of Shreveport Partnership inCommendam, Boyd Shreveport, L.L.C., Boyd Red River, L.L.C., and Boyd GamingCorporation. (Incorporated by reference to the exhibit filed with the Company’s CurrentReport on Form 8-K, filed January 23, 2004, File No. 1-10410.)
2(4) Agreement and Plan of Merger, dated July 14, 2004, by and among Harrah’sEntertainment, Inc., Harrah’s Operating Company, Inc. and Caesars Entertainment, Inc.(Incorporated by reference from the Company’s Current Report on Form 8-K filed July 15,2004, File No. 1-10410.)
2(5) Asset Purchase Agreement, dated September 28, 2004, by and among Showboat MarinaCasino Partnership, Tunica Partners II L.P., GNOC Corporation, Bally’s Olympia LimitedPartnership, Bally’s Park Place, Inc., Land Ventures Realty, LLC and Resorts InternationalHoldings, LLC. (Incorporated by reference from the Company’s Current Report onForm 8-K filed September 27, 2004, File No. 1-10410.)
84

No.
3(1) Certificate of Incorporation of The Promus Companies Incorporated; Certificate ofAmendment of Certificate of Incorporation of The Promus Companies Incorporated datedApril 29, 1994; Certificate of Amendment of Certificate of Incorporation of The PromusCompanies Incorporated dated May 26, 1995; and Certificate of Amendment of Certificateof Incorporation of The Promus Companies Incorporated dated June 30, 1995, changing itsname to Harrah’s Entertainment, Inc. (Incorporated by reference from the Company’sAnnual Report on Form 10-K for the fiscal year ended December 31, 1995, filed March 6,1996, File No. 1-10410.)
3(2) Bylaws of Harrah’s Entertainment, Inc., as amended November 12, 2002. (Incorporated byreference from the Company’s Annual Report on Form 10-K for the fiscal year endedDecember 31, 2002, filed March 10, 2003, File No. 1-10410.)
4(1) Rights Agreement dated as of October 5, 1996, between Harrah’s Entertainment, Inc. andThe Bank of New York, which includes the form of Certificate of Designations of Series ASpecial Stock of Harrah’s Entertainment, Inc. as Exhibit A, the form of Right Certificateas Exhibit B and the Summary of Rights to Purchase Special Shares as Exhibit C.(Incorporated by reference from the Company’s Current Report on Form 8-K, filedAugust 9, 1996, File No. 1-10410.)
4(2) First Amendment, dated as of February 21, 1997, to Rights Agreement between Harrah’sEntertainment, Inc. and The Bank of New York. (Incorporated by reference from theCompany’s Annual Report on Form 10-K for the fiscal year ended December 31, 1996,filed March 11, 1997, File No. 1-10410.)
4(3) Second Amendment, dated as of April 25, 1997, to Rights Agreement, dated as ofOctober 25, 1996, between Harrah’s Entertainment, Inc. and The Bank of New York.(Incorporated by reference from the Company’s Quarterly Report on Form 10-Q for thequarter ended March 31, 1997, filed May 13, 1997, File No. 1-10410.)
4(4) Letter to Stockholders dated July 23, 1997 regarding Summary of Rights To PurchaseSpecial Shares As Amended Through April 25, 1997. (Incorporated by reference from theCompany’s Quarterly Report on Form 10-Q for the quarter ended June 30, 1997, filedAugust 13, 1997, File No. 1-10410.)
4(5) Certificate of Elimination of Series B Special Stock of Harrah’s Entertainment, Inc., datedFebruary 21, 1997. (Incorporated by reference from the Company’s Annual Report onForm 10-K for the fiscal year ended December 31, 1996, filed March 11, 1997, FileNo. 1-10410.)
4(6) Certificate of Designations of Series A Special Stock of Harrah’s Entertainment, Inc.,dated February 21, 1997. (Incorporated by reference from the Company’s Annual Reporton Form 10-K for the fiscal year ended December 31, 1996, filed March 11, 1997, FileNo. F1-10410.)
4(7) Indenture, dated as of December 9, 1998, among Harrah’s Operating Company, Inc. asIssuer, Harrah’s Entertainment, Inc., as Guarantor and IBJ Schroder Bank & TrustCompany, as Trustee relating to the 77⁄8% Senior Subordinated Notes Due 2005.(Incorporated by reference from the Company’s Annual Report on Form 10-K for thefiscal year ended December 31, 1998, filed March 19, 1999, File No. 1-10410.)
85

No.
4(8) Indenture, dated as of December 18, 1998, among Harrah’s Operating Company, Inc. asobligor, Harrah’s Entertainment, Inc., as Guarantor, and IBJ Schroder Bank & TrustCompany, as Trustee relating to the 71⁄2% Senior Notes Due 2009. (Incorporated byreference from the Company’s Registration Statement on Form S-3 of Harrah’sEntertainment, Inc. and Harrah’s Operating Company, Inc., File No. 333-69263, filedDecember 18, 1998.)
4(9) Indenture, dated as of January 29, 2001, between Harrah’s Operating Company, Inc., asIssuer, Harrah’s Entertainment, Inc., as Guarantor, and Bank One Trust Company, N.A., asTrustee, relating to the 8.0% Senior Notes Due 2011. (Incorporated by reference from theCompany’s Annual Report on Form 10-K filed on March 28, 2001, File No. 1-10410.)
4(10) Indenture, dated as of June 14, 2001, between Harrah’s Operating Company, Inc., asIssuer, Harrah’s Entertainment, Inc., as Guarantor, and Firstar Bank, N.A., as Trustee,relating to the 71⁄8% Senior Notes due 2007. (Incorporated by reference from theCompany’s Registration Statement on Form S-4 of Harrah’s Entertainment, Inc. andHarrah’s Operating Company, Inc., File No. 333-68360, filed August 24, 2001.)
4(11) Indenture, dated as of December 11, 2003, between Harrah’s Operating Company, Inc., asIssuer, Harrah’s Entertainment, Inc., as Guarantor, and U.S. Bank National Association, asTrustee, relating to the 5.375% Senior Notes due 2013. (Incorporated by reference fromthe Company’s Annual Report on Form 10-K for the fiscal year ended December 31, 2003,filed March 4, 2004, File No. 1-10410.)
4(12) Registration Rights Agreement dated December 11, 2003 among Harrah’s OperatingCompany, Inc., Harrah’s Entertainment, Inc., as Guarantor, and Citigroup GlobalMarkets Inc., as Initial Purchasers, relating to the 5.375% Senior Notes due 2013.(Incorporated by reference from the Company’s Annual Report on Form 10-K for thefiscal year ended December 31, 2003, filed March 4, 2004, File No. 1-10410.)
4(13) Indenture, dated as of June 25, 2004, between Harrah’s Operating Company, Inc., asIssuer, Harrah’s Entertainment, Inc., as Guarantor, and U.S. Bank National Association, asTrustee, relating to the 5.50% Senior Notes due 2010. (Incorporated by reference from theCompany’s Quarterly Report on Form 10-Q for the quarter ended June 30, 2004, filedAugust 9, 2004, File No. 1-10410.)
4(14) Form of Exchange Note (included in Exhibit 4(13)).
4(15) Registration Rights Agreement, dated June 25, 2004, among Harrah’s OperatingCompany, Inc., Harrah’s Entertainment, Inc., as Guarantor, and J.P. MorganSecurities, Inc., as Representative of the Initial Purchasers, relating to the 5.50% SeniorNotes due 2010. (Incorporated by reference from the Company’s Quarterly Report onForm 10-Q for the quarter ended June 30, 2004, filed August 9, 2004, File No. 1-10410.)
*10(1) Amended and Restated Credit Agreement dated as of June 24, 2004, among Harrah’sEntertainment, Inc., as Guarantor, Harrah’s Operating Company, Inc., as Borrower, TheLenders, Syndication Agent, Co-Documentation Agents named therein, and Bank ofAmerica, N.A., as Administrative Agent, Banc of America Securities LLC and Wells FargoBank, N.A., Joint Lead Arrangers and Joint Book Managers.
86

No.
10(2) Second Amended and Restated Credit Agreement, dated as of January 31, 2005 amongHarrah’s Entertainment, Inc. as Guarantor, Harrah’s Operating Company, Inc. asBorrower, The Lenders, Syndication Agent and Co-Documentation Agents Herein Namedand Bank of America, N.A., as Administrative Agent, and Banc of America Securities LLCand Wells Fargo Bank, National Association, as Joint Lead Arrangers and Joint BookManagers. (Incorporated by reference from the Company’s Current Report on Form 8-K,filed February 4, 2005, File No. 1-10410.)
10(3) Purchase Agreement, dated June 22, 2004, among Harrah’s Operating Company, Inc.,Harrah’s Entertainment, Inc., as Guarantor, and J. P. Morgan Securities Inc., asrepresentative of the initial purchasers relating to the 5.50% Senior Notes due 2010.(Incorporated by reference from the Company’s Quarterly Report on Form 10-Q for thequarter ended June 30, 2004, filed August 9, 2004, File No. 1-10410.)
10(4) Issuing and Paying Agent Agreement, dated as of May 19, 2000, among Harrah’s OperatingCompany, Inc., as Issuer, Harrah’s Entertainment, Inc., as Guarantor, and Bank One,National Association, as issuing and paying agent; Corporate Commercial Paper MasterNote in favor of Cede & Co., as nominee of The Depository Trust Company, by Harrah’sOperating Company, Inc., as Issuer, and Bank One, N.A., as Paying Agent. (Incorporatedby reference from the Company’s Quarterly Report on Form 10-Q filed August 14, 2000,File No. 1-10410.)
10(5) Commercial Paper Dealer Agreement, dated as of May 3, 2000, among Harrah’s OperatingCompany, Inc., as Issuer, Harrah’s Entertainment, Inc., as Guarantor, and Banc ofAmerica Securities LLC, as Dealer. (Incorporated by reference from the Company’sQuarterly Report on Form 10-Q filed August 14, 2000, File No. 1-10410.)
10(6) Commercial Paper Dealer Agreement, dated as of May 3, 2000, among Harrah’s OperatingCompany, Inc., as Issuer, Harrah’s Entertainment, Inc., as Guarantor, and Credit SuisseFirst Boston Corporation, as Dealer. (Incorporated by reference from the Company’sQuarterly Report on Form 10-Q filed August 14, 2000, File No. 1-10410.)
10(7) Form of Interest Rate Swap Agreements with BNP Paribas, JP Morgan Chase Bank, andThe Royal Bank of Scotland PLC. (Incorporated by reference from the Company’sQuarterly Report on Form 10-Q for the quarter ended March 31, 2004, filed May 7, 2004,File No. 1-10410.)
10(8) Tax Sharing Agreement, dated June 30, 1995, between The Promus CompaniesIncorporated and Promus Hotel Corporation. (Incorporated by reference from theCompany’s Quarterly Report on Form 10-Q for the quarter ended June 30, 1995, filedAugust 14, 1995, File No. 1-10410.)
†10(9) Form of Indemnification Agreement entered into by The Promus Companies Incorporatedand each of its directors and executive officers. (Incorporated by reference from theCompany’s Registration Statement on Form 10, File No. 1-10410, filed on December 13,1989.)
†10(10) Financial Counseling Plan of Harrah’s Entertainment, Inc. as amended January 1996.(Incorporated by reference from the Company’s Annual Report on Form 10-K for thefiscal year ended December 31, 1995, filed March 6, 1996, File No. 1-10410.)
†10(11) The Promus Companies Incorporated 1996 Non-Management Director’s Stock IncentivePlan dated April 5, 1995. (Incorporated by reference from the Company’s Proxy Statementfor the May 26, 1995 Annual Meeting of Stockholders, filed April 25, 1995.)
87

No.
†10(12) Amendment dated February 20, 1997 to 1996 Non-Management Director’s Stock IncentivePlan. (Incorporated by reference from the Company’s Quarterly Report on Form 10-Q forthe quarter ended March 31, 1997, filed May 13, 1997, File No. 1-10410.)
†10(13) Amendment dated as of November 15, 2000 to the 1996 Non-Management Directors StockIncentive Plan. (Incorporated by reference from the Company’s Annual Report onForm 10-K filed on March 28, 2001, File No. 1-10410.)
10(14) Summary Plan Description of Executive Term Life Insurance Plan. (Incorporated byreference from the Company’s Annual Report on Form 10-K for the fiscal year endedDecember 31, 1996, filed March 11, 1997, File No. 1-10410.)
†10(15) Executive Supplemental Savings Plan dated February 21, 2001. (Incorporated by referencefrom the Company’s Quarterly Report on Form 10-Q filed May 11, 2001, FileNo. 1-10410.)
†10(16) First Amendment, dated May 2, 2001, to the Executive Supplemental Savings Plan.(Incorporated by reference from the Company’s Quarterly Report on Form 10-Q filedAugust 13, 2001, File No. 1-10410.)
†10(17) 2001 Restatement of the Harrah’s Entertainment, Inc. Executive Supplemental SavingsPlan, amended and restated effective April 1, 2001. (Incorporated by reference from theCompany’s Quarterly Report on Form 10-Q filed November 9, 2001, File No. 1-10410.)
†10(18) Second Amendment to the 2001 Restatement of the Harrah’s Entertainment, Inc.Executive Supplemental Savings Plan approved November 13, 2001. (Incorporated byreference from the Company’s Annual Report on Form 10-K for the fiscal year endedDecember 31, 2001 filed March 8, 2002, File No. 1-10410.)
†10(19) Third Amendment dated January 1, 2003 to the 2001 Restatement of the Harrah’sEntertainment, Inc. Executive Supplemental Savings Plan. (Incorporated by reference fromthe Company’s Annual Report on Form 10-K for the fiscal year ended December 31, 2002,filed March 10, 2003, File No. 1-10410.)
†10(20) Fourth Amendment dated August 19, 2004 to the 2001 Restatement of the Harrah’sEntertainment, Inc. Executive Supplemental Savings Plan. (Incorporated by reference fromthe Company’s Quarterly Report on Form 10-Q for the quarter ended September 30, 2004,filed November 8, 2004, File No. 1-10410.)
†10(21) Fifth Amendment dated December 16, 2004 to the 2001 Restatement of the Harrah’sEntertainment, Inc. Executive Supplemental Savings Plan. (Incorporated by reference fromthe Company’s Current Report on Form 8-K, filed December 17, 2004, File No. 1-10410.)
†10(22) Executive Supplemental Savings Plan II effective as of January 1, 2005. (Incorporated byreference from the Company’s Current Report on Form 8-K, filed December 17, 2004, FileNo. 1-10410.)
*†10(23) First Amendment to the Executive Supplemental Savings Plan II effective as of January 25,2005
*†10(24) Second Amendment to the Executive Supplemental Savings Plan II effective as ofFebruary 11, 2005
†10(25) Employment Agreement dated as of September 4, 2002, between Harrah’sEntertainment, Inc. and Philip G. Satre. (Incorporated by reference from the Company’sAnnual Report on Form 10-Q filed November 12, 2002, File No. 1-10410.)
88

No.
†10(26) Severance Agreement dated January 1, 2003, entered into with Philip G. Satre.(Incorporated by reference from the Company’s Annual Report on Form 10-K for thefiscal year ended December 31, 2002, filed March 10, 2003, File No. 1-10410.)
†10(27) Amendment, dated as of May 9, 2001, to Deferred Compensation Agreement datedOctober 1, 1986, between Philip G. Satre and Harrah’s Operating Company, Inc. successorto Harrah’s Club, as amended January 1, 1987 and December 13, 1993. (Incorporated byreference from the Company’s Quarterly Report on Form 10-Q filed August 13, 2001, FileNo. 1-10410.)
†10(28) Employment Agreement dated as of September 4, 2002, between Harrah’sEntertainment, Inc. and Gary W. Loveman. (Incorporated by reference from theCompany’s Quarterly Report on Form 10-Q filed November 12, 2002, File No. 1-10410.)
†10(29) Severance Agreement dated January 1, 2003 entered into with Gary W. Loveman(Incorporated by reference from the Company’s Annual Report on Form 10-K for thefiscal year ended December 31, 2002, filed March 10, 2003, File No. 1-10410.)
*†10(30) Employment Agreement effective as of July 26, 2004, between Harrah’s OperatingCompany, Inc. and John M. Boushy.
†10(31) Form of Employment Agreement between Harrah’s Operating Company, Inc. andCharles L. Atwood, Stephen H. Brammell, Jerry Boone, Janis L. Jones, Anthony D.McDuffie, Richard E. Mirman, David W. Norton, Virginia E. Shanks, Timothy S. Stanley,Kenneth M. Weil, and Timothy J. Wilmott. (Incorporated by reference to the Company’sAnnual Report on Form 10-K for the fiscal year ended December 31, 2003, filed March 5,2004, File No. 1-10410.)
†10(32) Form of Severance Agreement entered into with Charles L. Atwood, Jerry Boone, John M.Boushy, Stephen H. Brammell, Janis L. Jones, Anthony D. McDuffie, Richard E. Mirman,David W. Norton, Virginia E. Shanks, Timothy S. Stanley, Kenneth M. Weil, andTimothy J. Wilmott. (Incorporated by reference to the Company’s Annual Report onForm 10-K for the fiscal year ended December 31, 2003, filed March 5, 2004, FileNo. 1-10410.)
†10(33) The Promus Companies Incorporated 1990 Stock Option Plan, as amended July 29, 1994.(Incorporated by reference from the Company’s Quarterly Report on Form 10-Q for thequarter ended June 30, 1994, filed August 11, 1994, File No. 1-10410.)
†10(34) Amendment, dated April 5, 1995, to The Promus Companies Incorporated 1990 StockOption Plan as adjusted on December 12, 1996. (Incorporated by reference from theCompany’s Annual Report on Form 10-K for the fiscal year ended December 31, 1996,filed March 11, 1997, File No. 1-10410.)
†10(35) Amendment, dated February 26, 1998, to the Harrah’s Entertainment, Inc. 1990 StockOption Plan. (Incorporated by reference from the Company’s Quarterly Report onForm 10-Q for the quarter ended March 30, 1998, filed May 14, 1998, File No. 1-10410.)
†10(36) Amendment, dated April 30, 1998, to the Harrah’s Entertainment, Inc. 1990 Stock OptionPlan. (Incorporated by reference from the Company’s Quarterly Report on Form 10-Q forthe quarter ended June 30, 1998, filed August 7, 1998, File No. 1-10410.)
†10(37) Amendment, dated October 29, 1998, to the Harrah’s Entertainment, Inc. 1990 StockOption Plan. (Incorporated by reference from the Company’s Annual Report onForm 10-K for the fiscal year ended December 31, 1998, filed March 19, 1999, FileNo. 1-10410.)
89

No.
†10(38) The Promus Companies Incorporated 1990 Restricted Stock Plan. (Incorporated byreference from the Company’s Annual Report on Form 10-K for the fiscal year endedDecember 29, 1989, filed March 28, 1990, File No. 1-10410.)
†10(39) Amendment, dated April 5, 1995, to The Promus Companies Incorporated 1990 RestrictedStock Plan. (Incorporated by reference from the Company’s Proxy Statement for theMay 26, 1995 Annual Meeting of Stockholders, filed April 25, 1995.)
†10(40) Amendment, dated February 26, 1998, to the Harrah’s Entertainment, Inc. 1990 RestrictedStock Plan. (Incorporated by reference from the Company’s Quarterly Report onForm 10-Q for the quarter ended March 30, 1998, filed May 14, 1998, File No. 1-10410.)
†10(41) Amendment, dated April 30, 1998, to the Harrah’s Entertainment, Inc. 1990 RestrictedStock Plan. (Incorporated by reference from the Company’s Quarterly Report onForm 10-Q for the quarter ended June 30, 1998, filed August 7, 1998, File No. 1-10410.)
†10(42) Amendment, dated October 29, 1998, to the Harrah’s Entertainment, Inc. 1990 RestrictedStock Plan. (Incorporated by reference from the Company’s Annual Report on Form 10-Kfor the fiscal year ended December 31, 1998, filed March 19, 1999, File No. 1-10410.)
†10(43) Deferred Compensation Plan dated October 16, 1991. (Incorporated by reference fromAmendment No. 2 to the Company’s and Embassy’s Registration Statement on Form S-1,File No. 33-43748, filed March 18, 1992.)
†10(44) Amendment, dated May 26, 1995, to The Promus Companies Incorporated DeferredCompensation Plan. (Incorporated by reference from the Company’s Current Report onForm 8-K, filed June 15, 1995, File No. 1-10410.)
†10(45) Amendment dated April 24, 1997, to Harrah’s Entertainment, Inc.’s DeferredCompensation Plan. (Incorporated by reference from the Company’s Quarterly Report onForm 10-Q for the quarter ended June 30, 1997, filed August 13, 1997, File No. 1-10410.)
†10(46) Amendment dated as of November 15, 2000 to the Harrah’s Entertainment, Inc. DeferredCompensation Plan. (Incorporated by reference from the Company’s Annual Report onForm 10-K filed on March 28, 2001, File No. 1-10410.)
†10(47) Amendment dated as of February 26, 2003 to the Harrah’s Entertainment, Inc. DeferredCompensation Plan. (Incorporated by reference from the Company’s Annual Report onForm 10-K for the fiscal year ended December 31, 2002, filed March 10, 2003, FileNo. 1-10410.)
†10(48) Amended and Restated Executive Deferred Compensation Plan dated as of October 27,1995. (Incorporated by reference from the Company’s Annual Report on Form 10-K forthe fiscal year ended December 31, 1995, filed March 6, 1996, File No. 1-10410.)
†10(49) Amendment dated April 24, 1997 to Harrah’s Entertainment, Inc.’s Executive DeferredCompensation Plan. (Incorporated by reference from the Company’s Quarterly Report onForm 10-Q for the quarter ended June 30, 1997, filed August 13, 1997, File No. 1-10410.)
†10(50) Amendment dated April 30, 1998 to the Harrah’s Entertainment, Inc. Executive DeferredCompensation Plan. (Incorporated by reference from the Company’s Quarterly Report onForm 10-Q for the quarter ended June 30, 1998, filed August 7, 1998, File No. 1-10410.)
†10(51) Amendment dated October 29, 1998 to the Harrah’s Entertainment, Inc. ExecutiveDeferred Compensation Plan. (Incorporated by reference from the Company’s AnnualReport on Form 10-K for the fiscal year ended December 31, 1998, filed March 19, 1999,File No. 1-10410.)
90

No.
†10(52) Restated Amendment, dated July 18, 1996, to Harrah’s Entertainment, Inc. ExecutiveDeferred Compensation Plan. (Incorporated by reference from the Company’s AnnualReport on Form 10-K for the fiscal year ended December 31, 1996, filed March 11, 1997,File No. 1-10410.)
†10(53) Amendment dated as of November 15, 2000 to the Harrah’s Entertainment, Inc. ExecutiveDeferred Compensation Plan. (Incorporated by reference from the Company’s AnnualReport on Form 10-K filed on March 28, 2001, File No. 1-10410.)
†10(54) Amendment dated as of February 21, 2001 to the Harrah’s Entertainment, Inc. ExecutiveDeferred Compensation Plan. (Incorporated by reference from the Company’s QuarterlyReport on Form 10-Q filed May 11, 2001, File No. 1-10410.)
†10(55) Amendment dated as of January 1, 2003 to the Harrah’s Entertainment, Inc. ExecutiveDeferred Compensation Plan. (Incorporated by reference from the Company’s AnnualReport on Form 10-K for the fiscal year ended December 31, 2002, filed March 10, 2003,File No. 1-10410.)
†10(56) Letter Agreement with Wells Fargo Bank Minnesota, N.A., dated August 31, 2000,concerning appointment as Escrow Agent under Escrow Agreement for deferredcompensation plans. (Incorporated by reference from the Company’s Quarterly Report onForm 10-Q filed November 13, 2000, File No. 1-10410.)
†10(57) Amendment to Escrow Agreement, dated April 26, 2000, between Harrah’sEntertainment, Inc. and Wells Fargo Bank Minnesota, N.A., Successor to Bank of America,N.A. (Incorporated by reference from the Company’s Quarterly Report on Form 10-Q filedNovember 13, 2000, File No. 1-10410.)
10(58) Trust Agreement dated June 20, 2001 by and between Harrah’s Entertainment, Inc. (the‘‘Company’’) and Wells Fargo Bank Minnesota, N.A. (the ‘‘Trustee’’). (Incorporated byreference from the Company’s Quarterly Report on Form 10-Q filed November 9, 2001,File No. 1-10410.)
†10(59) Time Accelerated Restricted Stock Award Plan (‘‘TARSAP’’) program dated December 12,1996. (Incorporated by reference from the Company’s Annual Report on Form 10-K forthe fiscal year ended December 31, 1996, filed March 11, 1997, File No. 1-10410.)
†10(60) Amendment to Harrah’s Entertainment, Inc. 1990 Stock Option Plan. (Incorporated byreference from the Company’s Quarterly Report on Form 10-Q filed August 12, 1999, FileNo. 1-10410.)
†10(61) Amendment to Harrah’s Entertainment, Inc. 1990 Stock Option Plan, dated as ofFebruary 23, 2000. (Incorporated by reference from the Company’s Quarterly Report onForm 10-Q filed August 14, 2000, File No. 1-10410.)
†10(62) Harrah’s Entertainment, Inc. 2000 Senior Executive Incentive Plan (Incorporated byreference from the Company’s Quarterly Report on Form 10-Q filed August 14, 2000, FileNo. 1-10410.)
†10(63) TARSAP Deferral Plan dated July 28, 1999. (Incorporated by reference from theCompany’s Quarterly Report on Form 10-Q filed November 12, 1999, Filed No. 1-10410.)
†10(64) Time Accelerated Restricted Stock Award Plan II (TARSAP II) dated April 26, 2000.(Incorporated by reference from the Company’s Quarterly Report on Form 10-Q filedAugust 14, 2000, File No. 1-10410.)
91

No.
†10(65) Harrah’s Entertainment, Inc. 2001 Executive Stock Incentive Plan. (Incorporated byreference from the Company’s Registration Statement on Form S-8 of Harrah’sEntertainment, Inc., File No. 333-63856, filed June 26, 2001.)
†10(66) Amendment dated as of January 1, 2003 to the Harrah’s Entertainment, Inc. 2001Executive Stock Incentive Plan. (Incorporated by reference from the Company’s AnnualReport on Form 10-K for the fiscal year ended December 31, 2002, filed March 10, 2003,File No. 1-10410.)
†10(67) Harrah’s Entertainment, Inc. 2004 Equity Incentive Award Plan. (Incorporated byreference from Annex B to the Company’s Proxy Statement, filed March 4, 2004.)
†10(68) Harrah’s Entertainment, Inc. 2005 Senior Executive Incentive Plan. (Incorporated byreference from Annex C to the Company’s Proxy Statement, filed March 4, 2004.)
*12 Computations of ratios.
14 Harrah’s Entertainment, Inc. Code of Business Conduct and Ethics for Principal Officers,adopted February 26, 2003. (Incorporated by reference from the Company’s Annual Reporton Form 10-K for the fiscal year ended December 31, 2002, filed March 10, 2003, FileNo. 1-10410.)
*21 List of subsidiaries of Harrah’s Entertainment, Inc.
*23 Consent of Deloitte & Touche LLP, Independent Registered Public Accounting Firm.
*31(1) Certification of Chief Executive Officer Pursuant to Section 302 of the Sarbanes-Oxley Actof 2002, dated March 1, 2005.
*31(2) Certification of Chief Financial Officer Pursuant to Section 302 of the Sarbanes-Oxley Actof 2002, dated March 1, 2005.
*32(1) Certification of Chief Executive Officer Pursuant to Section 906 of the Sarbanes-Oxley Actof 2002, dated March 1, 2005.
*32(2) Certification of Chief Financial Officer Pursuant to Section 906 of the Sarbanes-Oxley Actof 2002, dated March 1, 2005
*99 Description of Governmental Regulation.
* Filed herewith.
† Management contract or compensatory plan or arrangement required to be filed as an exhibit tothis Form pursuant to Item 15(c) of Form 10-K.
92

SIGNATURES
Pursuant to the requirements of Section 13 of the Securities Exchange Act of 1934, the registranthas duly caused this report to be signed on its behalf by the undersigned, thereunto duly authorized.
HARRAH’S ENTERTAINMENT, INC.
March 1, 2005 By: /s/ GARY W. LOVEMAN
Gary W. LovemanChairman of the Board,
Chief Executive Officer and President
Pursuant to the requirements of the Securities Exchange Act of 1934, this report has been signedbelow by the following persons on behalf of the registrant in the capacities and on the dates indicated.
Signature Title Date
/s/ BARBARA T. ALEXANDERDirector March 1, 2005
Barbara T. Alexander
/s/ FRANK J. BIONDI, JR.Director March 1, 2005
Frank J. Biondi, Jr.
/s/ JOE M. HENSONDirector March 1, 2005
Joe M. Henson
/s/ RALPH HORNDirector March 1, 2005
Ralph Horn
Director, Chairman of the Board,/s/ GARY W. LOVEMANChief Executive Officer and March 1, 2005
Gary W. Loveman President
/s/ R. BRAD MARTINDirector March 1, 2005
R. Brad Martin
/s/ GARY G. MICHAELDirector March 1, 2005
Gary G. Michael
93

Signature Title Date
/s/ ROBERT G. MILLERDirector March 1, 2005
Robert G. Miller
/s/ BOAKE A. SELLSDirector March 1, 2005
Boake A. Sells
/s/ CHRISTOPHER J. WILLIAMSDirector March 1, 2005
Christopher J. Williams
/s/ CHARLES L. ATWOOD Senior Vice President and Chief March 1, 2005Financial OfficerCharles L. Atwood
/s/ ANTHONY D. MCDUFFIE Vice President, Controller and Chief March 1, 2005Accounting OfficerAnthony D. McDuffie
94

Schedule II
HARRAH’S ENTERTAINMENT, INC.CONSOLIDATED VALUATION AND QUALIFYING ACCOUNTS
(In thousands)
Column A Column B Column C Column D Column E
Additions
ChargedBalance at to Costs Charged Deductions BalanceBeginning and to Other from at End
Description of Period Expenses Accounts Reserves of Period
YEAR ENDED DECEMBER 31, 2004Allowance for doubtful accounts
Current . . . . . . . . . . . . . . . . . . . . . . . . . . . . . . . . . . . $51,466 $13,442 $7,277(d) $(23,596)(a) $48,589
Long-term . . . . . . . . . . . . . . . . . . . . . . . . . . . . . . . . . $ 80 $ – $ – $ (80) $ –
Liability to sellers under acquisition agreement(b) . . . . . . . $24,494 $ – $ – $ (847) $23,647
Reserve for structural repairs(c) . . . . . . . . . . . . . . . . . . . . $ 3,083 $ – $ – $(2,413) $ 670
YEAR ENDED DECEMBER 31, 2003Allowance for doubtful accounts
Current . . . . . . . . . . . . . . . . . . . . . . . . . . . . . . . . . . . $55,860 $ 4,950 $ 81 $ (9,425)(a) $51,466
Long-term . . . . . . . . . . . . . . . . . . . . . . . . . . . . . . . . . $ 155 $ – $ – $ (75) $ 80
Liability to sellers under acquisition agreement(b) . . . . . . . $25,641 $ – $ – $(1,147) $24,494
Reserve for structural repairs(c) . . . . . . . . . . . . . . . . . . . . $ 5,000 $ – $ 147 $(2,064) $ 3,083
YEAR ENDED DECEMBER 31, 2002Allowance for doubtful accounts
Current . . . . . . . . . . . . . . . . . . . . . . . . . . . . . . . . . . . $60,149 $(2,521) $8,225(d) $ (9,993)(a) $55,860
Long-term . . . . . . . . . . . . . . . . . . . . . . . . . . . . . . . . . $24,989 $ – $ – $(24,834)(e) $ 155
Liability to sellers under acquisition agreement(b) . . . . . . . $26,220 $ – $ – $ (579) $25,641
Reserve for structural repairs(c) . . . . . . . . . . . . . . . . . . . . $ – $ 5,000 $ – $ – $ 5,000
(a) Uncollectible accounts written off, net of amounts recovered.
(b) We acquired Players International, Inc., (‘‘Players’’) in March 2000. In 1995, Players acquired a hotel and landadjacent to its riverboat gaming facility in Lake Charles, Louisiana, for cash plus future payments to the sellerbased on the number of passengers boarding the riverboat casinos during a defined term. In accordance withthe guidance provided by APB 16 regarding the recognition of liabilities assumed in a business combinationaccounted for as a purchase, Players estimated the net present value of the future payments to be made tothe sellers and recorded that amount as a component of the total consideration paid to acquire these assets.Our recording of this liability in connection with the purchase price allocation process following the Playersacquisition was originally reported in 2000. The long-term portion of this liability is included in Deferredcredits and other on our Consolidated Balance Sheets; the current portion of this obligation is included inAccrued expenses on our Consolidated Balance Sheets.
(c) During 2002, we discovered that water leaks had caused considerable damage to a hotel tower at our propertyin Reno, Nevada. Following an initial assessment of the extent of the damage, our design and constructiondepartment (assisted by third-party experts) estimated that the costs to repair the damage would totalapproximately $5 million.
(d) 2004 Charged to Other Accounts consists primarily of the balance acquired from our acquisition of HorseshoeGaming Holding Corp. on July 1, 2004. 2002 Charged to Other Accounts consists primarily of the balanceacquired from our acquisition and consolidation of JCC Holding Company in our financial statements andre-established accounts that had been previously deemed uncollectible.
(e) In 2000, National Airlines, Inc., (‘‘NAI’’) filed for Chapter 11 Bankruptcy, and we recorded write-offs andreserves for our investment in and loans to NAI and our estimated net exposure under letters of credit issuedon behalf of NAI. In June 2001, we abandoned all rights to our equity ownership interest in NAI andremoved the investment balance and associated reserves from our balance sheet. Since we no longer held anequity investment in NAI, we transferred our reserve balance related to NAI to a long-term receivable and anassociated allowance for doubtful accounts. In 2002, we removed the receivable and associated allowance fromour general ledger.

Exhibit 12
HARRAH’S ENTERTAINMENT, INC.COMPUTATION OF RATIOS
(Unaudited)(In thousands, except ratio amounts)
2004(a) 2003(b) 2002(c) 2001(d) 2000(e)
Return on Revenues-ContinuingIncome/(loss) from continuing operations . . . . . . . . . . $ 329,525 $ 261,064 $ 282,212 $ 173,788 $ (46,428)Revenues . . . . . . . . . . . . . . . . . . . . . . . . . . . . . . . . 4,548,326 3,948,865 3,747,866 3,317,445 2,977,811
Return . . . . . . . . . . . . . . . . . . . . . . . . . . . . . . . . 7.2% 6.6% 7.5% 5.2% (1.6)%
Return on Average Invested Capital—ContinuingIncome/(loss) from continuing operations . . . . . . . . . . $ 329,525 $ 261,064 $ 282,212 $ 173,788 $ (46,428)Add: Interest expense after tax . . . . . . . . . . . . . . . . . 172,187 147,450 149,417 159,236 141,388
$ 501,712 $ 408,514 $ 431,629 $ 333,024 $ 94,960
Average invested capital . . . . . . . . . . . . . . . . . . . . . . $6,154,866 $5,087,001 $4,866,693 $4,442,581 $4,009,036
Return . . . . . . . . . . . . . . . . . . . . . . . . . . . . . . . . 8.2% 8.0% 8.9% 7.5% 2.4%
Return on Average Invested Capital—Net IncomeNet income/(loss) . . . . . . . . . . . . . . . . . . . . . . . . . . . $ 367,709 $ 292,623 $ 235,029 $ 208,967 $ (12,060)Add: Interest expense after tax . . . . . . . . . . . . . . . . . 172,187 147,450 149,417 159,236 141,388
$ 539,896 $ 440,073 $ 384,446 $ 368,203 $ 129,328
Average invested capital . . . . . . . . . . . . . . . . . . . . . . $6,718,979 $5,780,245 $5,551,218 $5,054,779 $4,504,205
Return . . . . . . . . . . . . . . . . . . . . . . . . . . . . . . . . 8.0% 7.6% 6.9% 7.3% 2.9%
Return on Average Equity—ContinuingIncome/(loss) from continuing operations . . . . . . . . . . $ 329,525 $ 261,064 $ 282,212 $ 173,788 $ (46,428)Average equity . . . . . . . . . . . . . . . . . . . . . . . . . . . . 1,887,844 1,627,834 1,458,941 1,347,257 1,431,255
Return . . . . . . . . . . . . . . . . . . . . . . . . . . . . . . . . 17.5% 16.0% 19.3% 12.9% (3.2)%
Return on Average Equity—Net IncomeNet income/(loss) . . . . . . . . . . . . . . . . . . . . . . . . . . . $ 367,709 $ 292,623 $ 235,029 $ 208,967 $ (12,060)Average equity . . . . . . . . . . . . . . . . . . . . . . . . . . . . 1,887,844 1,627,834 1,458,941 1,347,257 1,431,255
Return . . . . . . . . . . . . . . . . . . . . . . . . . . . . . . . . 19.5% 18.0% 16.1% 15.5% (0.8)%
Ratio of Earnings to Fixed Charges(f)Income/(loss) from continuing operations . . . . . . . . . . $ 329,525 $ 261,064 $ 282,212 $ 173,788 $ (46,428)Add:
Provision for income taxes . . . . . . . . . . . . . . . . . . . 190,641 155,568 174,445 107,747 (3,478)Interest expense . . . . . . . . . . . . . . . . . . . . . . . . . . 271,802 234,419 240,220 255,801 227,130Interest included in rental expense . . . . . . . . . . . . . 22,942 19,931 24,130 17,816 12,813Amortization of capitalized interest . . . . . . . . . . . . . 555 624 702 880 1,053Loss/(income) from equity investments . . . . . . . . . . . 879 871 (4,388) (426) 317,103
Earnings as defined . . . . . . . . . . . . . . . . . . . . . . . . . $ 816,344 $ 672,477 $ 717,321 $ 555,606 $ 508,193
Fixed charges:Interest expense . . . . . . . . . . . . . . . . . . . . . . . . . . $ 271,802 $ 234,419 $ 240,220 $ 255,801 $ 227,130Capitalized interest . . . . . . . . . . . . . . . . . . . . . . . . 4,085 2,349 3,537 9,309 7,960Interest included in rental expense . . . . . . . . . . . . . 22,942 19,931 24,130 17,816 12,813
Total fixed charges . . . . . . . . . . . . . . . . . . . . . . . . . . $ 298,829 $ 256,699 $ 267,887 $ 282,926 $ 247,903
Ratio of earnings to fixed charges . . . . . . . . . . . . . . 2.7 2.6 2.7 2.0 2.0
(a) 2004 includes $9.6 million in pretax charges for write-downs, reserves and recoveries and $2.3 million in pretaxcharges related to our pending acquisition of Caesars Entertainment, Inc. 2004 also includes the financialresults of Horseshoe Gaming Holding Corporation from its July 1, 2004, date of acquisition.
(b) 2003 includes $10.5 million in pretax charges for write-downs, reserves and recoveries and $19.1 million inpretax charges for premiums paid for, and write-offs associated with, debt retired before maturity. 2003 resultshave been reclassified to reflect Harrah’s East Chicago and Harrah’s Tunica as discontinued operations.

(c) 2002 includes $4.5 million in pretax charges for write-downs, reserves and recoveries, a $6.1 million pretaxcharge for our exposure under a letter of credit issued on behalf of National Airlines, Inc., and a charge of$91.2 million, net of tax benefits of $2.8 million, related to a change in accounting principle. 2002 also includesthe financial results of Jazz Casino Company LLC from the date of our acquisition of a majority ownershipinterest on June 7, 2002. 2002 results have been reclassified to reflect Harrah’s East Chicago and Harrah’sTunica as discontinued operations.
(d) 2001 includes $17.2 million in pretax charges for write-downs, reserves and recoveries and $26.2 million ofpretax income from dispositions of nonstrategic assets and the settlement of a contingency related to a formeraffiliate. 2001 also includes the financial results of Harveys Casino Resorts from its July 31, 2001, date ofacquisition. 2001 results have been reclassified to reflect Harrah’s East Chicago and Harrah’s Tunica asdiscontinued operations.
(e) 2000 includes $220.0 million in pretax reserves for receivables not expected to be recovered from JCC HoldingCompany and its subsidiary, Jazz Casino Company LLC, $6.1 million in pretax charges for other write-downs,reserves and recoveries, and $39.4 million in pretax write-offs and reserves for our investment in, loans to andnet estimated exposure under letters of credit issued on behalf of National Airlines, Inc. 2000 also includes thefinancial results of Players International, Inc., from its March 22, 2000, date of acquisition. 2000 results havebeen reclassified to reflect Harrah’s East Chicago and Harrah’s Tunica as discontinued operations.
(f) For purposes of computing this ratio, ‘‘earnings’’ consist of income before income taxes plus fixed charges(excluding capitalized interest) and minority interests (relating to subsidiaries whose fixed charges are includedin the computation), excluding equity in undistributed earnings of less-than-50%-owned investments. ‘‘Fixedcharges’’ include interest whether expensed or capitalized, amortization of debt expense, discount or premiumrelated to indebtedness and such portion of rental expense that we deem to be representative of interest. Asrequired by the rules which govern the computation of this ratio, both earnings and fixed charges are adjustedwhere appropriate to include the financial results for the Company’s nonconsolidated majority-ownedsubsidiaries. As discussed in Note 12 to the Consolidated Financial Statements in the 2004 Harrah’sEntertainment Annual Report, the Company has guaranteed certain third-party loans in connection with itscasino development activities. The above ratio computation excludes estimated fixed charges associated withthese guarantees as follows: 2004, $6.7 million; 2003, $9.5 million; 2002, $7.0 million; 2001, $4.4 million; and2000, $5.7 million.

Exhibit 31(1)
CERTIFICATIONS
I, Gary W. Loveman, certify that:
1. I have reviewed this annual report on Form 10-K of Harrah’s Entertainment, Inc.;
2. Based on my knowledge, this report does not contain any untrue statement of a material fact oromit to state a material fact necessary to make the statements made, in light of the circumstancesunder which such statements were made, not misleading with respect to the period covered by thisreport;
3. Based on my knowledge, the financial statements, and other financial information included in thisreport, fairly present in all material respects the financial condition, results of operations and cashflows of the registrant as of, and for, the periods presented in this report;
4. The registrant’s other certifying officers and I are responsible for establishing and maintainingdisclosure controls and procedures (as defined in Exchange Act Rules 13a-15(e) and 15d-15(e))and internal control over financial reporting (as defined in Exchange Act Rules 13a-15(f) and15d-15(f)) for the registrant and have:
a) designed such disclosure controls and procedures, or caused such disclosure controls andprocedures to be designed under our supervision, to ensure that material information relatingto the registrant, including its consolidated subsidiaries, is made known to us by others withinthose entities, particularly during the period in which this report is being prepared;
b) designed such internal control over financial reporting, or caused such internal control overfinancial reporting to be designed under our supervision, to provide reasonable assuranceregarding the reliability of financial reporting and the preparation of financial statements forexternal purposes in accordance with generally accepted accounting principles;
c) evaluated the effectiveness of the registrant’s disclosure controls and procedures andpresented in this report our conclusions about the effectiveness of the disclosure controls andprocedures, as of the end of the period covered by this report based on such evaluation; and
d) disclosed in this report any change in the registrant’s internal control over financial reportingthat occurred during the registrant’s most recent fiscal quarter (the registrant’s fourth fiscalquarter in the case of an annual report) that has materially affected, or is reasonably likely tomaterially affect, the registrant’s internal control over financial reporting; and
5. The registrant’s other certifying officers and I have disclosed, based on our most recent evaluationof internal control over financial reporting, to the registrant’s auditors and the audit committee ofthe registrant’s board of directors (or persons performing the equivalent functions):
a) all significant deficiencies and material weaknesses in the design or operation of internalcontrol over financial reporting which are reasonably likely to adversely affect the registrant’sability to record, process, summarize and report financial information; and
b) any fraud, whether or not material, that involves management or other employees who have asignificant role in the registrant’s internal control over financial reporting.
Date: March 1, 2005 By: /s/ GARY W. LOVEMAN
Gary W. LovemanChairman of the Board,Chief Executive Officer and President

Exhibit 31(2)
I, Charles L. Atwood, certify that:
1. I have reviewed this annual report on Form 10-K of Harrah’s Entertainment, Inc.;
2. Based on my knowledge, this report does not contain any untrue statement of a material fact oromit to state a material fact necessary to make the statements made, in light of the circumstancesunder which such statements were made, not misleading with respect to the period covered by thisreport;
3. Based on my knowledge, the financial statements, and other financial information included in thisreport, fairly present in all material respects the financial condition, results of operations and cashflows of the registrant as of, and for, the periods presented in this report;
4. The registrant’s other certifying officers and I are responsible for establishing and maintainingdisclosure controls and procedures (as defined in Exchange Act Rules 13a-15(e) and 15d-15(e))and internal control over financial reporting (as defined in Exchange Act Rules 13a-15(f) and15d-15(f)) for the registrant and have:
a) designed such disclosure controls and procedures, or caused such disclosure controls andprocedures to be designed under our supervision, to ensure that material information relatingto the registrant, including its consolidated subsidiaries, is made known to us by others withinthose entities, particularly during the period in which this report is being prepared;
b) designed such internal control over financial reporting, or caused such internal control overfinancial reporting to be designed under our supervision, to provide reasonable assuranceregarding the reliability of financial reporting and the preparation of financial statements forexternal purposes in accordance with generally accepted accounting principles;
c) evaluated the effectiveness of the registrant’s disclosure controls and procedures andpresented in this report our conclusions about the effectiveness of the disclosure controls andprocedures, as of the end of the period covered by this report based on such evaluation; and
d) disclosed in this report any change in the registrant’s internal control over financial reportingthat occurred during the registrant’s most recent fiscal quarter (the registrant’s fourth fiscalquarter in the case of an annual report) that has materially affected, or is reasonably likely tomaterially affect, the registrant’s internal control over financial reporting; and
5. The registrant’s other certifying officers and I have disclosed, based on our most recent evaluationof internal control over financial reporting, to the registrant’s auditors and the audit committee ofthe registrant’s board of directors (or persons performing the equivalent functions):
a) all significant deficiencies and material weaknesses in the design or operation of internalcontrol over financial reporting which are reasonably likely to adversely affect the registrant’sability to record, process, summarize and report financial information; and
b) any fraud, whether or not material, that involves management or other employees who have asignificant role in the registrant’s internal control over financial reporting.
Date: March 1, 2005 By: /s/ CHARLES L. ATWOOD
Charles L. AtwoodSenior Vice President and Chief Financial Officer

Exhibit 32(1)
Certification of Chief Executive Officer
Pursuant to 18 U.S.C. § 1350, as created by Section 906 of the Sarbanes-Oxley Act of 2002, theundersigned officer of Harrah’s Entertainment, Inc. (the ‘‘Company’’), hereby certifies, to such officer’sknowledge, that:
(i) the accompanying Annual Report on Form 10-K of the Company for the year endedDecember 31, 2004 (the ‘‘Report’’) fully complies with the requirements of Section 13(a) orSection 15(d), as applicable, of the Securities Exchange Act of 1934, as amended; and
(ii) the information contained in the Report fairly presents, in all material respects, the financialcondition and results of operations of the Company.
Dated: March 1, 2005
/s/ GARY W. LOVEMAN
Gary W. LovemanChairman of the Board,Chief Executive Officer and President
The foregoing certification is being furnished solely to accompany the Report pursuant to18 U.S.C. § 1350, and is not being filed for purposes of Section 18 of the Securities Exchange Act of1934, as amended, and is not to be incorporated by reference into any filing of the Company, whethermade before or after the date hereof, regardless of any general incorporation language in such filing.

Exhibit 32(2)
Certification of Chief Financial Officer
Pursuant to 18 U.S.C. § 1350, as created by Section 906 of the Sarbanes-Oxley Act of 2002, theundersigned officer of Harrah’s Entertainment, Inc. (the ‘‘Company’’), hereby certifies, to such officer’sknowledge, that:
(i) the accompanying Annual Report on Form 10-K of the Company for the year endedDecember 31, 2004 (the ‘‘Report’’) fully complies with the requirements of Section 13(a) orSection 15(d), as applicable, of the Securities Exchange Act of 1934, as amended; and
(ii) the information contained in the Report fairly presents, in all material respects, the financialcondition and results of operations of the Company.
Dated: March 1, 2005
/s/ CHARLES L. ATWOOD
Charles L. AtwoodSenior Vice President andChief Financial Officer
The foregoing certification is being furnished solely to accompany the Report pursuant to 18 U.S.C.§ 1350, and is not being filed for purposes of Section 18 of the Securities Exchange Act of 1934, asamended, and is not to be incorporated by reference into any filing of the Company, whether madebefore or after the date hereof, regardless of any general incorporation language in such filing.

HARRAH’S ENTERTAINMENT, INC.RECONCILIATION OF NET INCOME/(LOSS) TO TOTAL EBITDA AND PROPERTY EBITDA
(In thousands)
Year Ended December 31,
2004 2003 2002 2001 2000
Net income/(loss) . . . . . . . . . . . . . . . . . . . . . $ 367,709 $ 292,623 $ 235,029 $208,967 $(12,060)Add/(less):
Cumulative effect of change in accountingprinciple, net of tax benefits of $2,831 . . – – 91,169 – –
Income from discontinued operations, netof tax provision of $18,460, $16,993,$23,684, $18,977 and $18,505 . . . . . . . . . (38,184) (31,559) (43,986) (35,179) (34,368)
Provision for income taxes . . . . . . . . . . . . 190,641 155,568 174,445 107,747 (3,478)Interest expense . . . . . . . . . . . . . . . . . . . . 271,802 234,419 240,220 255,801 227,130Depreciation and amortization (property) . 327,188 294,336 278,935 260,616 211,659Corporate depreciation and amortization
(included in Corporate expense) . . . . . . 15,869 13,234 14,023 15,930 21,110Amortization of intangible assets . . . . . . . . 9,439 4,798 4,493 23,333 20,112
Total EBITDA . . . . . . . . . . . . . . . . . . . . . . . 1,144,464 963,419 994,328 837,215 430,105
Add/(less):Minority interests . . . . . . . . . . . . . . . . . . . 8,623 11,563 13,965 12,616 13,768Other income, including interest income . . (9,483) (2,913) (2,137) (28,219) (3,866)Losses on early extinguishments of debt . . . – 19,074 – 36 1,104Corporate expense . . . . . . . . . . . . . . . . . . 66,818 52,602 56,626 52,746 50,472Less: Corporate depreciation and
amortization (included in Corporateexpense) . . . . . . . . . . . . . . . . . . . . . . . . (15,869) (13,234) (14,023) (15,929) (21,110)
Project opening costs . . . . . . . . . . . . . . . . 9,526 7,352 1,703 12,421 8,190Write-downs, reserves and recoveries . . . . . 9,567 10,476 4,537 17,225 226,094Losses on interests in nonconsolidated
affiliates . . . . . . . . . . . . . . . . . . . . . . . . 879 999 1,670 4,614 99,329Merger and integration costs for Caesars
acquisition . . . . . . . . . . . . . . . . . . . . . . 2,331 – – – –Headquarters relocation costs . . . . . . . . . . – – – – 2,983Venture restructuring costs . . . . . . . . . . . . – – – 2,524 400
Property EBITDA . . . . . . . . . . . . . . . . . . . . $1,216,856 $1,049,338 $1,056,669 $895,249 $807,469
This Reconciliation should be read in conjunction with our Consolidated Financial Statements andNotes thereto included in our 2004 Form 10-K.

Harrah’s Entertainment, Inc. 2004 Annual Report 17
Financial and Statistical HighlightsSee Notes 1, 2 and 3 to the Consolidated Financial Statements.
Compound(In millions, except common stock data Growthand financial percentages and ratio) 2004(a) 2003(b) 2002(c) 2001(d) 2000(e) Rate
OPERATING DATA
Revenues $ 4,548.3 $ 3,948.9 $ 3,747.9 $ 3,317.4 $ 2,977.8 11.2%
Income from operations 791.1 678.8 708.7 521.8 188.2 43.2%
Income/(loss) from continuing operations 329.5 261.1 282.2 173.8 (46.4) N/M
Net income/(loss) 367.7 292.6 235.0 209.0 (12.1) N/M
COMMON STOCK DATA
Earnings/(loss) per share—diluted
From continuing operations 2.92 2.36 2.48 1.50 (0.40) N/M
Net income/(loss) 3.26 2.65 2.07 1.81 (0.10) N/M
Cash dividends declared per share 1.26 .60 – – – N/M
FINANCIAL POSITION
Total assets 8,585.6 6,578.8 6,350.0 6,128.6 5,166.1 13.5%
Long-term debt 5,151.1 3,671.9 3,763.1 3,719.4 2,835.8 16.1%
Stockholders’ equity 2,035.2 1,738.4 1,471.0 1,374.1 1,269.7 12.5%
FINANCIAL PERCENTAGES AND RATIOS
Return on revenues—continuing 7.2% 6.6% 7.5% 5.2% (1.6)%
Return on average invested capital
Continuing operations 8.2% 8.0% 8.9% 7.5% 2.4%
Net income/(loss) 8.0% 7.6% 6.9% 7.3% 2.9%
Return on average equity
Continuing operations 17.5% 16.0% 19.3% 12.9% (3.2)%
Net income/(loss) 19.5% 18.0% 16.1% 15.5% (0.8)%
Ratio of earnings to fixed charges(f) 2.7 2.6 2.7 2.0 2.0
N/M = not meaningful
Note references are to our Notes to Consolidated Financial Statements.
(a) 2004 includes $9.6 million in pretax charges for write-downs, reserves and recoveries (see Note 9) and $2.3 million in pretax charges related to our pending acquisitionof Caesars Entertainment, Inc. (see Note 2). 2004 also includes the financial results of Horseshoe Gaming Holding Corporation from its July 1, 2004, date of acquisition.
(b) 2003 includes $10.5 million in pretax charges for write-downs, reserves and recoveries (see Note 9) and $19.1 million in pretax charges for premiums paid for, and write-offs associated with, debt retired before maturity. 2003 results have been reclassified to reflect Harrah’s East Chicago and Harrah’s Tunica as discontinued operations.
(c) 2002 includes $4.5 million in pretax charges for write-downs, reserves and recoveries (see Note 9), a $6.1 million pretax charge for our exposure under a letter of creditissued on behalf of National Airlines, Inc., and a charge of $91.2 million, net of tax benefits of $2.8 million, related to a change in accounting principle (see Note 4). 2002also includes the financial results of Jazz Casino Company LLC from the date of our acquisition of a majority ownership interest on June 7, 2002. 2002 results have beenreclassified to reflect Harrah’s East Chicago and Harrah’s Tunica as discontinued operations.
(d) 2001 includes $17.2 million in pretax charges for write-downs, reserves and recoveries and $26.2 million of pretax income from dispositions of nonstrategic assets andthe settlement of a contingency related to a former affiliate. 2001 also includes the financial results of Harveys Casino Resorts from its July 31, 2001, date of acquisition.2001 results have been reclassified to reflect Harrah’s East Chicago and Harrah’s Tunica as discontinued operations.
(e) 2000 includes $220.0 million in pretax reserves for receivables not expected to be recovered from JCC Holding Company and its subsidiary, Jazz Casino Company LLC,$6.1 million in pretax charges for other write-downs, reserves and recoveries and $39.4 million in pretax write-offs and reserves for our investment in, loans to and netestimated exposure under letters of credit issued on behalf of National Airlines, Inc. 2000 also includes the financial results of Players International, Inc., from its March22, 2000, date of acquisition. 2000 results have been reclassified to reflect Harrah’s East Chicago and Harrah’s Tunica as discontinued operations.
(f) Ratio computed based on Income/(loss) from continuing operations.

18 Harrah’s Entertainment, Inc. 2004 Annual Report
1 2 3 4 5 6 7 8 9 10 11
1. R. Brad Martin Chairman of the Board and Chief Executive Officer, Saks Incorporated 2. Joe M. Henson Private Investor 3. Frank J. Biondi, Jr. Senior Managing
Director, WaterView Advisors LLC 4. Boake A. Sells Private Investor 5. Barbara T. Alexander Independent Consultant 6. Christopher J. Williams Chairman and
Chief Executive Officer, Williams Capital Group, L.P. and Williams Capital Management, Inc. 7. Gary W. Loveman Chairman of the Board, Chief Executive Officer
and President, Harrah’s Entertainment, Inc. 8. Gary G. Michael Private Investor 9. Philip G. Satre Chairman of the Board, Harrah’s Entertainment, Inc.*
10. Robert G. Miller Chairman of the Board, RiteAid, Inc. 11. Ralph Horn Private Investor
*Retired on January 1, 2005
Board of Directors

19
Code of CommitmentThe Harrah’s Code of Commitment governs the conduct of our business.It’s a public pledge to our guests, our employees and our communitiesthat we will honor the trust they have placed in us.
A commitment to our guests to promote responsible gaming:
> We do not cash payroll, welfare or unemployment checks.
> We have a process to honor the requests of customers that they be denied access to our casinos, and that their access to credit, check-cashing and casino promotions be restricted.
> We display toll-free helpline numbers for problem gambling in our ads, brochures and signs, and we provide financial support for those helplines.
> We train our employees about the importance of responsible gaming,and how to offer help to customers who may need it.
> We emphasize to our employees that casino gaming is an appropriateactivity for adults only, and require them to be vigilant in their efforts toprevent individuals under the legal age from playing at our casinos.
A commitment to our employees to treat them with respect and provide
them opportunities to build satisfying careers:
> We invest in our employees by providing excellent pay and valuablebenefits, including health insurance and a retirement plan.
> We are committed to sharing our financial success through programs such as cash bonuses for frontline employees.
> We encourage professional and personal growth through tuitionreimbursement, on the job training, career development and promotion from within.
> We actively seek and respond to employee opinions on all aspects of their jobs, from the quality of their supervisors to the quality of our casinos.
A commitment to our communities to help make them vibrant places to
live and work, and to market our casinos responsibly:
> We conduct our business with honesty and integrity, consistent withthe highest moral, legal and ethical standards, complying with allapplicable laws and regulations.
> We share our financial success with our communities by donating one percent of company profits to civic and charitable causes.
> We encourage our employees to volunteer in civic and charitable causes.
> We restrict the placement and content of our advertising and marketing materials.
Harrah’s Entertainment, Inc. 2004 Annual Report
TrademarksThe following trademarks used in this report to identify the services of Harrah’s Entertainment brands are owned by Harrah’s LicenseCompany, LLC: Harrah ’s®, Horseshoe ®, Showboat ®, Rio ®, Harveys ®,World Series of Poker ®, Total Rewards ®, Harrahs.com ®, Binion’sHorseshoe SM, 1-800-Harrahs ®, 1-800-Play-Rio ®, Bluffs Run ®,Seven Stars SM, Project 21 ®, Know When to Stop Before You Start®
and Operation Bet Smart®.
Caesars ® is a registered trademark of Caesars Entertainment, Inc.
© 2005, Harrah’s License Company, LLC

20 Harrah’s Entertainment, Inc. 2004 Annual Report
1. Anthony D. McDuffie Vice President, Controller and Chief Accounting Officer 2. J. Carlos Tolosa President, Harrah’s Eastern Division 3. Jerry Boone
Senior Vice President, Human Resources 4. Kenneth M. Weil Senior Vice President, Slots 5. Janis L. Jones Senior Vice President, Communications and
Government Relations 6. Gary W. Loveman Chairman of the Board, Chief Executive Officer and President 7. Anthony M. Sanfilippo President, Harrah’s
Central Division 8. Thomas M. Jenkin President, Harrah’s Western Division
Senior Management
1 2, 3 4 5 6 7 8

Harrah’s Entertainment, Inc. 2004 Annual Report 21
9. Stephen H. Brammell Senior Vice President, General Counsel and Corporate Secretary 10. David W. Norton Senior Vice President, Relationship Marketing
11. Timothy J. Wilmott Chief Operating Officer 12. Timothy S. Stanley Senior Vice President, Information Technology, and Chief Information Officer
13. Ginny E. Shanks Senior Vice President, Acquisition Marketing 14. Charles L. Atwood Senior Vice President and Chief Financial Officer 15. Richard E. Mirman
Senior Vice President, Business Development 16. Jonathan S. Halkyard Vice President and Treasurer 17. John M. Boushy Senior Vice President and Chief
Integration Officer
9 10, 11 12 13 14 15 16 17

22 Harrah’s Entertainment, Inc. 2004 Annual Report
Chairman’s Award RecipientsThe Chairman’s Award is the highest honor
Harrah’s Entertainment bestows on its
employees. Each year, the award recognizes
superior performance in categories that support
the Company’s vision. The names listed below are
the 2005 Chairman’s Award winners representing
each property. From this list, corporate-wide
Chairman’s Award winners are selected.
Harrah’s Ak-Chin
Harry Bedell, Leadership
Jane Stimmel, Superior Internal Service
Brandon Lopez, Superior Guest Service
Tanya Alvardo, Community Service
Joshua Henry, Superior Team Results
Robert Litton, Superior Team Results
Henry Cipolla, Superior Team Results
Eric Oszakiewski, Superior Team Results
Harold Gillespie, Superior Team Results
Adam Cure, Superior Team Results
Jesus Fierro, Superior Team Results
Dora Galvez, Superior Team Results
Michael Tinguely, Superior Team Results
George Tiznado, Superior Team Results
Terry Adams, Superior Team Results
Marcus Metivier, Superior Team Results
Norbert Peters, Superior Team Results
Tim Campbell, Superior Team Results
Fredrick Soriano, Superior Team Results
Duane Antone, Superior Team Results
John Eggers, Superior Team Results
Michael Perez, Superior Team Results
Philip Munoz, Superior Team Results
Nellie Fernandez, Superior Team Results
Ronald Vance, Superior Team Results
Harrah’s Atlantic City
Linda Peditto, Leadership
Ron Petersen, Superior Internal Service
Andrea Lamar, Superior Guest Service
Allen Strauss, Superior Team Results
Mike Shertel, Superior Team Results
Rosa Lebro, Superior Team Results
Maria Duffy, Superior Team Results
Maria Grassia, Superior Team Results
Jim Strickler, Superior Team Results
Dee Dolbow, Superior Team Results
Patricia Williams, Superior Team Results
Karen Sanahi, Superior Team Results
Robert Schoell, Superior Team Results
Harrah’s Cherokee
Tina Vatikus, Leadership
Lenia Hauk, Superior Internal Service
Curtis Fish, Superior Guest Service
Boyd Ammons, Community Service
Beverly Webb, Superior Team Results
Ella Arch, Superior Team Results
Wanda Deck, Superior Team Results
Billy Rowland, Superior Team Results
Margaret Lambert, Superior Team Results
Nancy N. Rhodes, Superior Team Results
Lynda Smith, Superior Team Results
Juanita Hornbuckle, Superior Team Results
Martha Oocumma, Superior Team Results
Harrah’s Joliet
Linda Harris, Leadership
Jamal Gresham, Superior Internal Service
Debbie Fisher, Superior Guest Service
Diane Bartnick, Community Service
Kathy Smith, Community Service
James Murphy, Community Service
Dave Philbsen, Community Service
Peter Garces, Superior Team Results
Paul Simek, Superior Team Results
Cheryl Miller, Superior Team Results
Harrah’s North Kansas City
Julie Frankland, Leadership
Vanessa Harbrucker, Superior Internal Service
Ruth Grant, Superior Guest Service
Robbie Makinen, Community Service
Julie Frankland, Superior Team Results
Erin Hansen, Superior Team Results
Steve Dahle, Superior Team Results
Tim Pugh, Superior Team Results
Harrah’s Lake Charles
Todd Swords, Leadership
Honoria Hebert, Superior Internal Service
Laverne Myres, Superior Guest Service
Chris Dinger, Community Service
Merryan Moore, Superior Team Results
Jason Comeaux, Superior Team Results
Honoria Hebert, Superior Team Results
Tom Gaspard, Superior Team Results
Robin Nelson, Superior Team Results
Harrah’s Reno
Kent Matsuura, Leadership
Martina Perez, Superior Internal Service
Carol Ross, Superior Guest Service
Janet Leis, Community Service
Luis Abasolo, Superior Team Results
Seena La Pointe, Superior Team Results
Francisco Page, Superior Team Results
Josephine Patel, Superior Team Results
Harrah’s Las Vegas
Danielle Crawford, Leadership
Barbara Rose, Superior Internal Service
Gabrielle Penazzi, Superior Guest Service
Terri Lawson, Community Service
Tom Adams, Superior Team Results
Mike Whitehead, Superior Team Results
Harrah’s Laughlin
Robert Smith, Leadership
Gail Strinz, Superior Internal Service
Belinda Andersen, Superior Internal Service
James Allen, Superior Internal Service
George P. Mabrey, Superior Guest Service
Sheri Weyer, Superior Guest Service
Charles Phemister, Community Service
Debora Phemister, Community Service
Steve Larson, Community Service
Todd Moreau, Superior Team Results
Christine Box, Superior Team Results
Rebecca Lenz, Superior Team Results
Raymond Garcia, Superior Team Results
Gregory Jellison, Superior Team Results
Eric Fox, Superior Team Results
Steve Coplan, Superior Team Results
Lorraine Rich, Special Recognition Revenue Growth
Harrah’s Prairie Band
Gary Stella, Leadership
Troy Davis, Superior Internal Service
Steven Shehi, Superior Guest Service
Kristi Lawrence, Community Service
Gina Hoffman, Community Service
Heather Whelpley, Community Service
Debbie McEntire, Community Service
Bill’s/Harrah’s/Harveys Lake Tahoe
Debbie Babcock, Superior Internal Service
Nubia Paiz, Superior Internal Service
Mel Chaney, Superior Internal Service
Narciso (David) Dy, Superior Guest Service
Lois Walsh, Superior Guest Service
Lorna Lomibao, Superior Guest Service
Tracy Wilson, Superior Guest Service
Mark Bartholomew, Community Service

Harrah’s Entertainment, Inc. 2004 Annual Report 23
Harrah’s Rincon
Al Gutierrez, Leadership
Mitch Crismon, Superior Internal Service
Phyllis Griffith, Superior Guest Service
Patty Edison, Superior Guest Service
Laurie Gonzalez, Superior Team Results
Lilia Vergara, Superior Team Results
Robin Willis, Superior Team Results
Jaime Stratton, Superior Team Results
Harrah’s St. Louis
Jim Abbas, Leadership
Stephanie Budnyk, Superior Internal Service
Nicole Will, Superior Guest Service
Kate McMahon, Community Service
Frank Oppenheim, Superior Team Results
Don McCowan, Superior Team Results
Kim Newton, Superior Team Results
Karen Robertson, Superior Team Results
Stacy Hoener, Superior Team Results
Harrah’s Council Bluffs
Jeff Hedges, Leadership
Jack Theisen, Superior Internal Service
Ted Relford, Superior Guest Service
Josh Crosby, Superior Team Results
Charles Walby, Superior Team Results
Renee Ronneau, Superior Team Results
Darryl Hynt, Superior Team Results
Jeff Piatak, Superior Team Results
Daniel Johnson, Superior Team Results
Tom Chaplin, Superior Team Results
Bluffs Run Casino
Lydia Mason, Leadership
Andrew Whalen, Superior Internal Service
Jana Jedinak, Superior Guest Service
Harrah’s New Orleans
Rick Korte, Leadership
Lois Anglin, Superior Internal Service
Judy Robinson, Superior Guest Service
Toby Lefort, Community Service
Rhoshunda Conway, Superior Team Results
Jim Agar, Superior Team Results
Edlee Lebrun, Superior Team Results
Luan Nguyen, Superior Team Results
Don Bell, Superior Team Results
Harrah’s Metropolis
Mindy Steckenrider, Leadership
Kris Hambrecht, Superior Internal Service
Lori Thorpe, Superior Guest Service
Shirley Sommer, Community Service
Troy Smith, Superior Team Results
Chris Riley, Superior Team Results
Ian Chandler, Superior Team Results
David Eubanks, Superior Team Results
Steve Tanner, Superior Team Results
Dean Jones, Superior Team Results
Jack Etherton, Superior Team Results
Russ McDowell, Superior Team Results
Rio All-Suite Hotel & Casino
Wilson Ning, Leadership
Matthew Burns, Superior Internal Service
Kevin Ishikawa, Superior Internal Service
Arthur Powell, Superior Guest Service
Dorothy Ruiz, Community Service
Susan Duca, Community Service
Gloria Murphy, Community Service
Nancy Thomas, Community Service
Ethan Corsell, Superior Team Results
Kimberly Dickinson, Superior Team Results
Trevor Ferguson, Superior Team Results
William O’Mahoney, Superior Team Results
Barbara Arko, Superior Team Results
Showboat Atlantic City
Randi Beck, Leadership
Michael Bengis, Superior Internal Service
Joanne Papa, Superior Guest Service
Joseph Giunta, Superior Team Results
James Stephan, Superior Team Results
Gabriel Pastrana, Superior Team Results
Antonio Holloway, Superior Team Results
Anthony Trejo, Superior Team Results
James Scarpato, Superior Team Results
Harrah’s Corporate
Sherri Pucci, Leadership
Cynthia Hays, Superior Internal Service
Tim Slater, Superior Team Results
Karen Grigg, Superior Team Results
Paul Rivera, Superior Team Results
Ralph Sacharcyzk, Superior Team Results
Bill Eaton, Superior Team Results
Michelle Pena, Superior Team Results
Jimmy Kleber, Superior Team Results
Horseshoe Bossier City
Dolly Wood, Superior Guest Service
Rickey Bonner, Superior Team Results
Robert Winbush, Superior Team Results
Shawn Abbington, Superior Team Results
Tommy Robinson, Superior Team Results
Phillip Birmingham, Superior Team Results
Harrah’s Louisiana Downs
Leila Pippen, Leadership
Julian “Gil” Highsmith, Superior Internal Service
Amye Rhone, Superior Guest Service
Holly Romain, Community Service
Douglas Jager, Superior Team Results
Melvin King, Superior Team Results
Kent Farnsworth, Superior Team Results
Edward Morgan, Superior Team Results
Travis Whitfield, Superior Team Results
Horseshoe Tunica
Monica Fuess, Leadership
Kristi Miller, Superior Internal Service
Patricia Uithoven, Superior Guest Service
Paula Shaw, Community Service
Marilyn Micheletti, Superior Team Results
Mark Feske, Superior Team Results
Harrah’s Tunica
Rob Brown, Leadership
Tamika Bonds, Superior Internal Service
Latasha Woods, Superior Guest Service
Daniel Russell, Superior Team Results
Marcus Mason, Superior Team Results
Frank Evans, Superior Team Results
David Shive, Superior Team Results

24 Harrah’s Entertainment, Inc. 2004 Annual Report
Investor InformationCorporate Headquarters
One Harrah’s CourtLas Vegas, NV 89119
Annual Meeting
Harrah’s Entertainment, Inc. will conduct its annual meeting of stock-holders at 11 a.m. (PDT), April 28, 2005, in the Scintas Showroom at the Rio All-Suite Hotel & Casino in Las Vegas.
Form 10-KA stockholder may receive a free copy of the Form 10-K Annual Report filed with the Securities and Exchange Commission by writing to InvestorRelations at the corporate headquarters mailing address.
Annual Report Requests
To request an Annual Report or other financial reports, or to be added to the Company’s mailing list, please call 1-800-318-0047, or e-mail us at [email protected].
Transfer Agent and Registrar
For address changes, account consolidation, registration, lost stock certificates and other services, contact:
The Bank of New York Shareholder Relations Department-11EChurch Street Station, P.O. Box 11258
New York, NY 10286-1258
1-800-524-4458 www.stockbny.com
Shareholder Account Assistance
For additional assistance regarding your account, contact the Shareholder Services Department by calling 1-800-318-0047 or by e-mailing us at [email protected].
Investor Relations
The Company maintains an Investor Relations office to assist stockholders and potential stockholders. Inquiries are welcome by telephone or letter. Financial community information requests should be directed to Investor Relations at the corporate head-quarters address, or by calling 1-800-318-0047 or 1-702-407-6367 or by e-mailing [email protected]. Investor information is also available on the Company’s web site at www.harrahs.com.
Media Relations and Communication
The Company maintains a Communications Department to assist media and other outside groups with information about the Company.Inquiries are welcome by telephone, letter or fax. Media and other non-investor inquiries should be directed to Corporate Communicationsat the corporate headquarters or by calling 1-702-407-6529 or by e-mailingus at [email protected].
Home Page
Harrah’s Entertainment, Inc. maintains a page on the World Wide Web for those interested in further information or recent news about theCompany. Quarterly financial information, in lieu of quarterly reports
to stockholders, is listed there, as well as facts and figures about theCompany. The page can be accessed at http://www.harrahs.com.
Dividend Information
Dividends were paid by the Company in the first, second, third and fourth quarters of 2004. The Company paid cash dividends of 30 cents per common share in the first and second quarters and 33 cents per common share in the third and fourth quarters.
Reservation Information
Guests wishing to make reservations at our properties may do so by calling the following toll-free numbers: 1-800-HARRAHS; 1-800-PLAY-RIO;
1-800-621-0200 (Showboat Atlantic City); 1-800-363-ROOM (HorseshoeTunica); 1-800-895-0711 (Horseshoe Bossier City).
Independent Registered Public Accounting Firm
Deloitte & Touche LLP3773 Howard Hughes Parkway, 490 North TowerLas Vegas, NV 89109
Stock InformationStock Listings
Harrah’s Entertainment, Inc. common stock trades on the New York Stock Exchange under the ticker symbol “HET.” The stock is also listedon the Chicago, Philadelphia and Pacific regional stock exchanges. Daily trading activity in the stock and the stock price may be found in the financial section of major newspapers under “Harrah’s.”
Quarterly Stock Information
New York Stock Exchange–Common Stock
Stock Price Per Share2004 High Low
1st Quarter $ 56.40 $ 48.90
2nd Quarter 57.50 50.86
3rd Quarter 55.21 43.94
4th Quarter 67.25 52.78
2003 High Low1st Quarter $ 40.75 $ 30.30
2nd Quarter 44.30 34.20
3rd Quarter 44.10 38.65
4th Quarter 49.94 40.85
Stockholders
As of December 31, 2004, there were 8,463 stockholders of record ofHarrah’s Entertainment, Inc.
Certifications
The Company has filed, as exhibits to its Annual Report on Form 10-K
for the year ended December 31, 2004, the certifications of its ChiefExecutive Officer and Chief Financial Officer required pursuant to Section 302 of the Sarbanes-Oxley Act of 2004. On May 27, 2004, theCompany submitted to the New York Stock Exchange the Annual CEO
Certification required pursuant to Section 303A.12(a) of the New YorkStock Exchange Listed Company Manual. D
esig
n:R
KC
!(R
obin
son
Kur
tinC
omm
unic
atio
ns!
Inc.
)P
hoto
grap
hy:
Peg
gyB
arne
tt,
Bill
Hay
war
d,B
urk
Uzz
leP
rintin
g:H
enne
gan
Mailing Address
Post Office Box 98905
Las Vegas, NV 89193-8905

Harrah’s Entertainment, Inc. operates through various
subsidiaries 28 casinos in 12 states, primarily under the
Harrah’s and Horseshoe brand names. The company
employs approximately 46,600 employees and trades on
the New York Stock Exchange under the symbol “HET.”
One Harrah’s Court, Las Vegas, Nevada 89119 www.harrahs.com